Zip Codes with the Highest Percentage of Population with a Degree in Liberal Arts and History in Philadelphia, PA

RELATED REPORTS & OPTIONS

Liberal Arts and History
Population
Families and Households
Female Fertility
Female Fertility (Unmarried)
Race (Community Size)
Race (Percentage)
Ancestry (Community Size)
AfghanAfricanAlaska NativeAlaskan AthabascanAlbanianAmericanApacheArabArgentineanArmenianAustralianAustrianBahamianBangladeshiBarbadianBasqueBelgianBelizeanBermudanBhutaneseBlackfeetBolivianBrazilianBritishBritish West IndianBulgarianBurmeseCajunCambodianCanadianCape VerdeanCarpatho RusynCelticCentral AmericanCentral American IndianCherokeeChickasawChileanChippewaChoctawColombianCosta RicanCreekCroatianCubanCypriotCzechCzechoslovakianDanishDelawareDominicanDutchEastern EuropeanEcuadorianEgyptianEnglishEstonianEthiopianEuropeanFilipinoFinnishFrenchFrench American IndianFrench CanadianGermanGerman RussianGhanaianGreekGuamanian / ChamorroGuatemalanGuyaneseHaitianHonduranHungarianIcelanderIndian (Asian)IndonesianInupiatIranianIraqiIrishIroquoisIsraeliItalianJamaicanJapaneseJordanianKenyanKoreanLaotianLatvianLebaneseLiberianLithuanianLumbeeMacedonianMalaysianMexicanMexican American IndianMongolianMoroccanNative HawaiianNavajoNew ZealanderNicaraguanNigerianNorthern EuropeanNorwegianOkinawanPakistaniPalestinianPanamanianParaguayanPennsylvania GermanPeruvianPolishPortuguesePotawatomiPuerto RicanRomanianRussianSalvadoranSamoanScandinavianScotch-IrishScottishSeminoleSenegaleseSerbianShoshoneSierra LeoneanSiouxSlavicSlovakSloveneSomaliSouth AfricanSouth AmericanSouth American IndianSpaniardSpanishSpanish AmericanSri LankanSubsaharan AfricanSudaneseSwedishSwissSyrianThaiTrinidadian and TobagonianTurkishU.S. Virgin IslanderUgandanUkrainianUruguayanVenezuelanVietnameseWelshWest IndianYugoslavian
Ancestry (Percentage)
AfghanAfricanAlaska NativeAlaskan AthabascanAlbanianAmericanApacheArabArgentineanArmenianAustralianAustrianBahamianBangladeshiBarbadianBasqueBelgianBelizeanBermudanBhutaneseBlackfeetBolivianBrazilianBritishBritish West IndianBulgarianBurmeseCajunCambodianCanadianCape VerdeanCarpatho RusynCelticCentral AmericanCentral American IndianCherokeeChickasawChileanChippewaChoctawColombianCosta RicanCreekCroatianCubanCypriotCzechCzechoslovakianDanishDelawareDominicanDutchEastern EuropeanEcuadorianEgyptianEnglishEstonianEthiopianEuropeanFilipinoFinnishFrenchFrench American IndianFrench CanadianGermanGerman RussianGhanaianGreekGuamanian / ChamorroGuatemalanGuyaneseHaitianHonduranHungarianIcelanderIndian (Asian)IndonesianInupiatIranianIraqiIrishIroquoisIsraeliItalianJamaicanJapaneseJordanianKenyanKoreanLaotianLatvianLebaneseLiberianLithuanianLumbeeMacedonianMalaysianMexicanMexican American IndianMongolianMoroccanNative HawaiianNavajoNew ZealanderNicaraguanNigerianNorthern EuropeanNorwegianOkinawanPakistaniPalestinianPanamanianParaguayanPennsylvania GermanPeruvianPolishPortuguesePotawatomiPuerto RicanRomanianRussianSalvadoranSamoanScandinavianScotch-IrishScottishSeminoleSenegaleseSerbianShoshoneSierra LeoneanSiouxSlavicSlovakSloveneSomaliSouth AfricanSouth AmericanSouth American IndianSpaniardSpanishSpanish AmericanSri LankanSubsaharan AfricanSudaneseSwedishSwissSyrianThaiTrinidadian and TobagonianTurkishU.S. Virgin IslanderUgandanUkrainianUruguayanVenezuelanVietnameseWelshWest IndianYugoslavian
Immigrant Origin (Total)
AfghanistanAfricaAlbaniaArgentinaArmeniaAsiaAustraliaAustriaBangladeshBarbadosBelarusBelgiumBelizeBoliviaBosnia and HerzegovinaBrazilBulgariaBurma / MyanmarCambodiaCameroonCanadaCaribbeanCentral AmericaChileChinaColombiaCongoCosta RicaCroatiaCubaCzechoslovakiaDenmarkDominicaDominican RepublicEastern AfricaEastern AsiaEastern EuropeEcuadorEgyptEl SalvadorEnglandEritreaEthiopiaEuropeFranceGermanyGhanaGreeceGrenadaGuatemalaGuyanaHaitiHondurasHong KongHungaryIndiaIndonesiaIranIraqIrelandIsraelItalyJamaicaJapanJordanKazakhstanKenyaKoreaKuwaitLaosLatin AmericaLatviaLebanonLiberiaLithuaniaMalaysiaMexicoMiddle AfricaMoldovaMoroccoNepalNetherlandsNicaraguaNigeriaNorth MacedoniaNorthern AfricaNorthern EuropeNorwayOceaniaPakistanPanamaPeruPhilippinesPolandPortugalRomaniaRussiaSaudi ArabiaScotlandSenegalSerbiaSierra LeoneSingaporeSouth AfricaSouth AmericaSouth Central AsiaSouth Eastern AsiaSouthern EuropeSpainSri LankaSt. Vincent and the GrenadinesSudanSwedenSwitzerlandSyriaTaiwanThailandTrinidad and TobagoTurkeyUkraineUruguayUzbekistanVenezuelaVietnamWest IndiesWestern AfricaWestern AsiaWestern EuropeZaireZimbabwe
Immigrant Origin (Percentage)
AfghanistanAfricaAlbaniaArgentinaArmeniaAsiaAustraliaAustriaBangladeshBarbadosBelarusBelgiumBelizeBoliviaBosnia and HerzegovinaBrazilBulgariaBurma / MyanmarCambodiaCameroonCanadaCaribbeanCentral AmericaChileChinaColombiaCongoCosta RicaCroatiaCubaCzechoslovakiaDenmarkDominicaDominican RepublicEastern AfricaEastern AsiaEastern EuropeEcuadorEgyptEl SalvadorEnglandEritreaEthiopiaEuropeFranceGermanyGhanaGreeceGrenadaGuatemalaGuyanaHaitiHondurasHong KongHungaryIndiaIndonesiaIranIraqIrelandIsraelItalyJamaicaJapanJordanKazakhstanKenyaKoreaKuwaitLaosLatin AmericaLatviaLebanonLiberiaLithuaniaMalaysiaMexicoMiddle AfricaMoldovaMoroccoNepalNetherlandsNicaraguaNigeriaNorth MacedoniaNorthern AfricaNorthern EuropeNorwayOceaniaPakistanPanamaPeruPhilippinesPolandPortugalRomaniaRussiaSaudi ArabiaScotlandSenegalSerbiaSierra LeoneSingaporeSouth AfricaSouth AmericaSouth Central AsiaSouth Eastern AsiaSouthern EuropeSpainSri LankaSt. Vincent and the GrenadinesSudanSwedenSwitzerlandSyriaTaiwanThailandTrinidad and TobagoTurkeyUkraineUruguayUzbekistanVenezuelaVietnamWest IndiesWestern AfricaWestern AsiaWestern EuropeZaireZimbabwe
Income
Income (Families)
Income (Households)
Poverty
Poverty (Families)
Unemployment
Employment Occupations
Employment Industries
Employer Class
Commute Time
Commute Means
School Enrollment
Education by Degree Field
Occupancy
Finances
Physical Characteristics
Philadelphia
Compare Zip Codes
Comparison Subject

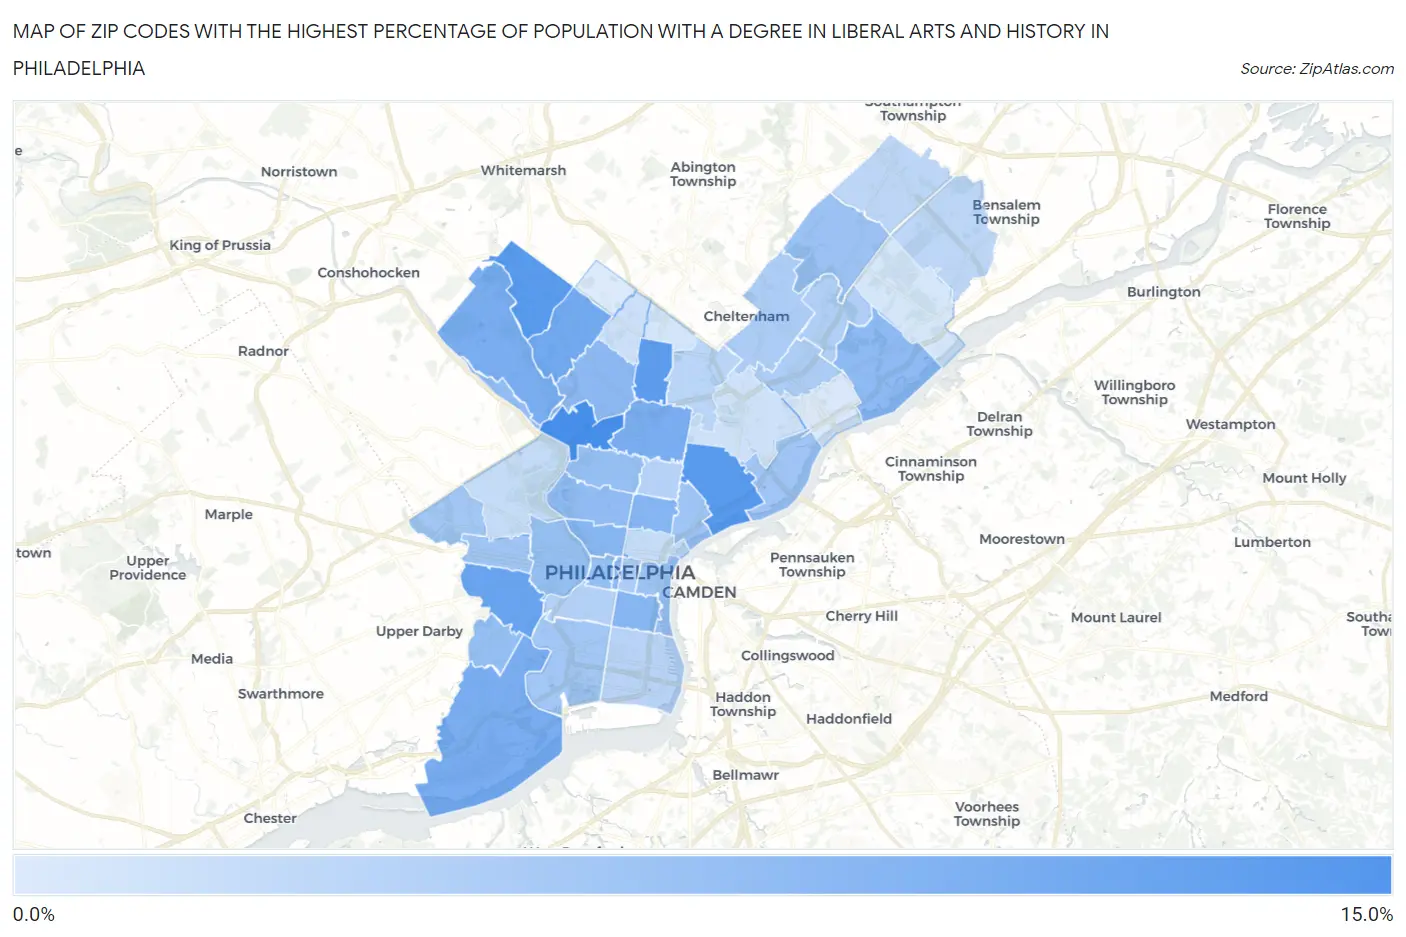
Map of Zip Codes with the Highest Percentage of Population with a Degree in Liberal Arts and History in Philadelphia

0.0%
15.0%
Zip Codes with the Highest Percentage of Population with a Degree in Liberal Arts and History in Philadelphia Map

Zip Codes with the Highest Percentage of Population with a Degree in Liberal Arts and History in Philadelphia, PA

Zip Code % Graduates vs State vs National
1.1912910.5%4.6%(+5.93)#1444.9%(+5.67)#2,795
2.191349.6%4.6%(+4.96)#1724.9%(+4.69)#3,399
3.191189.6%4.6%(+4.95)#1734.9%(+4.69)#3,400
4.191419.2%4.6%(+4.60)#1844.9%(+4.34)#3,677
5.191438.5%4.6%(+3.88)#2174.9%(+3.62)#4,349
6.191197.9%4.6%(+3.32)#2454.9%(+3.06)#4,990
7.191407.5%4.6%(+2.91)#2694.9%(+2.65)#5,556
8.191537.5%4.6%(+2.89)#2714.9%(+2.63)#5,582
9.191287.5%4.6%(+2.85)#2734.9%(+2.59)#5,646
10.191226.8%4.6%(+2.22)#3194.9%(+1.96)#6,677
11.191306.7%4.6%(+2.12)#3294.9%(+1.86)#6,879
12.191476.6%4.6%(+2.03)#3424.9%(+1.77)#7,073
13.191026.5%4.6%(+1.87)#3554.9%(+1.61)#7,368
14.191446.5%4.6%(+1.84)#3594.9%(+1.58)#7,442
15.191366.3%4.6%(+1.67)#3844.9%(+1.41)#7,833
16.191216.2%4.6%(+1.61)#3904.9%(+1.35)#7,982
17.191276.1%4.6%(+1.48)#4144.9%(+1.21)#8,299
18.191046.0%4.6%(+1.34)#4304.9%(+1.08)#8,646
19.191425.9%4.6%(+1.32)#4324.9%(+1.06)#8,687
20.191325.9%4.6%(+1.26)#4414.9%(+0.994)#8,880
21.191035.8%4.6%(+1.22)#4484.9%(+0.961)#8,957
22.191155.6%4.6%(+1.02)#4764.9%(+0.755)#9,495
23.191065.4%4.6%(+0.790)#5044.9%(+0.528)#10,135
24.191255.3%4.6%(+0.708)#5104.9%(+0.446)#10,386
25.191375.2%4.6%(+0.630)#5204.9%(+0.368)#10,619
26.191395.2%4.6%(+0.622)#5234.9%(+0.359)#10,640
27.191515.1%4.6%(+0.480)#5534.9%(+0.217)#11,071
28.191455.0%4.6%(+0.432)#5614.9%(+0.169)#11,224
29.191494.6%4.6%(+0.017)#6274.9%(-0.245)#12,560
30.191114.6%4.6%(+0.015)#6284.9%(-0.247)#12,566
31.191074.6%4.6%(-0.017)#6324.9%(-0.279)#12,662
32.191524.3%4.6%(-0.294)#6914.9%(-0.556)#13,585
33.191464.1%4.6%(-0.467)#7194.9%(-0.729)#14,230
34.191334.1%4.6%(-0.551)#7324.9%(-0.813)#14,549
35.191483.9%4.6%(-0.688)#7554.9%(-0.950)#15,089
36.191203.8%4.6%(-0.859)#7884.9%(-1.12)#15,696
37.191163.7%4.6%(-0.959)#8044.9%(-1.22)#16,061
38.191543.6%4.6%(-0.972)#8084.9%(-1.23)#16,104
39.191313.2%4.6%(-1.42)#8924.9%(-1.69)#17,712
40.191233.2%4.6%(-1.44)#8934.9%(-1.70)#17,771
41.191382.7%4.6%(-1.86)#9714.9%(-2.12)#19,160
42.191242.6%4.6%(-2.05)#1,0064.9%(-2.31)#19,794
43.191262.3%4.6%(-2.32)#1,0464.9%(-2.58)#20,571
44.191142.3%4.6%(-2.35)#1,0504.9%(-2.62)#20,676
45.191351.9%4.6%(-2.67)#1,0994.9%(-2.94)#21,529
46.191501.8%4.6%(-2.78)#1,1184.9%(-3.04)#21,770

Common Questions

What are the Top 10 Zip Codes with the Highest Percentage of Population with a Degree in Liberal Arts and History in Philadelphia, PA?
Top 10 Zip Codes with the Highest Percentage of Population with a Degree in Liberal Arts and History in Philadelphia, PA are:
#1
10.5%
#2
9.6%
#3
9.6%
#4
9.2%
#5
8.5%
#6
7.9%
#7
7.5%
#8
7.5%
#9
7.5%
#10
6.8%
What zip code has the Highest Percentage of Population with a Degree in Liberal Arts and History in Philadelphia, PA?
19129 has the Highest Percentage of Population with a Degree in Liberal Arts and History in Philadelphia, PA with 10.5%.
What is the Percentage of Population with a Degree in Liberal Arts and History in Philadelphia, PA?
Percentage of Population with a Degree in Liberal Arts and History in Philadelphia is 5.6%.
What is the Percentage of Population with a Degree in Liberal Arts and History in Pennsylvania?
Percentage of Population with a Degree in Liberal Arts and History in Pennsylvania is 4.6%.
What is the Percentage of Population with a Degree in Liberal Arts and History in the United States?
Percentage of Population with a Degree in Liberal Arts and History in the United States is 4.9%.