Quentin, PA Map & Demographics
Quentin Map
Quentin Overview
$34,242
PER CAPITA INCOME
$70,625
AVG FAMILY INCOME
$60,417
AVG HOUSEHOLD INCOME
13.9%
WAGE / INCOME GAP [ % ]
86.1¢/ $1
WAGE / INCOME GAP [ $ ]
0.36
INEQUALITY / GINI INDEX
676
TOTAL POPULATION
381
MALE POPULATION
295
FEMALE POPULATION
129.15
MALES / 100 FEMALES
77.43
FEMALES / 100 MALES
41.7
MEDIAN AGE
3.0
AVG FAMILY SIZE
2.2
AVG HOUSEHOLD SIZE
390
LABOR FORCE [ PEOPLE ]
71.2%
PERCENT IN LABOR FORCE
2.1%
UNEMPLOYMENT RATE
Quentin Area Codes
Income in Quentin
Income Overview in Quentin
Per Capita Income in Quentin is $34,242, while median incomes of families and households are $70,625 and $60,417 respectively.
| Characteristic | Number | Measure |
| Per Capita Income | 676 | $34,242 |
| Median Family Income | 163 | $70,625 |
| Mean Family Income | 163 | $90,323 |
| Median Household Income | 300 | $60,417 |
| Mean Household Income | 300 | $74,003 |
| Income Deficit | 163 | $0 |
| Wage / Income Gap (%) | 676 | 13.94% |
| Wage / Income Gap ($) | 676 | 86.06¢ per $1 |
| Gini / Inequality Index | 676 | 0.36 |
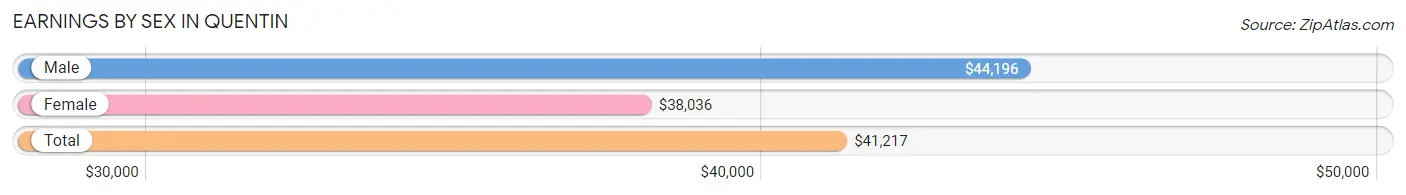
Earnings by Sex in Quentin
Average Earnings in Quentin are $41,217, $44,196 for men and $38,036 for women, a difference of 13.9%.
| Sex | Number | Average Earnings |
| Male | 249 (60.9%) | $44,196 |
| Female | 160 (39.1%) | $38,036 |
| Total | 409 (100.0%) | $41,217 |
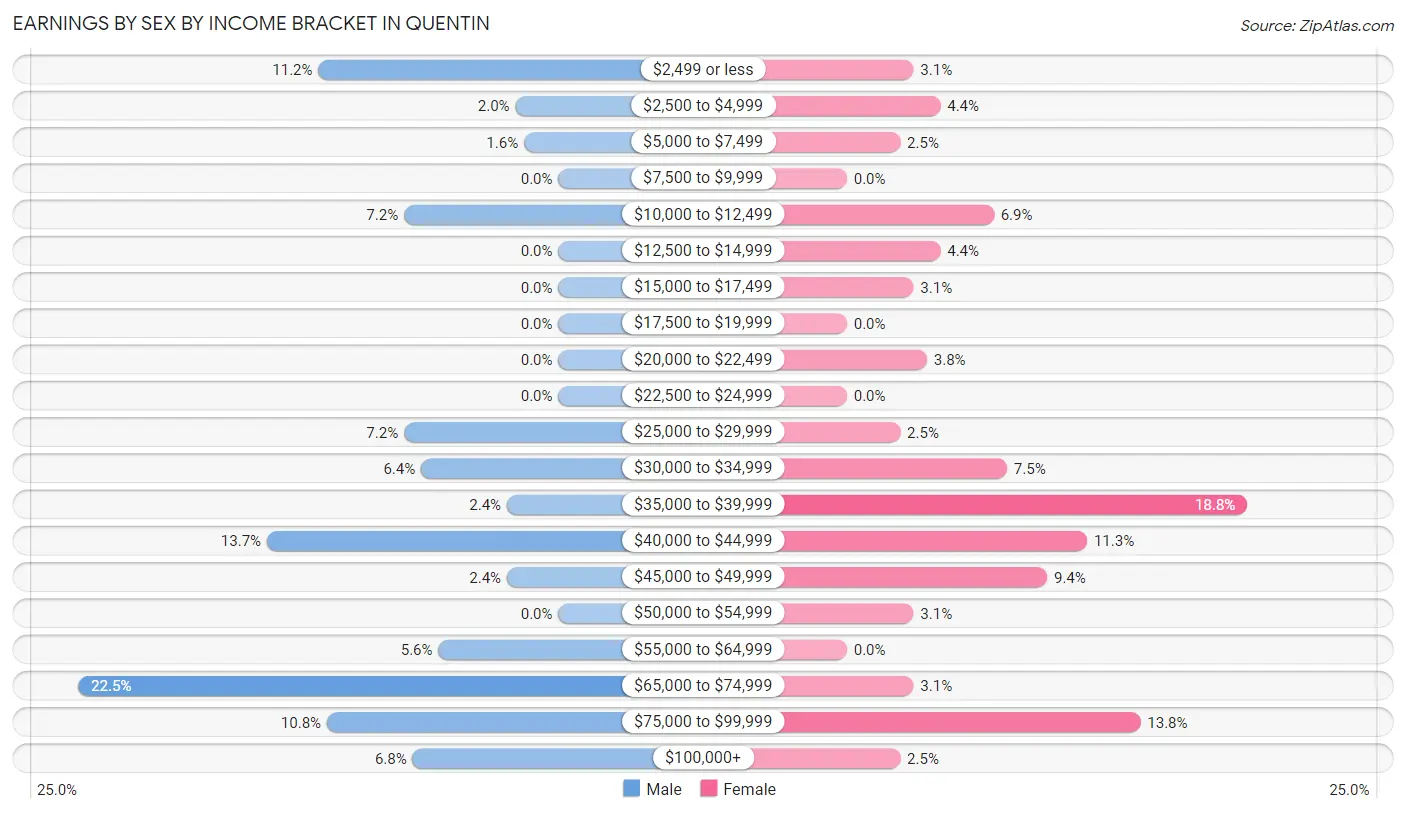
Earnings by Sex by Income Bracket in Quentin
The most common earnings brackets in Quentin are $65,000 to $74,999 for men (56 | 22.5%) and $35,000 to $39,999 for women (30 | 18.8%).
| Income | Male | Female |
| $2,499 or less | 28 (11.2%) | 5 (3.1%) |
| $2,500 to $4,999 | 5 (2.0%) | 7 (4.4%) |
| $5,000 to $7,499 | 4 (1.6%) | 4 (2.5%) |
| $7,500 to $9,999 | 0 (0.0%) | 0 (0.0%) |
| $10,000 to $12,499 | 18 (7.2%) | 11 (6.9%) |
| $12,500 to $14,999 | 0 (0.0%) | 7 (4.4%) |
| $15,000 to $17,499 | 0 (0.0%) | 5 (3.1%) |
| $17,500 to $19,999 | 0 (0.0%) | 0 (0.0%) |
| $20,000 to $22,499 | 0 (0.0%) | 6 (3.7%) |
| $22,500 to $24,999 | 0 (0.0%) | 0 (0.0%) |
| $25,000 to $29,999 | 18 (7.2%) | 4 (2.5%) |
| $30,000 to $34,999 | 16 (6.4%) | 12 (7.5%) |
| $35,000 to $39,999 | 6 (2.4%) | 30 (18.8%) |
| $40,000 to $44,999 | 34 (13.7%) | 18 (11.3%) |
| $45,000 to $49,999 | 6 (2.4%) | 15 (9.4%) |
| $50,000 to $54,999 | 0 (0.0%) | 5 (3.1%) |
| $55,000 to $64,999 | 14 (5.6%) | 0 (0.0%) |
| $65,000 to $74,999 | 56 (22.5%) | 5 (3.1%) |
| $75,000 to $99,999 | 27 (10.8%) | 22 (13.8%) |
| $100,000+ | 17 (6.8%) | 4 (2.5%) |
| Total | 249 (100.0%) | 160 (100.0%) |
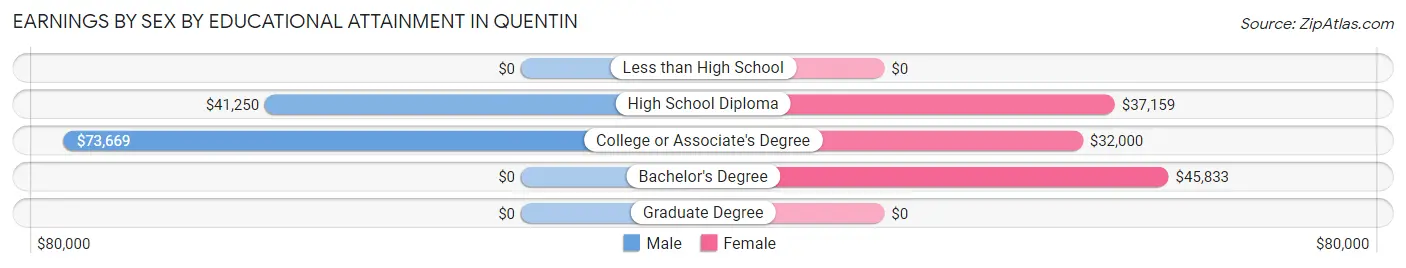
Earnings by Sex by Educational Attainment in Quentin
Average earnings in Quentin are $59,625 for men and $39,286 for women, a difference of 34.1%. Men with an educational attainment of college or associate's degree enjoy the highest average annual earnings of $73,669, while those with high school diploma education earn the least with $41,250. Women with an educational attainment of bachelor's degree earn the most with the average annual earnings of $45,833, while those with college or associate's degree education have the smallest earnings of $32,000.
| Educational Attainment | Male Income | Female Income |
| Less than High School | - | - |
| High School Diploma | $41,250 | $37,159 |
| College or Associate's Degree | $73,669 | $32,000 |
| Bachelor's Degree | - | - |
| Graduate Degree | - | - |
| Total | $59,625 | $39,286 |
Family Income in Quentin
Family Income Brackets in Quentin
According to the Quentin family income data, there are 39 families falling into the $35,000 to $49,999 income range, which is the most common income bracket and makes up 23.9% of all families.
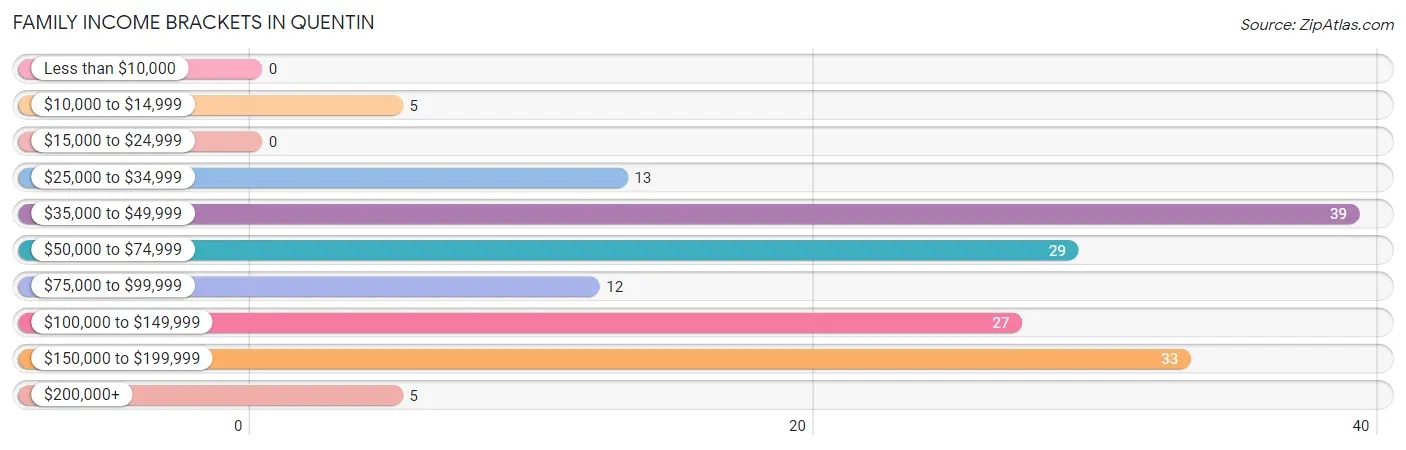
| Income Bracket | # Families | % Families |
| Less than $10,000 | 0 | 0.0% |
| $10,000 to $14,999 | 5 | 3.1% |
| $15,000 to $24,999 | 0 | 0.0% |
| $25,000 to $34,999 | 13 | 8.0% |
| $35,000 to $49,999 | 39 | 23.9% |
| $50,000 to $74,999 | 29 | 17.8% |
| $75,000 to $99,999 | 12 | 7.4% |
| $100,000 to $149,999 | 27 | 16.6% |
| $150,000 to $199,999 | 33 | 20.2% |
| $200,000+ | 5 | 3.1% |
Family Income by Famaliy Size in Quentin
2-person families (89 | 54.6%) account for the highest median family income in Quentin with $99,688 per family, while 2-person families (89 | 54.6%) have the highest median income of $49,844 per family member.
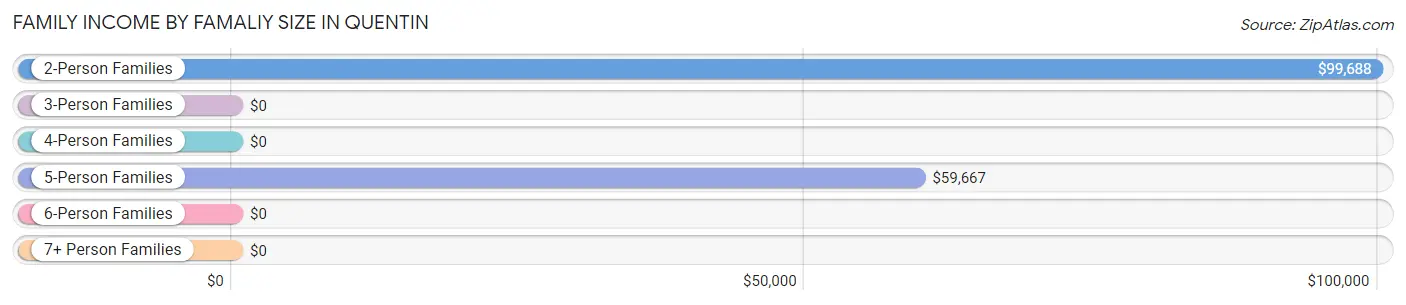
| Income Bracket | # Families | Median Income |
| 2-Person Families | 89 (54.6%) | $99,688 |
| 3-Person Families | 20 (12.3%) | $0 |
| 4-Person Families | 18 (11.0%) | $0 |
| 5-Person Families | 36 (22.1%) | $59,667 |
| 6-Person Families | 0 (0.0%) | $0 |
| 7+ Person Families | 0 (0.0%) | $0 |
| Total | 163 (100.0%) | $70,625 |
Family Income by Number of Earners in Quentin
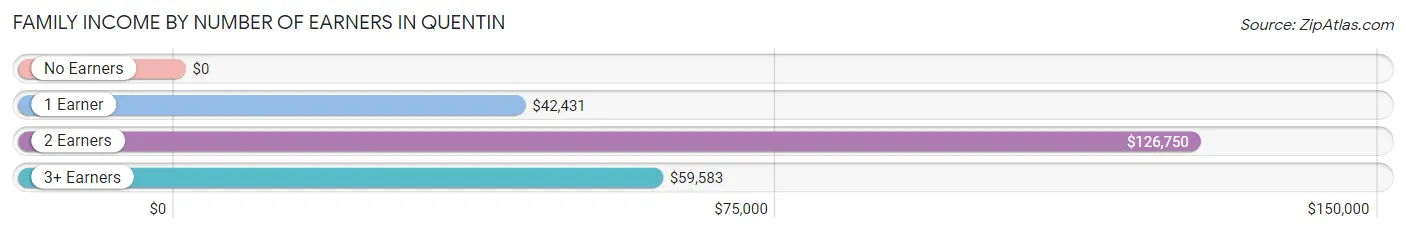
| Number of Earners | # Families | Median Income |
| No Earners | 22 (13.5%) | $0 |
| 1 Earner | 35 (21.5%) | $42,431 |
| 2 Earners | 81 (49.7%) | $126,750 |
| 3+ Earners | 25 (15.3%) | $59,583 |
| Total | 163 (100.0%) | $70,625 |
Household Income in Quentin
Household Income Brackets in Quentin
With 52 households falling in the category, the $35,000 to $49,999 income range is the most frequent in Quentin, accounting for 17.3% of all households.
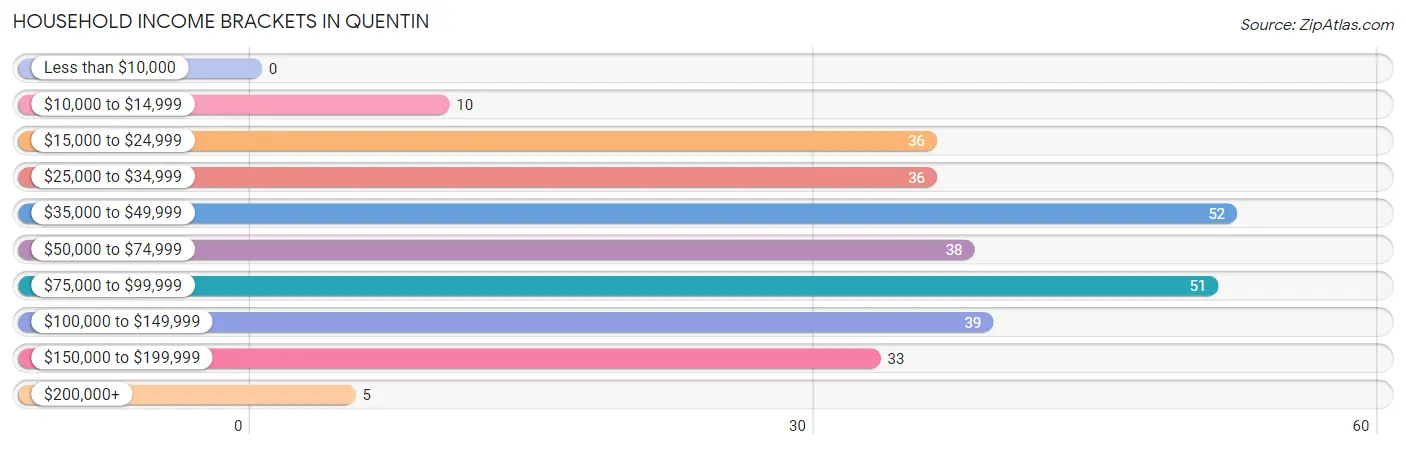
| Income Bracket | # Households | % Households |
| Less than $10,000 | 0 | 0.0% |
| $10,000 to $14,999 | 10 | 3.3% |
| $15,000 to $24,999 | 36 | 12.0% |
| $25,000 to $34,999 | 36 | 12.0% |
| $35,000 to $49,999 | 52 | 17.3% |
| $50,000 to $74,999 | 38 | 12.7% |
| $75,000 to $99,999 | 51 | 17.0% |
| $100,000 to $149,999 | 39 | 13.0% |
| $150,000 to $199,999 | 33 | 11.0% |
| $200,000+ | 5 | 1.7% |
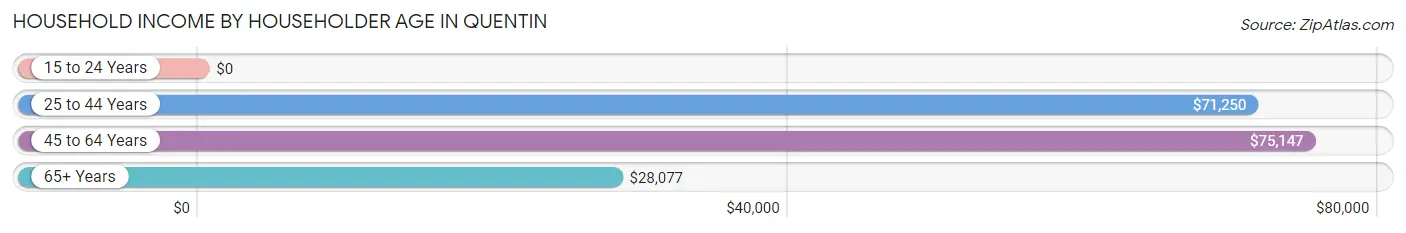
Household Income by Householder Age in Quentin
The median household income in Quentin is $60,417, with the highest median household income of $75,147 found in the 45 to 64 years age bracket for the primary householder. A total of 126 households (42.0%) fall into this category.
| Income Bracket | # Households | Median Income |
| 15 to 24 Years | 0 (0.0%) | $0 |
| 25 to 44 Years | 86 (28.7%) | $71,250 |
| 45 to 64 Years | 126 (42.0%) | $75,147 |
| 65+ Years | 88 (29.3%) | $28,077 |
| Total | 300 (100.0%) | $60,417 |
Poverty in Quentin
Income Below Poverty by Sex and Age in Quentin
With 7.3% poverty level for males and 1.7% for females among the residents of Quentin, 12 to 14 year old males and 35 to 44 year old females are the most vulnerable to poverty, with 6 males (54.5%) and 5 females (15.6%) in their respective age groups living below the poverty level.
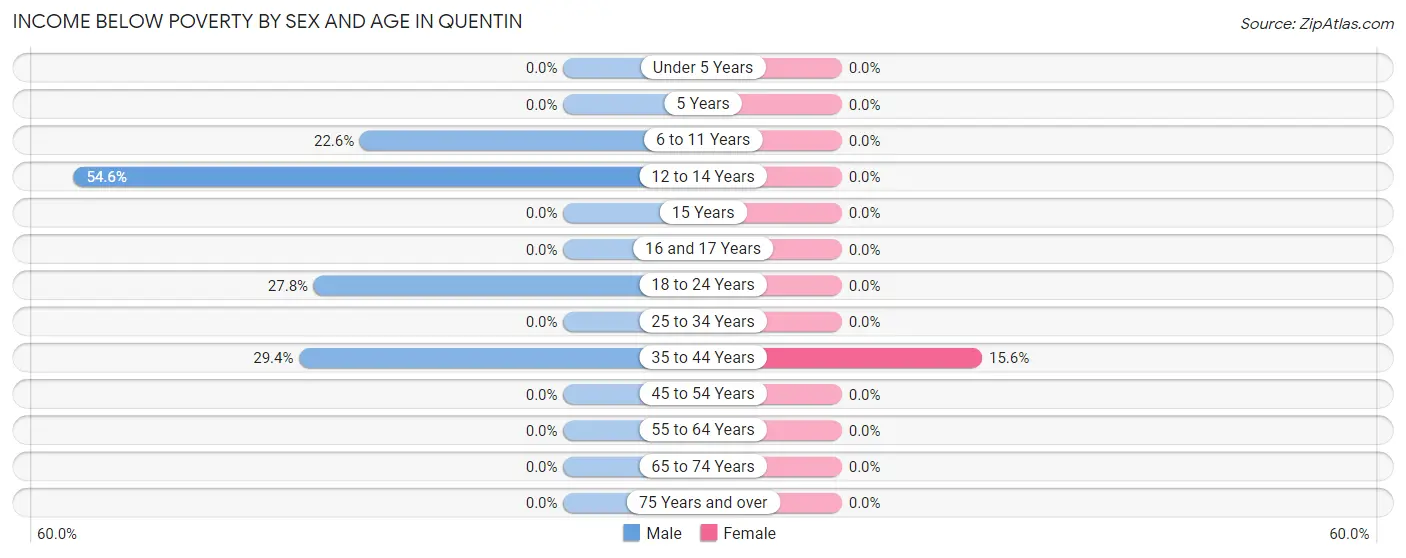
| Age Bracket | Male | Female |
| Under 5 Years | 0 (0.0%) | 0 (0.0%) |
| 5 Years | 0 (0.0%) | 0 (0.0%) |
| 6 to 11 Years | 12 (22.6%) | 0 (0.0%) |
| 12 to 14 Years | 6 (54.5%) | 0 (0.0%) |
| 15 Years | 0 (0.0%) | 0 (0.0%) |
| 16 and 17 Years | 0 (0.0%) | 0 (0.0%) |
| 18 to 24 Years | 5 (27.8%) | 0 (0.0%) |
| 25 to 34 Years | 0 (0.0%) | 0 (0.0%) |
| 35 to 44 Years | 5 (29.4%) | 5 (15.6%) |
| 45 to 54 Years | 0 (0.0%) | 0 (0.0%) |
| 55 to 64 Years | 0 (0.0%) | 0 (0.0%) |
| 65 to 74 Years | 0 (0.0%) | 0 (0.0%) |
| 75 Years and over | 0 (0.0%) | 0 (0.0%) |
| Total | 28 (7.3%) | 5 (1.7%) |
Income Above Poverty by Sex and Age in Quentin
According to the poverty statistics in Quentin, males aged 15 years and females aged under 5 years are the age groups that are most secure financially, with 100.0% of males and 100.0% of females in these age groups living above the poverty line.
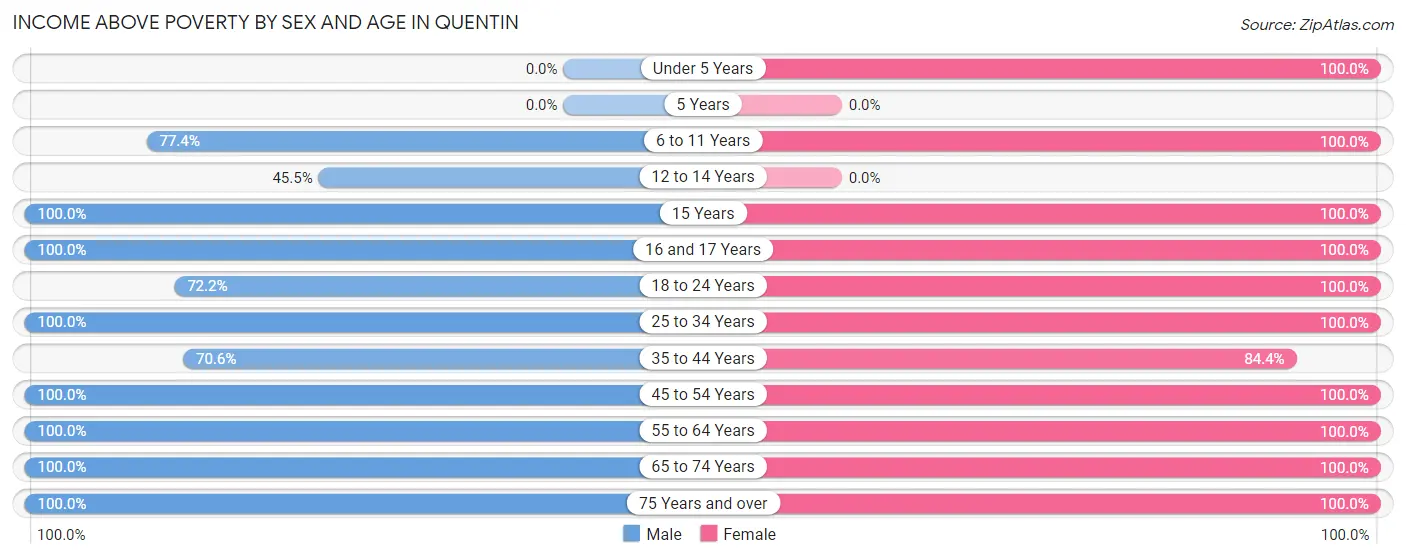
| Age Bracket | Male | Female |
| Under 5 Years | 0 (0.0%) | 26 (100.0%) |
| 5 Years | 0 (0.0%) | 0 (0.0%) |
| 6 to 11 Years | 41 (77.4%) | 20 (100.0%) |
| 12 to 14 Years | 5 (45.5%) | 0 (0.0%) |
| 15 Years | 14 (100.0%) | 4 (100.0%) |
| 16 and 17 Years | 28 (100.0%) | 5 (100.0%) |
| 18 to 24 Years | 13 (72.2%) | 14 (100.0%) |
| 25 to 34 Years | 84 (100.0%) | 20 (100.0%) |
| 35 to 44 Years | 12 (70.6%) | 27 (84.4%) |
| 45 to 54 Years | 56 (100.0%) | 57 (100.0%) |
| 55 to 64 Years | 38 (100.0%) | 42 (100.0%) |
| 65 to 74 Years | 32 (100.0%) | 22 (100.0%) |
| 75 Years and over | 30 (100.0%) | 53 (100.0%) |
| Total | 353 (92.6%) | 290 (98.3%) |
Income Below Poverty Among Married-Couple Families in Quentin
The poverty statistics for married-couple families in Quentin show that 4.7% or 5 of the total 106 families live below the poverty line. Families with 3 or 4 children have the highest poverty rate of 31.2%, comprising of 5 families. On the other hand, families with no children have the lowest poverty rate of 0.0%, which includes 0 families.
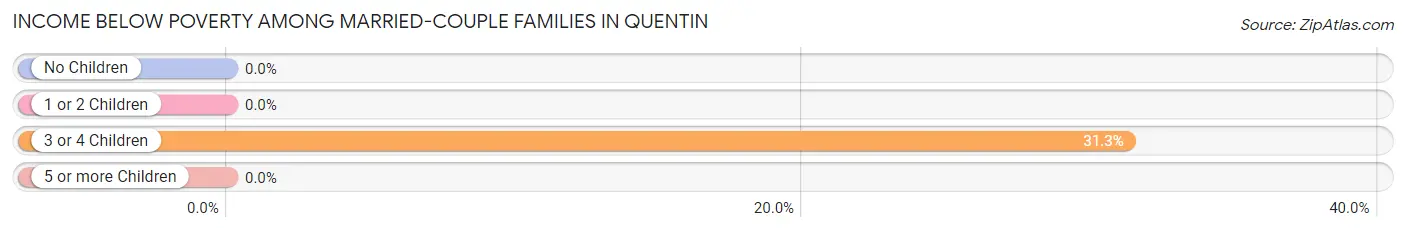
| Children | Above Poverty | Below Poverty |
| No Children | 84 (100.0%) | 0 (0.0%) |
| 1 or 2 Children | 6 (100.0%) | 0 (0.0%) |
| 3 or 4 Children | 11 (68.8%) | 5 (31.2%) |
| 5 or more Children | 0 (0.0%) | 0 (0.0%) |
| Total | 101 (95.3%) | 5 (4.7%) |
Income Below Poverty Among Single-Parent Households in Quentin
| Children | Single Father | Single Mother |
| No Children | 0 (0.0%) | 0 (0.0%) |
| 1 or 2 Children | 0 (0.0%) | 0 (0.0%) |
| 3 or 4 Children | 0 (0.0%) | 0 (0.0%) |
| 5 or more Children | 0 (0.0%) | 0 (0.0%) |
| Total | 0 (0.0%) | 0 (0.0%) |
Income Below Poverty Among Married-Couple vs Single-Parent Households in Quentin
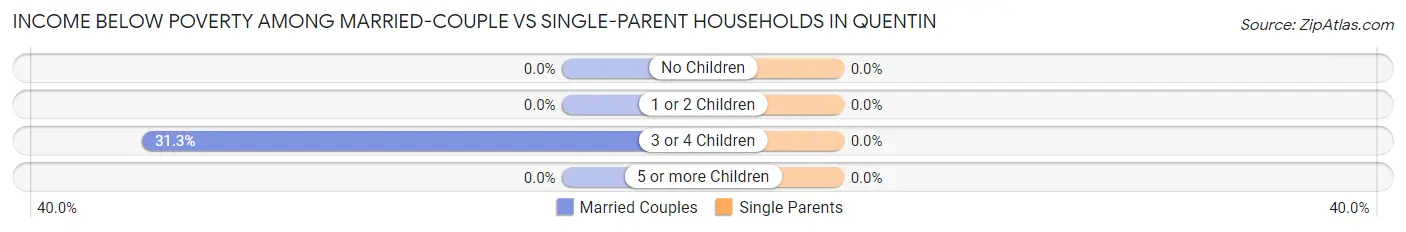
| Children | Married-Couple Families | Single-Parent Households |
| No Children | 0 (0.0%) | 0 (0.0%) |
| 1 or 2 Children | 0 (0.0%) | 0 (0.0%) |
| 3 or 4 Children | 5 (31.2%) | 0 (0.0%) |
| 5 or more Children | 0 (0.0%) | 0 (0.0%) |
| Total | 5 (4.7%) | 0 (0.0%) |
Race in Quentin
The most populous races in Quentin are White / Caucasian (644 | 95.3%), Asian (18 | 2.7%), and Native / Alaskan (14 | 2.1%).
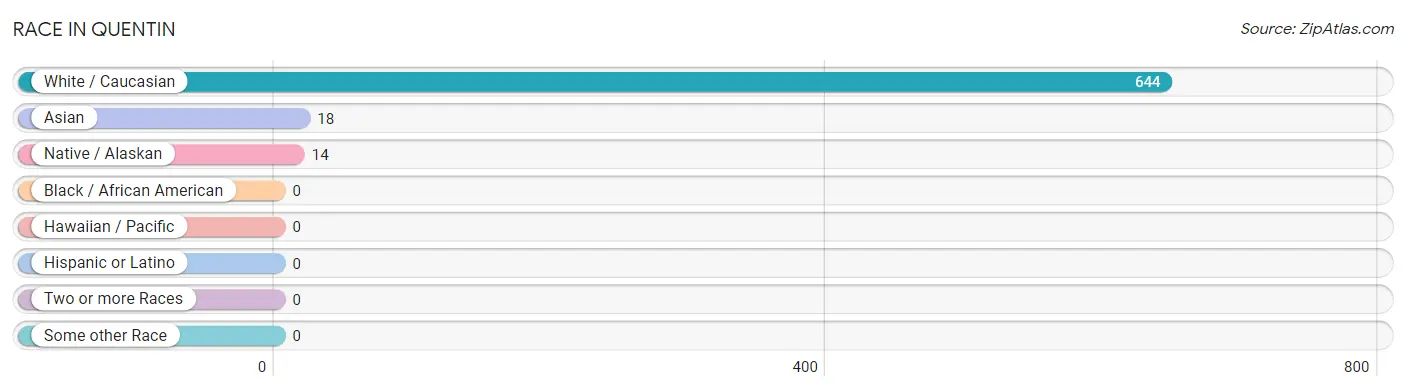
| Race | # Population | % Population |
| Asian | 18 | 2.7% |
| Black / African American | 0 | 0.0% |
| Hawaiian / Pacific | 0 | 0.0% |
| Hispanic or Latino | 0 | 0.0% |
| Native / Alaskan | 14 | 2.1% |
| White / Caucasian | 644 | 95.3% |
| Two or more Races | 0 | 0.0% |
| Some other Race | 0 | 0.0% |
| Total | 676 | 100.0% |
Ancestry in Quentin
The most populous ancestries reported in Quentin are German (350 | 51.8%), Swiss (73 | 10.8%), French (38 | 5.6%), Irish (33 | 4.9%), and American (30 | 4.4%), together accounting for 77.5% of all Quentin residents.
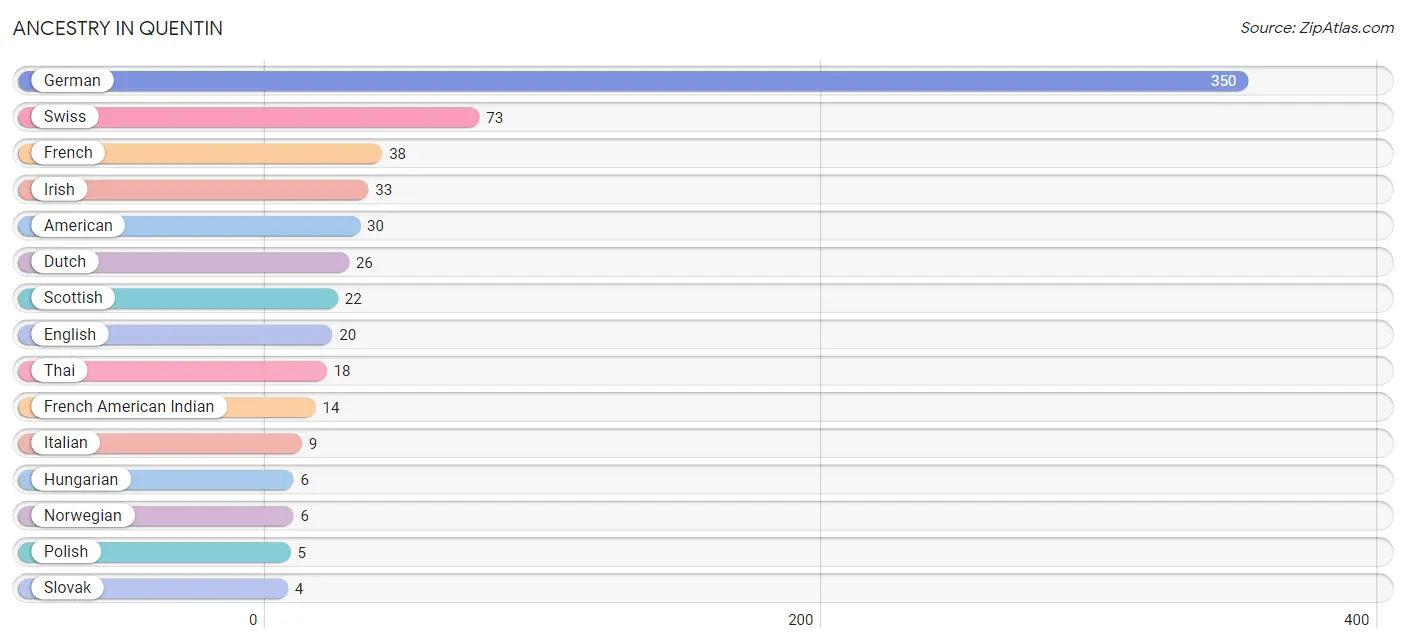
| Ancestry | # Population | % Population |
| American | 30 | 4.4% |
| Dutch | 26 | 3.8% |
| English | 20 | 3.0% |
| French | 38 | 5.6% |
| French American Indian | 14 | 2.1% |
| German | 350 | 51.8% |
| Hungarian | 6 | 0.9% |
| Irish | 33 | 4.9% |
| Italian | 9 | 1.3% |
| Norwegian | 6 | 0.9% |
| Polish | 5 | 0.7% |
| Scottish | 22 | 3.3% |
| Slovak | 4 | 0.6% |
| Swiss | 73 | 10.8% |
| Thai | 18 | 2.7% | View All 15 Rows |
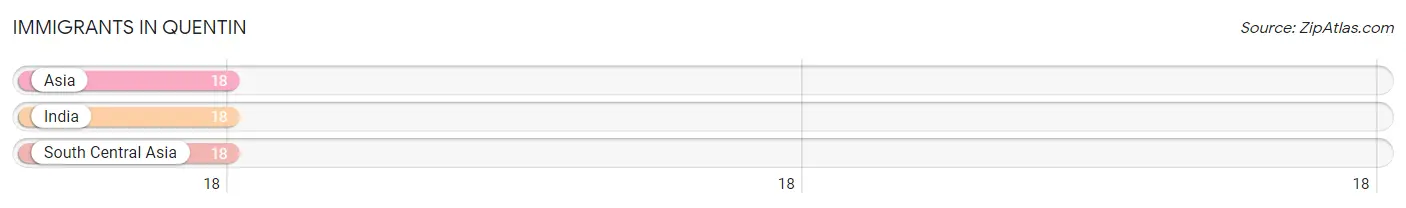
Immigrants in Quentin
The most numerous immigrant groups reported in Quentin came from Asia (18 | 2.7%), India (18 | 2.7%), and South Central Asia (18 | 2.7%), together accounting for 8.0% of all Quentin residents.
| Immigration Origin | # Population | % Population |
| Asia | 18 | 2.7% |
| India | 18 | 2.7% |
| South Central Asia | 18 | 2.7% | View All 3 Rows |
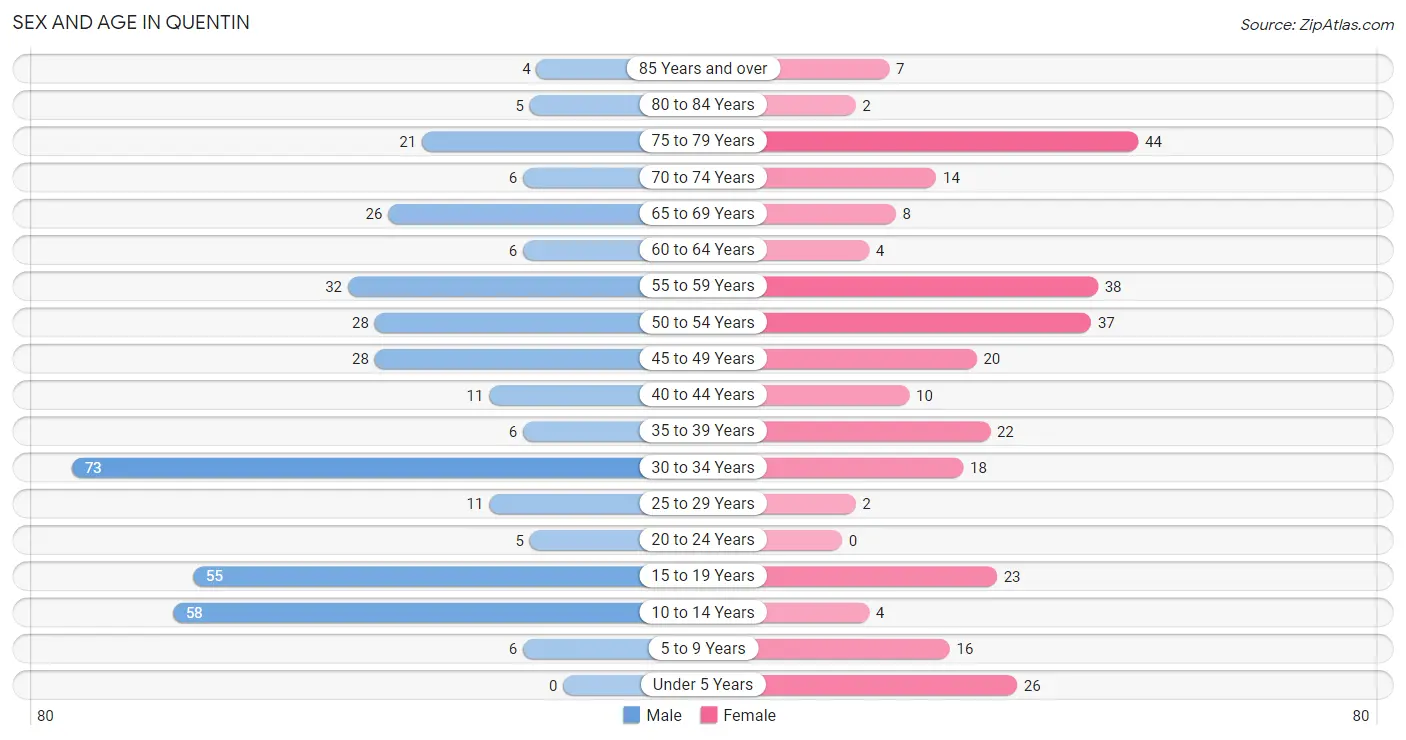
Sex and Age in Quentin
Sex and Age in Quentin
The most populous age groups in Quentin are 30 to 34 Years (73 | 19.2%) for men and 75 to 79 Years (44 | 14.9%) for women.
| Age Bracket | Male | Female |
| Under 5 Years | 0 (0.0%) | 26 (8.8%) |
| 5 to 9 Years | 6 (1.6%) | 16 (5.4%) |
| 10 to 14 Years | 58 (15.2%) | 4 (1.4%) |
| 15 to 19 Years | 55 (14.4%) | 23 (7.8%) |
| 20 to 24 Years | 5 (1.3%) | 0 (0.0%) |
| 25 to 29 Years | 11 (2.9%) | 2 (0.7%) |
| 30 to 34 Years | 73 (19.2%) | 18 (6.1%) |
| 35 to 39 Years | 6 (1.6%) | 22 (7.5%) |
| 40 to 44 Years | 11 (2.9%) | 10 (3.4%) |
| 45 to 49 Years | 28 (7.3%) | 20 (6.8%) |
| 50 to 54 Years | 28 (7.3%) | 37 (12.5%) |
| 55 to 59 Years | 32 (8.4%) | 38 (12.9%) |
| 60 to 64 Years | 6 (1.6%) | 4 (1.4%) |
| 65 to 69 Years | 26 (6.8%) | 8 (2.7%) |
| 70 to 74 Years | 6 (1.6%) | 14 (4.8%) |
| 75 to 79 Years | 21 (5.5%) | 44 (14.9%) |
| 80 to 84 Years | 5 (1.3%) | 2 (0.7%) |
| 85 Years and over | 4 (1.1%) | 7 (2.4%) |
| Total | 381 (100.0%) | 295 (100.0%) |
Families and Households in Quentin
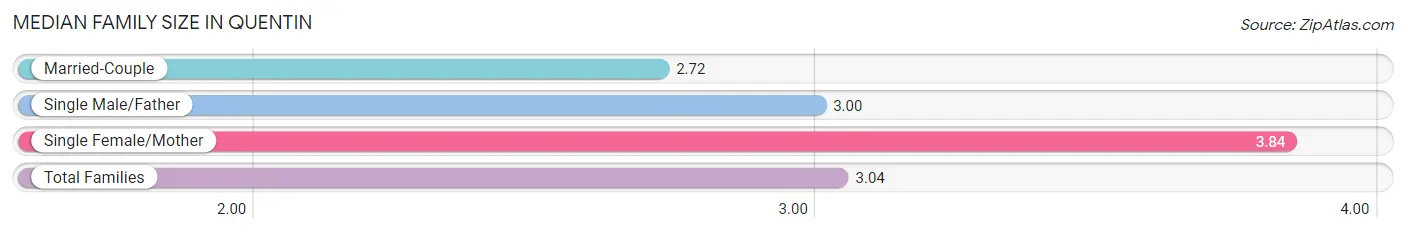
Median Family Size in Quentin
The median family size in Quentin is 3.04 persons per family, with single female/mother families (44 | 27.0%) accounting for the largest median family size of 3.84 persons per family. On the other hand, married-couple families (106 | 65.0%) represent the smallest median family size with 2.72 persons per family.
| Family Type | # Families | Family Size |
| Married-Couple | 106 (65.0%) | 2.72 |
| Single Male/Father | 13 (8.0%) | 3.00 |
| Single Female/Mother | 44 (27.0%) | 3.84 |
| Total Families | 163 (100.0%) | 3.04 |
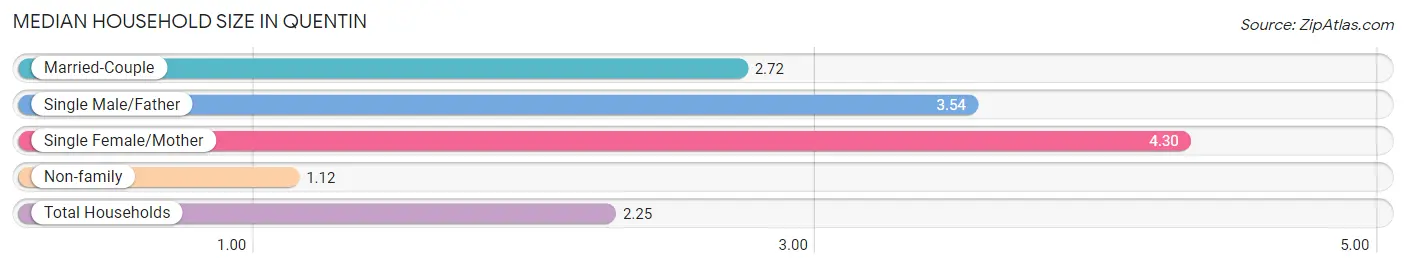
Median Household Size in Quentin
The median household size in Quentin is 2.25 persons per household, with single female/mother households (44 | 14.7%) accounting for the largest median household size of 4.3 persons per household. non-family households (137 | 45.7%) represent the smallest median household size with 1.12 persons per household.
| Household Type | # Households | Household Size |
| Married-Couple | 106 (35.3%) | 2.72 |
| Single Male/Father | 13 (4.3%) | 3.54 |
| Single Female/Mother | 44 (14.7%) | 4.30 |
| Non-family | 137 (45.7%) | 1.12 |
| Total Households | 300 (100.0%) | 2.25 |
Household Size by Marriage Status in Quentin
Out of a total of 300 households in Quentin, 163 (54.3%) are family households, while 137 (45.7%) are nonfamily households. The most numerous type of family households are 2-person households, comprising 86, and the most common type of nonfamily households are 1-person households, comprising 129.
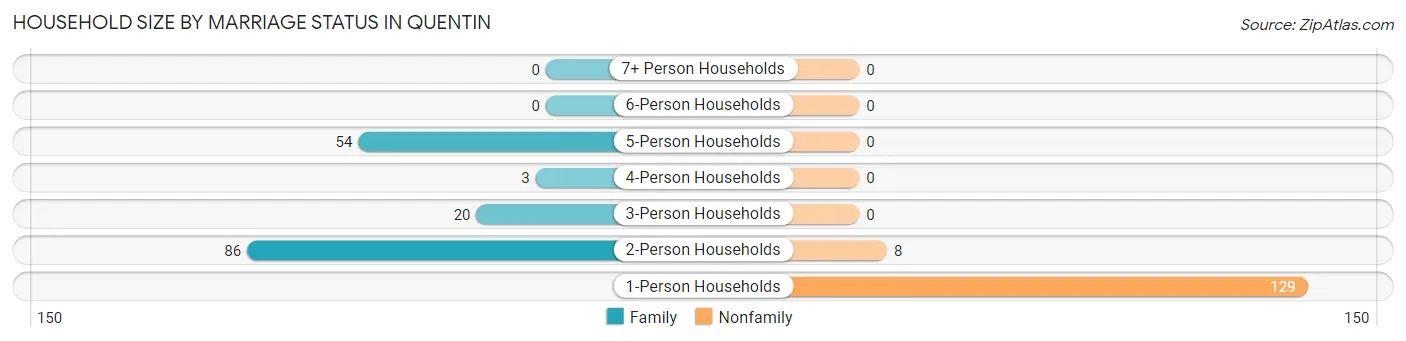
| Household Size | Family Households | Nonfamily Households |
| 1-Person Households | - | 129 (43.0%) |
| 2-Person Households | 86 (28.7%) | 8 (2.7%) |
| 3-Person Households | 20 (6.7%) | 0 (0.0%) |
| 4-Person Households | 3 (1.0%) | 0 (0.0%) |
| 5-Person Households | 54 (18.0%) | 0 (0.0%) |
| 6-Person Households | 0 (0.0%) | 0 (0.0%) |
| 7+ Person Households | 0 (0.0%) | 0 (0.0%) |
| Total | 163 (54.3%) | 137 (45.7%) |
Female Fertility in Quentin
Fertility by Age in Quentin
Average fertility rate in Quentin is 32.0 births per 1,000 women. Women in the age bracket of 15 to 19 years have the highest fertility rate with 130.0 births per 1,000 women. Women in the age bracket of 15 to 19 years acount for 100.0% of all women with births.
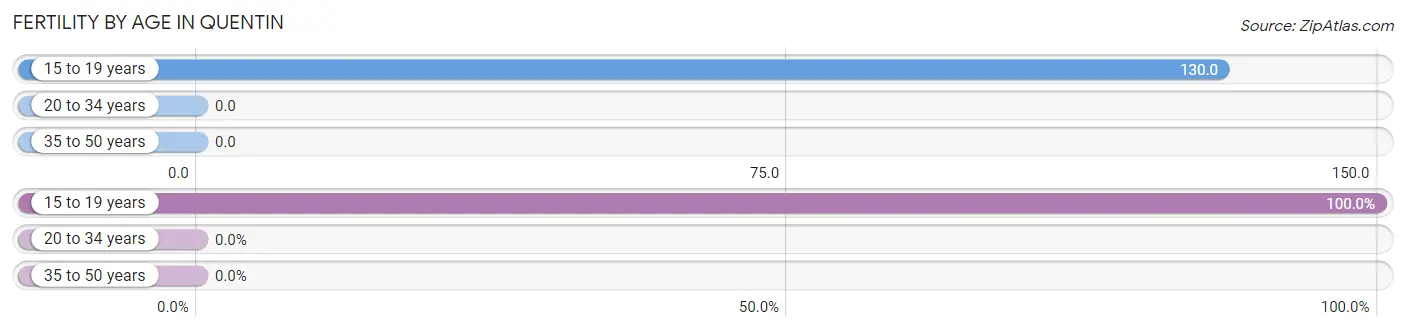
| Age Bracket | Women with Births | Births / 1,000 Women |
| 15 to 19 years | 3 (100.0%) | 130.0 |
| 20 to 34 years | 0 (0.0%) | 0.0 |
| 35 to 50 years | 0 (0.0%) | 0.0 |
| Total | 3 (100.0%) | 32.0 |
Fertility by Age by Marriage Status in Quentin
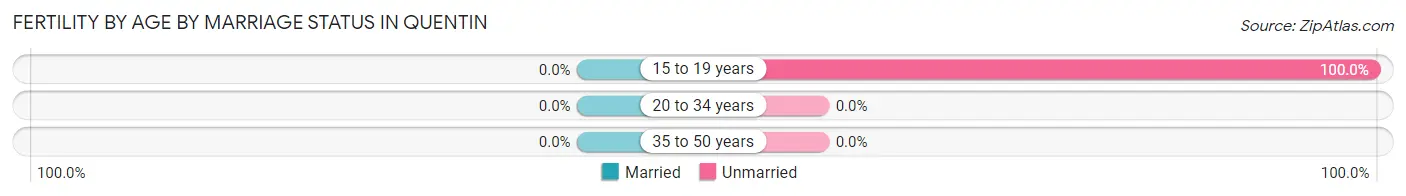
| Age Bracket | Married | Unmarried |
| 15 to 19 years | 0 (0.0%) | 3 (100.0%) |
| 20 to 34 years | 0 (0.0%) | 0 (0.0%) |
| 35 to 50 years | 0 (0.0%) | 0 (0.0%) |
| Total | 0 (0.0%) | 3 (100.0%) |
Fertility by Education in Quentin
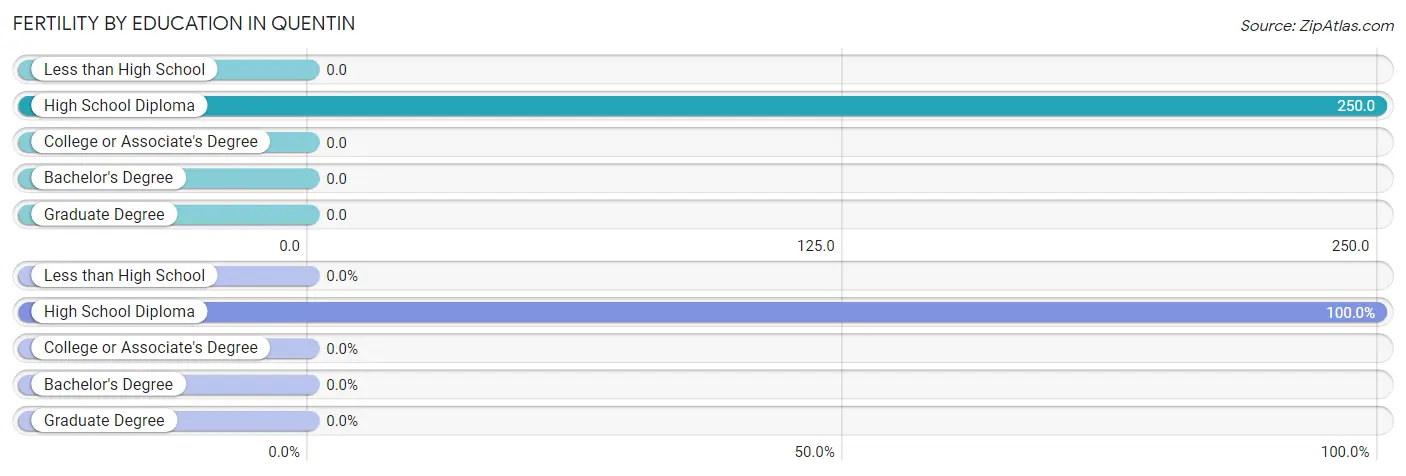
| Educational Attainment | Women with Births | Births / 1,000 Women |
| Less than High School | 0 (0.0%) | 0.0 |
| High School Diploma | 3 (100.0%) | 250.0 |
| College or Associate's Degree | 0 (0.0%) | 0.0 |
| Bachelor's Degree | 0 (0.0%) | 0.0 |
| Graduate Degree | 0 (0.0%) | 0.0 |
| Total | 3 (100.0%) | 32.0 |
Fertility by Education by Marriage Status in Quentin
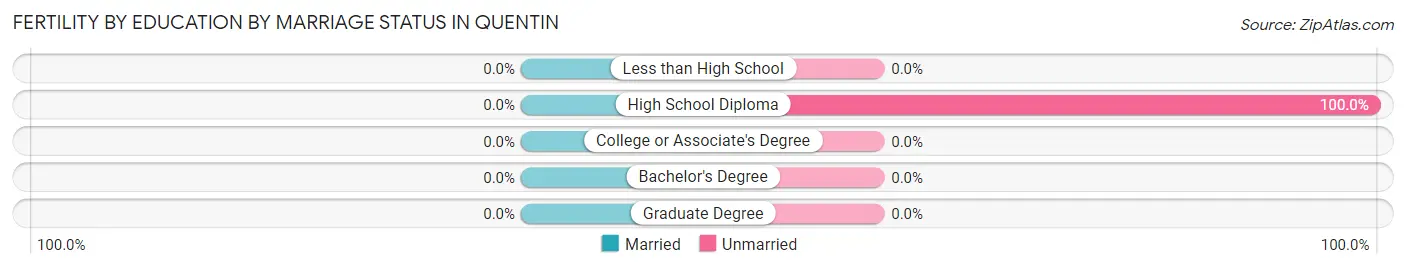
| Educational Attainment | Married | Unmarried |
| Less than High School | 0 (0.0%) | 0 (0.0%) |
| High School Diploma | 0 (0.0%) | 3 (100.0%) |
| College or Associate's Degree | 0 (0.0%) | 0 (0.0%) |
| Bachelor's Degree | 0 (0.0%) | 0 (0.0%) |
| Graduate Degree | 0 (0.0%) | 0 (0.0%) |
| Total | 0 (0.0%) | 3 (100.0%) |
Employment Characteristics in Quentin
Employment by Class of Employer in Quentin
Among the 371 employed individuals in Quentin, private company employees (237 | 63.9%), not-for-profit organizations (44 | 11.9%), and federal government employees (27 | 7.3%) make up the most common classes of employment.
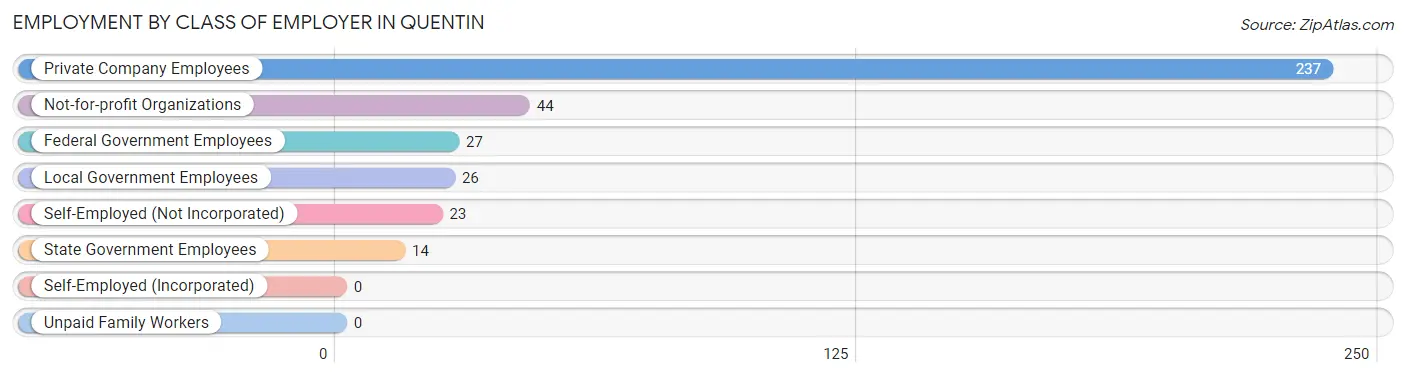
| Employer Class | # Employees | % Employees |
| Private Company Employees | 237 | 63.9% |
| Self-Employed (Incorporated) | 0 | 0.0% |
| Self-Employed (Not Incorporated) | 23 | 6.2% |
| Not-for-profit Organizations | 44 | 11.9% |
| Local Government Employees | 26 | 7.0% |
| State Government Employees | 14 | 3.8% |
| Federal Government Employees | 27 | 7.3% |
| Unpaid Family Workers | 0 | 0.0% |
| Total | 371 | 100.0% |
Employment Status by Age in Quentin
According to the labor force statistics for Quentin, out of the total population over 16 years of age (548), 71.2% or 390 individuals are in the labor force, with 2.1% or 8 of them unemployed. The age group with the highest labor force participation rate is 20 to 24 years, with 100.0% or 5 individuals in the labor force. Within the labor force, the 65 to 74 years age range has the highest percentage of unemployed individuals, with 17.6% or 3 of them being unemployed.
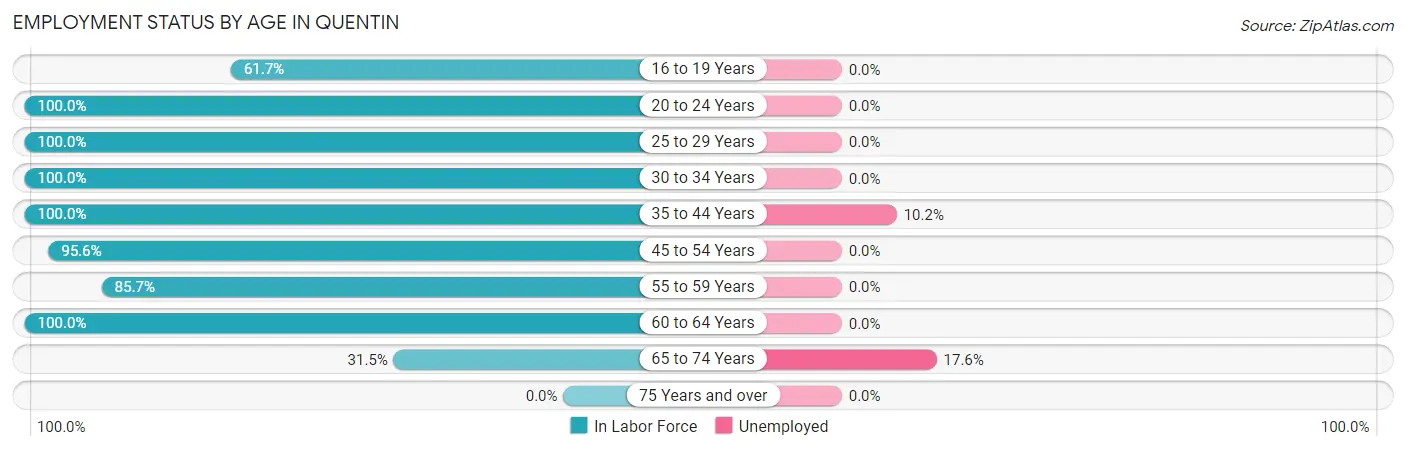
| Age Bracket | In Labor Force | Unemployed |
| 16 to 19 Years | 37 (61.7%) | 0 (0.0%) |
| 20 to 24 Years | 5 (100.0%) | 0 (0.0%) |
| 25 to 29 Years | 13 (100.0%) | 0 (0.0%) |
| 30 to 34 Years | 91 (100.0%) | 0 (0.0%) |
| 35 to 44 Years | 49 (100.0%) | 5 (10.2%) |
| 45 to 54 Years | 108 (95.6%) | 0 (0.0%) |
| 55 to 59 Years | 60 (85.7%) | 0 (0.0%) |
| 60 to 64 Years | 10 (100.0%) | 0 (0.0%) |
| 65 to 74 Years | 17 (31.5%) | 3 (17.6%) |
| 75 Years and over | 0 (0.0%) | 0 (0.0%) |
| Total | 390 (71.2%) | 8 (2.1%) |
Employment Status by Educational Attainment in Quentin
According to labor force statistics for Quentin, 95.7% of individuals (331) out of the total population between 25 and 64 years of age (346) are in the labor force, with 1.5% or 5 of them being unemployed. The group with the highest labor force participation rate are those with the educational attainment of less than high school, with 100.0% or 8 individuals in the labor force. Within the labor force, individuals with high school diploma education have the highest percentage of unemployment, with 3.5% or 5 of them being unemployed.
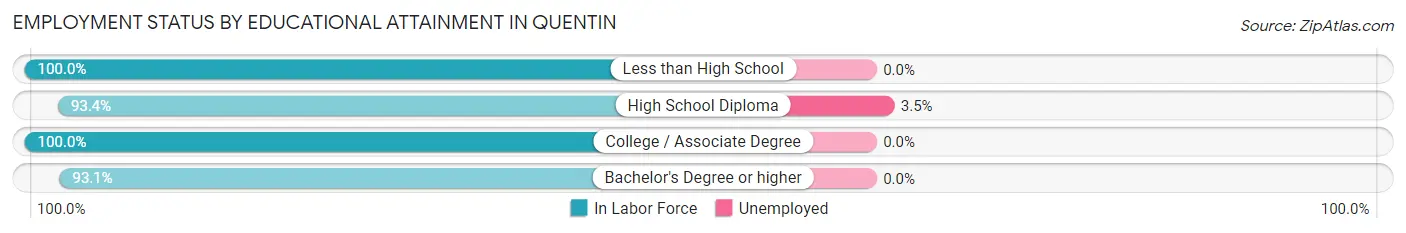
| Educational Attainment | In Labor Force | Unemployed |
| Less than High School | 8 (100.0%) | 0 (0.0%) |
| High School Diploma | 141 (93.4%) | 5 (3.5%) |
| College / Associate Degree | 115 (100.0%) | 0 (0.0%) |
| Bachelor's Degree or higher | 67 (93.1%) | 0 (0.0%) |
| Total | 331 (95.7%) | 5 (1.5%) |
Employment Occupations by Sex in Quentin
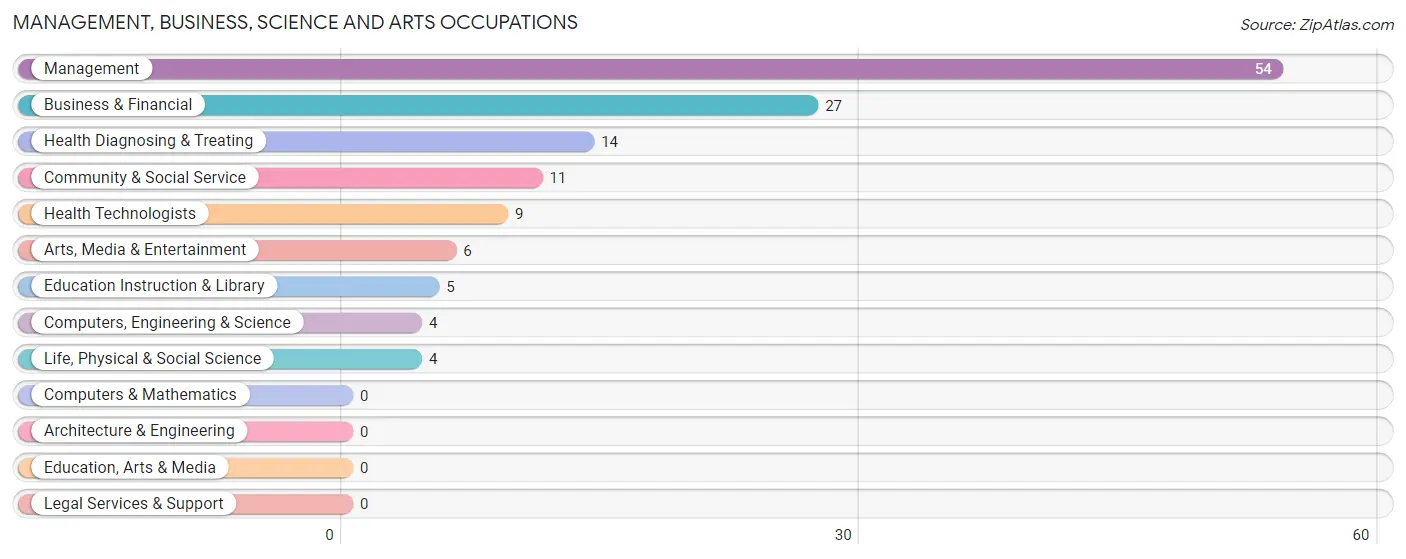
Management, Business, Science and Arts Occupations
The most common Management, Business, Science and Arts occupations in Quentin are Management (54 | 14.1%), Business & Financial (27 | 7.1%), Health Diagnosing & Treating (14 | 3.7%), Community & Social Service (11 | 2.9%), and Health Technologists (9 | 2.4%).
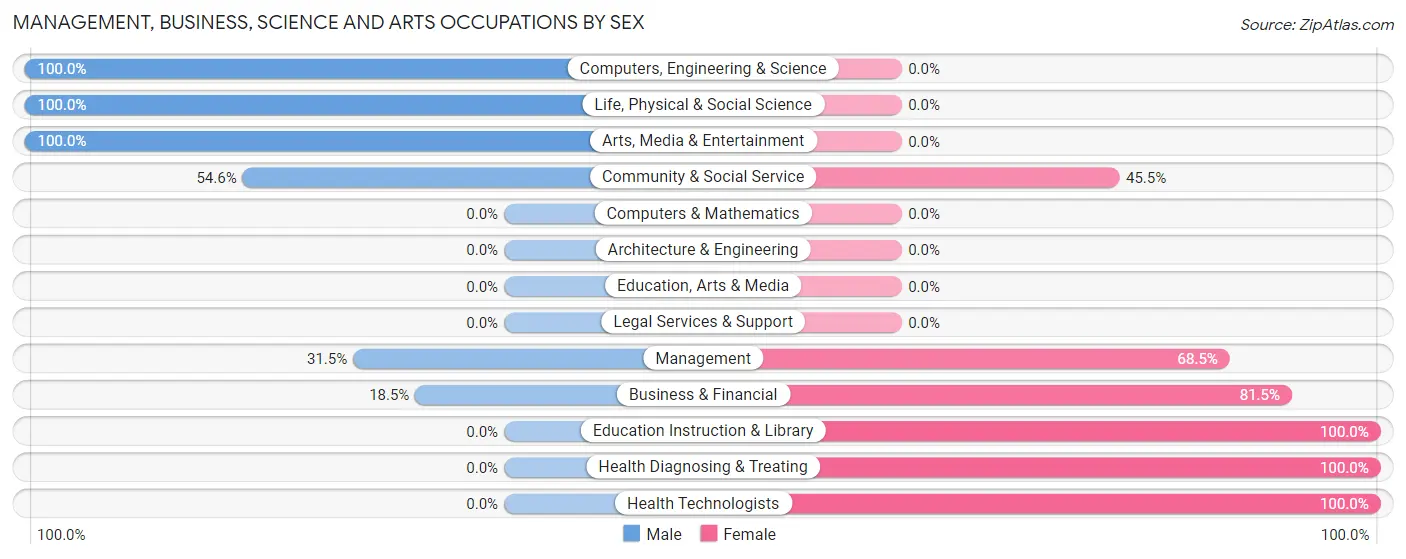
Management, Business, Science and Arts Occupations by Sex
Within the Management, Business, Science and Arts occupations in Quentin, the most male-oriented occupations are Computers, Engineering & Science (100.0%), Life, Physical & Social Science (100.0%), and Arts, Media & Entertainment (100.0%), while the most female-oriented occupations are Education Instruction & Library (100.0%), Health Diagnosing & Treating (100.0%), and Health Technologists (100.0%).
| Occupation | Male | Female |
| Management | 17 (31.5%) | 37 (68.5%) |
| Business & Financial | 5 (18.5%) | 22 (81.5%) |
| Computers, Engineering & Science | 4 (100.0%) | 0 (0.0%) |
| Computers & Mathematics | 0 (0.0%) | 0 (0.0%) |
| Architecture & Engineering | 0 (0.0%) | 0 (0.0%) |
| Life, Physical & Social Science | 4 (100.0%) | 0 (0.0%) |
| Community & Social Service | 6 (54.5%) | 5 (45.5%) |
| Education, Arts & Media | 0 (0.0%) | 0 (0.0%) |
| Legal Services & Support | 0 (0.0%) | 0 (0.0%) |
| Education Instruction & Library | 0 (0.0%) | 5 (100.0%) |
| Arts, Media & Entertainment | 6 (100.0%) | 0 (0.0%) |
| Health Diagnosing & Treating | 0 (0.0%) | 14 (100.0%) |
| Health Technologists | 0 (0.0%) | 9 (100.0%) |
| Total (Category) | 32 (29.1%) | 78 (70.9%) |
| Total (Overall) | 226 (59.2%) | 156 (40.8%) |
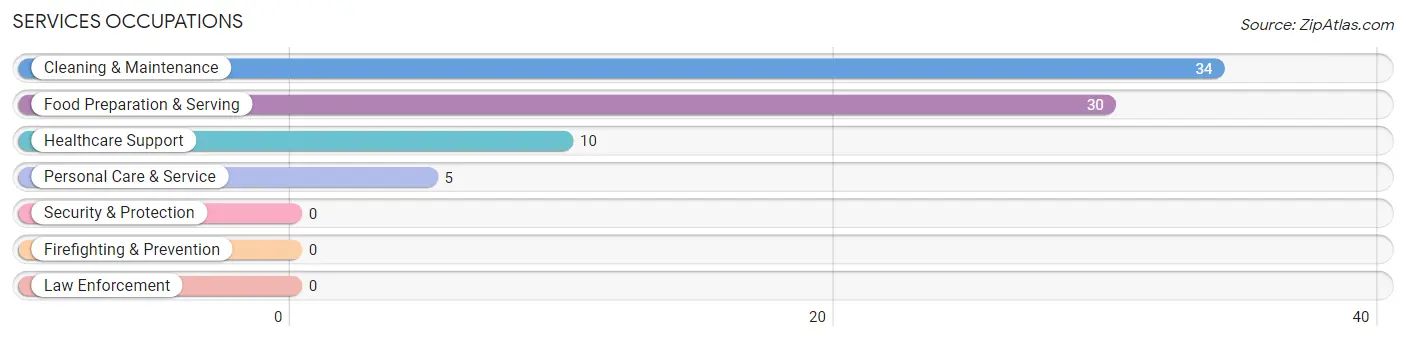
Services Occupations
The most common Services occupations in Quentin are Cleaning & Maintenance (34 | 8.9%), Food Preparation & Serving (30 | 7.9%), Healthcare Support (10 | 2.6%), and Personal Care & Service (5 | 1.3%).
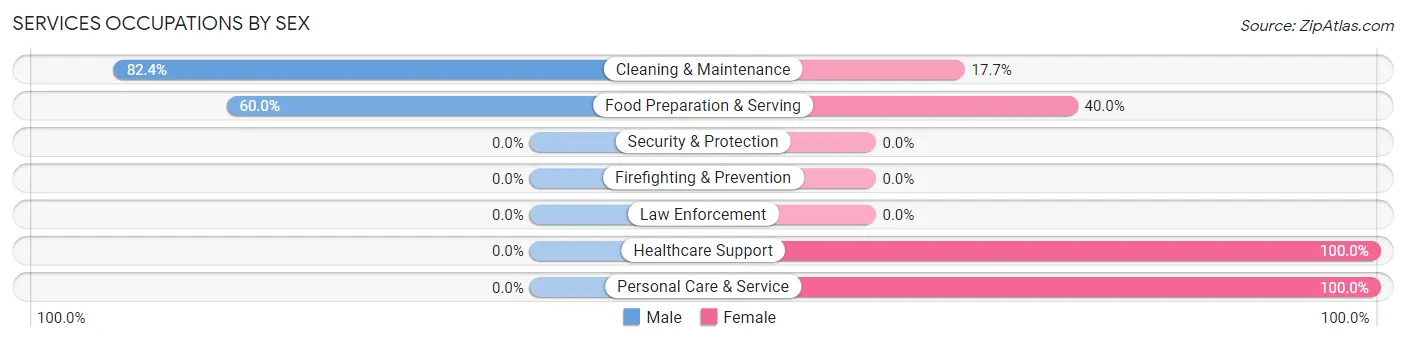
Services Occupations by Sex
Within the Services occupations in Quentin, the most male-oriented occupations are Cleaning & Maintenance (82.4%), and Food Preparation & Serving (60.0%), while the most female-oriented occupations are Healthcare Support (100.0%), Personal Care & Service (100.0%), and Food Preparation & Serving (40.0%).
| Occupation | Male | Female |
| Healthcare Support | 0 (0.0%) | 10 (100.0%) |
| Security & Protection | 0 (0.0%) | 0 (0.0%) |
| Firefighting & Prevention | 0 (0.0%) | 0 (0.0%) |
| Law Enforcement | 0 (0.0%) | 0 (0.0%) |
| Food Preparation & Serving | 18 (60.0%) | 12 (40.0%) |
| Cleaning & Maintenance | 28 (82.4%) | 6 (17.6%) |
| Personal Care & Service | 0 (0.0%) | 5 (100.0%) |
| Total (Category) | 46 (58.2%) | 33 (41.8%) |
| Total (Overall) | 226 (59.2%) | 156 (40.8%) |
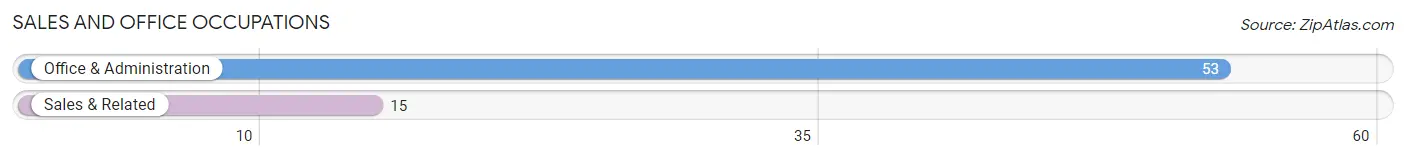
Sales and Office Occupations
The most common Sales and Office occupations in Quentin are Office & Administration (53 | 13.9%), and Sales & Related (15 | 3.9%).
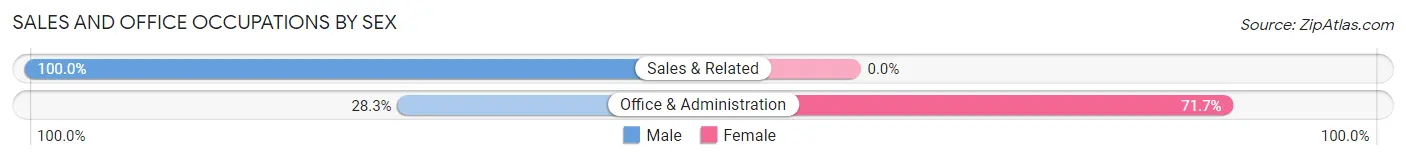
Sales and Office Occupations by Sex
| Occupation | Male | Female |
| Sales & Related | 15 (100.0%) | 0 (0.0%) |
| Office & Administration | 15 (28.3%) | 38 (71.7%) |
| Total (Category) | 30 (44.1%) | 38 (55.9%) |
| Total (Overall) | 226 (59.2%) | 156 (40.8%) |
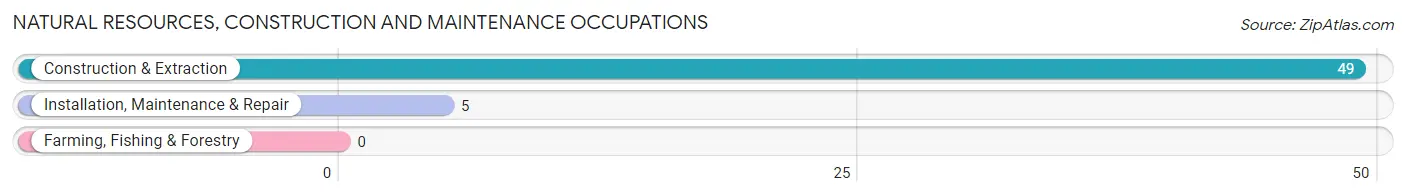
Natural Resources, Construction and Maintenance Occupations
The most common Natural Resources, Construction and Maintenance occupations in Quentin are Construction & Extraction (49 | 12.8%), and Installation, Maintenance & Repair (5 | 1.3%).
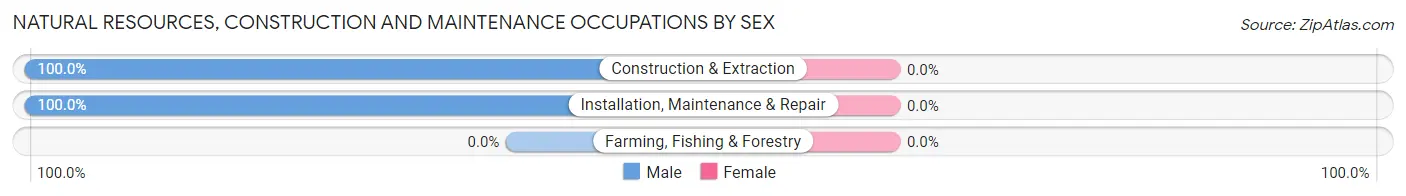
Natural Resources, Construction and Maintenance Occupations by Sex
| Occupation | Male | Female |
| Farming, Fishing & Forestry | 0 (0.0%) | 0 (0.0%) |
| Construction & Extraction | 49 (100.0%) | 0 (0.0%) |
| Installation, Maintenance & Repair | 5 (100.0%) | 0 (0.0%) |
| Total (Category) | 54 (100.0%) | 0 (0.0%) |
| Total (Overall) | 226 (59.2%) | 156 (40.8%) |
Production, Transportation and Moving Occupations
The most common Production, Transportation and Moving occupations in Quentin are Production (53 | 13.9%), and Material Moving (18 | 4.7%).
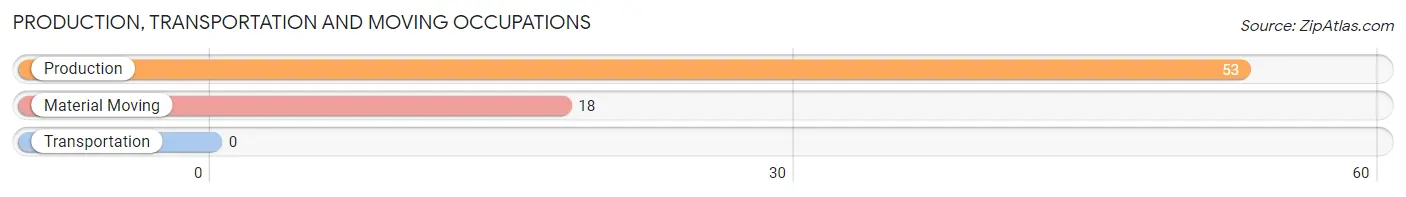
Production, Transportation and Moving Occupations by Sex
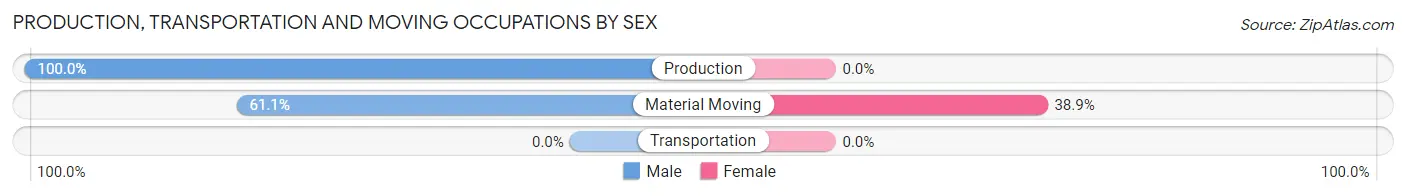
| Occupation | Male | Female |
| Production | 53 (100.0%) | 0 (0.0%) |
| Transportation | 0 (0.0%) | 0 (0.0%) |
| Material Moving | 11 (61.1%) | 7 (38.9%) |
| Total (Category) | 64 (90.1%) | 7 (9.9%) |
| Total (Overall) | 226 (59.2%) | 156 (40.8%) |
Employment Industries by Sex in Quentin
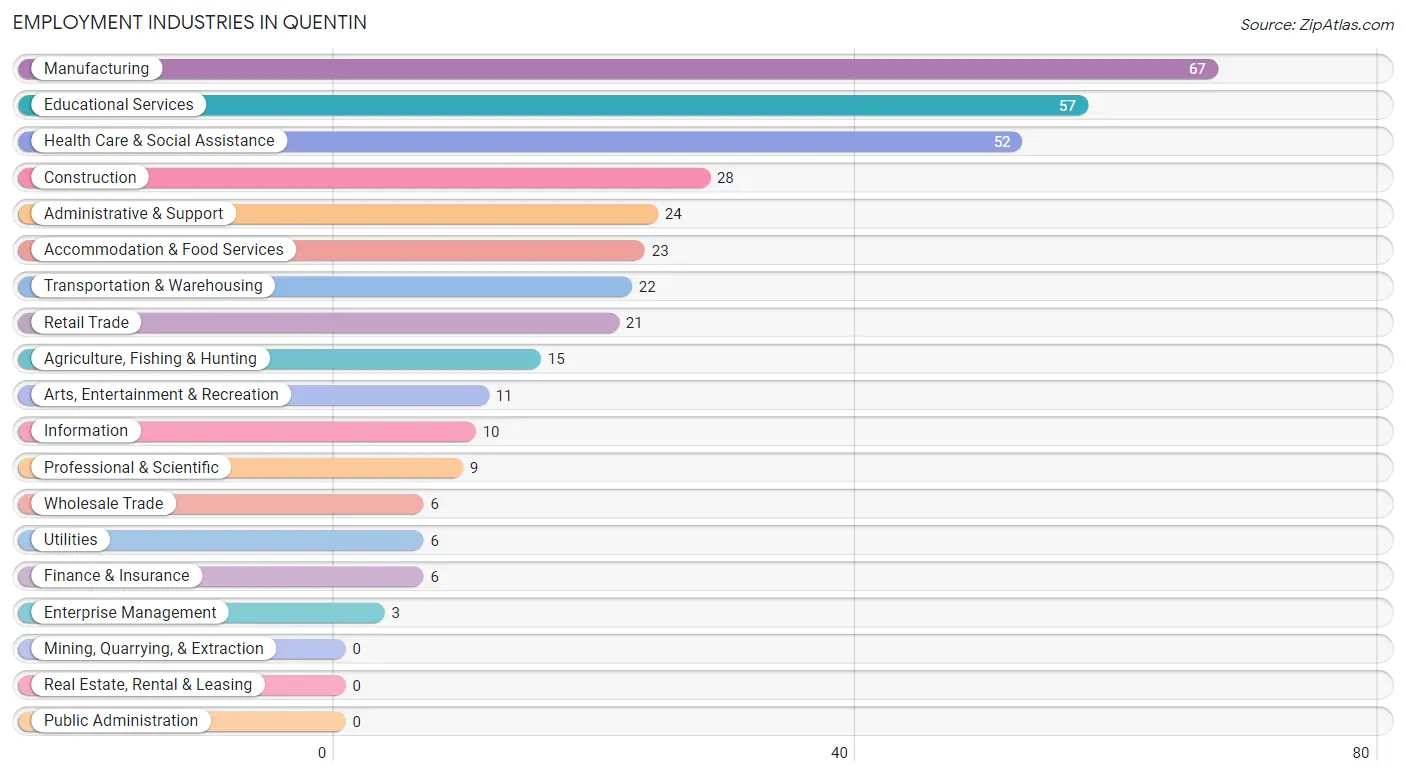
Employment Industries in Quentin
The major employment industries in Quentin include Manufacturing (67 | 17.5%), Educational Services (57 | 14.9%), Health Care & Social Assistance (52 | 13.6%), Construction (28 | 7.3%), and Administrative & Support (24 | 6.3%).
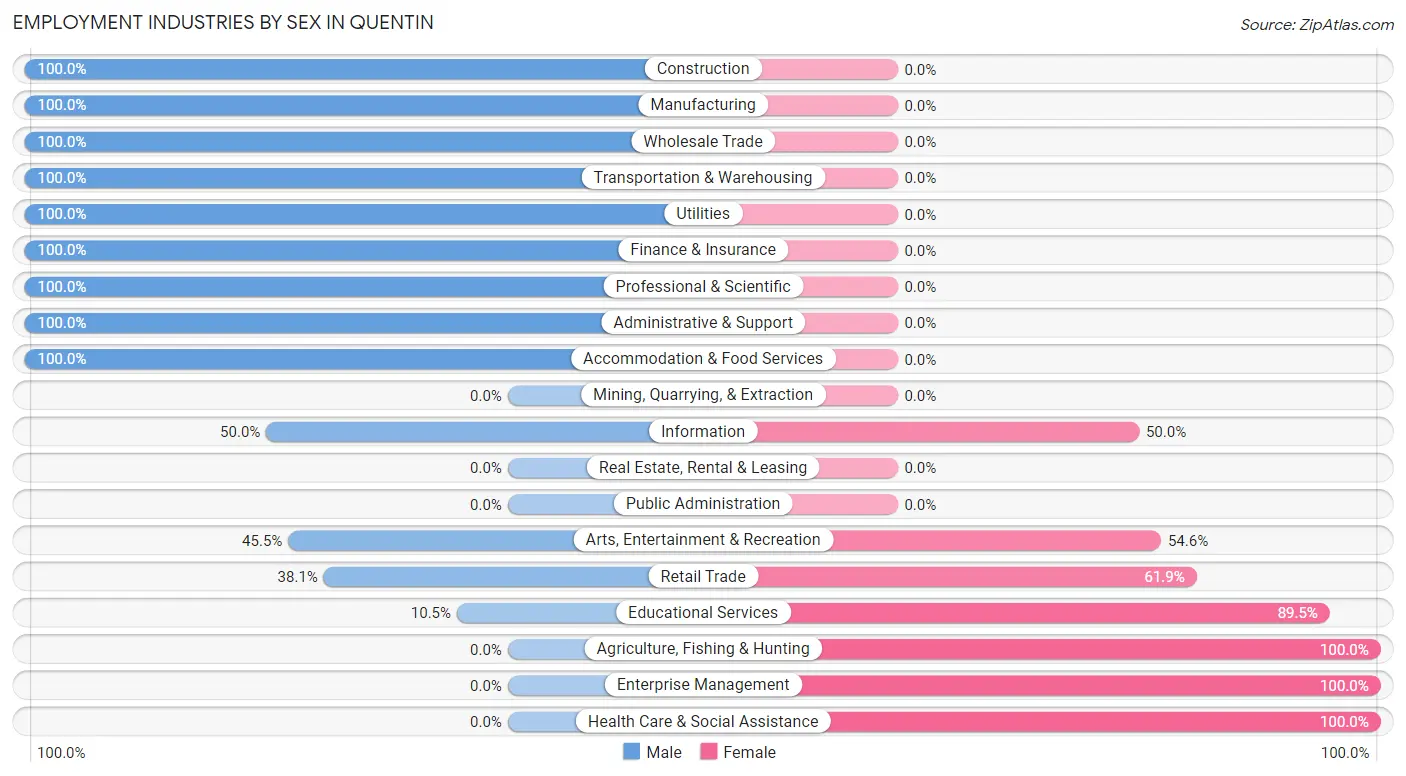
Employment Industries by Sex in Quentin
The Quentin industries that see more men than women are Construction (100.0%), Manufacturing (100.0%), and Wholesale Trade (100.0%), whereas the industries that tend to have a higher number of women are Agriculture, Fishing & Hunting (100.0%), Enterprise Management (100.0%), and Health Care & Social Assistance (100.0%).
| Industry | Male | Female |
| Agriculture, Fishing & Hunting | 0 (0.0%) | 15 (100.0%) |
| Mining, Quarrying, & Extraction | 0 (0.0%) | 0 (0.0%) |
| Construction | 28 (100.0%) | 0 (0.0%) |
| Manufacturing | 67 (100.0%) | 0 (0.0%) |
| Wholesale Trade | 6 (100.0%) | 0 (0.0%) |
| Retail Trade | 8 (38.1%) | 13 (61.9%) |
| Transportation & Warehousing | 22 (100.0%) | 0 (0.0%) |
| Utilities | 6 (100.0%) | 0 (0.0%) |
| Information | 5 (50.0%) | 5 (50.0%) |
| Finance & Insurance | 6 (100.0%) | 0 (0.0%) |
| Real Estate, Rental & Leasing | 0 (0.0%) | 0 (0.0%) |
| Professional & Scientific | 9 (100.0%) | 0 (0.0%) |
| Enterprise Management | 0 (0.0%) | 3 (100.0%) |
| Administrative & Support | 24 (100.0%) | 0 (0.0%) |
| Educational Services | 6 (10.5%) | 51 (89.5%) |
| Health Care & Social Assistance | 0 (0.0%) | 52 (100.0%) |
| Arts, Entertainment & Recreation | 5 (45.5%) | 6 (54.5%) |
| Accommodation & Food Services | 23 (100.0%) | 0 (0.0%) |
| Public Administration | 0 (0.0%) | 0 (0.0%) |
| Total | 226 (59.2%) | 156 (40.8%) |
Education in Quentin
School Enrollment in Quentin
The most common levels of schooling among the 152 students in Quentin are high school (64 | 42.1%), elementary school (49 | 32.2%), and middle school (35 | 23.0%).
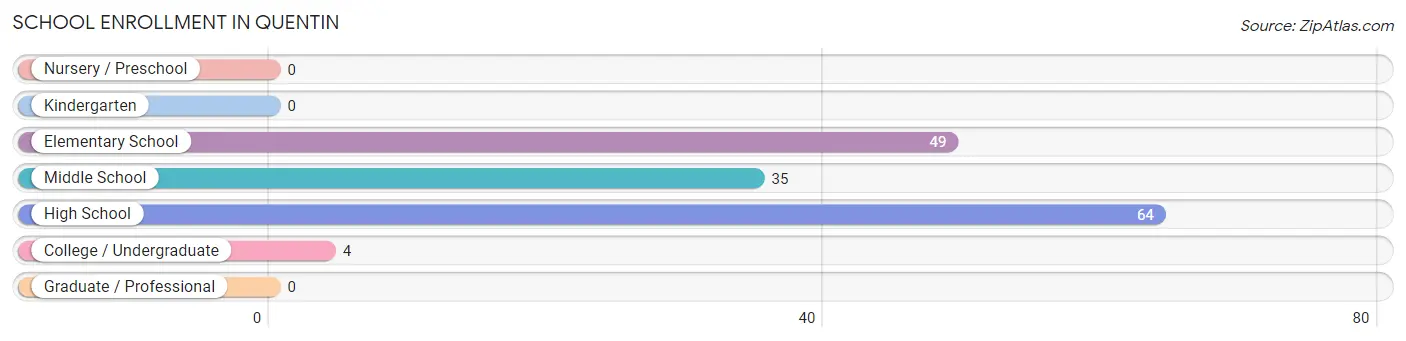
| School Level | # Students | % Students |
| Nursery / Preschool | 0 | 0.0% |
| Kindergarten | 0 | 0.0% |
| Elementary School | 49 | 32.2% |
| Middle School | 35 | 23.0% |
| High School | 64 | 42.1% |
| College / Undergraduate | 4 | 2.6% |
| Graduate / Professional | 0 | 0.0% |
| Total | 152 | 100.0% |
School Enrollment by Age by Funding Source in Quentin
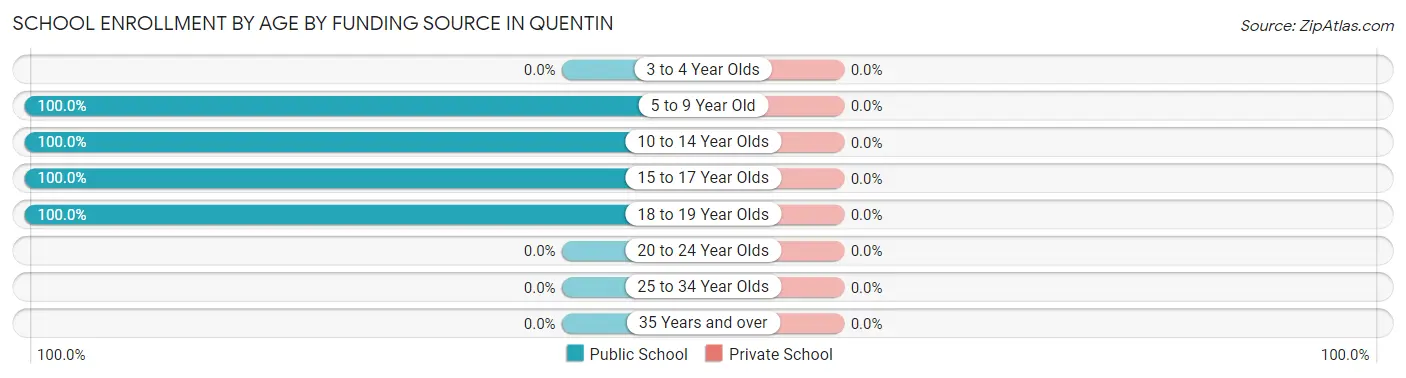
| Age Bracket | Public School | Private School |
| 3 to 4 Year Olds | 0 (0.0%) | 0 (0.0%) |
| 5 to 9 Year Old | 22 (100.0%) | 0 (0.0%) |
| 10 to 14 Year Olds | 62 (100.0%) | 0 (0.0%) |
| 15 to 17 Year Olds | 51 (100.0%) | 0 (0.0%) |
| 18 to 19 Year Olds | 17 (100.0%) | 0 (0.0%) |
| 20 to 24 Year Olds | 0 (0.0%) | 0 (0.0%) |
| 25 to 34 Year Olds | 0 (0.0%) | 0 (0.0%) |
| 35 Years and over | 0 (0.0%) | 0 (0.0%) |
| Total | 152 (100.0%) | 0 (0.0%) |
Educational Attainment by Field of Study in Quentin
Liberal arts & history (42 | 36.5%), social sciences (22 | 19.1%), business (15 | 13.0%), education (10 | 8.7%), and arts & humanities (9 | 7.8%) are the most common fields of study among 115 individuals in Quentin who have obtained a bachelor's degree or higher.
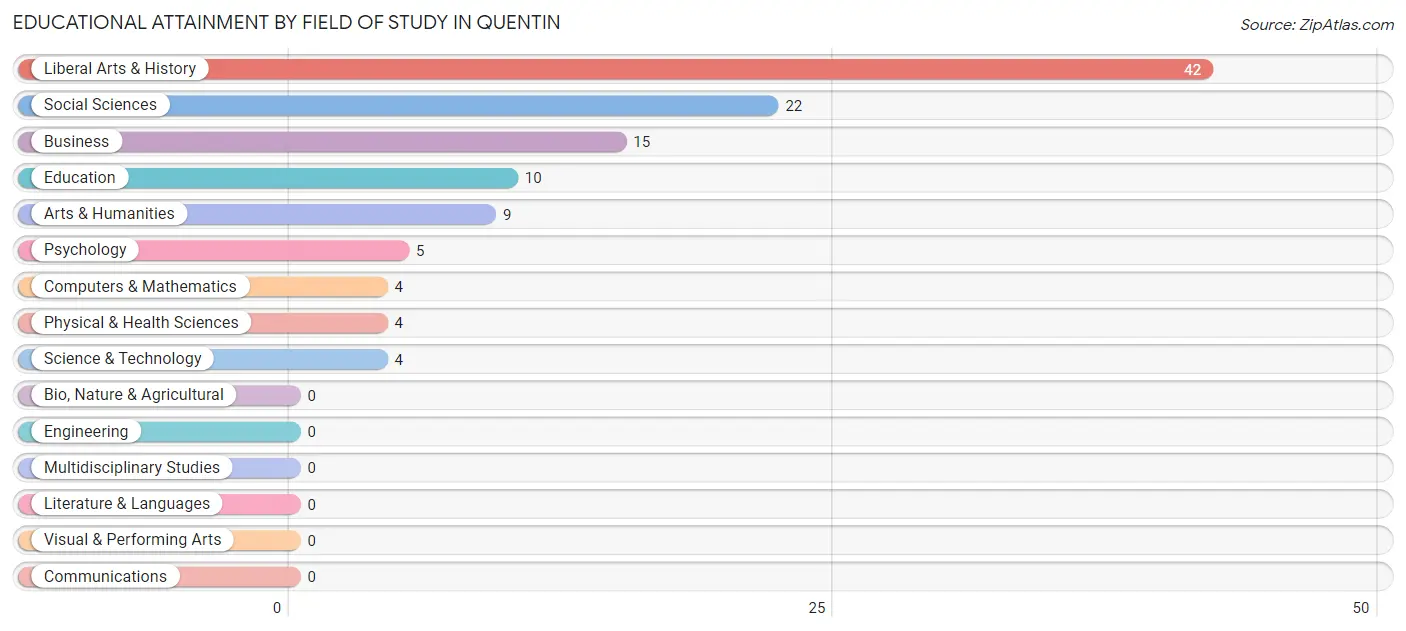
| Field of Study | # Graduates | % Graduates |
| Computers & Mathematics | 4 | 3.5% |
| Bio, Nature & Agricultural | 0 | 0.0% |
| Physical & Health Sciences | 4 | 3.5% |
| Psychology | 5 | 4.3% |
| Social Sciences | 22 | 19.1% |
| Engineering | 0 | 0.0% |
| Multidisciplinary Studies | 0 | 0.0% |
| Science & Technology | 4 | 3.5% |
| Business | 15 | 13.0% |
| Education | 10 | 8.7% |
| Literature & Languages | 0 | 0.0% |
| Liberal Arts & History | 42 | 36.5% |
| Visual & Performing Arts | 0 | 0.0% |
| Communications | 0 | 0.0% |
| Arts & Humanities | 9 | 7.8% |
| Total | 115 | 100.0% |
Transportation & Commute in Quentin
Vehicle Availability by Sex in Quentin
The most prevalent vehicle ownership categories in Quentin are males with 2 vehicles (105, accounting for 48.8%) and females with 2 vehicles (89, making up 67.3%).
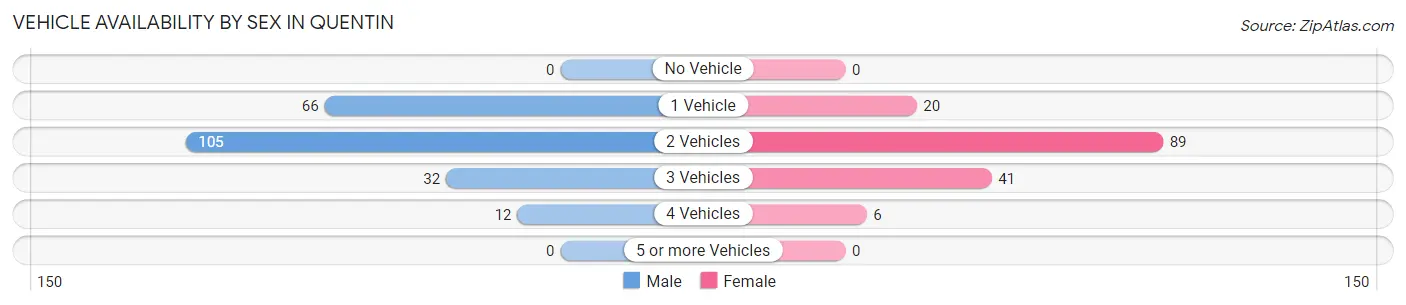
| Vehicles Available | Male | Female |
| No Vehicle | 0 (0.0%) | 0 (0.0%) |
| 1 Vehicle | 66 (30.7%) | 20 (12.8%) |
| 2 Vehicles | 105 (48.8%) | 89 (57.1%) |
| 3 Vehicles | 32 (14.9%) | 41 (26.3%) |
| 4 Vehicles | 12 (5.6%) | 6 (3.8%) |
| 5 or more Vehicles | 0 (0.0%) | 0 (0.0%) |
| Total | 215 (100.0%) | 156 (100.0%) |
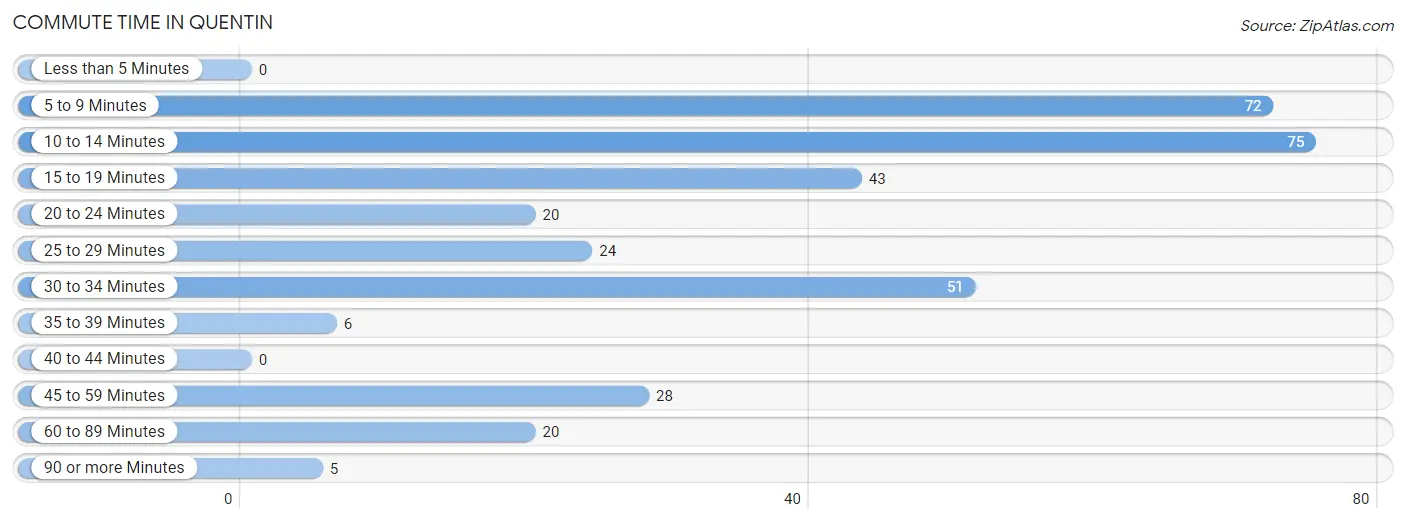
Commute Time in Quentin
The most frequently occuring commute durations in Quentin are 10 to 14 minutes (75 commuters, 21.8%), 5 to 9 minutes (72 commuters, 20.9%), and 30 to 34 minutes (51 commuters, 14.8%).
| Commute Time | # Commuters | % Commuters |
| Less than 5 Minutes | 0 | 0.0% |
| 5 to 9 Minutes | 72 | 20.9% |
| 10 to 14 Minutes | 75 | 21.8% |
| 15 to 19 Minutes | 43 | 12.5% |
| 20 to 24 Minutes | 20 | 5.8% |
| 25 to 29 Minutes | 24 | 7.0% |
| 30 to 34 Minutes | 51 | 14.8% |
| 35 to 39 Minutes | 6 | 1.7% |
| 40 to 44 Minutes | 0 | 0.0% |
| 45 to 59 Minutes | 28 | 8.1% |
| 60 to 89 Minutes | 20 | 5.8% |
| 90 or more Minutes | 5 | 1.5% |
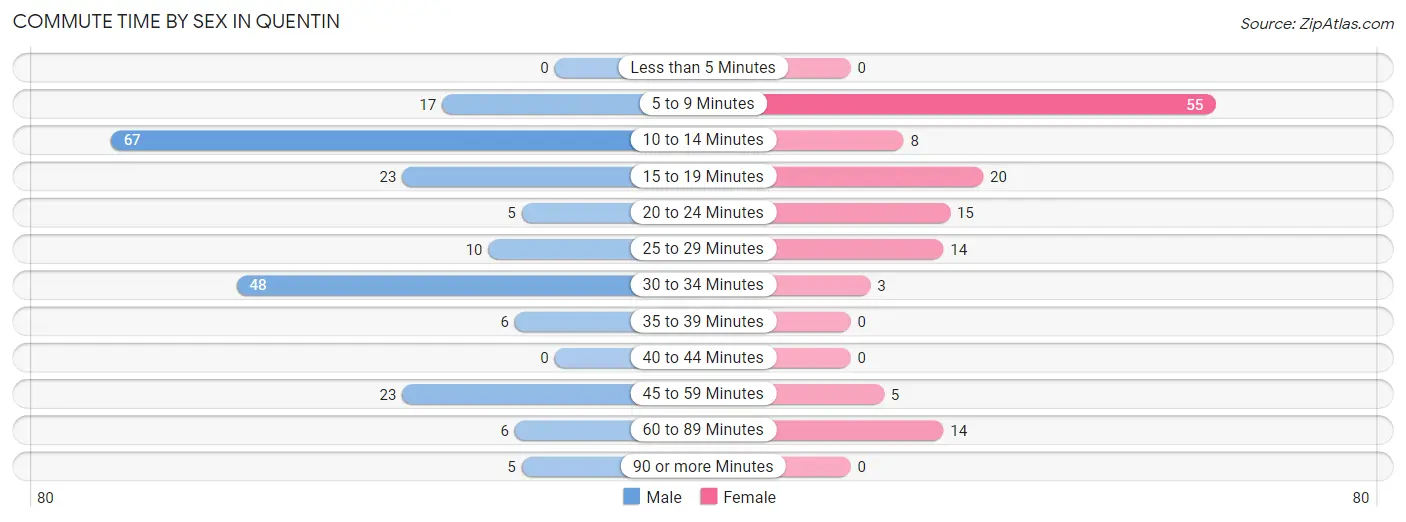
Commute Time by Sex in Quentin
The most common commute times in Quentin are 10 to 14 minutes (67 commuters, 31.9%) for males and 5 to 9 minutes (55 commuters, 41.0%) for females.
| Commute Time | Male | Female |
| Less than 5 Minutes | 0 (0.0%) | 0 (0.0%) |
| 5 to 9 Minutes | 17 (8.1%) | 55 (41.0%) |
| 10 to 14 Minutes | 67 (31.9%) | 8 (6.0%) |
| 15 to 19 Minutes | 23 (11.0%) | 20 (14.9%) |
| 20 to 24 Minutes | 5 (2.4%) | 15 (11.2%) |
| 25 to 29 Minutes | 10 (4.8%) | 14 (10.4%) |
| 30 to 34 Minutes | 48 (22.9%) | 3 (2.2%) |
| 35 to 39 Minutes | 6 (2.9%) | 0 (0.0%) |
| 40 to 44 Minutes | 0 (0.0%) | 0 (0.0%) |
| 45 to 59 Minutes | 23 (11.0%) | 5 (3.7%) |
| 60 to 89 Minutes | 6 (2.9%) | 14 (10.4%) |
| 90 or more Minutes | 5 (2.4%) | 0 (0.0%) |
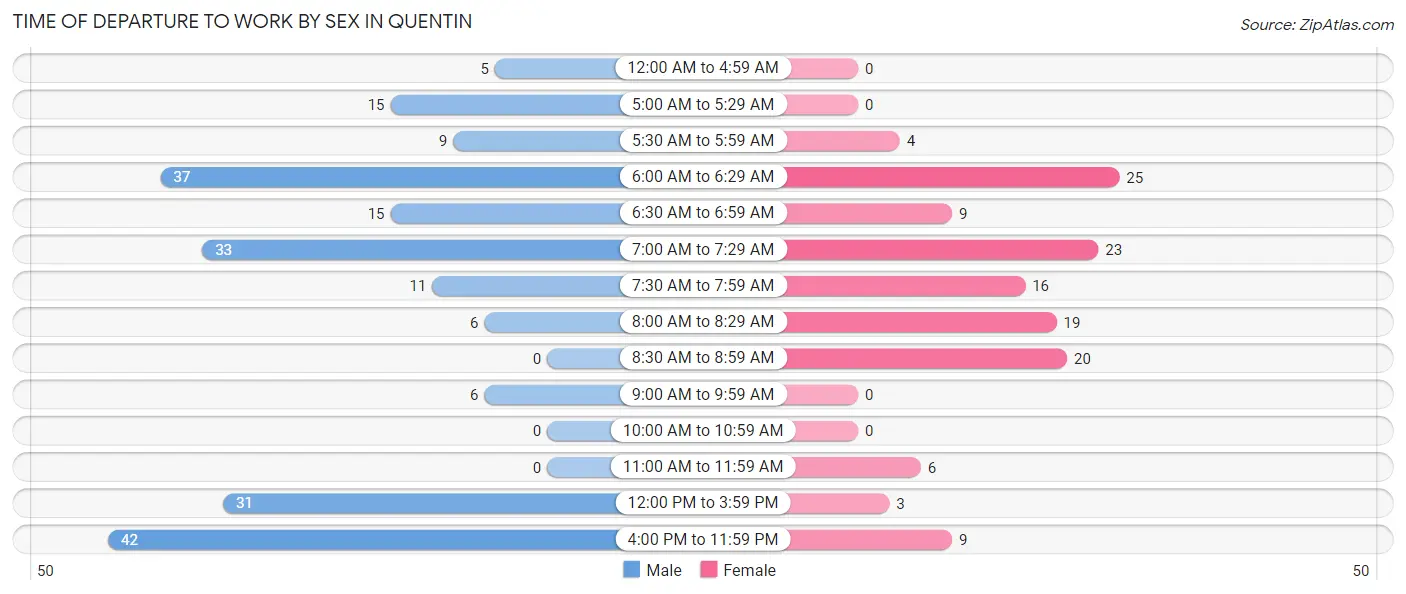
Time of Departure to Work by Sex in Quentin
The most frequent times of departure to work in Quentin are 4:00 PM to 11:59 PM (42, 20.0%) for males and 6:00 AM to 6:29 AM (25, 18.7%) for females.
| Time of Departure | Male | Female |
| 12:00 AM to 4:59 AM | 5 (2.4%) | 0 (0.0%) |
| 5:00 AM to 5:29 AM | 15 (7.1%) | 0 (0.0%) |
| 5:30 AM to 5:59 AM | 9 (4.3%) | 4 (3.0%) |
| 6:00 AM to 6:29 AM | 37 (17.6%) | 25 (18.7%) |
| 6:30 AM to 6:59 AM | 15 (7.1%) | 9 (6.7%) |
| 7:00 AM to 7:29 AM | 33 (15.7%) | 23 (17.2%) |
| 7:30 AM to 7:59 AM | 11 (5.2%) | 16 (11.9%) |
| 8:00 AM to 8:29 AM | 6 (2.9%) | 19 (14.2%) |
| 8:30 AM to 8:59 AM | 0 (0.0%) | 20 (14.9%) |
| 9:00 AM to 9:59 AM | 6 (2.9%) | 0 (0.0%) |
| 10:00 AM to 10:59 AM | 0 (0.0%) | 0 (0.0%) |
| 11:00 AM to 11:59 AM | 0 (0.0%) | 6 (4.5%) |
| 12:00 PM to 3:59 PM | 31 (14.8%) | 3 (2.2%) |
| 4:00 PM to 11:59 PM | 42 (20.0%) | 9 (6.7%) |
| Total | 210 (100.0%) | 134 (100.0%) |
Housing Occupancy in Quentin
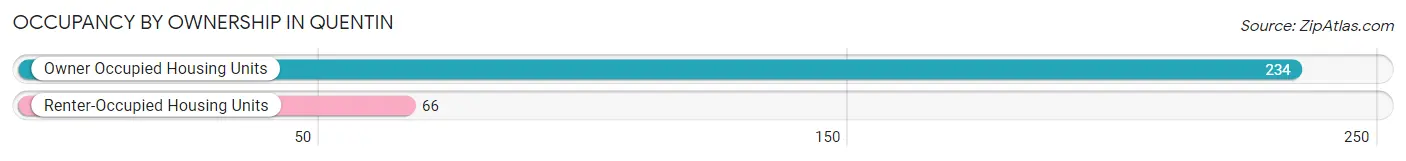
Occupancy by Ownership in Quentin
Of the total 300 dwellings in Quentin, owner-occupied units account for 234 (78.0%), while renter-occupied units make up 66 (22.0%).
| Occupancy | # Housing Units | % Housing Units |
| Owner Occupied Housing Units | 234 | 78.0% |
| Renter-Occupied Housing Units | 66 | 22.0% |
| Total Occupied Housing Units | 300 | 100.0% |
Occupancy by Household Size in Quentin
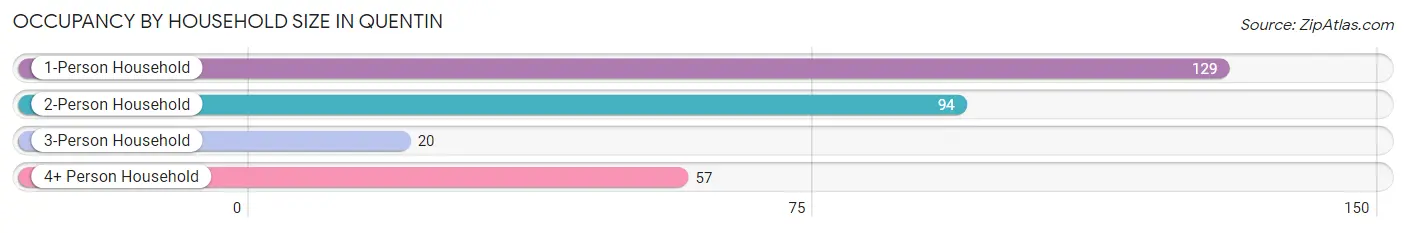
| Household Size | # Housing Units | % Housing Units |
| 1-Person Household | 129 | 43.0% |
| 2-Person Household | 94 | 31.3% |
| 3-Person Household | 20 | 6.7% |
| 4+ Person Household | 57 | 19.0% |
| Total Housing Units | 300 | 100.0% |
Occupancy by Ownership by Household Size in Quentin
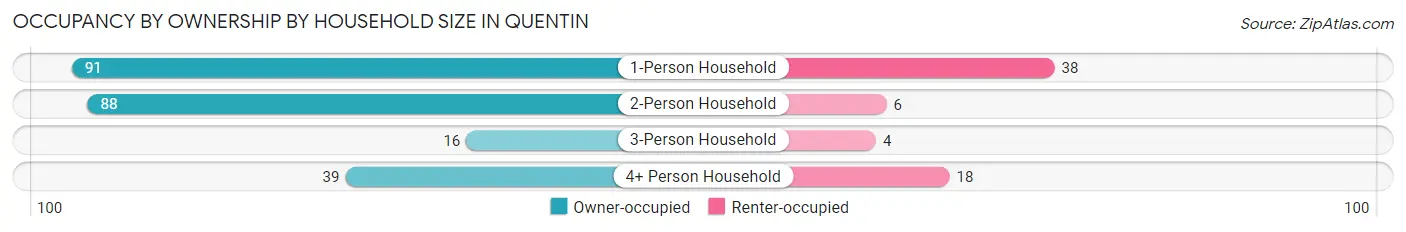
| Household Size | Owner-occupied | Renter-occupied |
| 1-Person Household | 91 (70.5%) | 38 (29.5%) |
| 2-Person Household | 88 (93.6%) | 6 (6.4%) |
| 3-Person Household | 16 (80.0%) | 4 (20.0%) |
| 4+ Person Household | 39 (68.4%) | 18 (31.6%) |
| Total Housing Units | 234 (78.0%) | 66 (22.0%) |
Occupancy by Educational Attainment in Quentin
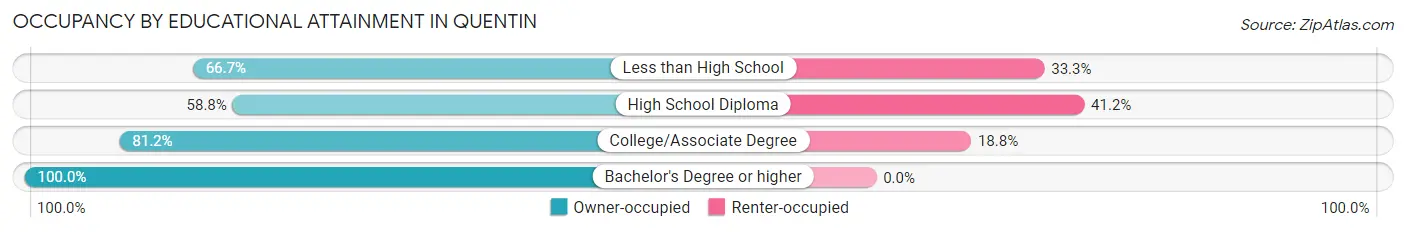
| Household Size | Owner-occupied | Renter-occupied |
| Less than High School | 8 (66.7%) | 4 (33.3%) |
| High School Diploma | 57 (58.8%) | 40 (41.2%) |
| College/Associate Degree | 95 (81.2%) | 22 (18.8%) |
| Bachelor's Degree or higher | 74 (100.0%) | 0 (0.0%) |
Occupancy by Age of Householder in Quentin
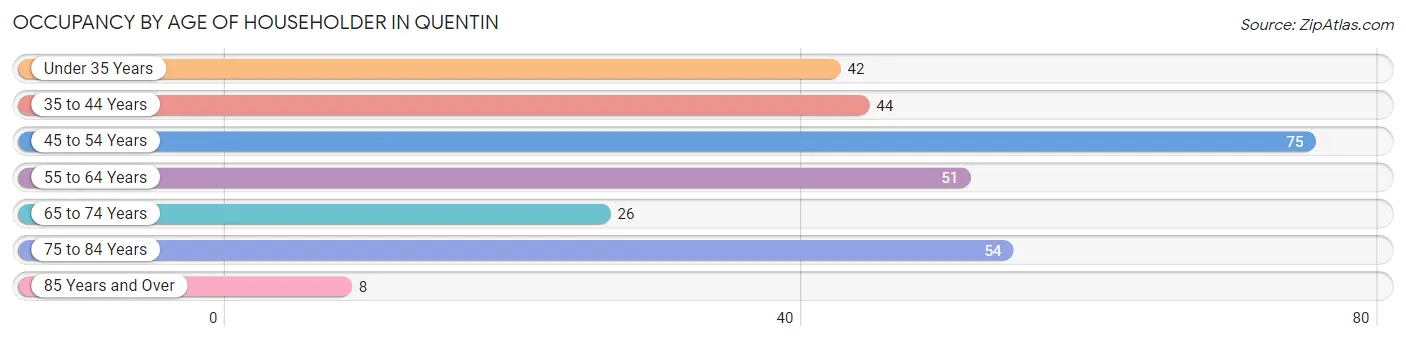
| Age Bracket | # Households | % Households |
| Under 35 Years | 42 | 14.0% |
| 35 to 44 Years | 44 | 14.7% |
| 45 to 54 Years | 75 | 25.0% |
| 55 to 64 Years | 51 | 17.0% |
| 65 to 74 Years | 26 | 8.7% |
| 75 to 84 Years | 54 | 18.0% |
| 85 Years and Over | 8 | 2.7% |
| Total | 300 | 100.0% |
Housing Finances in Quentin
Median Income by Occupancy in Quentin
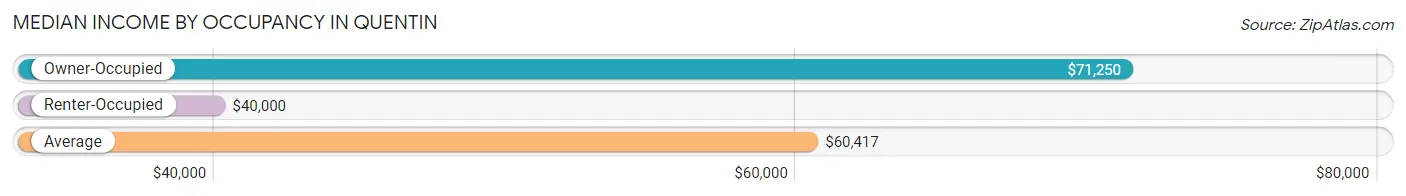
| Occupancy Type | # Households | Median Income |
| Owner-Occupied | 234 (78.0%) | $71,250 |
| Renter-Occupied | 66 (22.0%) | $40,000 |
| Average | 300 (100.0%) | $60,417 |
Occupancy by Householder Income Bracket in Quentin
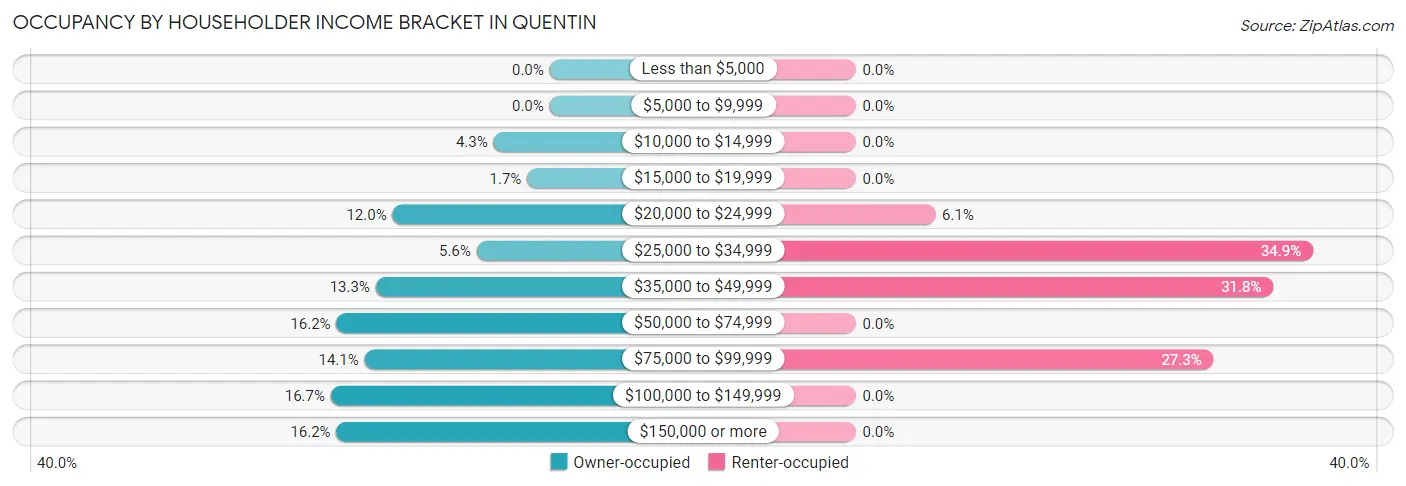
| Income Bracket | Owner-occupied | Renter-occupied |
| Less than $5,000 | 0 (0.0%) | 0 (0.0%) |
| $5,000 to $9,999 | 0 (0.0%) | 0 (0.0%) |
| $10,000 to $14,999 | 10 (4.3%) | 0 (0.0%) |
| $15,000 to $19,999 | 4 (1.7%) | 0 (0.0%) |
| $20,000 to $24,999 | 28 (12.0%) | 4 (6.1%) |
| $25,000 to $34,999 | 13 (5.6%) | 23 (34.8%) |
| $35,000 to $49,999 | 31 (13.3%) | 21 (31.8%) |
| $50,000 to $74,999 | 38 (16.2%) | 0 (0.0%) |
| $75,000 to $99,999 | 33 (14.1%) | 18 (27.3%) |
| $100,000 to $149,999 | 39 (16.7%) | 0 (0.0%) |
| $150,000 or more | 38 (16.2%) | 0 (0.0%) |
| Total | 234 (100.0%) | 66 (100.0%) |
Monthly Housing Cost Tiers in Quentin
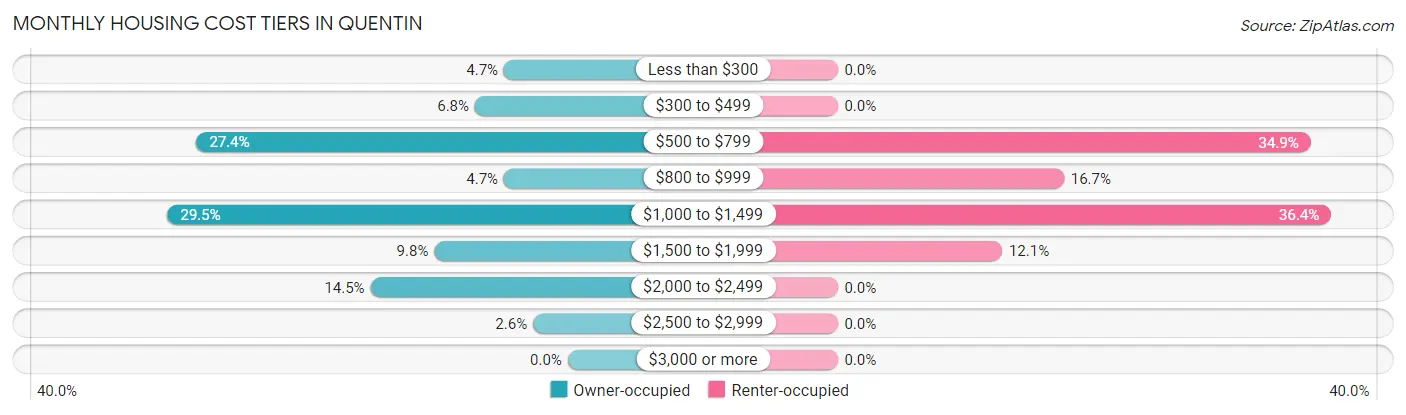
| Monthly Cost | Owner-occupied | Renter-occupied |
| Less than $300 | 11 (4.7%) | 0 (0.0%) |
| $300 to $499 | 16 (6.8%) | 0 (0.0%) |
| $500 to $799 | 64 (27.4%) | 23 (34.8%) |
| $800 to $999 | 11 (4.7%) | 11 (16.7%) |
| $1,000 to $1,499 | 69 (29.5%) | 24 (36.4%) |
| $1,500 to $1,999 | 23 (9.8%) | 8 (12.1%) |
| $2,000 to $2,499 | 34 (14.5%) | 0 (0.0%) |
| $2,500 to $2,999 | 6 (2.6%) | 0 (0.0%) |
| $3,000 or more | 0 (0.0%) | 0 (0.0%) |
| Total | 234 (100.0%) | 66 (100.0%) |
Physical Housing Characteristics in Quentin
Housing Structures in Quentin
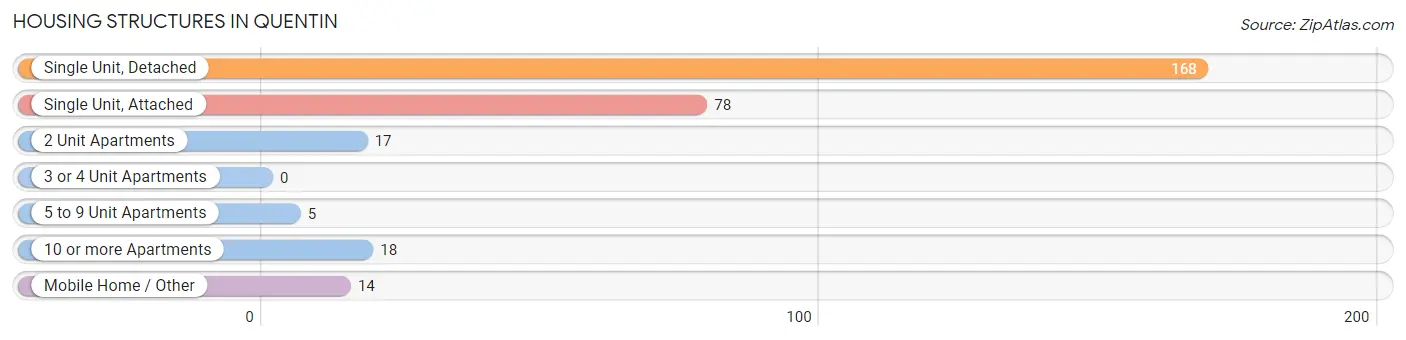
| Structure Type | # Housing Units | % Housing Units |
| Single Unit, Detached | 168 | 56.0% |
| Single Unit, Attached | 78 | 26.0% |
| 2 Unit Apartments | 17 | 5.7% |
| 3 or 4 Unit Apartments | 0 | 0.0% |
| 5 to 9 Unit Apartments | 5 | 1.7% |
| 10 or more Apartments | 18 | 6.0% |
| Mobile Home / Other | 14 | 4.7% |
| Total | 300 | 100.0% |
Housing Structures by Occupancy in Quentin
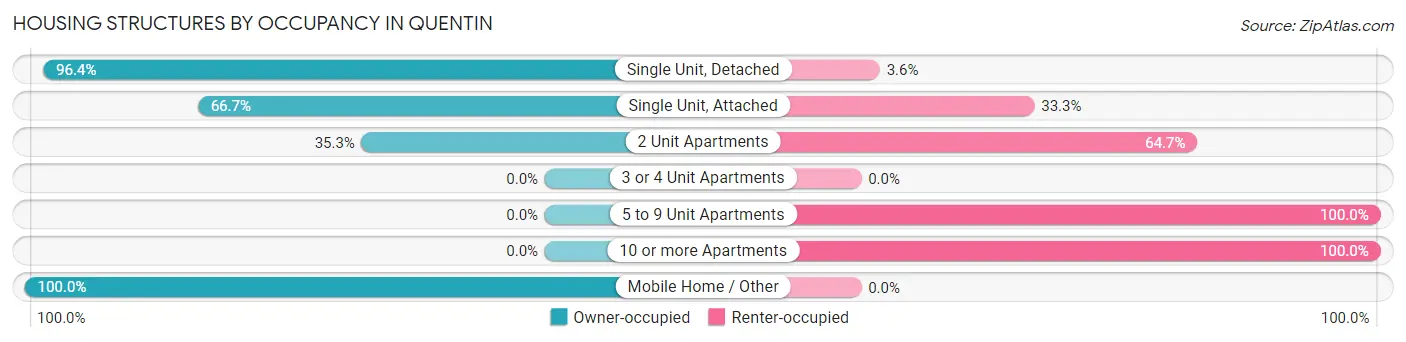
| Structure Type | Owner-occupied | Renter-occupied |
| Single Unit, Detached | 162 (96.4%) | 6 (3.6%) |
| Single Unit, Attached | 52 (66.7%) | 26 (33.3%) |
| 2 Unit Apartments | 6 (35.3%) | 11 (64.7%) |
| 3 or 4 Unit Apartments | 0 (0.0%) | 0 (0.0%) |
| 5 to 9 Unit Apartments | 0 (0.0%) | 5 (100.0%) |
| 10 or more Apartments | 0 (0.0%) | 18 (100.0%) |
| Mobile Home / Other | 14 (100.0%) | 0 (0.0%) |
| Total | 234 (78.0%) | 66 (22.0%) |
Housing Structures by Number of Rooms in Quentin
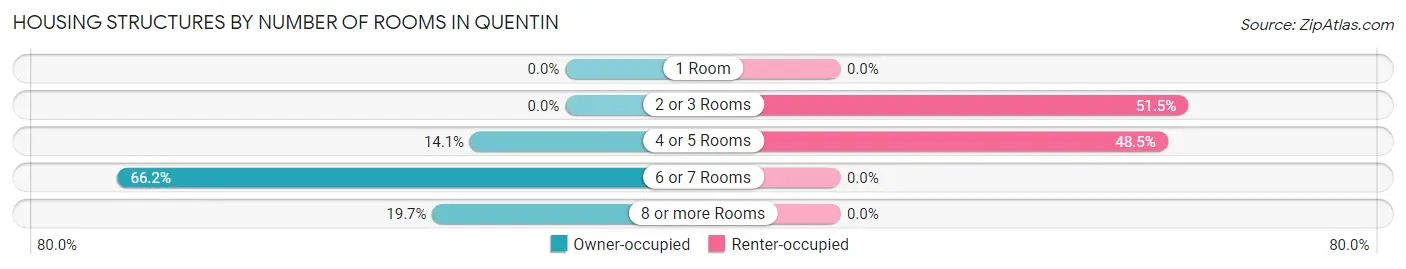
| Number of Rooms | Owner-occupied | Renter-occupied |
| 1 Room | 0 (0.0%) | 0 (0.0%) |
| 2 or 3 Rooms | 0 (0.0%) | 34 (51.5%) |
| 4 or 5 Rooms | 33 (14.1%) | 32 (48.5%) |
| 6 or 7 Rooms | 155 (66.2%) | 0 (0.0%) |
| 8 or more Rooms | 46 (19.7%) | 0 (0.0%) |
| Total | 234 (100.0%) | 66 (100.0%) |
Housing Structure by Heating Type in Quentin
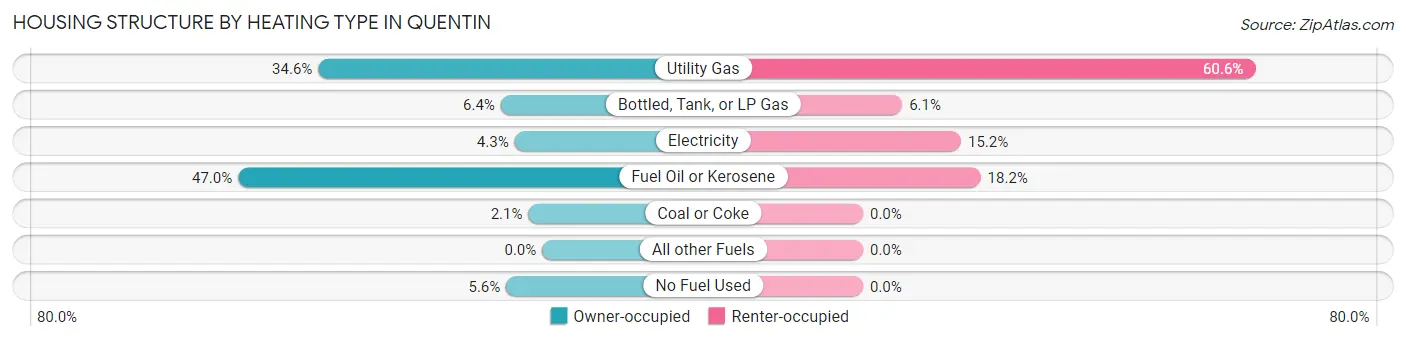
| Heating Type | Owner-occupied | Renter-occupied |
| Utility Gas | 81 (34.6%) | 40 (60.6%) |
| Bottled, Tank, or LP Gas | 15 (6.4%) | 4 (6.1%) |
| Electricity | 10 (4.3%) | 10 (15.1%) |
| Fuel Oil or Kerosene | 110 (47.0%) | 12 (18.2%) |
| Coal or Coke | 5 (2.1%) | 0 (0.0%) |
| All other Fuels | 0 (0.0%) | 0 (0.0%) |
| No Fuel Used | 13 (5.6%) | 0 (0.0%) |
| Total | 234 (100.0%) | 66 (100.0%) |
Household Vehicle Usage in Quentin
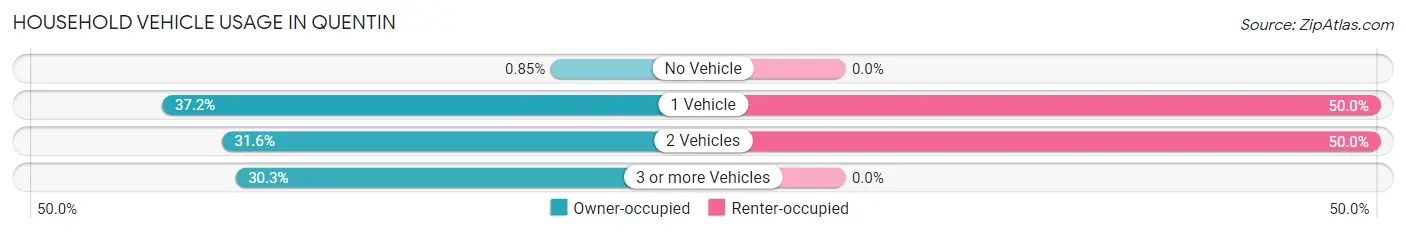
| Vehicles per Household | Owner-occupied | Renter-occupied |
| No Vehicle | 2 (0.9%) | 0 (0.0%) |
| 1 Vehicle | 87 (37.2%) | 33 (50.0%) |
| 2 Vehicles | 74 (31.6%) | 33 (50.0%) |
| 3 or more Vehicles | 71 (30.3%) | 0 (0.0%) |
| Total | 234 (100.0%) | 66 (100.0%) |
Real Estate & Mortgages in Quentin
Real Estate and Mortgage Overview in Quentin
| Characteristic | Without Mortgage | With Mortgage |
| Housing Units | 84 | 150 |
| Median Property Value | $195,000 | $167,400 |
| Median Household Income | $59,500 | $38 |
| Monthly Housing Costs | $644 | $0 |
| Real Estate Taxes | $2,478 | $0 |
Property Value by Mortgage Status in Quentin
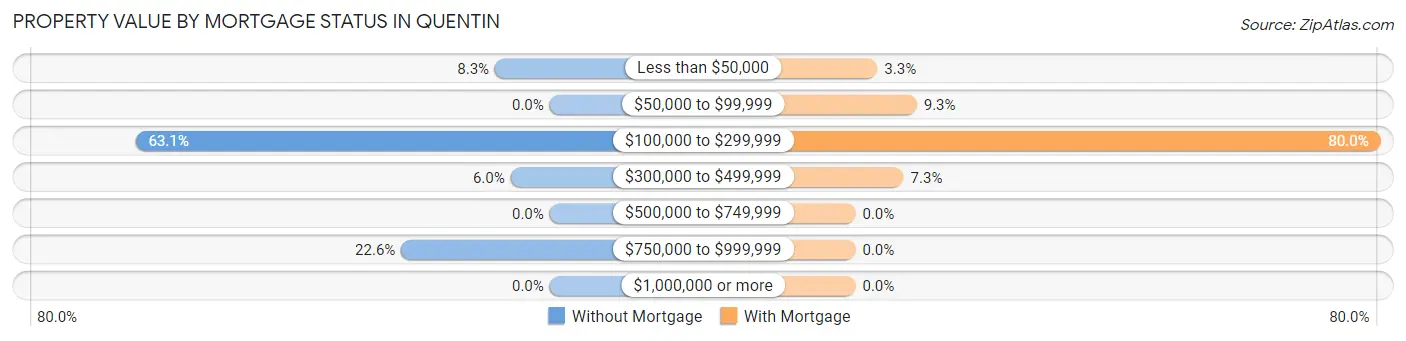
| Property Value | Without Mortgage | With Mortgage |
| Less than $50,000 | 7 (8.3%) | 5 (3.3%) |
| $50,000 to $99,999 | 0 (0.0%) | 14 (9.3%) |
| $100,000 to $299,999 | 53 (63.1%) | 120 (80.0%) |
| $300,000 to $499,999 | 5 (5.9%) | 11 (7.3%) |
| $500,000 to $749,999 | 0 (0.0%) | 0 (0.0%) |
| $750,000 to $999,999 | 19 (22.6%) | 0 (0.0%) |
| $1,000,000 or more | 0 (0.0%) | 0 (0.0%) |
| Total | 84 (100.0%) | 150 (100.0%) |
Household Income by Mortgage Status in Quentin
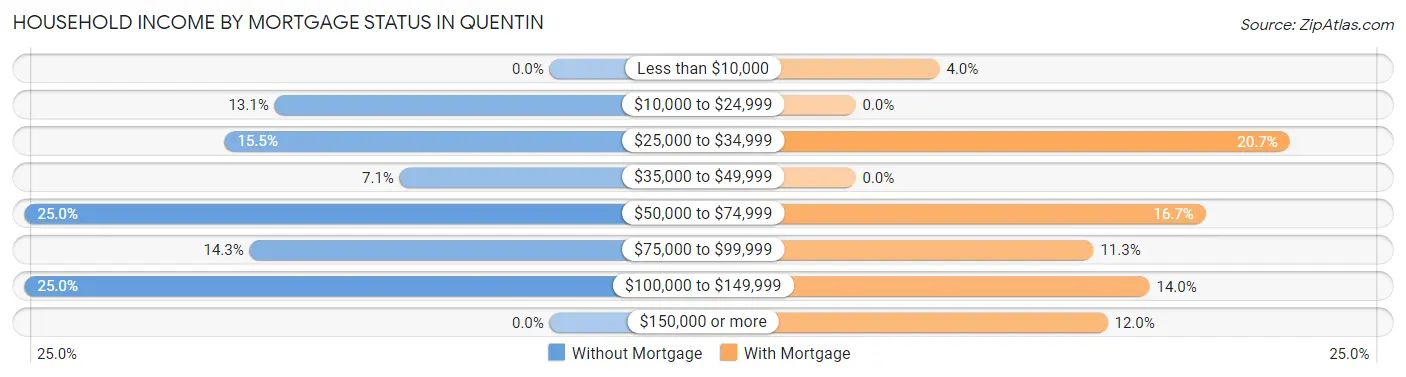
| Household Income | Without Mortgage | With Mortgage |
| Less than $10,000 | 0 (0.0%) | 6 (4.0%) |
| $10,000 to $24,999 | 11 (13.1%) | 0 (0.0%) |
| $25,000 to $34,999 | 13 (15.5%) | 31 (20.7%) |
| $35,000 to $49,999 | 6 (7.1%) | 0 (0.0%) |
| $50,000 to $74,999 | 21 (25.0%) | 25 (16.7%) |
| $75,000 to $99,999 | 12 (14.3%) | 17 (11.3%) |
| $100,000 to $149,999 | 21 (25.0%) | 21 (14.0%) |
| $150,000 or more | 0 (0.0%) | 18 (12.0%) |
| Total | 84 (100.0%) | 150 (100.0%) |
Property Value to Household Income Ratio in Quentin
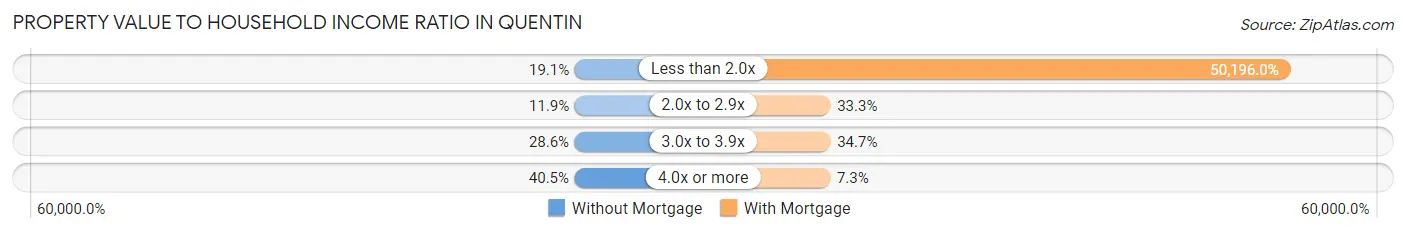
| Value-to-Income Ratio | Without Mortgage | With Mortgage |
| Less than 2.0x | 16 (19.1%) | 75,294 (50,196.0%) |
| 2.0x to 2.9x | 10 (11.9%) | 50 (33.3%) |
| 3.0x to 3.9x | 24 (28.6%) | 52 (34.7%) |
| 4.0x or more | 34 (40.5%) | 11 (7.3%) |
| Total | 84 (100.0%) | 150 (100.0%) |
Real Estate Taxes by Mortgage Status in Quentin
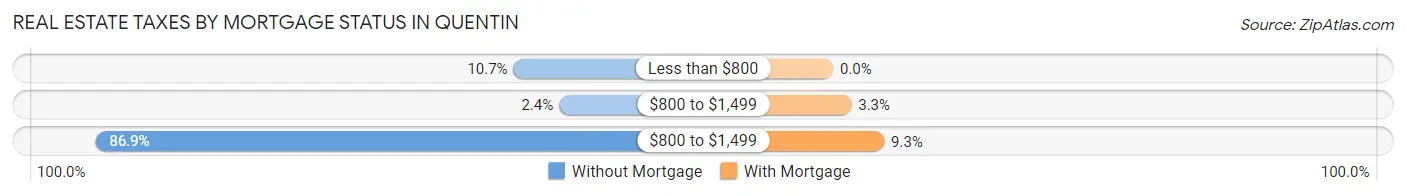
| Property Taxes | Without Mortgage | With Mortgage |
| Less than $800 | 9 (10.7%) | 0 (0.0%) |
| $800 to $1,499 | 2 (2.4%) | 5 (3.3%) |
| $800 to $1,499 | 73 (86.9%) | 14 (9.3%) |
| Total | 84 (100.0%) | 150 (100.0%) |
Health & Disability in Quentin
Health Insurance Coverage by Age in Quentin
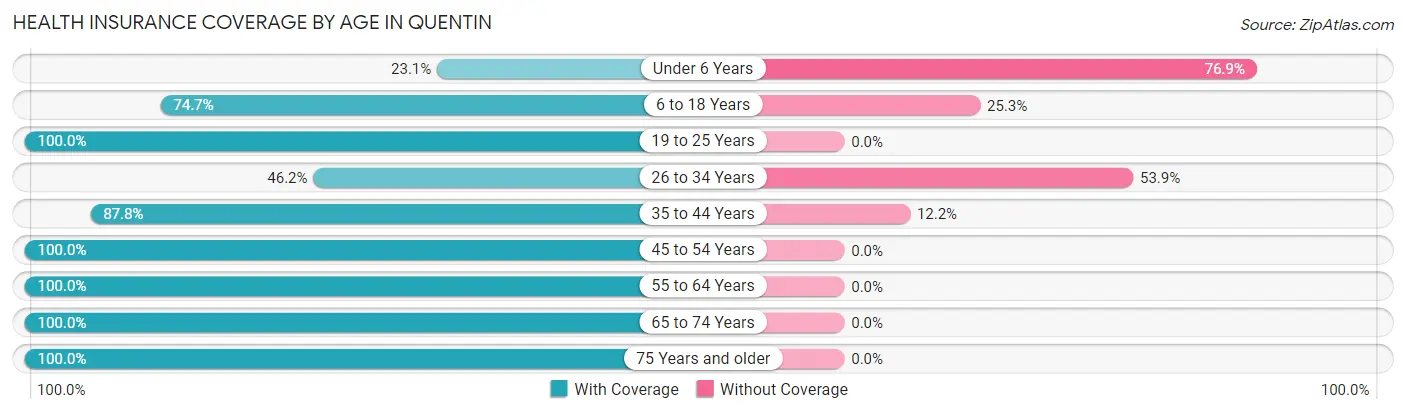
| Age Bracket | With Coverage | Without Coverage |
| Under 6 Years | 6 (23.1%) | 20 (76.9%) |
| 6 to 18 Years | 118 (74.7%) | 40 (25.3%) |
| 19 to 25 Years | 9 (100.0%) | 0 (0.0%) |
| 26 to 34 Years | 48 (46.2%) | 56 (53.8%) |
| 35 to 44 Years | 43 (87.8%) | 6 (12.2%) |
| 45 to 54 Years | 113 (100.0%) | 0 (0.0%) |
| 55 to 64 Years | 80 (100.0%) | 0 (0.0%) |
| 65 to 74 Years | 54 (100.0%) | 0 (0.0%) |
| 75 Years and older | 83 (100.0%) | 0 (0.0%) |
| Total | 554 (82.0%) | 122 (18.0%) |
Health Insurance Coverage by Citizenship Status in Quentin
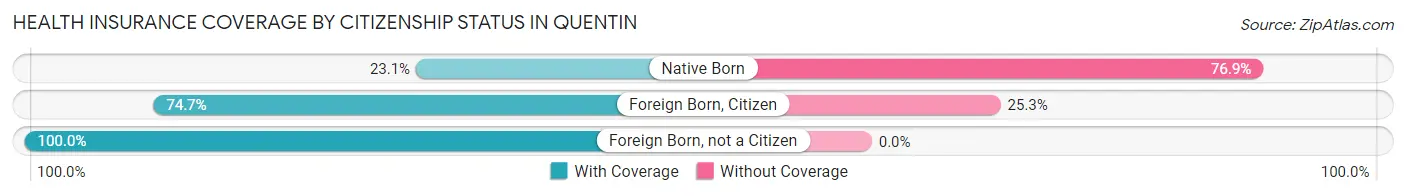
| Citizenship Status | With Coverage | Without Coverage |
| Native Born | 6 (23.1%) | 20 (76.9%) |
| Foreign Born, Citizen | 118 (74.7%) | 40 (25.3%) |
| Foreign Born, not a Citizen | 9 (100.0%) | 0 (0.0%) |
Health Insurance Coverage by Household Income in Quentin
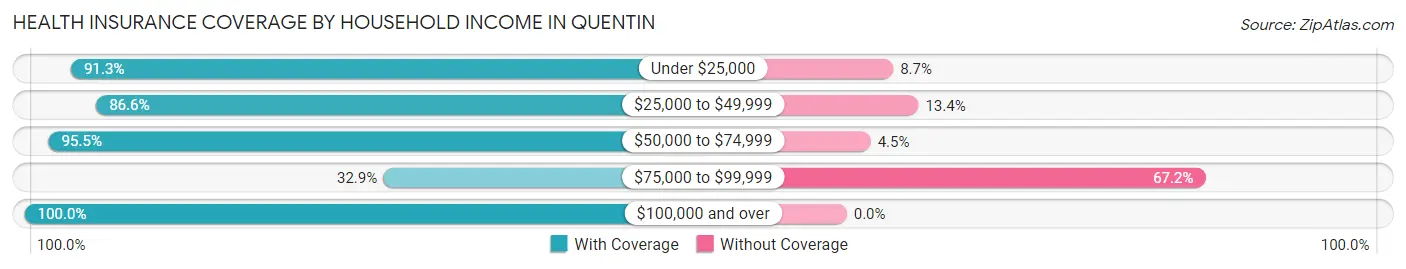
| Household Income | With Coverage | Without Coverage |
| Under $25,000 | 63 (91.3%) | 6 (8.7%) |
| $25,000 to $49,999 | 116 (86.6%) | 18 (13.4%) |
| $50,000 to $74,999 | 128 (95.5%) | 6 (4.5%) |
| $75,000 to $99,999 | 45 (32.9%) | 92 (67.1%) |
| $100,000 and over | 202 (100.0%) | 0 (0.0%) |
Public vs Private Health Insurance Coverage by Age in Quentin
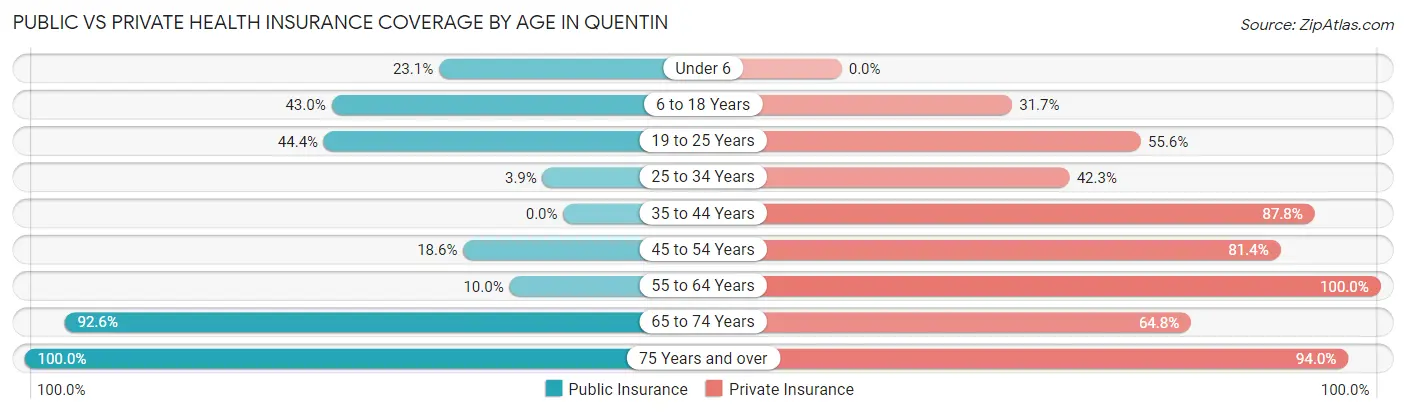
| Age Bracket | Public Insurance | Private Insurance |
| Under 6 | 6 (23.1%) | 0 (0.0%) |
| 6 to 18 Years | 68 (43.0%) | 50 (31.7%) |
| 19 to 25 Years | 4 (44.4%) | 5 (55.6%) |
| 25 to 34 Years | 4 (3.8%) | 44 (42.3%) |
| 35 to 44 Years | 0 (0.0%) | 43 (87.8%) |
| 45 to 54 Years | 21 (18.6%) | 92 (81.4%) |
| 55 to 64 Years | 8 (10.0%) | 80 (100.0%) |
| 65 to 74 Years | 50 (92.6%) | 35 (64.8%) |
| 75 Years and over | 83 (100.0%) | 78 (94.0%) |
| Total | 244 (36.1%) | 427 (63.2%) |
Disability Status by Sex by Age in Quentin
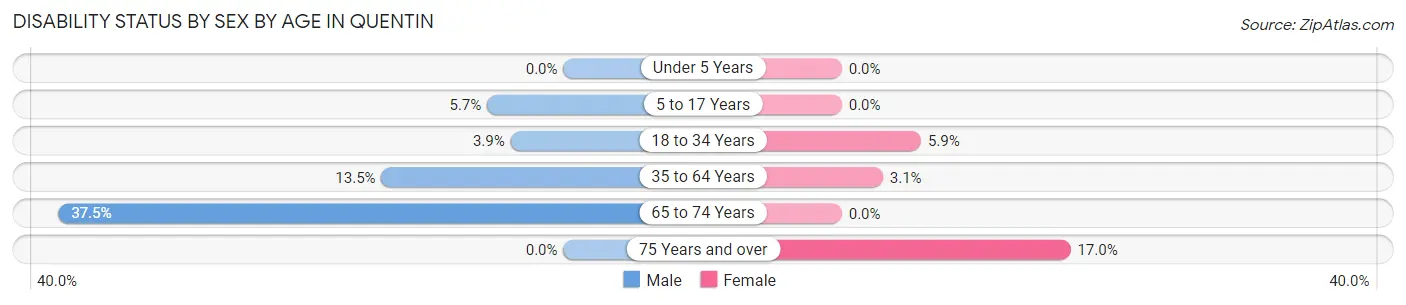
| Age Bracket | Male | Female |
| Under 5 Years | 0 (0.0%) | 0 (0.0%) |
| 5 to 17 Years | 6 (5.7%) | 0 (0.0%) |
| 18 to 34 Years | 4 (3.9%) | 2 (5.9%) |
| 35 to 64 Years | 15 (13.5%) | 4 (3.0%) |
| 65 to 74 Years | 12 (37.5%) | 0 (0.0%) |
| 75 Years and over | 0 (0.0%) | 9 (17.0%) |
Disability Class by Sex by Age in Quentin
Disability Class: Hearing Difficulty
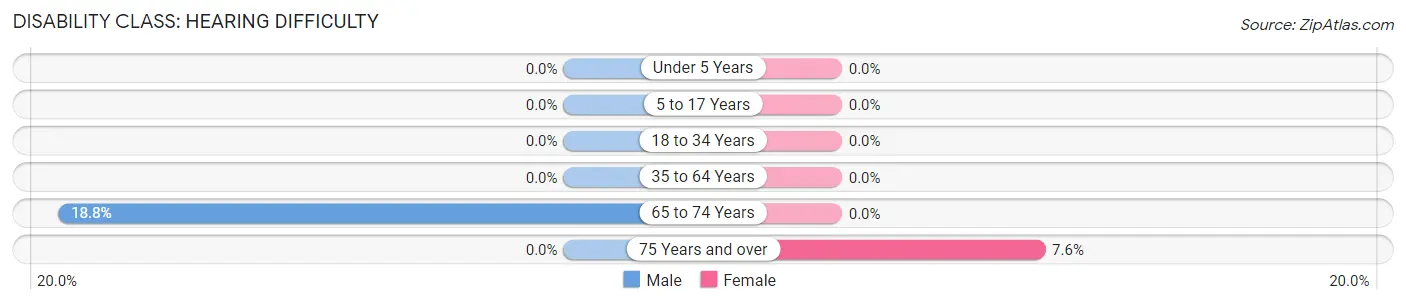
| Age Bracket | Male | Female |
| Under 5 Years | 0 (0.0%) | 0 (0.0%) |
| 5 to 17 Years | 0 (0.0%) | 0 (0.0%) |
| 18 to 34 Years | 0 (0.0%) | 0 (0.0%) |
| 35 to 64 Years | 0 (0.0%) | 0 (0.0%) |
| 65 to 74 Years | 6 (18.8%) | 0 (0.0%) |
| 75 Years and over | 0 (0.0%) | 4 (7.5%) |
Disability Class: Vision Difficulty
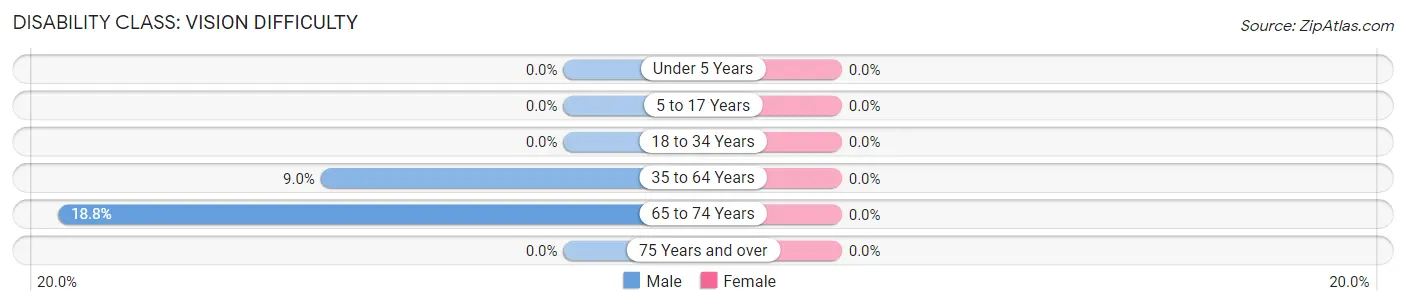
| Age Bracket | Male | Female |
| Under 5 Years | 0 (0.0%) | 0 (0.0%) |
| 5 to 17 Years | 0 (0.0%) | 0 (0.0%) |
| 18 to 34 Years | 0 (0.0%) | 0 (0.0%) |
| 35 to 64 Years | 10 (9.0%) | 0 (0.0%) |
| 65 to 74 Years | 6 (18.8%) | 0 (0.0%) |
| 75 Years and over | 0 (0.0%) | 0 (0.0%) |
Disability Class: Cognitive Difficulty
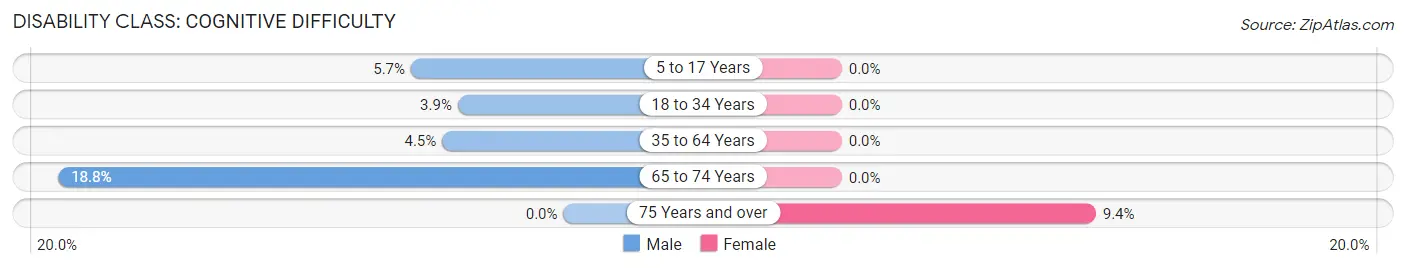
| Age Bracket | Male | Female |
| 5 to 17 Years | 6 (5.7%) | 0 (0.0%) |
| 18 to 34 Years | 4 (3.9%) | 0 (0.0%) |
| 35 to 64 Years | 5 (4.5%) | 0 (0.0%) |
| 65 to 74 Years | 6 (18.8%) | 0 (0.0%) |
| 75 Years and over | 0 (0.0%) | 5 (9.4%) |
Disability Class: Ambulatory Difficulty
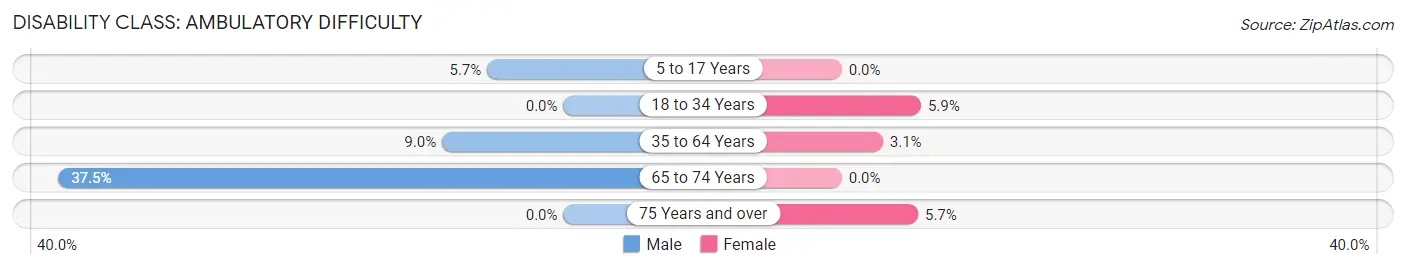
| Age Bracket | Male | Female |
| 5 to 17 Years | 6 (5.7%) | 0 (0.0%) |
| 18 to 34 Years | 0 (0.0%) | 2 (5.9%) |
| 35 to 64 Years | 10 (9.0%) | 4 (3.0%) |
| 65 to 74 Years | 12 (37.5%) | 0 (0.0%) |
| 75 Years and over | 0 (0.0%) | 3 (5.7%) |
Disability Class: Self-Care Difficulty
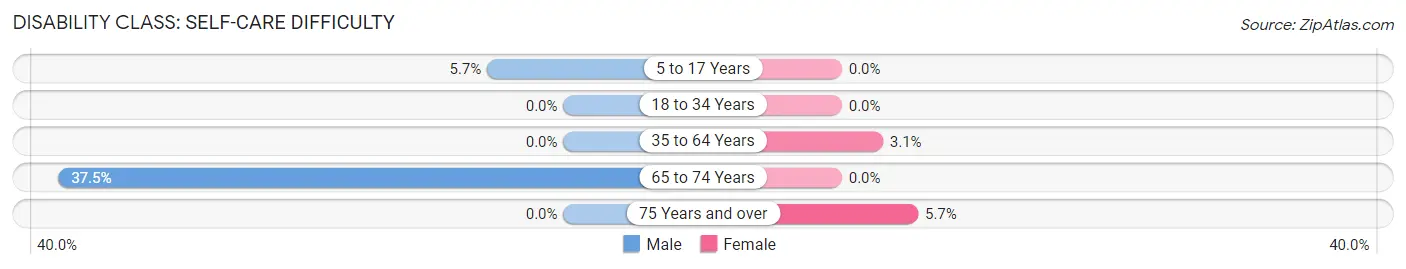
| Age Bracket | Male | Female |
| 5 to 17 Years | 6 (5.7%) | 0 (0.0%) |
| 18 to 34 Years | 0 (0.0%) | 0 (0.0%) |
| 35 to 64 Years | 0 (0.0%) | 4 (3.0%) |
| 65 to 74 Years | 12 (37.5%) | 0 (0.0%) |
| 75 Years and over | 0 (0.0%) | 3 (5.7%) |
Technology Access in Quentin
Computing Device Access in Quentin
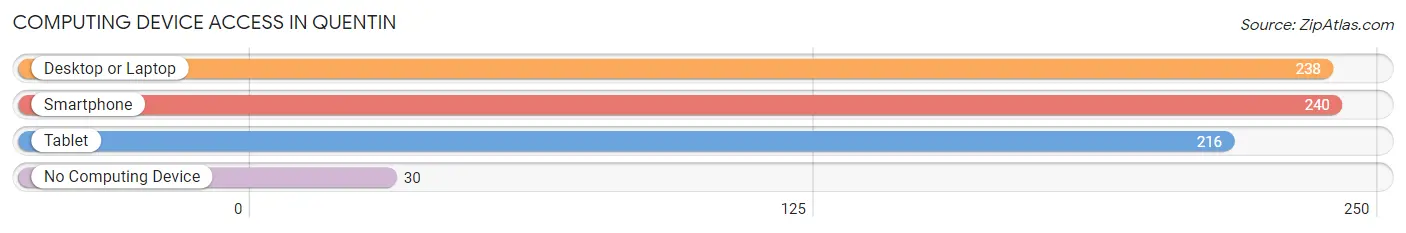
| Device Type | # Households | % Households |
| Desktop or Laptop | 238 | 79.3% |
| Smartphone | 240 | 80.0% |
| Tablet | 216 | 72.0% |
| No Computing Device | 30 | 10.0% |
| Total | 300 | 100.0% |
Internet Access in Quentin
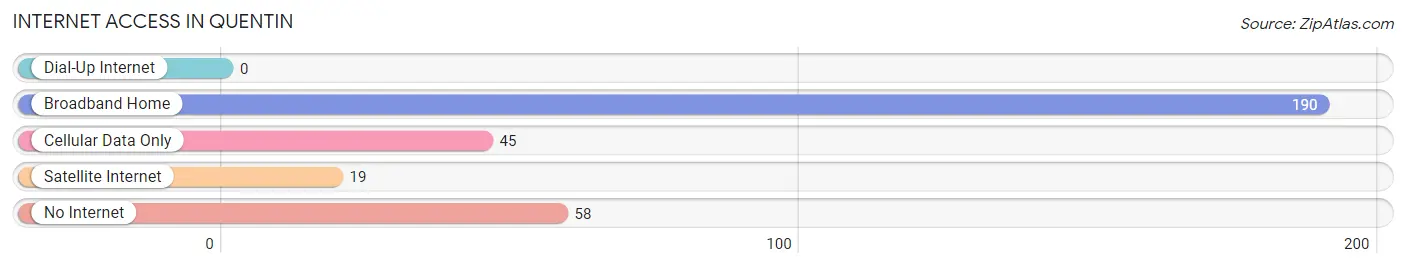
| Internet Type | # Households | % Households |
| Dial-Up Internet | 0 | 0.0% |
| Broadband Home | 190 | 63.3% |
| Cellular Data Only | 45 | 15.0% |
| Satellite Internet | 19 | 6.3% |
| No Internet | 58 | 19.3% |
| Total | 300 | 100.0% |
Quentin Summary
Quentin is a small borough located in Lebanon County, Pennsylvania. It is situated in the southeastern part of the state, about 10 miles east of the city of Lebanon. The borough is bordered by North Cornwall Township to the north, South Annville Township to the east, and South Londonderry Township to the south and west. As of the 2010 census, the population of Quentin was 1,845.
Geography
Quentin is located at 40°19'45" North, 76°25'45" West (40.329167, -76.429167). It has an area of 0.6 square miles, all of which is land. The borough is situated in the Appalachian Mountains, and is surrounded by rolling hills and farmland. The closest major cities are Harrisburg, located about 40 miles to the northwest, and Philadelphia, located about 90 miles to the east.
Climate
Quentin has a humid continental climate, with cold, snowy winters and hot, humid summers. The average annual temperature is 48°F, and the average annual precipitation is 40 inches.
Demographics
As of the 2010 census, there were 1,845 people, 745 households, and 517 families residing in the borough. The population density was 3,072.5 people per square mile. The racial makeup of the borough was 97.2% White, 0.7% African American, 0.2% Native American, 0.4% Asian, 0.2% from other races, and 1.3% from two or more races. Hispanic or Latino of any race were 1.2% of the population.
There were 745 households, out of which 28.3% had children under the age of 18 living with them, 51.2% were married couples living together, 11.2% had a female householder with no husband present, and 33.2% were non-families. 28.3% of all households were made up of individuals, and 14.2% had someone living alone who was 65 years of age or older. The average household size was 2.47 and the average family size was 3.03.
The median age in the borough was 41.2 years. 22.7% of residents were under the age of 18; 7.2% were between the ages of 18 and 24; 25.2% were from 25 to 44; 28.2% were from 45 to 64; and 16.7% were 65 years of age or older. The gender makeup of the borough was 48.2% male and 51.8% female.
Economy
Quentin is a small, rural community with a largely agricultural economy. The main industries in the borough are farming, dairy production, and food processing. The largest employers in the area are the local farms and food processing plants. Other industries in the borough include retail, construction, and manufacturing.
The median household income in Quentin was $50,938 in 2018, and the median family income was $60,938. The per capita income was $25,938. About 8.2% of families and 10.2% of the population were below the poverty line, including 14.2% of those under age 18 and 8.2% of those age 65 or over.
Conclusion
Quentin is a small borough located in Lebanon County, Pennsylvania. It is situated in the Appalachian Mountains, and is surrounded by rolling hills and farmland. As of the 2010 census, the population of Quentin was 1,845. The borough has a humid continental climate, with cold, snowy winters and hot, humid summers. The economy of Quentin is largely agricultural, with the main industries being farming, dairy production, and food processing. The median household income in Quentin was $50,938 in 2018.
Common Questions
What is Per Capita Income in Quentin?
Per Capita income in Quentin is $34,242.
What is the Median Family Income in Quentin?
Median Family Income in Quentin is $70,625.
What is the Median Household income in Quentin?
Median Household Income in Quentin is $60,417.
What is Income or Wage Gap in Quentin?
Income or Wage Gap in Quentin is 13.9%.
Women in Quentin earn 86.1 cents for every dollar earned by a man.
What is Inequality or Gini Index in Quentin?
Inequality or Gini Index in Quentin is 0.36.
What is the Total Population of Quentin?
Total Population of Quentin is 676.
What is the Total Male Population of Quentin?
Total Male Population of Quentin is 381.
What is the Total Female Population of Quentin?
Total Female Population of Quentin is 295.
What is the Ratio of Males per 100 Females in Quentin?
There are 129.15 Males per 100 Females in Quentin.
What is the Ratio of Females per 100 Males in Quentin?
There are 77.43 Females per 100 Males in Quentin.
What is the Median Population Age in Quentin?
Median Population Age in Quentin is 41.7 Years.
What is the Average Family Size in Quentin
Average Family Size in Quentin is 3.0 People.
What is the Average Household Size in Quentin
Average Household Size in Quentin is 2.2 People.
How Large is the Labor Force in Quentin?
There are 390 People in the Labor Forcein in Quentin.
What is the Percentage of People in the Labor Force in Quentin?
71.2% of People are in the Labor Force in Quentin.
What is the Unemployment Rate in Quentin?
Unemployment Rate in Quentin is 2.1%.