Union Dale borough, PA Map & Demographics
Union Dale borough Overview
$36,659
PER CAPITA INCOME
$80,417
AVG FAMILY INCOME
$58,125
AVG HOUSEHOLD INCOME
25.7%
WAGE / INCOME GAP [ % ]
74.3¢/ $1
WAGE / INCOME GAP [ $ ]
0.39
INEQUALITY / GINI INDEX
160
TOTAL POPULATION
90
MALE POPULATION
70
FEMALE POPULATION
128.57
MALES / 100 FEMALES
77.78
FEMALES / 100 MALES
62.1
MEDIAN AGE
2.3
AVG FAMILY SIZE
1.8
AVG HOUSEHOLD SIZE
78
LABOR FORCE [ PEOPLE ]
50.3%
PERCENT IN LABOR FORCE
3.8%
UNEMPLOYMENT RATE
Income in Union Dale borough
Income Overview in Union Dale borough
Per Capita Income in Union Dale borough is $36,659, while median incomes of families and households are $80,417 and $58,125 respectively.
| Characteristic | Number | Measure |
| Per Capita Income | 160 | $36,659 |
| Median Family Income | 45 | $80,417 |
| Mean Family Income | 45 | $88,244 |
| Median Household Income | 91 | $58,125 |
| Mean Household Income | 91 | $63,447 |
| Income Deficit | 45 | $0 |
| Wage / Income Gap (%) | 160 | 25.68% |
| Wage / Income Gap ($) | 160 | 74.32¢ per $1 |
| Gini / Inequality Index | 160 | 0.39 |
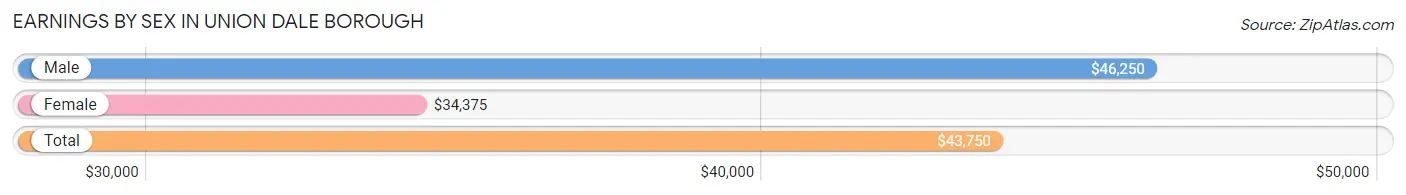
Earnings by Sex in Union Dale borough
Average Earnings in Union Dale borough are $43,750, $46,250 for men and $34,375 for women, a difference of 25.7%.
| Sex | Number | Average Earnings |
| Male | 57 (66.3%) | $46,250 |
| Female | 29 (33.7%) | $34,375 |
| Total | 86 (100.0%) | $43,750 |
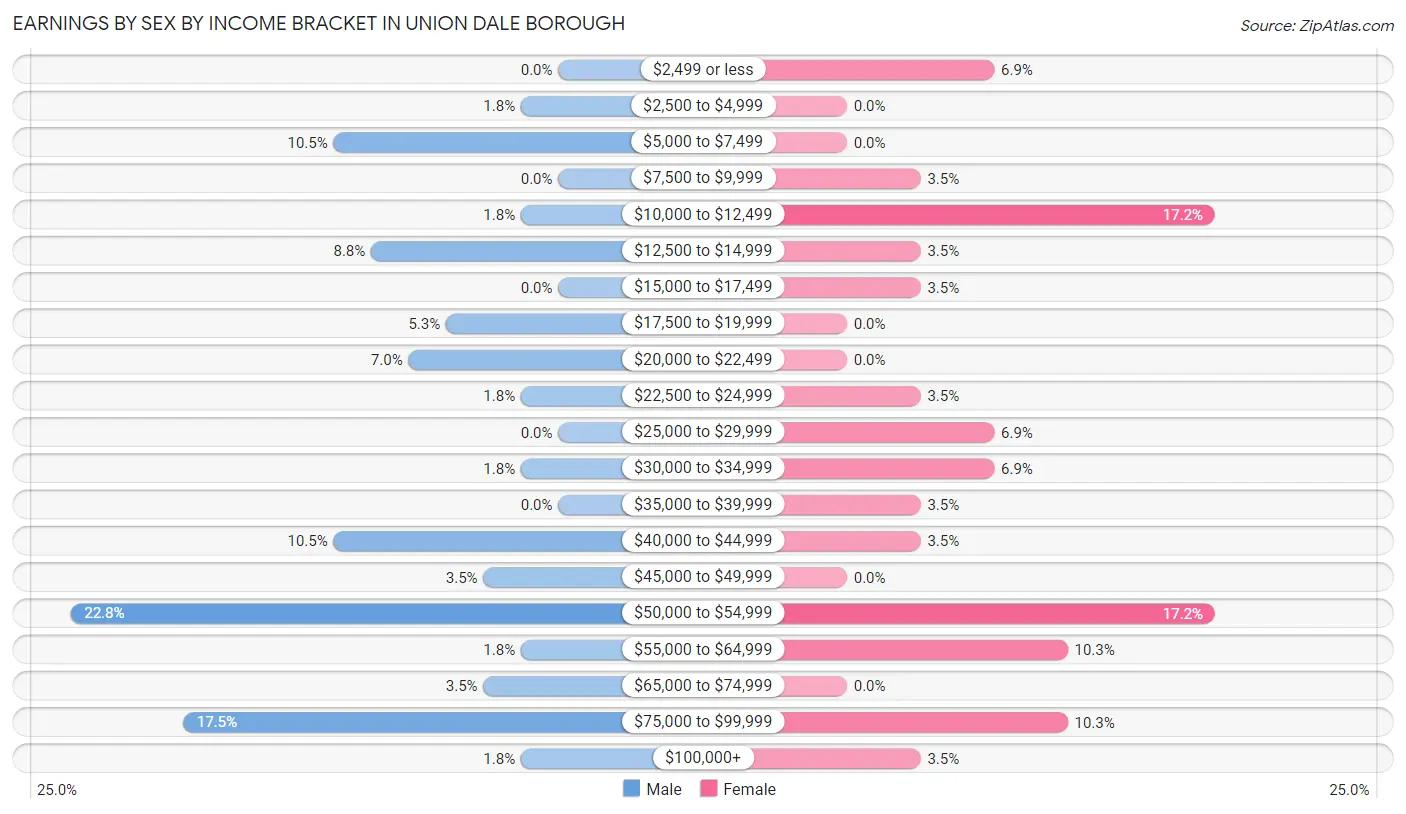
Earnings by Sex by Income Bracket in Union Dale borough
The most common earnings brackets in Union Dale borough are $50,000 to $54,999 for men (13 | 22.8%) and $10,000 to $12,499 for women (5 | 17.2%).
| Income | Male | Female |
| $2,499 or less | 0 (0.0%) | 2 (6.9%) |
| $2,500 to $4,999 | 1 (1.8%) | 0 (0.0%) |
| $5,000 to $7,499 | 6 (10.5%) | 0 (0.0%) |
| $7,500 to $9,999 | 0 (0.0%) | 1 (3.5%) |
| $10,000 to $12,499 | 1 (1.8%) | 5 (17.2%) |
| $12,500 to $14,999 | 5 (8.8%) | 1 (3.5%) |
| $15,000 to $17,499 | 0 (0.0%) | 1 (3.5%) |
| $17,500 to $19,999 | 3 (5.3%) | 0 (0.0%) |
| $20,000 to $22,499 | 4 (7.0%) | 0 (0.0%) |
| $22,500 to $24,999 | 1 (1.8%) | 1 (3.5%) |
| $25,000 to $29,999 | 0 (0.0%) | 2 (6.9%) |
| $30,000 to $34,999 | 1 (1.8%) | 2 (6.9%) |
| $35,000 to $39,999 | 0 (0.0%) | 1 (3.5%) |
| $40,000 to $44,999 | 6 (10.5%) | 1 (3.5%) |
| $45,000 to $49,999 | 2 (3.5%) | 0 (0.0%) |
| $50,000 to $54,999 | 13 (22.8%) | 5 (17.2%) |
| $55,000 to $64,999 | 1 (1.8%) | 3 (10.3%) |
| $65,000 to $74,999 | 2 (3.5%) | 0 (0.0%) |
| $75,000 to $99,999 | 10 (17.5%) | 3 (10.3%) |
| $100,000+ | 1 (1.8%) | 1 (3.5%) |
| Total | 57 (100.0%) | 29 (100.0%) |
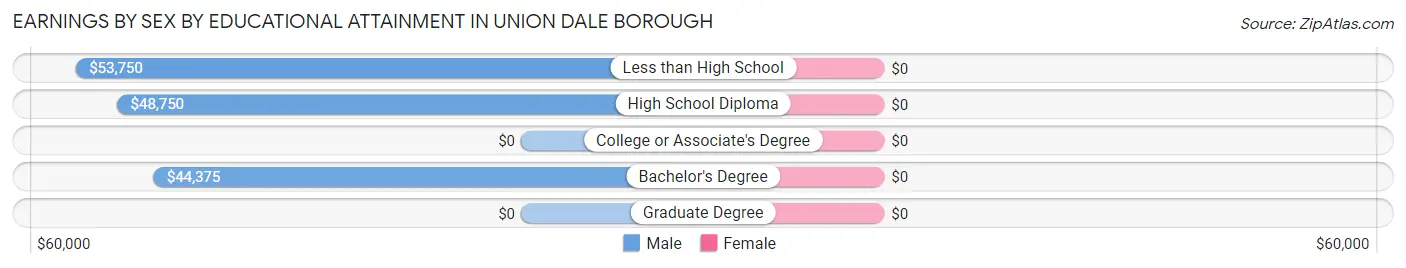
Earnings by Sex by Educational Attainment in Union Dale borough
| Educational Attainment | Male Income | Female Income |
| Less than High School | $53,750 | $0 |
| High School Diploma | $48,750 | $0 |
| College or Associate's Degree | - | - |
| Bachelor's Degree | $44,375 | $0 |
| Graduate Degree | - | - |
| Total | $50,417 | $38,750 |
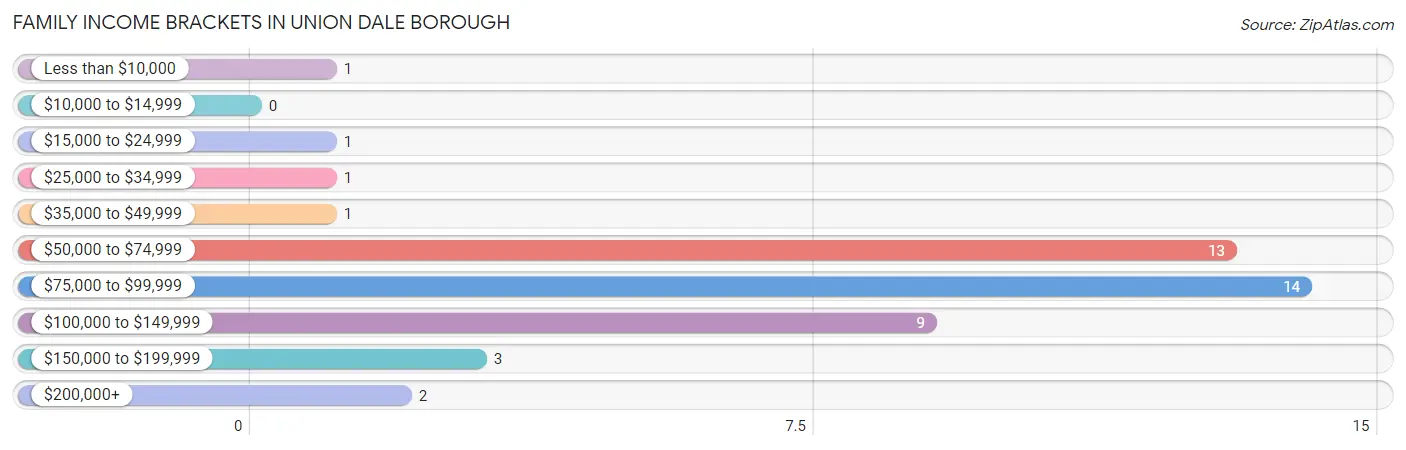
Family Income in Union Dale borough
Family Income Brackets in Union Dale borough
According to the Union Dale borough family income data, there are 14 families falling into the $75,000 to $99,999 income range, which is the most common income bracket and makes up 31.1% of all families.
| Income Bracket | # Families | % Families |
| Less than $10,000 | 1 | 2.2% |
| $10,000 to $14,999 | 0 | 0.0% |
| $15,000 to $24,999 | 1 | 2.2% |
| $25,000 to $34,999 | 1 | 2.2% |
| $35,000 to $49,999 | 1 | 2.2% |
| $50,000 to $74,999 | 13 | 28.9% |
| $75,000 to $99,999 | 14 | 31.1% |
| $100,000 to $149,999 | 9 | 20.0% |
| $150,000 to $199,999 | 3 | 6.7% |
| $200,000+ | 2 | 4.4% |
Family Income by Famaliy Size in Union Dale borough
2-person families (41 | 91.1%) account for the highest median family income in Union Dale borough with $82,083 per family, while 2-person families (41 | 91.1%) have the highest median income of $41,042 per family member.
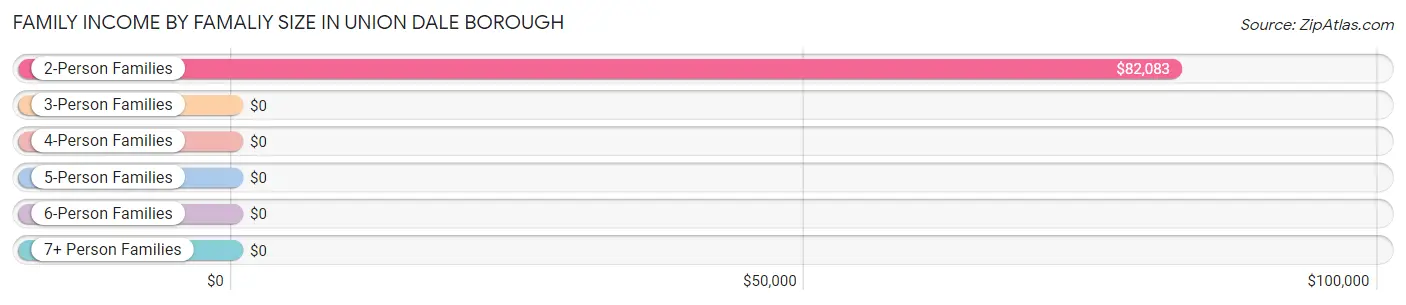
| Income Bracket | # Families | Median Income |
| 2-Person Families | 41 (91.1%) | $82,083 |
| 3-Person Families | 0 (0.0%) | $0 |
| 4-Person Families | 3 (6.7%) | $0 |
| 5-Person Families | 0 (0.0%) | $0 |
| 6-Person Families | 0 (0.0%) | $0 |
| 7+ Person Families | 1 (2.2%) | $0 |
| Total | 45 (100.0%) | $80,417 |
Family Income by Number of Earners in Union Dale borough
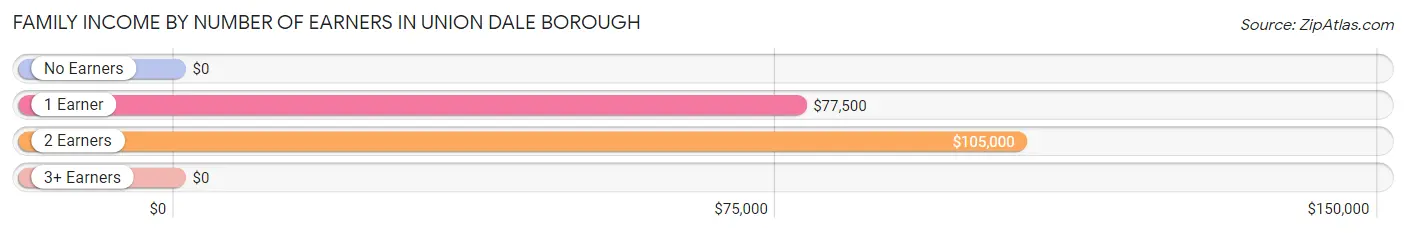
| Number of Earners | # Families | Median Income |
| No Earners | 6 (13.3%) | $0 |
| 1 Earner | 20 (44.4%) | $77,500 |
| 2 Earners | 16 (35.6%) | $105,000 |
| 3+ Earners | 3 (6.7%) | $0 |
| Total | 45 (100.0%) | $80,417 |
Household Income in Union Dale borough
Household Income Brackets in Union Dale borough
With 27 households falling in the category, the $50,000 to $74,999 income range is the most frequent in Union Dale borough, accounting for 29.7% of all households. In contrast, only 2 households (2.2%) fall into the less than $10,000 income bracket, making it the least populous group.
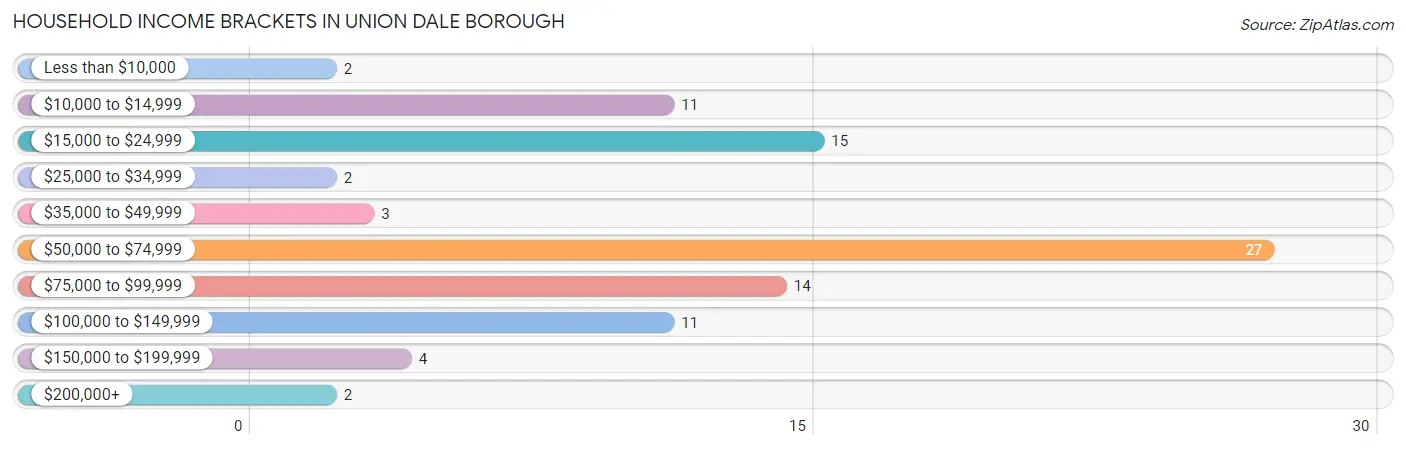
| Income Bracket | # Households | % Households |
| Less than $10,000 | 2 | 2.2% |
| $10,000 to $14,999 | 11 | 12.1% |
| $15,000 to $24,999 | 15 | 16.5% |
| $25,000 to $34,999 | 2 | 2.2% |
| $35,000 to $49,999 | 3 | 3.3% |
| $50,000 to $74,999 | 27 | 29.7% |
| $75,000 to $99,999 | 14 | 15.4% |
| $100,000 to $149,999 | 11 | 12.1% |
| $150,000 to $199,999 | 4 | 4.4% |
| $200,000+ | 2 | 2.2% |
Household Income by Householder Age in Union Dale borough
The median household income in Union Dale borough is $58,125, with the highest median household income of $76,250 found in the 45 to 64 years age bracket for the primary householder. A total of 39 households (42.9%) fall into this category. Meanwhile, the 25 to 44 years age bracket for the primary householder has the lowest median household income of $0, with 9 households (9.9%) in this group.
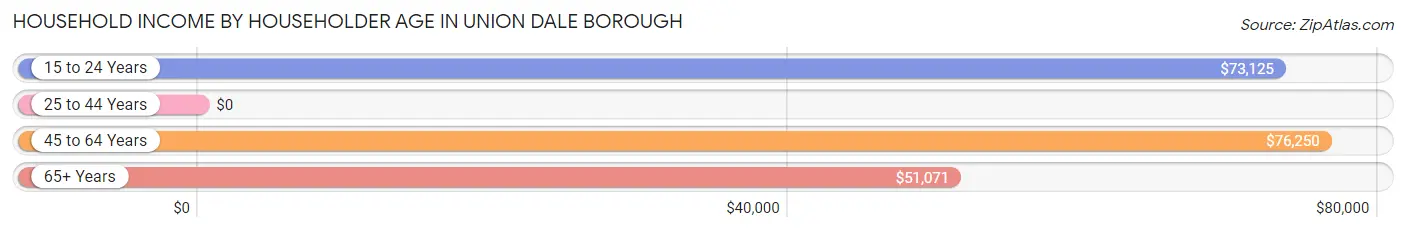
| Income Bracket | # Households | Median Income |
| 15 to 24 Years | 5 (5.5%) | $73,125 |
| 25 to 44 Years | 9 (9.9%) | $0 |
| 45 to 64 Years | 39 (42.9%) | $76,250 |
| 65+ Years | 38 (41.8%) | $51,071 |
| Total | 91 (100.0%) | $58,125 |
Poverty in Union Dale borough
Income Below Poverty by Sex and Age in Union Dale borough
With 12.2% poverty level for males and 11.4% for females among the residents of Union Dale borough, 45 to 54 year old males and 75 year old and over females are the most vulnerable to poverty, with 5 males (33.3%) and 6 females (60.0%) in their respective age groups living below the poverty level.
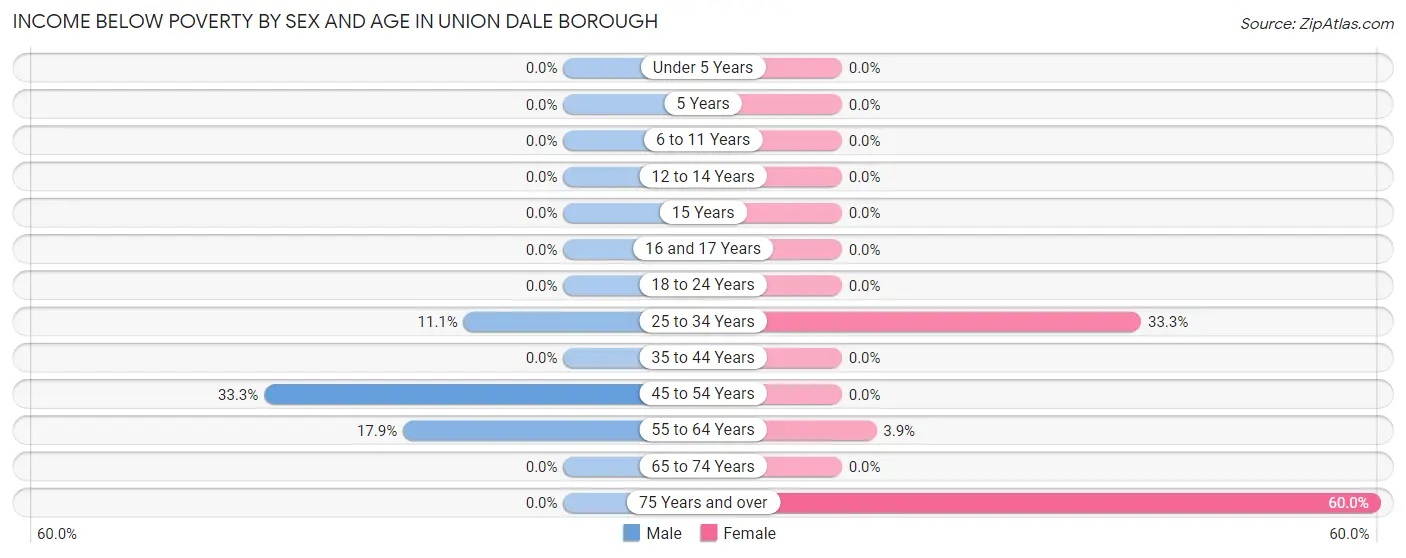
| Age Bracket | Male | Female |
| Under 5 Years | 0 (0.0%) | 0 (0.0%) |
| 5 Years | 0 (0.0%) | 0 (0.0%) |
| 6 to 11 Years | 0 (0.0%) | 0 (0.0%) |
| 12 to 14 Years | 0 (0.0%) | 0 (0.0%) |
| 15 Years | 0 (0.0%) | 0 (0.0%) |
| 16 and 17 Years | 0 (0.0%) | 0 (0.0%) |
| 18 to 24 Years | 0 (0.0%) | 0 (0.0%) |
| 25 to 34 Years | 1 (11.1%) | 1 (33.3%) |
| 35 to 44 Years | 0 (0.0%) | 0 (0.0%) |
| 45 to 54 Years | 5 (33.3%) | 0 (0.0%) |
| 55 to 64 Years | 5 (17.9%) | 1 (3.8%) |
| 65 to 74 Years | 0 (0.0%) | 0 (0.0%) |
| 75 Years and over | 0 (0.0%) | 6 (60.0%) |
| Total | 11 (12.2%) | 8 (11.4%) |
Income Above Poverty by Sex and Age in Union Dale borough
According to the poverty statistics in Union Dale borough, males aged under 5 years and females aged under 5 years are the age groups that are most secure financially, with 100.0% of males and 100.0% of females in these age groups living above the poverty line.
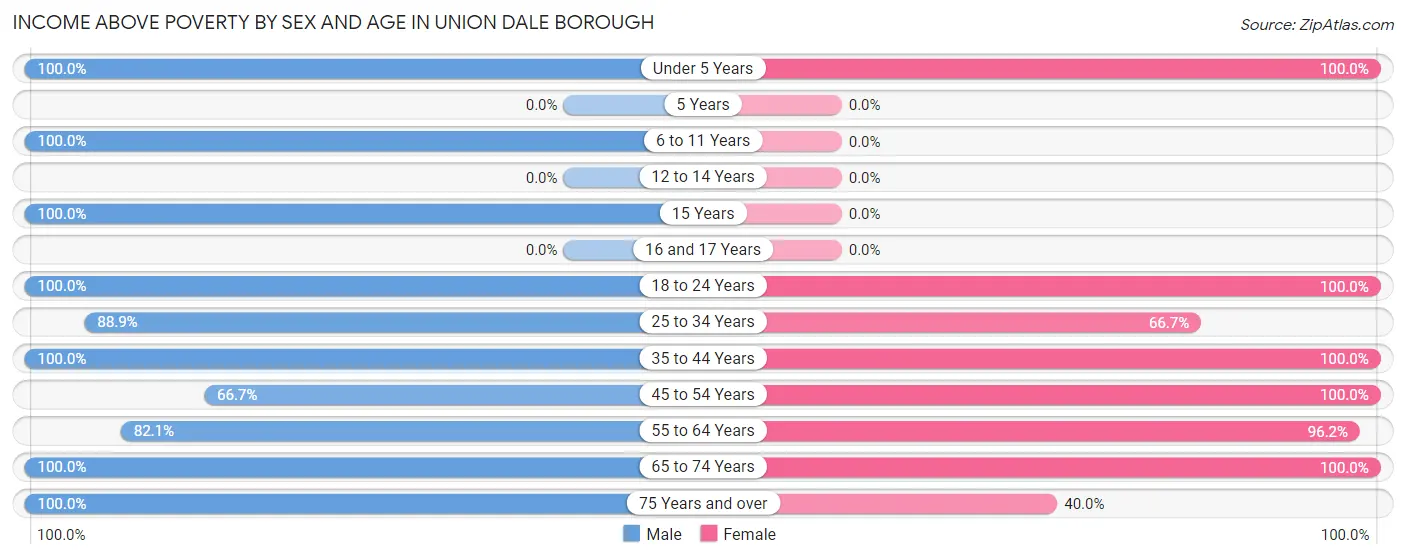
| Age Bracket | Male | Female |
| Under 5 Years | 1 (100.0%) | 1 (100.0%) |
| 5 Years | 0 (0.0%) | 0 (0.0%) |
| 6 to 11 Years | 1 (100.0%) | 0 (0.0%) |
| 12 to 14 Years | 0 (0.0%) | 0 (0.0%) |
| 15 Years | 2 (100.0%) | 0 (0.0%) |
| 16 and 17 Years | 0 (0.0%) | 0 (0.0%) |
| 18 to 24 Years | 5 (100.0%) | 6 (100.0%) |
| 25 to 34 Years | 8 (88.9%) | 2 (66.7%) |
| 35 to 44 Years | 4 (100.0%) | 2 (100.0%) |
| 45 to 54 Years | 10 (66.7%) | 8 (100.0%) |
| 55 to 64 Years | 23 (82.1%) | 25 (96.2%) |
| 65 to 74 Years | 17 (100.0%) | 14 (100.0%) |
| 75 Years and over | 8 (100.0%) | 4 (40.0%) |
| Total | 79 (87.8%) | 62 (88.6%) |
Income Below Poverty Among Married-Couple Families in Union Dale borough
The poverty statistics for married-couple families in Union Dale borough show that 2.5% or 1 of the total 40 families live below the poverty line. Families with no children have the highest poverty rate of 2.6%, comprising of 1 families. On the other hand, families with 5 or more children have the lowest poverty rate of 0.0%, which includes 0 families.
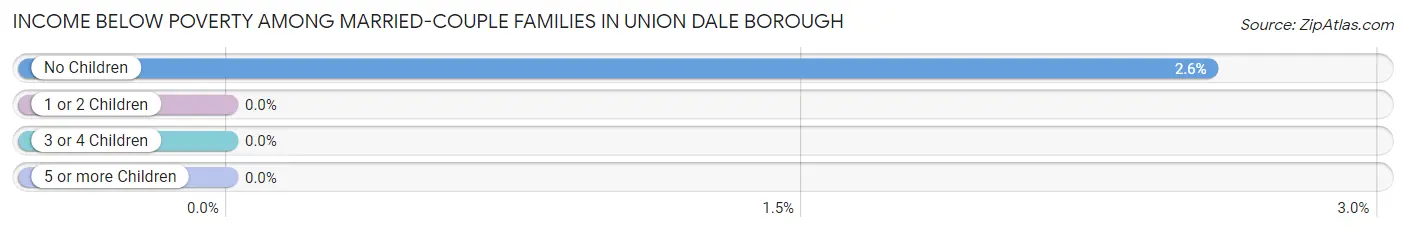
| Children | Above Poverty | Below Poverty |
| No Children | 38 (97.4%) | 1 (2.6%) |
| 1 or 2 Children | 0 (0.0%) | 0 (0.0%) |
| 3 or 4 Children | 0 (0.0%) | 0 (0.0%) |
| 5 or more Children | 1 (100.0%) | 0 (0.0%) |
| Total | 39 (97.5%) | 1 (2.5%) |
Income Below Poverty Among Single-Parent Households in Union Dale borough
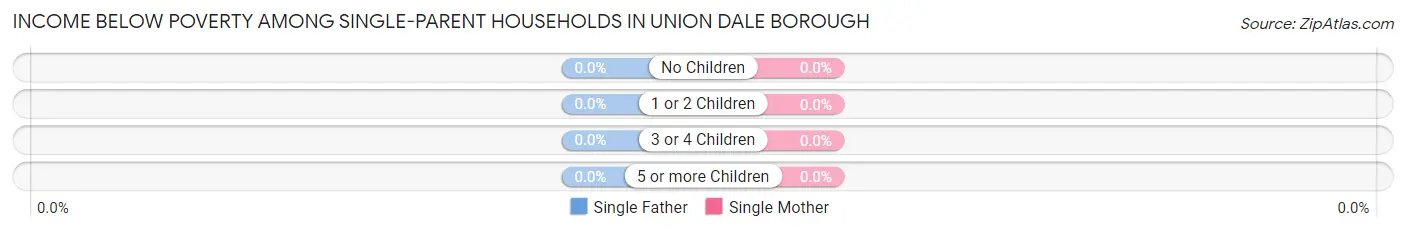
| Children | Single Father | Single Mother |
| No Children | 0 (0.0%) | 0 (0.0%) |
| 1 or 2 Children | 0 (0.0%) | 0 (0.0%) |
| 3 or 4 Children | 0 (0.0%) | 0 (0.0%) |
| 5 or more Children | 0 (0.0%) | 0 (0.0%) |
| Total | 0 (0.0%) | 0 (0.0%) |
Income Below Poverty Among Married-Couple vs Single-Parent Households in Union Dale borough
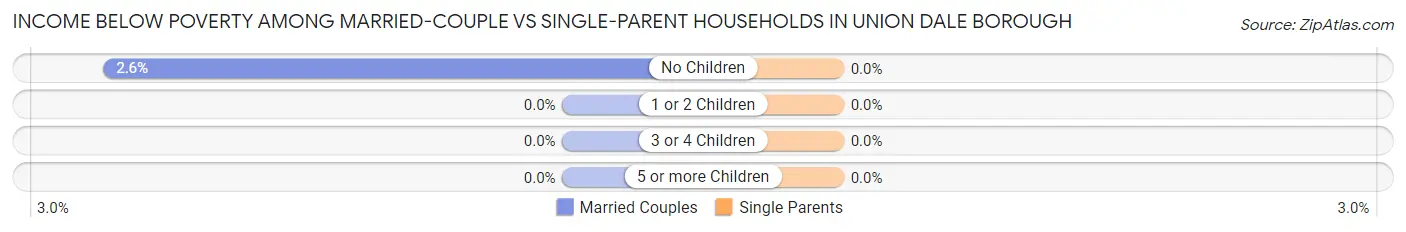
| Children | Married-Couple Families | Single-Parent Households |
| No Children | 1 (2.6%) | 0 (0.0%) |
| 1 or 2 Children | 0 (0.0%) | 0 (0.0%) |
| 3 or 4 Children | 0 (0.0%) | 0 (0.0%) |
| 5 or more Children | 0 (0.0%) | 0 (0.0%) |
| Total | 1 (2.5%) | 0 (0.0%) |
Race in Union Dale borough
The most populous races in Union Dale borough are White / Caucasian (152 | 95.0%), Hispanic or Latino (10 | 6.2%), and Native / Alaskan (6 | 3.7%).
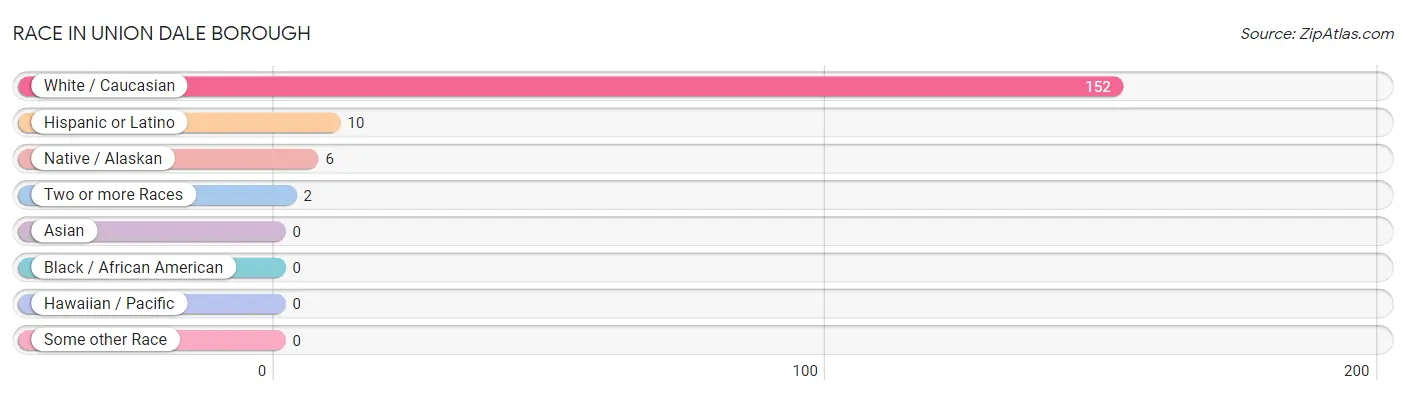
| Race | # Population | % Population |
| Asian | 0 | 0.0% |
| Black / African American | 0 | 0.0% |
| Hawaiian / Pacific | 0 | 0.0% |
| Hispanic or Latino | 10 | 6.2% |
| Native / Alaskan | 6 | 3.7% |
| White / Caucasian | 152 | 95.0% |
| Two or more Races | 2 | 1.3% |
| Some other Race | 0 | 0.0% |
| Total | 160 | 100.0% |
Ancestry in Union Dale borough
The most populous ancestries reported in Union Dale borough are English (32 | 20.0%), Irish (30 | 18.8%), Polish (24 | 15.0%), German (22 | 13.8%), and Russian (16 | 10.0%), together accounting for 77.5% of all Union Dale borough residents.
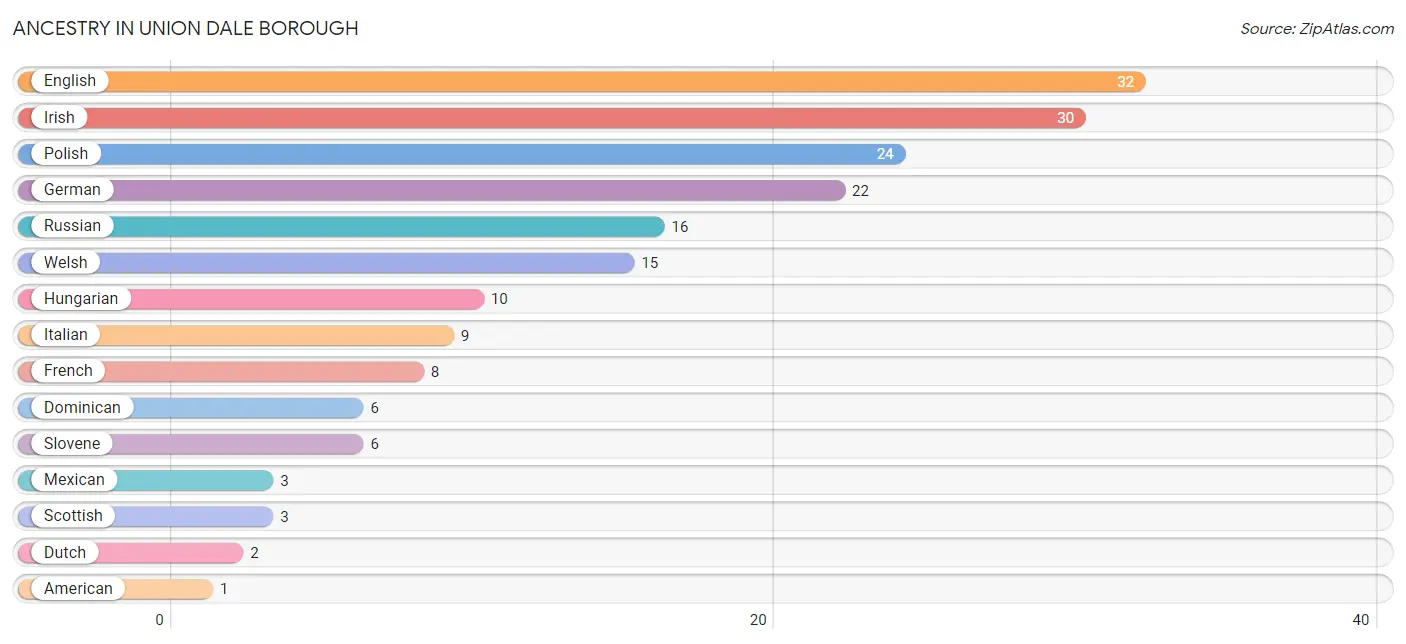
| Ancestry | # Population | % Population |
| American | 1 | 0.6% |
| Croatian | 1 | 0.6% |
| Dominican | 6 | 3.7% |
| Dutch | 2 | 1.3% |
| English | 32 | 20.0% |
| French | 8 | 5.0% |
| German | 22 | 13.8% |
| Hungarian | 10 | 6.2% |
| Irish | 30 | 18.8% |
| Italian | 9 | 5.6% |
| Lithuanian | 1 | 0.6% |
| Mexican | 3 | 1.9% |
| Polish | 24 | 15.0% |
| Puerto Rican | 1 | 0.6% |
| Russian | 16 | 10.0% |
| Scottish | 3 | 1.9% |
| Slovak | 1 | 0.6% |
| Slovene | 6 | 3.7% |
| Welsh | 15 | 9.4% | View All 19 Rows |
Immigrants in Union Dale borough
The most numerous immigrant groups reported in Union Dale borough came from Latin America (3 | 1.9%), Central America (2 | 1.3%), Mexico (2 | 1.3%), Caribbean (1 | 0.6%), and Dominican Republic (1 | 0.6%), together accounting for 5.6% of all Union Dale borough residents.
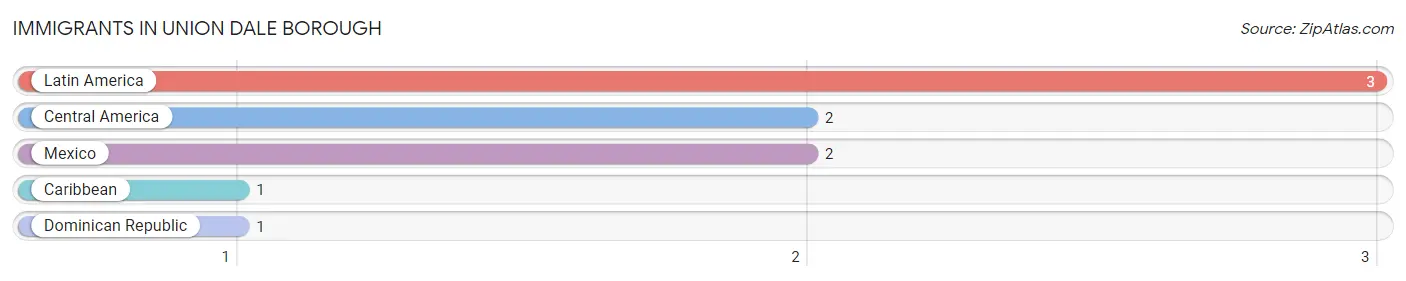
| Immigration Origin | # Population | % Population |
| Caribbean | 1 | 0.6% |
| Central America | 2 | 1.3% |
| Dominican Republic | 1 | 0.6% |
| Latin America | 3 | 1.9% |
| Mexico | 2 | 1.3% | View All 5 Rows |
Sex and Age in Union Dale borough
Sex and Age in Union Dale borough
The most populous age groups in Union Dale borough are 60 to 64 Years (22 | 24.4%) for men and 60 to 64 Years (21 | 30.0%) for women.
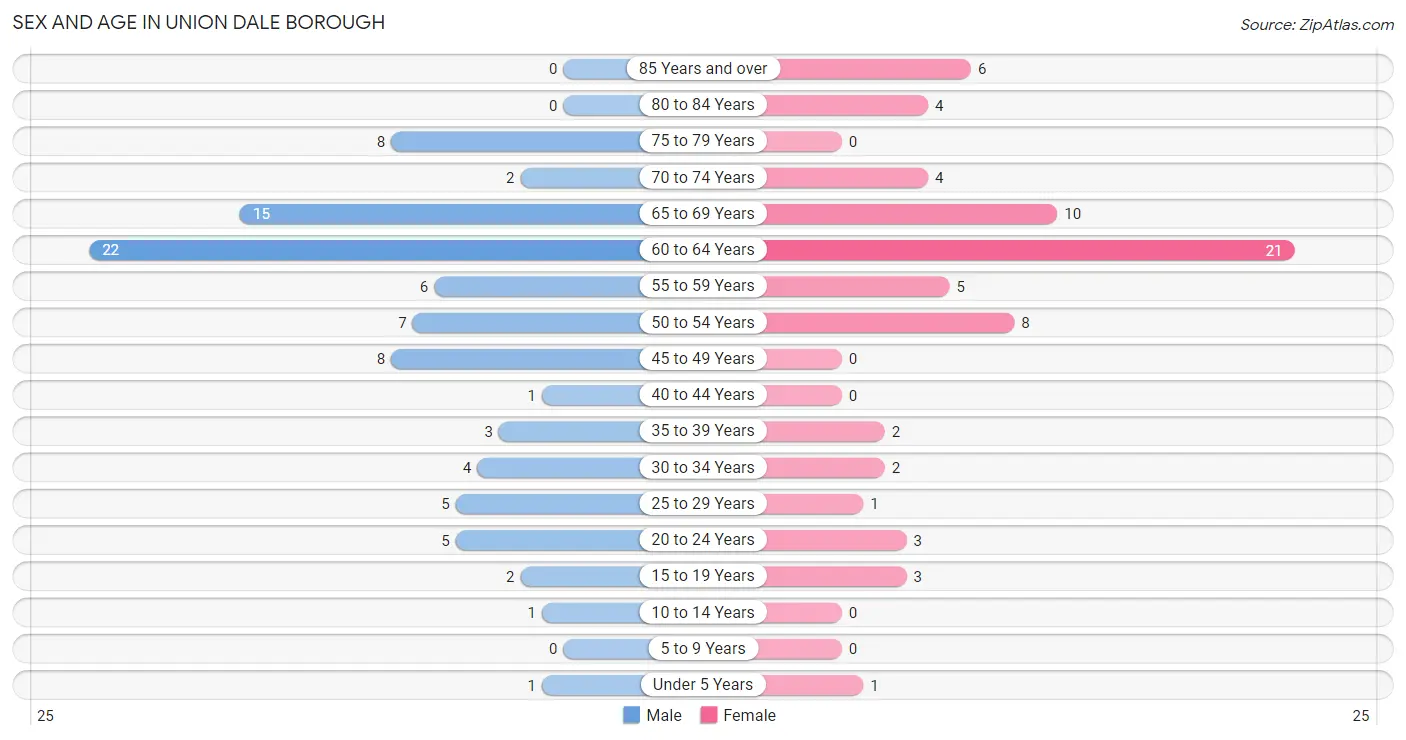
| Age Bracket | Male | Female |
| Under 5 Years | 1 (1.1%) | 1 (1.4%) |
| 5 to 9 Years | 0 (0.0%) | 0 (0.0%) |
| 10 to 14 Years | 1 (1.1%) | 0 (0.0%) |
| 15 to 19 Years | 2 (2.2%) | 3 (4.3%) |
| 20 to 24 Years | 5 (5.6%) | 3 (4.3%) |
| 25 to 29 Years | 5 (5.6%) | 1 (1.4%) |
| 30 to 34 Years | 4 (4.4%) | 2 (2.9%) |
| 35 to 39 Years | 3 (3.3%) | 2 (2.9%) |
| 40 to 44 Years | 1 (1.1%) | 0 (0.0%) |
| 45 to 49 Years | 8 (8.9%) | 0 (0.0%) |
| 50 to 54 Years | 7 (7.8%) | 8 (11.4%) |
| 55 to 59 Years | 6 (6.7%) | 5 (7.1%) |
| 60 to 64 Years | 22 (24.4%) | 21 (30.0%) |
| 65 to 69 Years | 15 (16.7%) | 10 (14.3%) |
| 70 to 74 Years | 2 (2.2%) | 4 (5.7%) |
| 75 to 79 Years | 8 (8.9%) | 0 (0.0%) |
| 80 to 84 Years | 0 (0.0%) | 4 (5.7%) |
| 85 Years and over | 0 (0.0%) | 6 (8.6%) |
| Total | 90 (100.0%) | 70 (100.0%) |
Families and Households in Union Dale borough
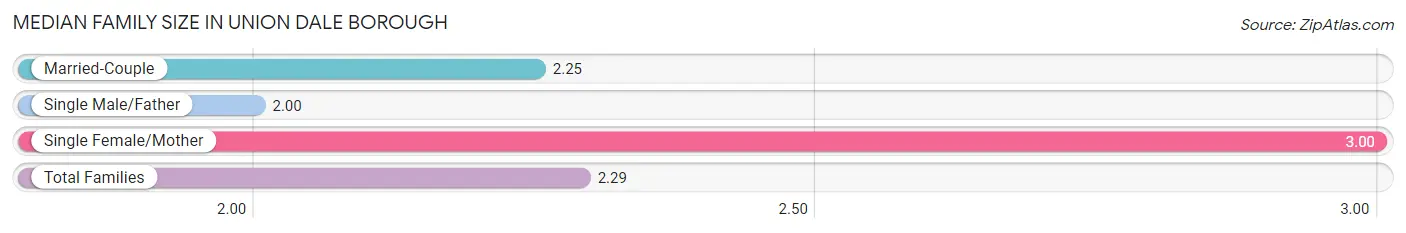
Median Family Size in Union Dale borough
The median family size in Union Dale borough is 2.29 persons per family, with single female/mother families (3 | 6.7%) accounting for the largest median family size of 3 persons per family. On the other hand, single male/father families (2 | 4.4%) represent the smallest median family size with 2.00 persons per family.
| Family Type | # Families | Family Size |
| Married-Couple | 40 (88.9%) | 2.25 |
| Single Male/Father | 2 (4.4%) | 2.00 |
| Single Female/Mother | 3 (6.7%) | 3.00 |
| Total Families | 45 (100.0%) | 2.29 |
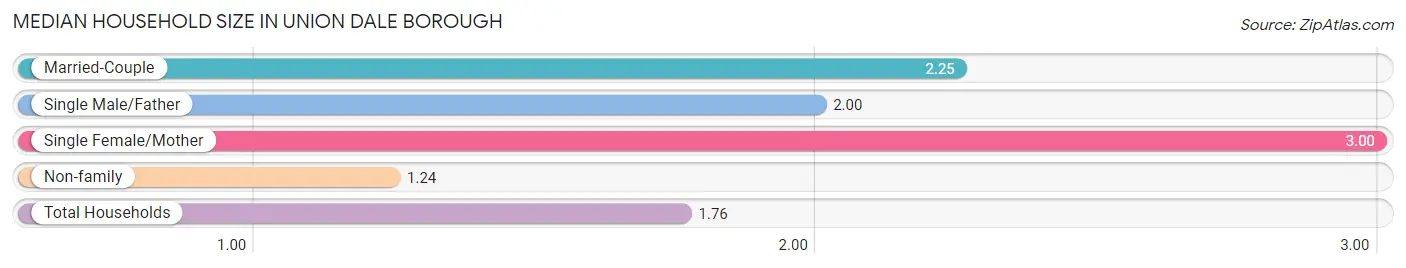
Median Household Size in Union Dale borough
The median household size in Union Dale borough is 1.76 persons per household, with single female/mother households (3 | 3.3%) accounting for the largest median household size of 3 persons per household. non-family households (46 | 50.5%) represent the smallest median household size with 1.24 persons per household.
| Household Type | # Households | Household Size |
| Married-Couple | 40 (44.0%) | 2.25 |
| Single Male/Father | 2 (2.2%) | 2.00 |
| Single Female/Mother | 3 (3.3%) | 3.00 |
| Non-family | 46 (50.5%) | 1.24 |
| Total Households | 91 (100.0%) | 1.76 |
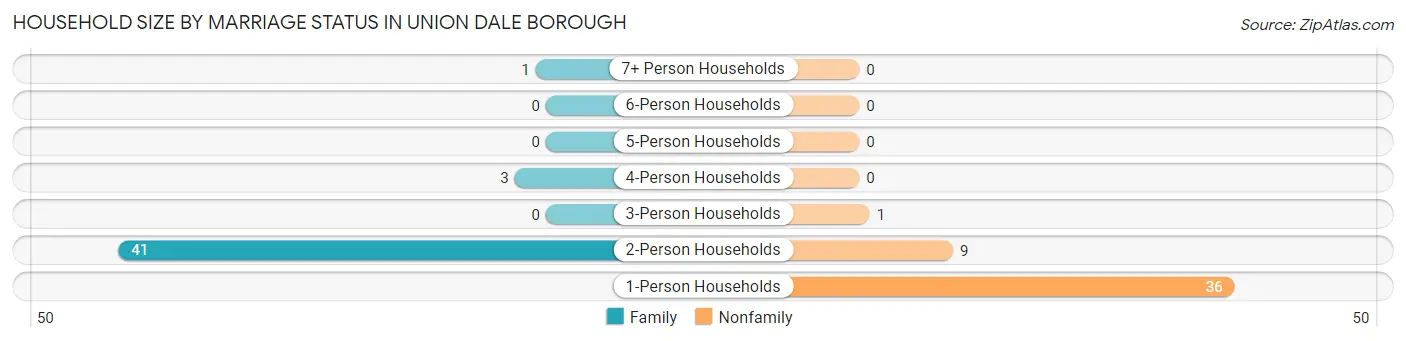
Household Size by Marriage Status in Union Dale borough
Out of a total of 91 households in Union Dale borough, 45 (49.4%) are family households, while 46 (50.5%) are nonfamily households. The most numerous type of family households are 2-person households, comprising 41, and the most common type of nonfamily households are 1-person households, comprising 36.
| Household Size | Family Households | Nonfamily Households |
| 1-Person Households | - | 36 (39.6%) |
| 2-Person Households | 41 (45.1%) | 9 (9.9%) |
| 3-Person Households | 0 (0.0%) | 1 (1.1%) |
| 4-Person Households | 3 (3.3%) | 0 (0.0%) |
| 5-Person Households | 0 (0.0%) | 0 (0.0%) |
| 6-Person Households | 0 (0.0%) | 0 (0.0%) |
| 7+ Person Households | 1 (1.1%) | 0 (0.0%) |
| Total | 45 (49.4%) | 46 (50.5%) |
Female Fertility in Union Dale borough
Fertility by Age in Union Dale borough
Average fertility rate in Union Dale borough is 59.0 births per 1,000 women. Women in the age bracket of 15 to 19 years have the highest fertility rate with 333.0 births per 1,000 women. Women in the age bracket of 15 to 19 years acount for 100.0% of all women with births.
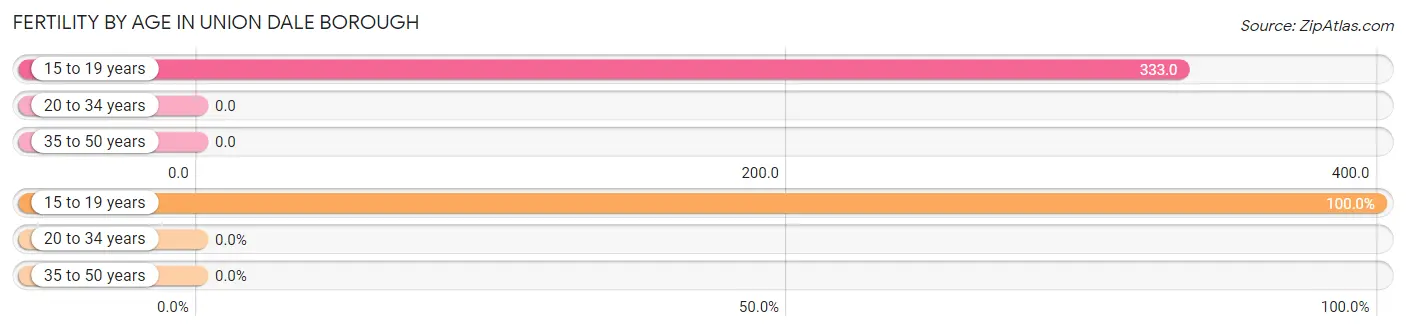
| Age Bracket | Women with Births | Births / 1,000 Women |
| 15 to 19 years | 1 (100.0%) | 333.0 |
| 20 to 34 years | 0 (0.0%) | 0.0 |
| 35 to 50 years | 0 (0.0%) | 0.0 |
| Total | 1 (100.0%) | 59.0 |
Fertility by Age by Marriage Status in Union Dale borough
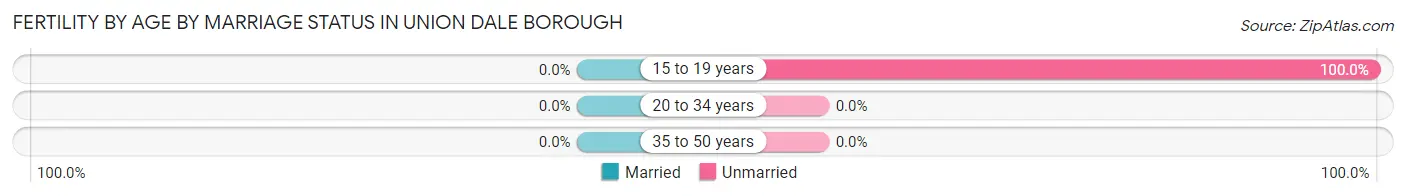
| Age Bracket | Married | Unmarried |
| 15 to 19 years | 0 (0.0%) | 1 (100.0%) |
| 20 to 34 years | 0 (0.0%) | 0 (0.0%) |
| 35 to 50 years | 0 (0.0%) | 0 (0.0%) |
| Total | 0 (0.0%) | 1 (100.0%) |
Fertility by Education in Union Dale borough
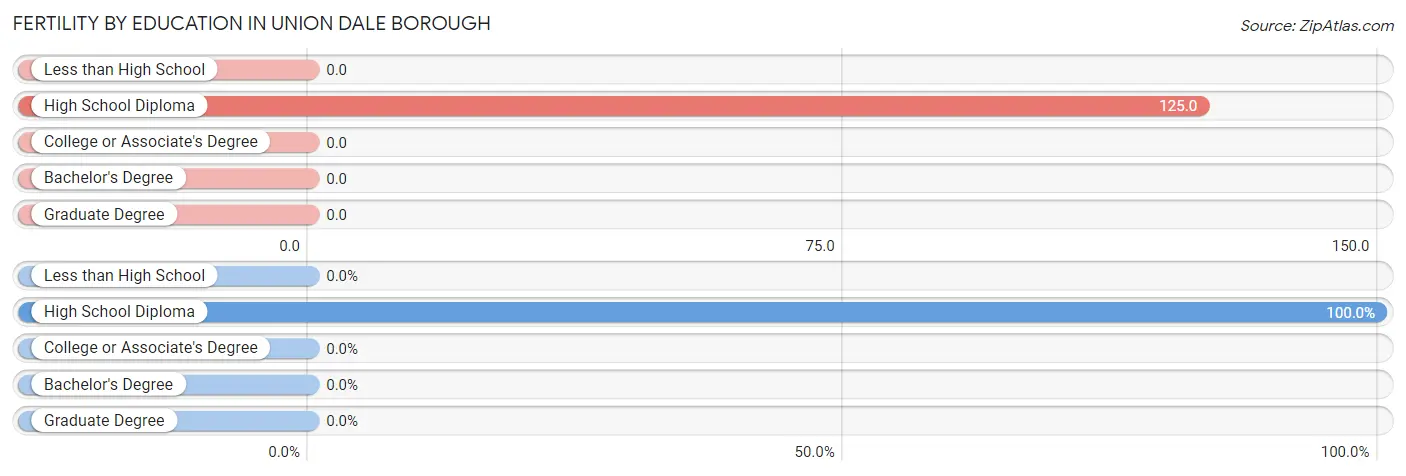
| Educational Attainment | Women with Births | Births / 1,000 Women |
| Less than High School | 0 (0.0%) | 0.0 |
| High School Diploma | 1 (100.0%) | 125.0 |
| College or Associate's Degree | 0 (0.0%) | 0.0 |
| Bachelor's Degree | 0 (0.0%) | 0.0 |
| Graduate Degree | 0 (0.0%) | 0.0 |
| Total | 1 (100.0%) | 59.0 |
Fertility by Education by Marriage Status in Union Dale borough
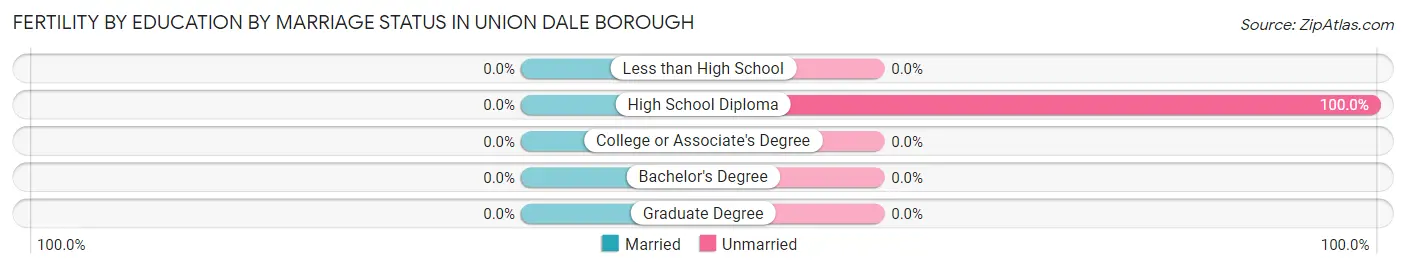
| Educational Attainment | Married | Unmarried |
| Less than High School | 0 (0.0%) | 0 (0.0%) |
| High School Diploma | 0 (0.0%) | 1 (100.0%) |
| College or Associate's Degree | 0 (0.0%) | 0 (0.0%) |
| Bachelor's Degree | 0 (0.0%) | 0 (0.0%) |
| Graduate Degree | 0 (0.0%) | 0 (0.0%) |
| Total | 0 (0.0%) | 1 (100.0%) |
Employment Characteristics in Union Dale borough
Employment by Class of Employer in Union Dale borough
Among the 75 employed individuals in Union Dale borough, private company employees (47 | 62.7%), self-employed (not incorporated) (8 | 10.7%), and self-employed (incorporated) (6 | 8.0%) make up the most common classes of employment.
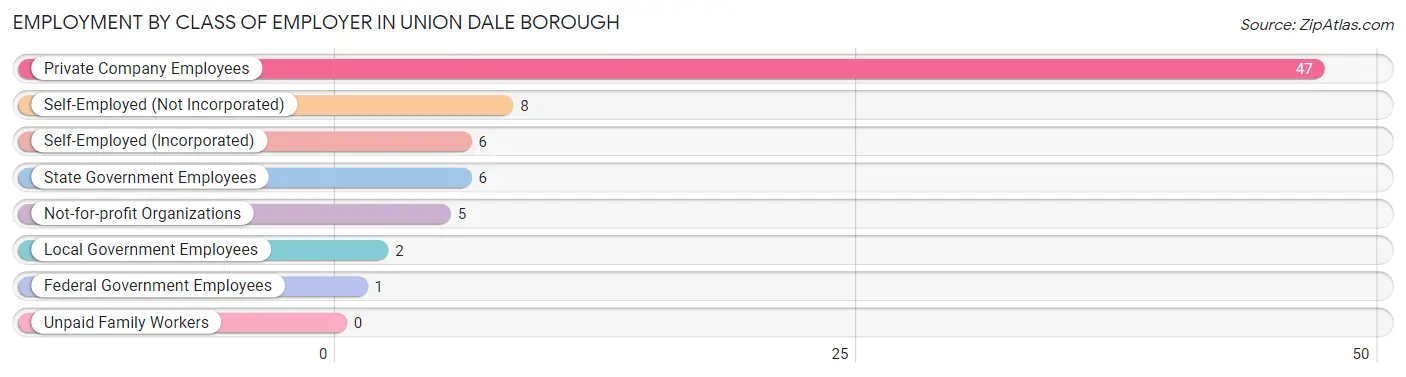
| Employer Class | # Employees | % Employees |
| Private Company Employees | 47 | 62.7% |
| Self-Employed (Incorporated) | 6 | 8.0% |
| Self-Employed (Not Incorporated) | 8 | 10.7% |
| Not-for-profit Organizations | 5 | 6.7% |
| Local Government Employees | 2 | 2.7% |
| State Government Employees | 6 | 8.0% |
| Federal Government Employees | 1 | 1.3% |
| Unpaid Family Workers | 0 | 0.0% |
| Total | 75 | 100.0% |
Employment Status by Age in Union Dale borough
According to the labor force statistics for Union Dale borough, out of the total population over 16 years of age (155), 50.3% or 78 individuals are in the labor force, with 3.8% or 3 of them unemployed. The age group with the highest labor force participation rate is 20 to 24 years, with 100.0% or 8 individuals in the labor force. Within the labor force, the 20 to 24 years age range has the highest percentage of unemployed individuals, with 37.5% or 3 of them being unemployed.
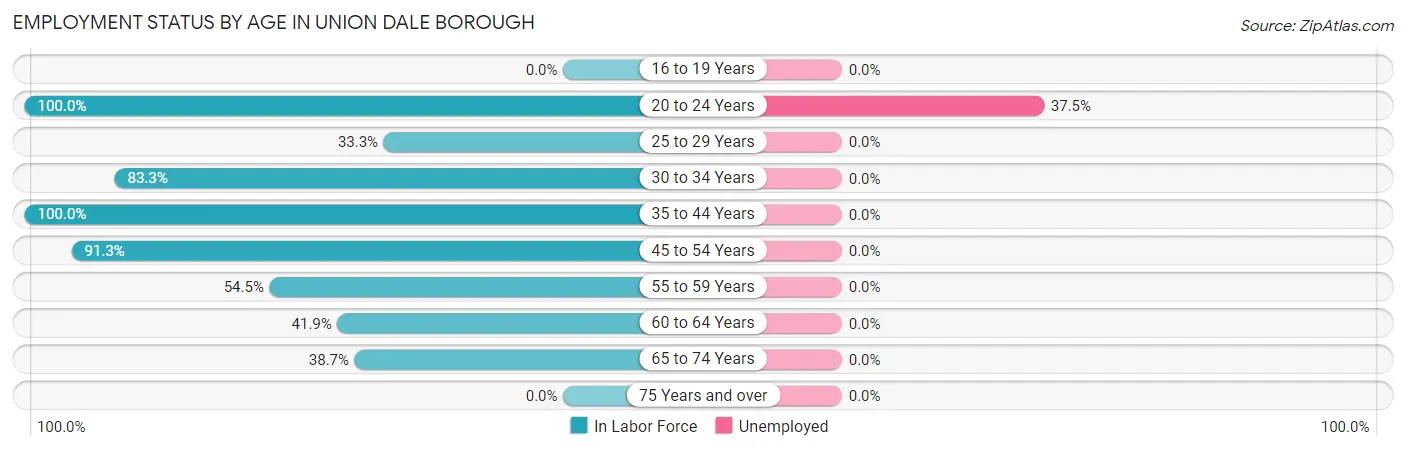
| Age Bracket | In Labor Force | Unemployed |
| 16 to 19 Years | 0 (0.0%) | 0 (0.0%) |
| 20 to 24 Years | 8 (100.0%) | 3 (37.5%) |
| 25 to 29 Years | 2 (33.3%) | 0 (0.0%) |
| 30 to 34 Years | 5 (83.3%) | 0 (0.0%) |
| 35 to 44 Years | 6 (100.0%) | 0 (0.0%) |
| 45 to 54 Years | 21 (91.3%) | 0 (0.0%) |
| 55 to 59 Years | 6 (54.5%) | 0 (0.0%) |
| 60 to 64 Years | 18 (41.9%) | 0 (0.0%) |
| 65 to 74 Years | 12 (38.7%) | 0 (0.0%) |
| 75 Years and over | 0 (0.0%) | 0 (0.0%) |
| Total | 78 (50.3%) | 3 (3.8%) |
Employment Status by Educational Attainment in Union Dale borough
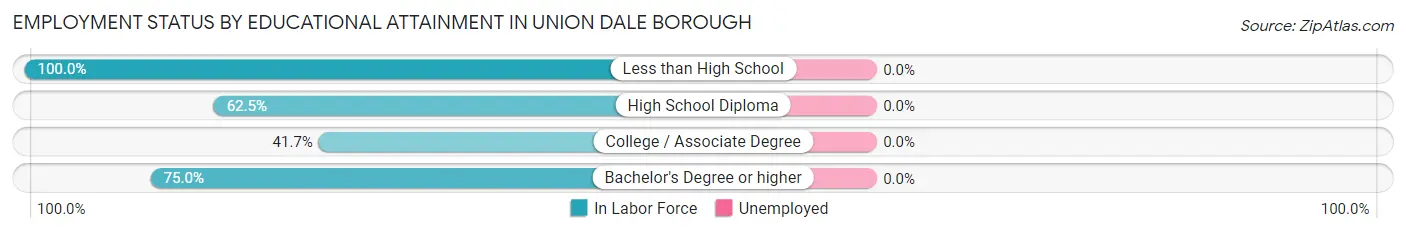
| Educational Attainment | In Labor Force | Unemployed |
| Less than High School | 7 (100.0%) | 0 (0.0%) |
| High School Diploma | 35 (62.5%) | 0 (0.0%) |
| College / Associate Degree | 10 (41.7%) | 0 (0.0%) |
| Bachelor's Degree or higher | 6 (75.0%) | 0 (0.0%) |
| Total | 58 (61.1%) | 0 (0.0%) |
Employment Occupations by Sex in Union Dale borough
Management, Business, Science and Arts Occupations
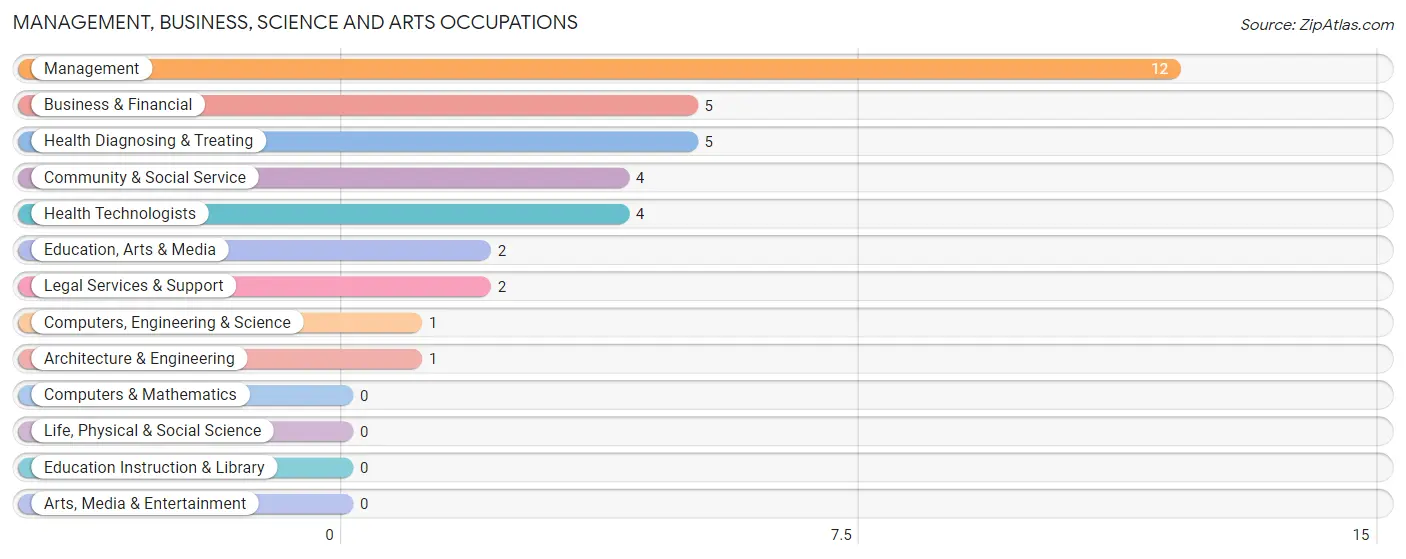
The most common Management, Business, Science and Arts occupations in Union Dale borough are Management (12 | 16.0%), Business & Financial (5 | 6.7%), Health Diagnosing & Treating (5 | 6.7%), Community & Social Service (4 | 5.3%), and Health Technologists (4 | 5.3%).
Management, Business, Science and Arts Occupations by Sex
Within the Management, Business, Science and Arts occupations in Union Dale borough, the most male-oriented occupations are Business & Financial (100.0%), Computers, Engineering & Science (100.0%), and Architecture & Engineering (100.0%), while the most female-oriented occupations are Legal Services & Support (100.0%), Health Diagnosing & Treating (80.0%), and Health Technologists (75.0%).
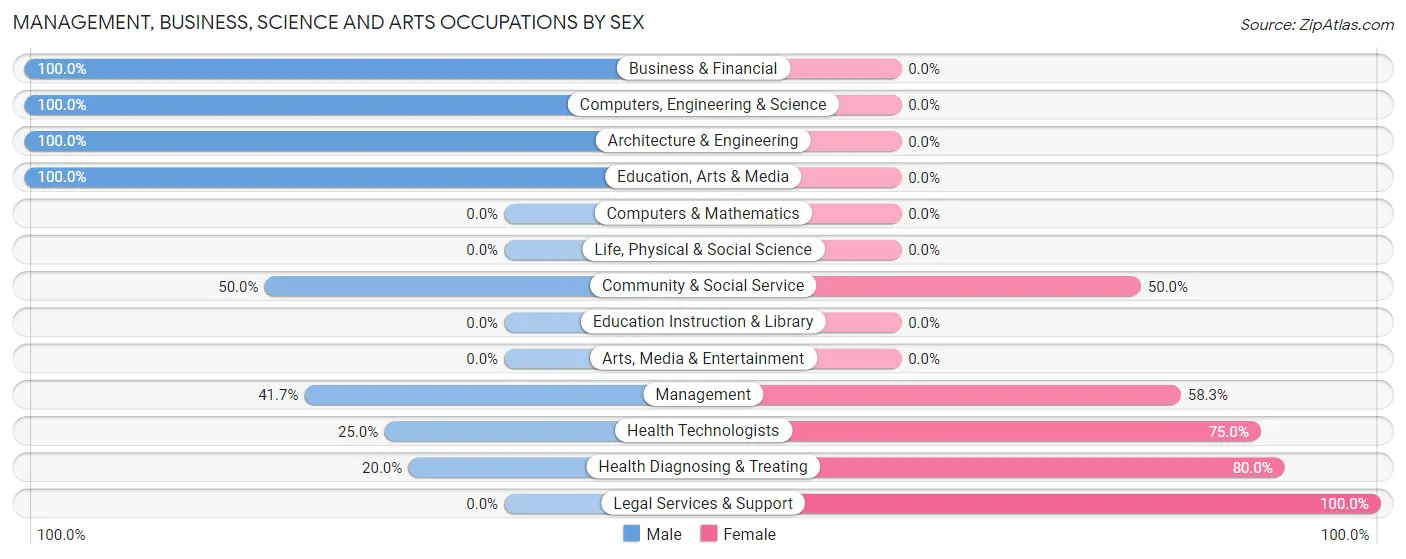
| Occupation | Male | Female |
| Management | 5 (41.7%) | 7 (58.3%) |
| Business & Financial | 5 (100.0%) | 0 (0.0%) |
| Computers, Engineering & Science | 1 (100.0%) | 0 (0.0%) |
| Computers & Mathematics | 0 (0.0%) | 0 (0.0%) |
| Architecture & Engineering | 1 (100.0%) | 0 (0.0%) |
| Life, Physical & Social Science | 0 (0.0%) | 0 (0.0%) |
| Community & Social Service | 2 (50.0%) | 2 (50.0%) |
| Education, Arts & Media | 2 (100.0%) | 0 (0.0%) |
| Legal Services & Support | 0 (0.0%) | 2 (100.0%) |
| Education Instruction & Library | 0 (0.0%) | 0 (0.0%) |
| Arts, Media & Entertainment | 0 (0.0%) | 0 (0.0%) |
| Health Diagnosing & Treating | 1 (20.0%) | 4 (80.0%) |
| Health Technologists | 1 (25.0%) | 3 (75.0%) |
| Total (Category) | 14 (51.8%) | 13 (48.1%) |
| Total (Overall) | 51 (68.0%) | 24 (32.0%) |
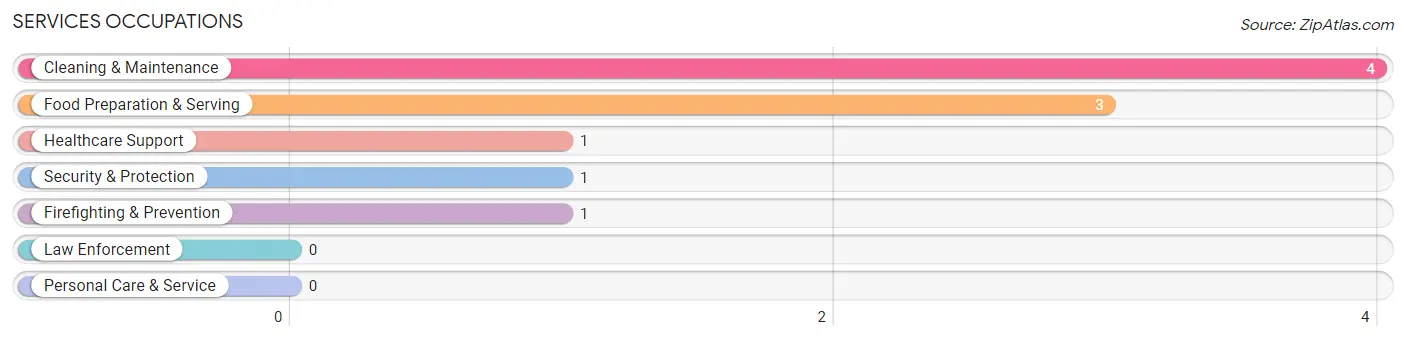
Services Occupations
The most common Services occupations in Union Dale borough are Cleaning & Maintenance (4 | 5.3%), Food Preparation & Serving (3 | 4.0%), Healthcare Support (1 | 1.3%), Security & Protection (1 | 1.3%), and Firefighting & Prevention (1 | 1.3%).
Services Occupations by Sex
Within the Services occupations in Union Dale borough, the most male-oriented occupations are Security & Protection (100.0%), Firefighting & Prevention (100.0%), and Cleaning & Maintenance (100.0%), while the most female-oriented occupations are Healthcare Support (100.0%), and Food Preparation & Serving (100.0%).
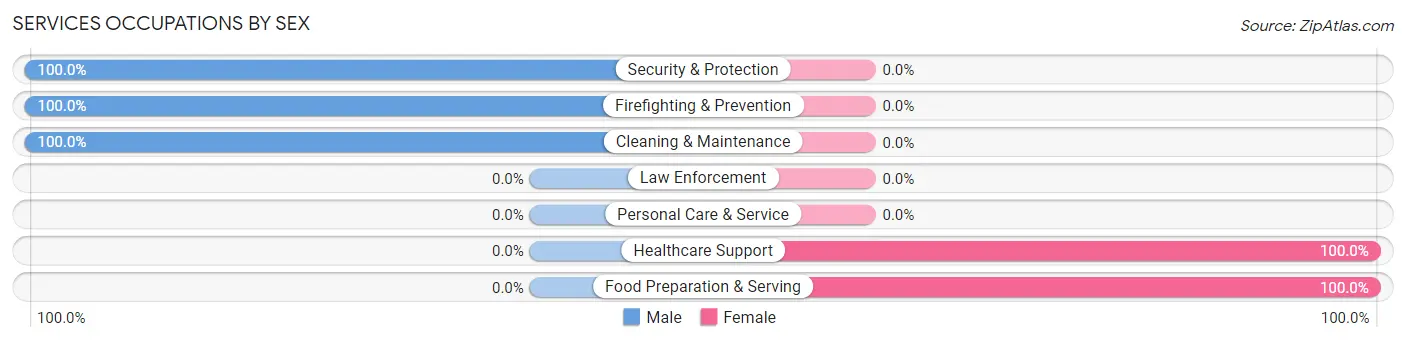
| Occupation | Male | Female |
| Healthcare Support | 0 (0.0%) | 1 (100.0%) |
| Security & Protection | 1 (100.0%) | 0 (0.0%) |
| Firefighting & Prevention | 1 (100.0%) | 0 (0.0%) |
| Law Enforcement | 0 (0.0%) | 0 (0.0%) |
| Food Preparation & Serving | 0 (0.0%) | 3 (100.0%) |
| Cleaning & Maintenance | 4 (100.0%) | 0 (0.0%) |
| Personal Care & Service | 0 (0.0%) | 0 (0.0%) |
| Total (Category) | 5 (55.6%) | 4 (44.4%) |
| Total (Overall) | 51 (68.0%) | 24 (32.0%) |
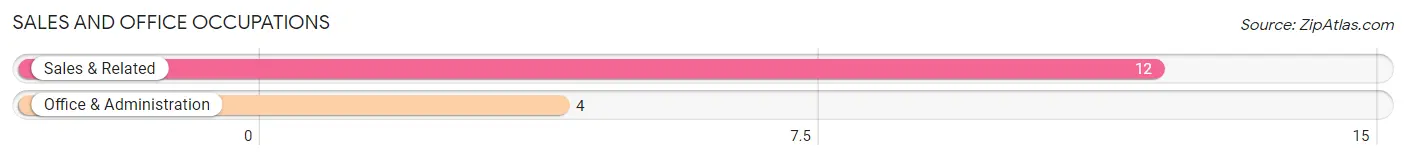
Sales and Office Occupations
The most common Sales and Office occupations in Union Dale borough are Sales & Related (12 | 16.0%), and Office & Administration (4 | 5.3%).
Sales and Office Occupations by Sex
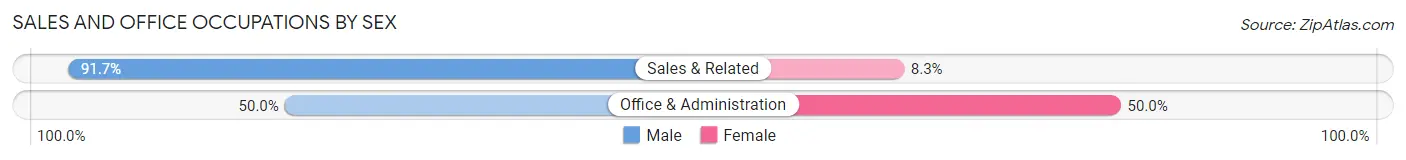
| Occupation | Male | Female |
| Sales & Related | 11 (91.7%) | 1 (8.3%) |
| Office & Administration | 2 (50.0%) | 2 (50.0%) |
| Total (Category) | 13 (81.2%) | 3 (18.8%) |
| Total (Overall) | 51 (68.0%) | 24 (32.0%) |
Natural Resources, Construction and Maintenance Occupations
The most common Natural Resources, Construction and Maintenance occupations in Union Dale borough are Construction & Extraction (5 | 6.7%), and Installation, Maintenance & Repair (2 | 2.7%).
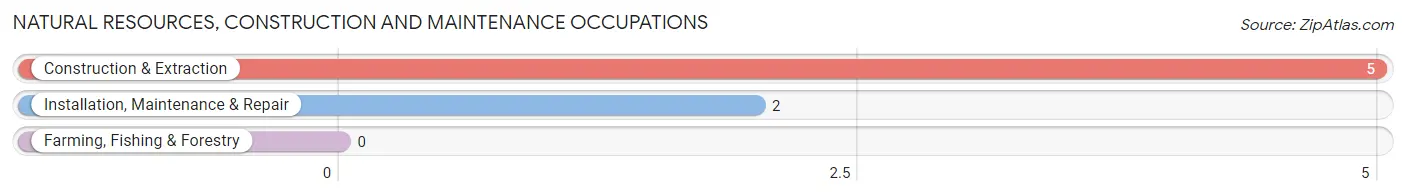
Natural Resources, Construction and Maintenance Occupations by Sex
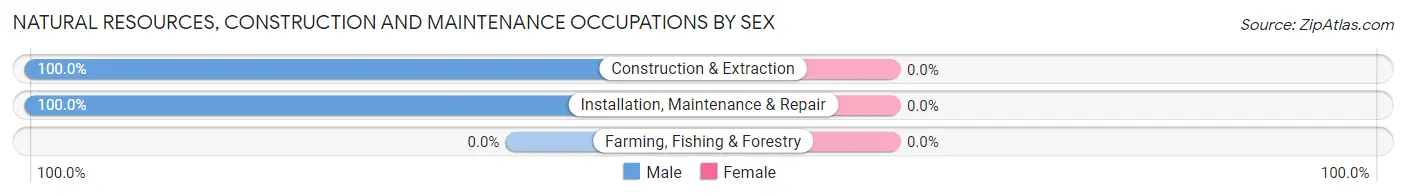
| Occupation | Male | Female |
| Farming, Fishing & Forestry | 0 (0.0%) | 0 (0.0%) |
| Construction & Extraction | 5 (100.0%) | 0 (0.0%) |
| Installation, Maintenance & Repair | 2 (100.0%) | 0 (0.0%) |
| Total (Category) | 7 (100.0%) | 0 (0.0%) |
| Total (Overall) | 51 (68.0%) | 24 (32.0%) |
Production, Transportation and Moving Occupations
The most common Production, Transportation and Moving occupations in Union Dale borough are Material Moving (6 | 8.0%), Production (5 | 6.7%), and Transportation (5 | 6.7%).
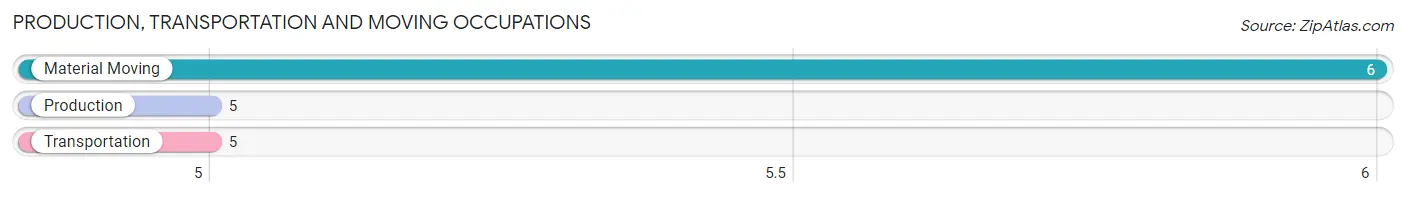
Production, Transportation and Moving Occupations by Sex
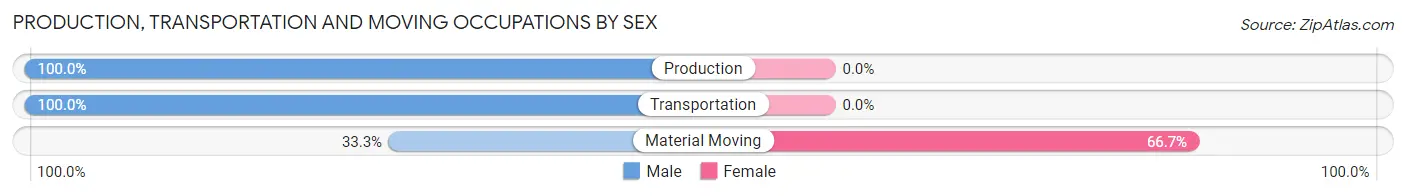
| Occupation | Male | Female |
| Production | 5 (100.0%) | 0 (0.0%) |
| Transportation | 5 (100.0%) | 0 (0.0%) |
| Material Moving | 2 (33.3%) | 4 (66.7%) |
| Total (Category) | 12 (75.0%) | 4 (25.0%) |
| Total (Overall) | 51 (68.0%) | 24 (32.0%) |
Employment Industries by Sex in Union Dale borough
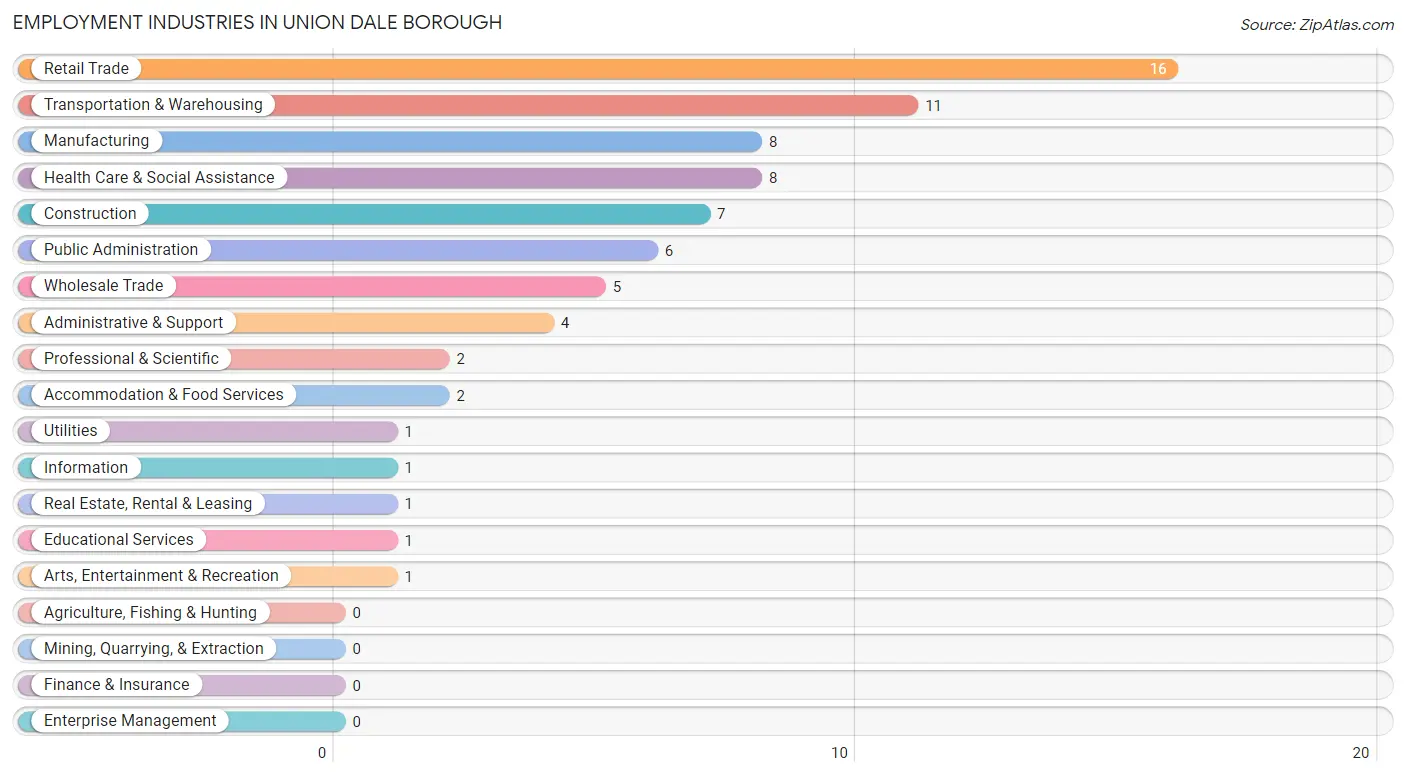
Employment Industries in Union Dale borough
The major employment industries in Union Dale borough include Retail Trade (16 | 21.3%), Transportation & Warehousing (11 | 14.7%), Manufacturing (8 | 10.7%), Health Care & Social Assistance (8 | 10.7%), and Construction (7 | 9.3%).
Employment Industries by Sex in Union Dale borough
The Union Dale borough industries that see more men than women are Construction (100.0%), Wholesale Trade (100.0%), and Utilities (100.0%), whereas the industries that tend to have a higher number of women are Professional & Scientific (100.0%), Educational Services (100.0%), and Accommodation & Food Services (100.0%).
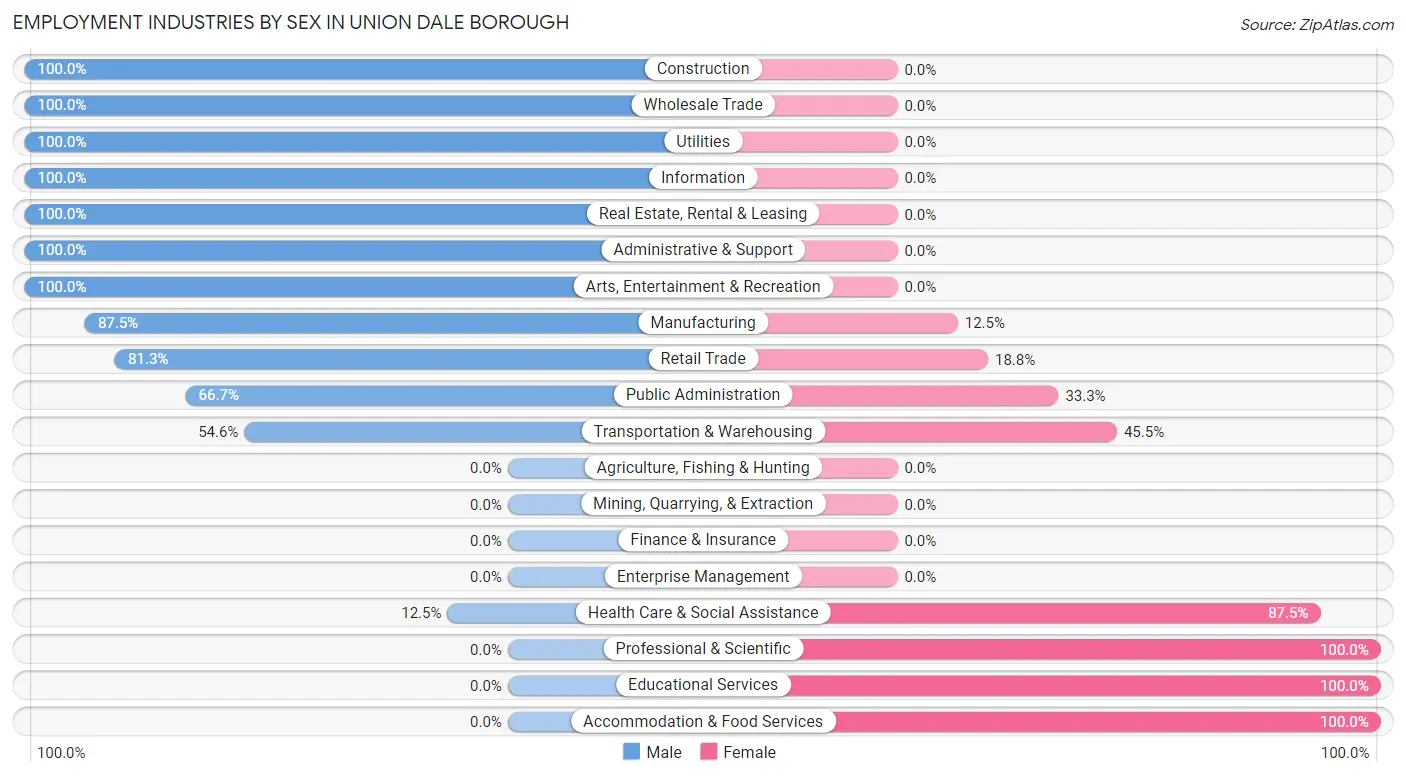
| Industry | Male | Female |
| Agriculture, Fishing & Hunting | 0 (0.0%) | 0 (0.0%) |
| Mining, Quarrying, & Extraction | 0 (0.0%) | 0 (0.0%) |
| Construction | 7 (100.0%) | 0 (0.0%) |
| Manufacturing | 7 (87.5%) | 1 (12.5%) |
| Wholesale Trade | 5 (100.0%) | 0 (0.0%) |
| Retail Trade | 13 (81.2%) | 3 (18.8%) |
| Transportation & Warehousing | 6 (54.5%) | 5 (45.5%) |
| Utilities | 1 (100.0%) | 0 (0.0%) |
| Information | 1 (100.0%) | 0 (0.0%) |
| Finance & Insurance | 0 (0.0%) | 0 (0.0%) |
| Real Estate, Rental & Leasing | 1 (100.0%) | 0 (0.0%) |
| Professional & Scientific | 0 (0.0%) | 2 (100.0%) |
| Enterprise Management | 0 (0.0%) | 0 (0.0%) |
| Administrative & Support | 4 (100.0%) | 0 (0.0%) |
| Educational Services | 0 (0.0%) | 1 (100.0%) |
| Health Care & Social Assistance | 1 (12.5%) | 7 (87.5%) |
| Arts, Entertainment & Recreation | 1 (100.0%) | 0 (0.0%) |
| Accommodation & Food Services | 0 (0.0%) | 2 (100.0%) |
| Public Administration | 4 (66.7%) | 2 (33.3%) |
| Total | 51 (68.0%) | 24 (32.0%) |
Education in Union Dale borough
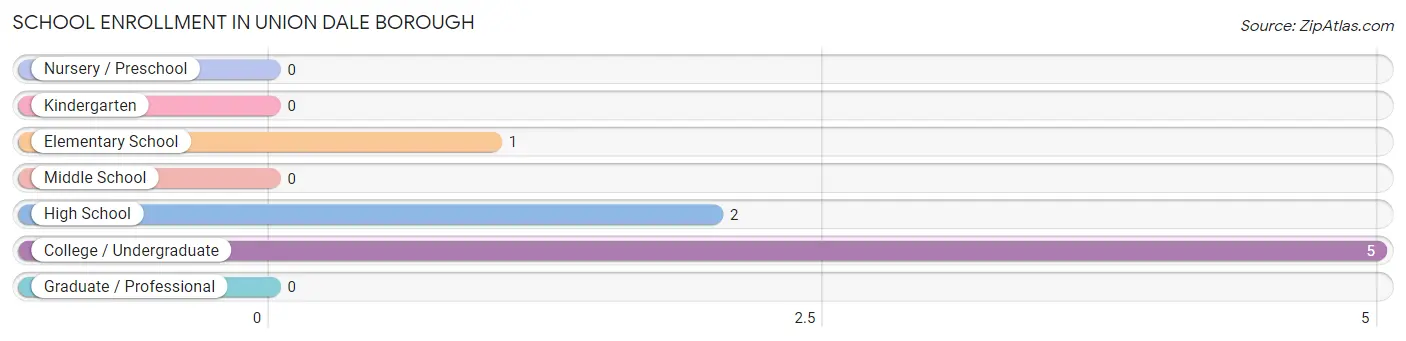
School Enrollment in Union Dale borough
The most common levels of schooling among the 8 students in Union Dale borough are college / undergraduate (5 | 62.5%), high school (2 | 25.0%), and elementary school (1 | 12.5%).
| School Level | # Students | % Students |
| Nursery / Preschool | 0 | 0.0% |
| Kindergarten | 0 | 0.0% |
| Elementary School | 1 | 12.5% |
| Middle School | 0 | 0.0% |
| High School | 2 | 25.0% |
| College / Undergraduate | 5 | 62.5% |
| Graduate / Professional | 0 | 0.0% |
| Total | 8 | 100.0% |
School Enrollment by Age by Funding Source in Union Dale borough
Out of a total of 8 students who are enrolled in schools in Union Dale borough, 2 (25.0%) attend a private institution, while the remaining 6 (75.0%) are enrolled in public schools. The age group of 20 to 24 year olds has the highest likelihood of being enrolled in private schools, with 2 (100.0% in the age bracket) enrolled. Conversely, the age group of 10 to 14 year olds has the lowest likelihood of being enrolled in a private school, with 1 (100.0% in the age bracket) attending a public institution.
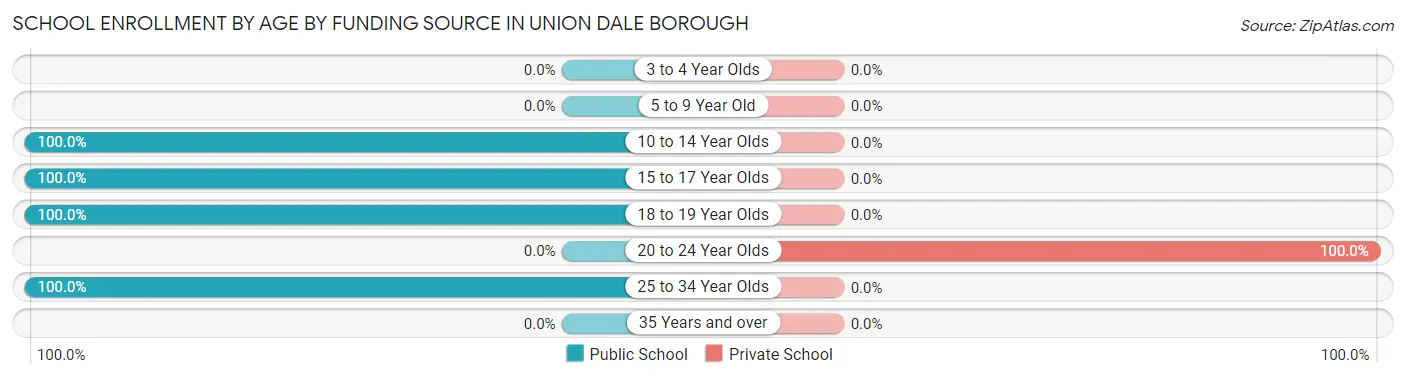
| Age Bracket | Public School | Private School |
| 3 to 4 Year Olds | 0 (0.0%) | 0 (0.0%) |
| 5 to 9 Year Old | 0 (0.0%) | 0 (0.0%) |
| 10 to 14 Year Olds | 1 (100.0%) | 0 (0.0%) |
| 15 to 17 Year Olds | 2 (100.0%) | 0 (0.0%) |
| 18 to 19 Year Olds | 2 (100.0%) | 0 (0.0%) |
| 20 to 24 Year Olds | 0 (0.0%) | 2 (100.0%) |
| 25 to 34 Year Olds | 1 (100.0%) | 0 (0.0%) |
| 35 Years and over | 0 (0.0%) | 0 (0.0%) |
| Total | 6 (75.0%) | 2 (25.0%) |
Educational Attainment by Field of Study in Union Dale borough
Liberal arts & history (6 | 28.6%), science & technology (4 | 19.1%), business (3 | 14.3%), literature & languages (3 | 14.3%), and computers & mathematics (2 | 9.5%) are the most common fields of study among 21 individuals in Union Dale borough who have obtained a bachelor's degree or higher.
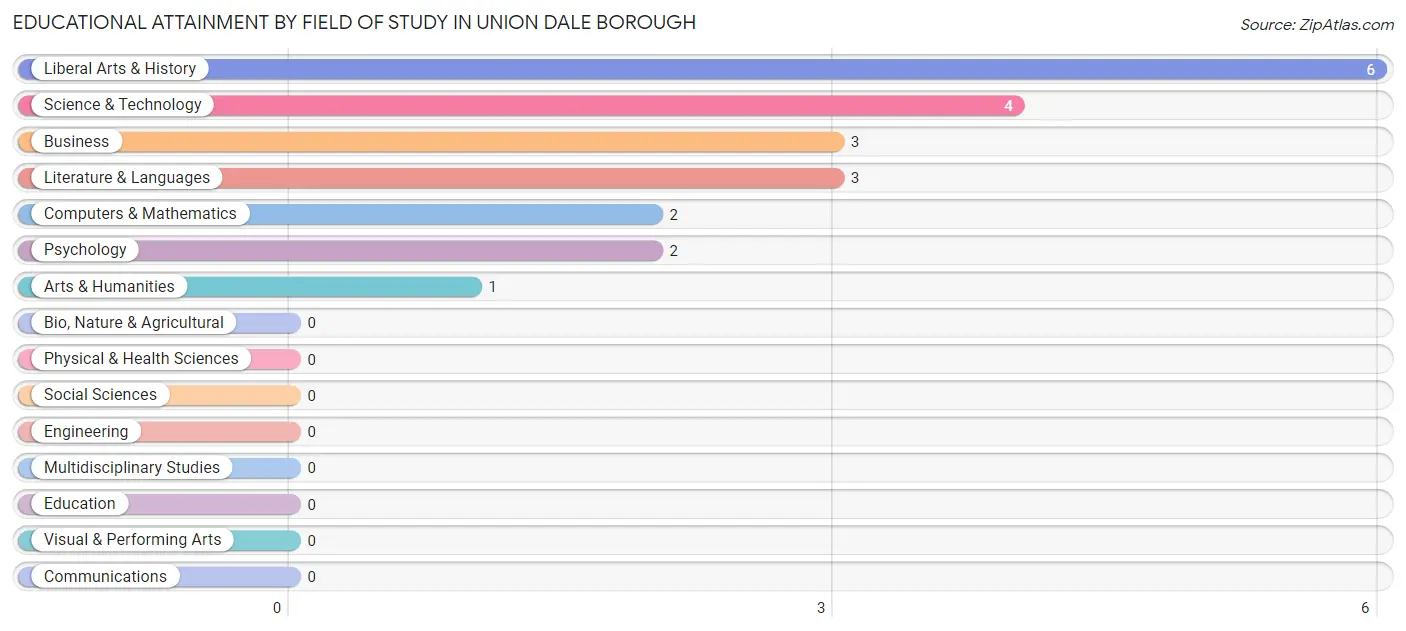
| Field of Study | # Graduates | % Graduates |
| Computers & Mathematics | 2 | 9.5% |
| Bio, Nature & Agricultural | 0 | 0.0% |
| Physical & Health Sciences | 0 | 0.0% |
| Psychology | 2 | 9.5% |
| Social Sciences | 0 | 0.0% |
| Engineering | 0 | 0.0% |
| Multidisciplinary Studies | 0 | 0.0% |
| Science & Technology | 4 | 19.1% |
| Business | 3 | 14.3% |
| Education | 0 | 0.0% |
| Literature & Languages | 3 | 14.3% |
| Liberal Arts & History | 6 | 28.6% |
| Visual & Performing Arts | 0 | 0.0% |
| Communications | 0 | 0.0% |
| Arts & Humanities | 1 | 4.8% |
| Total | 21 | 100.0% |
Transportation & Commute in Union Dale borough
Vehicle Availability by Sex in Union Dale borough
The most prevalent vehicle ownership categories in Union Dale borough are males with 2 vehicles (29, accounting for 56.9%) and females with 2 vehicles (15, making up 120.8%).
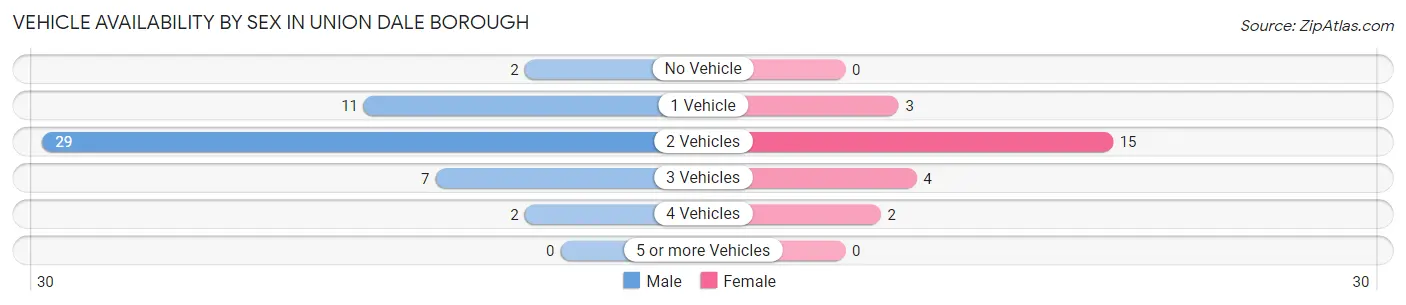
| Vehicles Available | Male | Female |
| No Vehicle | 2 (3.9%) | 0 (0.0%) |
| 1 Vehicle | 11 (21.6%) | 3 (12.5%) |
| 2 Vehicles | 29 (56.9%) | 15 (62.5%) |
| 3 Vehicles | 7 (13.7%) | 4 (16.7%) |
| 4 Vehicles | 2 (3.9%) | 2 (8.3%) |
| 5 or more Vehicles | 0 (0.0%) | 0 (0.0%) |
| Total | 51 (100.0%) | 24 (100.0%) |
Commute Time in Union Dale borough
The most frequently occuring commute durations in Union Dale borough are 20 to 24 minutes (23 commuters, 31.5%), 35 to 39 minutes (12 commuters, 16.4%), and 45 to 59 minutes (10 commuters, 13.7%).
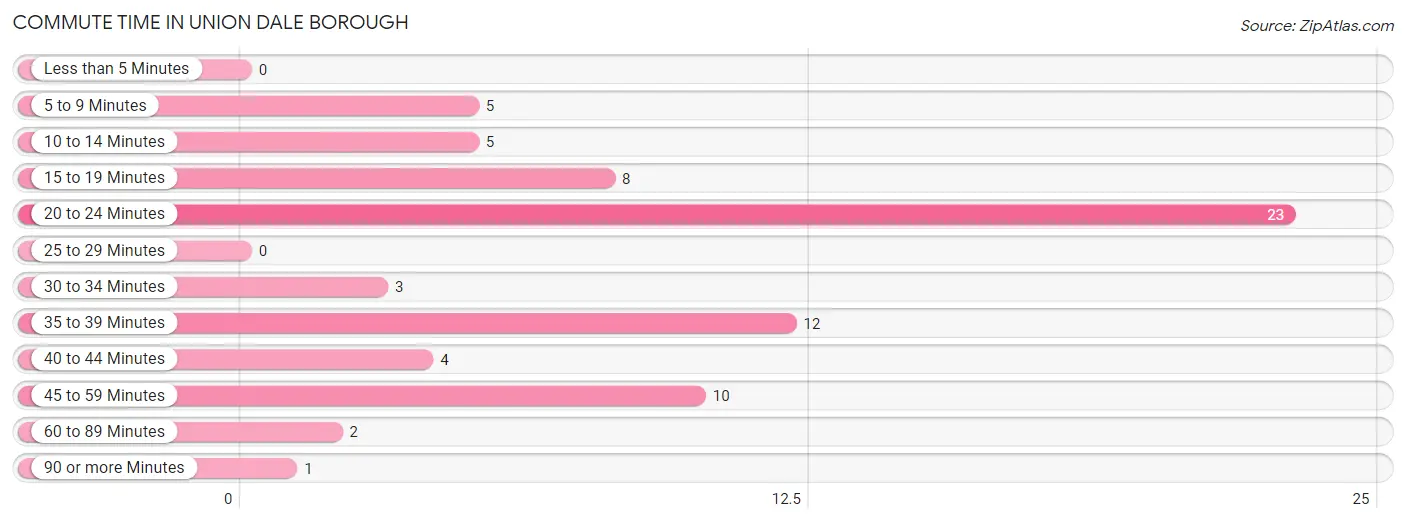
| Commute Time | # Commuters | % Commuters |
| Less than 5 Minutes | 0 | 0.0% |
| 5 to 9 Minutes | 5 | 6.9% |
| 10 to 14 Minutes | 5 | 6.9% |
| 15 to 19 Minutes | 8 | 11.0% |
| 20 to 24 Minutes | 23 | 31.5% |
| 25 to 29 Minutes | 0 | 0.0% |
| 30 to 34 Minutes | 3 | 4.1% |
| 35 to 39 Minutes | 12 | 16.4% |
| 40 to 44 Minutes | 4 | 5.5% |
| 45 to 59 Minutes | 10 | 13.7% |
| 60 to 89 Minutes | 2 | 2.7% |
| 90 or more Minutes | 1 | 1.4% |
Commute Time by Sex in Union Dale borough
The most common commute times in Union Dale borough are 20 to 24 minutes (17 commuters, 34.7%) for males and 20 to 24 minutes (6 commuters, 25.0%) for females.
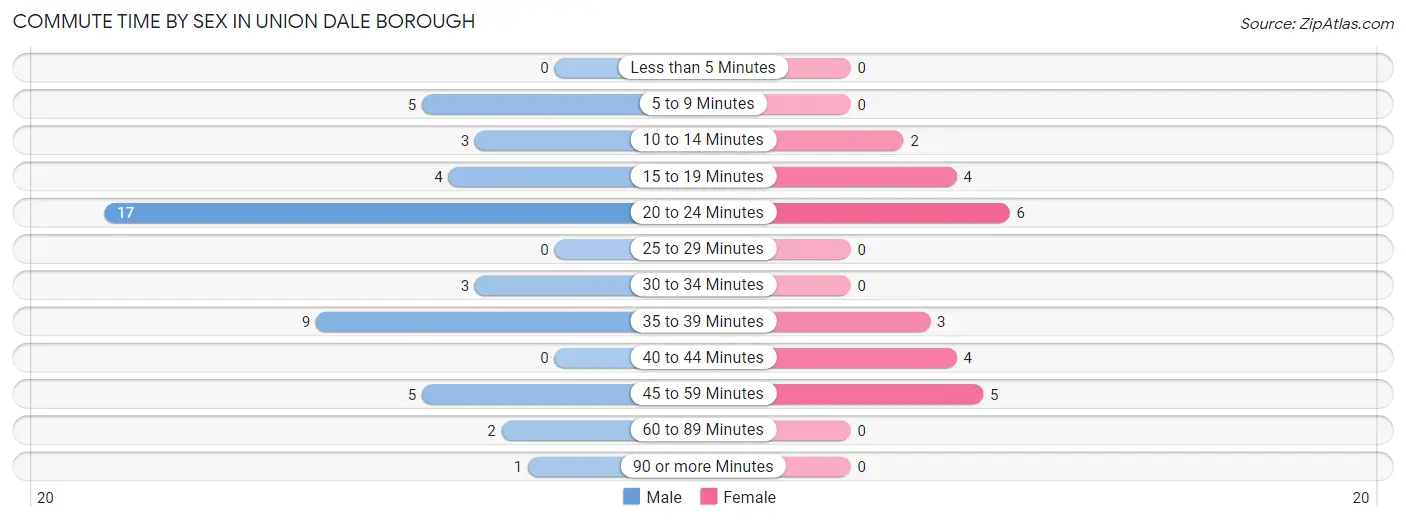
| Commute Time | Male | Female |
| Less than 5 Minutes | 0 (0.0%) | 0 (0.0%) |
| 5 to 9 Minutes | 5 (10.2%) | 0 (0.0%) |
| 10 to 14 Minutes | 3 (6.1%) | 2 (8.3%) |
| 15 to 19 Minutes | 4 (8.2%) | 4 (16.7%) |
| 20 to 24 Minutes | 17 (34.7%) | 6 (25.0%) |
| 25 to 29 Minutes | 0 (0.0%) | 0 (0.0%) |
| 30 to 34 Minutes | 3 (6.1%) | 0 (0.0%) |
| 35 to 39 Minutes | 9 (18.4%) | 3 (12.5%) |
| 40 to 44 Minutes | 0 (0.0%) | 4 (16.7%) |
| 45 to 59 Minutes | 5 (10.2%) | 5 (20.8%) |
| 60 to 89 Minutes | 2 (4.1%) | 0 (0.0%) |
| 90 or more Minutes | 1 (2.0%) | 0 (0.0%) |
Time of Departure to Work by Sex in Union Dale borough
The most frequent times of departure to work in Union Dale borough are 5:30 AM to 5:59 AM (9, 18.4%) for males and 5:30 AM to 5:59 AM (5, 20.8%) for females.
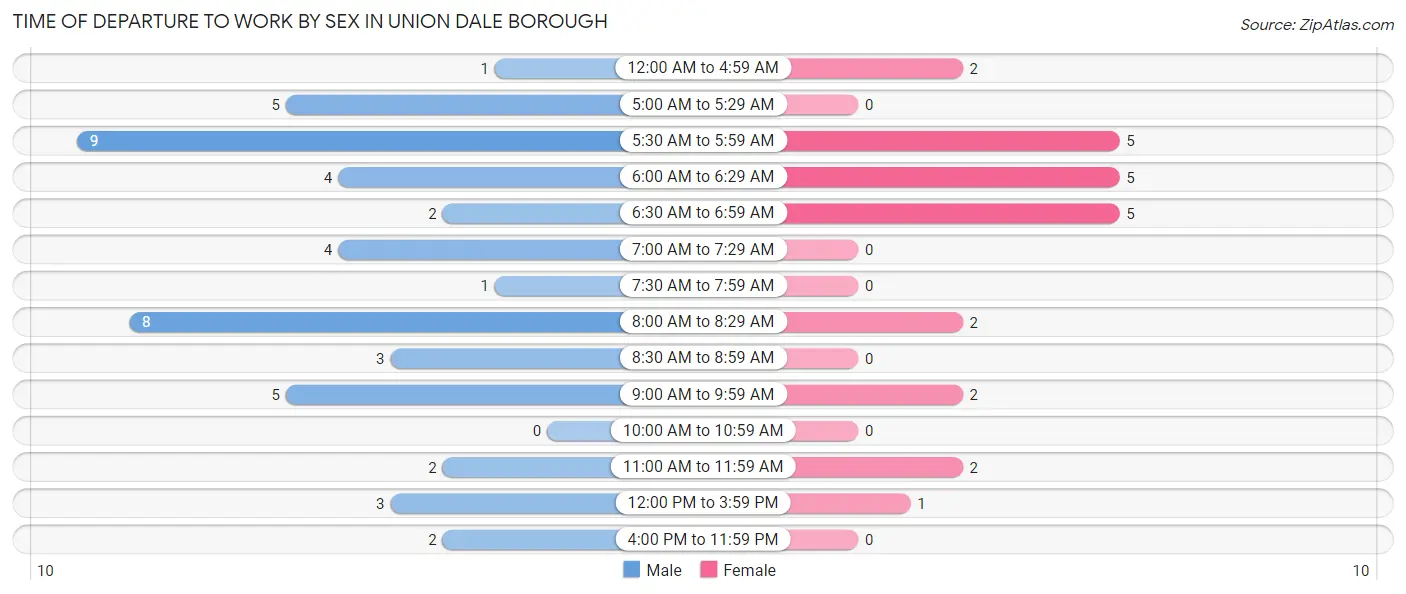
| Time of Departure | Male | Female |
| 12:00 AM to 4:59 AM | 1 (2.0%) | 2 (8.3%) |
| 5:00 AM to 5:29 AM | 5 (10.2%) | 0 (0.0%) |
| 5:30 AM to 5:59 AM | 9 (18.4%) | 5 (20.8%) |
| 6:00 AM to 6:29 AM | 4 (8.2%) | 5 (20.8%) |
| 6:30 AM to 6:59 AM | 2 (4.1%) | 5 (20.8%) |
| 7:00 AM to 7:29 AM | 4 (8.2%) | 0 (0.0%) |
| 7:30 AM to 7:59 AM | 1 (2.0%) | 0 (0.0%) |
| 8:00 AM to 8:29 AM | 8 (16.3%) | 2 (8.3%) |
| 8:30 AM to 8:59 AM | 3 (6.1%) | 0 (0.0%) |
| 9:00 AM to 9:59 AM | 5 (10.2%) | 2 (8.3%) |
| 10:00 AM to 10:59 AM | 0 (0.0%) | 0 (0.0%) |
| 11:00 AM to 11:59 AM | 2 (4.1%) | 2 (8.3%) |
| 12:00 PM to 3:59 PM | 3 (6.1%) | 1 (4.2%) |
| 4:00 PM to 11:59 PM | 2 (4.1%) | 0 (0.0%) |
| Total | 49 (100.0%) | 24 (100.0%) |
Housing Occupancy in Union Dale borough
Occupancy by Ownership in Union Dale borough
Of the total 91 dwellings in Union Dale borough, owner-occupied units account for 80 (87.9%), while renter-occupied units make up 11 (12.1%).
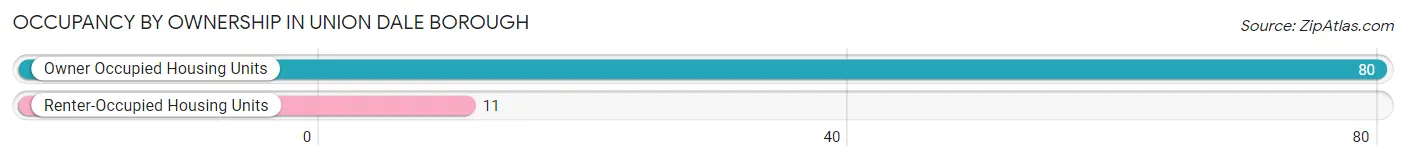
| Occupancy | # Housing Units | % Housing Units |
| Owner Occupied Housing Units | 80 | 87.9% |
| Renter-Occupied Housing Units | 11 | 12.1% |
| Total Occupied Housing Units | 91 | 100.0% |
Occupancy by Household Size in Union Dale borough
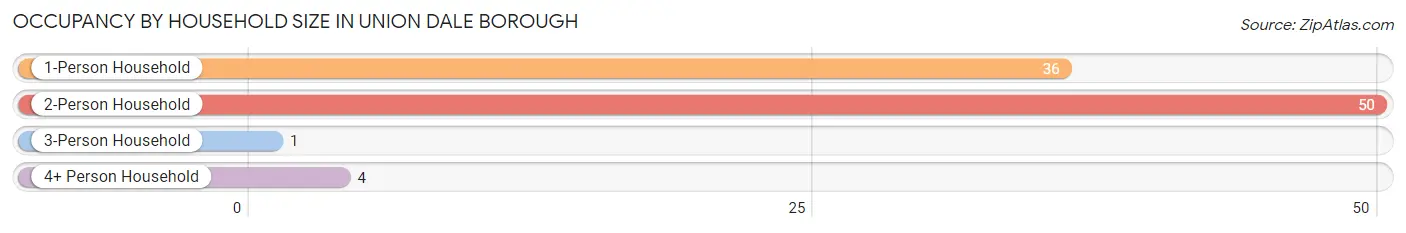
| Household Size | # Housing Units | % Housing Units |
| 1-Person Household | 36 | 39.6% |
| 2-Person Household | 50 | 54.9% |
| 3-Person Household | 1 | 1.1% |
| 4+ Person Household | 4 | 4.4% |
| Total Housing Units | 91 | 100.0% |
Occupancy by Ownership by Household Size in Union Dale borough
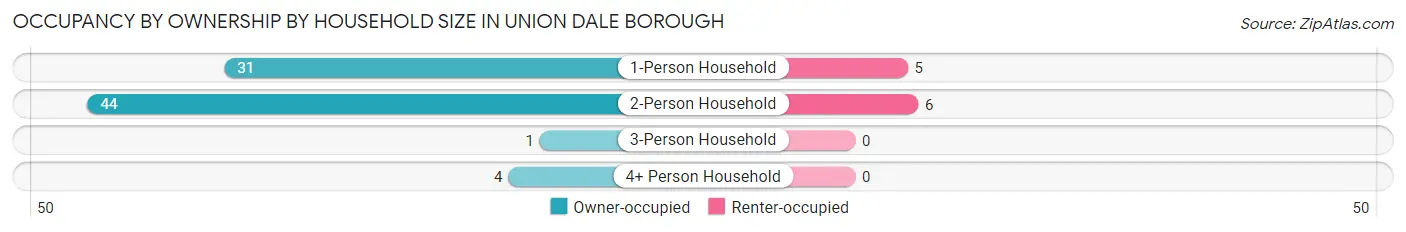
| Household Size | Owner-occupied | Renter-occupied |
| 1-Person Household | 31 (86.1%) | 5 (13.9%) |
| 2-Person Household | 44 (88.0%) | 6 (12.0%) |
| 3-Person Household | 1 (100.0%) | 0 (0.0%) |
| 4+ Person Household | 4 (100.0%) | 0 (0.0%) |
| Total Housing Units | 80 (87.9%) | 11 (12.1%) |
Occupancy by Educational Attainment in Union Dale borough
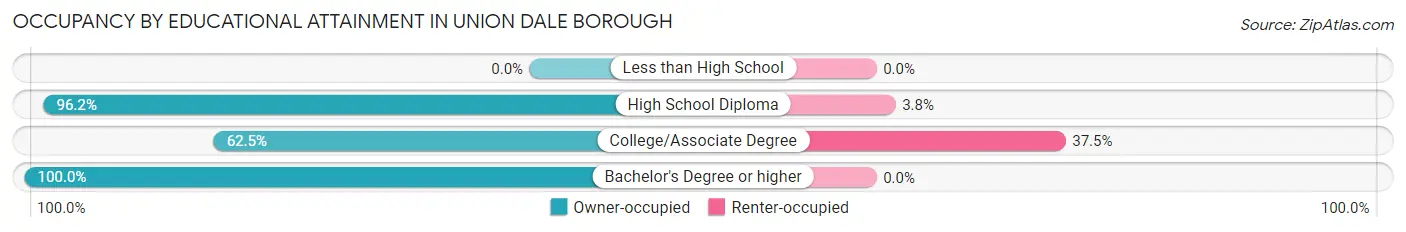
| Household Size | Owner-occupied | Renter-occupied |
| Less than High School | 0 (0.0%) | 0 (0.0%) |
| High School Diploma | 51 (96.2%) | 2 (3.8%) |
| College/Associate Degree | 15 (62.5%) | 9 (37.5%) |
| Bachelor's Degree or higher | 14 (100.0%) | 0 (0.0%) |
Occupancy by Age of Householder in Union Dale borough
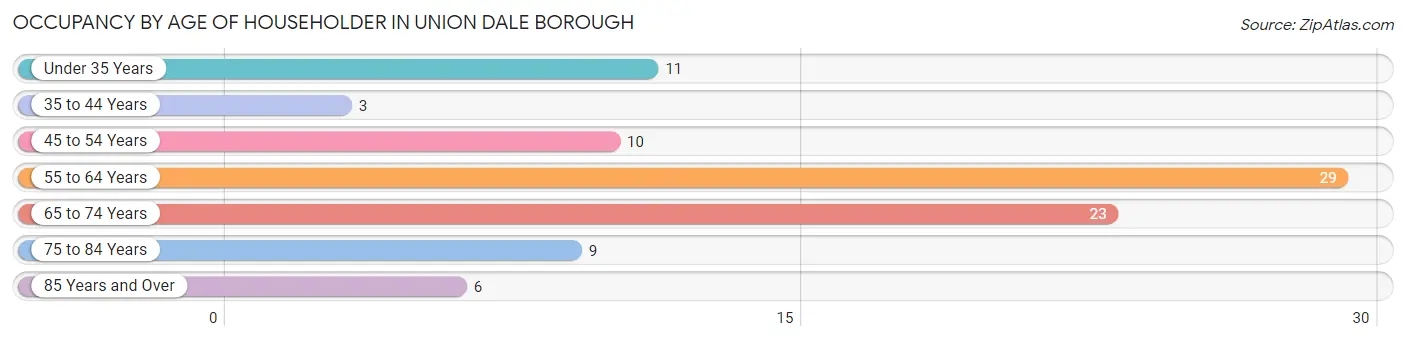
| Age Bracket | # Households | % Households |
| Under 35 Years | 11 | 12.1% |
| 35 to 44 Years | 3 | 3.3% |
| 45 to 54 Years | 10 | 11.0% |
| 55 to 64 Years | 29 | 31.9% |
| 65 to 74 Years | 23 | 25.3% |
| 75 to 84 Years | 9 | 9.9% |
| 85 Years and Over | 6 | 6.6% |
| Total | 91 | 100.0% |
Housing Finances in Union Dale borough
Median Income by Occupancy in Union Dale borough
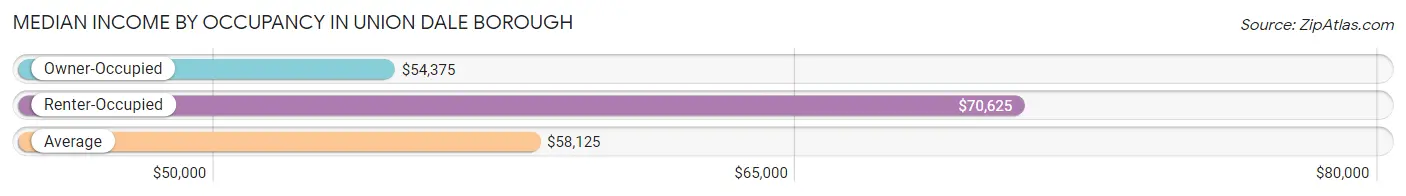
| Occupancy Type | # Households | Median Income |
| Owner-Occupied | 80 (87.9%) | $54,375 |
| Renter-Occupied | 11 (12.1%) | $70,625 |
| Average | 91 (100.0%) | $58,125 |
Occupancy by Householder Income Bracket in Union Dale borough
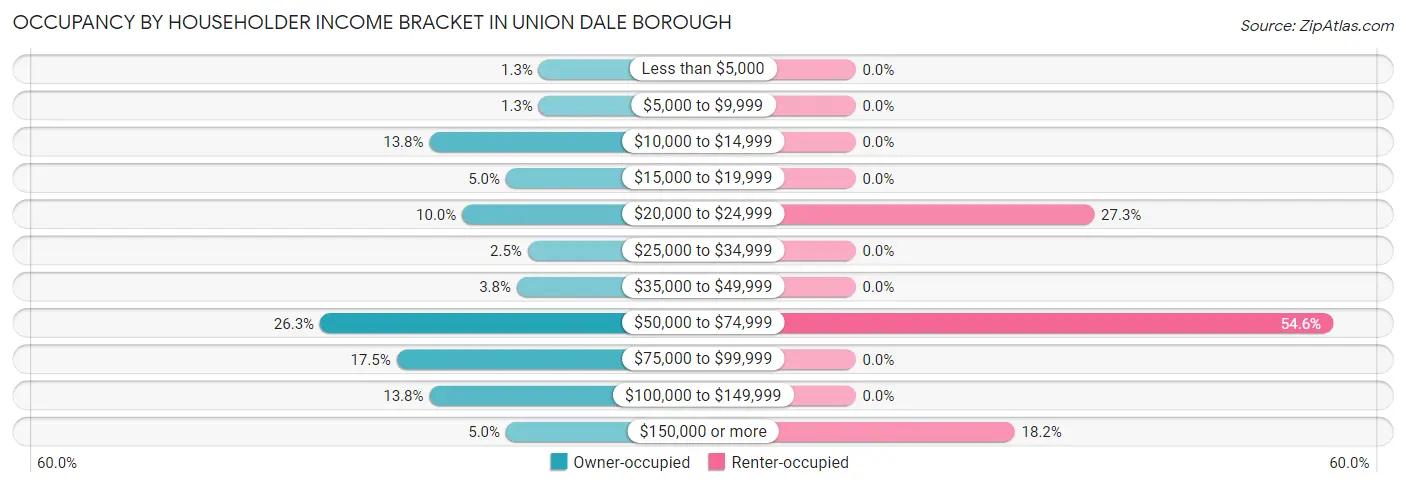
| Income Bracket | Owner-occupied | Renter-occupied |
| Less than $5,000 | 1 (1.3%) | 0 (0.0%) |
| $5,000 to $9,999 | 1 (1.3%) | 0 (0.0%) |
| $10,000 to $14,999 | 11 (13.8%) | 0 (0.0%) |
| $15,000 to $19,999 | 4 (5.0%) | 0 (0.0%) |
| $20,000 to $24,999 | 8 (10.0%) | 3 (27.3%) |
| $25,000 to $34,999 | 2 (2.5%) | 0 (0.0%) |
| $35,000 to $49,999 | 3 (3.7%) | 0 (0.0%) |
| $50,000 to $74,999 | 21 (26.3%) | 6 (54.5%) |
| $75,000 to $99,999 | 14 (17.5%) | 0 (0.0%) |
| $100,000 to $149,999 | 11 (13.8%) | 0 (0.0%) |
| $150,000 or more | 4 (5.0%) | 2 (18.2%) |
| Total | 80 (100.0%) | 11 (100.0%) |
Monthly Housing Cost Tiers in Union Dale borough
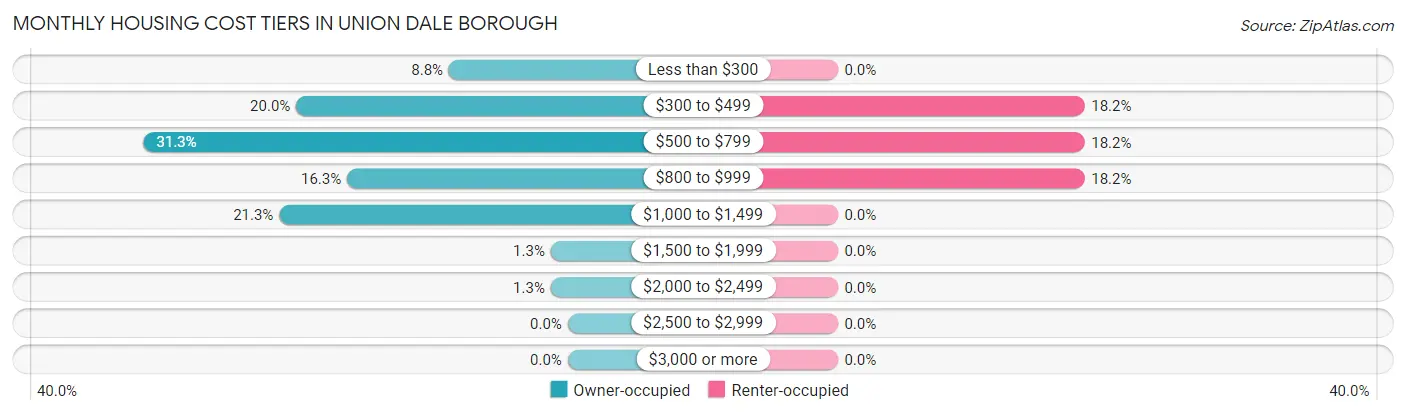
| Monthly Cost | Owner-occupied | Renter-occupied |
| Less than $300 | 7 (8.7%) | 0 (0.0%) |
| $300 to $499 | 16 (20.0%) | 2 (18.2%) |
| $500 to $799 | 25 (31.2%) | 2 (18.2%) |
| $800 to $999 | 13 (16.3%) | 2 (18.2%) |
| $1,000 to $1,499 | 17 (21.2%) | 0 (0.0%) |
| $1,500 to $1,999 | 1 (1.3%) | 0 (0.0%) |
| $2,000 to $2,499 | 1 (1.3%) | 0 (0.0%) |
| $2,500 to $2,999 | 0 (0.0%) | 0 (0.0%) |
| $3,000 or more | 0 (0.0%) | 0 (0.0%) |
| Total | 80 (100.0%) | 11 (100.0%) |
Physical Housing Characteristics in Union Dale borough
Housing Structures in Union Dale borough
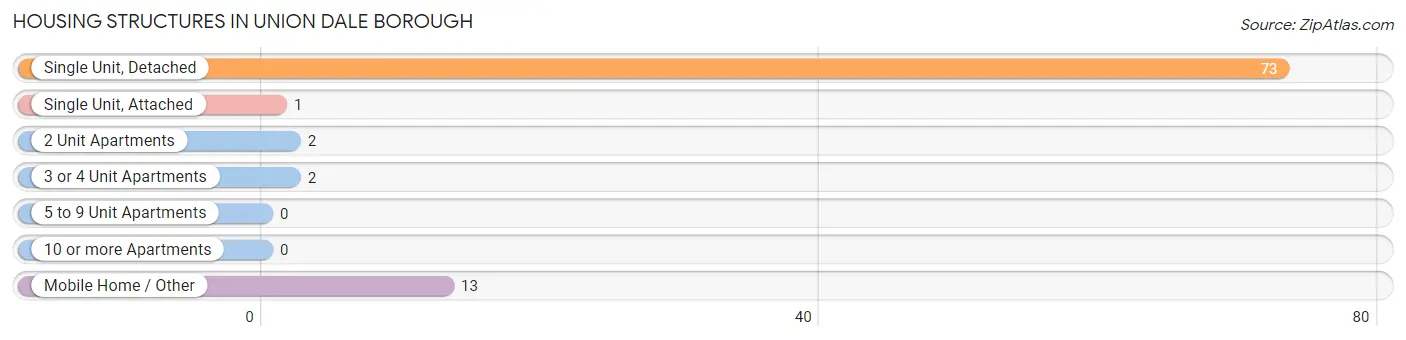
| Structure Type | # Housing Units | % Housing Units |
| Single Unit, Detached | 73 | 80.2% |
| Single Unit, Attached | 1 | 1.1% |
| 2 Unit Apartments | 2 | 2.2% |
| 3 or 4 Unit Apartments | 2 | 2.2% |
| 5 to 9 Unit Apartments | 0 | 0.0% |
| 10 or more Apartments | 0 | 0.0% |
| Mobile Home / Other | 13 | 14.3% |
| Total | 91 | 100.0% |
Housing Structures by Occupancy in Union Dale borough
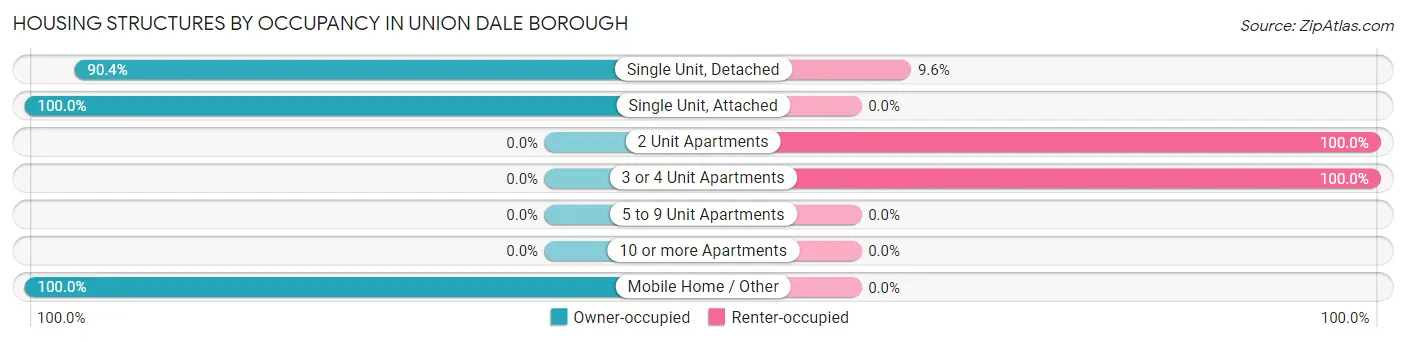
| Structure Type | Owner-occupied | Renter-occupied |
| Single Unit, Detached | 66 (90.4%) | 7 (9.6%) |
| Single Unit, Attached | 1 (100.0%) | 0 (0.0%) |
| 2 Unit Apartments | 0 (0.0%) | 2 (100.0%) |
| 3 or 4 Unit Apartments | 0 (0.0%) | 2 (100.0%) |
| 5 to 9 Unit Apartments | 0 (0.0%) | 0 (0.0%) |
| 10 or more Apartments | 0 (0.0%) | 0 (0.0%) |
| Mobile Home / Other | 13 (100.0%) | 0 (0.0%) |
| Total | 80 (87.9%) | 11 (12.1%) |
Housing Structures by Number of Rooms in Union Dale borough
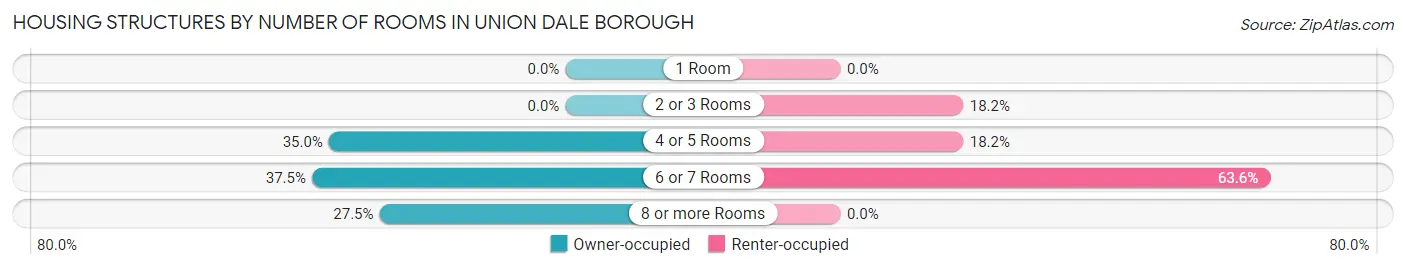
| Number of Rooms | Owner-occupied | Renter-occupied |
| 1 Room | 0 (0.0%) | 0 (0.0%) |
| 2 or 3 Rooms | 0 (0.0%) | 2 (18.2%) |
| 4 or 5 Rooms | 28 (35.0%) | 2 (18.2%) |
| 6 or 7 Rooms | 30 (37.5%) | 7 (63.6%) |
| 8 or more Rooms | 22 (27.5%) | 0 (0.0%) |
| Total | 80 (100.0%) | 11 (100.0%) |
Housing Structure by Heating Type in Union Dale borough
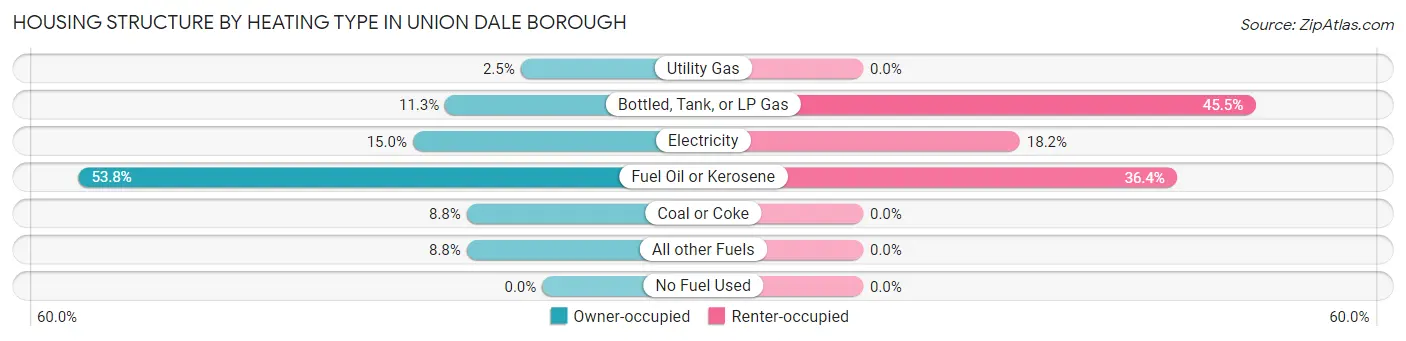
| Heating Type | Owner-occupied | Renter-occupied |
| Utility Gas | 2 (2.5%) | 0 (0.0%) |
| Bottled, Tank, or LP Gas | 9 (11.3%) | 5 (45.5%) |
| Electricity | 12 (15.0%) | 2 (18.2%) |
| Fuel Oil or Kerosene | 43 (53.7%) | 4 (36.4%) |
| Coal or Coke | 7 (8.7%) | 0 (0.0%) |
| All other Fuels | 7 (8.7%) | 0 (0.0%) |
| No Fuel Used | 0 (0.0%) | 0 (0.0%) |
| Total | 80 (100.0%) | 11 (100.0%) |
Household Vehicle Usage in Union Dale borough
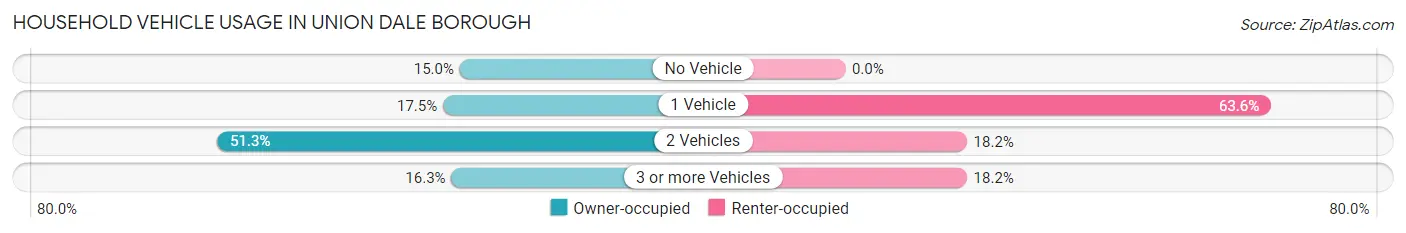
| Vehicles per Household | Owner-occupied | Renter-occupied |
| No Vehicle | 12 (15.0%) | 0 (0.0%) |
| 1 Vehicle | 14 (17.5%) | 7 (63.6%) |
| 2 Vehicles | 41 (51.2%) | 2 (18.2%) |
| 3 or more Vehicles | 13 (16.3%) | 2 (18.2%) |
| Total | 80 (100.0%) | 11 (100.0%) |
Real Estate & Mortgages in Union Dale borough
Real Estate and Mortgage Overview in Union Dale borough
| Characteristic | Without Mortgage | With Mortgage |
| Housing Units | 51 | 29 |
| Median Property Value | $187,500 | $146,900 |
| Median Household Income | $53,125 | $2 |
| Monthly Housing Costs | $531 | $0 |
| Real Estate Taxes | $2,063 | $0 |
Property Value by Mortgage Status in Union Dale borough
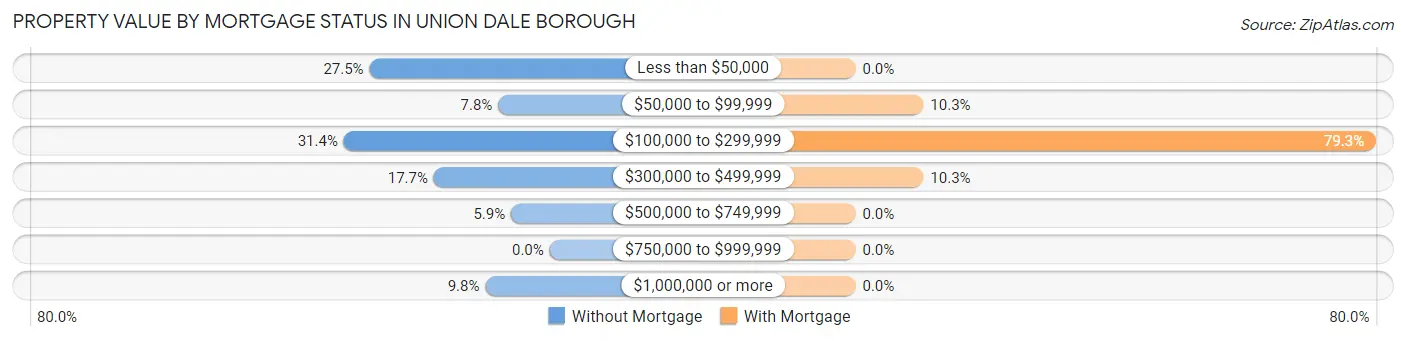
| Property Value | Without Mortgage | With Mortgage |
| Less than $50,000 | 14 (27.5%) | 0 (0.0%) |
| $50,000 to $99,999 | 4 (7.8%) | 3 (10.3%) |
| $100,000 to $299,999 | 16 (31.4%) | 23 (79.3%) |
| $300,000 to $499,999 | 9 (17.6%) | 3 (10.3%) |
| $500,000 to $749,999 | 3 (5.9%) | 0 (0.0%) |
| $750,000 to $999,999 | 0 (0.0%) | 0 (0.0%) |
| $1,000,000 or more | 5 (9.8%) | 0 (0.0%) |
| Total | 51 (100.0%) | 29 (100.0%) |
Household Income by Mortgage Status in Union Dale borough
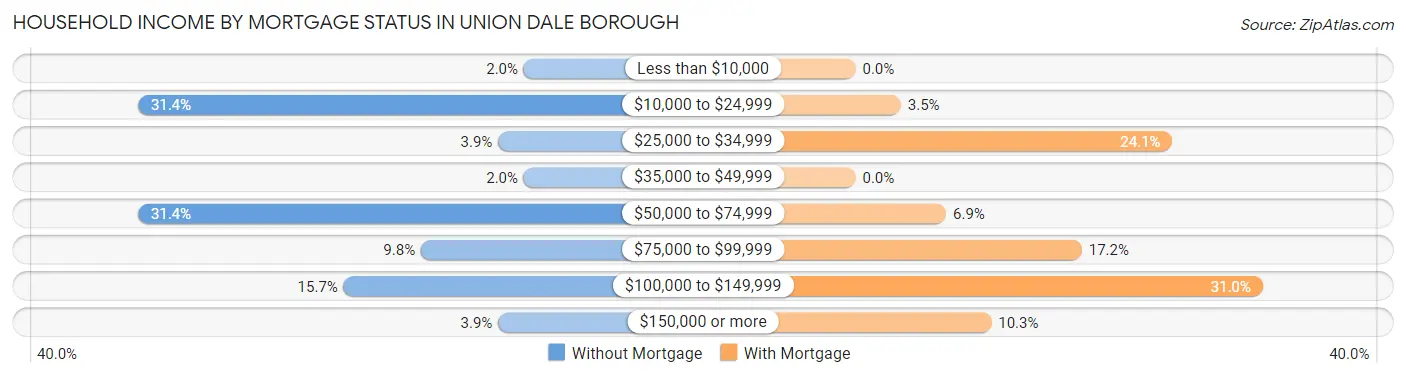
| Household Income | Without Mortgage | With Mortgage |
| Less than $10,000 | 1 (2.0%) | 0 (0.0%) |
| $10,000 to $24,999 | 16 (31.4%) | 1 (3.5%) |
| $25,000 to $34,999 | 2 (3.9%) | 7 (24.1%) |
| $35,000 to $49,999 | 1 (2.0%) | 0 (0.0%) |
| $50,000 to $74,999 | 16 (31.4%) | 2 (6.9%) |
| $75,000 to $99,999 | 5 (9.8%) | 5 (17.2%) |
| $100,000 to $149,999 | 8 (15.7%) | 9 (31.0%) |
| $150,000 or more | 2 (3.9%) | 3 (10.3%) |
| Total | 51 (100.0%) | 29 (100.0%) |
Property Value to Household Income Ratio in Union Dale borough
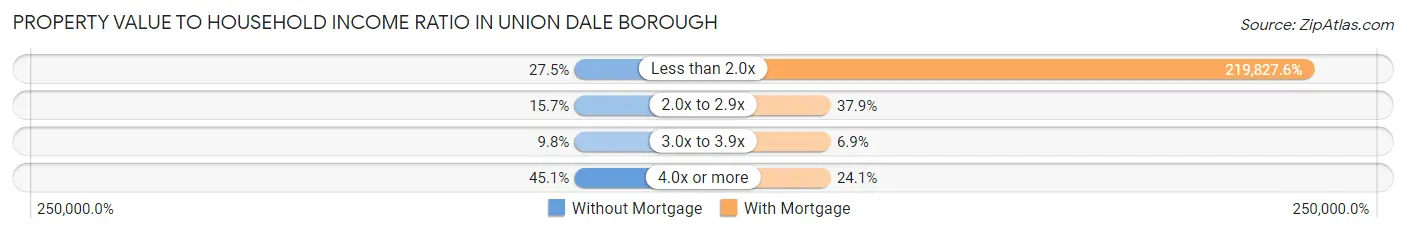
| Value-to-Income Ratio | Without Mortgage | With Mortgage |
| Less than 2.0x | 14 (27.5%) | 63,750 (219,827.6%) |
| 2.0x to 2.9x | 8 (15.7%) | 11 (37.9%) |
| 3.0x to 3.9x | 5 (9.8%) | 2 (6.9%) |
| 4.0x or more | 23 (45.1%) | 7 (24.1%) |
| Total | 51 (100.0%) | 29 (100.0%) |
Real Estate Taxes by Mortgage Status in Union Dale borough
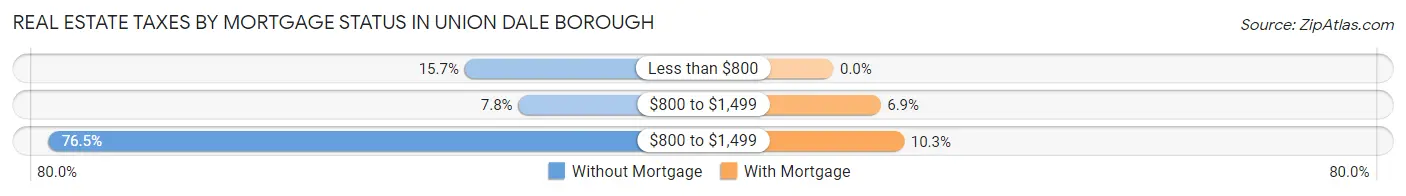
| Property Taxes | Without Mortgage | With Mortgage |
| Less than $800 | 8 (15.7%) | 0 (0.0%) |
| $800 to $1,499 | 4 (7.8%) | 2 (6.9%) |
| $800 to $1,499 | 39 (76.5%) | 3 (10.3%) |
| Total | 51 (100.0%) | 29 (100.0%) |
Health & Disability in Union Dale borough
Health Insurance Coverage by Age in Union Dale borough
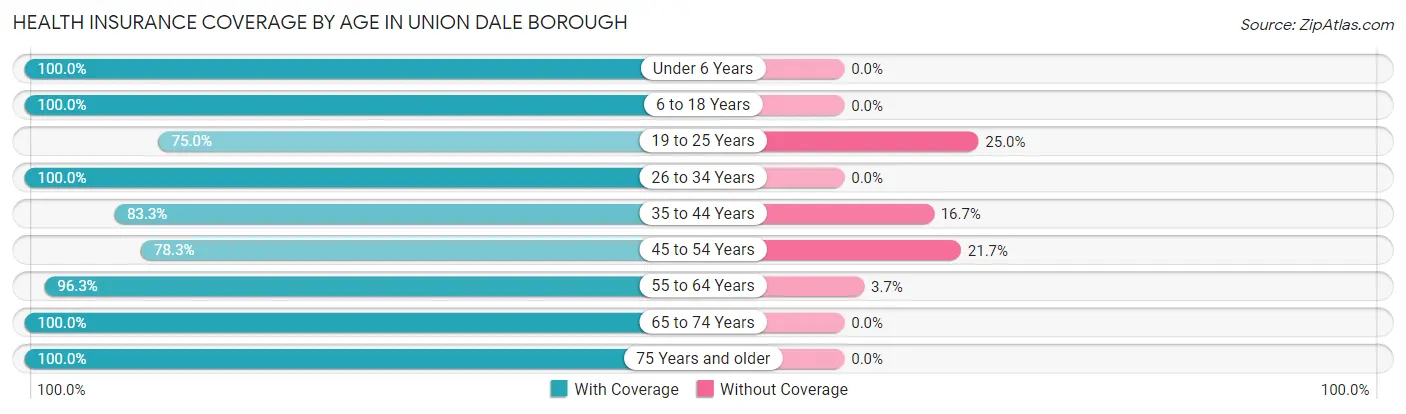
| Age Bracket | With Coverage | Without Coverage |
| Under 6 Years | 2 (100.0%) | 0 (0.0%) |
| 6 to 18 Years | 4 (100.0%) | 0 (0.0%) |
| 19 to 25 Years | 9 (75.0%) | 3 (25.0%) |
| 26 to 34 Years | 10 (100.0%) | 0 (0.0%) |
| 35 to 44 Years | 5 (83.3%) | 1 (16.7%) |
| 45 to 54 Years | 18 (78.3%) | 5 (21.7%) |
| 55 to 64 Years | 52 (96.3%) | 2 (3.7%) |
| 65 to 74 Years | 31 (100.0%) | 0 (0.0%) |
| 75 Years and older | 18 (100.0%) | 0 (0.0%) |
| Total | 149 (93.1%) | 11 (6.9%) |
Health Insurance Coverage by Citizenship Status in Union Dale borough
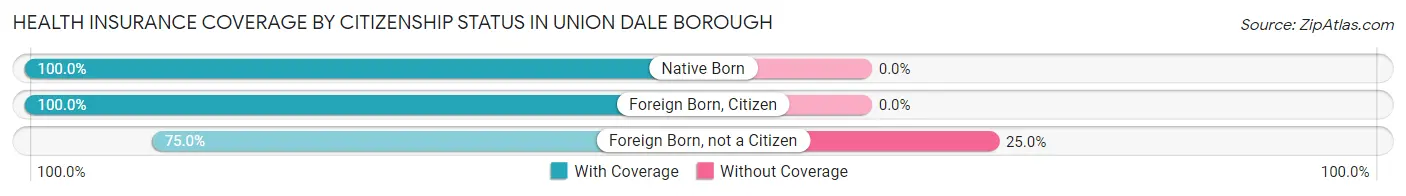
| Citizenship Status | With Coverage | Without Coverage |
| Native Born | 2 (100.0%) | 0 (0.0%) |
| Foreign Born, Citizen | 4 (100.0%) | 0 (0.0%) |
| Foreign Born, not a Citizen | 9 (75.0%) | 3 (25.0%) |
Health Insurance Coverage by Household Income in Union Dale borough
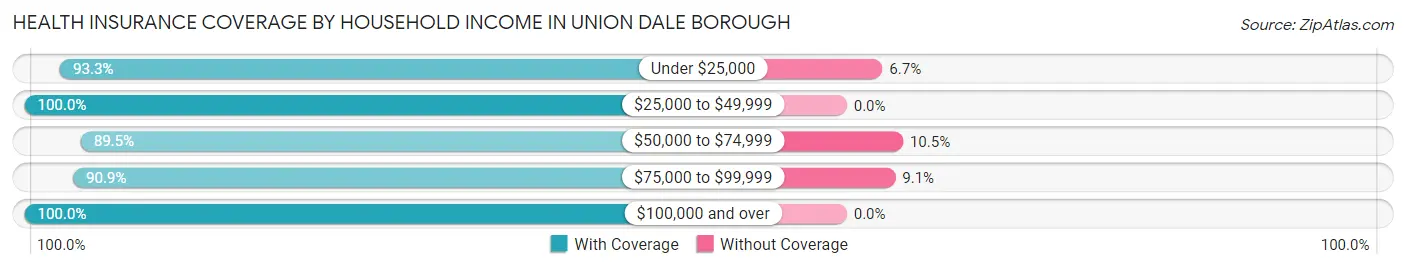
| Household Income | With Coverage | Without Coverage |
| Under $25,000 | 28 (93.3%) | 2 (6.7%) |
| $25,000 to $49,999 | 8 (100.0%) | 0 (0.0%) |
| $50,000 to $74,999 | 51 (89.5%) | 6 (10.5%) |
| $75,000 to $99,999 | 30 (90.9%) | 3 (9.1%) |
| $100,000 and over | 32 (100.0%) | 0 (0.0%) |
Public vs Private Health Insurance Coverage by Age in Union Dale borough
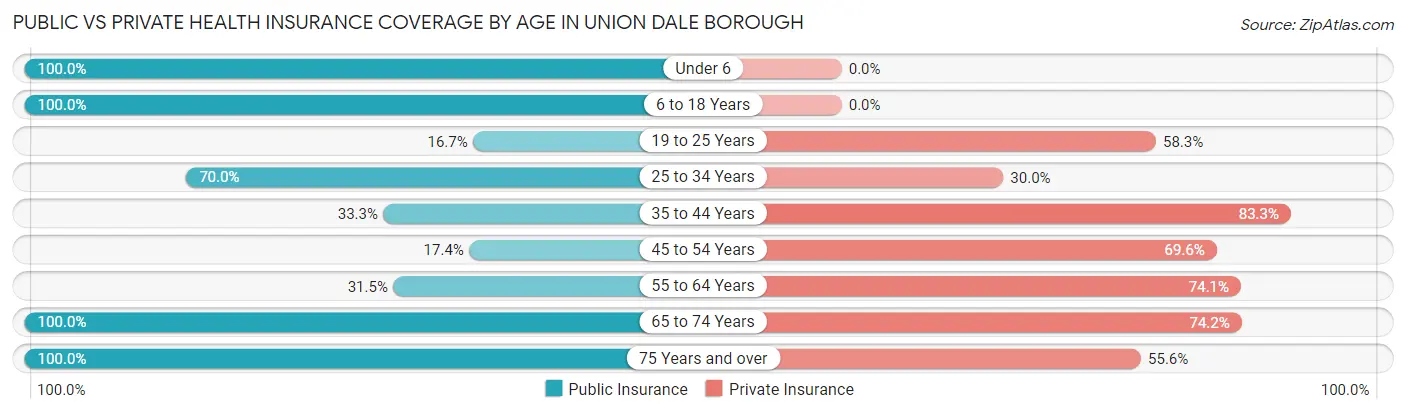
| Age Bracket | Public Insurance | Private Insurance |
| Under 6 | 2 (100.0%) | 0 (0.0%) |
| 6 to 18 Years | 4 (100.0%) | 0 (0.0%) |
| 19 to 25 Years | 2 (16.7%) | 7 (58.3%) |
| 25 to 34 Years | 7 (70.0%) | 3 (30.0%) |
| 35 to 44 Years | 2 (33.3%) | 5 (83.3%) |
| 45 to 54 Years | 4 (17.4%) | 16 (69.6%) |
| 55 to 64 Years | 17 (31.5%) | 40 (74.1%) |
| 65 to 74 Years | 31 (100.0%) | 23 (74.2%) |
| 75 Years and over | 18 (100.0%) | 10 (55.6%) |
| Total | 87 (54.4%) | 104 (65.0%) |
Disability Status by Sex by Age in Union Dale borough
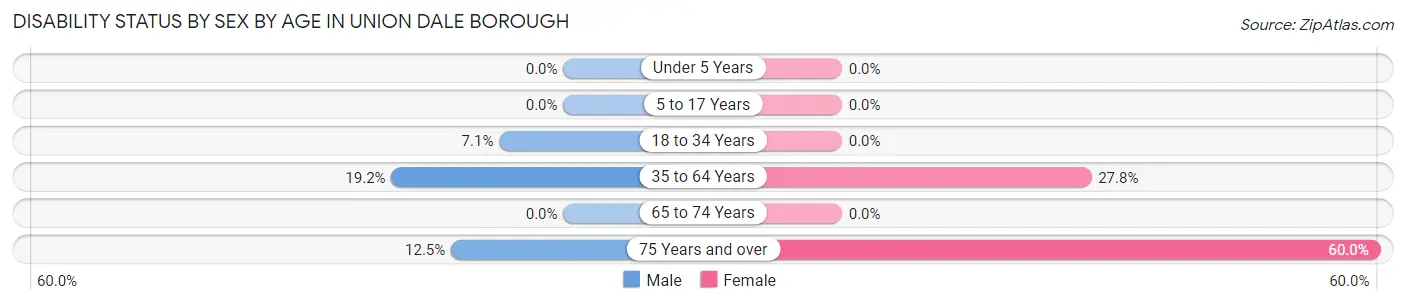
| Age Bracket | Male | Female |
| Under 5 Years | 0 (0.0%) | 0 (0.0%) |
| 5 to 17 Years | 0 (0.0%) | 0 (0.0%) |
| 18 to 34 Years | 1 (7.1%) | 0 (0.0%) |
| 35 to 64 Years | 9 (19.2%) | 10 (27.8%) |
| 65 to 74 Years | 0 (0.0%) | 0 (0.0%) |
| 75 Years and over | 1 (12.5%) | 6 (60.0%) |
Disability Class by Sex by Age in Union Dale borough
Disability Class: Hearing Difficulty
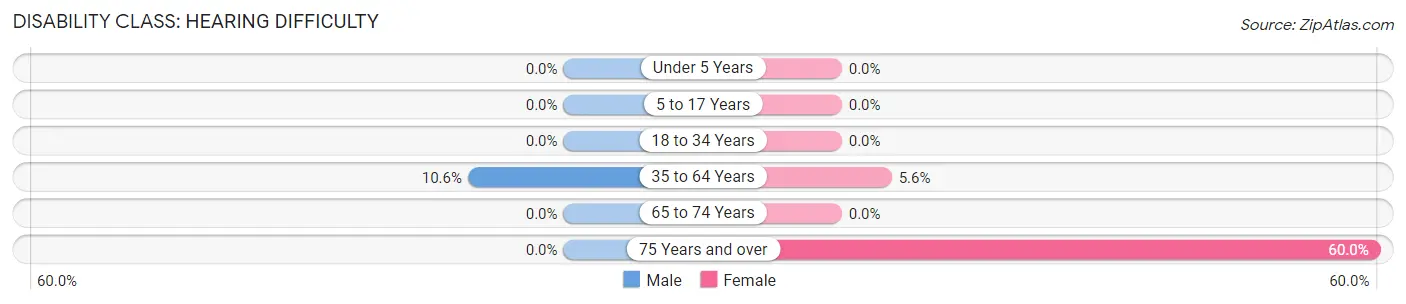
| Age Bracket | Male | Female |
| Under 5 Years | 0 (0.0%) | 0 (0.0%) |
| 5 to 17 Years | 0 (0.0%) | 0 (0.0%) |
| 18 to 34 Years | 0 (0.0%) | 0 (0.0%) |
| 35 to 64 Years | 5 (10.6%) | 2 (5.6%) |
| 65 to 74 Years | 0 (0.0%) | 0 (0.0%) |
| 75 Years and over | 0 (0.0%) | 6 (60.0%) |
Disability Class: Vision Difficulty
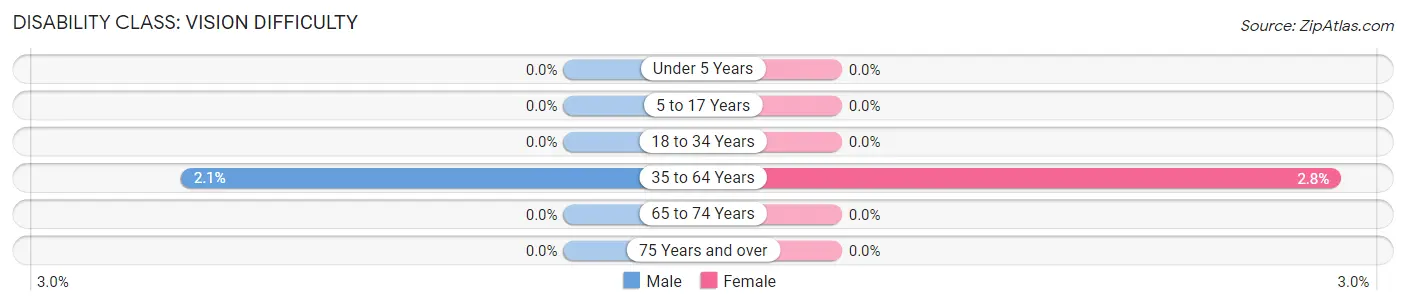
| Age Bracket | Male | Female |
| Under 5 Years | 0 (0.0%) | 0 (0.0%) |
| 5 to 17 Years | 0 (0.0%) | 0 (0.0%) |
| 18 to 34 Years | 0 (0.0%) | 0 (0.0%) |
| 35 to 64 Years | 1 (2.1%) | 1 (2.8%) |
| 65 to 74 Years | 0 (0.0%) | 0 (0.0%) |
| 75 Years and over | 0 (0.0%) | 0 (0.0%) |
Disability Class: Cognitive Difficulty
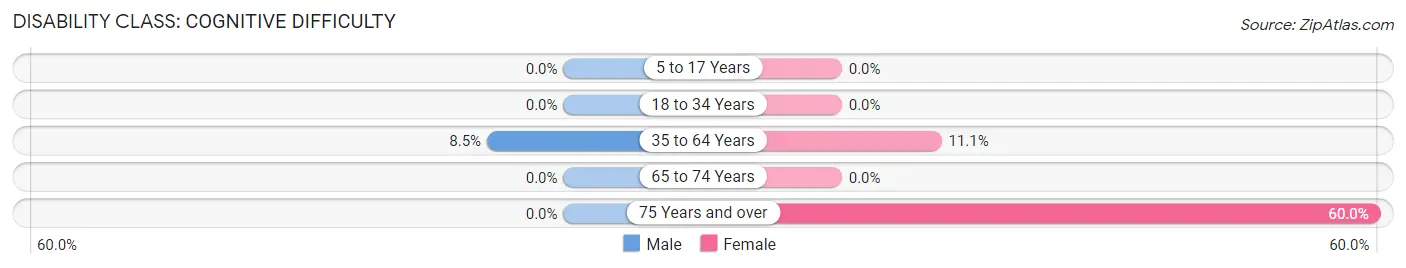
| Age Bracket | Male | Female |
| 5 to 17 Years | 0 (0.0%) | 0 (0.0%) |
| 18 to 34 Years | 0 (0.0%) | 0 (0.0%) |
| 35 to 64 Years | 4 (8.5%) | 4 (11.1%) |
| 65 to 74 Years | 0 (0.0%) | 0 (0.0%) |
| 75 Years and over | 0 (0.0%) | 6 (60.0%) |
Disability Class: Ambulatory Difficulty
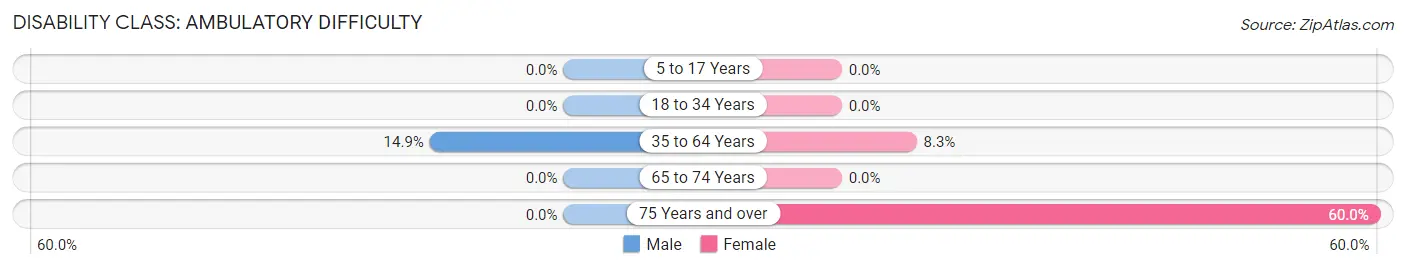
| Age Bracket | Male | Female |
| 5 to 17 Years | 0 (0.0%) | 0 (0.0%) |
| 18 to 34 Years | 0 (0.0%) | 0 (0.0%) |
| 35 to 64 Years | 7 (14.9%) | 3 (8.3%) |
| 65 to 74 Years | 0 (0.0%) | 0 (0.0%) |
| 75 Years and over | 0 (0.0%) | 6 (60.0%) |
Disability Class: Self-Care Difficulty
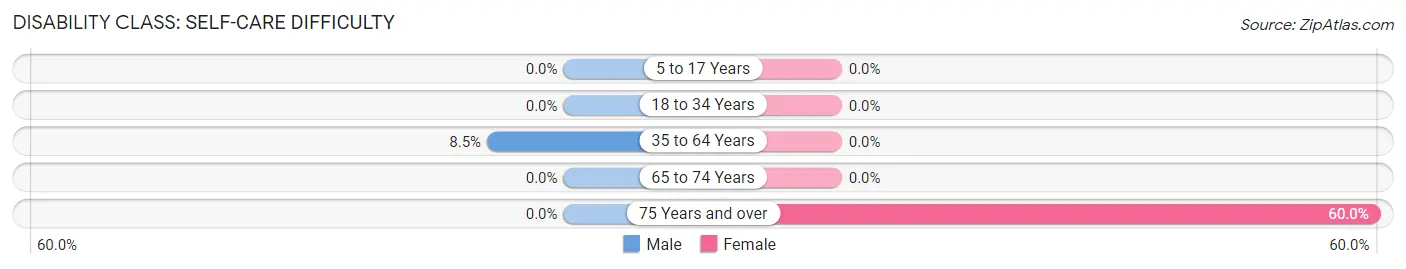
| Age Bracket | Male | Female |
| 5 to 17 Years | 0 (0.0%) | 0 (0.0%) |
| 18 to 34 Years | 0 (0.0%) | 0 (0.0%) |
| 35 to 64 Years | 4 (8.5%) | 0 (0.0%) |
| 65 to 74 Years | 0 (0.0%) | 0 (0.0%) |
| 75 Years and over | 0 (0.0%) | 6 (60.0%) |
Technology Access in Union Dale borough
Computing Device Access in Union Dale borough
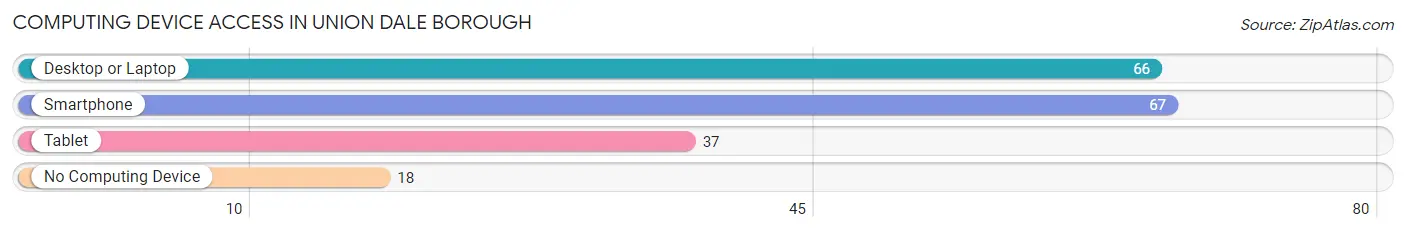
| Device Type | # Households | % Households |
| Desktop or Laptop | 66 | 72.5% |
| Smartphone | 67 | 73.6% |
| Tablet | 37 | 40.7% |
| No Computing Device | 18 | 19.8% |
| Total | 91 | 100.0% |
Internet Access in Union Dale borough
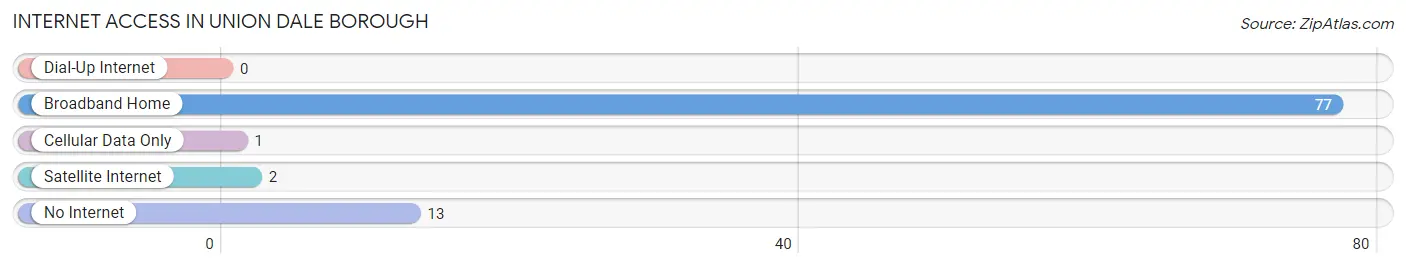
| Internet Type | # Households | % Households |
| Dial-Up Internet | 0 | 0.0% |
| Broadband Home | 77 | 84.6% |
| Cellular Data Only | 1 | 1.1% |
| Satellite Internet | 2 | 2.2% |
| No Internet | 13 | 14.3% |
| Total | 91 | 100.0% |
Union Dale borough Summary
Introduction
Union Dale Borough is a small borough located in Susquehanna County, Pennsylvania. It is situated in the Endless Mountains region of the state and is part of the Scranton–Wilkes-Barre–Hazleton Metropolitan Statistical Area. The borough was incorporated in 1891 and has a population of approximately 500 people.
History
Union Dale Borough was originally part of Clifford Township, which was established in 1810. The area was first settled in the late 1700s by a group of settlers from Connecticut. The settlers named the area Union Dale, after the union of two streams that ran through the area. The area was primarily used for farming and logging until the late 1800s, when the railroad was built through the area. This allowed for the development of the borough and the growth of the local economy.
In 1891, Union Dale was incorporated as a borough. The borough was named after the union of two streams that ran through the area. The borough was primarily a farming and logging community until the late 1800s, when the railroad was built through the area. This allowed for the development of the borough and the growth of the local economy.
Geography
Union Dale Borough is located in Susquehanna County, Pennsylvania. It is situated in the Endless Mountains region of the state and is part of the Scranton–Wilkes-Barre–Hazleton Metropolitan Statistical Area. The borough is located in the northern part of the county, approximately 10 miles south of the New York state border. The borough is bordered by Clifford Township to the north, Gibson Township to the east, Herrick Township to the south, and Lenox Township to the west.
The borough is situated in a valley between two mountain ranges, the Endless Mountains to the east and the Lackawanna Mountains to the west. The borough is located at an elevation of 1,400 feet above sea level. The borough is located in a temperate climate, with cold winters and warm summers. The average annual temperature is approximately 50 degrees Fahrenheit.
Economy
The economy of Union Dale Borough is primarily based on agriculture and tourism. The borough is home to several farms, which produce a variety of crops, including corn, soybeans, hay, and vegetables. The borough is also home to several tourist attractions, including the Union Dale Historical Society Museum, the Union Dale Cemetery, and the Union Dale Railroad Station.
The borough is also home to several small businesses, including restaurants, retail stores, and service providers. The borough is served by the Union Dale Post Office and the Union Dale Fire Department.
Demographics
As of the 2010 census, the population of Union Dale Borough was 498 people. The racial makeup of the borough was 97.2% White, 0.6% African American, 0.2% Native American, 0.2% Asian, 0.2% from other races, and 1.8% from two or more races. Hispanic or Latino of any race were 0.8% of the population.
The median household income in the borough was $41,250, and the median family income was $50,000. The per capita income in the borough was $20,945. Approximately 11.2% of the population was below the poverty line.
Conclusion
Union Dale Borough is a small borough located in Susquehanna County, Pennsylvania. It is situated in the Endless Mountains region of the state and is part of the Scranton–Wilkes-Barre–Hazleton Metropolitan Statistical Area. The borough was incorporated in 1891 and has a population of approximately 500 people. The economy of the borough is primarily based on agriculture and tourism, and the borough is home to several small businesses. The population of the borough is primarily white, with a small percentage of African American, Native American, and Asian residents. The median household income in the borough is $41,250, and the per capita income is $20,945.
Common Questions
What is Per Capita Income in Union Dale borough?
Per Capita income in Union Dale borough is $36,659.
What is the Median Family Income in Union Dale borough?
Median Family Income in Union Dale borough is $80,417.
What is the Median Household income in Union Dale borough?
Median Household Income in Union Dale borough is $58,125.
What is Income or Wage Gap in Union Dale borough?
Income or Wage Gap in Union Dale borough is 25.7%.
Women in Union Dale borough earn 74.3 cents for every dollar earned by a man.
What is Inequality or Gini Index in Union Dale borough?
Inequality or Gini Index in Union Dale borough is 0.39.
What is the Total Population of Union Dale borough?
Total Population of Union Dale borough is 160.
What is the Total Male Population of Union Dale borough?
Total Male Population of Union Dale borough is 90.
What is the Total Female Population of Union Dale borough?
Total Female Population of Union Dale borough is 70.
What is the Ratio of Males per 100 Females in Union Dale borough?
There are 128.57 Males per 100 Females in Union Dale borough.
What is the Ratio of Females per 100 Males in Union Dale borough?
There are 77.78 Females per 100 Males in Union Dale borough.
What is the Median Population Age in Union Dale borough?
Median Population Age in Union Dale borough is 62.1 Years.
What is the Average Family Size in Union Dale borough
Average Family Size in Union Dale borough is 2.3 People.
What is the Average Household Size in Union Dale borough
Average Household Size in Union Dale borough is 1.8 People.
How Large is the Labor Force in Union Dale borough?
There are 78 People in the Labor Forcein in Union Dale borough.
What is the Percentage of People in the Labor Force in Union Dale borough?
50.3% of People are in the Labor Force in Union Dale borough.
What is the Unemployment Rate in Union Dale borough?
Unemployment Rate in Union Dale borough is 3.8%.