Highland Park, PA Map & Demographics
Highland Park Map
Highland Park Overview
$30,196
PER CAPITA INCOME
$60,294
AVG FAMILY INCOME
$55,988
AVG HOUSEHOLD INCOME
52.9%
WAGE / INCOME GAP [ % ]
47.1¢/ $1
WAGE / INCOME GAP [ $ ]
0.35
INEQUALITY / GINI INDEX
1,218
TOTAL POPULATION
484
MALE POPULATION
734
FEMALE POPULATION
65.94
MALES / 100 FEMALES
151.65
FEMALES / 100 MALES
54.2
MEDIAN AGE
2.6
AVG FAMILY SIZE
2.0
AVG HOUSEHOLD SIZE
571
LABOR FORCE [ PEOPLE ]
55.3%
PERCENT IN LABOR FORCE
Income in Highland Park
Income Overview in Highland Park
Per Capita Income in Highland Park is $30,196, while median incomes of families and households are $60,294 and $55,988 respectively.
| Characteristic | Number | Measure |
| Per Capita Income | 1,218 | $30,196 |
| Median Family Income | 286 | $60,294 |
| Mean Family Income | 286 | $80,186 |
| Median Household Income | 538 | $55,988 |
| Mean Household Income | 538 | $63,498 |
| Income Deficit | 286 | $0 |
| Wage / Income Gap (%) | 1,218 | 52.87% |
| Wage / Income Gap ($) | 1,218 | 47.13¢ per $1 |
| Gini / Inequality Index | 1,218 | 0.35 |
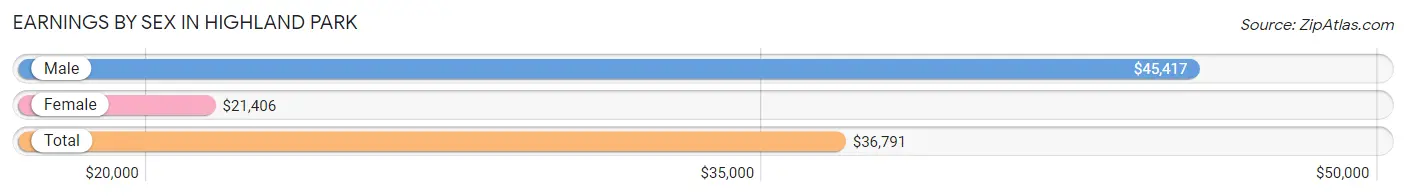
Earnings by Sex in Highland Park
Average Earnings in Highland Park are $36,791, $45,417 for men and $21,406 for women, a difference of 52.9%.
| Sex | Number | Average Earnings |
| Male | 277 (46.4%) | $45,417 |
| Female | 320 (53.6%) | $21,406 |
| Total | 597 (100.0%) | $36,791 |
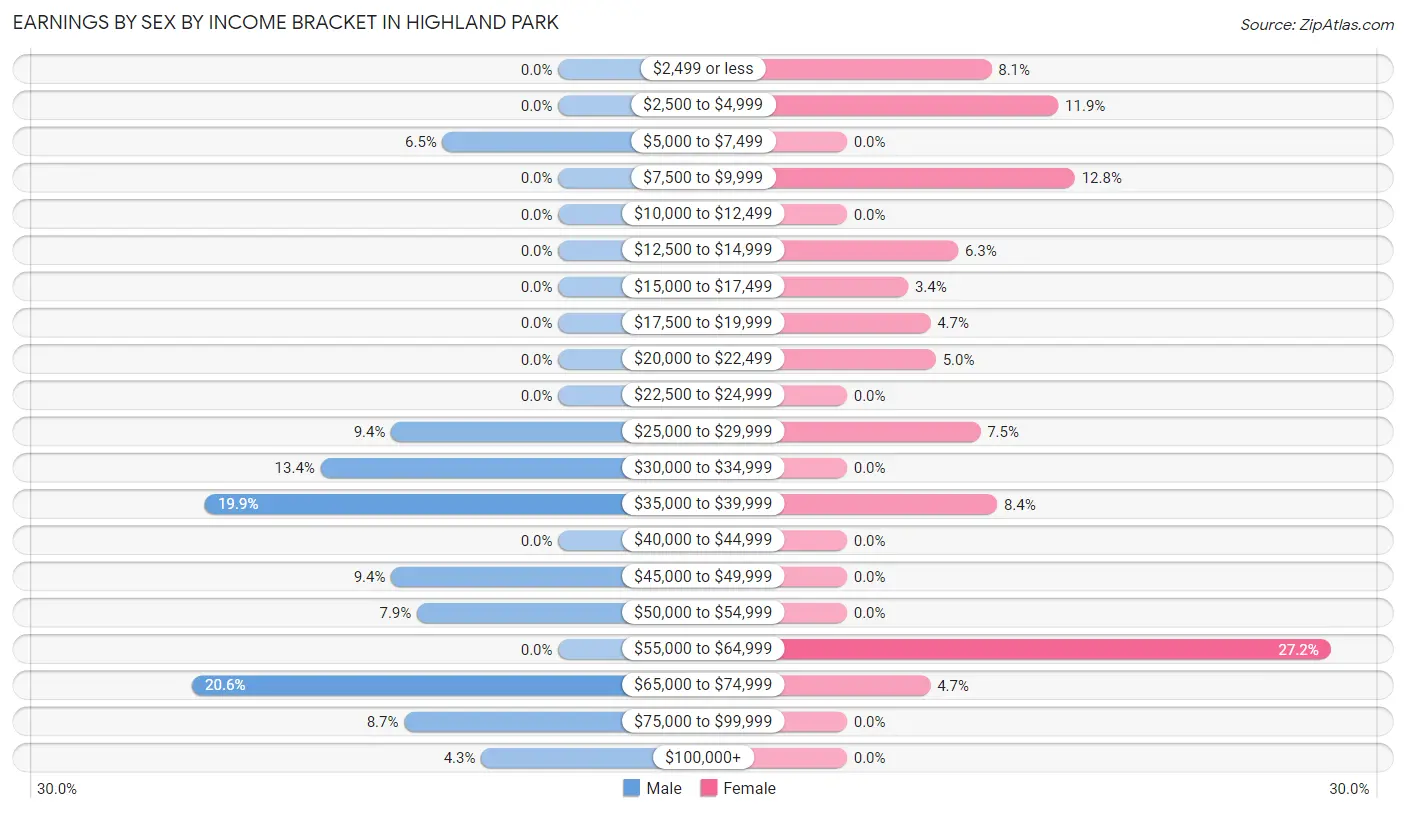
Earnings by Sex by Income Bracket in Highland Park
The most common earnings brackets in Highland Park are $65,000 to $74,999 for men (57 | 20.6%) and $55,000 to $64,999 for women (87 | 27.2%).
| Income | Male | Female |
| $2,499 or less | 0 (0.0%) | 26 (8.1%) |
| $2,500 to $4,999 | 0 (0.0%) | 38 (11.9%) |
| $5,000 to $7,499 | 18 (6.5%) | 0 (0.0%) |
| $7,500 to $9,999 | 0 (0.0%) | 41 (12.8%) |
| $10,000 to $12,499 | 0 (0.0%) | 0 (0.0%) |
| $12,500 to $14,999 | 0 (0.0%) | 20 (6.2%) |
| $15,000 to $17,499 | 0 (0.0%) | 11 (3.4%) |
| $17,500 to $19,999 | 0 (0.0%) | 15 (4.7%) |
| $20,000 to $22,499 | 0 (0.0%) | 16 (5.0%) |
| $22,500 to $24,999 | 0 (0.0%) | 0 (0.0%) |
| $25,000 to $29,999 | 26 (9.4%) | 24 (7.5%) |
| $30,000 to $34,999 | 37 (13.4%) | 0 (0.0%) |
| $35,000 to $39,999 | 55 (19.9%) | 27 (8.4%) |
| $40,000 to $44,999 | 0 (0.0%) | 0 (0.0%) |
| $45,000 to $49,999 | 26 (9.4%) | 0 (0.0%) |
| $50,000 to $54,999 | 22 (7.9%) | 0 (0.0%) |
| $55,000 to $64,999 | 0 (0.0%) | 87 (27.2%) |
| $65,000 to $74,999 | 57 (20.6%) | 15 (4.7%) |
| $75,000 to $99,999 | 24 (8.7%) | 0 (0.0%) |
| $100,000+ | 12 (4.3%) | 0 (0.0%) |
| Total | 277 (100.0%) | 320 (100.0%) |
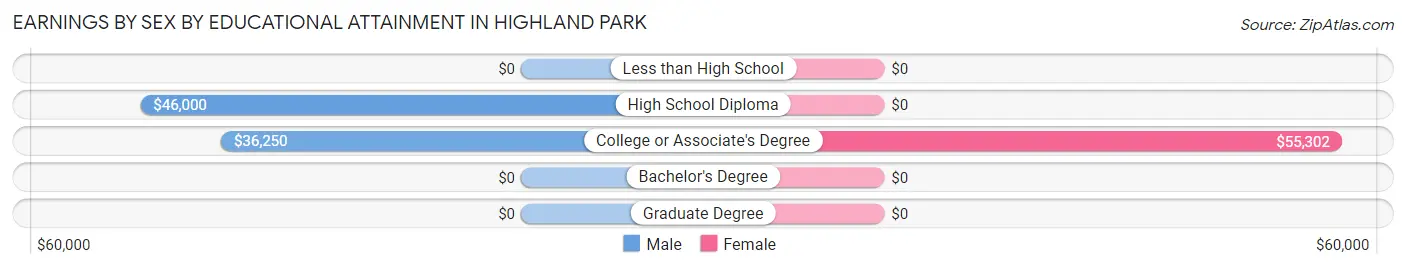
Earnings by Sex by Educational Attainment in Highland Park
Average earnings in Highland Park are $46,667 for men and $29,219 for women, a difference of 37.4%. Men with an educational attainment of high school diploma enjoy the highest average annual earnings of $46,000, while those with college or associate's degree education earn the least with $36,250. Women with an educational attainment of college or associate's degree earn the most with the average annual earnings of $55,302, while those with college or associate's degree education have the smallest earnings of $55,302.
| Educational Attainment | Male Income | Female Income |
| Less than High School | - | - |
| High School Diploma | $46,000 | $0 |
| College or Associate's Degree | $36,250 | $55,302 |
| Bachelor's Degree | - | - |
| Graduate Degree | - | - |
| Total | $46,667 | $29,219 |
Family Income in Highland Park
Family Income Brackets in Highland Park
According to the Highland Park family income data, there are 91 families falling into the $50,000 to $74,999 income range, which is the most common income bracket and makes up 31.8% of all families.
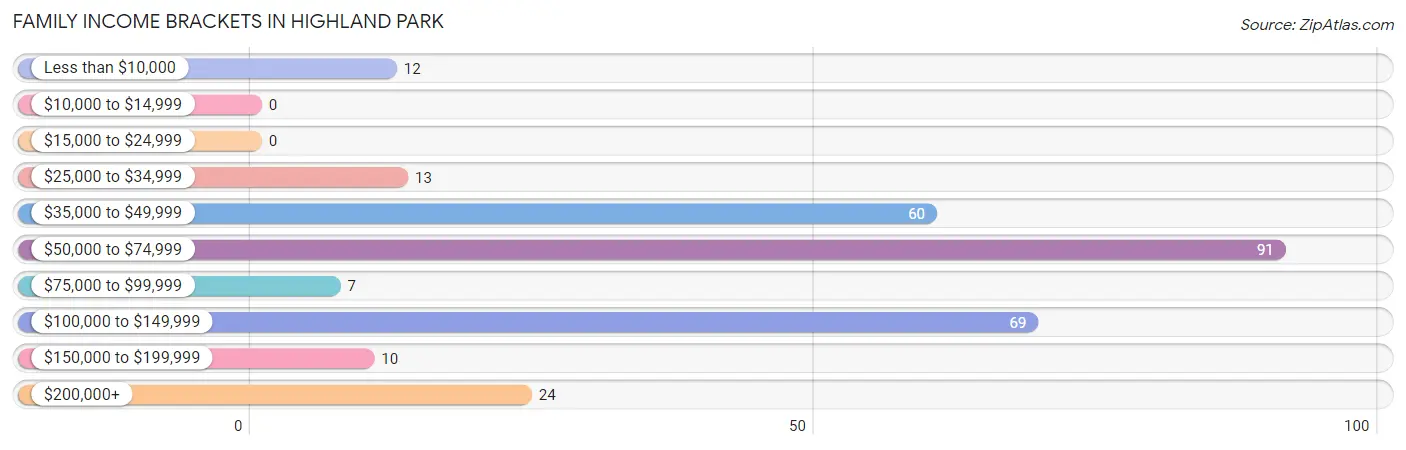
| Income Bracket | # Families | % Families |
| Less than $10,000 | 12 | 4.2% |
| $10,000 to $14,999 | 0 | 0.0% |
| $15,000 to $24,999 | 0 | 0.0% |
| $25,000 to $34,999 | 13 | 4.5% |
| $35,000 to $49,999 | 60 | 21.0% |
| $50,000 to $74,999 | 91 | 31.8% |
| $75,000 to $99,999 | 7 | 2.4% |
| $100,000 to $149,999 | 69 | 24.1% |
| $150,000 to $199,999 | 10 | 3.5% |
| $200,000+ | 24 | 8.4% |
Family Income by Famaliy Size in Highland Park
2-person families (184 | 64.3%) account for the highest median family income in Highland Park with $74,167 per family, while 2-person families (184 | 64.3%) have the highest median income of $37,084 per family member.
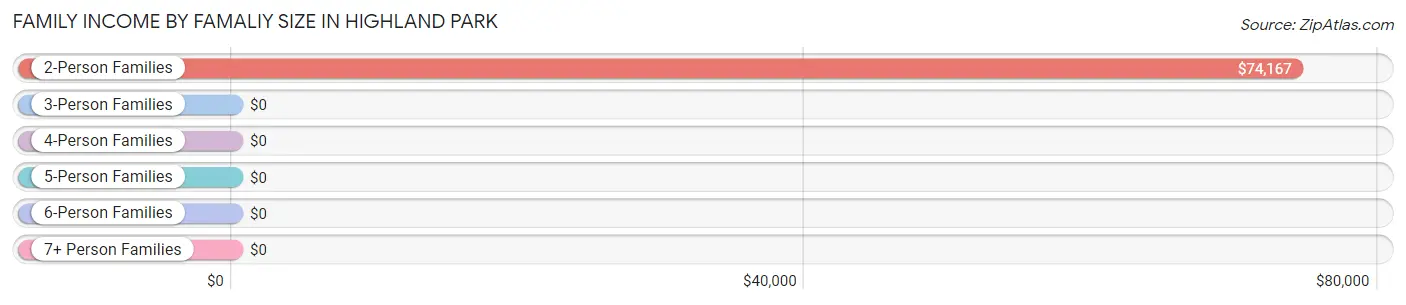
| Income Bracket | # Families | Median Income |
| 2-Person Families | 184 (64.3%) | $74,167 |
| 3-Person Families | 29 (10.1%) | $0 |
| 4-Person Families | 36 (12.6%) | $0 |
| 5-Person Families | 37 (12.9%) | $0 |
| 6-Person Families | 0 (0.0%) | $0 |
| 7+ Person Families | 0 (0.0%) | $0 |
| Total | 286 (100.0%) | $60,294 |
Family Income by Number of Earners in Highland Park
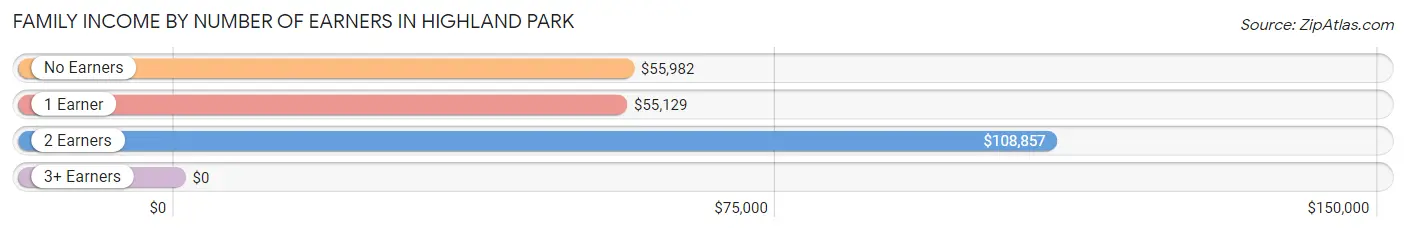
| Number of Earners | # Families | Median Income |
| No Earners | 61 (21.3%) | $55,982 |
| 1 Earner | 149 (52.1%) | $55,129 |
| 2 Earners | 52 (18.2%) | $108,857 |
| 3+ Earners | 24 (8.4%) | $0 |
| Total | 286 (100.0%) | $60,294 |
Household Income in Highland Park
Household Income Brackets in Highland Park
With 168 households falling in the category, the $50,000 to $74,999 income range is the most frequent in Highland Park, accounting for 31.2% of all households. In contrast, only 10 households (1.9%) fall into the $150,000 to $199,999 income bracket, making it the least populous group.
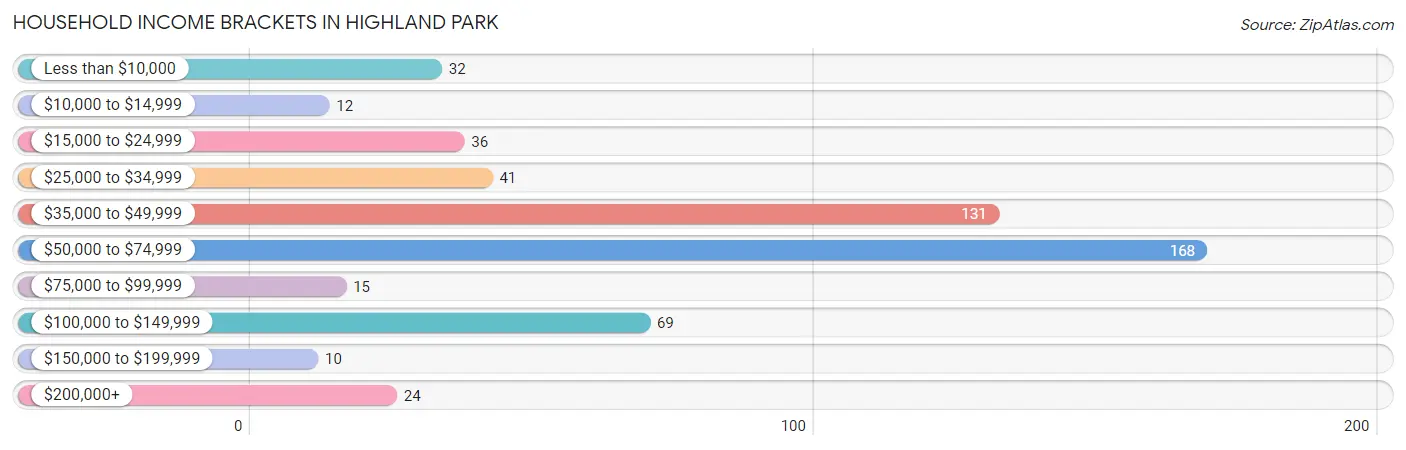
| Income Bracket | # Households | % Households |
| Less than $10,000 | 32 | 5.9% |
| $10,000 to $14,999 | 12 | 2.2% |
| $15,000 to $24,999 | 36 | 6.7% |
| $25,000 to $34,999 | 41 | 7.6% |
| $35,000 to $49,999 | 131 | 24.3% |
| $50,000 to $74,999 | 168 | 31.2% |
| $75,000 to $99,999 | 15 | 2.8% |
| $100,000 to $149,999 | 69 | 12.8% |
| $150,000 to $199,999 | 10 | 1.9% |
| $200,000+ | 24 | 4.5% |
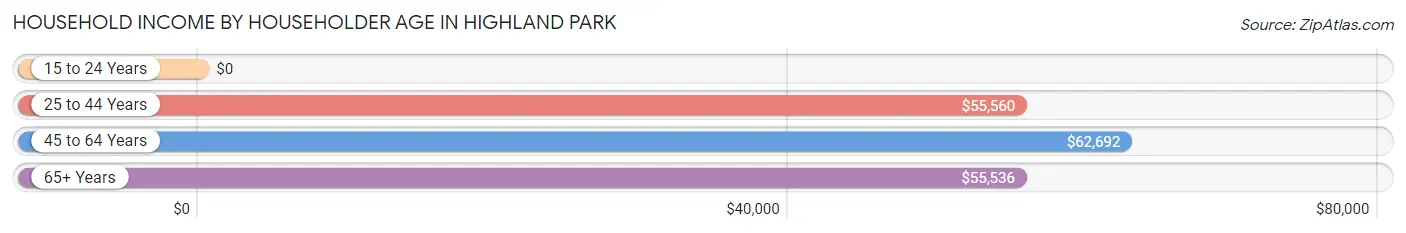
Household Income by Householder Age in Highland Park
The median household income in Highland Park is $55,988, with the highest median household income of $62,692 found in the 45 to 64 years age bracket for the primary householder. A total of 210 households (39.0%) fall into this category. Meanwhile, the 15 to 24 years age bracket for the primary householder has the lowest median household income of $0, with 25 households (4.6%) in this group.
| Income Bracket | # Households | Median Income |
| 15 to 24 Years | 25 (4.6%) | $0 |
| 25 to 44 Years | 137 (25.5%) | $55,560 |
| 45 to 64 Years | 210 (39.0%) | $62,692 |
| 65+ Years | 166 (30.9%) | $55,536 |
| Total | 538 (100.0%) | $55,988 |
Poverty in Highland Park
Income Below Poverty by Sex and Age in Highland Park
With 6.4% poverty level for males and 13.1% for females among the residents of Highland Park, under 5 year old males and 18 to 24 year old females are the most vulnerable to poverty, with 12 males (24.0%) and 31 females (53.4%) in their respective age groups living below the poverty level.
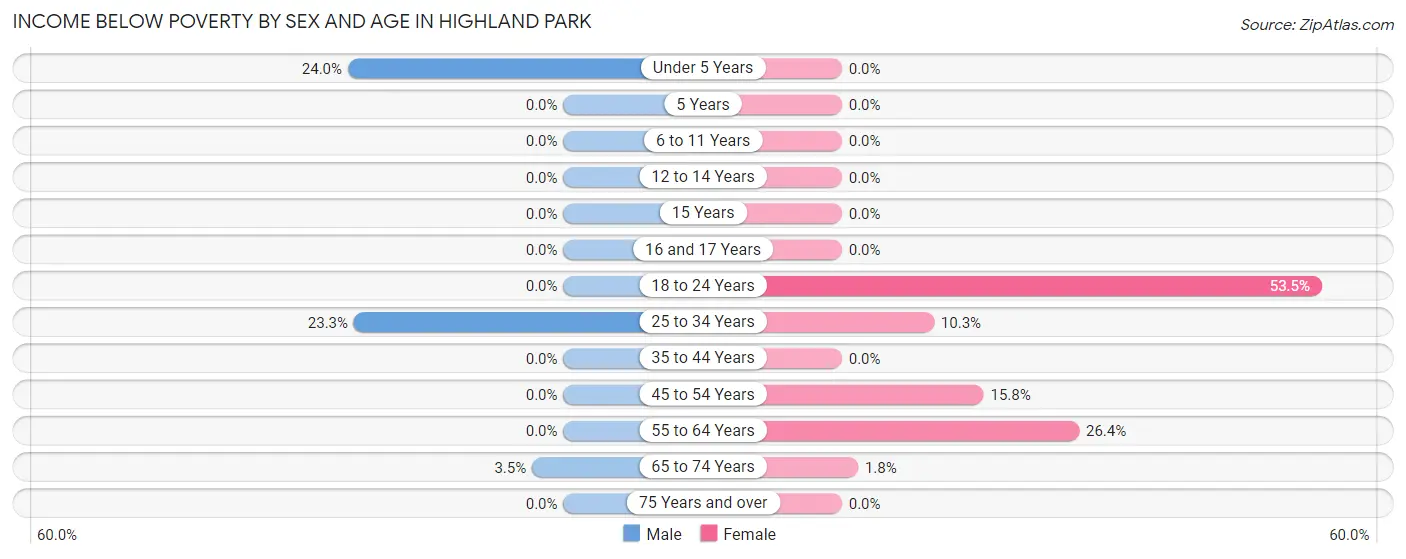
| Age Bracket | Male | Female |
| Under 5 Years | 12 (24.0%) | 0 (0.0%) |
| 5 Years | 0 (0.0%) | 0 (0.0%) |
| 6 to 11 Years | 0 (0.0%) | 0 (0.0%) |
| 12 to 14 Years | 0 (0.0%) | 0 (0.0%) |
| 15 Years | 0 (0.0%) | 0 (0.0%) |
| 16 and 17 Years | 0 (0.0%) | 0 (0.0%) |
| 18 to 24 Years | 0 (0.0%) | 31 (53.4%) |
| 25 to 34 Years | 14 (23.3%) | 12 (10.3%) |
| 35 to 44 Years | 0 (0.0%) | 0 (0.0%) |
| 45 to 54 Years | 0 (0.0%) | 9 (15.8%) |
| 55 to 64 Years | 0 (0.0%) | 28 (26.4%) |
| 65 to 74 Years | 3 (3.5%) | 2 (1.8%) |
| 75 Years and over | 0 (0.0%) | 0 (0.0%) |
| Total | 29 (6.4%) | 82 (13.1%) |
Income Above Poverty by Sex and Age in Highland Park
According to the poverty statistics in Highland Park, males aged 6 to 11 years and females aged under 5 years are the age groups that are most secure financially, with 100.0% of males and 100.0% of females in these age groups living above the poverty line.
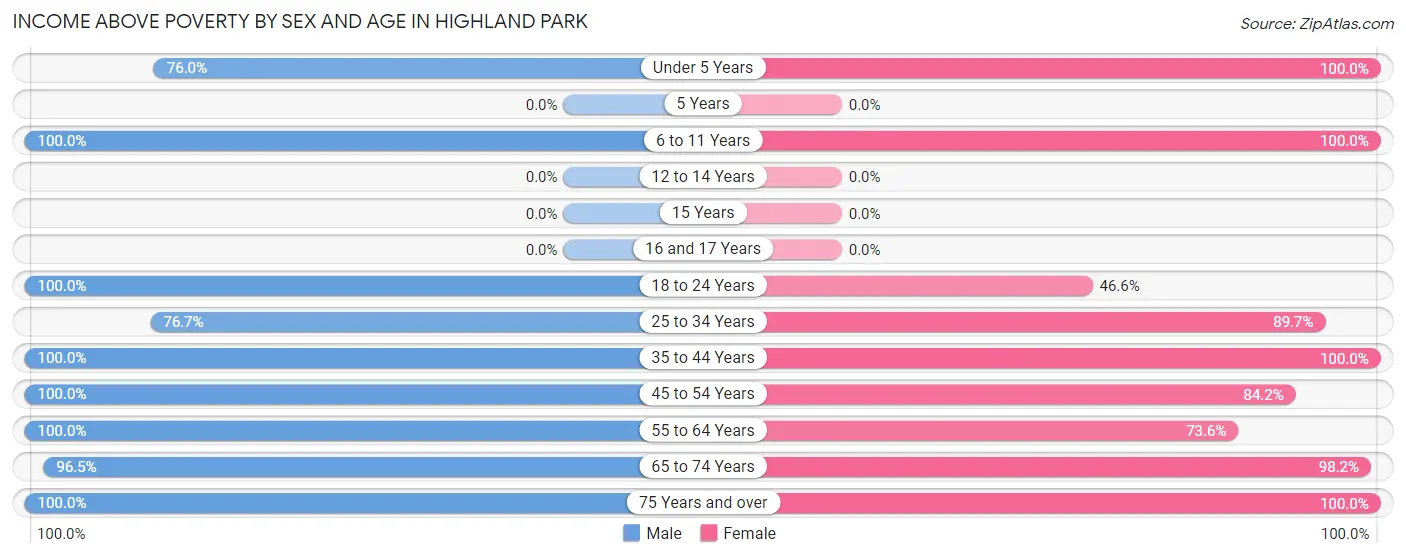
| Age Bracket | Male | Female |
| Under 5 Years | 38 (76.0%) | 77 (100.0%) |
| 5 Years | 0 (0.0%) | 0 (0.0%) |
| 6 to 11 Years | 39 (100.0%) | 19 (100.0%) |
| 12 to 14 Years | 0 (0.0%) | 0 (0.0%) |
| 15 Years | 0 (0.0%) | 0 (0.0%) |
| 16 and 17 Years | 0 (0.0%) | 0 (0.0%) |
| 18 to 24 Years | 37 (100.0%) | 27 (46.6%) |
| 25 to 34 Years | 46 (76.7%) | 105 (89.7%) |
| 35 to 44 Years | 31 (100.0%) | 18 (100.0%) |
| 45 to 54 Years | 49 (100.0%) | 48 (84.2%) |
| 55 to 64 Years | 78 (100.0%) | 78 (73.6%) |
| 65 to 74 Years | 83 (96.5%) | 109 (98.2%) |
| 75 Years and over | 24 (100.0%) | 62 (100.0%) |
| Total | 425 (93.6%) | 543 (86.9%) |
Income Below Poverty Among Married-Couple Families in Highland Park
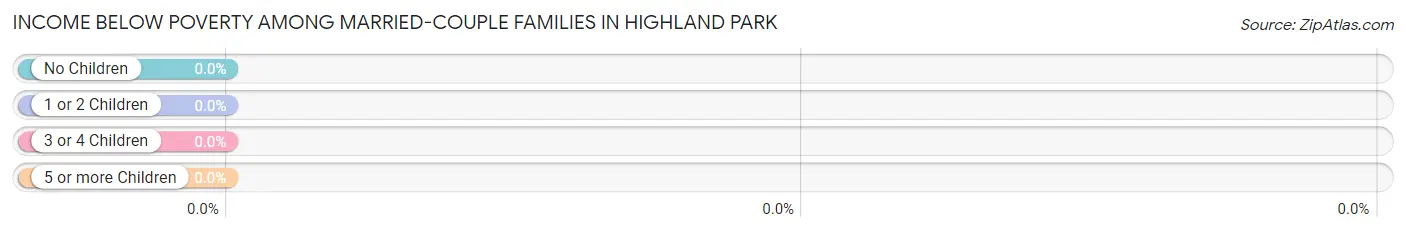
| Children | Above Poverty | Below Poverty |
| No Children | 163 (100.0%) | 0 (0.0%) |
| 1 or 2 Children | 0 (0.0%) | 0 (0.0%) |
| 3 or 4 Children | 37 (100.0%) | 0 (0.0%) |
| 5 or more Children | 0 (0.0%) | 0 (0.0%) |
| Total | 200 (100.0%) | 0 (0.0%) |
Income Below Poverty Among Single-Parent Households in Highland Park
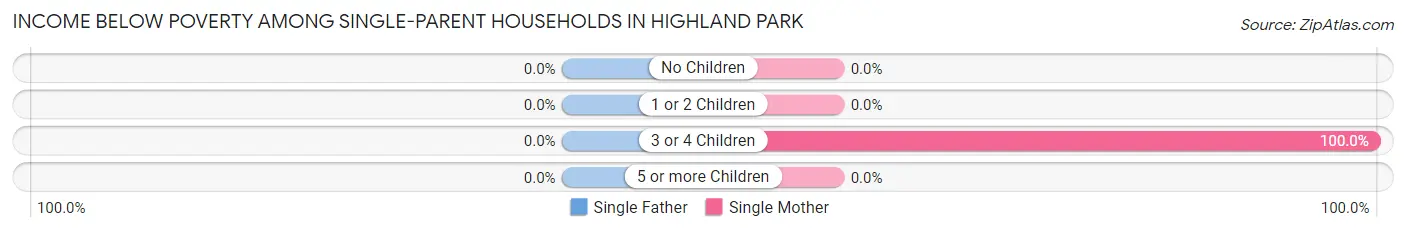
| Children | Single Father | Single Mother |
| No Children | 0 (0.0%) | 0 (0.0%) |
| 1 or 2 Children | 0 (0.0%) | 0 (0.0%) |
| 3 or 4 Children | 0 (0.0%) | 12 (100.0%) |
| 5 or more Children | 0 (0.0%) | 0 (0.0%) |
| Total | 0 (0.0%) | 12 (19.7%) |
Income Below Poverty Among Married-Couple vs Single-Parent Households in Highland Park
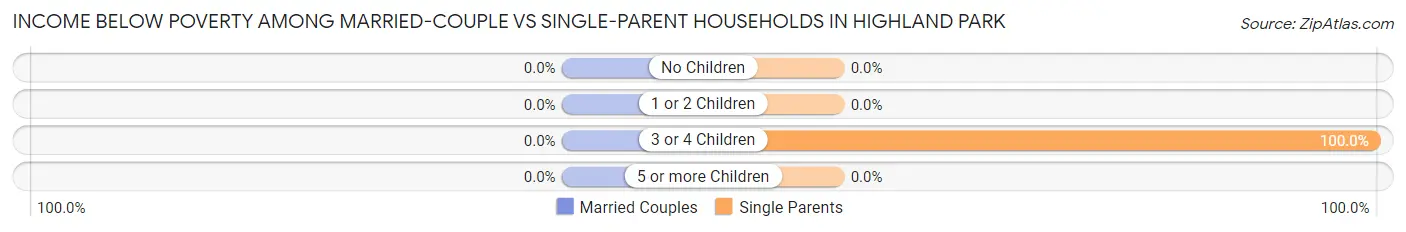
| Children | Married-Couple Families | Single-Parent Households |
| No Children | 0 (0.0%) | 0 (0.0%) |
| 1 or 2 Children | 0 (0.0%) | 0 (0.0%) |
| 3 or 4 Children | 0 (0.0%) | 12 (100.0%) |
| 5 or more Children | 0 (0.0%) | 0 (0.0%) |
| Total | 0 (0.0%) | 12 (14.0%) |
Race in Highland Park
The most populous races in Highland Park are White / Caucasian (1,144 | 93.9%), Two or more Races (59 | 4.8%), and Native / Alaskan (15 | 1.2%).
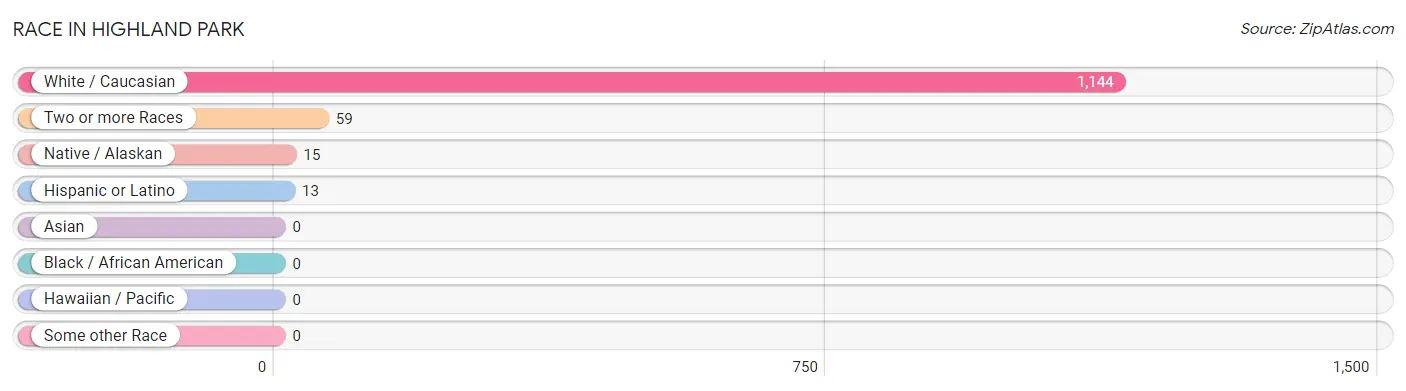
| Race | # Population | % Population |
| Asian | 0 | 0.0% |
| Black / African American | 0 | 0.0% |
| Hawaiian / Pacific | 0 | 0.0% |
| Hispanic or Latino | 13 | 1.1% |
| Native / Alaskan | 15 | 1.2% |
| White / Caucasian | 1,144 | 93.9% |
| Two or more Races | 59 | 4.8% |
| Some other Race | 0 | 0.0% |
| Total | 1,218 | 100.0% |
Ancestry in Highland Park
The most populous ancestries reported in Highland Park are German (639 | 52.5%), Irish (112 | 9.2%), English (106 | 8.7%), Pennsylvania German (67 | 5.5%), and American (53 | 4.3%), together accounting for 80.2% of all Highland Park residents.
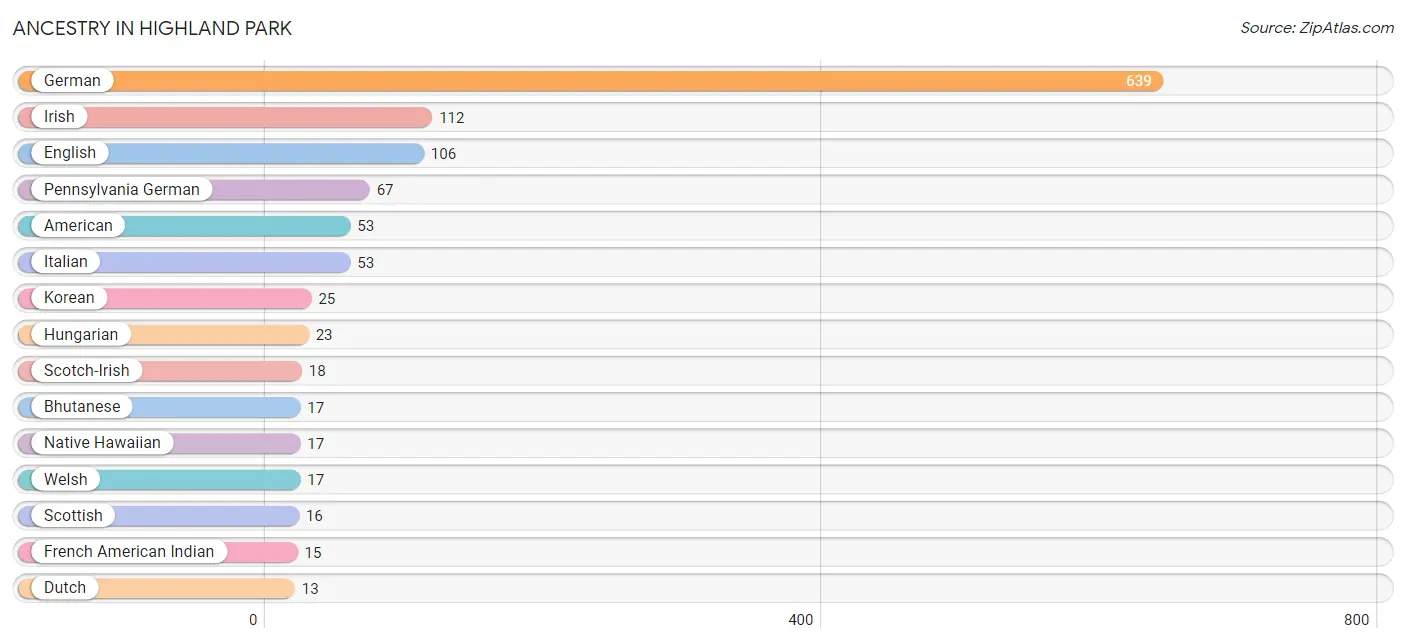
| Ancestry | # Population | % Population |
| American | 53 | 4.3% |
| Arab | 3 | 0.3% |
| Bhutanese | 17 | 1.4% |
| Dutch | 13 | 1.1% |
| English | 106 | 8.7% |
| French American Indian | 15 | 1.2% |
| German | 639 | 52.5% |
| Hungarian | 23 | 1.9% |
| Irish | 112 | 9.2% |
| Italian | 53 | 4.3% |
| Korean | 25 | 2.1% |
| Native Hawaiian | 17 | 1.4% |
| Pennsylvania German | 67 | 5.5% |
| Scotch-Irish | 18 | 1.5% |
| Scottish | 16 | 1.3% |
| Spanish | 13 | 1.1% |
| Swiss | 8 | 0.7% |
| Syrian | 3 | 0.3% |
| Ukrainian | 11 | 0.9% |
| Welsh | 17 | 1.4% | View All 20 Rows |
Immigrants in Highland Park

| Immigration Origin | # Population | % Population | View All 0 Rows |
Sex and Age in Highland Park
Sex and Age in Highland Park
The most populous age groups in Highland Park are 65 to 69 Years (53 | 11.0%) for men and 25 to 29 Years (117 | 15.9%) for women.
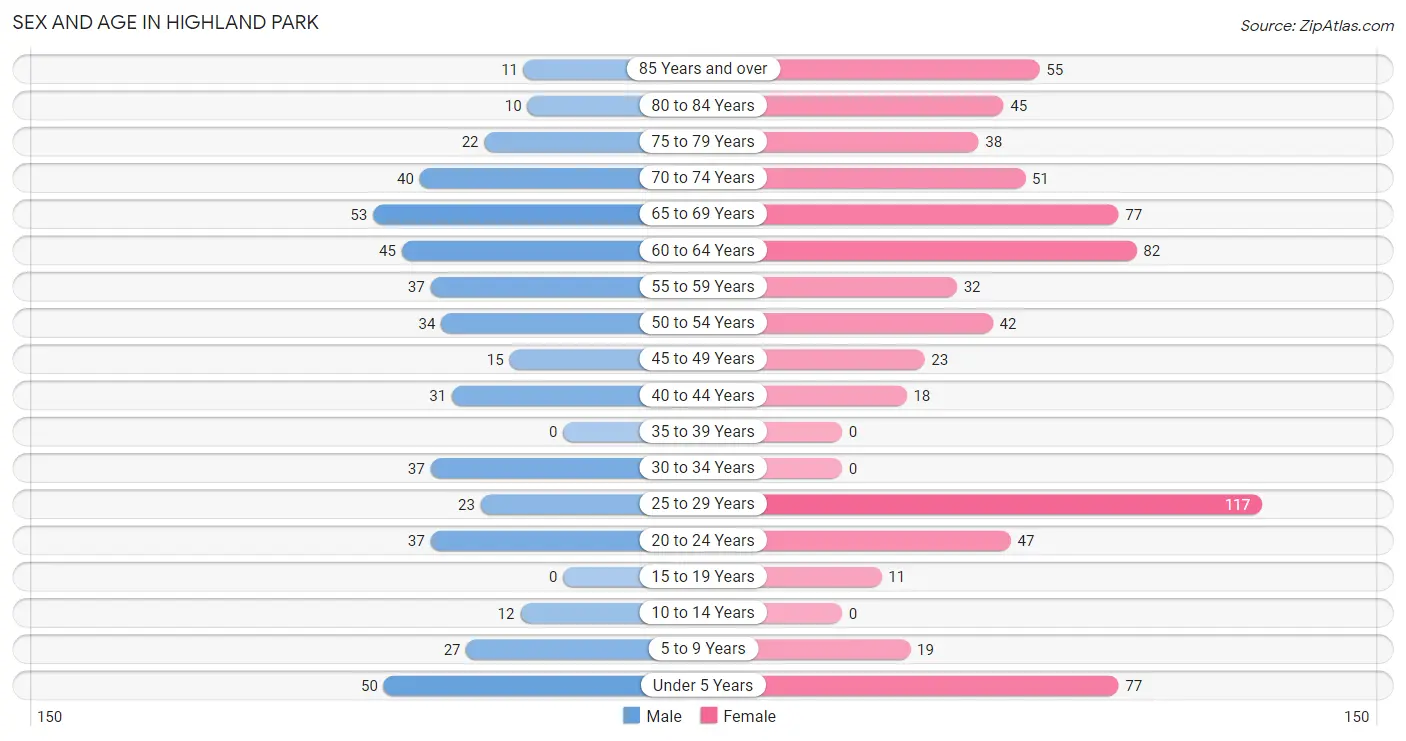
| Age Bracket | Male | Female |
| Under 5 Years | 50 (10.3%) | 77 (10.5%) |
| 5 to 9 Years | 27 (5.6%) | 19 (2.6%) |
| 10 to 14 Years | 12 (2.5%) | 0 (0.0%) |
| 15 to 19 Years | 0 (0.0%) | 11 (1.5%) |
| 20 to 24 Years | 37 (7.6%) | 47 (6.4%) |
| 25 to 29 Years | 23 (4.8%) | 117 (15.9%) |
| 30 to 34 Years | 37 (7.6%) | 0 (0.0%) |
| 35 to 39 Years | 0 (0.0%) | 0 (0.0%) |
| 40 to 44 Years | 31 (6.4%) | 18 (2.5%) |
| 45 to 49 Years | 15 (3.1%) | 23 (3.1%) |
| 50 to 54 Years | 34 (7.0%) | 42 (5.7%) |
| 55 to 59 Years | 37 (7.6%) | 32 (4.4%) |
| 60 to 64 Years | 45 (9.3%) | 82 (11.2%) |
| 65 to 69 Years | 53 (11.0%) | 77 (10.5%) |
| 70 to 74 Years | 40 (8.3%) | 51 (7.0%) |
| 75 to 79 Years | 22 (4.5%) | 38 (5.2%) |
| 80 to 84 Years | 10 (2.1%) | 45 (6.1%) |
| 85 Years and over | 11 (2.3%) | 55 (7.5%) |
| Total | 484 (100.0%) | 734 (100.0%) |
Families and Households in Highland Park
Median Family Size in Highland Park
The median family size in Highland Park is 2.58 persons per family, with married-couple families (200 | 69.9%) accounting for the largest median family size of 2.76 persons per family. On the other hand, single male/father families (25 | 8.7%) represent the smallest median family size with 2.08 persons per family.
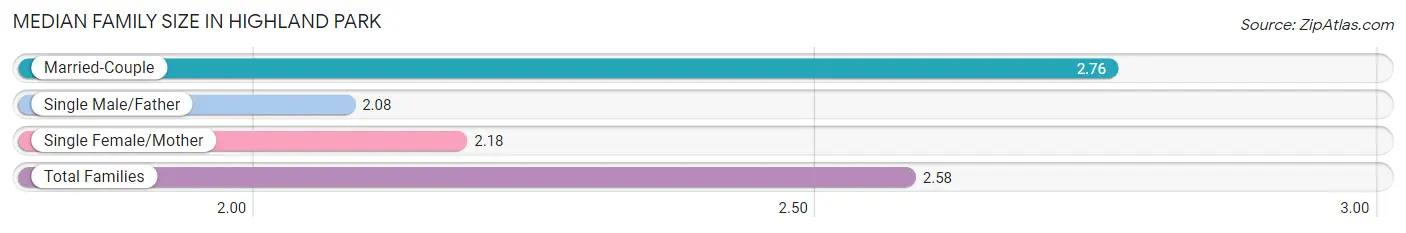
| Family Type | # Families | Family Size |
| Married-Couple | 200 (69.9%) | 2.76 |
| Single Male/Father | 25 (8.7%) | 2.08 |
| Single Female/Mother | 61 (21.3%) | 2.18 |
| Total Families | 286 (100.0%) | 2.58 |
Median Household Size in Highland Park
The median household size in Highland Park is 1.99 persons per household, with married-couple households (200 | 37.2%) accounting for the largest median household size of 2.76 persons per household. non-family households (252 | 46.8%) represent the smallest median household size with 1.20 persons per household.
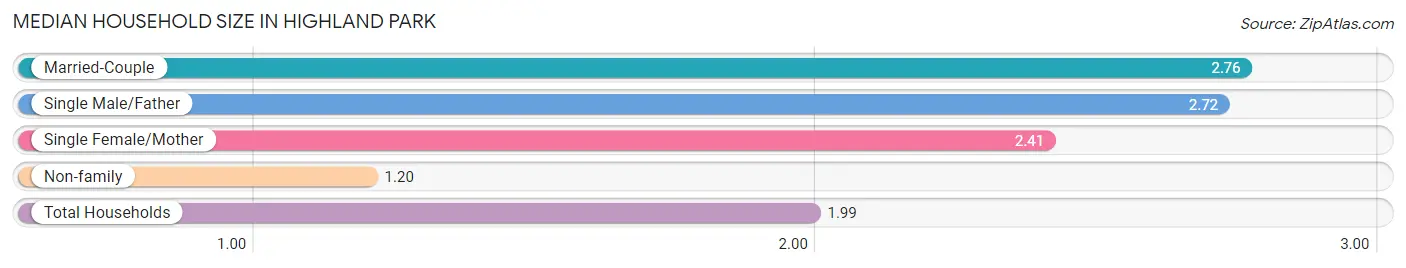
| Household Type | # Households | Household Size |
| Married-Couple | 200 (37.2%) | 2.76 |
| Single Male/Father | 25 (4.6%) | 2.72 |
| Single Female/Mother | 61 (11.3%) | 2.41 |
| Non-family | 252 (46.8%) | 1.20 |
| Total Households | 538 (100.0%) | 1.99 |
Household Size by Marriage Status in Highland Park
Out of a total of 538 households in Highland Park, 286 (53.2%) are family households, while 252 (46.8%) are nonfamily households. The most numerous type of family households are 2-person households, comprising 171, and the most common type of nonfamily households are 1-person households, comprising 201.
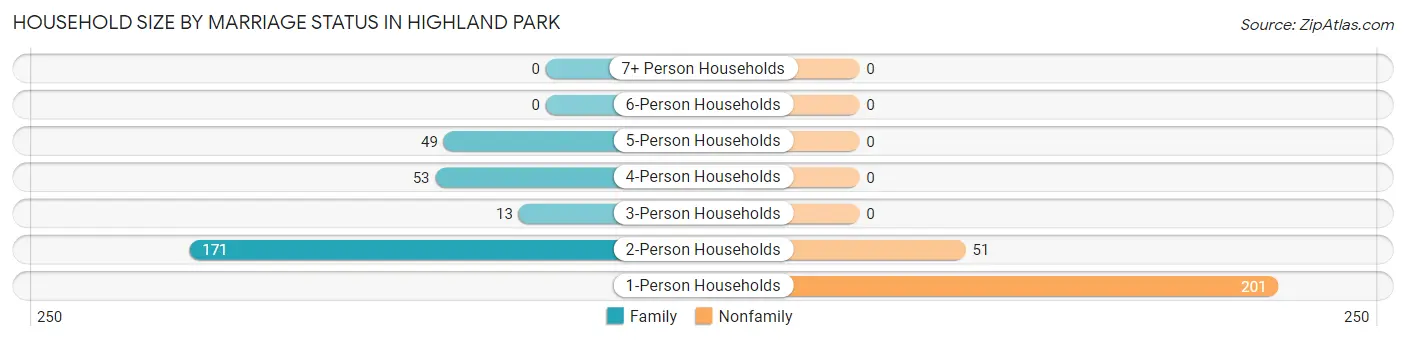
| Household Size | Family Households | Nonfamily Households |
| 1-Person Households | - | 201 (37.4%) |
| 2-Person Households | 171 (31.8%) | 51 (9.5%) |
| 3-Person Households | 13 (2.4%) | 0 (0.0%) |
| 4-Person Households | 53 (9.9%) | 0 (0.0%) |
| 5-Person Households | 49 (9.1%) | 0 (0.0%) |
| 6-Person Households | 0 (0.0%) | 0 (0.0%) |
| 7+ Person Households | 0 (0.0%) | 0 (0.0%) |
| Total | 286 (53.2%) | 252 (46.8%) |
Female Fertility in Highland Park
Fertility by Age in Highland Park
Average fertility rate in Highland Park is 53.0 births per 1,000 women. Women in the age bracket of 20 to 34 years have the highest fertility rate with 73.0 births per 1,000 women. Women in the age bracket of 20 to 34 years acount for 100.0% of all women with births.
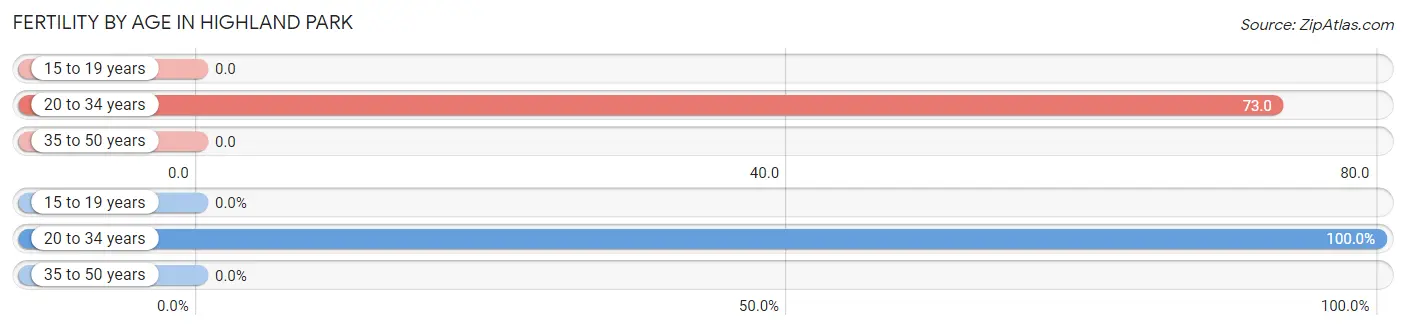
| Age Bracket | Women with Births | Births / 1,000 Women |
| 15 to 19 years | 0 (0.0%) | 0.0 |
| 20 to 34 years | 12 (100.0%) | 73.0 |
| 35 to 50 years | 0 (0.0%) | 0.0 |
| Total | 12 (100.0%) | 53.0 |
Fertility by Age by Marriage Status in Highland Park
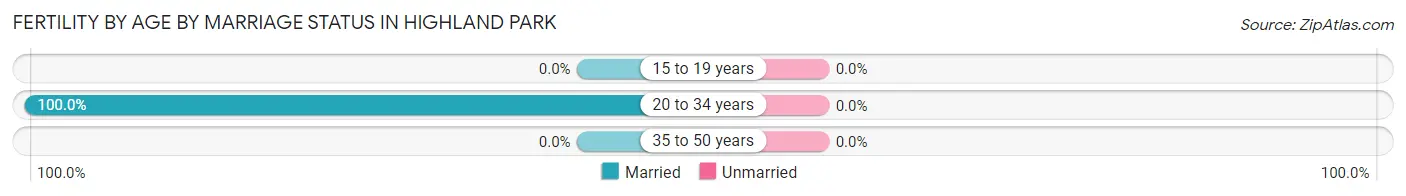
| Age Bracket | Married | Unmarried |
| 15 to 19 years | 0 (0.0%) | 0 (0.0%) |
| 20 to 34 years | 12 (100.0%) | 0 (0.0%) |
| 35 to 50 years | 0 (0.0%) | 0 (0.0%) |
| Total | 12 (100.0%) | 0 (0.0%) |
Fertility by Education in Highland Park
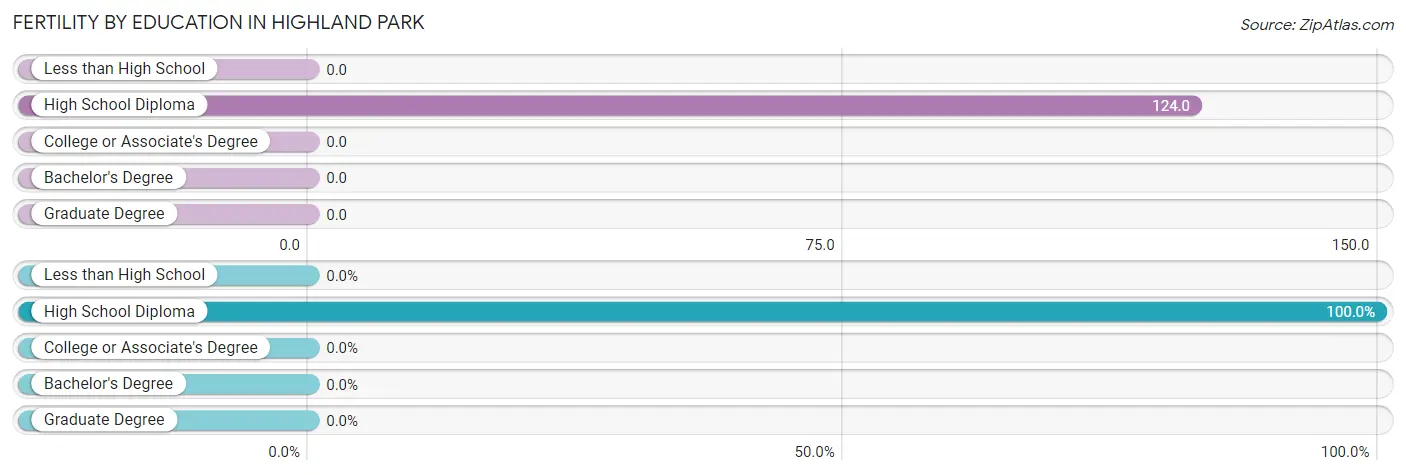
| Educational Attainment | Women with Births | Births / 1,000 Women |
| Less than High School | 0 (0.0%) | 0.0 |
| High School Diploma | 12 (100.0%) | 124.0 |
| College or Associate's Degree | 0 (0.0%) | 0.0 |
| Bachelor's Degree | 0 (0.0%) | 0.0 |
| Graduate Degree | 0 (0.0%) | 0.0 |
| Total | 12 (100.0%) | 53.0 |
Fertility by Education by Marriage Status in Highland Park
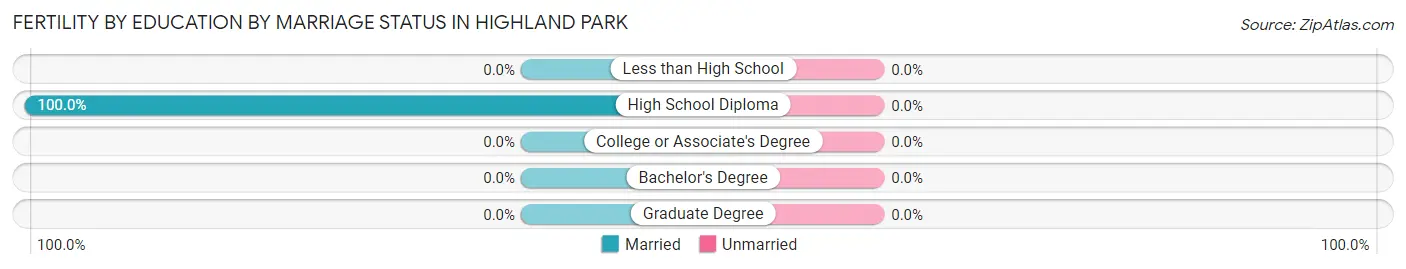
| Educational Attainment | Married | Unmarried |
| Less than High School | 0 (0.0%) | 0 (0.0%) |
| High School Diploma | 12 (100.0%) | 0 (0.0%) |
| College or Associate's Degree | 0 (0.0%) | 0 (0.0%) |
| Bachelor's Degree | 0 (0.0%) | 0 (0.0%) |
| Graduate Degree | 0 (0.0%) | 0 (0.0%) |
| Total | 12 (100.0%) | 0 (0.0%) |
Employment Characteristics in Highland Park
Employment by Class of Employer in Highland Park
Among the 571 employed individuals in Highland Park, private company employees (393 | 68.8%), not-for-profit organizations (83 | 14.5%), and local government employees (51 | 8.9%) make up the most common classes of employment.
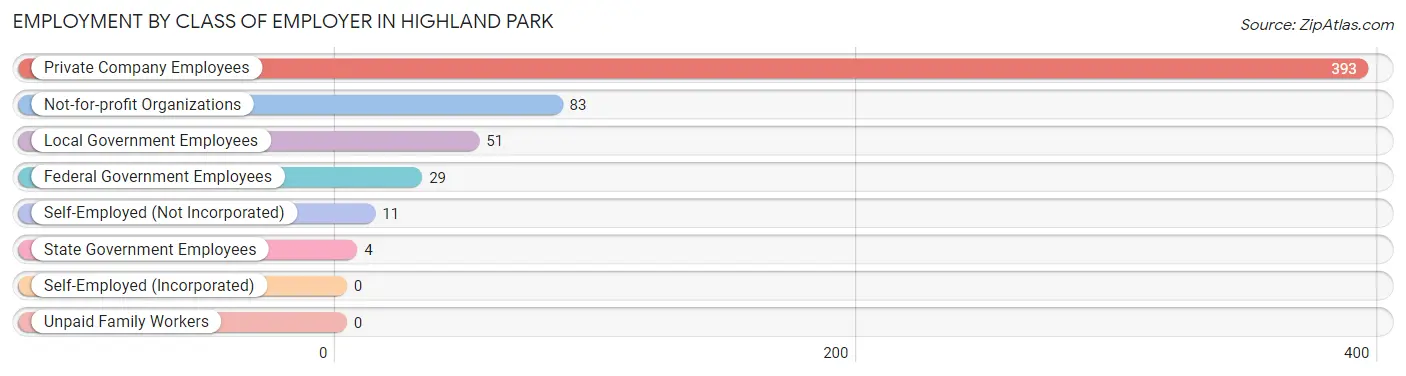
| Employer Class | # Employees | % Employees |
| Private Company Employees | 393 | 68.8% |
| Self-Employed (Incorporated) | 0 | 0.0% |
| Self-Employed (Not Incorporated) | 11 | 1.9% |
| Not-for-profit Organizations | 83 | 14.5% |
| Local Government Employees | 51 | 8.9% |
| State Government Employees | 4 | 0.7% |
| Federal Government Employees | 29 | 5.1% |
| Unpaid Family Workers | 0 | 0.0% |
| Total | 571 | 100.0% |
Employment Status by Age in Highland Park
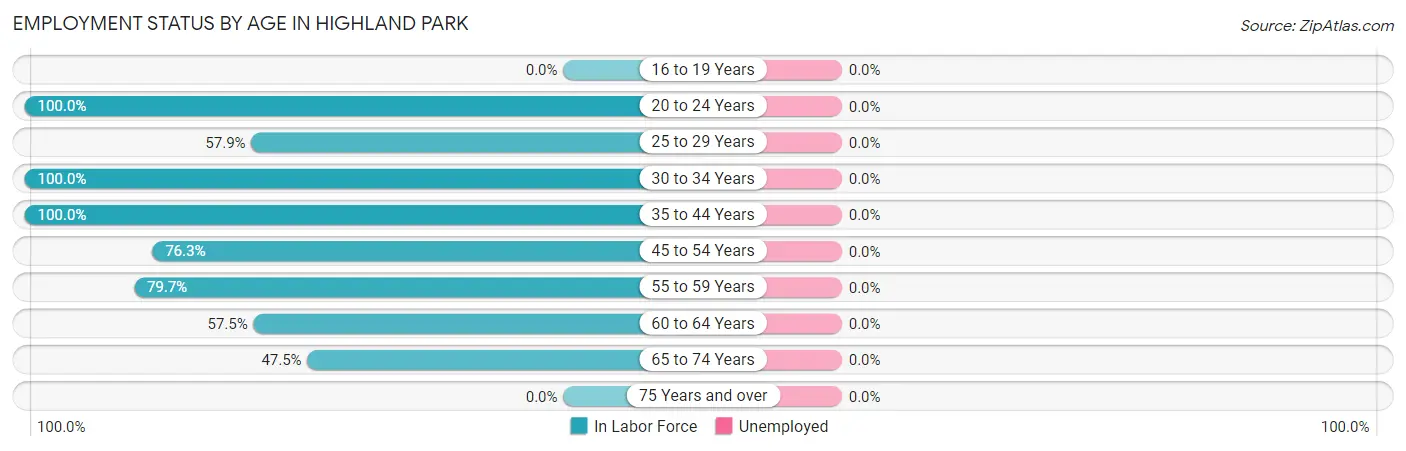
| Age Bracket | In Labor Force | Unemployed |
| 16 to 19 Years | 0 (0.0%) | 0 (0.0%) |
| 20 to 24 Years | 84 (100.0%) | 0 (0.0%) |
| 25 to 29 Years | 81 (57.9%) | 0 (0.0%) |
| 30 to 34 Years | 37 (100.0%) | 0 (0.0%) |
| 35 to 44 Years | 49 (100.0%) | 0 (0.0%) |
| 45 to 54 Years | 87 (76.3%) | 0 (0.0%) |
| 55 to 59 Years | 55 (79.7%) | 0 (0.0%) |
| 60 to 64 Years | 73 (57.5%) | 0 (0.0%) |
| 65 to 74 Years | 105 (47.5%) | 0 (0.0%) |
| 75 Years and over | 0 (0.0%) | 0 (0.0%) |
| Total | 571 (55.3%) | 0 (0.0%) |
Employment Status by Educational Attainment in Highland Park
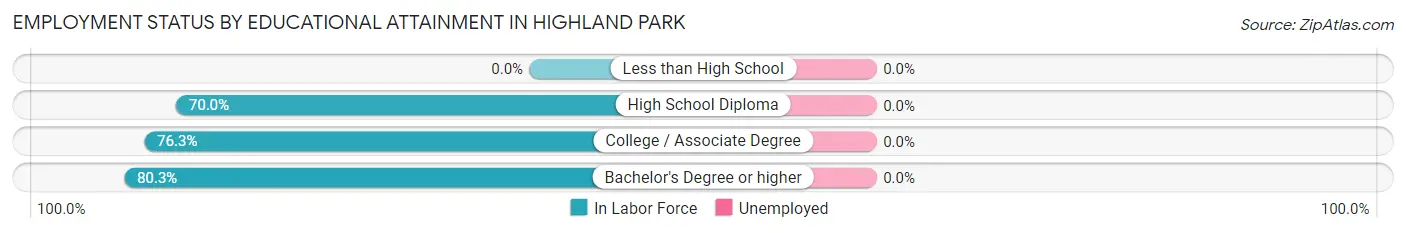
| Educational Attainment | In Labor Force | Unemployed |
| Less than High School | 0 (0.0%) | 0 (0.0%) |
| High School Diploma | 163 (70.0%) | 0 (0.0%) |
| College / Associate Degree | 158 (76.3%) | 0 (0.0%) |
| Bachelor's Degree or higher | 61 (80.3%) | 0 (0.0%) |
| Total | 382 (71.3%) | 0 (0.0%) |
Employment Occupations by Sex in Highland Park
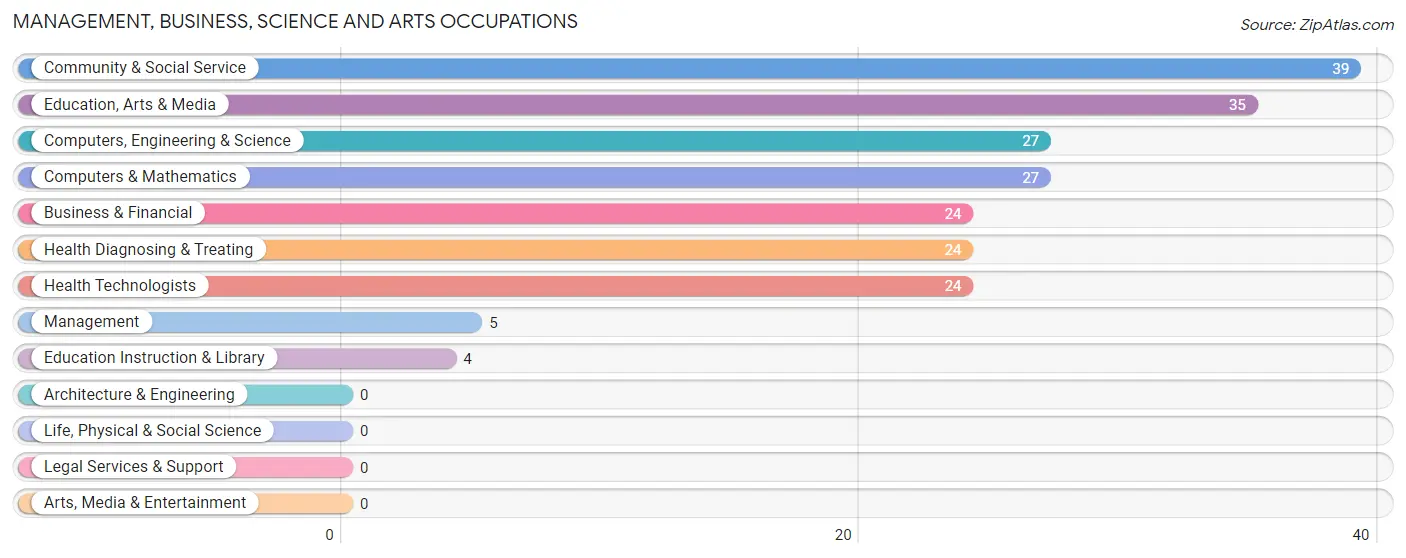
Management, Business, Science and Arts Occupations
The most common Management, Business, Science and Arts occupations in Highland Park are Community & Social Service (39 | 6.8%), Education, Arts & Media (35 | 6.1%), Computers, Engineering & Science (27 | 4.7%), Computers & Mathematics (27 | 4.7%), and Business & Financial (24 | 4.2%).
Management, Business, Science and Arts Occupations by Sex
Within the Management, Business, Science and Arts occupations in Highland Park, the most male-oriented occupations are Business & Financial (100.0%), Community & Social Service (100.0%), and Education, Arts & Media (100.0%), while the most female-oriented occupations are Management (100.0%), Computers, Engineering & Science (100.0%), and Computers & Mathematics (100.0%).
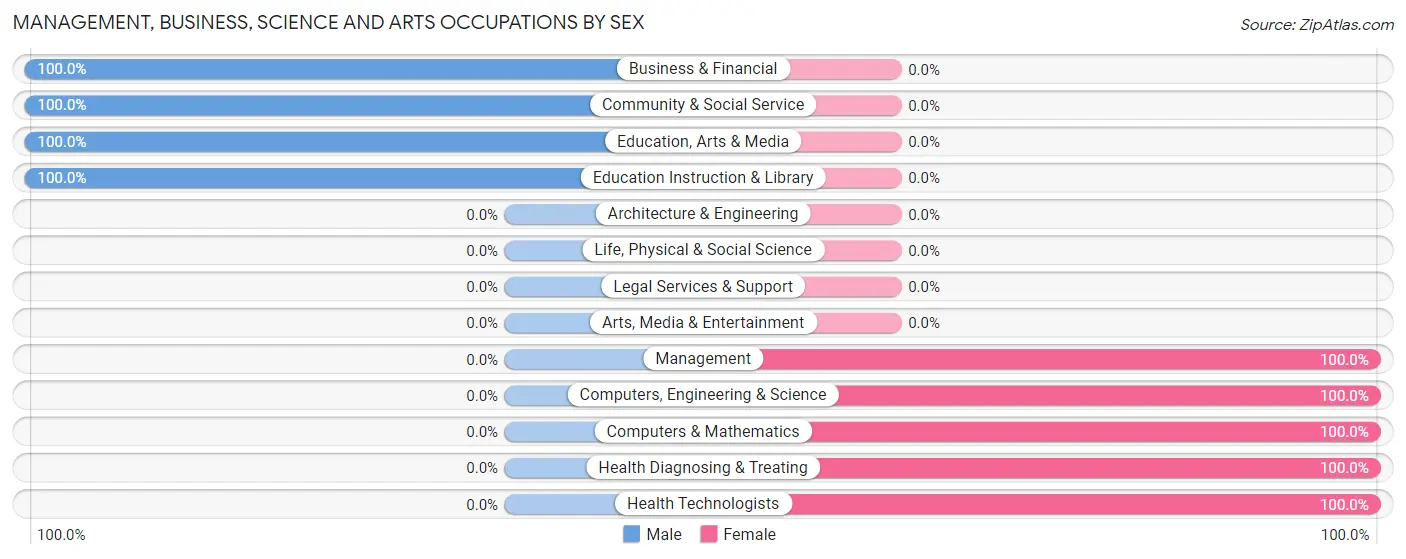
| Occupation | Male | Female |
| Management | 0 (0.0%) | 5 (100.0%) |
| Business & Financial | 24 (100.0%) | 0 (0.0%) |
| Computers, Engineering & Science | 0 (0.0%) | 27 (100.0%) |
| Computers & Mathematics | 0 (0.0%) | 27 (100.0%) |
| Architecture & Engineering | 0 (0.0%) | 0 (0.0%) |
| Life, Physical & Social Science | 0 (0.0%) | 0 (0.0%) |
| Community & Social Service | 39 (100.0%) | 0 (0.0%) |
| Education, Arts & Media | 35 (100.0%) | 0 (0.0%) |
| Legal Services & Support | 0 (0.0%) | 0 (0.0%) |
| Education Instruction & Library | 4 (100.0%) | 0 (0.0%) |
| Arts, Media & Entertainment | 0 (0.0%) | 0 (0.0%) |
| Health Diagnosing & Treating | 0 (0.0%) | 24 (100.0%) |
| Health Technologists | 0 (0.0%) | 24 (100.0%) |
| Total (Category) | 63 (52.9%) | 56 (47.1%) |
| Total (Overall) | 259 (45.4%) | 312 (54.6%) |
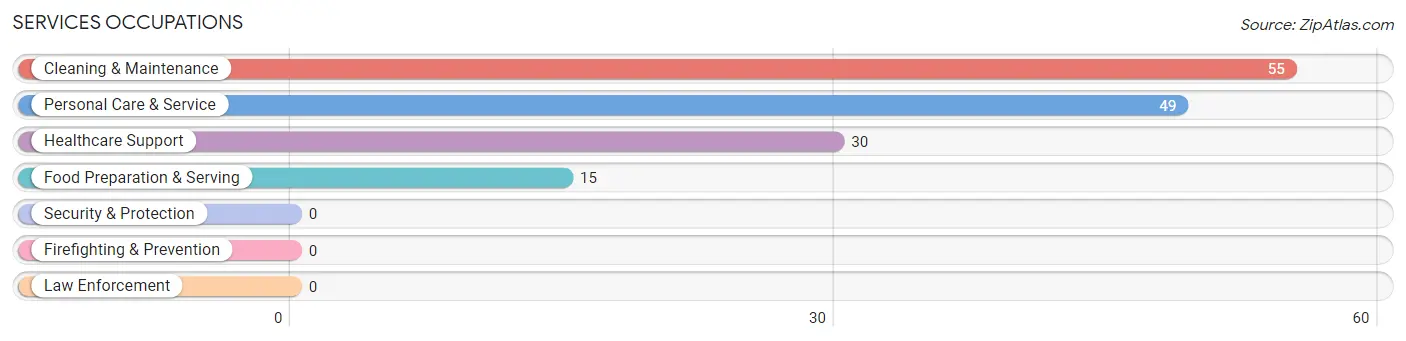
Services Occupations
The most common Services occupations in Highland Park are Cleaning & Maintenance (55 | 9.6%), Personal Care & Service (49 | 8.6%), Healthcare Support (30 | 5.2%), and Food Preparation & Serving (15 | 2.6%).
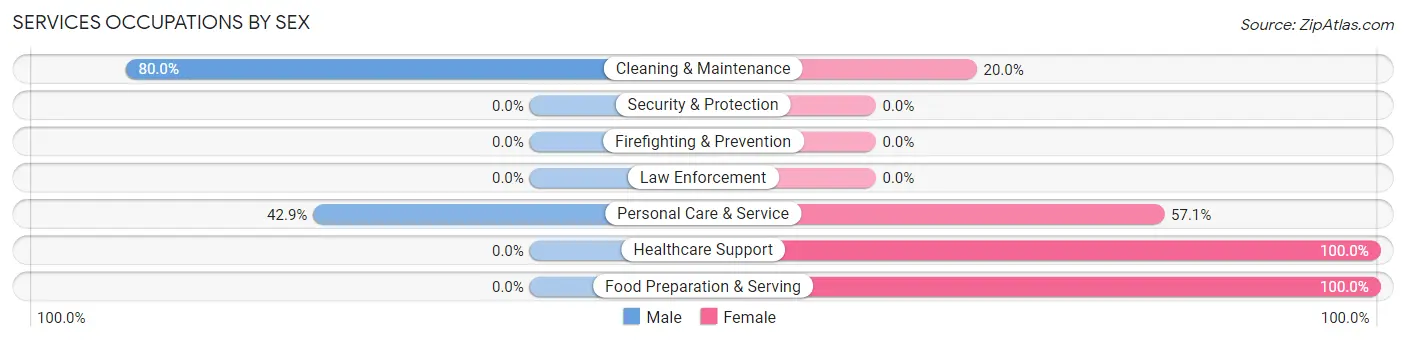
Services Occupations by Sex
Within the Services occupations in Highland Park, the most male-oriented occupations are Cleaning & Maintenance (80.0%), and Personal Care & Service (42.9%), while the most female-oriented occupations are Healthcare Support (100.0%), Food Preparation & Serving (100.0%), and Personal Care & Service (57.1%).
| Occupation | Male | Female |
| Healthcare Support | 0 (0.0%) | 30 (100.0%) |
| Security & Protection | 0 (0.0%) | 0 (0.0%) |
| Firefighting & Prevention | 0 (0.0%) | 0 (0.0%) |
| Law Enforcement | 0 (0.0%) | 0 (0.0%) |
| Food Preparation & Serving | 0 (0.0%) | 15 (100.0%) |
| Cleaning & Maintenance | 44 (80.0%) | 11 (20.0%) |
| Personal Care & Service | 21 (42.9%) | 28 (57.1%) |
| Total (Category) | 65 (43.6%) | 84 (56.4%) |
| Total (Overall) | 259 (45.4%) | 312 (54.6%) |
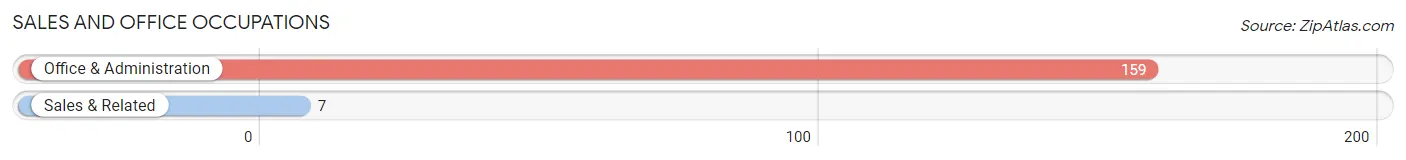
Sales and Office Occupations
The most common Sales and Office occupations in Highland Park are Office & Administration (159 | 27.9%), and Sales & Related (7 | 1.2%).
Sales and Office Occupations by Sex
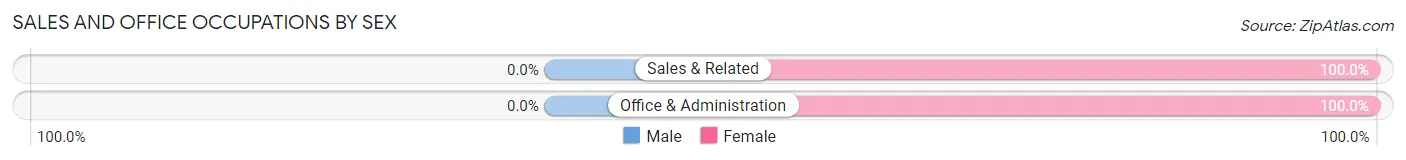
| Occupation | Male | Female |
| Sales & Related | 0 (0.0%) | 7 (100.0%) |
| Office & Administration | 0 (0.0%) | 159 (100.0%) |
| Total (Category) | 0 (0.0%) | 166 (100.0%) |
| Total (Overall) | 259 (45.4%) | 312 (54.6%) |
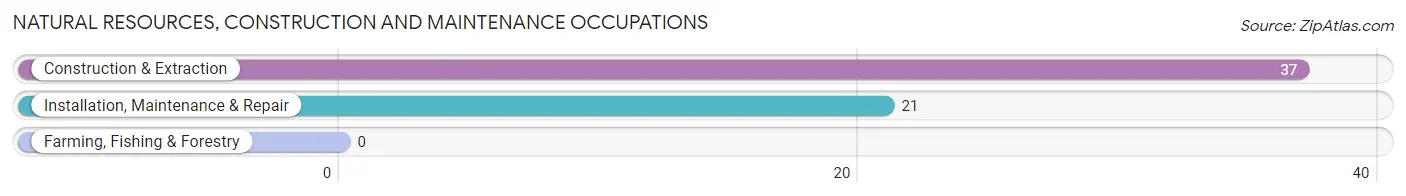
Natural Resources, Construction and Maintenance Occupations
The most common Natural Resources, Construction and Maintenance occupations in Highland Park are Construction & Extraction (37 | 6.5%), and Installation, Maintenance & Repair (21 | 3.7%).
Natural Resources, Construction and Maintenance Occupations by Sex
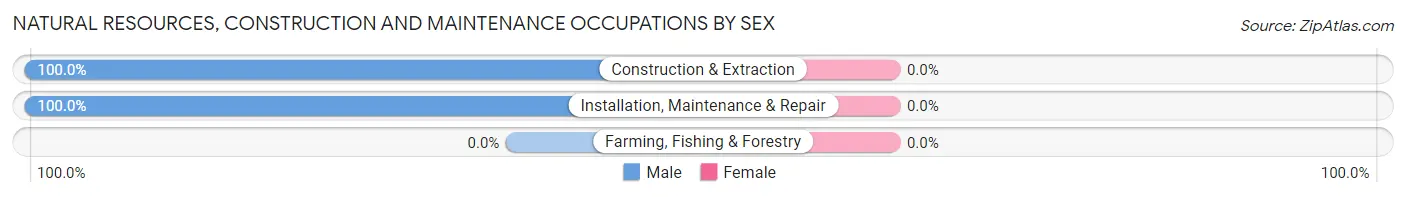
| Occupation | Male | Female |
| Farming, Fishing & Forestry | 0 (0.0%) | 0 (0.0%) |
| Construction & Extraction | 37 (100.0%) | 0 (0.0%) |
| Installation, Maintenance & Repair | 21 (100.0%) | 0 (0.0%) |
| Total (Category) | 58 (100.0%) | 0 (0.0%) |
| Total (Overall) | 259 (45.4%) | 312 (54.6%) |
Production, Transportation and Moving Occupations
The most common Production, Transportation and Moving occupations in Highland Park are Material Moving (68 | 11.9%), and Production (11 | 1.9%).
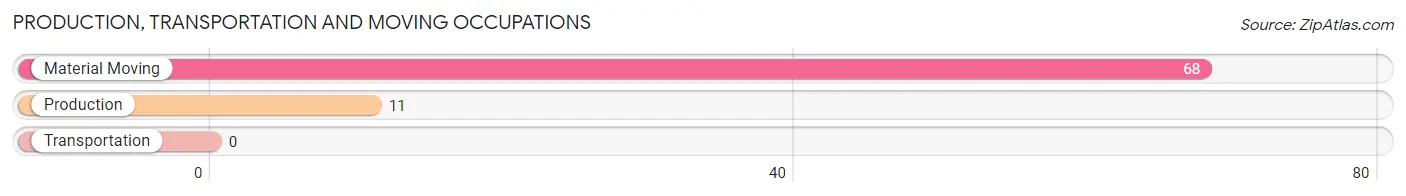
Production, Transportation and Moving Occupations by Sex
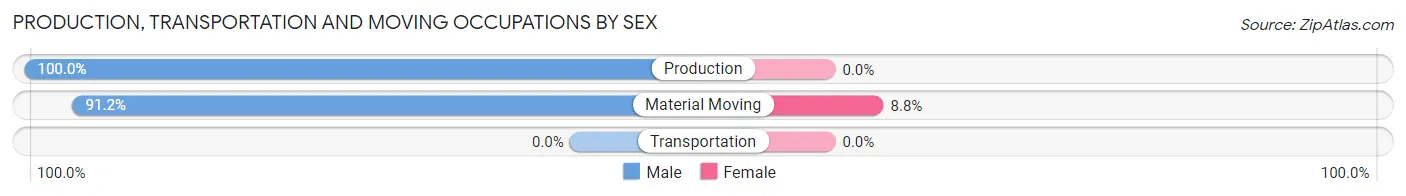
| Occupation | Male | Female |
| Production | 11 (100.0%) | 0 (0.0%) |
| Transportation | 0 (0.0%) | 0 (0.0%) |
| Material Moving | 62 (91.2%) | 6 (8.8%) |
| Total (Category) | 73 (92.4%) | 6 (7.6%) |
| Total (Overall) | 259 (45.4%) | 312 (54.6%) |
Employment Industries by Sex in Highland Park
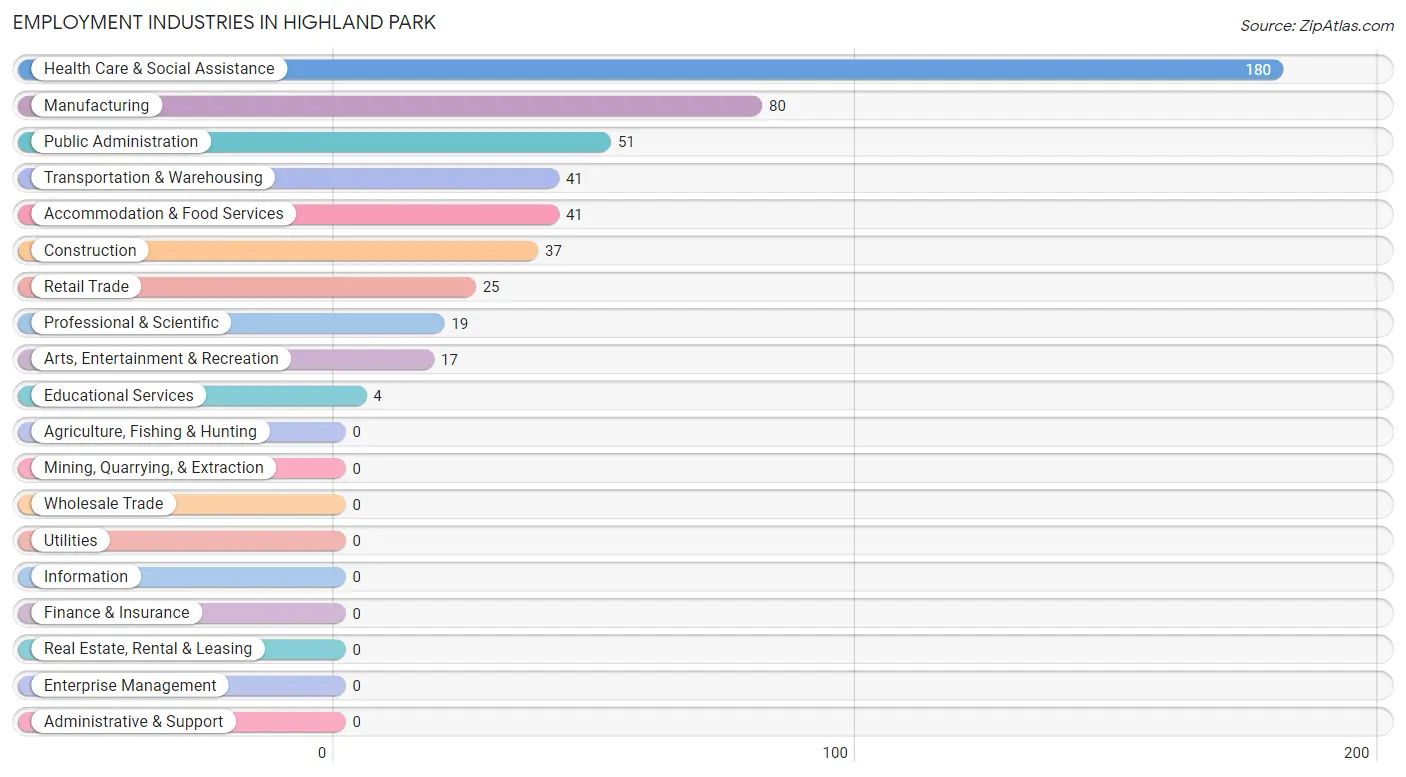
Employment Industries in Highland Park
The major employment industries in Highland Park include Health Care & Social Assistance (180 | 31.5%), Manufacturing (80 | 14.0%), Public Administration (51 | 8.9%), Transportation & Warehousing (41 | 7.2%), and Accommodation & Food Services (41 | 7.2%).
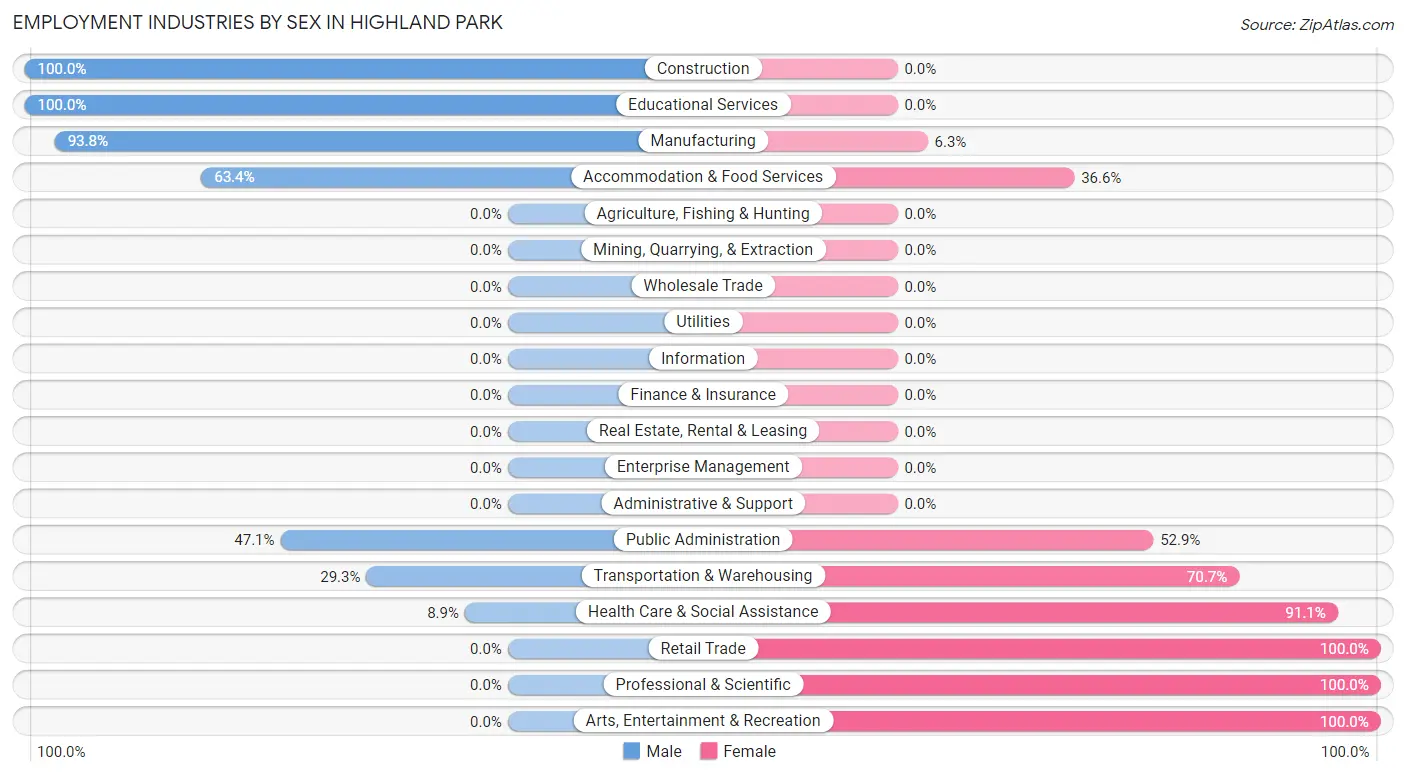
Employment Industries by Sex in Highland Park
The Highland Park industries that see more men than women are Construction (100.0%), Educational Services (100.0%), and Manufacturing (93.8%), whereas the industries that tend to have a higher number of women are Retail Trade (100.0%), Professional & Scientific (100.0%), and Arts, Entertainment & Recreation (100.0%).
| Industry | Male | Female |
| Agriculture, Fishing & Hunting | 0 (0.0%) | 0 (0.0%) |
| Mining, Quarrying, & Extraction | 0 (0.0%) | 0 (0.0%) |
| Construction | 37 (100.0%) | 0 (0.0%) |
| Manufacturing | 75 (93.8%) | 5 (6.2%) |
| Wholesale Trade | 0 (0.0%) | 0 (0.0%) |
| Retail Trade | 0 (0.0%) | 25 (100.0%) |
| Transportation & Warehousing | 12 (29.3%) | 29 (70.7%) |
| Utilities | 0 (0.0%) | 0 (0.0%) |
| Information | 0 (0.0%) | 0 (0.0%) |
| Finance & Insurance | 0 (0.0%) | 0 (0.0%) |
| Real Estate, Rental & Leasing | 0 (0.0%) | 0 (0.0%) |
| Professional & Scientific | 0 (0.0%) | 19 (100.0%) |
| Enterprise Management | 0 (0.0%) | 0 (0.0%) |
| Administrative & Support | 0 (0.0%) | 0 (0.0%) |
| Educational Services | 4 (100.0%) | 0 (0.0%) |
| Health Care & Social Assistance | 16 (8.9%) | 164 (91.1%) |
| Arts, Entertainment & Recreation | 0 (0.0%) | 17 (100.0%) |
| Accommodation & Food Services | 26 (63.4%) | 15 (36.6%) |
| Public Administration | 24 (47.1%) | 27 (52.9%) |
| Total | 259 (45.4%) | 312 (54.6%) |
Education in Highland Park
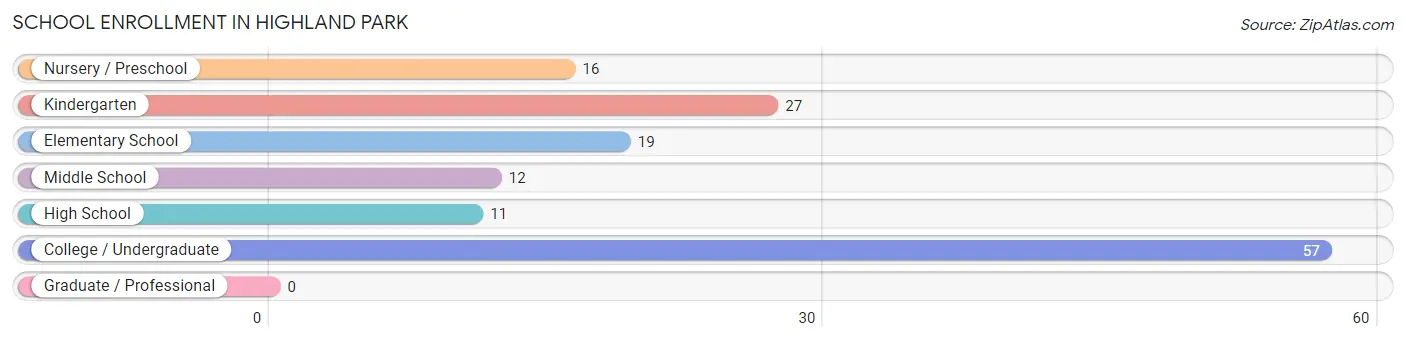
School Enrollment in Highland Park
The most common levels of schooling among the 142 students in Highland Park are college / undergraduate (57 | 40.1%), kindergarten (27 | 19.0%), and elementary school (19 | 13.4%).
| School Level | # Students | % Students |
| Nursery / Preschool | 16 | 11.3% |
| Kindergarten | 27 | 19.0% |
| Elementary School | 19 | 13.4% |
| Middle School | 12 | 8.5% |
| High School | 11 | 7.7% |
| College / Undergraduate | 57 | 40.1% |
| Graduate / Professional | 0 | 0.0% |
| Total | 142 | 100.0% |
School Enrollment by Age by Funding Source in Highland Park
Out of a total of 142 students who are enrolled in schools in Highland Park, 19 (13.4%) attend a private institution, while the remaining 123 (86.6%) are enrolled in public schools. The age group of 5 to 9 year old has the highest likelihood of being enrolled in private schools, with 19 (41.3% in the age bracket) enrolled. Conversely, the age group of 3 to 4 year olds has the lowest likelihood of being enrolled in a private school, with 16 (100.0% in the age bracket) attending a public institution.
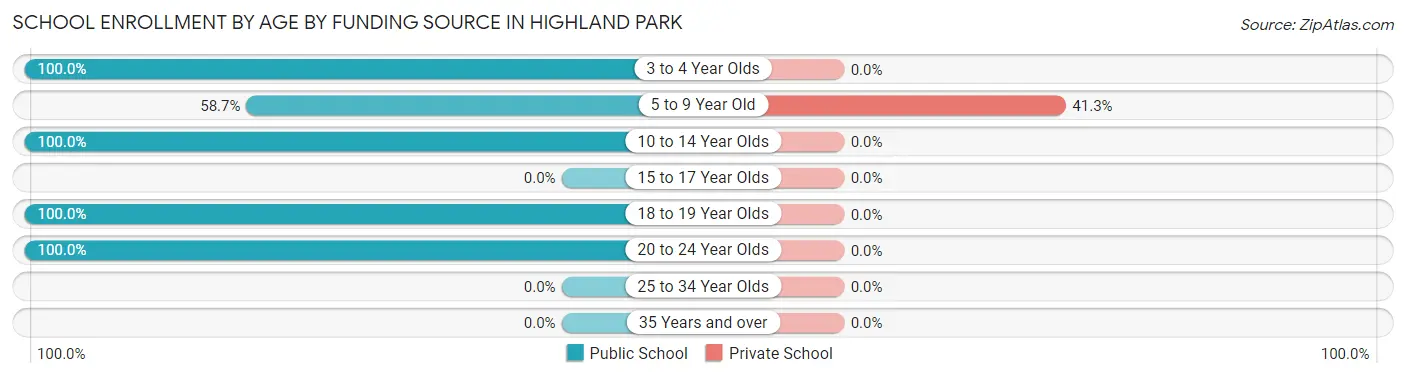
| Age Bracket | Public School | Private School |
| 3 to 4 Year Olds | 16 (100.0%) | 0 (0.0%) |
| 5 to 9 Year Old | 27 (58.7%) | 19 (41.3%) |
| 10 to 14 Year Olds | 12 (100.0%) | 0 (0.0%) |
| 15 to 17 Year Olds | 0 (0.0%) | 0 (0.0%) |
| 18 to 19 Year Olds | 11 (100.0%) | 0 (0.0%) |
| 20 to 24 Year Olds | 57 (100.0%) | 0 (0.0%) |
| 25 to 34 Year Olds | 0 (0.0%) | 0 (0.0%) |
| 35 Years and over | 0 (0.0%) | 0 (0.0%) |
| Total | 123 (86.6%) | 19 (13.4%) |
Educational Attainment by Field of Study in Highland Park
Business (60 | 27.7%), liberal arts & history (49 | 22.6%), literature & languages (45 | 20.7%), communications (27 | 12.4%), and education (15 | 6.9%) are the most common fields of study among 217 individuals in Highland Park who have obtained a bachelor's degree or higher.
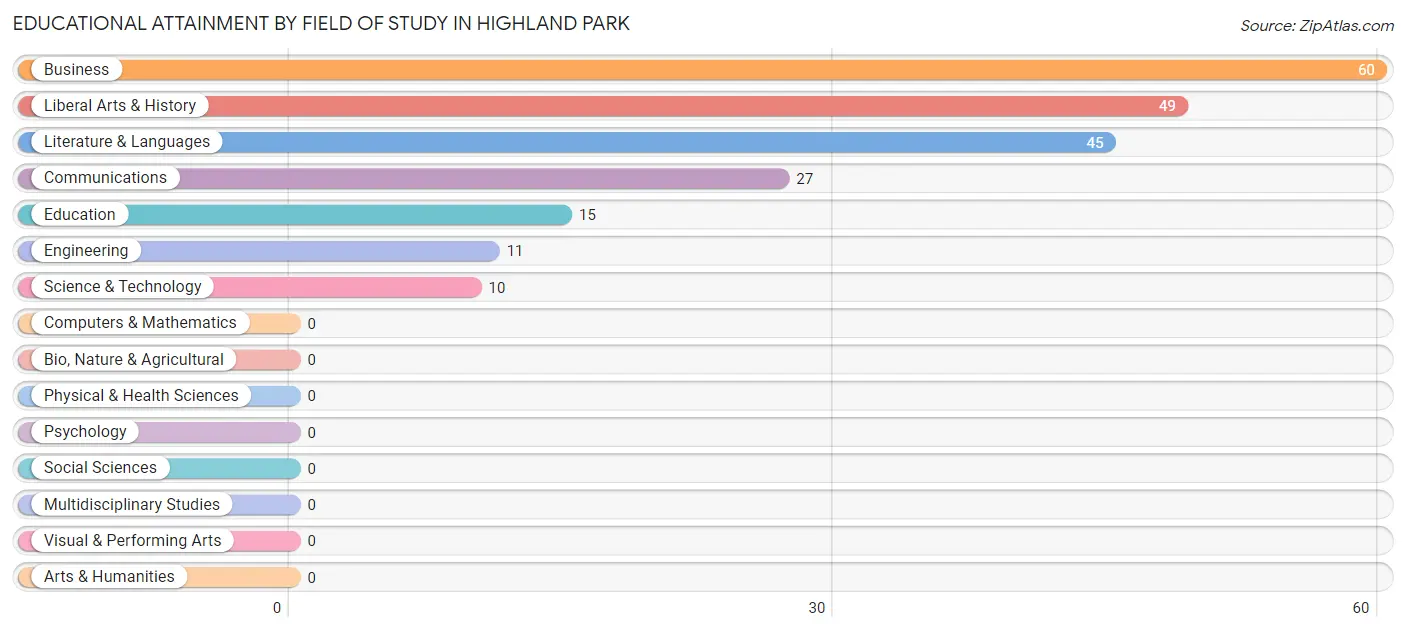
| Field of Study | # Graduates | % Graduates |
| Computers & Mathematics | 0 | 0.0% |
| Bio, Nature & Agricultural | 0 | 0.0% |
| Physical & Health Sciences | 0 | 0.0% |
| Psychology | 0 | 0.0% |
| Social Sciences | 0 | 0.0% |
| Engineering | 11 | 5.1% |
| Multidisciplinary Studies | 0 | 0.0% |
| Science & Technology | 10 | 4.6% |
| Business | 60 | 27.7% |
| Education | 15 | 6.9% |
| Literature & Languages | 45 | 20.7% |
| Liberal Arts & History | 49 | 22.6% |
| Visual & Performing Arts | 0 | 0.0% |
| Communications | 27 | 12.4% |
| Arts & Humanities | 0 | 0.0% |
| Total | 217 | 100.0% |
Transportation & Commute in Highland Park
Vehicle Availability by Sex in Highland Park
The most prevalent vehicle ownership categories in Highland Park are males with 2 vehicles (118, accounting for 46.3%) and females with 2 vehicles (129, making up 37.8%).
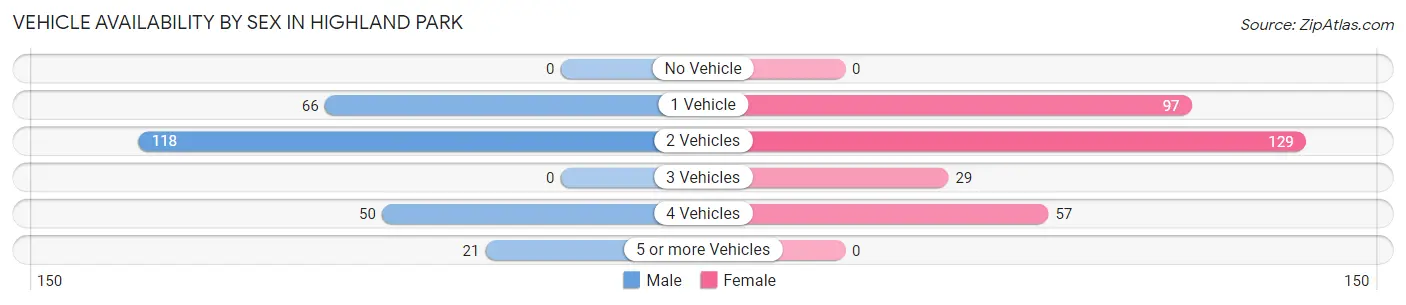
| Vehicles Available | Male | Female |
| No Vehicle | 0 (0.0%) | 0 (0.0%) |
| 1 Vehicle | 66 (25.9%) | 97 (31.1%) |
| 2 Vehicles | 118 (46.3%) | 129 (41.3%) |
| 3 Vehicles | 0 (0.0%) | 29 (9.3%) |
| 4 Vehicles | 50 (19.6%) | 57 (18.3%) |
| 5 or more Vehicles | 21 (8.2%) | 0 (0.0%) |
| Total | 255 (100.0%) | 312 (100.0%) |
Commute Time in Highland Park
The most frequently occuring commute durations in Highland Park are 5 to 9 minutes (224 commuters, 40.7%), 10 to 14 minutes (78 commuters, 14.2%), and 90 or more minutes (49 commuters, 8.9%).
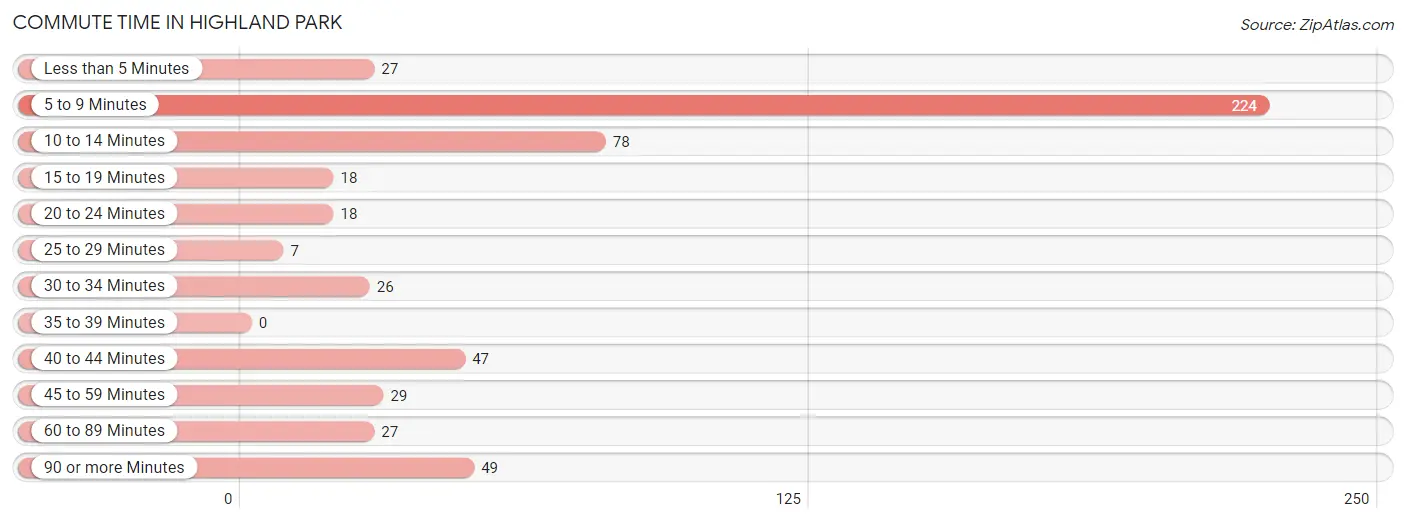
| Commute Time | # Commuters | % Commuters |
| Less than 5 Minutes | 27 | 4.9% |
| 5 to 9 Minutes | 224 | 40.7% |
| 10 to 14 Minutes | 78 | 14.2% |
| 15 to 19 Minutes | 18 | 3.3% |
| 20 to 24 Minutes | 18 | 3.3% |
| 25 to 29 Minutes | 7 | 1.3% |
| 30 to 34 Minutes | 26 | 4.7% |
| 35 to 39 Minutes | 0 | 0.0% |
| 40 to 44 Minutes | 47 | 8.6% |
| 45 to 59 Minutes | 29 | 5.3% |
| 60 to 89 Minutes | 27 | 4.9% |
| 90 or more Minutes | 49 | 8.9% |
Commute Time by Sex in Highland Park
The most common commute times in Highland Park are 5 to 9 minutes (106 commuters, 44.5%) for males and 5 to 9 minutes (118 commuters, 37.8%) for females.
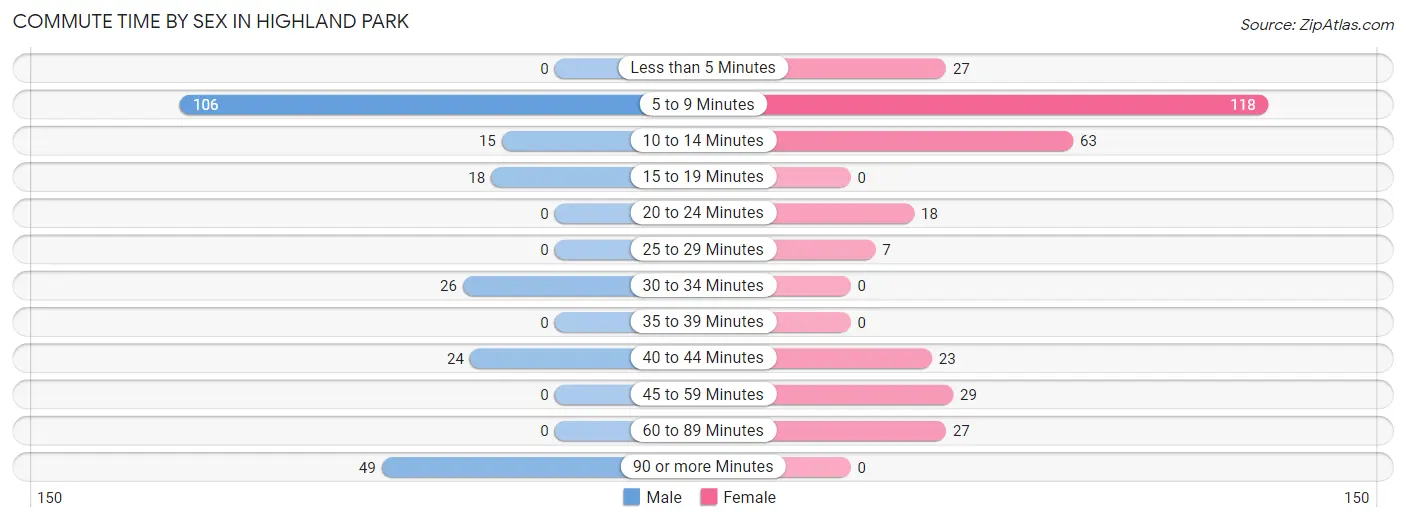
| Commute Time | Male | Female |
| Less than 5 Minutes | 0 (0.0%) | 27 (8.6%) |
| 5 to 9 Minutes | 106 (44.5%) | 118 (37.8%) |
| 10 to 14 Minutes | 15 (6.3%) | 63 (20.2%) |
| 15 to 19 Minutes | 18 (7.6%) | 0 (0.0%) |
| 20 to 24 Minutes | 0 (0.0%) | 18 (5.8%) |
| 25 to 29 Minutes | 0 (0.0%) | 7 (2.2%) |
| 30 to 34 Minutes | 26 (10.9%) | 0 (0.0%) |
| 35 to 39 Minutes | 0 (0.0%) | 0 (0.0%) |
| 40 to 44 Minutes | 24 (10.1%) | 23 (7.4%) |
| 45 to 59 Minutes | 0 (0.0%) | 29 (9.3%) |
| 60 to 89 Minutes | 0 (0.0%) | 27 (8.6%) |
| 90 or more Minutes | 49 (20.6%) | 0 (0.0%) |
Time of Departure to Work by Sex in Highland Park
The most frequent times of departure to work in Highland Park are 7:30 AM to 7:59 AM (83, 34.9%) for males and 7:30 AM to 7:59 AM (84, 26.9%) for females.
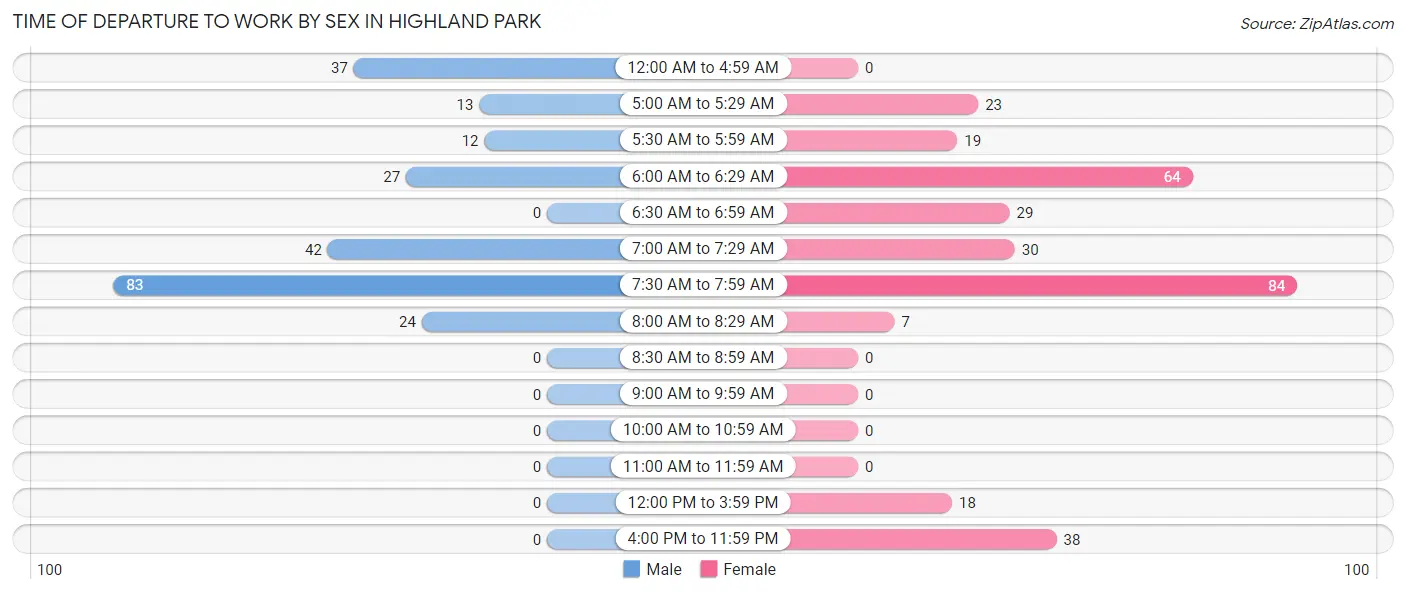
| Time of Departure | Male | Female |
| 12:00 AM to 4:59 AM | 37 (15.5%) | 0 (0.0%) |
| 5:00 AM to 5:29 AM | 13 (5.5%) | 23 (7.4%) |
| 5:30 AM to 5:59 AM | 12 (5.0%) | 19 (6.1%) |
| 6:00 AM to 6:29 AM | 27 (11.3%) | 64 (20.5%) |
| 6:30 AM to 6:59 AM | 0 (0.0%) | 29 (9.3%) |
| 7:00 AM to 7:29 AM | 42 (17.6%) | 30 (9.6%) |
| 7:30 AM to 7:59 AM | 83 (34.9%) | 84 (26.9%) |
| 8:00 AM to 8:29 AM | 24 (10.1%) | 7 (2.2%) |
| 8:30 AM to 8:59 AM | 0 (0.0%) | 0 (0.0%) |
| 9:00 AM to 9:59 AM | 0 (0.0%) | 0 (0.0%) |
| 10:00 AM to 10:59 AM | 0 (0.0%) | 0 (0.0%) |
| 11:00 AM to 11:59 AM | 0 (0.0%) | 0 (0.0%) |
| 12:00 PM to 3:59 PM | 0 (0.0%) | 18 (5.8%) |
| 4:00 PM to 11:59 PM | 0 (0.0%) | 38 (12.2%) |
| Total | 238 (100.0%) | 312 (100.0%) |
Housing Occupancy in Highland Park
Occupancy by Ownership in Highland Park
Of the total 538 dwellings in Highland Park, owner-occupied units account for 328 (61.0%), while renter-occupied units make up 210 (39.0%).
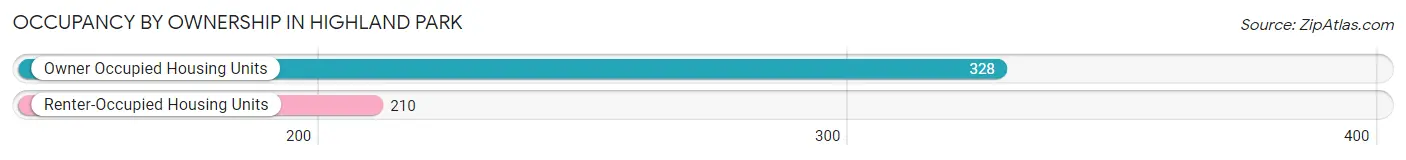
| Occupancy | # Housing Units | % Housing Units |
| Owner Occupied Housing Units | 328 | 61.0% |
| Renter-Occupied Housing Units | 210 | 39.0% |
| Total Occupied Housing Units | 538 | 100.0% |
Occupancy by Household Size in Highland Park
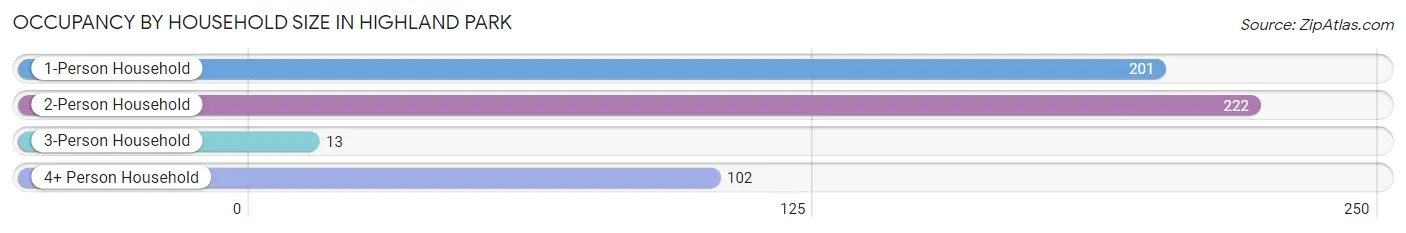
| Household Size | # Housing Units | % Housing Units |
| 1-Person Household | 201 | 37.4% |
| 2-Person Household | 222 | 41.3% |
| 3-Person Household | 13 | 2.4% |
| 4+ Person Household | 102 | 19.0% |
| Total Housing Units | 538 | 100.0% |
Occupancy by Ownership by Household Size in Highland Park
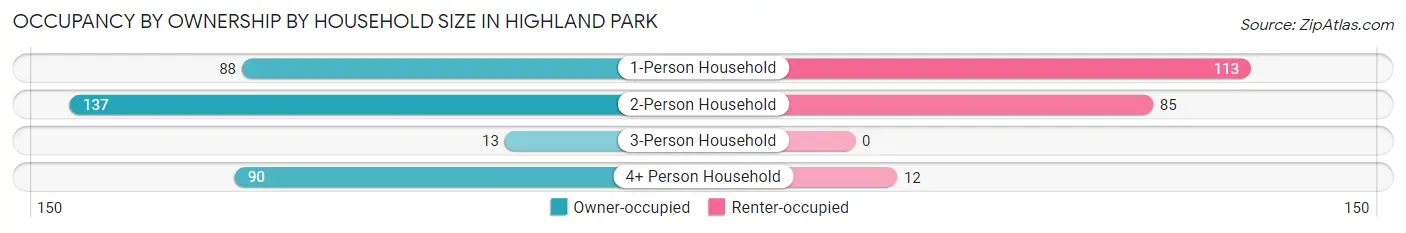
| Household Size | Owner-occupied | Renter-occupied |
| 1-Person Household | 88 (43.8%) | 113 (56.2%) |
| 2-Person Household | 137 (61.7%) | 85 (38.3%) |
| 3-Person Household | 13 (100.0%) | 0 (0.0%) |
| 4+ Person Household | 90 (88.2%) | 12 (11.8%) |
| Total Housing Units | 328 (61.0%) | 210 (39.0%) |
Occupancy by Educational Attainment in Highland Park
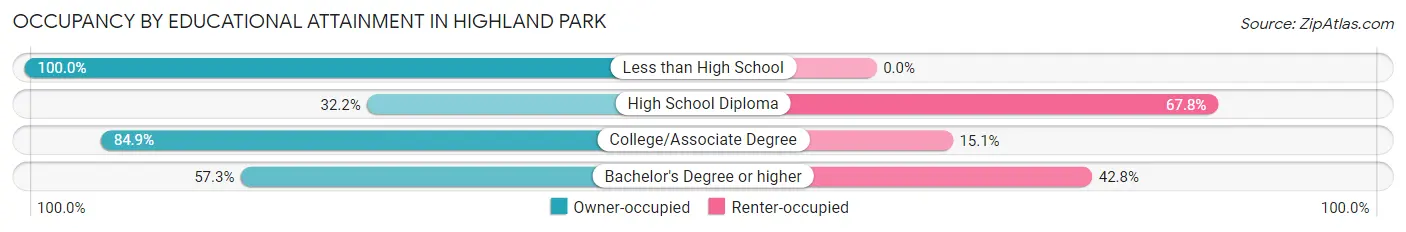
| Household Size | Owner-occupied | Renter-occupied |
| Less than High School | 18 (100.0%) | 0 (0.0%) |
| High School Diploma | 57 (32.2%) | 120 (67.8%) |
| College/Associate Degree | 174 (84.9%) | 31 (15.1%) |
| Bachelor's Degree or higher | 79 (57.3%) | 59 (42.7%) |
Occupancy by Age of Householder in Highland Park
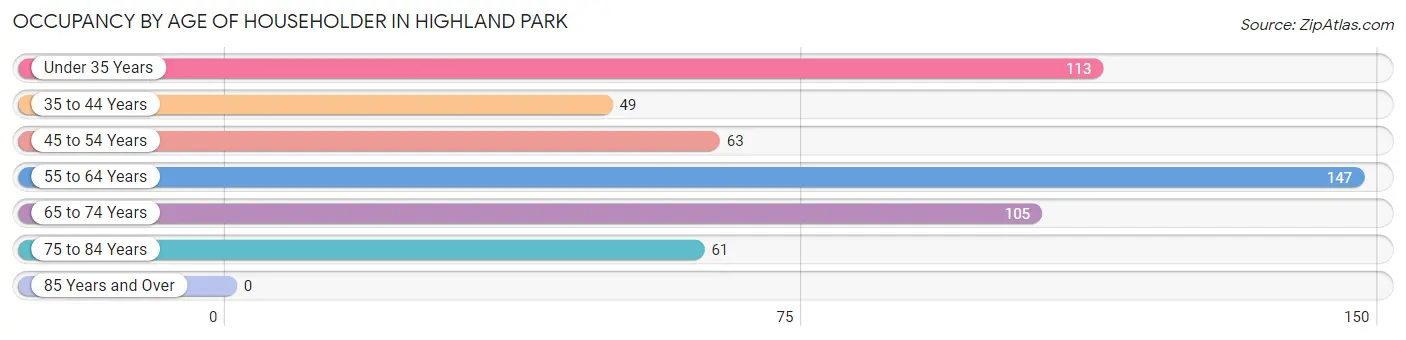
| Age Bracket | # Households | % Households |
| Under 35 Years | 113 | 21.0% |
| 35 to 44 Years | 49 | 9.1% |
| 45 to 54 Years | 63 | 11.7% |
| 55 to 64 Years | 147 | 27.3% |
| 65 to 74 Years | 105 | 19.5% |
| 75 to 84 Years | 61 | 11.3% |
| 85 Years and Over | 0 | 0.0% |
| Total | 538 | 100.0% |
Housing Finances in Highland Park
Median Income by Occupancy in Highland Park
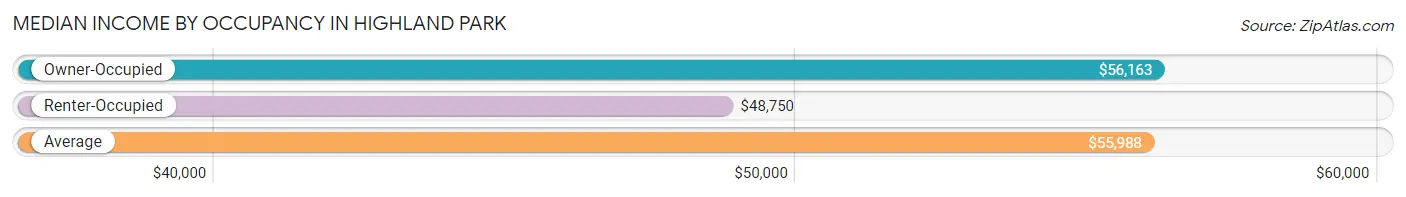
| Occupancy Type | # Households | Median Income |
| Owner-Occupied | 328 (61.0%) | $56,163 |
| Renter-Occupied | 210 (39.0%) | $48,750 |
| Average | 538 (100.0%) | $55,988 |
Occupancy by Householder Income Bracket in Highland Park
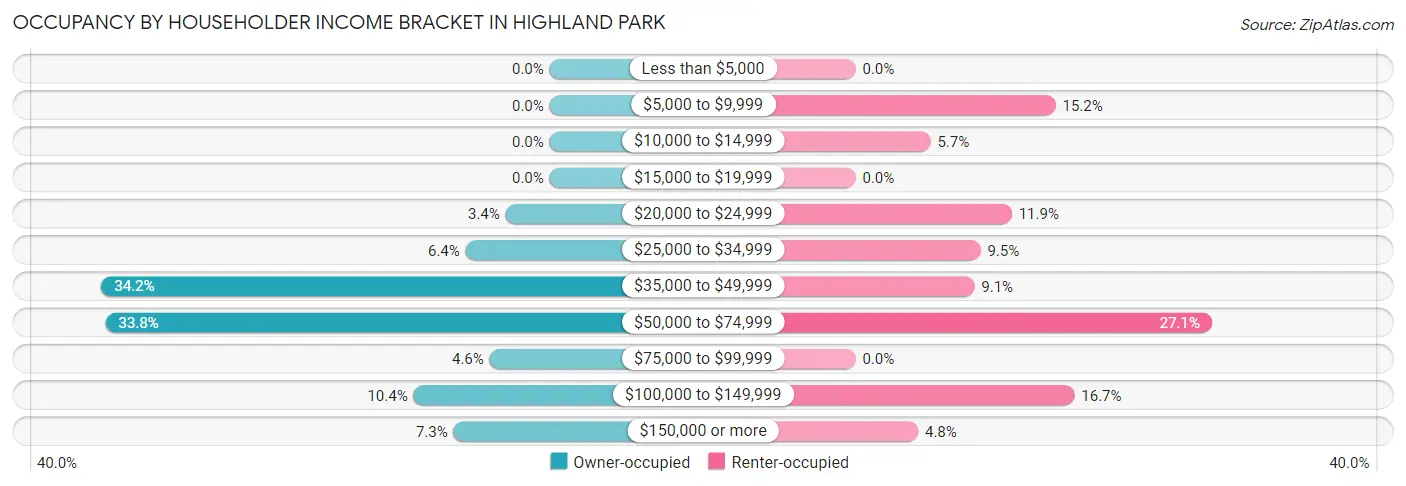
| Income Bracket | Owner-occupied | Renter-occupied |
| Less than $5,000 | 0 (0.0%) | 0 (0.0%) |
| $5,000 to $9,999 | 0 (0.0%) | 32 (15.2%) |
| $10,000 to $14,999 | 0 (0.0%) | 12 (5.7%) |
| $15,000 to $19,999 | 0 (0.0%) | 0 (0.0%) |
| $20,000 to $24,999 | 11 (3.4%) | 25 (11.9%) |
| $25,000 to $34,999 | 21 (6.4%) | 20 (9.5%) |
| $35,000 to $49,999 | 112 (34.2%) | 19 (9.0%) |
| $50,000 to $74,999 | 111 (33.8%) | 57 (27.1%) |
| $75,000 to $99,999 | 15 (4.6%) | 0 (0.0%) |
| $100,000 to $149,999 | 34 (10.4%) | 35 (16.7%) |
| $150,000 or more | 24 (7.3%) | 10 (4.8%) |
| Total | 328 (100.0%) | 210 (100.0%) |
Monthly Housing Cost Tiers in Highland Park
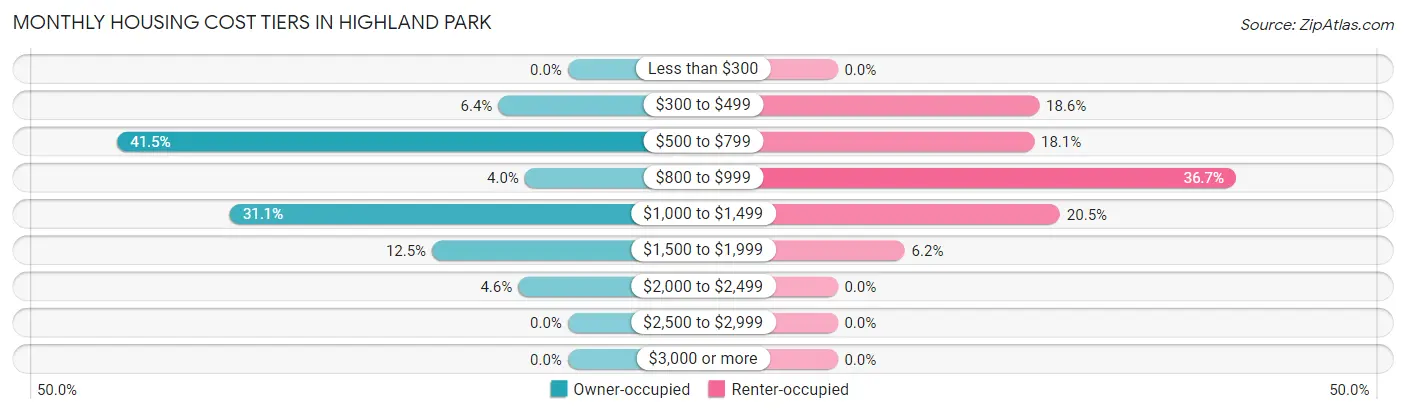
| Monthly Cost | Owner-occupied | Renter-occupied |
| Less than $300 | 0 (0.0%) | 0 (0.0%) |
| $300 to $499 | 21 (6.4%) | 39 (18.6%) |
| $500 to $799 | 136 (41.5%) | 38 (18.1%) |
| $800 to $999 | 13 (4.0%) | 77 (36.7%) |
| $1,000 to $1,499 | 102 (31.1%) | 43 (20.5%) |
| $1,500 to $1,999 | 41 (12.5%) | 13 (6.2%) |
| $2,000 to $2,499 | 15 (4.6%) | 0 (0.0%) |
| $2,500 to $2,999 | 0 (0.0%) | 0 (0.0%) |
| $3,000 or more | 0 (0.0%) | 0 (0.0%) |
| Total | 328 (100.0%) | 210 (100.0%) |
Physical Housing Characteristics in Highland Park
Housing Structures in Highland Park
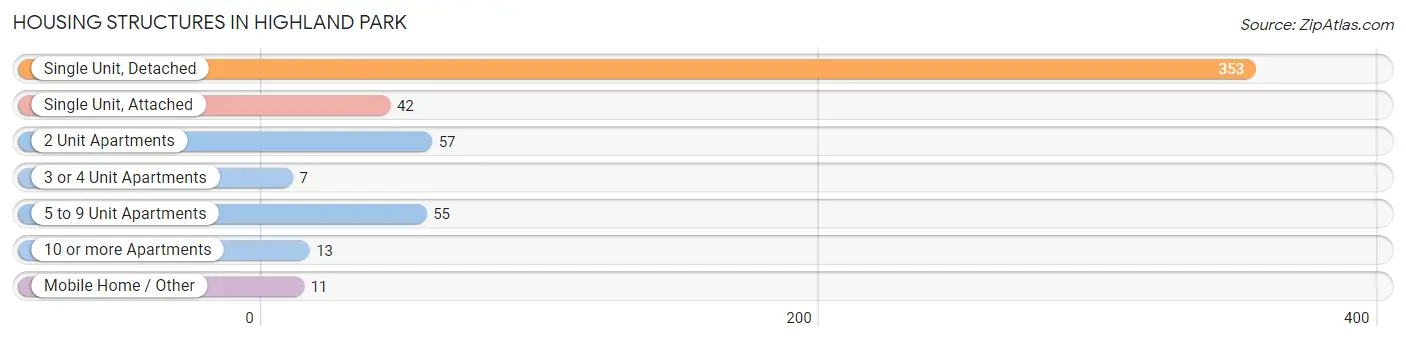
| Structure Type | # Housing Units | % Housing Units |
| Single Unit, Detached | 353 | 65.6% |
| Single Unit, Attached | 42 | 7.8% |
| 2 Unit Apartments | 57 | 10.6% |
| 3 or 4 Unit Apartments | 7 | 1.3% |
| 5 to 9 Unit Apartments | 55 | 10.2% |
| 10 or more Apartments | 13 | 2.4% |
| Mobile Home / Other | 11 | 2.0% |
| Total | 538 | 100.0% |
Housing Structures by Occupancy in Highland Park
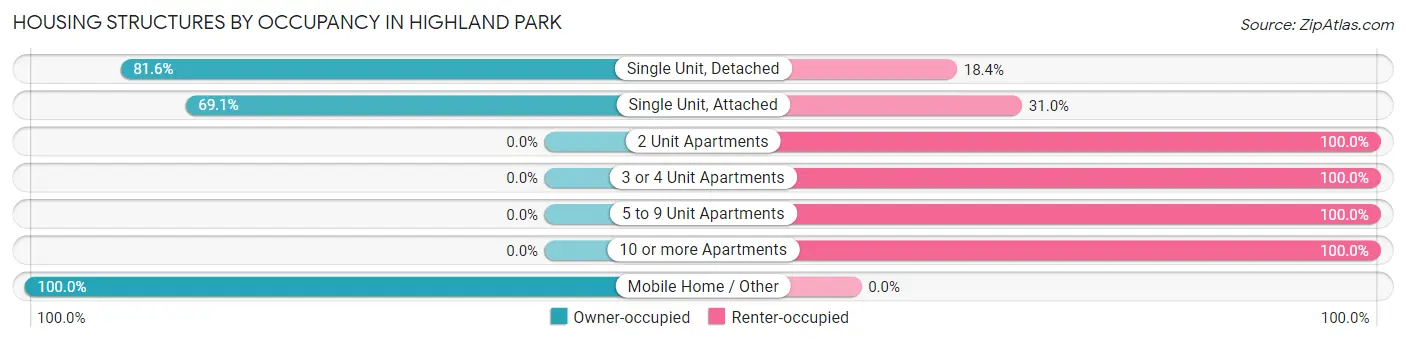
| Structure Type | Owner-occupied | Renter-occupied |
| Single Unit, Detached | 288 (81.6%) | 65 (18.4%) |
| Single Unit, Attached | 29 (69.1%) | 13 (30.9%) |
| 2 Unit Apartments | 0 (0.0%) | 57 (100.0%) |
| 3 or 4 Unit Apartments | 0 (0.0%) | 7 (100.0%) |
| 5 to 9 Unit Apartments | 0 (0.0%) | 55 (100.0%) |
| 10 or more Apartments | 0 (0.0%) | 13 (100.0%) |
| Mobile Home / Other | 11 (100.0%) | 0 (0.0%) |
| Total | 328 (61.0%) | 210 (39.0%) |
Housing Structures by Number of Rooms in Highland Park
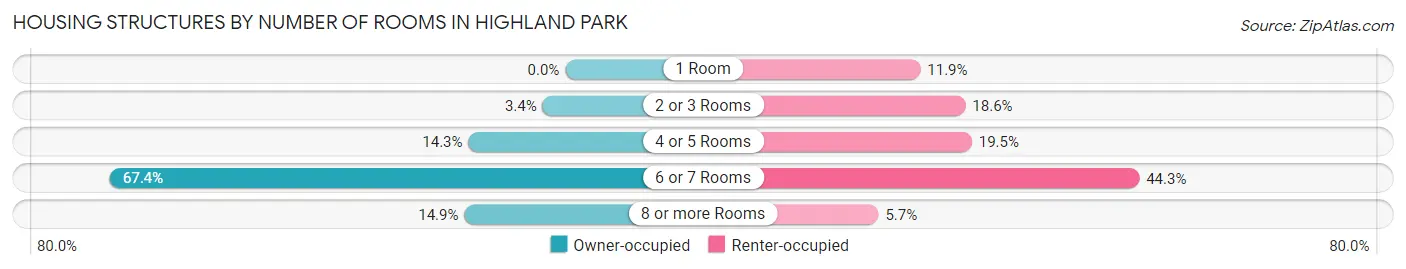
| Number of Rooms | Owner-occupied | Renter-occupied |
| 1 Room | 0 (0.0%) | 25 (11.9%) |
| 2 or 3 Rooms | 11 (3.4%) | 39 (18.6%) |
| 4 or 5 Rooms | 47 (14.3%) | 41 (19.5%) |
| 6 or 7 Rooms | 221 (67.4%) | 93 (44.3%) |
| 8 or more Rooms | 49 (14.9%) | 12 (5.7%) |
| Total | 328 (100.0%) | 210 (100.0%) |
Housing Structure by Heating Type in Highland Park
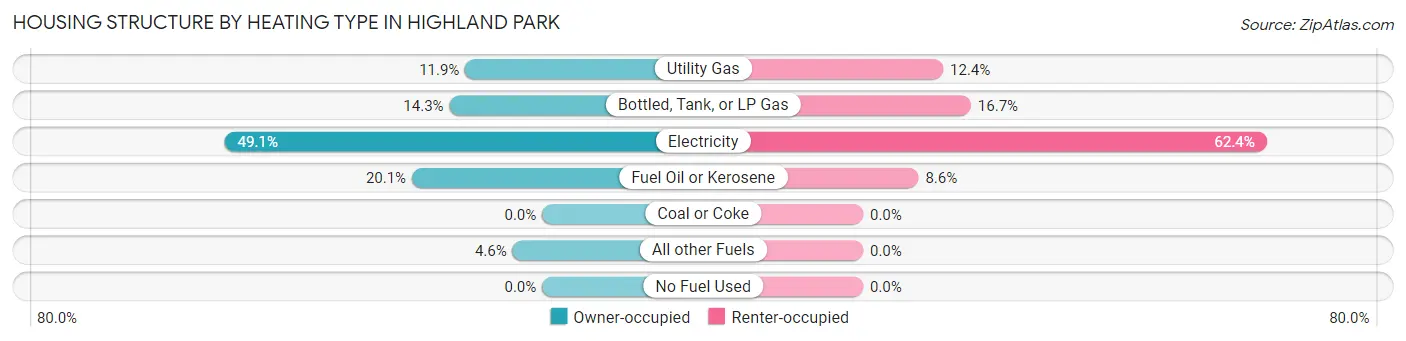
| Heating Type | Owner-occupied | Renter-occupied |
| Utility Gas | 39 (11.9%) | 26 (12.4%) |
| Bottled, Tank, or LP Gas | 47 (14.3%) | 35 (16.7%) |
| Electricity | 161 (49.1%) | 131 (62.4%) |
| Fuel Oil or Kerosene | 66 (20.1%) | 18 (8.6%) |
| Coal or Coke | 0 (0.0%) | 0 (0.0%) |
| All other Fuels | 15 (4.6%) | 0 (0.0%) |
| No Fuel Used | 0 (0.0%) | 0 (0.0%) |
| Total | 328 (100.0%) | 210 (100.0%) |
Household Vehicle Usage in Highland Park
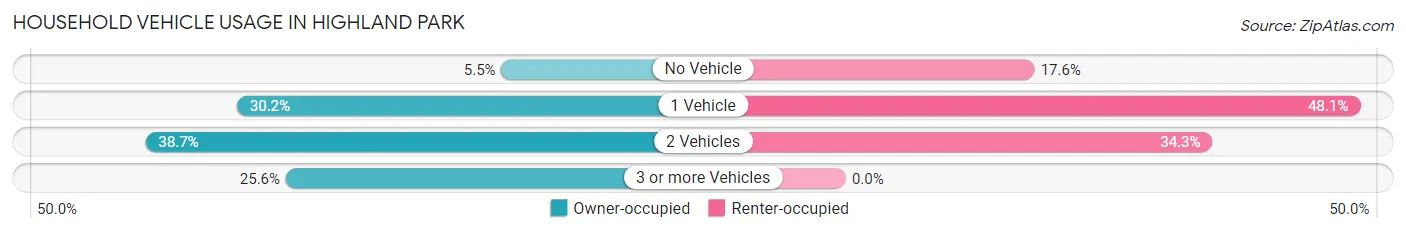
| Vehicles per Household | Owner-occupied | Renter-occupied |
| No Vehicle | 18 (5.5%) | 37 (17.6%) |
| 1 Vehicle | 99 (30.2%) | 101 (48.1%) |
| 2 Vehicles | 127 (38.7%) | 72 (34.3%) |
| 3 or more Vehicles | 84 (25.6%) | 0 (0.0%) |
| Total | 328 (100.0%) | 210 (100.0%) |
Real Estate & Mortgages in Highland Park
Real Estate and Mortgage Overview in Highland Park
| Characteristic | Without Mortgage | With Mortgage |
| Housing Units | 125 | 203 |
| Median Property Value | $154,200 | $131,300 |
| Median Household Income | $55,982 | $24 |
| Monthly Housing Costs | $577 | $0 |
| Real Estate Taxes | $1,729 | $0 |
Property Value by Mortgage Status in Highland Park
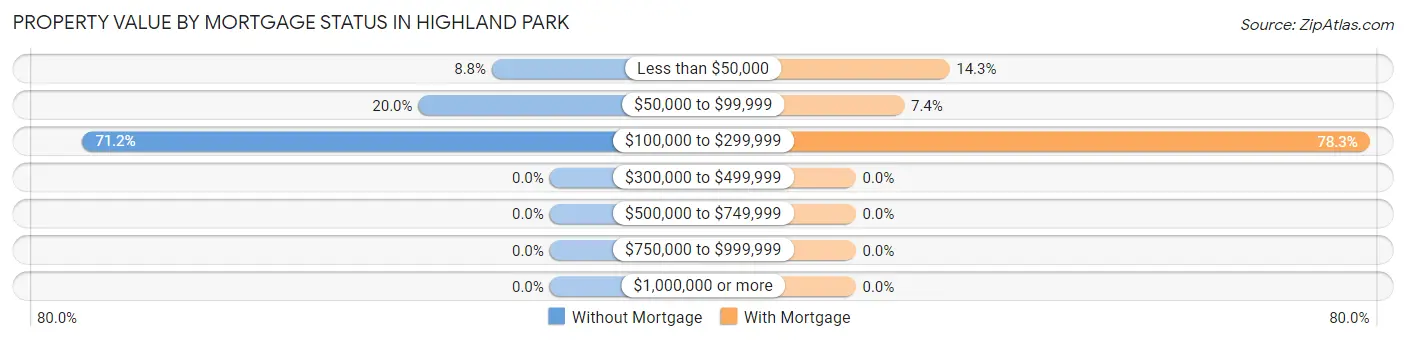
| Property Value | Without Mortgage | With Mortgage |
| Less than $50,000 | 11 (8.8%) | 29 (14.3%) |
| $50,000 to $99,999 | 25 (20.0%) | 15 (7.4%) |
| $100,000 to $299,999 | 89 (71.2%) | 159 (78.3%) |
| $300,000 to $499,999 | 0 (0.0%) | 0 (0.0%) |
| $500,000 to $749,999 | 0 (0.0%) | 0 (0.0%) |
| $750,000 to $999,999 | 0 (0.0%) | 0 (0.0%) |
| $1,000,000 or more | 0 (0.0%) | 0 (0.0%) |
| Total | 125 (100.0%) | 203 (100.0%) |
Household Income by Mortgage Status in Highland Park
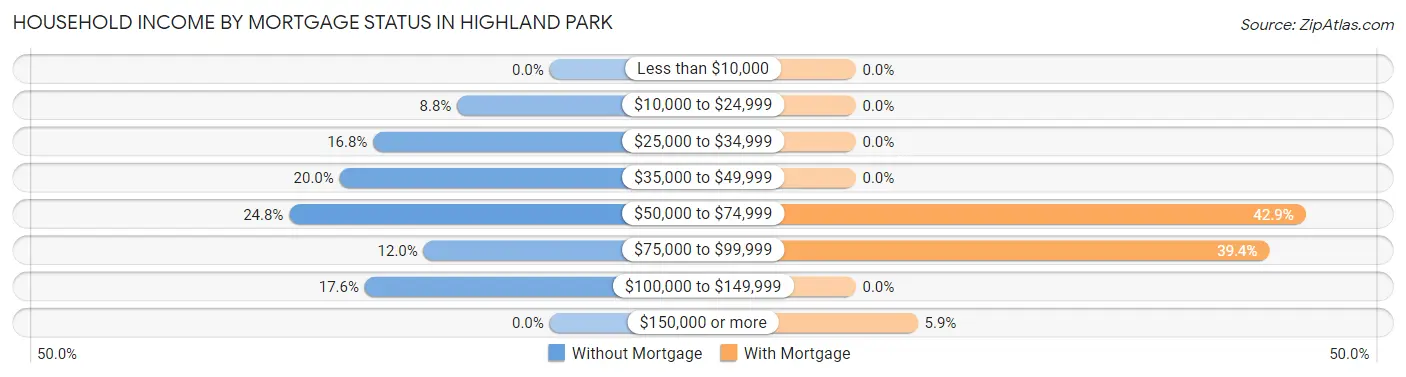
| Household Income | Without Mortgage | With Mortgage |
| Less than $10,000 | 0 (0.0%) | 0 (0.0%) |
| $10,000 to $24,999 | 11 (8.8%) | 0 (0.0%) |
| $25,000 to $34,999 | 21 (16.8%) | 0 (0.0%) |
| $35,000 to $49,999 | 25 (20.0%) | 0 (0.0%) |
| $50,000 to $74,999 | 31 (24.8%) | 87 (42.9%) |
| $75,000 to $99,999 | 15 (12.0%) | 80 (39.4%) |
| $100,000 to $149,999 | 22 (17.6%) | 0 (0.0%) |
| $150,000 or more | 0 (0.0%) | 12 (5.9%) |
| Total | 125 (100.0%) | 203 (100.0%) |
Property Value to Household Income Ratio in Highland Park
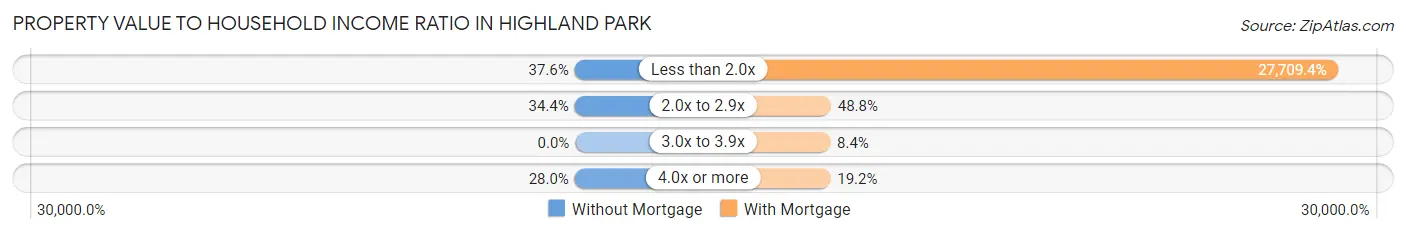
| Value-to-Income Ratio | Without Mortgage | With Mortgage |
| Less than 2.0x | 47 (37.6%) | 56,250 (27,709.4%) |
| 2.0x to 2.9x | 43 (34.4%) | 99 (48.8%) |
| 3.0x to 3.9x | 0 (0.0%) | 17 (8.4%) |
| 4.0x or more | 35 (28.0%) | 39 (19.2%) |
| Total | 125 (100.0%) | 203 (100.0%) |
Real Estate Taxes by Mortgage Status in Highland Park
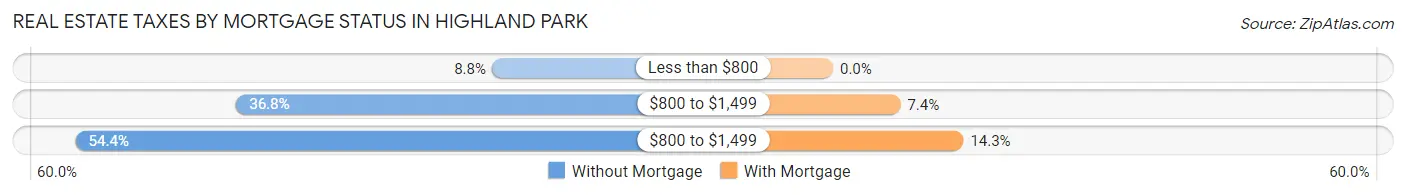
| Property Taxes | Without Mortgage | With Mortgage |
| Less than $800 | 11 (8.8%) | 0 (0.0%) |
| $800 to $1,499 | 46 (36.8%) | 15 (7.4%) |
| $800 to $1,499 | 68 (54.4%) | 29 (14.3%) |
| Total | 125 (100.0%) | 203 (100.0%) |
Health & Disability in Highland Park
Health Insurance Coverage by Age in Highland Park
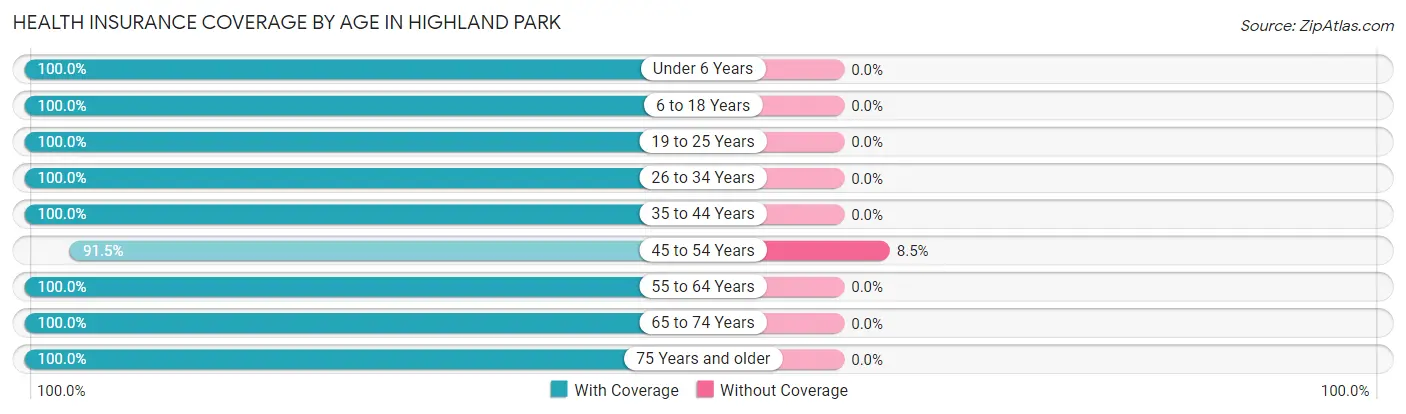
| Age Bracket | With Coverage | Without Coverage |
| Under 6 Years | 127 (100.0%) | 0 (0.0%) |
| 6 to 18 Years | 69 (100.0%) | 0 (0.0%) |
| 19 to 25 Years | 111 (100.0%) | 0 (0.0%) |
| 26 to 34 Years | 150 (100.0%) | 0 (0.0%) |
| 35 to 44 Years | 49 (100.0%) | 0 (0.0%) |
| 45 to 54 Years | 97 (91.5%) | 9 (8.5%) |
| 55 to 64 Years | 184 (100.0%) | 0 (0.0%) |
| 65 to 74 Years | 197 (100.0%) | 0 (0.0%) |
| 75 Years and older | 86 (100.0%) | 0 (0.0%) |
| Total | 1,070 (99.2%) | 9 (0.8%) |
Health Insurance Coverage by Citizenship Status in Highland Park
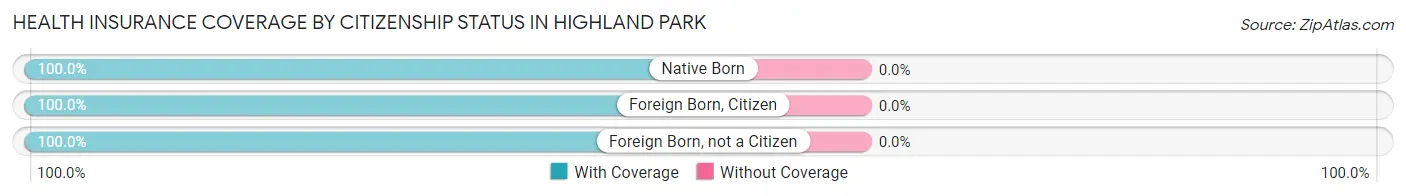
| Citizenship Status | With Coverage | Without Coverage |
| Native Born | 127 (100.0%) | 0 (0.0%) |
| Foreign Born, Citizen | 69 (100.0%) | 0 (0.0%) |
| Foreign Born, not a Citizen | 111 (100.0%) | 0 (0.0%) |
Health Insurance Coverage by Household Income in Highland Park
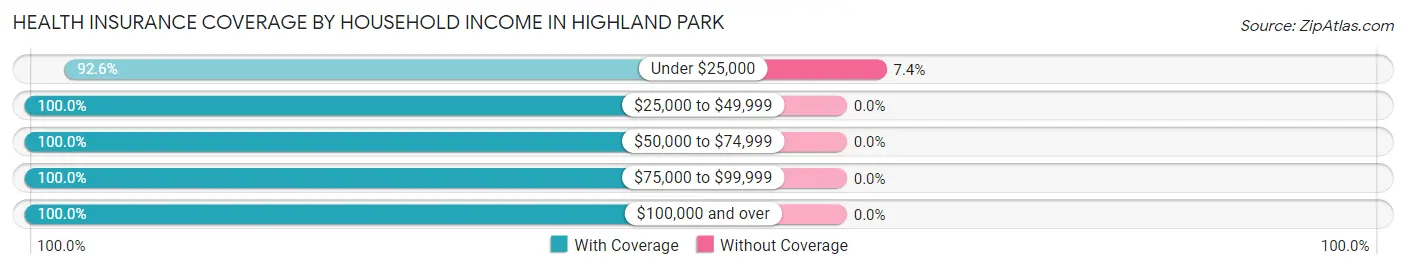
| Household Income | With Coverage | Without Coverage |
| Under $25,000 | 112 (92.6%) | 9 (7.4%) |
| $25,000 to $49,999 | 355 (100.0%) | 0 (0.0%) |
| $50,000 to $74,999 | 315 (100.0%) | 0 (0.0%) |
| $75,000 to $99,999 | 21 (100.0%) | 0 (0.0%) |
| $100,000 and over | 258 (100.0%) | 0 (0.0%) |
Public vs Private Health Insurance Coverage by Age in Highland Park
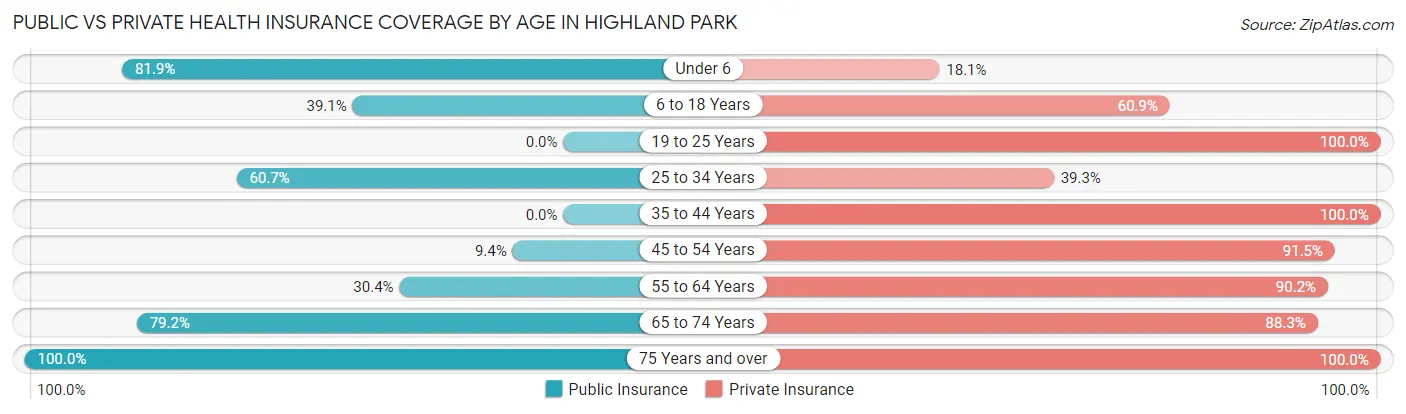
| Age Bracket | Public Insurance | Private Insurance |
| Under 6 | 104 (81.9%) | 23 (18.1%) |
| 6 to 18 Years | 27 (39.1%) | 42 (60.9%) |
| 19 to 25 Years | 0 (0.0%) | 111 (100.0%) |
| 25 to 34 Years | 91 (60.7%) | 59 (39.3%) |
| 35 to 44 Years | 0 (0.0%) | 49 (100.0%) |
| 45 to 54 Years | 10 (9.4%) | 97 (91.5%) |
| 55 to 64 Years | 56 (30.4%) | 166 (90.2%) |
| 65 to 74 Years | 156 (79.2%) | 174 (88.3%) |
| 75 Years and over | 86 (100.0%) | 86 (100.0%) |
| Total | 530 (49.1%) | 807 (74.8%) |
Disability Status by Sex by Age in Highland Park
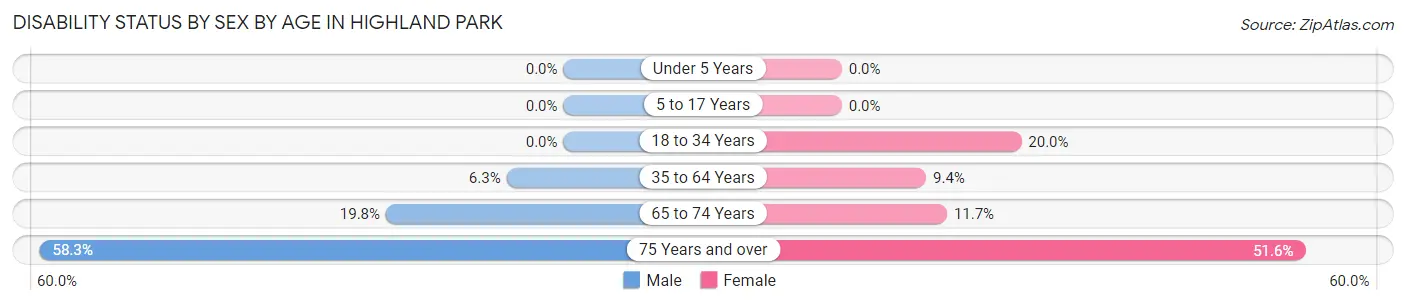
| Age Bracket | Male | Female |
| Under 5 Years | 0 (0.0%) | 0 (0.0%) |
| 5 to 17 Years | 0 (0.0%) | 0 (0.0%) |
| 18 to 34 Years | 0 (0.0%) | 35 (20.0%) |
| 35 to 64 Years | 10 (6.3%) | 17 (9.4%) |
| 65 to 74 Years | 17 (19.8%) | 13 (11.7%) |
| 75 Years and over | 14 (58.3%) | 32 (51.6%) |
Disability Class by Sex by Age in Highland Park
Disability Class: Hearing Difficulty
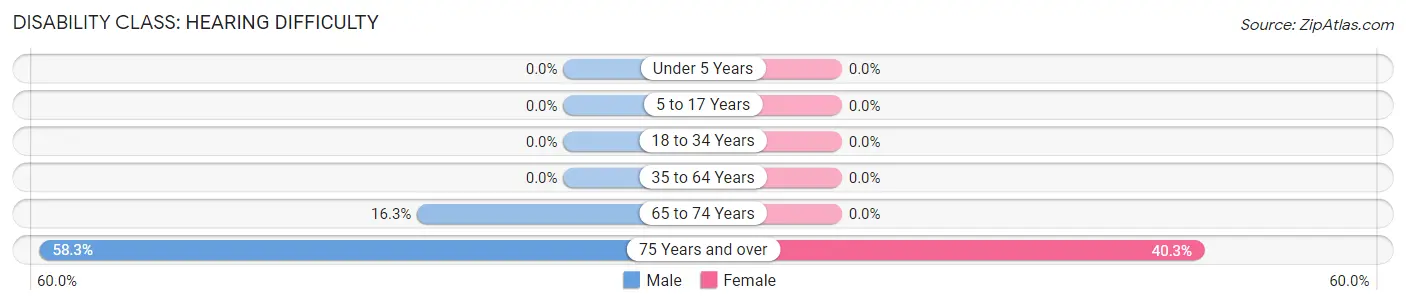
| Age Bracket | Male | Female |
| Under 5 Years | 0 (0.0%) | 0 (0.0%) |
| 5 to 17 Years | 0 (0.0%) | 0 (0.0%) |
| 18 to 34 Years | 0 (0.0%) | 0 (0.0%) |
| 35 to 64 Years | 0 (0.0%) | 0 (0.0%) |
| 65 to 74 Years | 14 (16.3%) | 0 (0.0%) |
| 75 Years and over | 14 (58.3%) | 25 (40.3%) |
Disability Class: Vision Difficulty
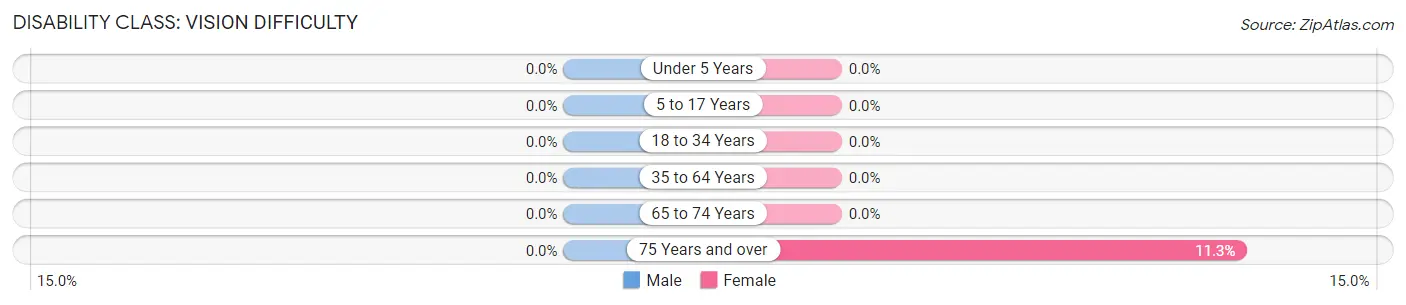
| Age Bracket | Male | Female |
| Under 5 Years | 0 (0.0%) | 0 (0.0%) |
| 5 to 17 Years | 0 (0.0%) | 0 (0.0%) |
| 18 to 34 Years | 0 (0.0%) | 0 (0.0%) |
| 35 to 64 Years | 0 (0.0%) | 0 (0.0%) |
| 65 to 74 Years | 0 (0.0%) | 0 (0.0%) |
| 75 Years and over | 0 (0.0%) | 7 (11.3%) |
Disability Class: Cognitive Difficulty
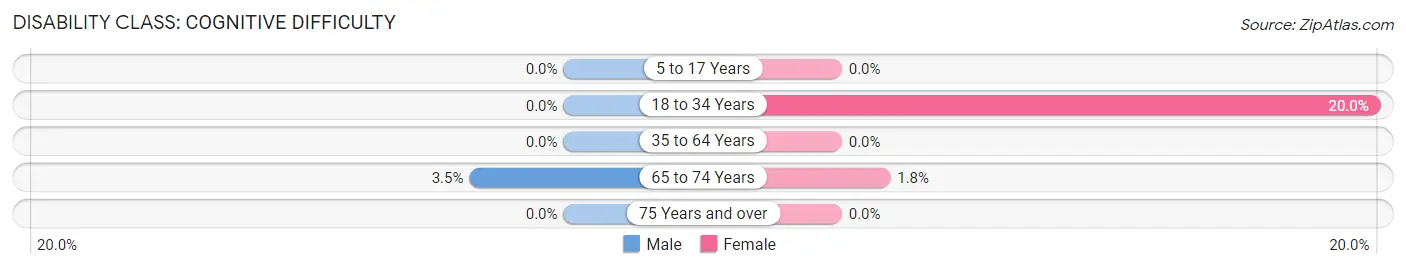
| Age Bracket | Male | Female |
| 5 to 17 Years | 0 (0.0%) | 0 (0.0%) |
| 18 to 34 Years | 0 (0.0%) | 35 (20.0%) |
| 35 to 64 Years | 0 (0.0%) | 0 (0.0%) |
| 65 to 74 Years | 3 (3.5%) | 2 (1.8%) |
| 75 Years and over | 0 (0.0%) | 0 (0.0%) |
Disability Class: Ambulatory Difficulty
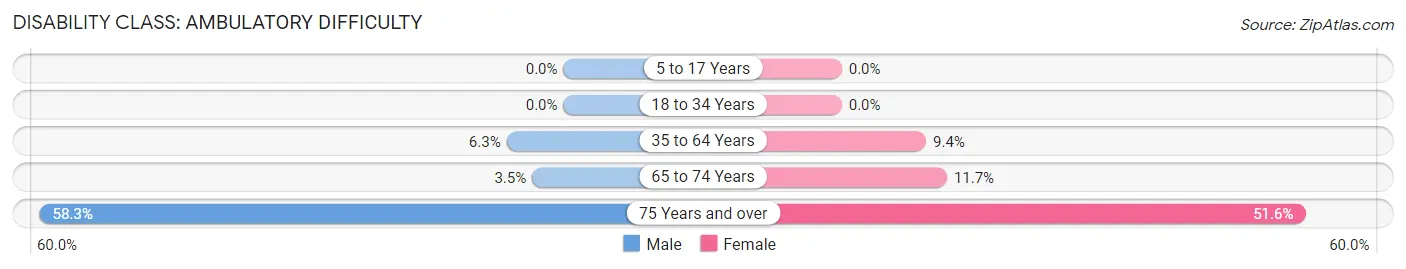
| Age Bracket | Male | Female |
| 5 to 17 Years | 0 (0.0%) | 0 (0.0%) |
| 18 to 34 Years | 0 (0.0%) | 0 (0.0%) |
| 35 to 64 Years | 10 (6.3%) | 17 (9.4%) |
| 65 to 74 Years | 3 (3.5%) | 13 (11.7%) |
| 75 Years and over | 14 (58.3%) | 32 (51.6%) |
Disability Class: Self-Care Difficulty
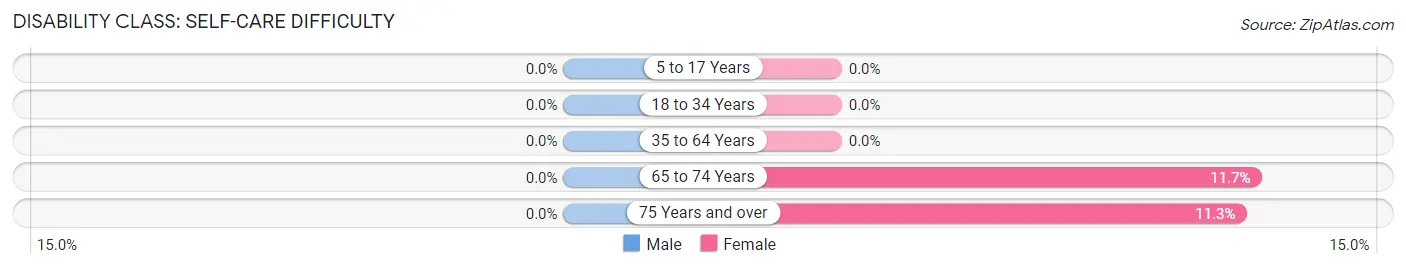
| Age Bracket | Male | Female |
| 5 to 17 Years | 0 (0.0%) | 0 (0.0%) |
| 18 to 34 Years | 0 (0.0%) | 0 (0.0%) |
| 35 to 64 Years | 0 (0.0%) | 0 (0.0%) |
| 65 to 74 Years | 0 (0.0%) | 13 (11.7%) |
| 75 Years and over | 0 (0.0%) | 7 (11.3%) |
Technology Access in Highland Park
Computing Device Access in Highland Park
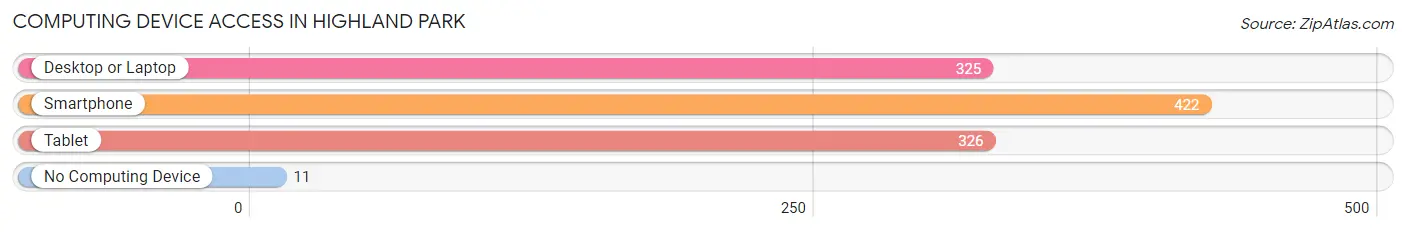
| Device Type | # Households | % Households |
| Desktop or Laptop | 325 | 60.4% |
| Smartphone | 422 | 78.4% |
| Tablet | 326 | 60.6% |
| No Computing Device | 11 | 2.0% |
| Total | 538 | 100.0% |
Internet Access in Highland Park
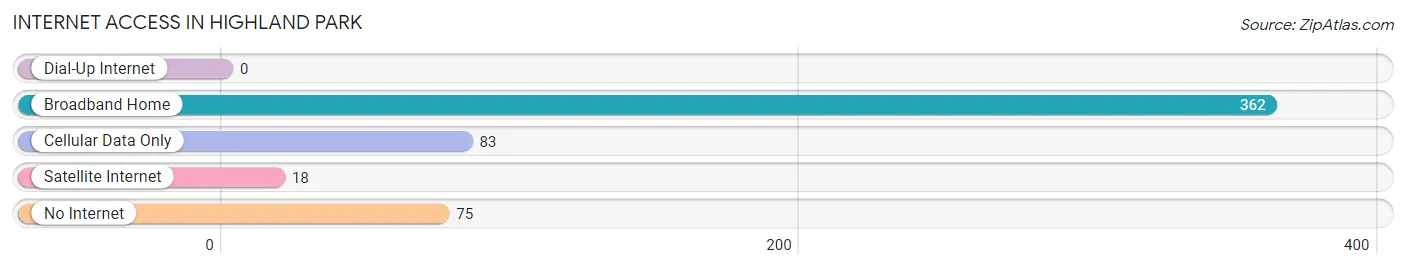
| Internet Type | # Households | % Households |
| Dial-Up Internet | 0 | 0.0% |
| Broadband Home | 362 | 67.3% |
| Cellular Data Only | 83 | 15.4% |
| Satellite Internet | 18 | 3.4% |
| No Internet | 75 | 13.9% |
| Total | 538 | 100.0% |
Highland Park Summary
Highland Park is a borough located in Allegheny County, Pennsylvania. It is a small community of just over 1,000 people, located about 10 miles northeast of Pittsburgh. The borough was incorporated in 1891 and is part of the Pittsburgh Metropolitan Statistical Area.
Geography
Highland Park is located at 40°31'17" North, 79°54'45" West (40.5214, -79.9125). It is situated in the Allegheny Plateau region of Pennsylvania, and is bordered by the boroughs of Wilkinsburg and Penn Hills. The borough is located in a valley, with the Allegheny River to the north and Turtle Creek to the south. The terrain is mostly hilly, with some flat areas.
Climate
Highland Park has a humid continental climate, with cold winters and hot, humid summers. The average annual temperature is 48°F (9°C), with an average high of 64°F (18°C) and an average low of 32°F (0°C). The average annual precipitation is 40 inches (101 cm).
Demographics
As of the 2010 census, the population of Highland Park was 1,072. The racial makeup of the borough was 79.2% White, 15.2% African American, 0.3% Native American, 0.7% Asian, 0.1% Pacific Islander, and 4.5% from other races. Hispanic or Latino of any race were 1.3% of the population.
Economy
Highland Park is a small, residential community with no major industries. The borough is home to several small businesses, including a few restaurants, a grocery store, and a few retail stores. The median household income in Highland Park is $37,917, and the median family income is $45,938.
History
Highland Park was first settled in the late 1700s by a group of Scots-Irish immigrants. The area was originally known as "Highland Park Station" due to its location on the Pennsylvania Railroad. The borough was officially incorporated in 1891.
Highland Park was a popular summer resort destination in the late 19th and early 20th centuries. The borough was home to several large hotels, including the Highland Park Hotel, which was built in 1891 and demolished in the 1950s.
Highland Park experienced a period of decline in the mid-20th century, as many of its residents moved away to the suburbs. The borough has since experienced a resurgence, with many of its historic buildings being restored and new businesses opening.
Common Questions
What is Per Capita Income in Highland Park?
Per Capita income in Highland Park is $30,196.
What is the Median Family Income in Highland Park?
Median Family Income in Highland Park is $60,294.
What is the Median Household income in Highland Park?
Median Household Income in Highland Park is $55,988.
What is Income or Wage Gap in Highland Park?
Income or Wage Gap in Highland Park is 52.9%.
Women in Highland Park earn 47.1 cents for every dollar earned by a man.
What is Inequality or Gini Index in Highland Park?
Inequality or Gini Index in Highland Park is 0.35.
What is the Total Population of Highland Park?
Total Population of Highland Park is 1,218.
What is the Total Male Population of Highland Park?
Total Male Population of Highland Park is 484.
What is the Total Female Population of Highland Park?
Total Female Population of Highland Park is 734.
What is the Ratio of Males per 100 Females in Highland Park?
There are 65.94 Males per 100 Females in Highland Park.
What is the Ratio of Females per 100 Males in Highland Park?
There are 151.65 Females per 100 Males in Highland Park.
What is the Median Population Age in Highland Park?
Median Population Age in Highland Park is 54.2 Years.
What is the Average Family Size in Highland Park
Average Family Size in Highland Park is 2.6 People.
What is the Average Household Size in Highland Park
Average Household Size in Highland Park is 2.0 People.
How Large is the Labor Force in Highland Park?
There are 571 People in the Labor Forcein in Highland Park.
What is the Percentage of People in the Labor Force in Highland Park?
55.3% of People are in the Labor Force in Highland Park.