Zip Codes with the Highest Percentage of Population with a Degree in Liberal Arts and History in Lebanon, PA
RELATED REPORTS & OPTIONS
Liberal Arts and History
Lebanon
Compare Zip Codes
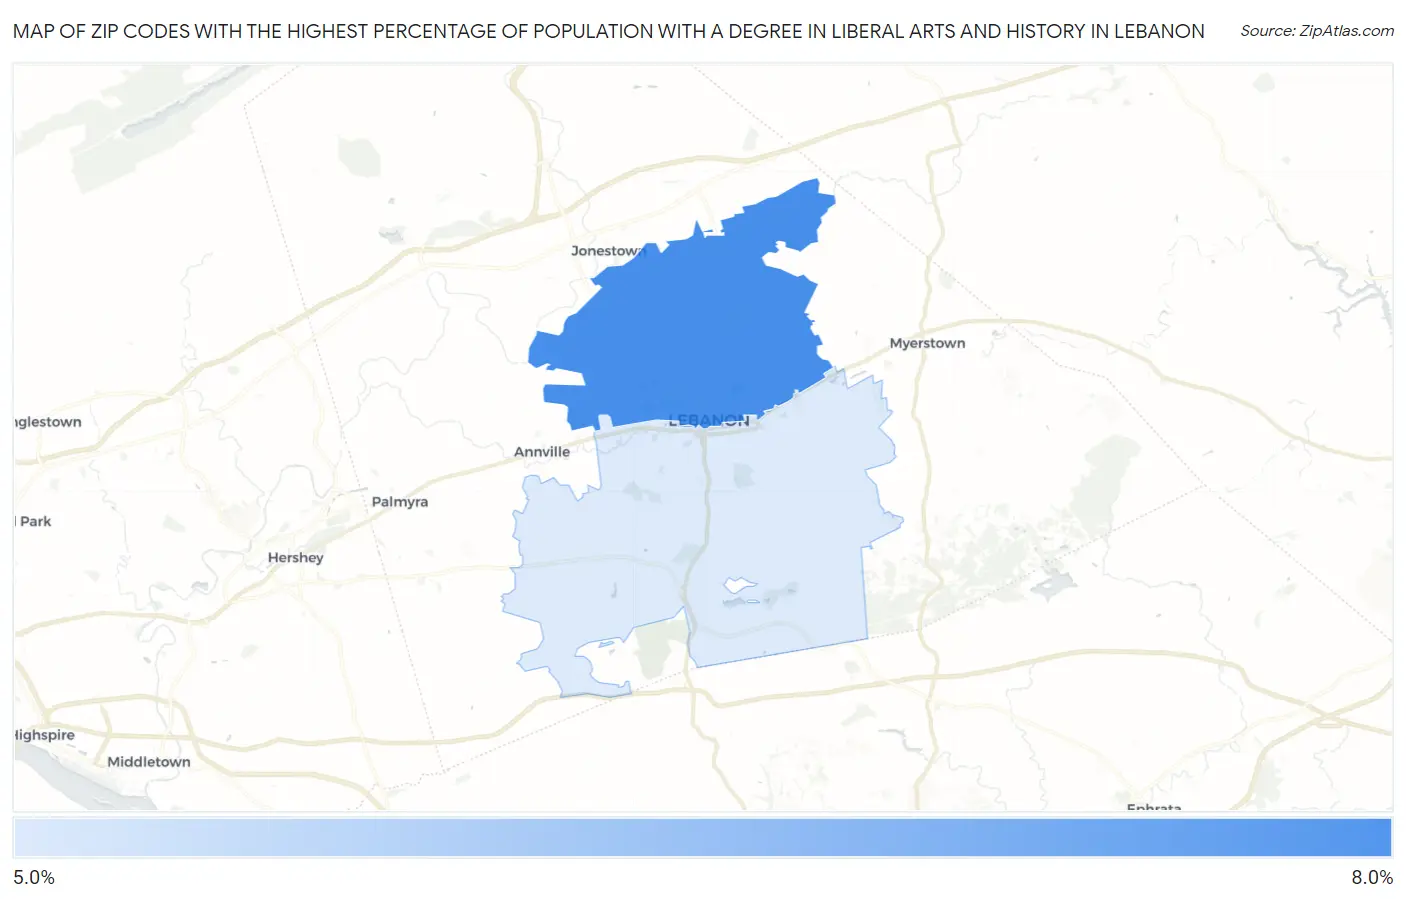
Map of Zip Codes with the Highest Percentage of Population with a Degree in Liberal Arts and History in Lebanon
5.5%
6.2%
Zip Codes with the Highest Percentage of Population with a Degree in Liberal Arts and History in Lebanon, PA
| Zip Code | % Graduates | vs State | vs National | |
| 1. | 17046 | 6.2% | 4.6%(+1.60)#394 | 4.9%(+1.33)#8,011 |
| 2. | 17042 | 5.5% | 4.6%(+0.870)#495 | 4.9%(+0.608)#9,918 |
1
Common Questions
What are the Top Zip Codes with the Highest Percentage of Population with a Degree in Liberal Arts and History in Lebanon, PA?
Top Zip Codes with the Highest Percentage of Population with a Degree in Liberal Arts and History in Lebanon, PA are:
What zip code has the Highest Percentage of Population with a Degree in Liberal Arts and History in Lebanon, PA?
17046 has the Highest Percentage of Population with a Degree in Liberal Arts and History in Lebanon, PA with 6.2%.
What is the Percentage of Population with a Degree in Liberal Arts and History in Lebanon, PA?
Percentage of Population with a Degree in Liberal Arts and History in Lebanon is 6.0%.
What is the Percentage of Population with a Degree in Liberal Arts and History in Pennsylvania?
Percentage of Population with a Degree in Liberal Arts and History in Pennsylvania is 4.6%.
What is the Percentage of Population with a Degree in Liberal Arts and History in the United States?
Percentage of Population with a Degree in Liberal Arts and History in the United States is 4.9%.