Wallenpaupack Lake Estates, PA Map & Demographics
Wallenpaupack Lake Estates Map
Wallenpaupack Lake Estates Overview
$40,788
PER CAPITA INCOME
$92,449
AVG FAMILY INCOME
$90,408
AVG HOUSEHOLD INCOME
14.3%
WAGE / INCOME GAP [ % ]
85.7¢/ $1
WAGE / INCOME GAP [ $ ]
$16,696
FAMILY INCOME DEFICIT
0.37
INEQUALITY / GINI INDEX
1,075
TOTAL POPULATION
542
MALE POPULATION
533
FEMALE POPULATION
101.69
MALES / 100 FEMALES
98.34
FEMALES / 100 MALES
63.1
MEDIAN AGE
2.4
AVG FAMILY SIZE
2.1
AVG HOUSEHOLD SIZE
459
LABOR FORCE [ PEOPLE ]
47.9%
PERCENT IN LABOR FORCE
8.1%
UNEMPLOYMENT RATE
Income in Wallenpaupack Lake Estates
Income Overview in Wallenpaupack Lake Estates
Per Capita Income in Wallenpaupack Lake Estates is $40,788, while median incomes of families and households are $92,449 and $90,408 respectively.
| Characteristic | Number | Measure |
| Per Capita Income | 1,075 | $40,788 |
| Median Family Income | 388 | $92,449 |
| Mean Family Income | 388 | $91,393 |
| Median Household Income | 506 | $90,408 |
| Mean Household Income | 506 | $84,956 |
| Income Deficit | 388 | $16,696 |
| Wage / Income Gap (%) | 1,075 | 14.26% |
| Wage / Income Gap ($) | 1,075 | 85.74¢ per $1 |
| Gini / Inequality Index | 1,075 | 0.37 |
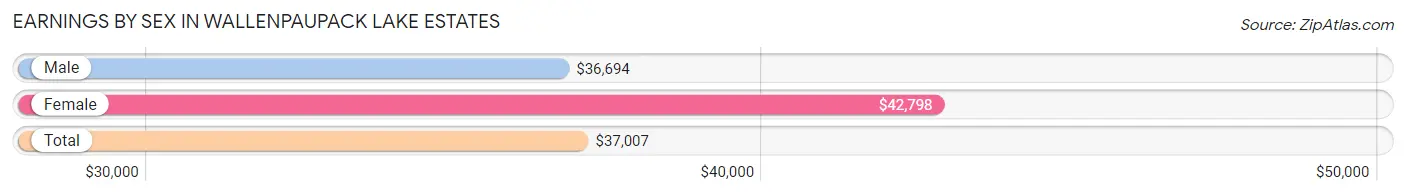
Earnings by Sex in Wallenpaupack Lake Estates
Average Earnings in Wallenpaupack Lake Estates are $37,007, $36,694 for men and $42,798 for women, a difference of 14.3%.
| Sex | Number | Average Earnings |
| Male | 324 (65.4%) | $36,694 |
| Female | 171 (34.5%) | $42,798 |
| Total | 495 (100.0%) | $37,007 |
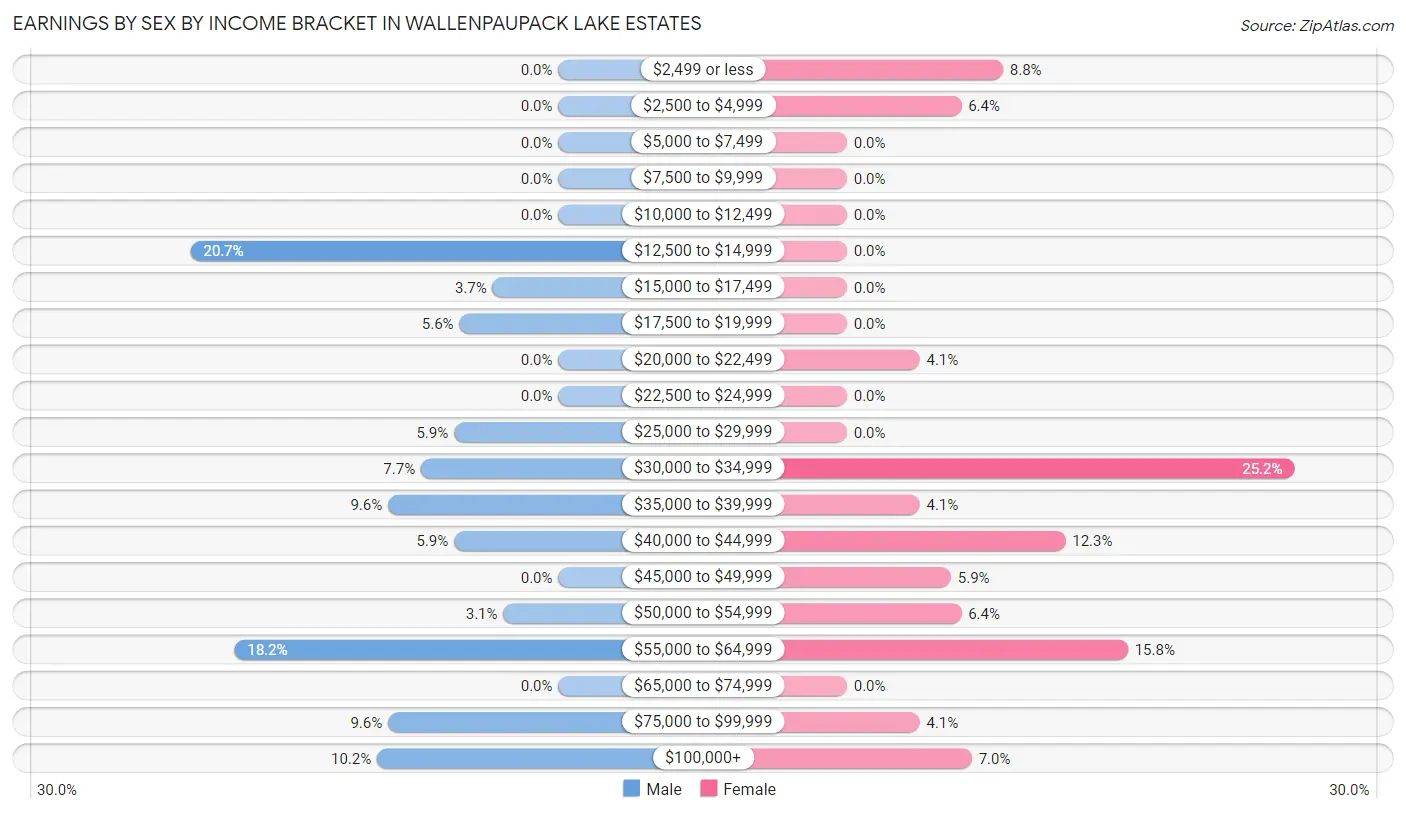
Earnings by Sex by Income Bracket in Wallenpaupack Lake Estates
The most common earnings brackets in Wallenpaupack Lake Estates are $12,500 to $14,999 for men (67 | 20.7%) and $30,000 to $34,999 for women (43 | 25.2%).
| Income | Male | Female |
| $2,499 or less | 0 (0.0%) | 15 (8.8%) |
| $2,500 to $4,999 | 0 (0.0%) | 11 (6.4%) |
| $5,000 to $7,499 | 0 (0.0%) | 0 (0.0%) |
| $7,500 to $9,999 | 0 (0.0%) | 0 (0.0%) |
| $10,000 to $12,499 | 0 (0.0%) | 0 (0.0%) |
| $12,500 to $14,999 | 67 (20.7%) | 0 (0.0%) |
| $15,000 to $17,499 | 12 (3.7%) | 0 (0.0%) |
| $17,500 to $19,999 | 18 (5.6%) | 0 (0.0%) |
| $20,000 to $22,499 | 0 (0.0%) | 7 (4.1%) |
| $22,500 to $24,999 | 0 (0.0%) | 0 (0.0%) |
| $25,000 to $29,999 | 19 (5.9%) | 0 (0.0%) |
| $30,000 to $34,999 | 25 (7.7%) | 43 (25.2%) |
| $35,000 to $39,999 | 31 (9.6%) | 7 (4.1%) |
| $40,000 to $44,999 | 19 (5.9%) | 21 (12.3%) |
| $45,000 to $49,999 | 0 (0.0%) | 10 (5.9%) |
| $50,000 to $54,999 | 10 (3.1%) | 11 (6.4%) |
| $55,000 to $64,999 | 59 (18.2%) | 27 (15.8%) |
| $65,000 to $74,999 | 0 (0.0%) | 0 (0.0%) |
| $75,000 to $99,999 | 31 (9.6%) | 7 (4.1%) |
| $100,000+ | 33 (10.2%) | 12 (7.0%) |
| Total | 324 (100.0%) | 171 (100.0%) |
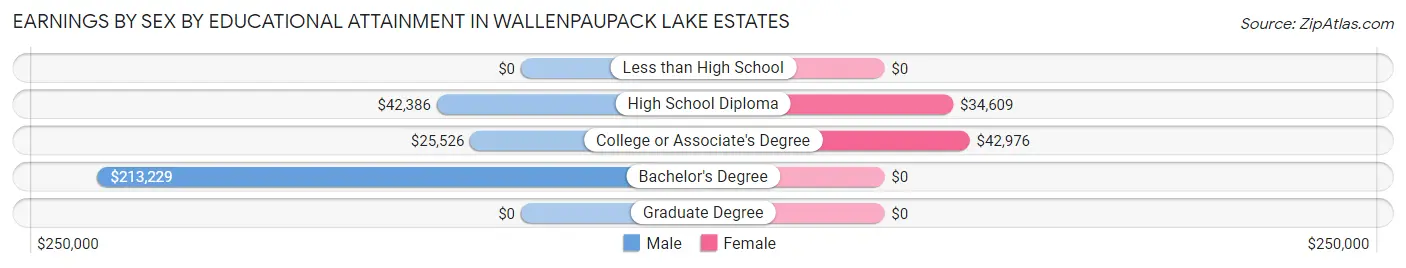
Earnings by Sex by Educational Attainment in Wallenpaupack Lake Estates
Average earnings in Wallenpaupack Lake Estates are $36,694 for men and $42,798 for women, a difference of 14.3%. Men with an educational attainment of bachelor's degree enjoy the highest average annual earnings of $213,229, while those with college or associate's degree education earn the least with $25,526. Women with an educational attainment of college or associate's degree earn the most with the average annual earnings of $42,976, while those with high school diploma education have the smallest earnings of $34,609.
| Educational Attainment | Male Income | Female Income |
| Less than High School | - | - |
| High School Diploma | $42,386 | $34,609 |
| College or Associate's Degree | $25,526 | $42,976 |
| Bachelor's Degree | $213,229 | $0 |
| Graduate Degree | - | - |
| Total | $36,694 | $42,798 |
Family Income in Wallenpaupack Lake Estates
Family Income Brackets in Wallenpaupack Lake Estates
According to the Wallenpaupack Lake Estates family income data, there are 121 families falling into the $100,000 to $149,999 income range, which is the most common income bracket and makes up 31.2% of all families.
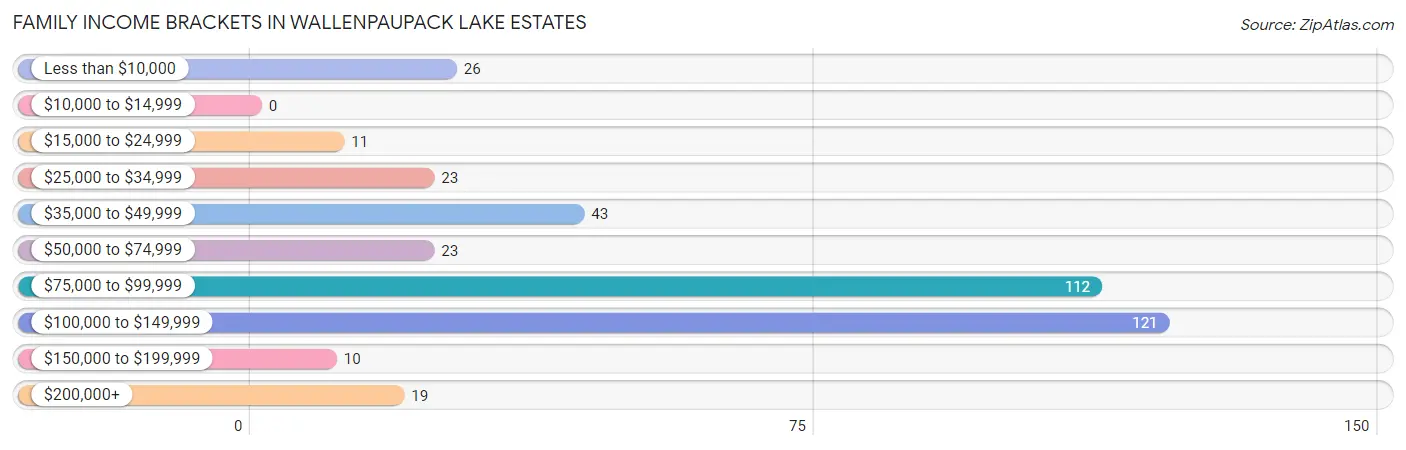
| Income Bracket | # Families | % Families |
| Less than $10,000 | 26 | 6.7% |
| $10,000 to $14,999 | 0 | 0.0% |
| $15,000 to $24,999 | 11 | 2.8% |
| $25,000 to $34,999 | 23 | 5.9% |
| $35,000 to $49,999 | 43 | 11.1% |
| $50,000 to $74,999 | 23 | 5.9% |
| $75,000 to $99,999 | 112 | 28.9% |
| $100,000 to $149,999 | 121 | 31.2% |
| $150,000 to $199,999 | 10 | 2.6% |
| $200,000+ | 19 | 4.9% |
Family Income by Famaliy Size in Wallenpaupack Lake Estates
3-person families (32 | 8.3%) account for the highest median family income in Wallenpaupack Lake Estates with $105,417 per family, while 2-person families (333 | 85.8%) have the highest median income of $46,058 per family member.
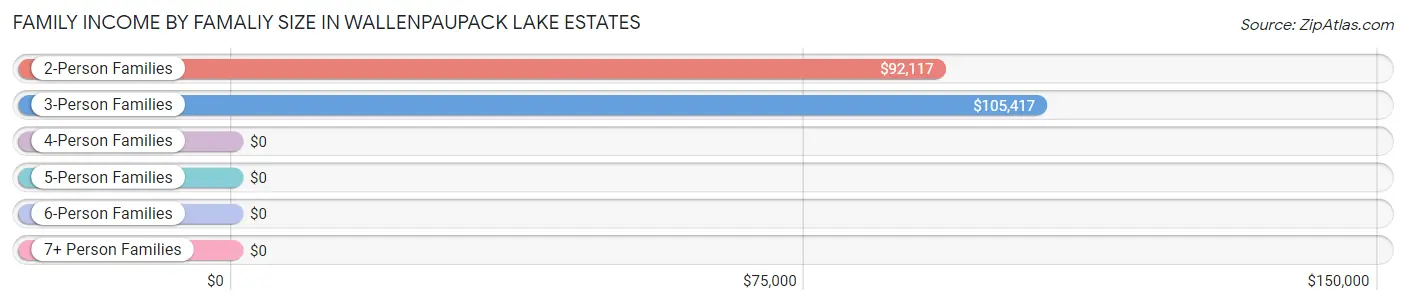
| Income Bracket | # Families | Median Income |
| 2-Person Families | 333 (85.8%) | $92,117 |
| 3-Person Families | 32 (8.3%) | $105,417 |
| 4-Person Families | 0 (0.0%) | $0 |
| 5-Person Families | 23 (5.9%) | $0 |
| 6-Person Families | 0 (0.0%) | $0 |
| 7+ Person Families | 0 (0.0%) | $0 |
| Total | 388 (100.0%) | $92,449 |
Family Income by Number of Earners in Wallenpaupack Lake Estates
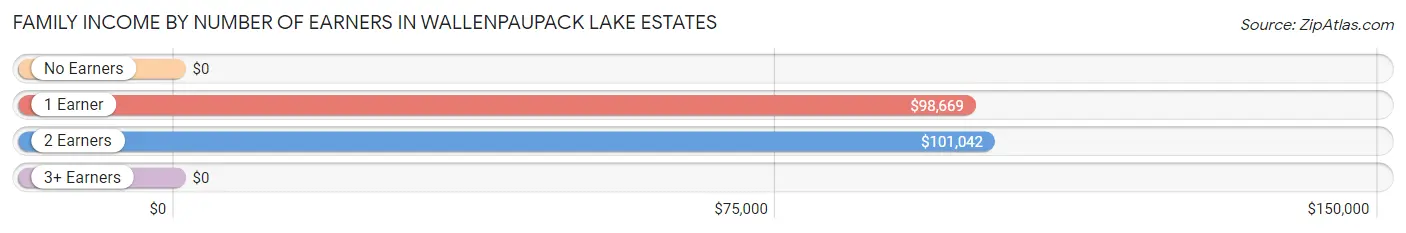
| Number of Earners | # Families | Median Income |
| No Earners | 105 (27.1%) | $0 |
| 1 Earner | 181 (46.7%) | $98,669 |
| 2 Earners | 91 (23.4%) | $101,042 |
| 3+ Earners | 11 (2.8%) | $0 |
| Total | 388 (100.0%) | $92,449 |
Household Income in Wallenpaupack Lake Estates
Household Income Brackets in Wallenpaupack Lake Estates
With 159 households falling in the category, the $100,000 to $149,999 income range is the most frequent in Wallenpaupack Lake Estates, accounting for 31.4% of all households.
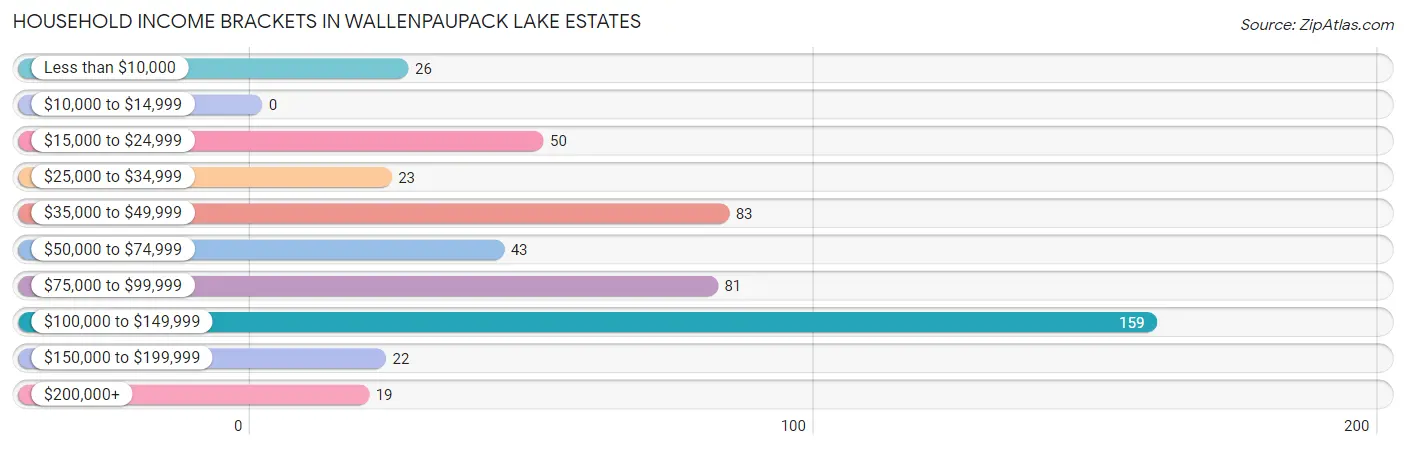
| Income Bracket | # Households | % Households |
| Less than $10,000 | 26 | 5.1% |
| $10,000 to $14,999 | 0 | 0.0% |
| $15,000 to $24,999 | 50 | 9.9% |
| $25,000 to $34,999 | 23 | 4.5% |
| $35,000 to $49,999 | 83 | 16.4% |
| $50,000 to $74,999 | 43 | 8.5% |
| $75,000 to $99,999 | 81 | 16.0% |
| $100,000 to $149,999 | 159 | 31.4% |
| $150,000 to $199,999 | 22 | 4.3% |
| $200,000+ | 19 | 3.8% |
Household Income by Householder Age in Wallenpaupack Lake Estates
The median household income in Wallenpaupack Lake Estates is $90,408, with the highest median household income of $99,583 found in the 45 to 64 years age bracket for the primary householder. A total of 166 households (32.8%) fall into this category.
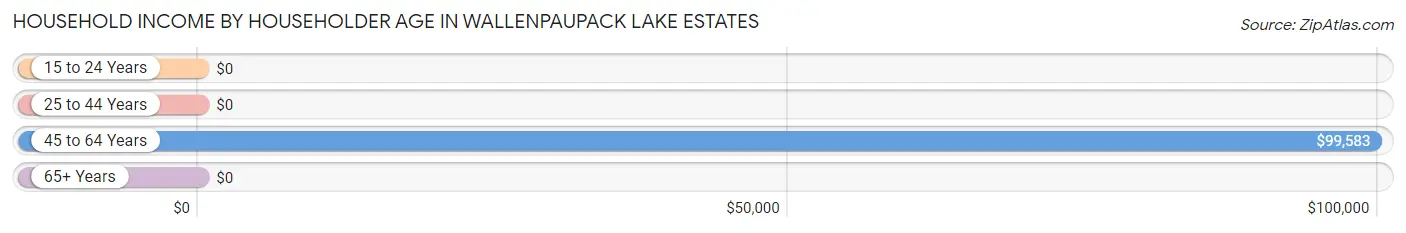
| Income Bracket | # Households | Median Income |
| 15 to 24 Years | 0 (0.0%) | $0 |
| 25 to 44 Years | 114 (22.5%) | $0 |
| 45 to 64 Years | 166 (32.8%) | $99,583 |
| 65+ Years | 226 (44.7%) | $0 |
| Total | 506 (100.0%) | $90,408 |
Poverty in Wallenpaupack Lake Estates
Income Below Poverty by Sex and Age in Wallenpaupack Lake Estates
With 4.8% poverty level for males and 4.7% for females among the residents of Wallenpaupack Lake Estates, 65 to 74 year old males and 55 to 64 year old females are the most vulnerable to poverty, with 16 males (12.8%) and 18 females (11.6%) in their respective age groups living below the poverty level.
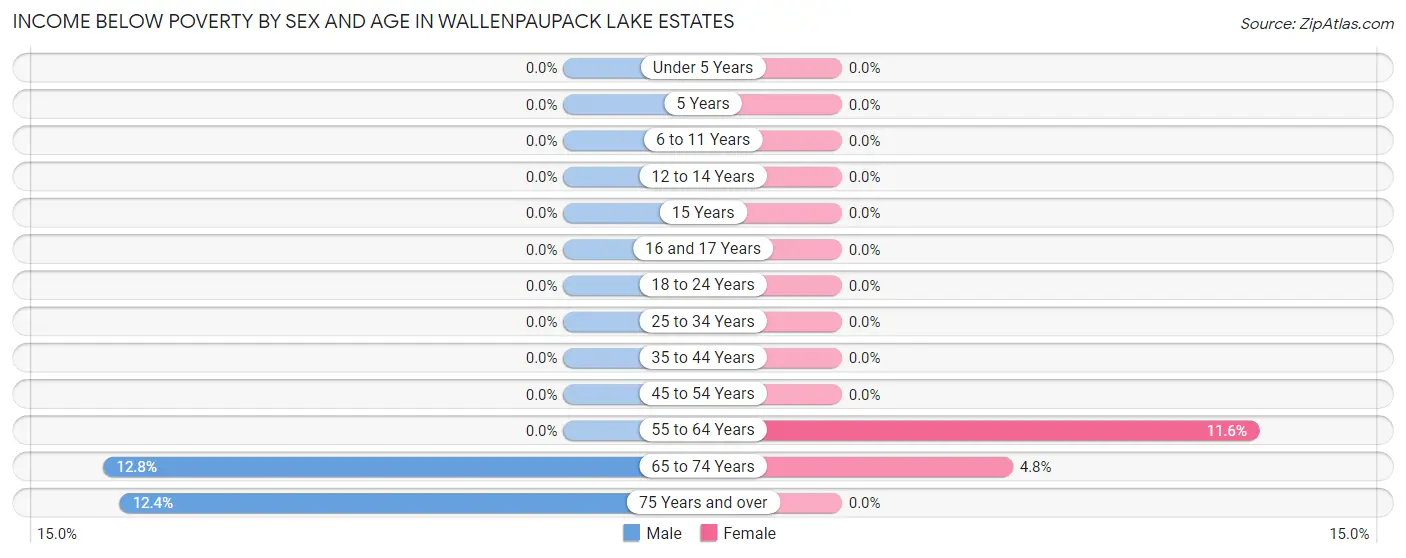
| Age Bracket | Male | Female |
| Under 5 Years | 0 (0.0%) | 0 (0.0%) |
| 5 Years | 0 (0.0%) | 0 (0.0%) |
| 6 to 11 Years | 0 (0.0%) | 0 (0.0%) |
| 12 to 14 Years | 0 (0.0%) | 0 (0.0%) |
| 15 Years | 0 (0.0%) | 0 (0.0%) |
| 16 and 17 Years | 0 (0.0%) | 0 (0.0%) |
| 18 to 24 Years | 0 (0.0%) | 0 (0.0%) |
| 25 to 34 Years | 0 (0.0%) | 0 (0.0%) |
| 35 to 44 Years | 0 (0.0%) | 0 (0.0%) |
| 45 to 54 Years | 0 (0.0%) | 0 (0.0%) |
| 55 to 64 Years | 0 (0.0%) | 18 (11.6%) |
| 65 to 74 Years | 16 (12.8%) | 7 (4.8%) |
| 75 Years and over | 10 (12.3%) | 0 (0.0%) |
| Total | 26 (4.8%) | 25 (4.7%) |
Income Above Poverty by Sex and Age in Wallenpaupack Lake Estates
According to the poverty statistics in Wallenpaupack Lake Estates, males aged 6 to 11 years and females aged under 5 years are the age groups that are most secure financially, with 100.0% of males and 100.0% of females in these age groups living above the poverty line.
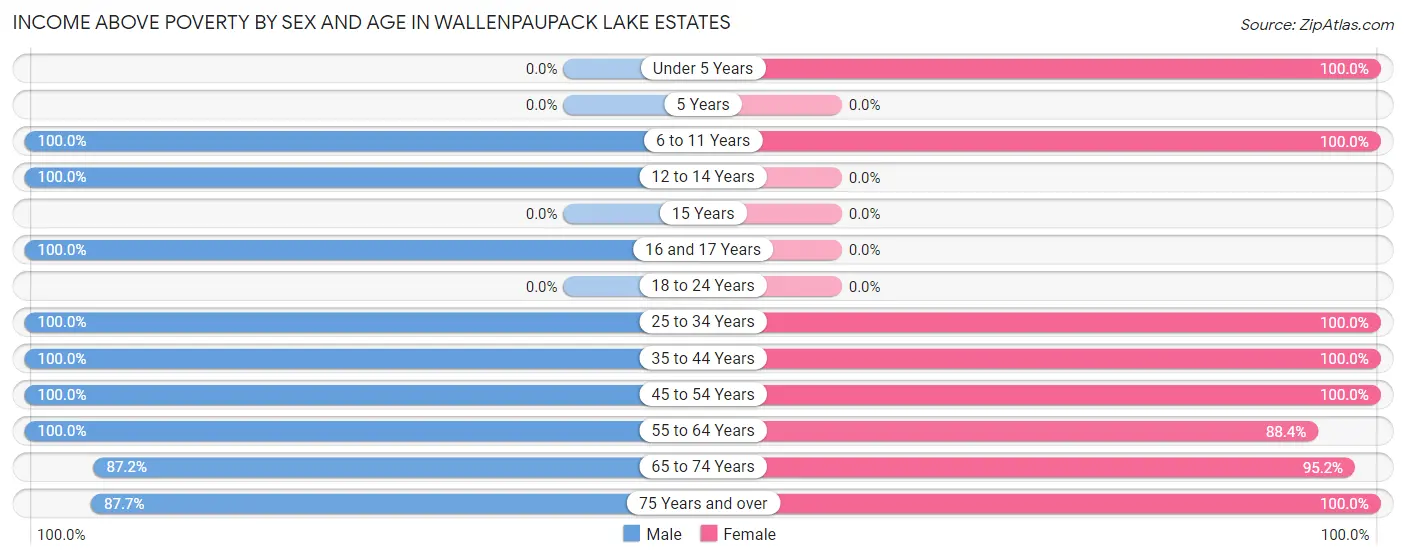
| Age Bracket | Male | Female |
| Under 5 Years | 0 (0.0%) | 36 (100.0%) |
| 5 Years | 0 (0.0%) | 0 (0.0%) |
| 6 to 11 Years | 33 (100.0%) | 33 (100.0%) |
| 12 to 14 Years | 15 (100.0%) | 0 (0.0%) |
| 15 Years | 0 (0.0%) | 0 (0.0%) |
| 16 and 17 Years | 7 (100.0%) | 0 (0.0%) |
| 18 to 24 Years | 0 (0.0%) | 0 (0.0%) |
| 25 to 34 Years | 34 (100.0%) | 7 (100.0%) |
| 35 to 44 Years | 108 (100.0%) | 65 (100.0%) |
| 45 to 54 Years | 20 (100.0%) | 26 (100.0%) |
| 55 to 64 Years | 119 (100.0%) | 137 (88.4%) |
| 65 to 74 Years | 109 (87.2%) | 140 (95.2%) |
| 75 Years and over | 71 (87.6%) | 64 (100.0%) |
| Total | 516 (95.2%) | 508 (95.3%) |
Income Below Poverty Among Married-Couple Families in Wallenpaupack Lake Estates
The poverty statistics for married-couple families in Wallenpaupack Lake Estates show that 7.5% or 26 of the total 348 families live below the poverty line. Families with no children have the highest poverty rate of 8.4%, comprising of 26 families. On the other hand, families with 1 or 2 children have the lowest poverty rate of 0.0%, which includes 0 families.
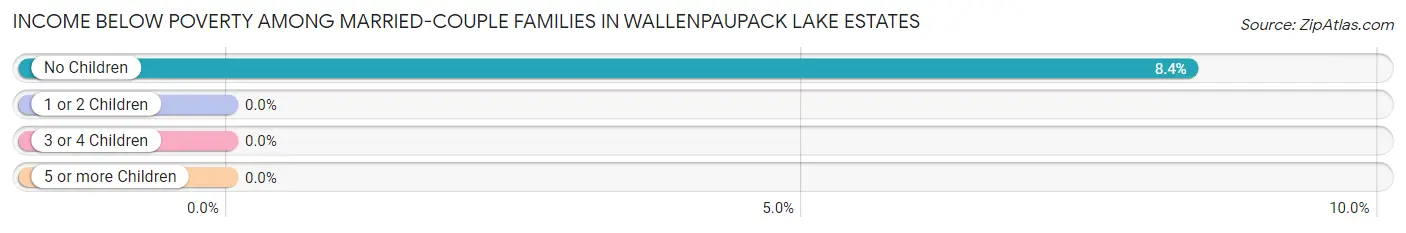
| Children | Above Poverty | Below Poverty |
| No Children | 285 (91.6%) | 26 (8.4%) |
| 1 or 2 Children | 24 (100.0%) | 0 (0.0%) |
| 3 or 4 Children | 13 (100.0%) | 0 (0.0%) |
| 5 or more Children | 0 (0.0%) | 0 (0.0%) |
| Total | 322 (92.5%) | 26 (7.5%) |
Income Below Poverty Among Single-Parent Households in Wallenpaupack Lake Estates
| Children | Single Father | Single Mother |
| No Children | 0 (0.0%) | 0 (0.0%) |
| 1 or 2 Children | 0 (0.0%) | 0 (0.0%) |
| 3 or 4 Children | 0 (0.0%) | 0 (0.0%) |
| 5 or more Children | 0 (0.0%) | 0 (0.0%) |
| Total | 0 (0.0%) | 0 (0.0%) |
Income Below Poverty Among Married-Couple vs Single-Parent Households in Wallenpaupack Lake Estates
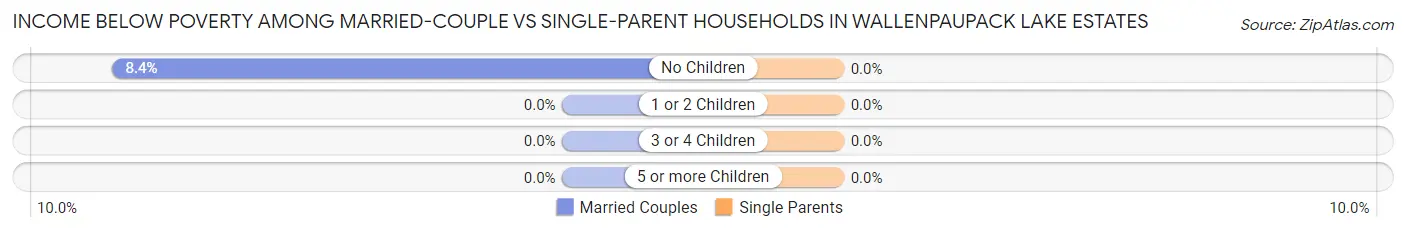
| Children | Married-Couple Families | Single-Parent Households |
| No Children | 26 (8.4%) | 0 (0.0%) |
| 1 or 2 Children | 0 (0.0%) | 0 (0.0%) |
| 3 or 4 Children | 0 (0.0%) | 0 (0.0%) |
| 5 or more Children | 0 (0.0%) | 0 (0.0%) |
| Total | 26 (7.5%) | 0 (0.0%) |
Race in Wallenpaupack Lake Estates
The most populous races in Wallenpaupack Lake Estates are White / Caucasian (1,075 | 100.0%), and Hispanic or Latino (28 | 2.6%).
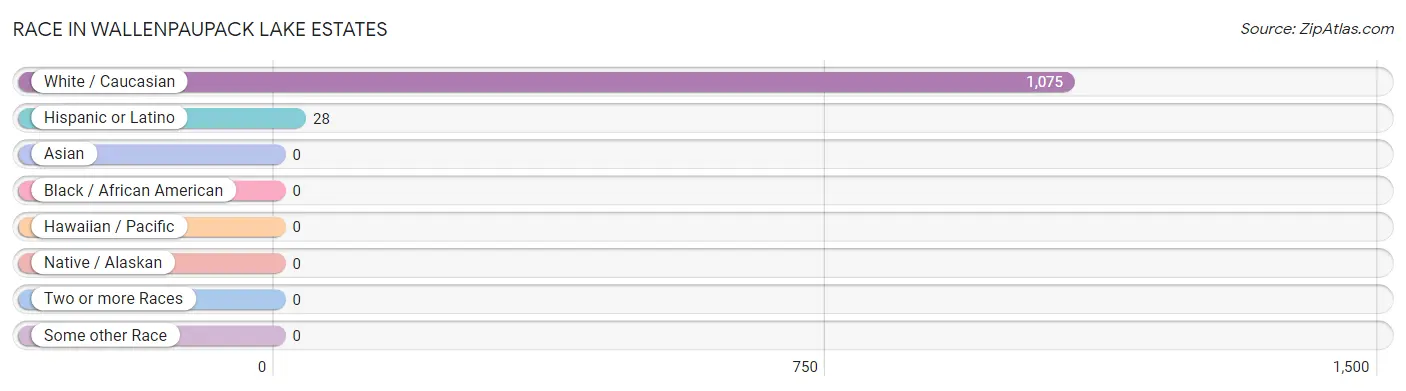
| Race | # Population | % Population |
| Asian | 0 | 0.0% |
| Black / African American | 0 | 0.0% |
| Hawaiian / Pacific | 0 | 0.0% |
| Hispanic or Latino | 28 | 2.6% |
| Native / Alaskan | 0 | 0.0% |
| White / Caucasian | 1,075 | 100.0% |
| Two or more Races | 0 | 0.0% |
| Some other Race | 0 | 0.0% |
| Total | 1,075 | 100.0% |
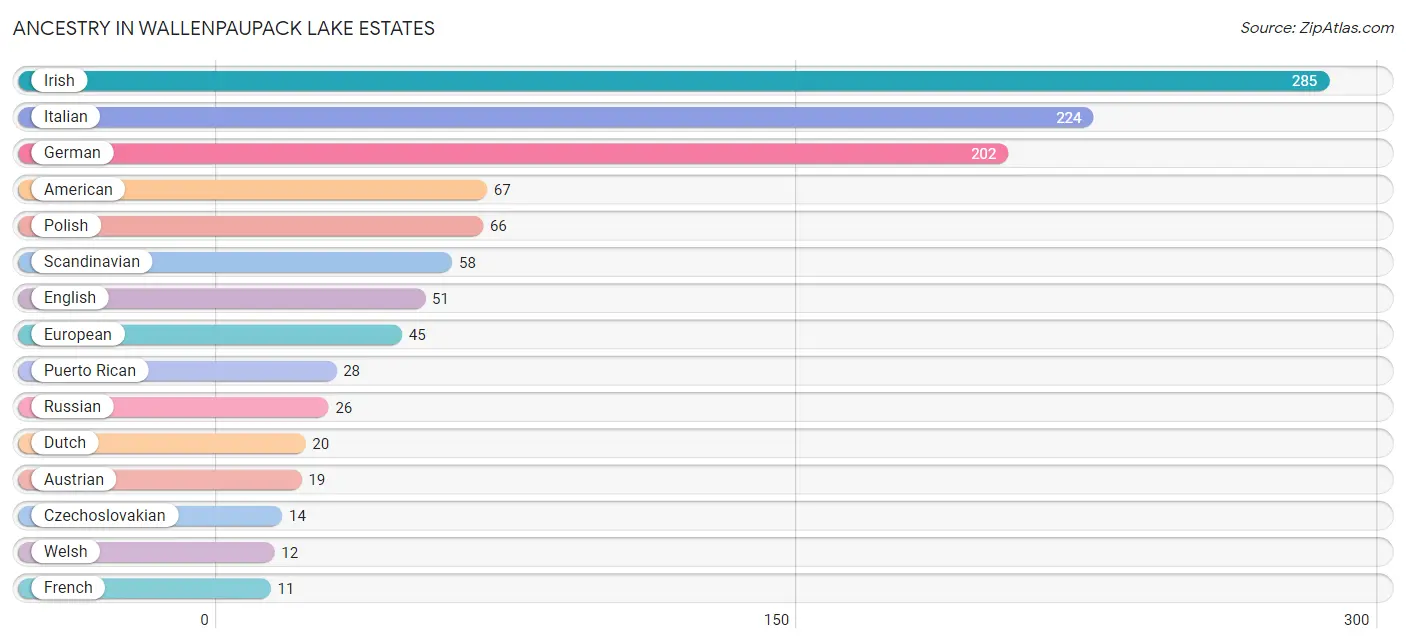
Ancestry in Wallenpaupack Lake Estates
The most populous ancestries reported in Wallenpaupack Lake Estates are Irish (285 | 26.5%), Italian (224 | 20.8%), German (202 | 18.8%), American (67 | 6.2%), and Polish (66 | 6.1%), together accounting for 78.5% of all Wallenpaupack Lake Estates residents.
| Ancestry | # Population | % Population |
| American | 67 | 6.2% |
| Austrian | 19 | 1.8% |
| British | 6 | 0.6% |
| Czechoslovakian | 14 | 1.3% |
| Dutch | 20 | 1.9% |
| English | 51 | 4.7% |
| European | 45 | 4.2% |
| French | 11 | 1.0% |
| German | 202 | 18.8% |
| Hungarian | 10 | 0.9% |
| Irish | 285 | 26.5% |
| Italian | 224 | 20.8% |
| Norwegian | 9 | 0.8% |
| Polish | 66 | 6.1% |
| Puerto Rican | 28 | 2.6% |
| Russian | 26 | 2.4% |
| Scandinavian | 58 | 5.4% |
| Slovak | 11 | 1.0% |
| Welsh | 12 | 1.1% | View All 19 Rows |
Immigrants in Wallenpaupack Lake Estates
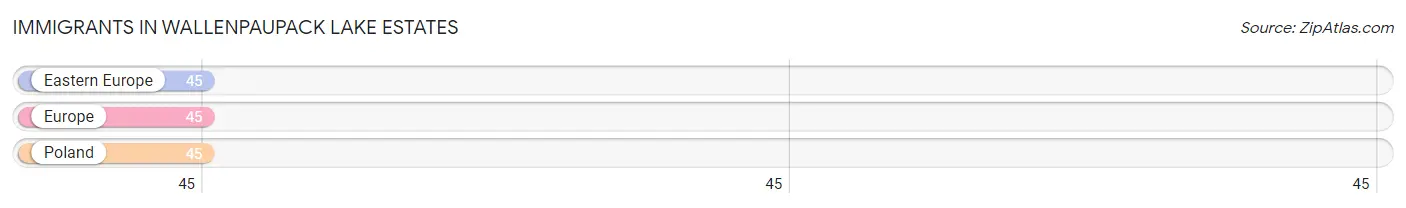
The most numerous immigrant groups reported in Wallenpaupack Lake Estates came from Eastern Europe (45 | 4.2%), Europe (45 | 4.2%), and Poland (45 | 4.2%), together accounting for 12.6% of all Wallenpaupack Lake Estates residents.
| Immigration Origin | # Population | % Population |
| Eastern Europe | 45 | 4.2% |
| Europe | 45 | 4.2% |
| Poland | 45 | 4.2% | View All 3 Rows |
Sex and Age in Wallenpaupack Lake Estates
Sex and Age in Wallenpaupack Lake Estates
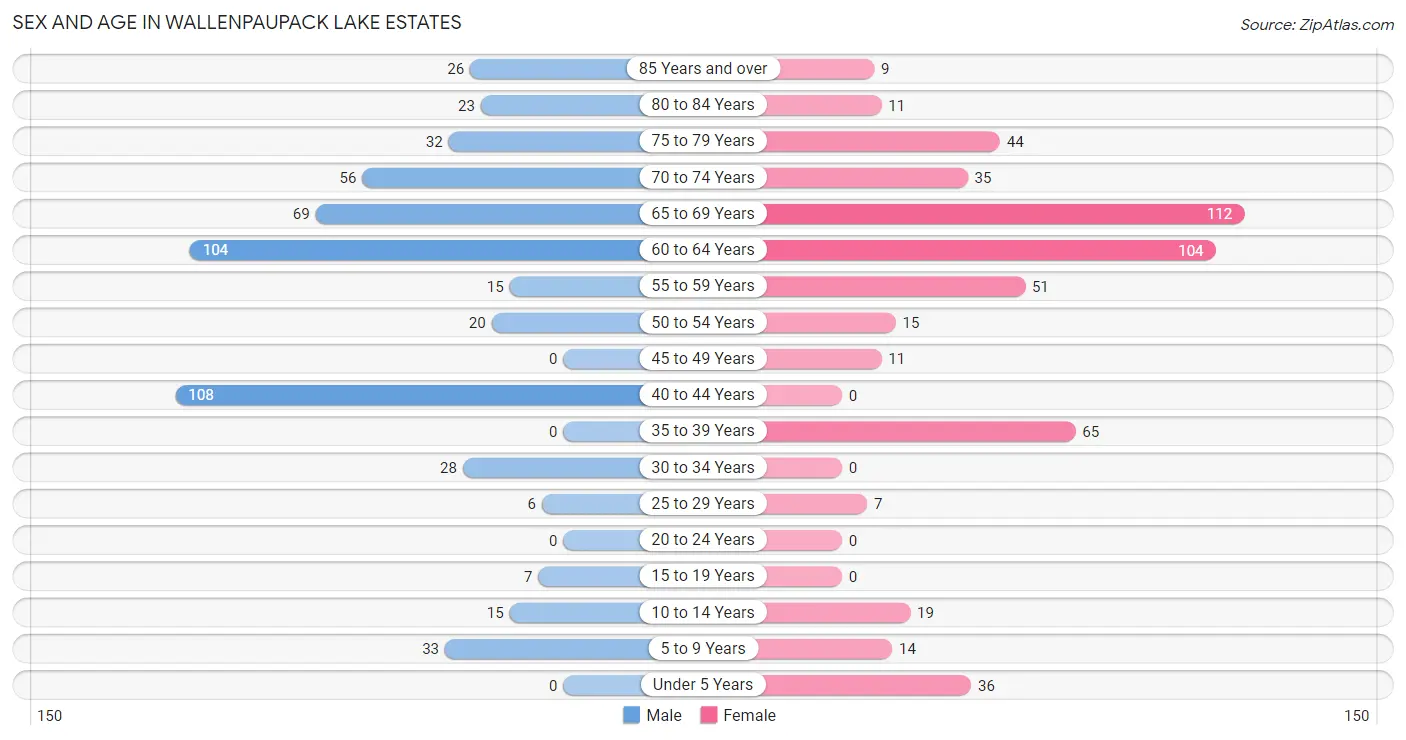
The most populous age groups in Wallenpaupack Lake Estates are 40 to 44 Years (108 | 19.9%) for men and 65 to 69 Years (112 | 21.0%) for women.
| Age Bracket | Male | Female |
| Under 5 Years | 0 (0.0%) | 36 (6.8%) |
| 5 to 9 Years | 33 (6.1%) | 14 (2.6%) |
| 10 to 14 Years | 15 (2.8%) | 19 (3.6%) |
| 15 to 19 Years | 7 (1.3%) | 0 (0.0%) |
| 20 to 24 Years | 0 (0.0%) | 0 (0.0%) |
| 25 to 29 Years | 6 (1.1%) | 7 (1.3%) |
| 30 to 34 Years | 28 (5.2%) | 0 (0.0%) |
| 35 to 39 Years | 0 (0.0%) | 65 (12.2%) |
| 40 to 44 Years | 108 (19.9%) | 0 (0.0%) |
| 45 to 49 Years | 0 (0.0%) | 11 (2.1%) |
| 50 to 54 Years | 20 (3.7%) | 15 (2.8%) |
| 55 to 59 Years | 15 (2.8%) | 51 (9.6%) |
| 60 to 64 Years | 104 (19.2%) | 104 (19.5%) |
| 65 to 69 Years | 69 (12.7%) | 112 (21.0%) |
| 70 to 74 Years | 56 (10.3%) | 35 (6.6%) |
| 75 to 79 Years | 32 (5.9%) | 44 (8.3%) |
| 80 to 84 Years | 23 (4.2%) | 11 (2.1%) |
| 85 Years and over | 26 (4.8%) | 9 (1.7%) |
| Total | 542 (100.0%) | 533 (100.0%) |
Families and Households in Wallenpaupack Lake Estates
Median Family Size in Wallenpaupack Lake Estates
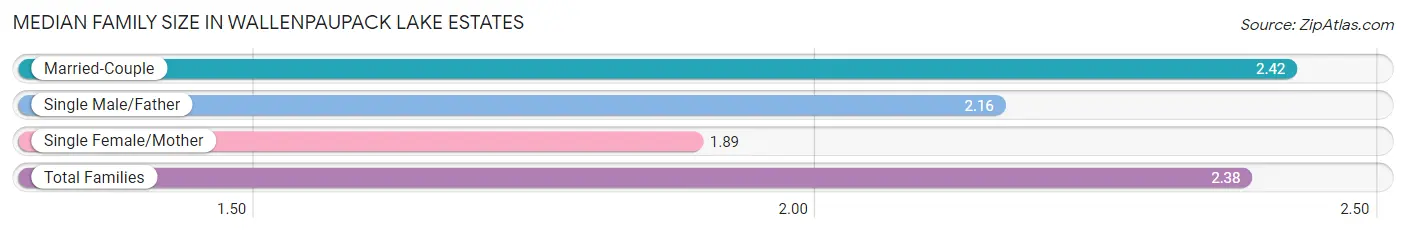
The median family size in Wallenpaupack Lake Estates is 2.38 persons per family, with married-couple families (348 | 89.7%) accounting for the largest median family size of 2.42 persons per family. On the other hand, single female/mother families (9 | 2.3%) represent the smallest median family size with 1.89 persons per family.
| Family Type | # Families | Family Size |
| Married-Couple | 348 (89.7%) | 2.42 |
| Single Male/Father | 31 (8.0%) | 2.16 |
| Single Female/Mother | 9 (2.3%) | 1.89 |
| Total Families | 388 (100.0%) | 2.38 |
Median Household Size in Wallenpaupack Lake Estates
| Household Type | # Households | Household Size |
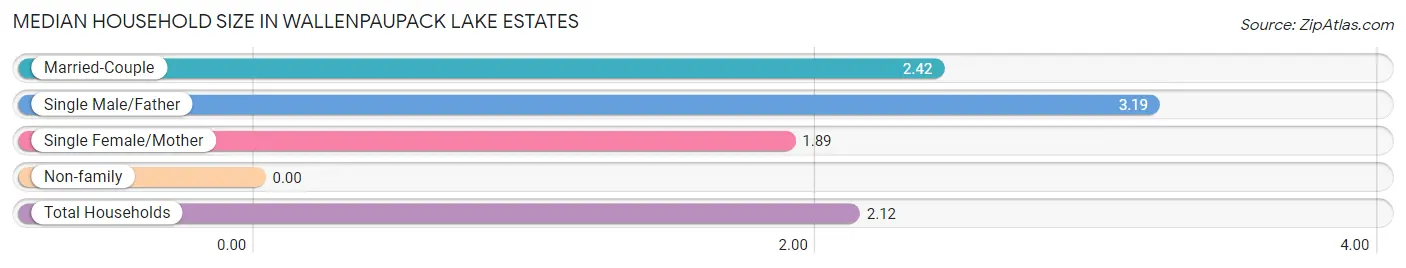
| Married-Couple | 348 (68.8%) | 2.42 |
| Single Male/Father | 31 (6.1%) | 3.19 |
| Single Female/Mother | 9 (1.8%) | 1.89 |
| Non-family | 118 (23.3%) | - |
| Total Households | 506 (100.0%) | 2.12 |
Household Size by Marriage Status in Wallenpaupack Lake Estates
Out of a total of 506 households in Wallenpaupack Lake Estates, 388 (76.7%) are family households, while 118 (23.3%) are nonfamily households. The most numerous type of family households are 2-person households, comprising 302, and the most common type of nonfamily households are 1-person households, comprising 118.
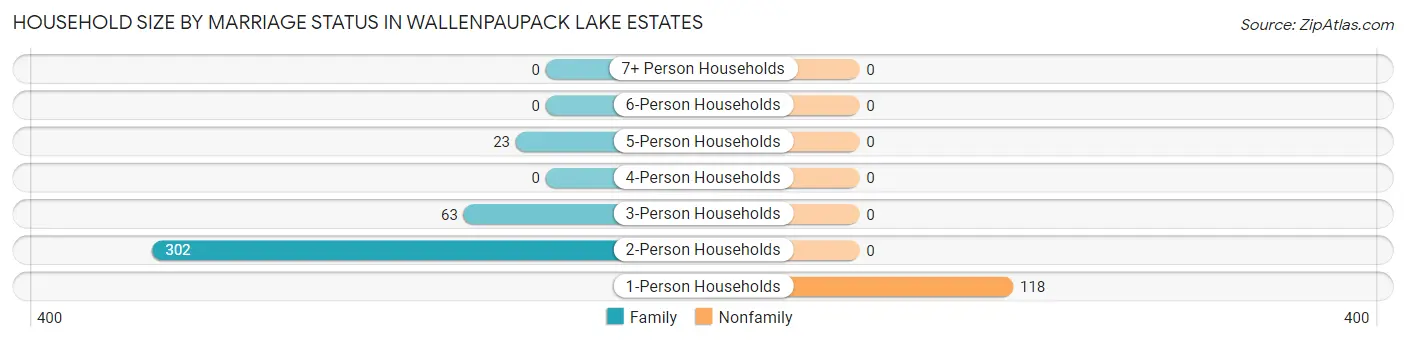
| Household Size | Family Households | Nonfamily Households |
| 1-Person Households | - | 118 (23.3%) |
| 2-Person Households | 302 (59.7%) | 0 (0.0%) |
| 3-Person Households | 63 (12.4%) | 0 (0.0%) |
| 4-Person Households | 0 (0.0%) | 0 (0.0%) |
| 5-Person Households | 23 (4.5%) | 0 (0.0%) |
| 6-Person Households | 0 (0.0%) | 0 (0.0%) |
| 7+ Person Households | 0 (0.0%) | 0 (0.0%) |
| Total | 388 (76.7%) | 118 (23.3%) |
Female Fertility in Wallenpaupack Lake Estates
Fertility by Age in Wallenpaupack Lake Estates
| Age Bracket | Women with Births | Births / 1,000 Women |
| 15 to 19 years | 0 (0.0%) | 0.0 |
| 20 to 34 years | 0 (0.0%) | 0.0 |
| 35 to 50 years | 0 (0.0%) | 0.0 |
| Total | 0 (0.0%) | 0.0 |
Fertility by Age by Marriage Status in Wallenpaupack Lake Estates
| Age Bracket | Married | Unmarried |
| 15 to 19 years | 0 (0.0%) | 0 (0.0%) |
| 20 to 34 years | 0 (0.0%) | 0 (0.0%) |
| 35 to 50 years | 0 (0.0%) | 0 (0.0%) |
| Total | 0 (0.0%) | 0 (0.0%) |
Fertility by Education in Wallenpaupack Lake Estates

| Educational Attainment | Women with Births | Births / 1,000 Women |
| Less than High School | 0 (0.0%) | 0.0 |
| High School Diploma | 0 (0.0%) | 0.0 |
| College or Associate's Degree | 0 (0.0%) | 0.0 |
| Bachelor's Degree | 0 (0.0%) | 0.0 |
| Graduate Degree | 0 (0.0%) | 0.0 |
| Total | 0 (0.0%) | 0.0 |
Fertility by Education by Marriage Status in Wallenpaupack Lake Estates
| Educational Attainment | Married | Unmarried |
| Less than High School | 0 (0.0%) | 0 (0.0%) |
| High School Diploma | 0 (0.0%) | 0 (0.0%) |
| College or Associate's Degree | 0 (0.0%) | 0 (0.0%) |
| Bachelor's Degree | 0 (0.0%) | 0 (0.0%) |
| Graduate Degree | 0 (0.0%) | 0 (0.0%) |
| Total | 0 (0.0%) | 0 (0.0%) |
Employment Characteristics in Wallenpaupack Lake Estates
Employment by Class of Employer in Wallenpaupack Lake Estates
Among the 422 employed individuals in Wallenpaupack Lake Estates, private company employees (254 | 60.2%), not-for-profit organizations (71 | 16.8%), and federal government employees (31 | 7.3%) make up the most common classes of employment.
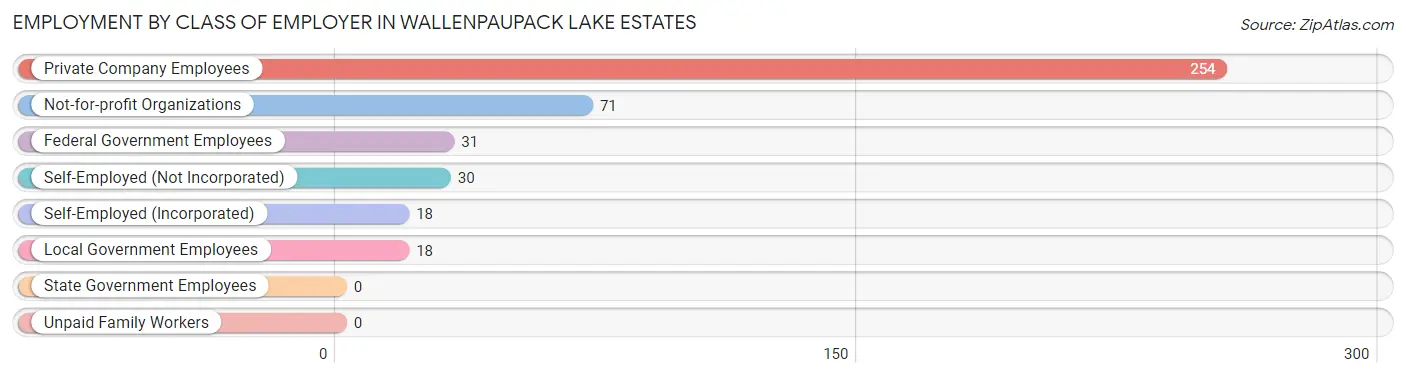
| Employer Class | # Employees | % Employees |
| Private Company Employees | 254 | 60.2% |
| Self-Employed (Incorporated) | 18 | 4.3% |
| Self-Employed (Not Incorporated) | 30 | 7.1% |
| Not-for-profit Organizations | 71 | 16.8% |
| Local Government Employees | 18 | 4.3% |
| State Government Employees | 0 | 0.0% |
| Federal Government Employees | 31 | 7.3% |
| Unpaid Family Workers | 0 | 0.0% |
| Total | 422 | 100.0% |
Employment Status by Age in Wallenpaupack Lake Estates
According to the labor force statistics for Wallenpaupack Lake Estates, out of the total population over 16 years of age (958), 47.9% or 459 individuals are in the labor force, with 8.1% or 37 of them unemployed. The age group with the highest labor force participation rate is 25 to 29 years, with 100.0% or 13 individuals in the labor force. Within the labor force, the 45 to 54 years age range has the highest percentage of unemployed individuals, with 61.3% or 19 of them being unemployed.
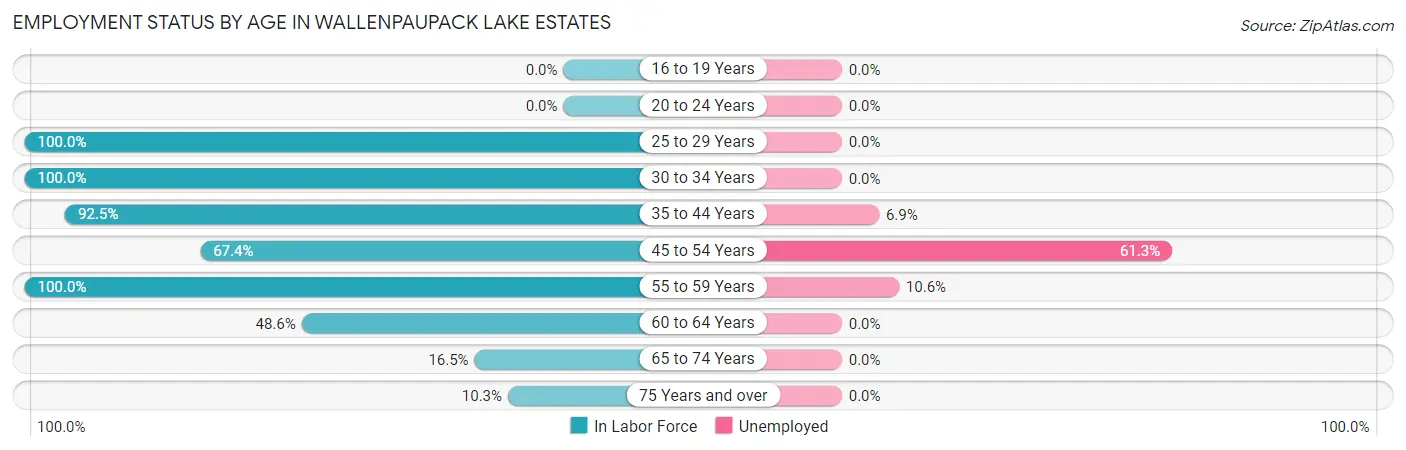
| Age Bracket | In Labor Force | Unemployed |
| 16 to 19 Years | 0 (0.0%) | 0 (0.0%) |
| 20 to 24 Years | 0 (0.0%) | 0 (0.0%) |
| 25 to 29 Years | 13 (100.0%) | 0 (0.0%) |
| 30 to 34 Years | 28 (100.0%) | 0 (0.0%) |
| 35 to 44 Years | 160 (92.5%) | 11 (6.9%) |
| 45 to 54 Years | 31 (67.4%) | 19 (61.3%) |
| 55 to 59 Years | 66 (100.0%) | 7 (10.6%) |
| 60 to 64 Years | 101 (48.6%) | 0 (0.0%) |
| 65 to 74 Years | 45 (16.5%) | 0 (0.0%) |
| 75 Years and over | 15 (10.3%) | 0 (0.0%) |
| Total | 459 (47.9%) | 37 (8.1%) |
Employment Status by Educational Attainment in Wallenpaupack Lake Estates
According to labor force statistics for Wallenpaupack Lake Estates, 74.7% of individuals (399) out of the total population between 25 and 64 years of age (534) are in the labor force, with 9.3% or 37 of them being unemployed. The group with the highest labor force participation rate are those with the educational attainment of high school diploma, with 82.4% or 169 individuals in the labor force. Within the labor force, individuals with college / associate degree education have the highest percentage of unemployment, with 19.0% or 26 of them being unemployed.
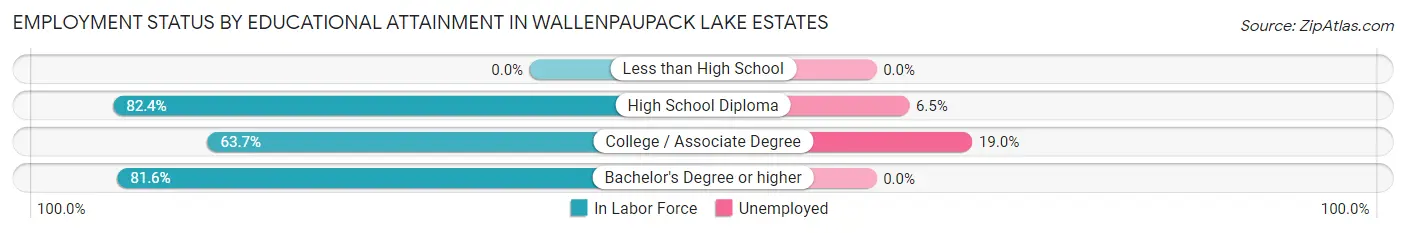
| Educational Attainment | In Labor Force | Unemployed |
| Less than High School | 0 (0.0%) | 0 (0.0%) |
| High School Diploma | 169 (82.4%) | 13 (6.5%) |
| College / Associate Degree | 137 (63.7%) | 41 (19.0%) |
| Bachelor's Degree or higher | 93 (81.6%) | 0 (0.0%) |
| Total | 399 (74.7%) | 50 (9.3%) |
Employment Occupations by Sex in Wallenpaupack Lake Estates
Management, Business, Science and Arts Occupations
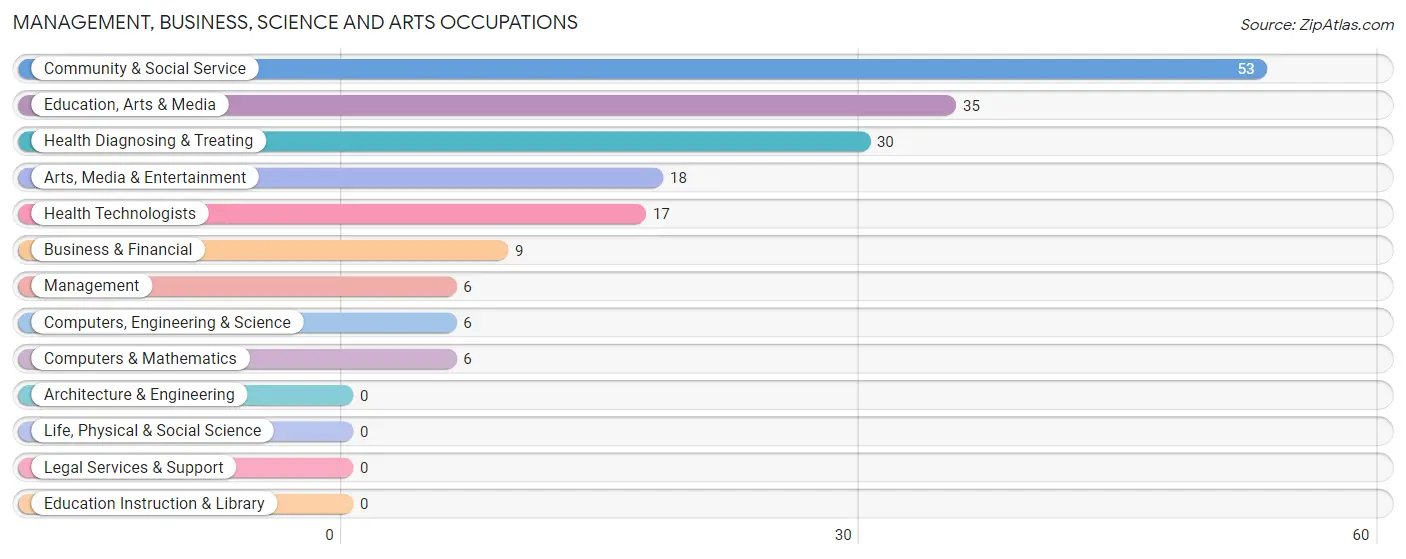
The most common Management, Business, Science and Arts occupations in Wallenpaupack Lake Estates are Community & Social Service (53 | 12.6%), Education, Arts & Media (35 | 8.3%), Health Diagnosing & Treating (30 | 7.1%), Arts, Media & Entertainment (18 | 4.3%), and Health Technologists (17 | 4.0%).
Management, Business, Science and Arts Occupations by Sex
Within the Management, Business, Science and Arts occupations in Wallenpaupack Lake Estates, the most male-oriented occupations are Computers, Engineering & Science (100.0%), Computers & Mathematics (100.0%), and Education, Arts & Media (100.0%), while the most female-oriented occupations are Management (100.0%), Business & Financial (100.0%), and Health Technologists (58.8%).
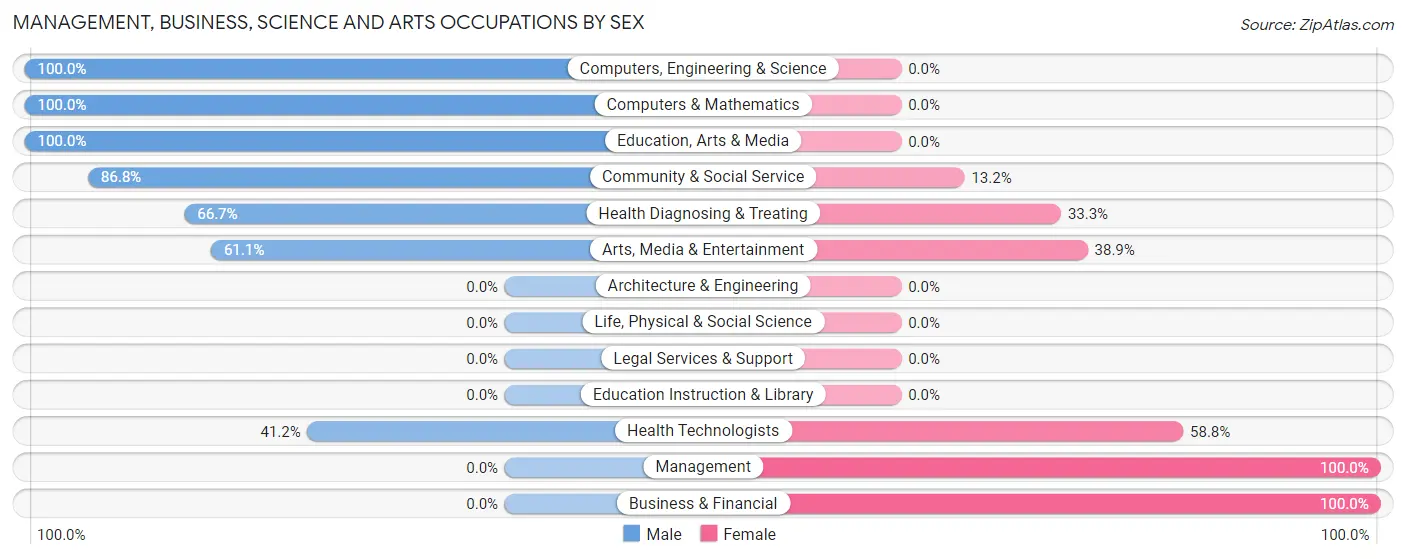
| Occupation | Male | Female |
| Management | 0 (0.0%) | 6 (100.0%) |
| Business & Financial | 0 (0.0%) | 9 (100.0%) |
| Computers, Engineering & Science | 6 (100.0%) | 0 (0.0%) |
| Computers & Mathematics | 6 (100.0%) | 0 (0.0%) |
| Architecture & Engineering | 0 (0.0%) | 0 (0.0%) |
| Life, Physical & Social Science | 0 (0.0%) | 0 (0.0%) |
| Community & Social Service | 46 (86.8%) | 7 (13.2%) |
| Education, Arts & Media | 35 (100.0%) | 0 (0.0%) |
| Legal Services & Support | 0 (0.0%) | 0 (0.0%) |
| Education Instruction & Library | 0 (0.0%) | 0 (0.0%) |
| Arts, Media & Entertainment | 11 (61.1%) | 7 (38.9%) |
| Health Diagnosing & Treating | 20 (66.7%) | 10 (33.3%) |
| Health Technologists | 7 (41.2%) | 10 (58.8%) |
| Total (Category) | 72 (69.2%) | 32 (30.8%) |
| Total (Overall) | 291 (69.0%) | 131 (31.0%) |
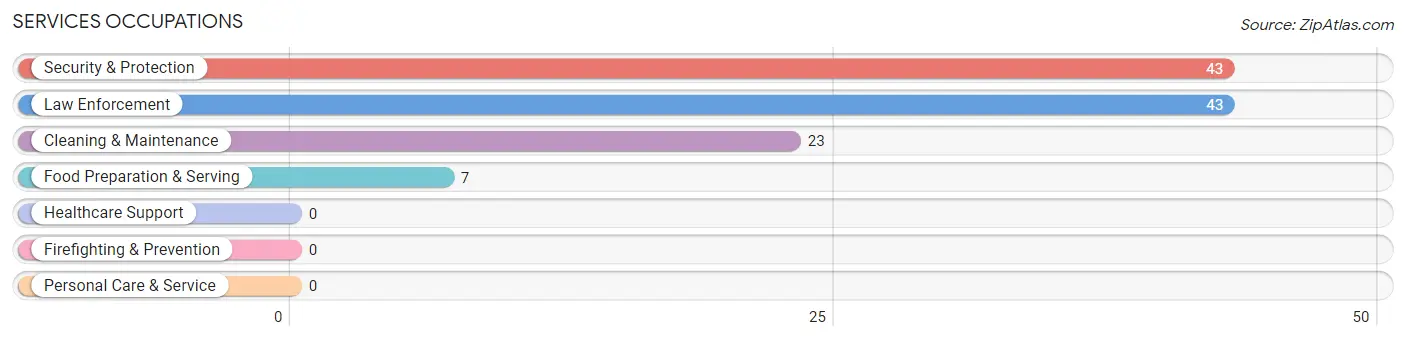
Services Occupations
The most common Services occupations in Wallenpaupack Lake Estates are Security & Protection (43 | 10.2%), Law Enforcement (43 | 10.2%), Cleaning & Maintenance (23 | 5.4%), and Food Preparation & Serving (7 | 1.7%).
Services Occupations by Sex
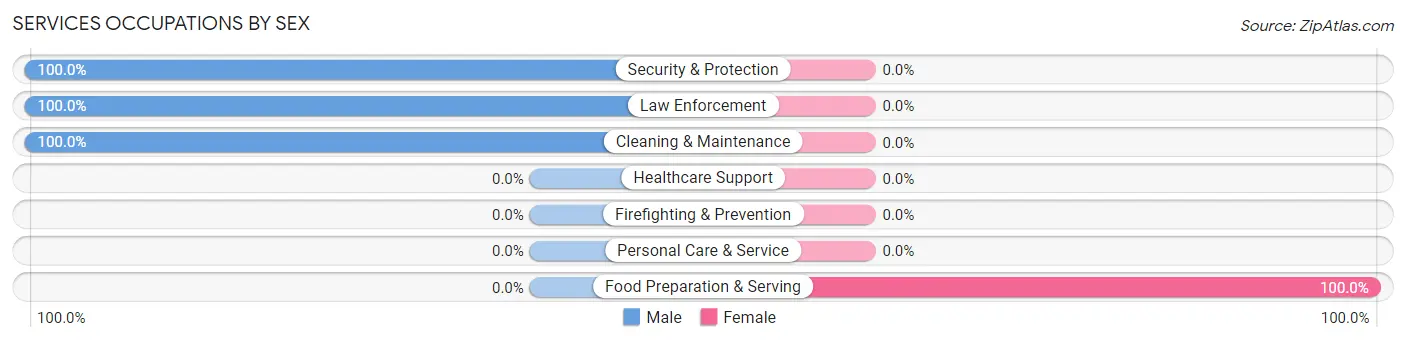
| Occupation | Male | Female |
| Healthcare Support | 0 (0.0%) | 0 (0.0%) |
| Security & Protection | 43 (100.0%) | 0 (0.0%) |
| Firefighting & Prevention | 0 (0.0%) | 0 (0.0%) |
| Law Enforcement | 43 (100.0%) | 0 (0.0%) |
| Food Preparation & Serving | 0 (0.0%) | 7 (100.0%) |
| Cleaning & Maintenance | 23 (100.0%) | 0 (0.0%) |
| Personal Care & Service | 0 (0.0%) | 0 (0.0%) |
| Total (Category) | 66 (90.4%) | 7 (9.6%) |
| Total (Overall) | 291 (69.0%) | 131 (31.0%) |
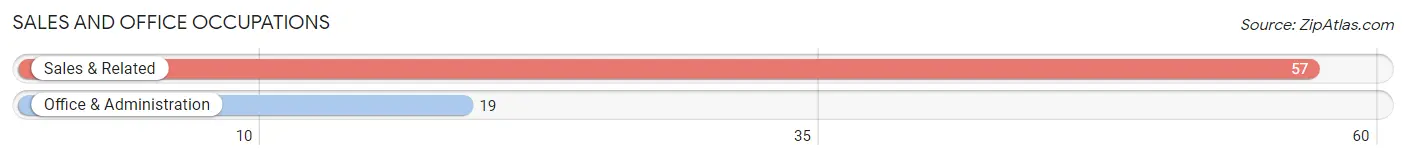
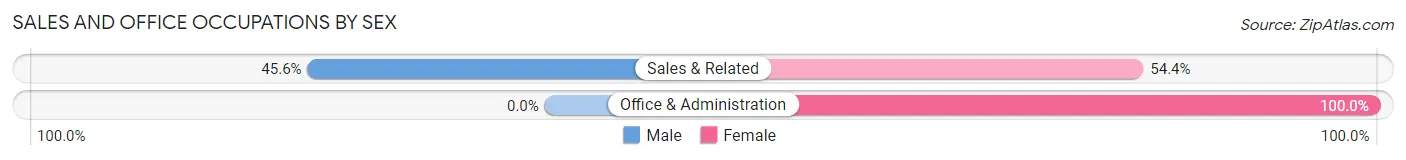
Sales and Office Occupations
The most common Sales and Office occupations in Wallenpaupack Lake Estates are Sales & Related (57 | 13.5%), and Office & Administration (19 | 4.5%).
Sales and Office Occupations by Sex
| Occupation | Male | Female |
| Sales & Related | 26 (45.6%) | 31 (54.4%) |
| Office & Administration | 0 (0.0%) | 19 (100.0%) |
| Total (Category) | 26 (34.2%) | 50 (65.8%) |
| Total (Overall) | 291 (69.0%) | 131 (31.0%) |
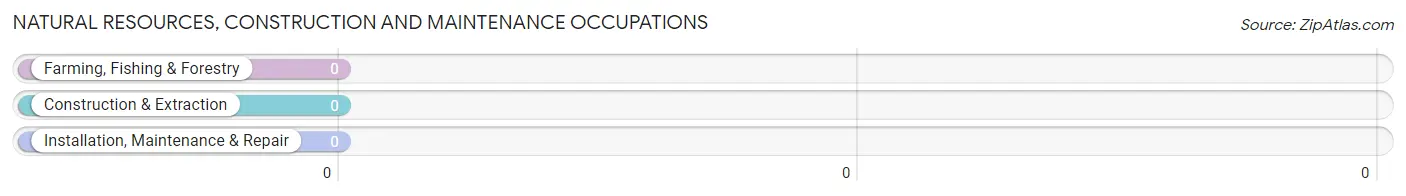
Natural Resources, Construction and Maintenance Occupations
Natural Resources, Construction and Maintenance Occupations by Sex
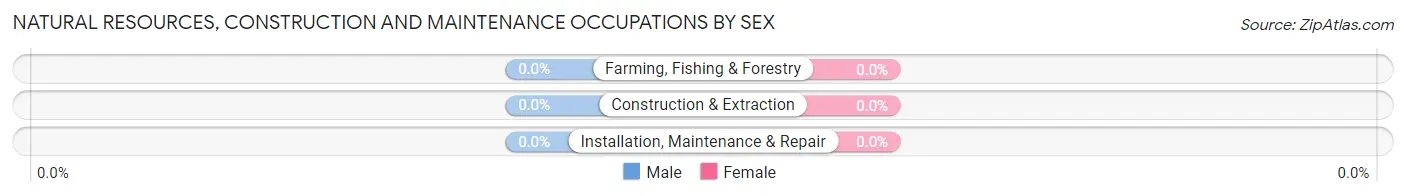
| Occupation | Male | Female |
| Farming, Fishing & Forestry | 0 (0.0%) | 0 (0.0%) |
| Construction & Extraction | 0 (0.0%) | 0 (0.0%) |
| Installation, Maintenance & Repair | 0 (0.0%) | 0 (0.0%) |
| Total (Category) | 0 (0.0%) | 0 (0.0%) |
| Total (Overall) | 291 (69.0%) | 131 (31.0%) |
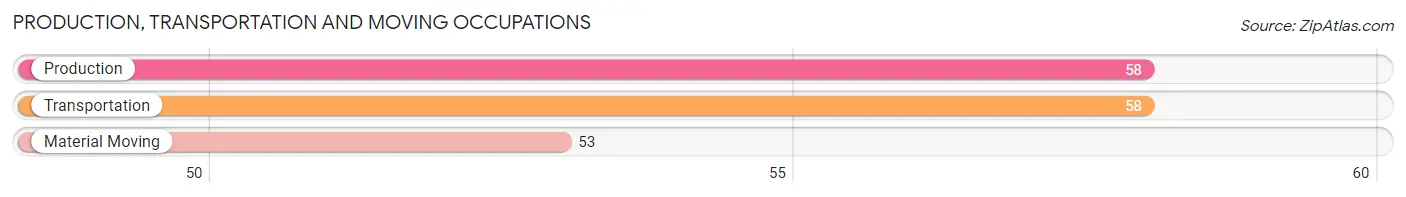
Production, Transportation and Moving Occupations
The most common Production, Transportation and Moving occupations in Wallenpaupack Lake Estates are Production (58 | 13.7%), Transportation (58 | 13.7%), and Material Moving (53 | 12.6%).
Production, Transportation and Moving Occupations by Sex
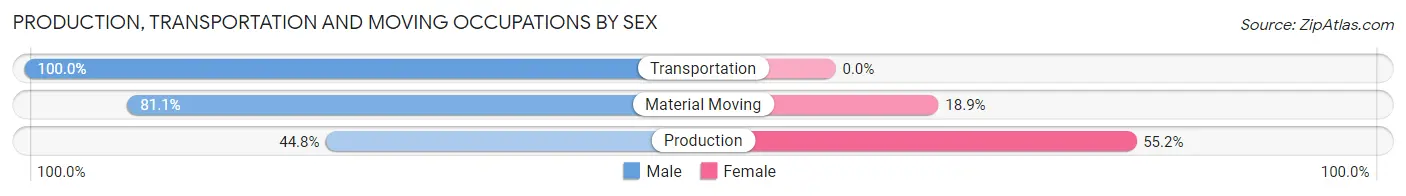
| Occupation | Male | Female |
| Production | 26 (44.8%) | 32 (55.2%) |
| Transportation | 58 (100.0%) | 0 (0.0%) |
| Material Moving | 43 (81.1%) | 10 (18.9%) |
| Total (Category) | 127 (75.1%) | 42 (24.8%) |
| Total (Overall) | 291 (69.0%) | 131 (31.0%) |
Employment Industries by Sex in Wallenpaupack Lake Estates
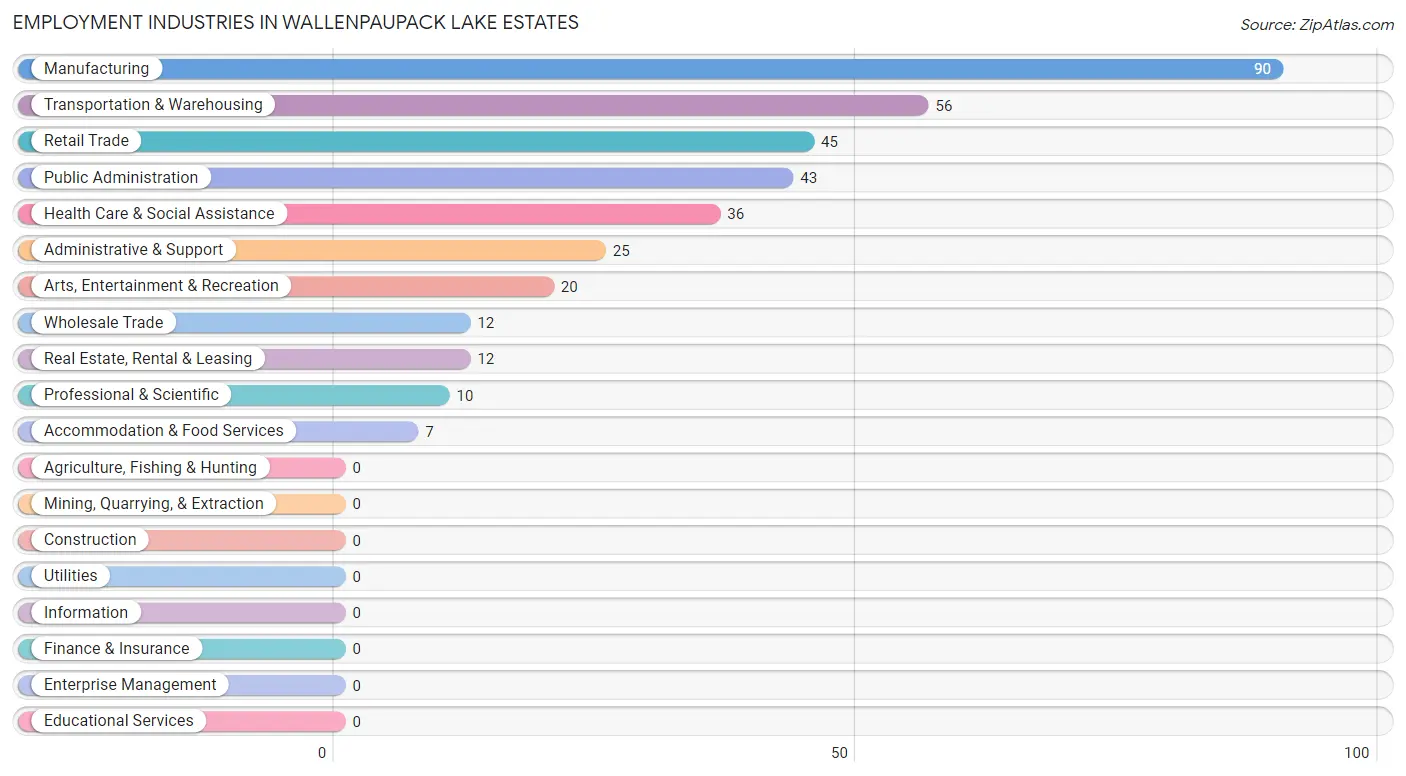
Employment Industries in Wallenpaupack Lake Estates
The major employment industries in Wallenpaupack Lake Estates include Manufacturing (90 | 21.3%), Transportation & Warehousing (56 | 13.3%), Retail Trade (45 | 10.7%), Public Administration (43 | 10.2%), and Health Care & Social Assistance (36 | 8.5%).
Employment Industries by Sex in Wallenpaupack Lake Estates
The Wallenpaupack Lake Estates industries that see more men than women are Wholesale Trade (100.0%), Transportation & Warehousing (100.0%), and Arts, Entertainment & Recreation (100.0%), whereas the industries that tend to have a higher number of women are Real Estate, Rental & Leasing (100.0%), Professional & Scientific (100.0%), and Accommodation & Food Services (100.0%).
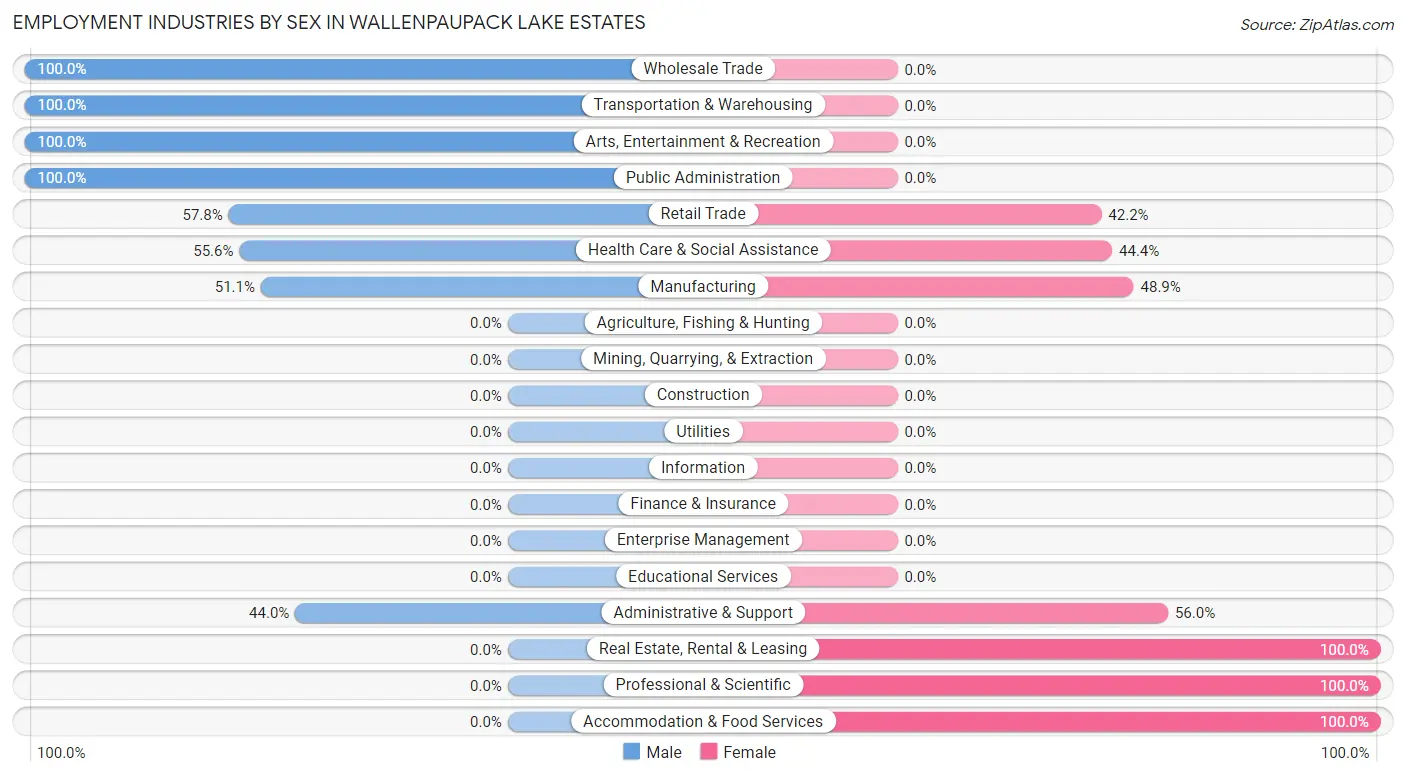
| Industry | Male | Female |
| Agriculture, Fishing & Hunting | 0 (0.0%) | 0 (0.0%) |
| Mining, Quarrying, & Extraction | 0 (0.0%) | 0 (0.0%) |
| Construction | 0 (0.0%) | 0 (0.0%) |
| Manufacturing | 46 (51.1%) | 44 (48.9%) |
| Wholesale Trade | 12 (100.0%) | 0 (0.0%) |
| Retail Trade | 26 (57.8%) | 19 (42.2%) |
| Transportation & Warehousing | 56 (100.0%) | 0 (0.0%) |
| Utilities | 0 (0.0%) | 0 (0.0%) |
| Information | 0 (0.0%) | 0 (0.0%) |
| Finance & Insurance | 0 (0.0%) | 0 (0.0%) |
| Real Estate, Rental & Leasing | 0 (0.0%) | 12 (100.0%) |
| Professional & Scientific | 0 (0.0%) | 10 (100.0%) |
| Enterprise Management | 0 (0.0%) | 0 (0.0%) |
| Administrative & Support | 11 (44.0%) | 14 (56.0%) |
| Educational Services | 0 (0.0%) | 0 (0.0%) |
| Health Care & Social Assistance | 20 (55.6%) | 16 (44.4%) |
| Arts, Entertainment & Recreation | 20 (100.0%) | 0 (0.0%) |
| Accommodation & Food Services | 0 (0.0%) | 7 (100.0%) |
| Public Administration | 43 (100.0%) | 0 (0.0%) |
| Total | 291 (69.0%) | 131 (31.0%) |
Education in Wallenpaupack Lake Estates
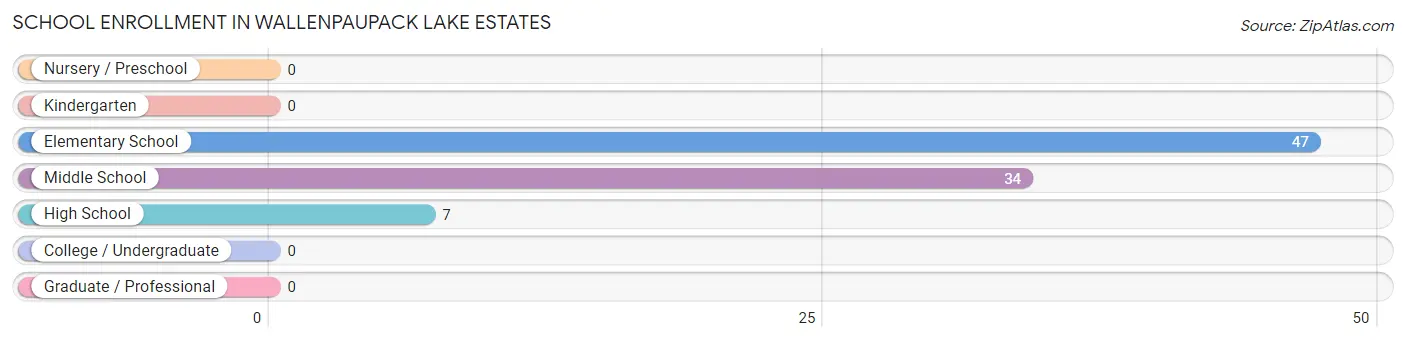
School Enrollment in Wallenpaupack Lake Estates
The most common levels of schooling among the 88 students in Wallenpaupack Lake Estates are elementary school (47 | 53.4%), middle school (34 | 38.6%), and high school (7 | 8.0%).
| School Level | # Students | % Students |
| Nursery / Preschool | 0 | 0.0% |
| Kindergarten | 0 | 0.0% |
| Elementary School | 47 | 53.4% |
| Middle School | 34 | 38.6% |
| High School | 7 | 8.0% |
| College / Undergraduate | 0 | 0.0% |
| Graduate / Professional | 0 | 0.0% |
| Total | 88 | 100.0% |
School Enrollment by Age by Funding Source in Wallenpaupack Lake Estates
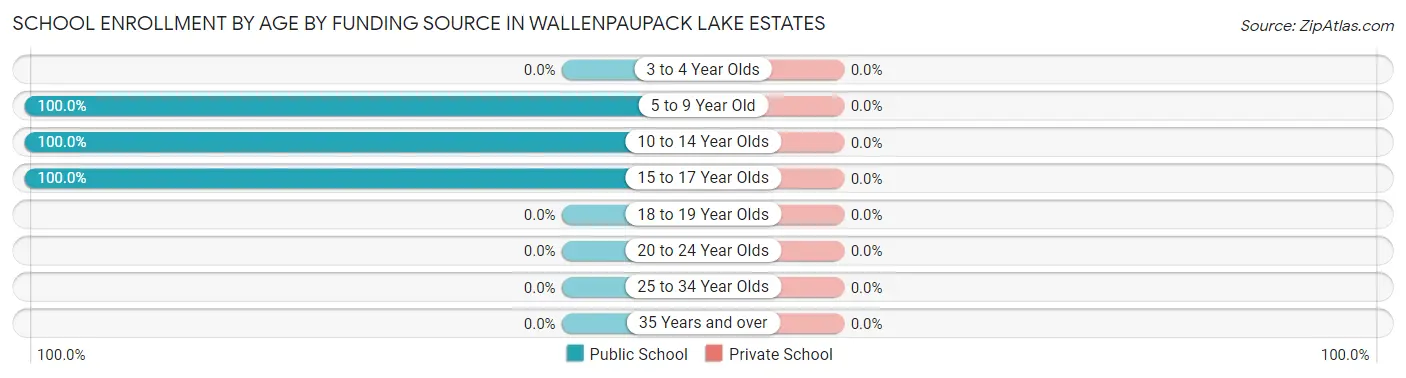
| Age Bracket | Public School | Private School |
| 3 to 4 Year Olds | 0 (0.0%) | 0 (0.0%) |
| 5 to 9 Year Old | 47 (100.0%) | 0 (0.0%) |
| 10 to 14 Year Olds | 34 (100.0%) | 0 (0.0%) |
| 15 to 17 Year Olds | 7 (100.0%) | 0 (0.0%) |
| 18 to 19 Year Olds | 0 (0.0%) | 0 (0.0%) |
| 20 to 24 Year Olds | 0 (0.0%) | 0 (0.0%) |
| 25 to 34 Year Olds | 0 (0.0%) | 0 (0.0%) |
| 35 Years and over | 0 (0.0%) | 0 (0.0%) |
| Total | 88 (100.0%) | 0 (0.0%) |
Educational Attainment by Field of Study in Wallenpaupack Lake Estates
Business (66 | 31.3%), science & technology (46 | 21.8%), liberal arts & history (43 | 20.4%), bio, nature & agricultural (18 | 8.5%), and psychology (10 | 4.7%) are the most common fields of study among 211 individuals in Wallenpaupack Lake Estates who have obtained a bachelor's degree or higher.
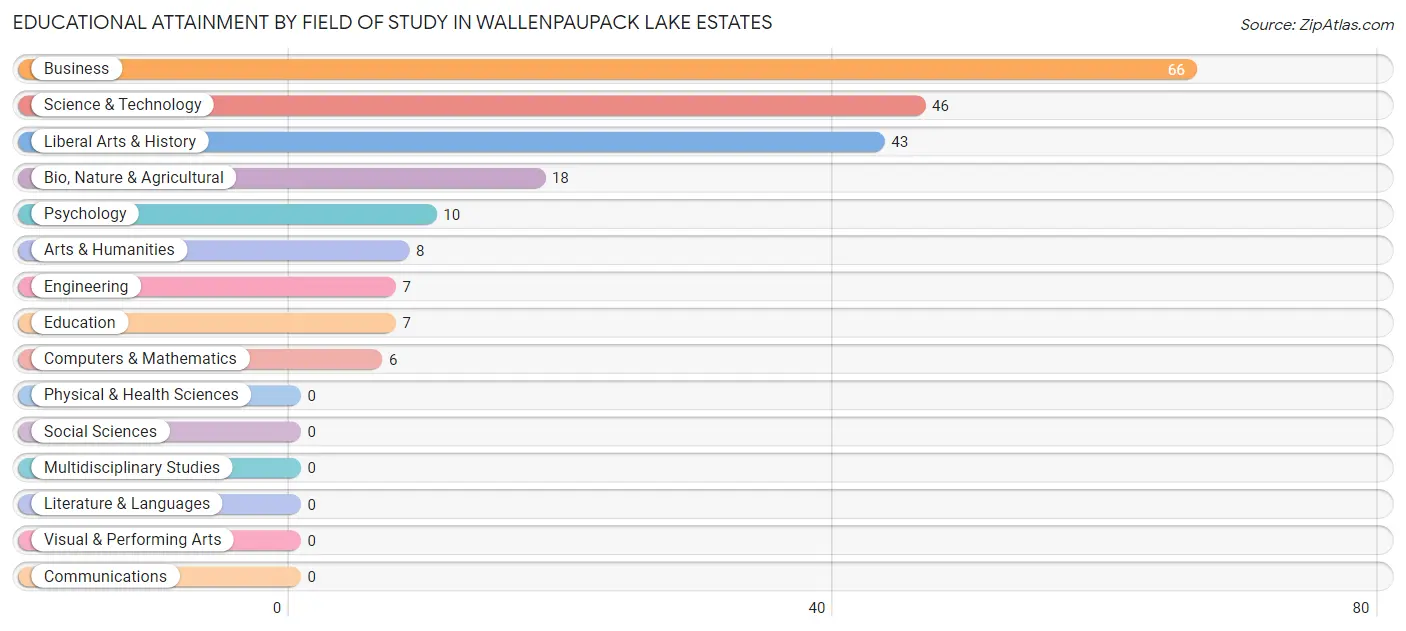
| Field of Study | # Graduates | % Graduates |
| Computers & Mathematics | 6 | 2.8% |
| Bio, Nature & Agricultural | 18 | 8.5% |
| Physical & Health Sciences | 0 | 0.0% |
| Psychology | 10 | 4.7% |
| Social Sciences | 0 | 0.0% |
| Engineering | 7 | 3.3% |
| Multidisciplinary Studies | 0 | 0.0% |
| Science & Technology | 46 | 21.8% |
| Business | 66 | 31.3% |
| Education | 7 | 3.3% |
| Literature & Languages | 0 | 0.0% |
| Liberal Arts & History | 43 | 20.4% |
| Visual & Performing Arts | 0 | 0.0% |
| Communications | 0 | 0.0% |
| Arts & Humanities | 8 | 3.8% |
| Total | 211 | 100.0% |
Transportation & Commute in Wallenpaupack Lake Estates
Vehicle Availability by Sex in Wallenpaupack Lake Estates
The most prevalent vehicle ownership categories in Wallenpaupack Lake Estates are males with 2 vehicles (174, accounting for 59.8%) and females with 2 vehicles (91, making up 132.8%).
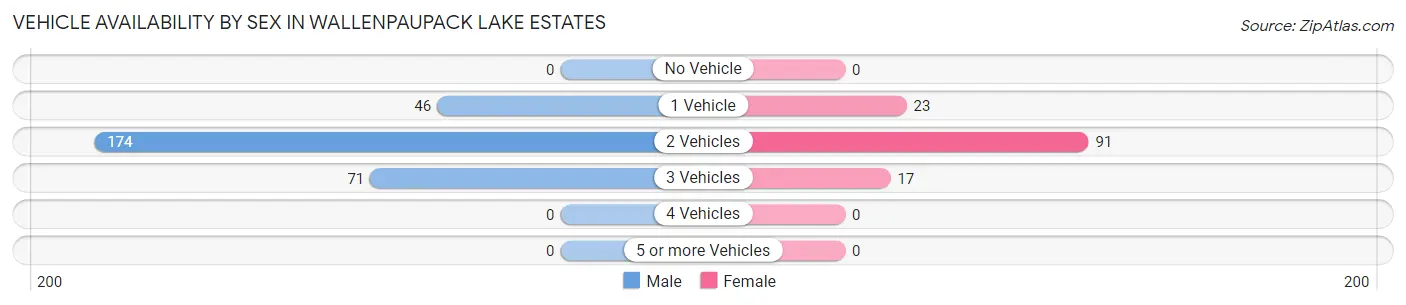
| Vehicles Available | Male | Female |
| No Vehicle | 0 (0.0%) | 0 (0.0%) |
| 1 Vehicle | 46 (15.8%) | 23 (17.6%) |
| 2 Vehicles | 174 (59.8%) | 91 (69.5%) |
| 3 Vehicles | 71 (24.4%) | 17 (13.0%) |
| 4 Vehicles | 0 (0.0%) | 0 (0.0%) |
| 5 or more Vehicles | 0 (0.0%) | 0 (0.0%) |
| Total | 291 (100.0%) | 131 (100.0%) |
Commute Time in Wallenpaupack Lake Estates
The most frequently occuring commute durations in Wallenpaupack Lake Estates are 90 or more minutes (80 commuters, 20.8%), 45 to 59 minutes (64 commuters, 16.6%), and 60 to 89 minutes (63 commuters, 16.4%).
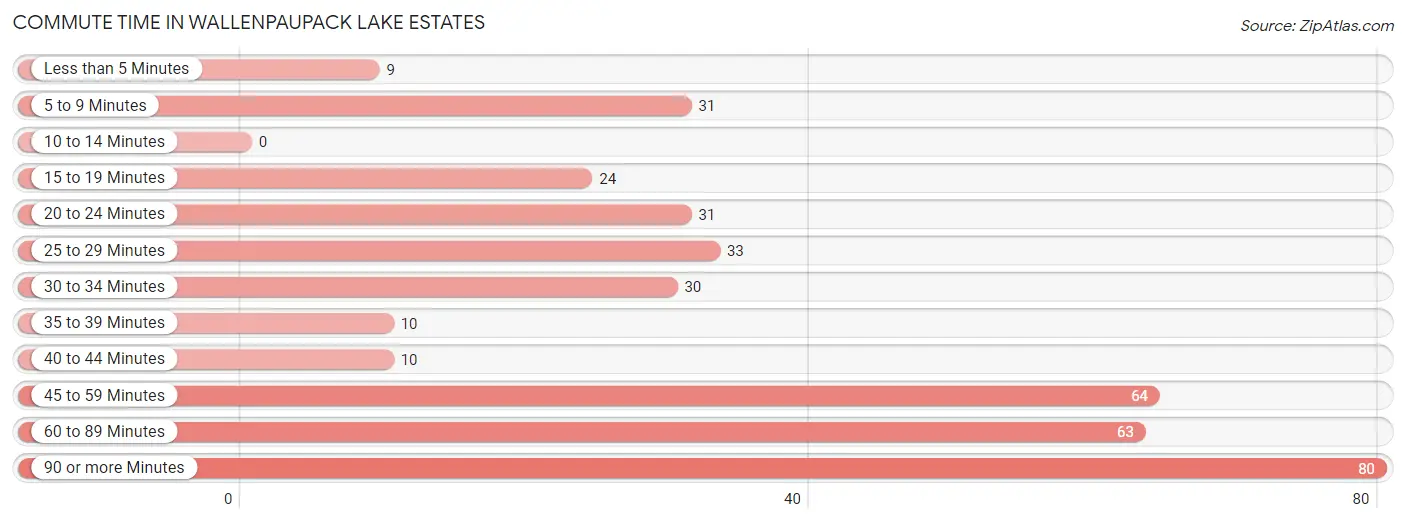
| Commute Time | # Commuters | % Commuters |
| Less than 5 Minutes | 9 | 2.3% |
| 5 to 9 Minutes | 31 | 8.1% |
| 10 to 14 Minutes | 0 | 0.0% |
| 15 to 19 Minutes | 24 | 6.2% |
| 20 to 24 Minutes | 31 | 8.1% |
| 25 to 29 Minutes | 33 | 8.6% |
| 30 to 34 Minutes | 30 | 7.8% |
| 35 to 39 Minutes | 10 | 2.6% |
| 40 to 44 Minutes | 10 | 2.6% |
| 45 to 59 Minutes | 64 | 16.6% |
| 60 to 89 Minutes | 63 | 16.4% |
| 90 or more Minutes | 80 | 20.8% |
Commute Time by Sex in Wallenpaupack Lake Estates
The most common commute times in Wallenpaupack Lake Estates are 45 to 59 minutes (64 commuters, 23.9%) for males and 90 or more minutes (56 commuters, 47.9%) for females.
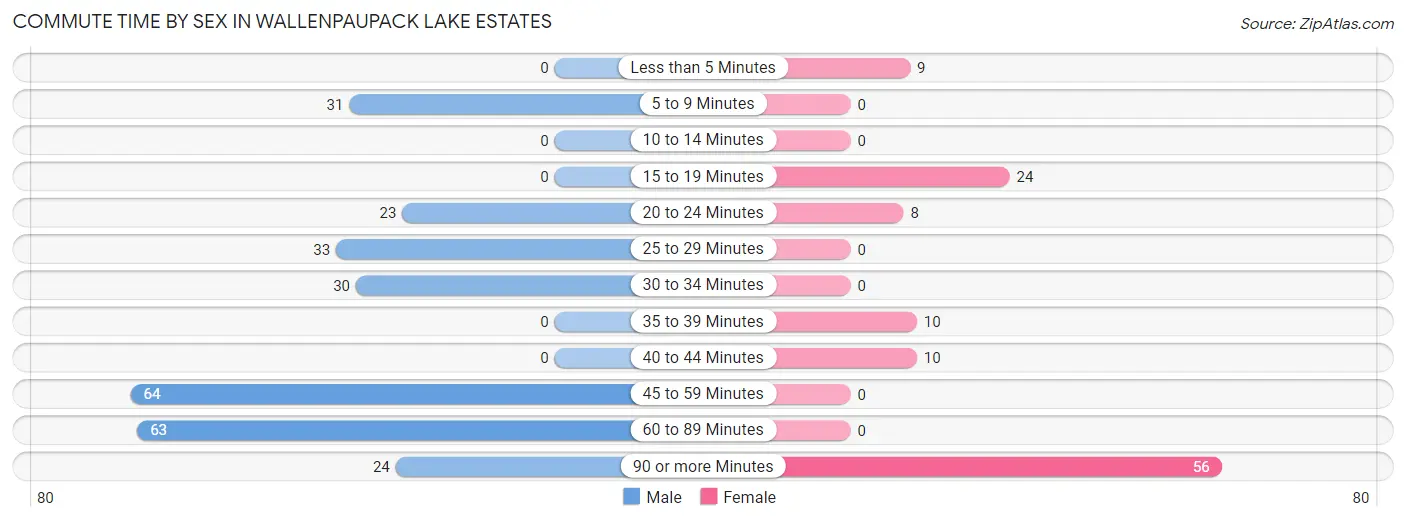
| Commute Time | Male | Female |
| Less than 5 Minutes | 0 (0.0%) | 9 (7.7%) |
| 5 to 9 Minutes | 31 (11.6%) | 0 (0.0%) |
| 10 to 14 Minutes | 0 (0.0%) | 0 (0.0%) |
| 15 to 19 Minutes | 0 (0.0%) | 24 (20.5%) |
| 20 to 24 Minutes | 23 (8.6%) | 8 (6.8%) |
| 25 to 29 Minutes | 33 (12.3%) | 0 (0.0%) |
| 30 to 34 Minutes | 30 (11.2%) | 0 (0.0%) |
| 35 to 39 Minutes | 0 (0.0%) | 10 (8.6%) |
| 40 to 44 Minutes | 0 (0.0%) | 10 (8.6%) |
| 45 to 59 Minutes | 64 (23.9%) | 0 (0.0%) |
| 60 to 89 Minutes | 63 (23.5%) | 0 (0.0%) |
| 90 or more Minutes | 24 (9.0%) | 56 (47.9%) |
Time of Departure to Work by Sex in Wallenpaupack Lake Estates
The most frequent times of departure to work in Wallenpaupack Lake Estates are 12:00 PM to 3:59 PM (89, 33.2%) for males and 7:00 AM to 7:29 AM (56, 47.9%) for females.
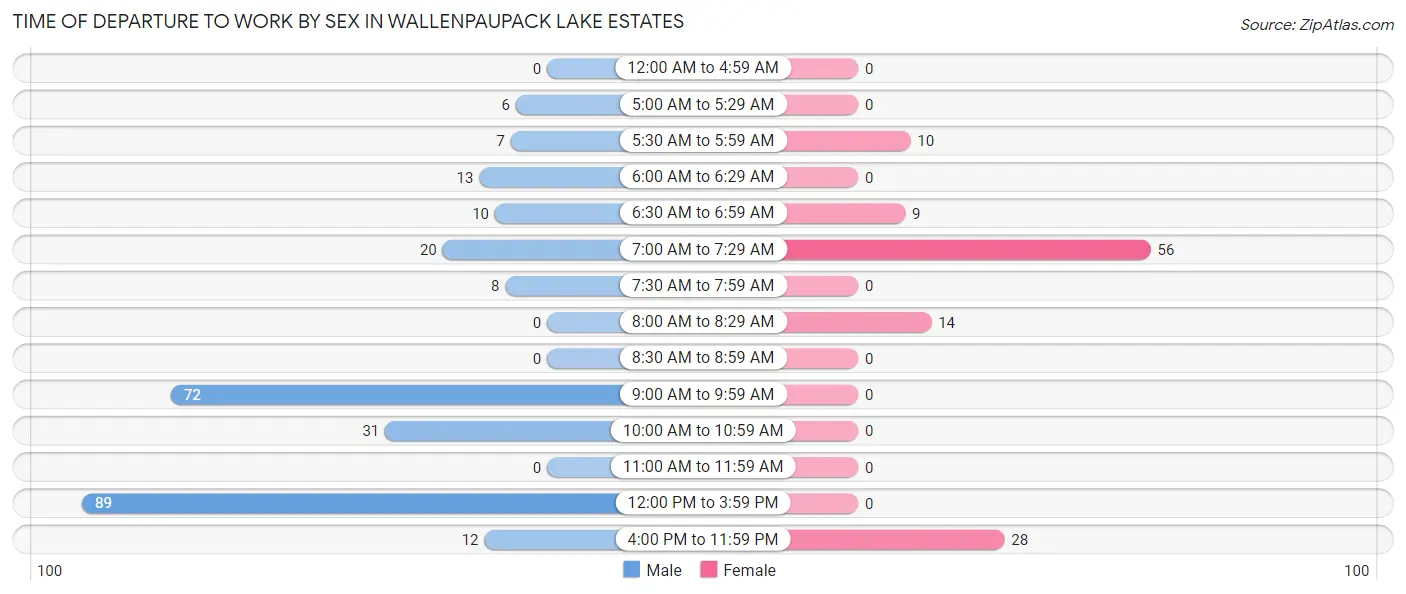
| Time of Departure | Male | Female |
| 12:00 AM to 4:59 AM | 0 (0.0%) | 0 (0.0%) |
| 5:00 AM to 5:29 AM | 6 (2.2%) | 0 (0.0%) |
| 5:30 AM to 5:59 AM | 7 (2.6%) | 10 (8.6%) |
| 6:00 AM to 6:29 AM | 13 (4.9%) | 0 (0.0%) |
| 6:30 AM to 6:59 AM | 10 (3.7%) | 9 (7.7%) |
| 7:00 AM to 7:29 AM | 20 (7.5%) | 56 (47.9%) |
| 7:30 AM to 7:59 AM | 8 (3.0%) | 0 (0.0%) |
| 8:00 AM to 8:29 AM | 0 (0.0%) | 14 (12.0%) |
| 8:30 AM to 8:59 AM | 0 (0.0%) | 0 (0.0%) |
| 9:00 AM to 9:59 AM | 72 (26.9%) | 0 (0.0%) |
| 10:00 AM to 10:59 AM | 31 (11.6%) | 0 (0.0%) |
| 11:00 AM to 11:59 AM | 0 (0.0%) | 0 (0.0%) |
| 12:00 PM to 3:59 PM | 89 (33.2%) | 0 (0.0%) |
| 4:00 PM to 11:59 PM | 12 (4.5%) | 28 (23.9%) |
| Total | 268 (100.0%) | 117 (100.0%) |
Housing Occupancy in Wallenpaupack Lake Estates
Occupancy by Ownership in Wallenpaupack Lake Estates
Of the total 506 dwellings in Wallenpaupack Lake Estates, owner-occupied units account for 456 (90.1%), while renter-occupied units make up 50 (9.9%).
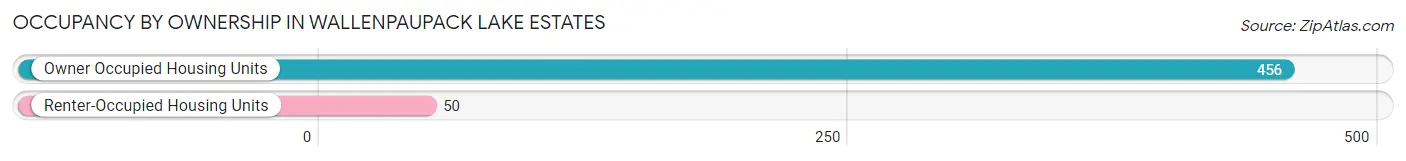
| Occupancy | # Housing Units | % Housing Units |
| Owner Occupied Housing Units | 456 | 90.1% |
| Renter-Occupied Housing Units | 50 | 9.9% |
| Total Occupied Housing Units | 506 | 100.0% |
Occupancy by Household Size in Wallenpaupack Lake Estates
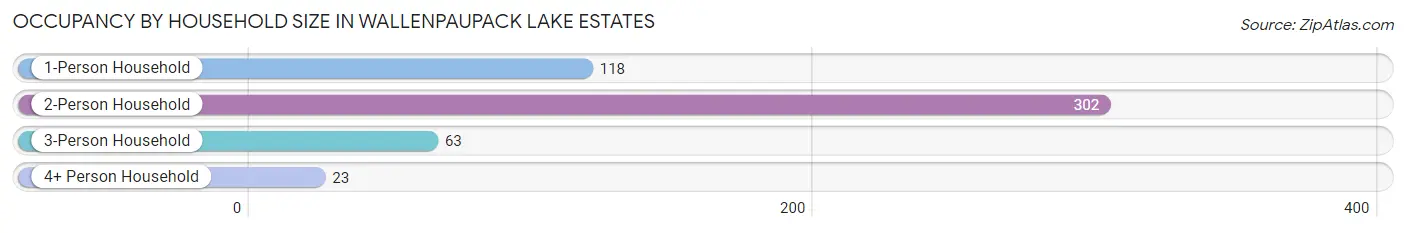
| Household Size | # Housing Units | % Housing Units |
| 1-Person Household | 118 | 23.3% |
| 2-Person Household | 302 | 59.7% |
| 3-Person Household | 63 | 12.4% |
| 4+ Person Household | 23 | 4.5% |
| Total Housing Units | 506 | 100.0% |
Occupancy by Ownership by Household Size in Wallenpaupack Lake Estates
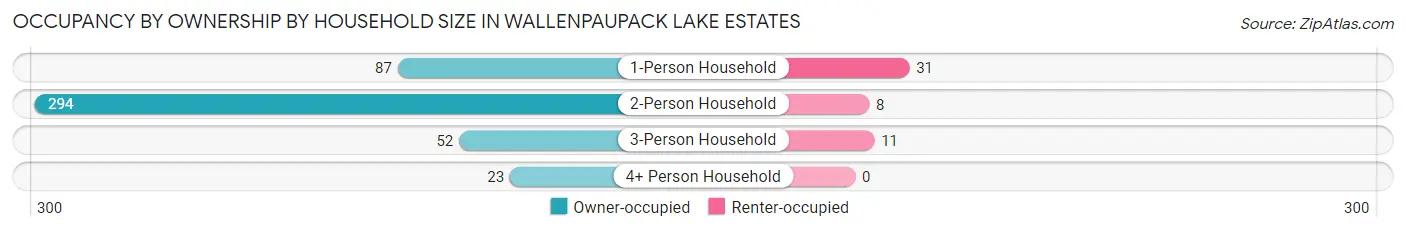
| Household Size | Owner-occupied | Renter-occupied |
| 1-Person Household | 87 (73.7%) | 31 (26.3%) |
| 2-Person Household | 294 (97.4%) | 8 (2.6%) |
| 3-Person Household | 52 (82.5%) | 11 (17.5%) |
| 4+ Person Household | 23 (100.0%) | 0 (0.0%) |
| Total Housing Units | 456 (90.1%) | 50 (9.9%) |
Occupancy by Educational Attainment in Wallenpaupack Lake Estates
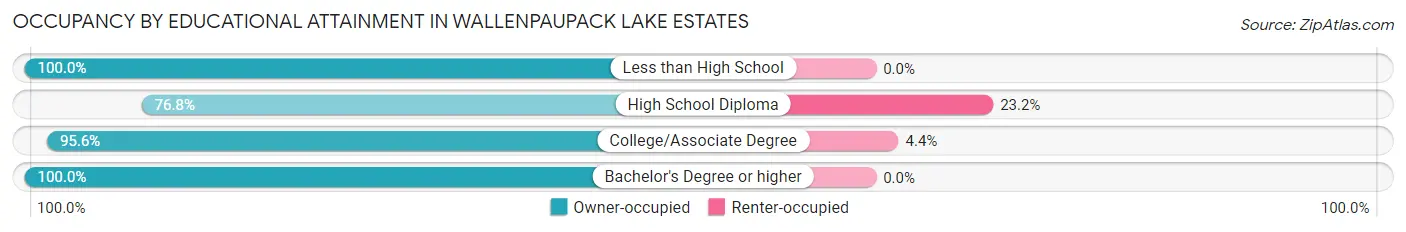
| Household Size | Owner-occupied | Renter-occupied |
| Less than High School | 15 (100.0%) | 0 (0.0%) |
| High School Diploma | 139 (76.8%) | 42 (23.2%) |
| College/Associate Degree | 172 (95.6%) | 8 (4.4%) |
| Bachelor's Degree or higher | 130 (100.0%) | 0 (0.0%) |
Occupancy by Age of Householder in Wallenpaupack Lake Estates
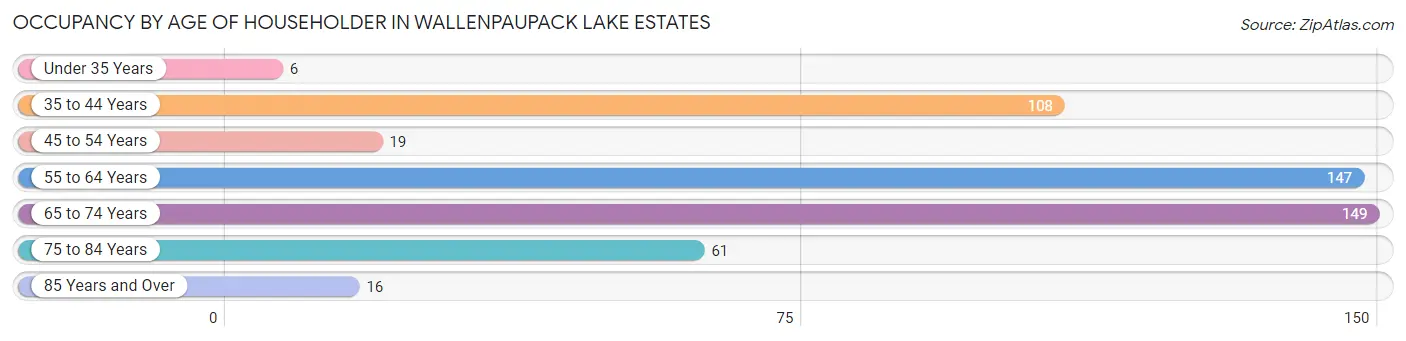
| Age Bracket | # Households | % Households |
| Under 35 Years | 6 | 1.2% |
| 35 to 44 Years | 108 | 21.3% |
| 45 to 54 Years | 19 | 3.7% |
| 55 to 64 Years | 147 | 29.0% |
| 65 to 74 Years | 149 | 29.4% |
| 75 to 84 Years | 61 | 12.1% |
| 85 Years and Over | 16 | 3.2% |
| Total | 506 | 100.0% |
Housing Finances in Wallenpaupack Lake Estates
Median Income by Occupancy in Wallenpaupack Lake Estates
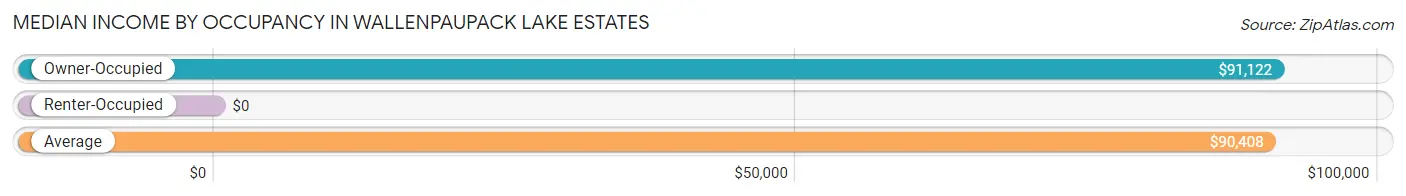
| Occupancy Type | # Households | Median Income |
| Owner-Occupied | 456 (90.1%) | $91,122 |
| Renter-Occupied | 50 (9.9%) | $0 |
| Average | 506 (100.0%) | $90,408 |
Occupancy by Householder Income Bracket in Wallenpaupack Lake Estates
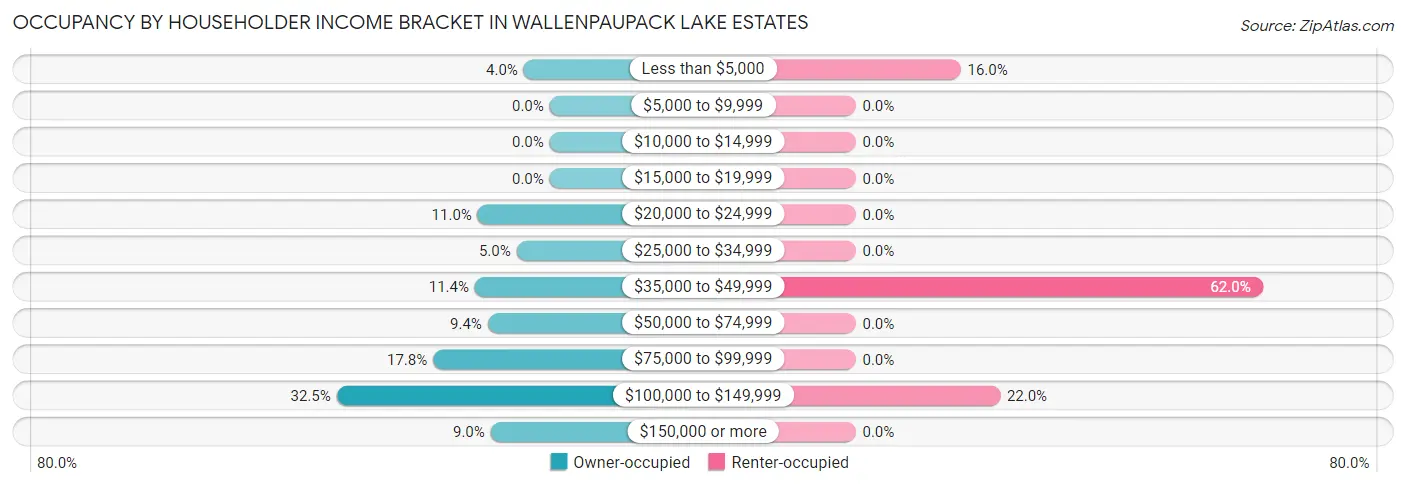
| Income Bracket | Owner-occupied | Renter-occupied |
| Less than $5,000 | 18 (4.0%) | 8 (16.0%) |
| $5,000 to $9,999 | 0 (0.0%) | 0 (0.0%) |
| $10,000 to $14,999 | 0 (0.0%) | 0 (0.0%) |
| $15,000 to $19,999 | 0 (0.0%) | 0 (0.0%) |
| $20,000 to $24,999 | 50 (11.0%) | 0 (0.0%) |
| $25,000 to $34,999 | 23 (5.0%) | 0 (0.0%) |
| $35,000 to $49,999 | 52 (11.4%) | 31 (62.0%) |
| $50,000 to $74,999 | 43 (9.4%) | 0 (0.0%) |
| $75,000 to $99,999 | 81 (17.8%) | 0 (0.0%) |
| $100,000 to $149,999 | 148 (32.5%) | 11 (22.0%) |
| $150,000 or more | 41 (9.0%) | 0 (0.0%) |
| Total | 456 (100.0%) | 50 (100.0%) |
Monthly Housing Cost Tiers in Wallenpaupack Lake Estates
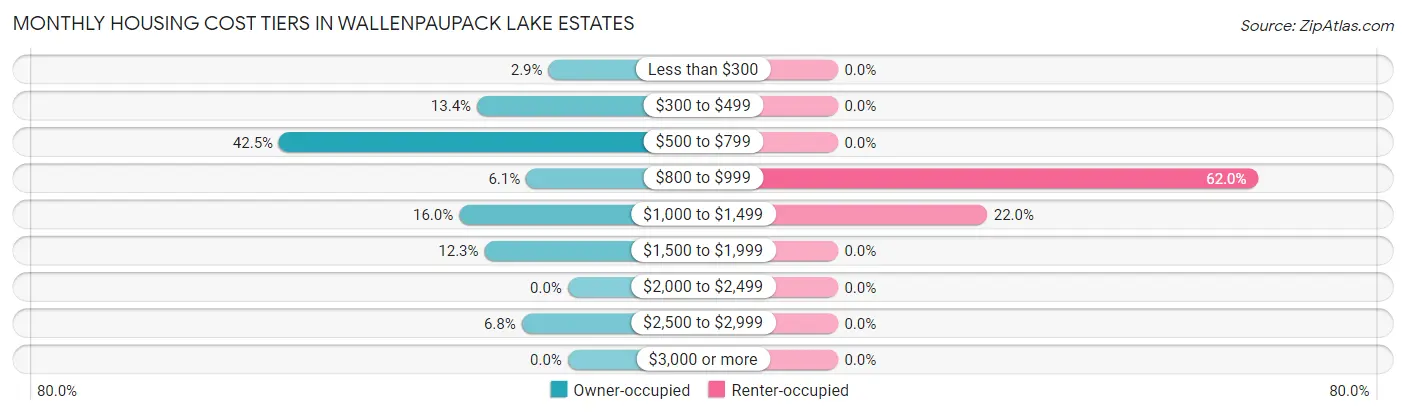
| Monthly Cost | Owner-occupied | Renter-occupied |
| Less than $300 | 13 (2.9%) | 0 (0.0%) |
| $300 to $499 | 61 (13.4%) | 0 (0.0%) |
| $500 to $799 | 194 (42.5%) | 0 (0.0%) |
| $800 to $999 | 28 (6.1%) | 31 (62.0%) |
| $1,000 to $1,499 | 73 (16.0%) | 11 (22.0%) |
| $1,500 to $1,999 | 56 (12.3%) | 0 (0.0%) |
| $2,000 to $2,499 | 0 (0.0%) | 0 (0.0%) |
| $2,500 to $2,999 | 31 (6.8%) | 0 (0.0%) |
| $3,000 or more | 0 (0.0%) | 0 (0.0%) |
| Total | 456 (100.0%) | 50 (100.0%) |
Physical Housing Characteristics in Wallenpaupack Lake Estates
Housing Structures in Wallenpaupack Lake Estates
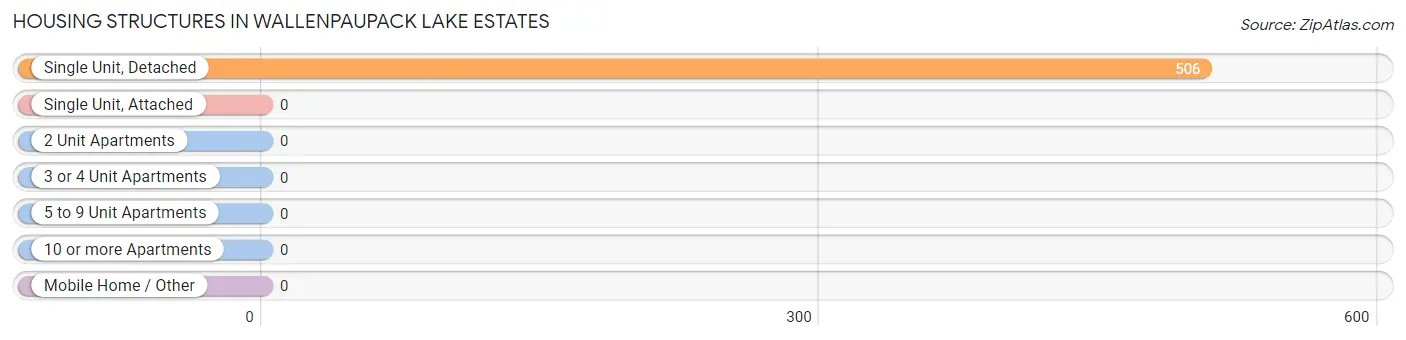
| Structure Type | # Housing Units | % Housing Units |
| Single Unit, Detached | 506 | 100.0% |
| Single Unit, Attached | 0 | 0.0% |
| 2 Unit Apartments | 0 | 0.0% |
| 3 or 4 Unit Apartments | 0 | 0.0% |
| 5 to 9 Unit Apartments | 0 | 0.0% |
| 10 or more Apartments | 0 | 0.0% |
| Mobile Home / Other | 0 | 0.0% |
| Total | 506 | 100.0% |
Housing Structures by Occupancy in Wallenpaupack Lake Estates
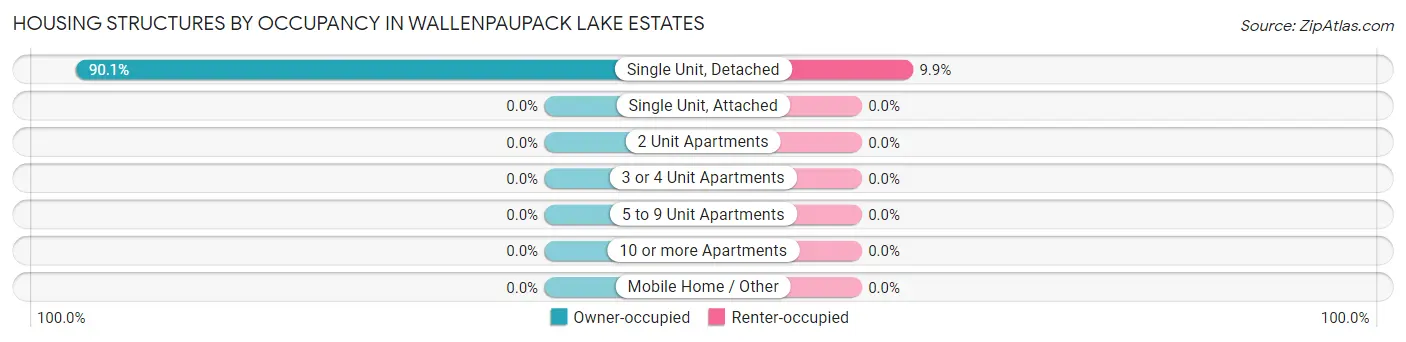
| Structure Type | Owner-occupied | Renter-occupied |
| Single Unit, Detached | 456 (90.1%) | 50 (9.9%) |
| Single Unit, Attached | 0 (0.0%) | 0 (0.0%) |
| 2 Unit Apartments | 0 (0.0%) | 0 (0.0%) |
| 3 or 4 Unit Apartments | 0 (0.0%) | 0 (0.0%) |
| 5 to 9 Unit Apartments | 0 (0.0%) | 0 (0.0%) |
| 10 or more Apartments | 0 (0.0%) | 0 (0.0%) |
| Mobile Home / Other | 0 (0.0%) | 0 (0.0%) |
| Total | 456 (90.1%) | 50 (9.9%) |
Housing Structures by Number of Rooms in Wallenpaupack Lake Estates
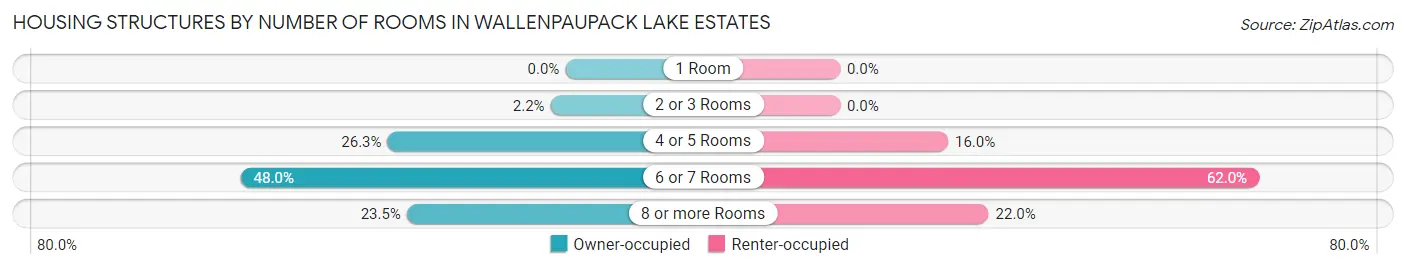
| Number of Rooms | Owner-occupied | Renter-occupied |
| 1 Room | 0 (0.0%) | 0 (0.0%) |
| 2 or 3 Rooms | 10 (2.2%) | 0 (0.0%) |
| 4 or 5 Rooms | 120 (26.3%) | 8 (16.0%) |
| 6 or 7 Rooms | 219 (48.0%) | 31 (62.0%) |
| 8 or more Rooms | 107 (23.5%) | 11 (22.0%) |
| Total | 456 (100.0%) | 50 (100.0%) |
Housing Structure by Heating Type in Wallenpaupack Lake Estates
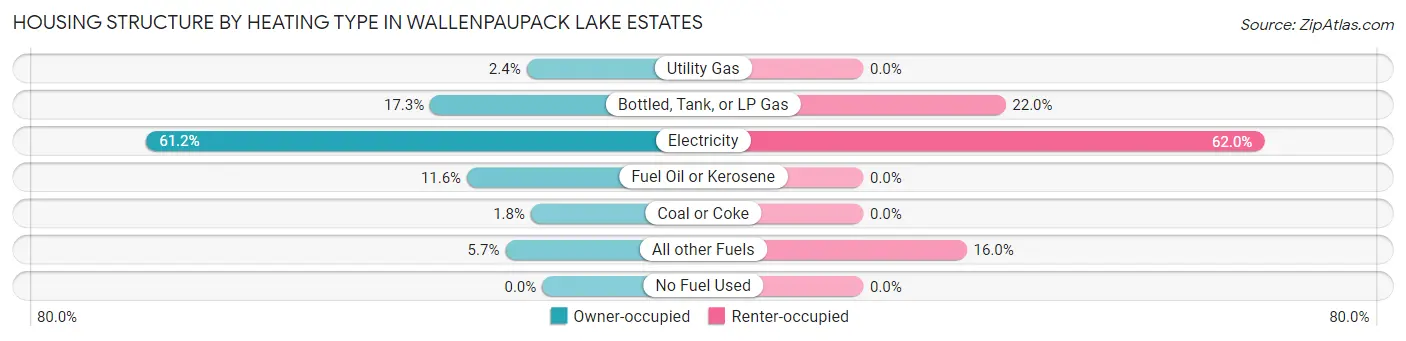
| Heating Type | Owner-occupied | Renter-occupied |
| Utility Gas | 11 (2.4%) | 0 (0.0%) |
| Bottled, Tank, or LP Gas | 79 (17.3%) | 11 (22.0%) |
| Electricity | 279 (61.2%) | 31 (62.0%) |
| Fuel Oil or Kerosene | 53 (11.6%) | 0 (0.0%) |
| Coal or Coke | 8 (1.8%) | 0 (0.0%) |
| All other Fuels | 26 (5.7%) | 8 (16.0%) |
| No Fuel Used | 0 (0.0%) | 0 (0.0%) |
| Total | 456 (100.0%) | 50 (100.0%) |
Household Vehicle Usage in Wallenpaupack Lake Estates
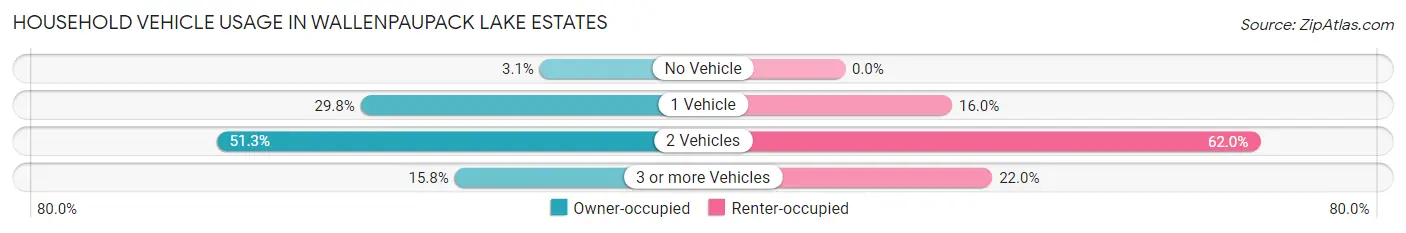
| Vehicles per Household | Owner-occupied | Renter-occupied |
| No Vehicle | 14 (3.1%) | 0 (0.0%) |
| 1 Vehicle | 136 (29.8%) | 8 (16.0%) |
| 2 Vehicles | 234 (51.3%) | 31 (62.0%) |
| 3 or more Vehicles | 72 (15.8%) | 11 (22.0%) |
| Total | 456 (100.0%) | 50 (100.0%) |
Real Estate & Mortgages in Wallenpaupack Lake Estates
Real Estate and Mortgage Overview in Wallenpaupack Lake Estates
| Characteristic | Without Mortgage | With Mortgage |
| Housing Units | 273 | 183 |
| Median Property Value | $173,400 | $209,900 |
| Median Household Income | $61,793 | $20 |
| Monthly Housing Costs | $626 | $0 |
| Real Estate Taxes | $2,554 | $8 |
Property Value by Mortgage Status in Wallenpaupack Lake Estates
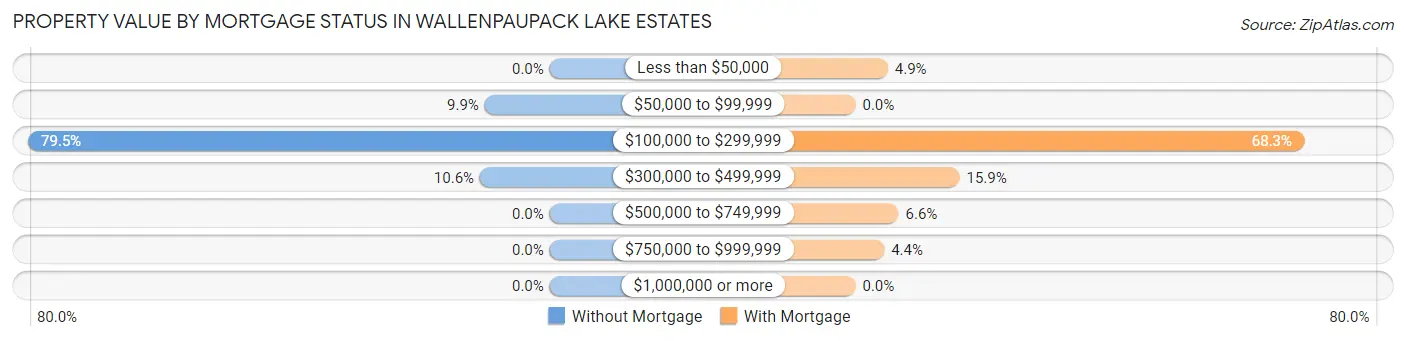
| Property Value | Without Mortgage | With Mortgage |
| Less than $50,000 | 0 (0.0%) | 9 (4.9%) |
| $50,000 to $99,999 | 27 (9.9%) | 0 (0.0%) |
| $100,000 to $299,999 | 217 (79.5%) | 125 (68.3%) |
| $300,000 to $499,999 | 29 (10.6%) | 29 (15.9%) |
| $500,000 to $749,999 | 0 (0.0%) | 12 (6.6%) |
| $750,000 to $999,999 | 0 (0.0%) | 8 (4.4%) |
| $1,000,000 or more | 0 (0.0%) | 0 (0.0%) |
| Total | 273 (100.0%) | 183 (100.0%) |
Household Income by Mortgage Status in Wallenpaupack Lake Estates
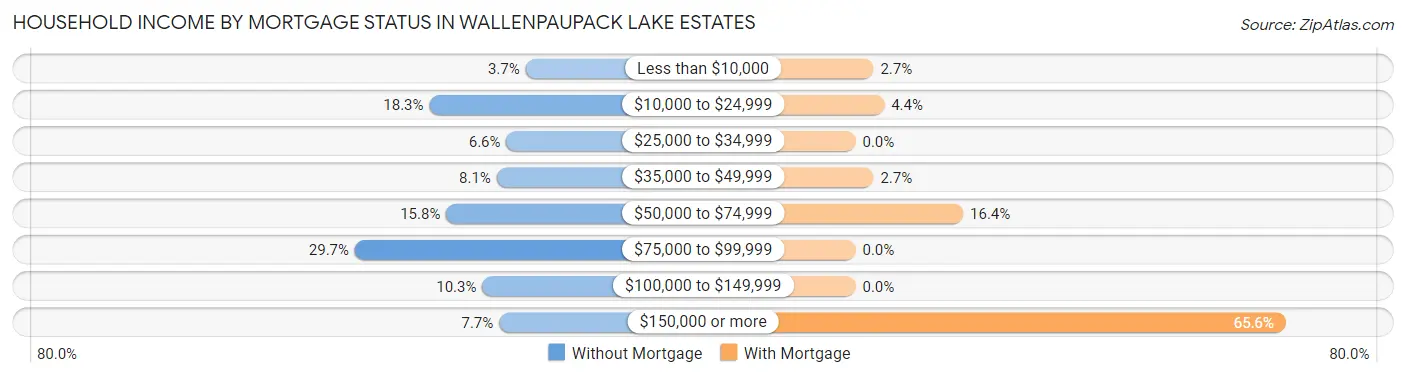
| Household Income | Without Mortgage | With Mortgage |
| Less than $10,000 | 10 (3.7%) | 5 (2.7%) |
| $10,000 to $24,999 | 50 (18.3%) | 8 (4.4%) |
| $25,000 to $34,999 | 18 (6.6%) | 0 (0.0%) |
| $35,000 to $49,999 | 22 (8.1%) | 5 (2.7%) |
| $50,000 to $74,999 | 43 (15.8%) | 30 (16.4%) |
| $75,000 to $99,999 | 81 (29.7%) | 0 (0.0%) |
| $100,000 to $149,999 | 28 (10.3%) | 0 (0.0%) |
| $150,000 or more | 21 (7.7%) | 120 (65.6%) |
| Total | 273 (100.0%) | 183 (100.0%) |
Property Value to Household Income Ratio in Wallenpaupack Lake Estates
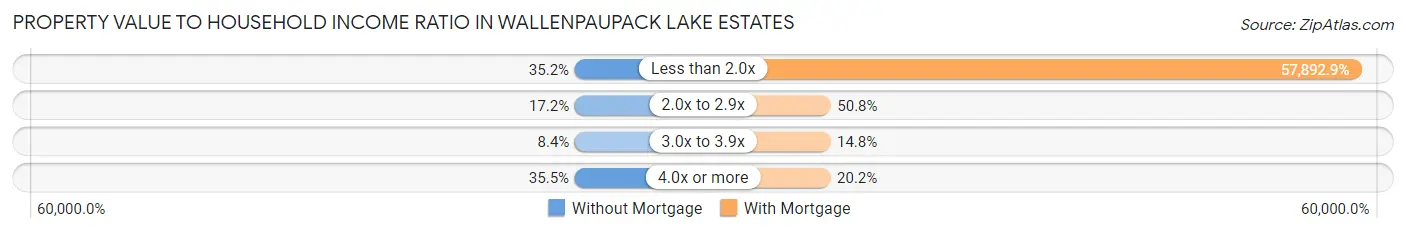
| Value-to-Income Ratio | Without Mortgage | With Mortgage |
| Less than 2.0x | 96 (35.2%) | 105,944 (57,892.9%) |
| 2.0x to 2.9x | 47 (17.2%) | 93 (50.8%) |
| 3.0x to 3.9x | 23 (8.4%) | 27 (14.7%) |
| 4.0x or more | 97 (35.5%) | 37 (20.2%) |
| Total | 273 (100.0%) | 183 (100.0%) |
Real Estate Taxes by Mortgage Status in Wallenpaupack Lake Estates
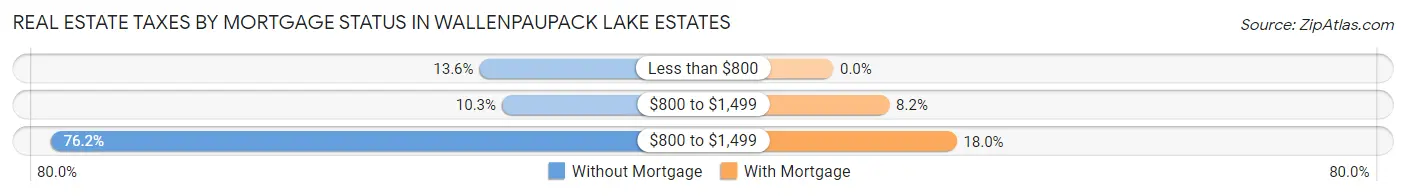
| Property Taxes | Without Mortgage | With Mortgage |
| Less than $800 | 37 (13.6%) | 0 (0.0%) |
| $800 to $1,499 | 28 (10.3%) | 15 (8.2%) |
| $800 to $1,499 | 208 (76.2%) | 33 (18.0%) |
| Total | 273 (100.0%) | 183 (100.0%) |
Health & Disability in Wallenpaupack Lake Estates
Health Insurance Coverage by Age in Wallenpaupack Lake Estates
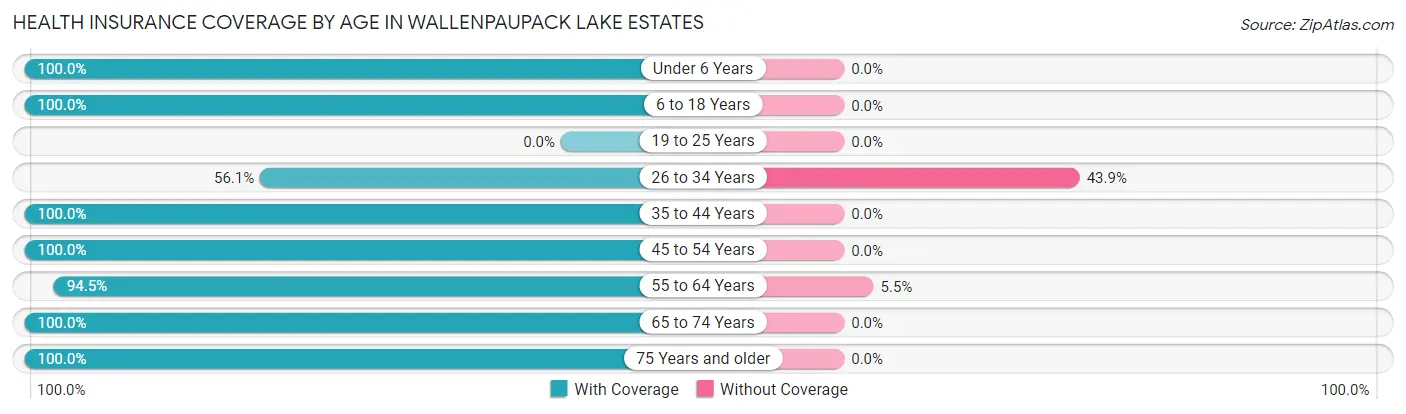
| Age Bracket | With Coverage | Without Coverage |
| Under 6 Years | 36 (100.0%) | 0 (0.0%) |
| 6 to 18 Years | 88 (100.0%) | 0 (0.0%) |
| 19 to 25 Years | 0 (0.0%) | 0 (0.0%) |
| 26 to 34 Years | 23 (56.1%) | 18 (43.9%) |
| 35 to 44 Years | 173 (100.0%) | 0 (0.0%) |
| 45 to 54 Years | 46 (100.0%) | 0 (0.0%) |
| 55 to 64 Years | 259 (94.5%) | 15 (5.5%) |
| 65 to 74 Years | 272 (100.0%) | 0 (0.0%) |
| 75 Years and older | 145 (100.0%) | 0 (0.0%) |
| Total | 1,042 (96.9%) | 33 (3.1%) |
Health Insurance Coverage by Citizenship Status in Wallenpaupack Lake Estates
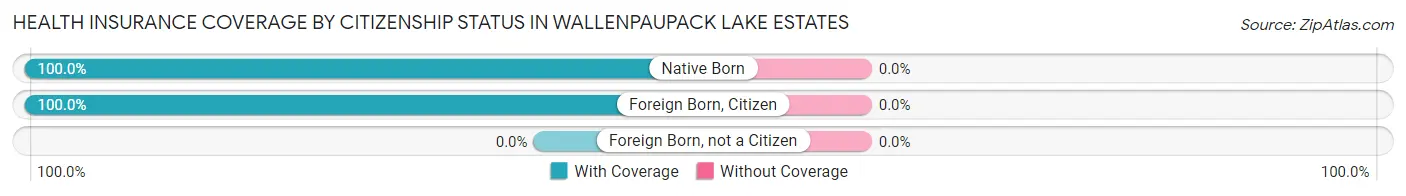
| Citizenship Status | With Coverage | Without Coverage |
| Native Born | 36 (100.0%) | 0 (0.0%) |
| Foreign Born, Citizen | 88 (100.0%) | 0 (0.0%) |
| Foreign Born, not a Citizen | 0 (0.0%) | 0 (0.0%) |
Health Insurance Coverage by Household Income in Wallenpaupack Lake Estates
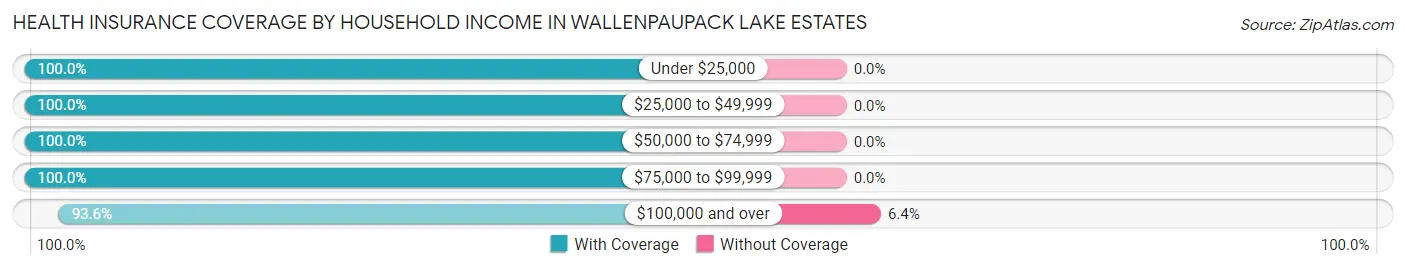
| Household Income | With Coverage | Without Coverage |
| Under $25,000 | 113 (100.0%) | 0 (0.0%) |
| $25,000 to $49,999 | 225 (100.0%) | 0 (0.0%) |
| $50,000 to $74,999 | 65 (100.0%) | 0 (0.0%) |
| $75,000 to $99,999 | 156 (100.0%) | 0 (0.0%) |
| $100,000 and over | 483 (93.6%) | 33 (6.4%) |
Public vs Private Health Insurance Coverage by Age in Wallenpaupack Lake Estates
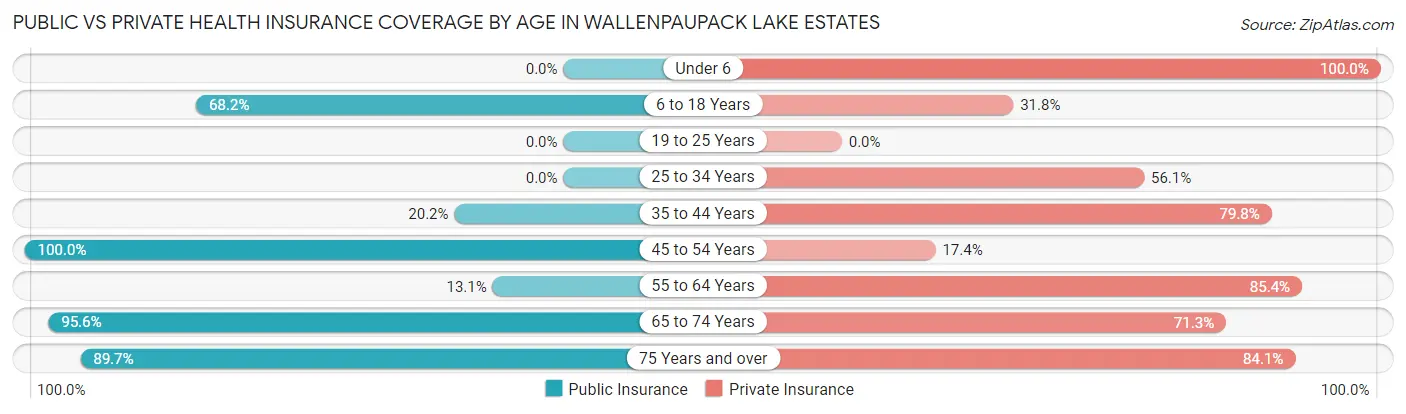
| Age Bracket | Public Insurance | Private Insurance |
| Under 6 | 0 (0.0%) | 36 (100.0%) |
| 6 to 18 Years | 60 (68.2%) | 28 (31.8%) |
| 19 to 25 Years | 0 (0.0%) | 0 (0.0%) |
| 25 to 34 Years | 0 (0.0%) | 23 (56.1%) |
| 35 to 44 Years | 35 (20.2%) | 138 (79.8%) |
| 45 to 54 Years | 46 (100.0%) | 8 (17.4%) |
| 55 to 64 Years | 36 (13.1%) | 234 (85.4%) |
| 65 to 74 Years | 260 (95.6%) | 194 (71.3%) |
| 75 Years and over | 130 (89.7%) | 122 (84.1%) |
| Total | 567 (52.7%) | 783 (72.8%) |
Disability Status by Sex by Age in Wallenpaupack Lake Estates
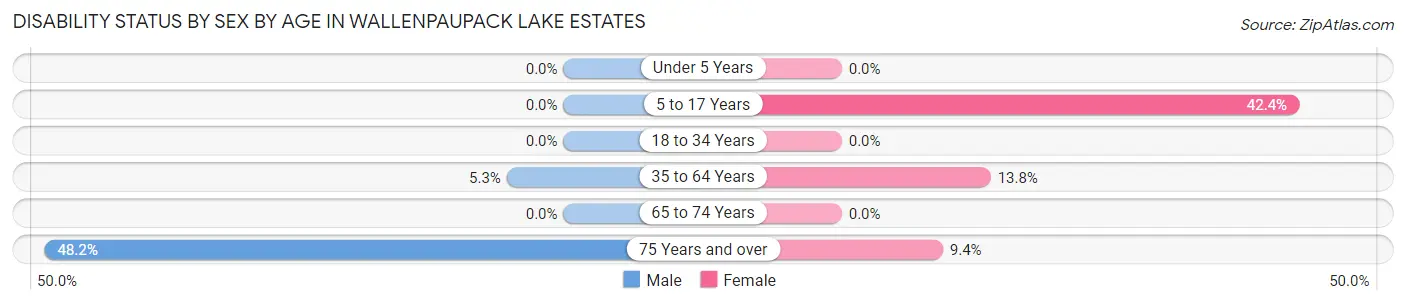
| Age Bracket | Male | Female |
| Under 5 Years | 0 (0.0%) | 0 (0.0%) |
| 5 to 17 Years | 0 (0.0%) | 14 (42.4%) |
| 18 to 34 Years | 0 (0.0%) | 0 (0.0%) |
| 35 to 64 Years | 13 (5.3%) | 34 (13.8%) |
| 65 to 74 Years | 0 (0.0%) | 0 (0.0%) |
| 75 Years and over | 39 (48.1%) | 6 (9.4%) |
Disability Class by Sex by Age in Wallenpaupack Lake Estates
Disability Class: Hearing Difficulty
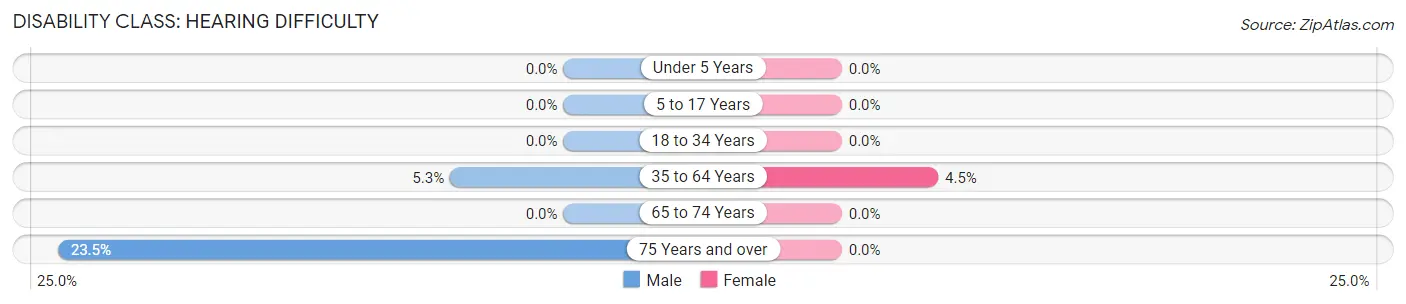
| Age Bracket | Male | Female |
| Under 5 Years | 0 (0.0%) | 0 (0.0%) |
| 5 to 17 Years | 0 (0.0%) | 0 (0.0%) |
| 18 to 34 Years | 0 (0.0%) | 0 (0.0%) |
| 35 to 64 Years | 13 (5.3%) | 11 (4.5%) |
| 65 to 74 Years | 0 (0.0%) | 0 (0.0%) |
| 75 Years and over | 19 (23.5%) | 0 (0.0%) |
Disability Class: Vision Difficulty
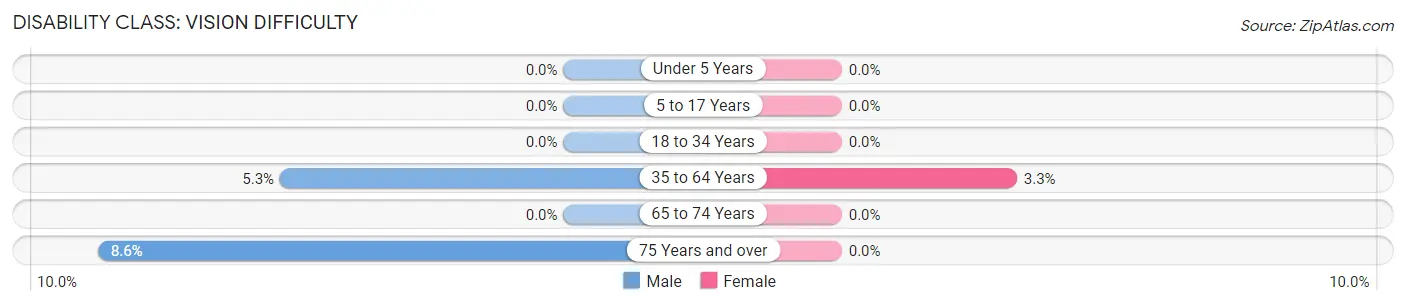
| Age Bracket | Male | Female |
| Under 5 Years | 0 (0.0%) | 0 (0.0%) |
| 5 to 17 Years | 0 (0.0%) | 0 (0.0%) |
| 18 to 34 Years | 0 (0.0%) | 0 (0.0%) |
| 35 to 64 Years | 13 (5.3%) | 8 (3.3%) |
| 65 to 74 Years | 0 (0.0%) | 0 (0.0%) |
| 75 Years and over | 7 (8.6%) | 0 (0.0%) |
Disability Class: Cognitive Difficulty
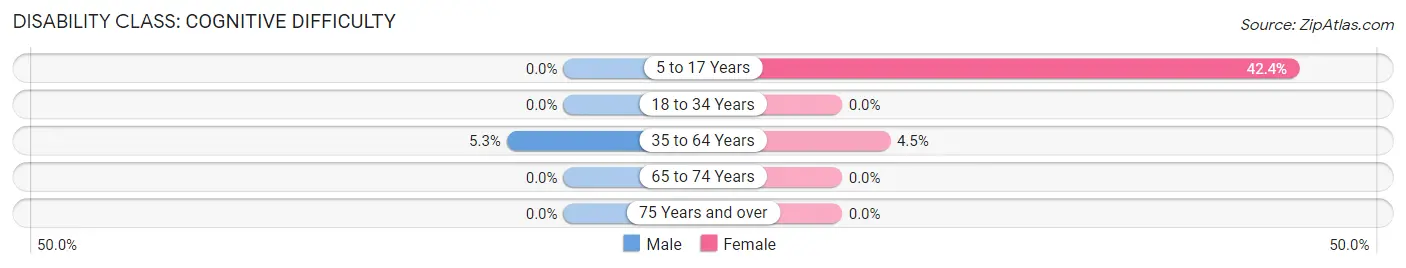
| Age Bracket | Male | Female |
| 5 to 17 Years | 0 (0.0%) | 14 (42.4%) |
| 18 to 34 Years | 0 (0.0%) | 0 (0.0%) |
| 35 to 64 Years | 13 (5.3%) | 11 (4.5%) |
| 65 to 74 Years | 0 (0.0%) | 0 (0.0%) |
| 75 Years and over | 0 (0.0%) | 0 (0.0%) |
Disability Class: Ambulatory Difficulty
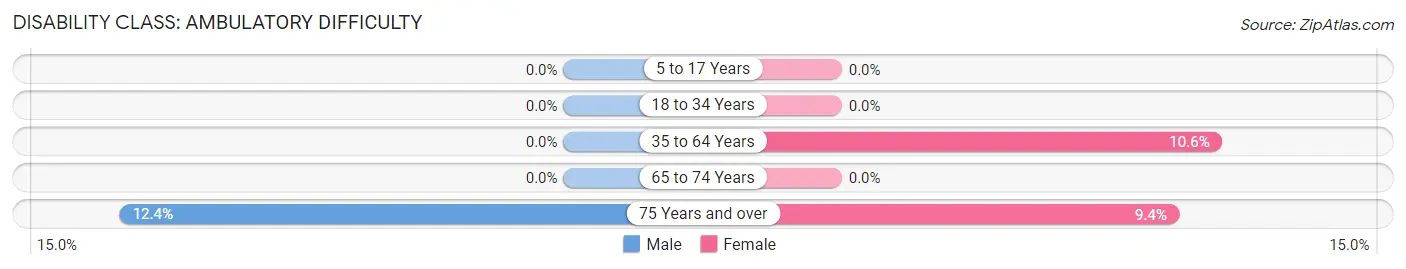
| Age Bracket | Male | Female |
| 5 to 17 Years | 0 (0.0%) | 0 (0.0%) |
| 18 to 34 Years | 0 (0.0%) | 0 (0.0%) |
| 35 to 64 Years | 0 (0.0%) | 26 (10.6%) |
| 65 to 74 Years | 0 (0.0%) | 0 (0.0%) |
| 75 Years and over | 10 (12.3%) | 6 (9.4%) |
Disability Class: Self-Care Difficulty
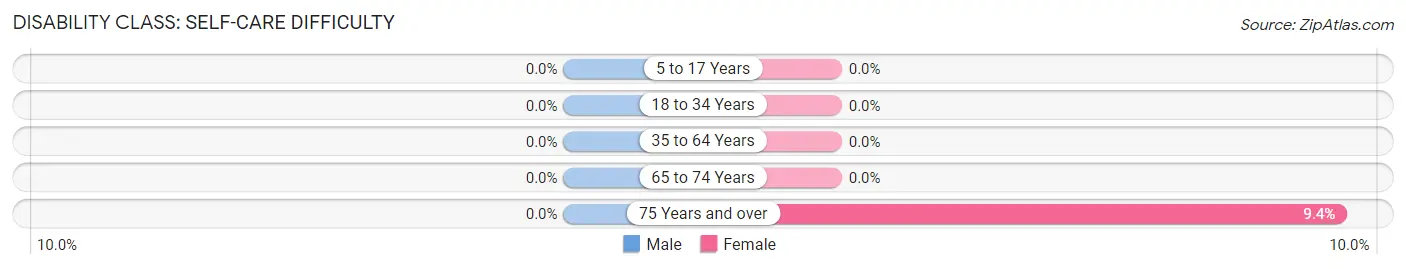
| Age Bracket | Male | Female |
| 5 to 17 Years | 0 (0.0%) | 0 (0.0%) |
| 18 to 34 Years | 0 (0.0%) | 0 (0.0%) |
| 35 to 64 Years | 0 (0.0%) | 0 (0.0%) |
| 65 to 74 Years | 0 (0.0%) | 0 (0.0%) |
| 75 Years and over | 0 (0.0%) | 6 (9.4%) |
Technology Access in Wallenpaupack Lake Estates
Computing Device Access in Wallenpaupack Lake Estates
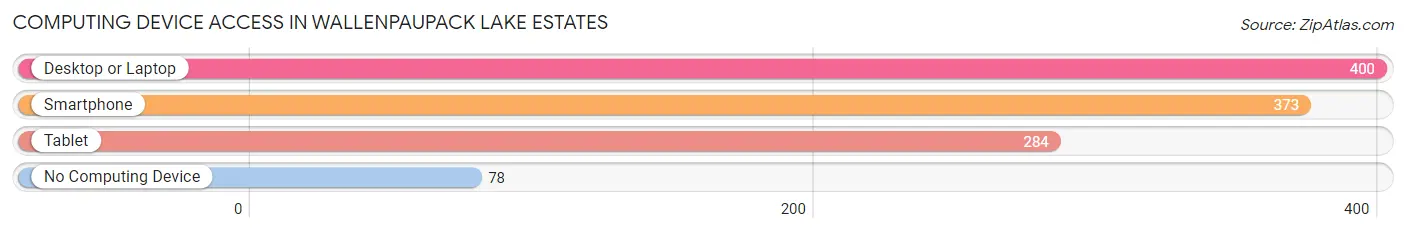
| Device Type | # Households | % Households |
| Desktop or Laptop | 400 | 79.0% |
| Smartphone | 373 | 73.7% |
| Tablet | 284 | 56.1% |
| No Computing Device | 78 | 15.4% |
| Total | 506 | 100.0% |
Internet Access in Wallenpaupack Lake Estates
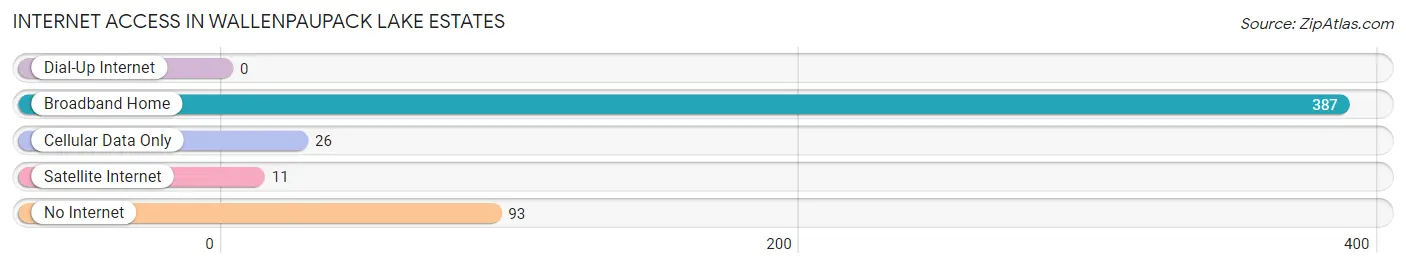
| Internet Type | # Households | % Households |
| Dial-Up Internet | 0 | 0.0% |
| Broadband Home | 387 | 76.5% |
| Cellular Data Only | 26 | 5.1% |
| Satellite Internet | 11 | 2.2% |
| No Internet | 93 | 18.4% |
| Total | 506 | 100.0% |
Wallenpaupack Lake Estates Summary
Wallenpaupack Lake Estates is a private residential community located in Pike County, Pennsylvania. It is situated on the shores of Lake Wallenpaupack, a 5,700-acre lake created by the damming of the Wallenpaupack River. The community is located in the Pocono Mountains, approximately 90 miles from New York City and Philadelphia.
History
Wallenpaupack Lake Estates was founded in the early 1950s by the Wallenpaupack Lake Estates Corporation. The corporation was formed by a group of investors who purchased the land from the Pennsylvania Power and Light Company. The company had acquired the land in the 1930s as part of its plan to build a hydroelectric dam on the Wallenpaupack River. The dam was completed in 1955, creating Lake Wallenpaupack.
The Wallenpaupack Lake Estates Corporation began developing the community in the late 1950s. The first homes were built in 1959, and the community was officially incorporated in 1961. The community was designed to be a private, gated residential community with a focus on recreational activities.
Geography
Wallenpaupack Lake Estates is located in the Pocono Mountains of northeastern Pennsylvania. The community is situated on the shores of Lake Wallenpaupack, a 5,700-acre lake created by the damming of the Wallenpaupack River. The lake is the largest man-made lake in Pennsylvania.
The community is located in Pike County, approximately 90 miles from New York City and Philadelphia. The nearest major city is Scranton, which is approximately 30 miles away.
Economy
Wallenpaupack Lake Estates is a private residential community, and the primary industry is real estate. The community is home to a variety of businesses, including restaurants, retail stores, and marinas. The community also has a golf course and a number of recreational activities, such as fishing, boating, and swimming.
Demographics
As of the 2010 census, the population of Wallenpaupack Lake Estates was 1,845. The median age was 57.7 years, and the median household income was $63,750. The racial makeup of the community was 94.3% White, 1.2% African American, 0.7% Asian, 0.2% Native American, and 3.6% other.
Conclusion
Wallenpaupack Lake Estates is a private residential community located in the Pocono Mountains of northeastern Pennsylvania. The community was founded in the 1950s and is situated on the shores of Lake Wallenpaupack. The primary industry is real estate, and the community is home to a variety of businesses, including restaurants, retail stores, and marinas. As of the 2010 census, the population of Wallenpaupack Lake Estates was 1,845.
Common Questions
What is Per Capita Income in Wallenpaupack Lake Estates?
Per Capita income in Wallenpaupack Lake Estates is $40,788.
What is the Median Family Income in Wallenpaupack Lake Estates?
Median Family Income in Wallenpaupack Lake Estates is $92,449.
What is the Median Household income in Wallenpaupack Lake Estates?
Median Household Income in Wallenpaupack Lake Estates is $90,408.
What is Income or Wage Gap in Wallenpaupack Lake Estates?
Income or Wage Gap in Wallenpaupack Lake Estates is 14.3%.
Women in Wallenpaupack Lake Estates earn 85.7 cents for every dollar earned by a man.
What is Family Income Deficit in Wallenpaupack Lake Estates?
Family Income Deficit in Wallenpaupack Lake Estates is $16,696.
Families that are below poverty line in Wallenpaupack Lake Estates earn $16,696 less on average than the poverty threshold level.
What is Inequality or Gini Index in Wallenpaupack Lake Estates?
Inequality or Gini Index in Wallenpaupack Lake Estates is 0.37.
What is the Total Population of Wallenpaupack Lake Estates?
Total Population of Wallenpaupack Lake Estates is 1,075.
What is the Total Male Population of Wallenpaupack Lake Estates?
Total Male Population of Wallenpaupack Lake Estates is 542.
What is the Total Female Population of Wallenpaupack Lake Estates?
Total Female Population of Wallenpaupack Lake Estates is 533.
What is the Ratio of Males per 100 Females in Wallenpaupack Lake Estates?
There are 101.69 Males per 100 Females in Wallenpaupack Lake Estates.
What is the Ratio of Females per 100 Males in Wallenpaupack Lake Estates?
There are 98.34 Females per 100 Males in Wallenpaupack Lake Estates.
What is the Median Population Age in Wallenpaupack Lake Estates?
Median Population Age in Wallenpaupack Lake Estates is 63.1 Years.
What is the Average Family Size in Wallenpaupack Lake Estates
Average Family Size in Wallenpaupack Lake Estates is 2.4 People.
What is the Average Household Size in Wallenpaupack Lake Estates
Average Household Size in Wallenpaupack Lake Estates is 2.1 People.
How Large is the Labor Force in Wallenpaupack Lake Estates?
There are 459 People in the Labor Forcein in Wallenpaupack Lake Estates.
What is the Percentage of People in the Labor Force in Wallenpaupack Lake Estates?
47.9% of People are in the Labor Force in Wallenpaupack Lake Estates.
What is the Unemployment Rate in Wallenpaupack Lake Estates?
Unemployment Rate in Wallenpaupack Lake Estates is 8.1%.