Zip Codes with the Highest Percentage of Population with a Degree in Liberal Arts and History in Allentown, PA
RELATED REPORTS & OPTIONS
Liberal Arts and History
Allentown
Compare Zip Codes
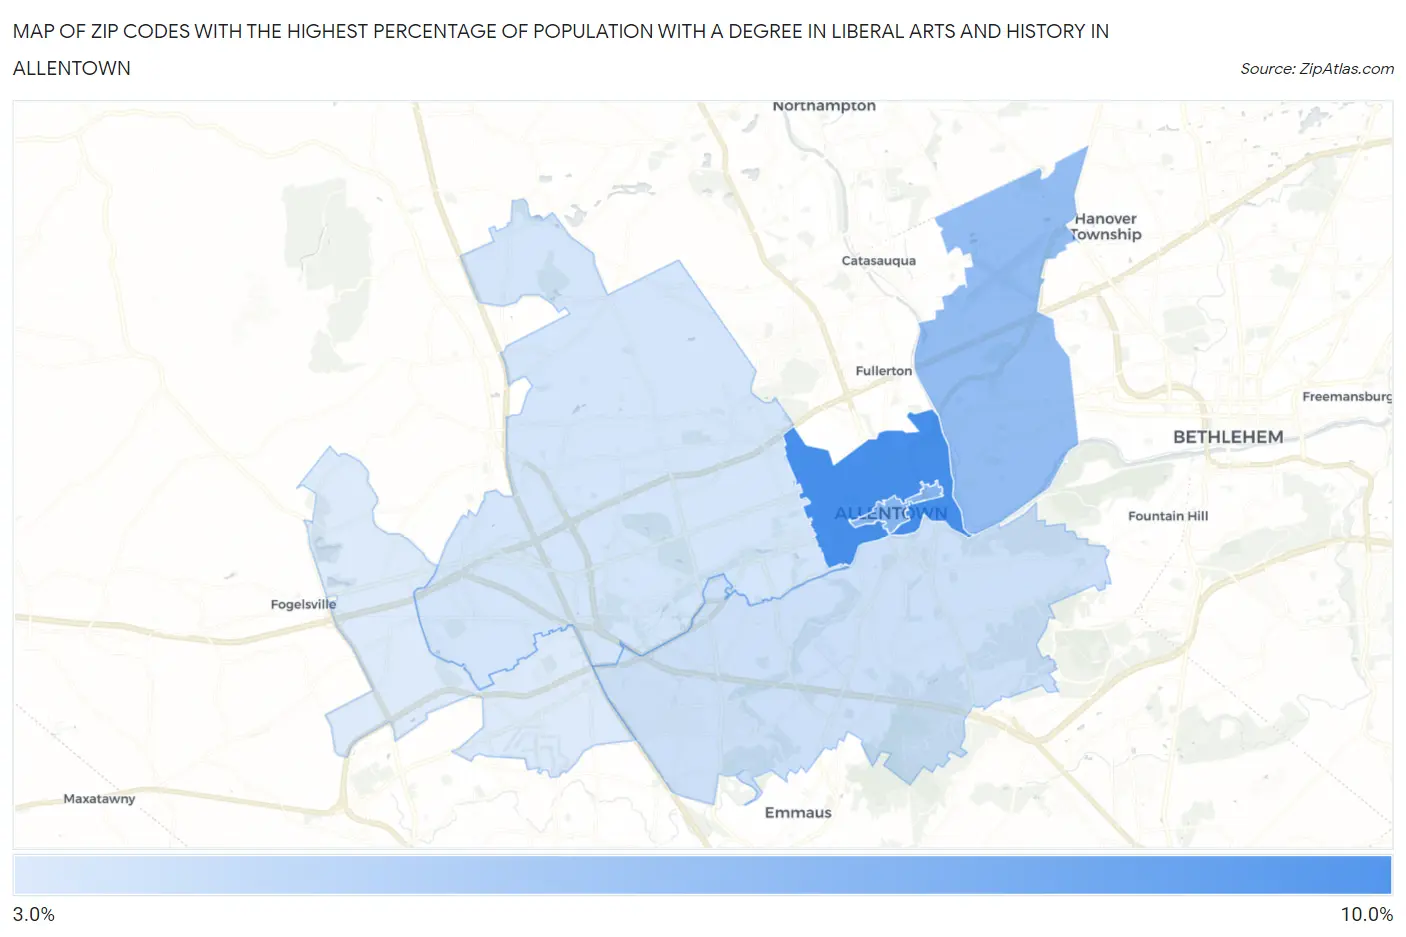
Map of Zip Codes with the Highest Percentage of Population with a Degree in Liberal Arts and History in Allentown
3.2%
8.5%
Zip Codes with the Highest Percentage of Population with a Degree in Liberal Arts and History in Allentown, PA
| Zip Code | % Graduates | vs State | vs National | |
| 1. | 18102 | 8.5% | 4.6%(+3.92)#214 | 4.9%(+3.66)#4,307 |
| 2. | 18101 | 6.2% | 4.6%(+1.60)#392 | 4.9%(+1.34)#7,998 |
| 3. | 18109 | 5.8% | 4.6%(+1.17)#453 | 4.9%(+0.910)#9,090 |
| 4. | 18103 | 3.8% | 4.6%(-0.805)#781 | 4.9%(-1.07)#15,506 |
| 5. | 18104 | 3.5% | 4.6%(-1.08)#822 | 4.9%(-1.34)#16,465 |
| 6. | 18106 | 3.2% | 4.6%(-1.40)#884 | 4.9%(-1.66)#17,619 |
1
Common Questions
What are the Top 5 Zip Codes with the Highest Percentage of Population with a Degree in Liberal Arts and History in Allentown, PA?
Top 5 Zip Codes with the Highest Percentage of Population with a Degree in Liberal Arts and History in Allentown, PA are:
What zip code has the Highest Percentage of Population with a Degree in Liberal Arts and History in Allentown, PA?
18102 has the Highest Percentage of Population with a Degree in Liberal Arts and History in Allentown, PA with 8.5%.
What is the Percentage of Population with a Degree in Liberal Arts and History in Allentown, PA?
Percentage of Population with a Degree in Liberal Arts and History in Allentown is 5.1%.
What is the Percentage of Population with a Degree in Liberal Arts and History in Pennsylvania?
Percentage of Population with a Degree in Liberal Arts and History in Pennsylvania is 4.6%.
What is the Percentage of Population with a Degree in Liberal Arts and History in the United States?
Percentage of Population with a Degree in Liberal Arts and History in the United States is 4.9%.