East Salem, PA Map & Demographics
East Salem Map
East Salem Overview
$25,072
PER CAPITA INCOME
$73,750
AVG FAMILY INCOME
$65,357
AVG HOUSEHOLD INCOME
4.9%
WAGE / INCOME GAP [ % ]
95.1¢/ $1
WAGE / INCOME GAP [ $ ]
0.27
INEQUALITY / GINI INDEX
141
TOTAL POPULATION
61
MALE POPULATION
80
FEMALE POPULATION
76.25
MALES / 100 FEMALES
131.15
FEMALES / 100 MALES
26.8
MEDIAN AGE
4.1
AVG FAMILY SIZE
2.8
AVG HOUSEHOLD SIZE
85
LABOR FORCE [ PEOPLE ]
88.5%
PERCENT IN LABOR FORCE
Income in East Salem
Income Overview in East Salem
Per Capita Income in East Salem is $25,072, while median incomes of families and households are $73,750 and $65,357 respectively.
| Characteristic | Number | Measure |
| Per Capita Income | 141 | $25,072 |
| Median Family Income | 22 | $73,750 |
| Mean Family Income | 22 | $80,432 |
| Median Household Income | 50 | $65,357 |
| Mean Household Income | 50 | $69,282 |
| Income Deficit | 22 | $0 |
| Wage / Income Gap (%) | 141 | 4.87% |
| Wage / Income Gap ($) | 141 | 95.13¢ per $1 |
| Gini / Inequality Index | 141 | 0.27 |
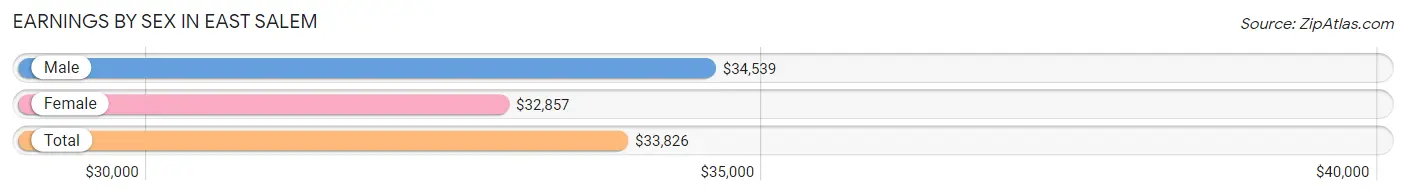
Earnings by Sex in East Salem
Average Earnings in East Salem are $33,826, $34,539 for men and $32,857 for women, a difference of 4.9%.
| Sex | Number | Average Earnings |
| Male | 47 (55.3%) | $34,539 |
| Female | 38 (44.7%) | $32,857 |
| Total | 85 (100.0%) | $33,826 |
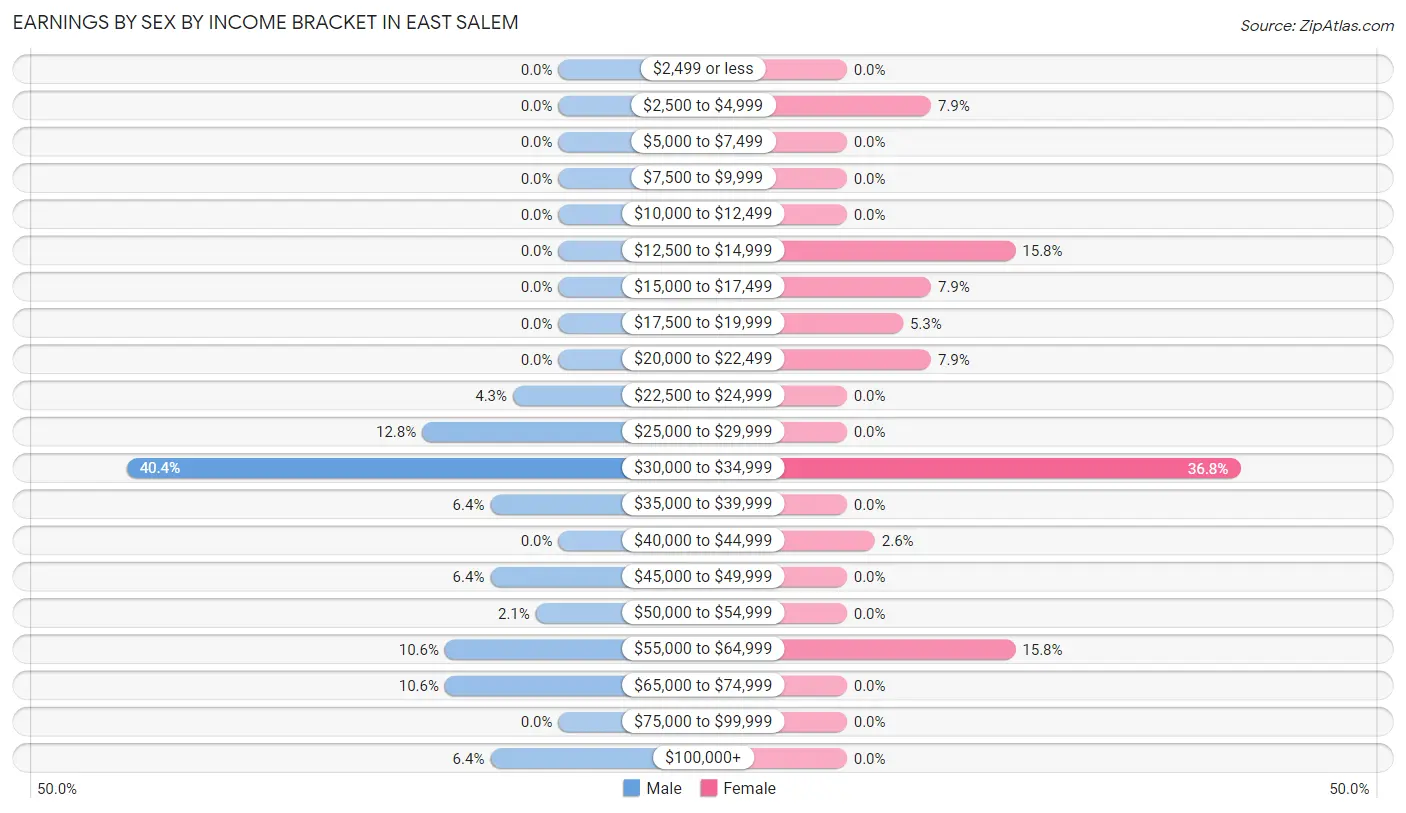
Earnings by Sex by Income Bracket in East Salem
The most common earnings brackets in East Salem are $30,000 to $34,999 for men (19 | 40.4%) and $30,000 to $34,999 for women (14 | 36.8%).
| Income | Male | Female |
| $2,499 or less | 0 (0.0%) | 0 (0.0%) |
| $2,500 to $4,999 | 0 (0.0%) | 3 (7.9%) |
| $5,000 to $7,499 | 0 (0.0%) | 0 (0.0%) |
| $7,500 to $9,999 | 0 (0.0%) | 0 (0.0%) |
| $10,000 to $12,499 | 0 (0.0%) | 0 (0.0%) |
| $12,500 to $14,999 | 0 (0.0%) | 6 (15.8%) |
| $15,000 to $17,499 | 0 (0.0%) | 3 (7.9%) |
| $17,500 to $19,999 | 0 (0.0%) | 2 (5.3%) |
| $20,000 to $22,499 | 0 (0.0%) | 3 (7.9%) |
| $22,500 to $24,999 | 2 (4.3%) | 0 (0.0%) |
| $25,000 to $29,999 | 6 (12.8%) | 0 (0.0%) |
| $30,000 to $34,999 | 19 (40.4%) | 14 (36.8%) |
| $35,000 to $39,999 | 3 (6.4%) | 0 (0.0%) |
| $40,000 to $44,999 | 0 (0.0%) | 1 (2.6%) |
| $45,000 to $49,999 | 3 (6.4%) | 0 (0.0%) |
| $50,000 to $54,999 | 1 (2.1%) | 0 (0.0%) |
| $55,000 to $64,999 | 5 (10.6%) | 6 (15.8%) |
| $65,000 to $74,999 | 5 (10.6%) | 0 (0.0%) |
| $75,000 to $99,999 | 0 (0.0%) | 0 (0.0%) |
| $100,000+ | 3 (6.4%) | 0 (0.0%) |
| Total | 47 (100.0%) | 38 (100.0%) |
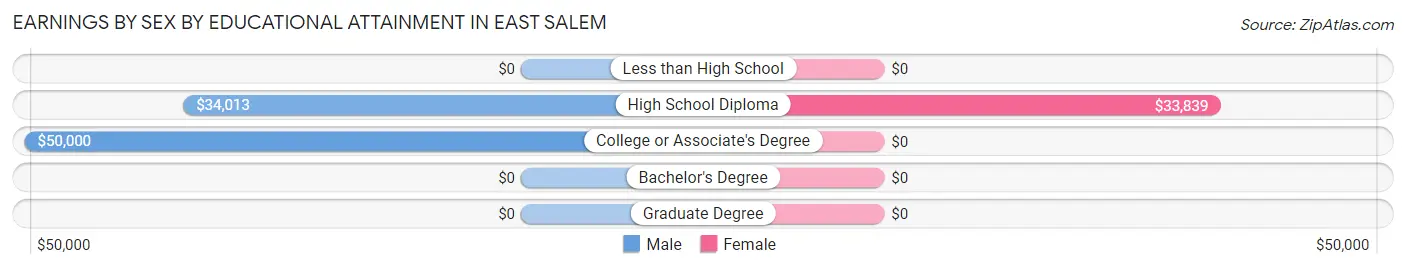
Earnings by Sex by Educational Attainment in East Salem
Average earnings in East Salem are $34,737 for men and $33,125 for women, a difference of 4.6%. Men with an educational attainment of college or associate's degree enjoy the highest average annual earnings of $50,000, while those with high school diploma education earn the least with $34,013. Women with an educational attainment of high school diploma earn the most with the average annual earnings of $33,839, while those with high school diploma education have the smallest earnings of $33,839.
| Educational Attainment | Male Income | Female Income |
| Less than High School | - | - |
| High School Diploma | $34,013 | $33,839 |
| College or Associate's Degree | $50,000 | $0 |
| Bachelor's Degree | - | - |
| Graduate Degree | - | - |
| Total | $34,737 | $33,125 |
Family Income in East Salem
Family Income Brackets in East Salem
According to the East Salem family income data, there are 7 families falling into the $75,000 to $99,999 income range, which is the most common income bracket and makes up 31.8% of all families.
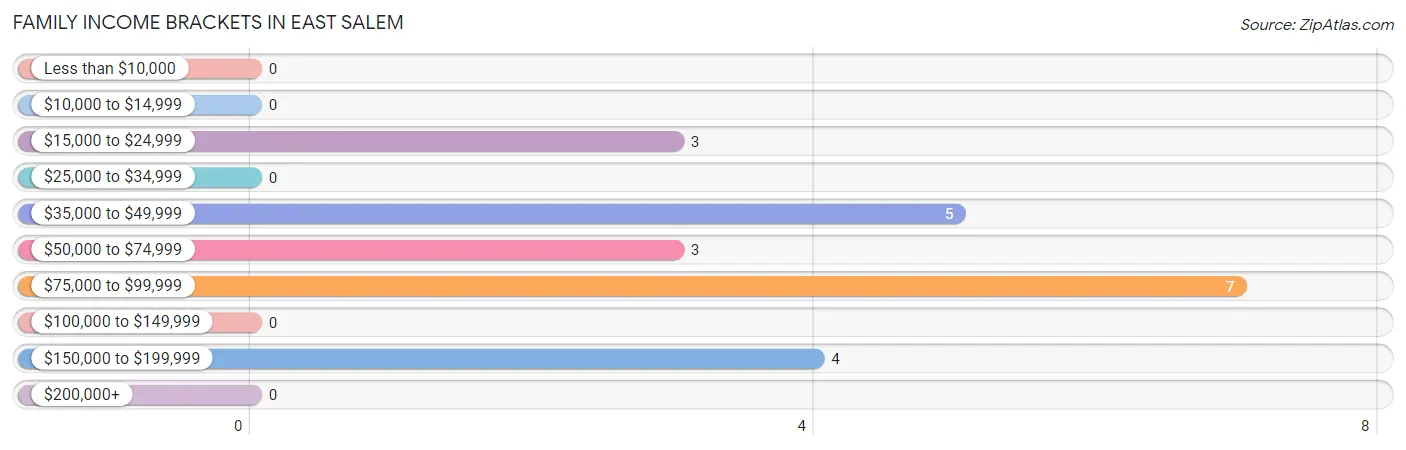
| Income Bracket | # Families | % Families |
| Less than $10,000 | 0 | 0.0% |
| $10,000 to $14,999 | 0 | 0.0% |
| $15,000 to $24,999 | 3 | 13.6% |
| $25,000 to $34,999 | 0 | 0.0% |
| $35,000 to $49,999 | 5 | 22.7% |
| $50,000 to $74,999 | 3 | 13.6% |
| $75,000 to $99,999 | 7 | 31.8% |
| $100,000 to $149,999 | 0 | 0.0% |
| $150,000 to $199,999 | 4 | 18.2% |
| $200,000+ | 0 | 0.0% |
Family Income by Famaliy Size in East Salem
5-person families (7 | 31.8%) account for the highest median family income in East Salem with $57,917 per family, while 5-person families (7 | 31.8%) have the highest median income of $11,583 per family member.
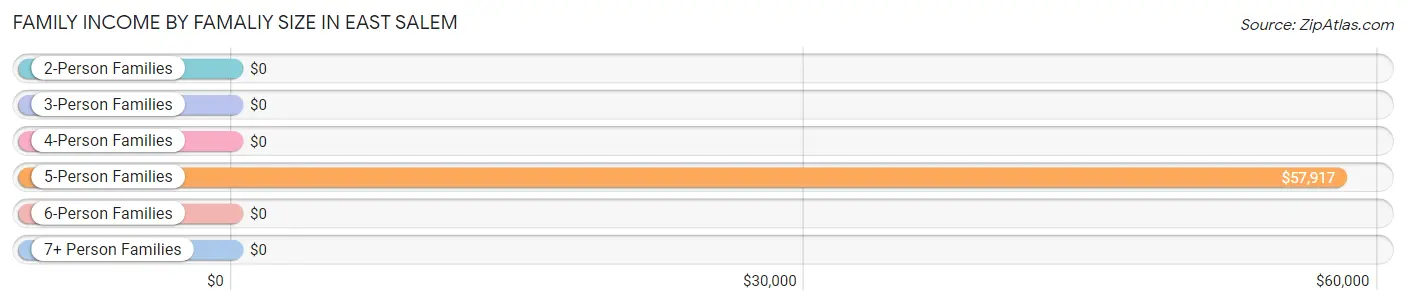
| Income Bracket | # Families | Median Income |
| 2-Person Families | 5 (22.7%) | $0 |
| 3-Person Families | 3 (13.6%) | $0 |
| 4-Person Families | 3 (13.6%) | $0 |
| 5-Person Families | 7 (31.8%) | $57,917 |
| 6-Person Families | 4 (18.2%) | $0 |
| 7+ Person Families | 0 (0.0%) | $0 |
| Total | 22 (100.0%) | $73,750 |
Family Income by Number of Earners in East Salem
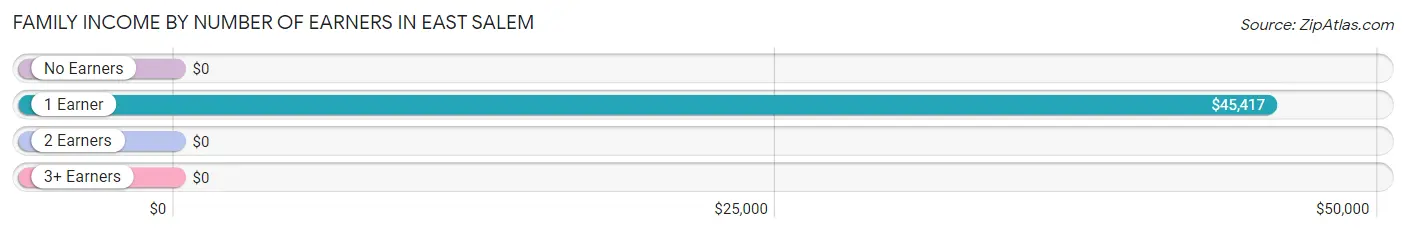
| Number of Earners | # Families | Median Income |
| No Earners | 0 (0.0%) | $0 |
| 1 Earner | 11 (50.0%) | $45,417 |
| 2 Earners | 10 (45.5%) | $0 |
| 3+ Earners | 1 (4.5%) | $0 |
| Total | 22 (100.0%) | $73,750 |
Household Income in East Salem
Household Income Brackets in East Salem
With 21 households falling in the category, the $50,000 to $74,999 income range is the most frequent in East Salem, accounting for 42.0% of all households.
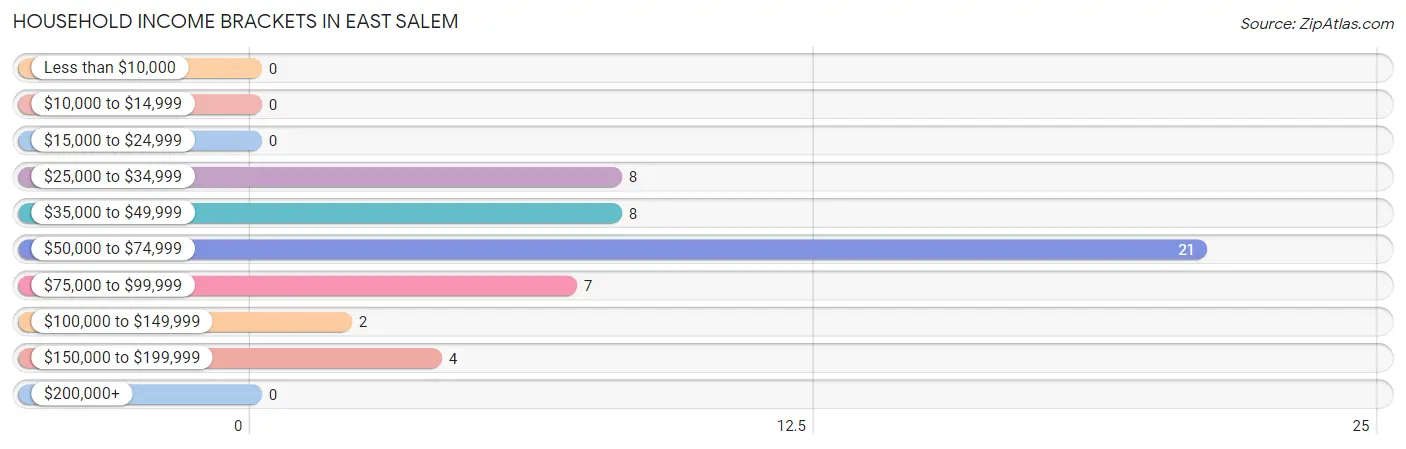
| Income Bracket | # Households | % Households |
| Less than $10,000 | 0 | 0.0% |
| $10,000 to $14,999 | 0 | 0.0% |
| $15,000 to $24,999 | 0 | 0.0% |
| $25,000 to $34,999 | 8 | 16.0% |
| $35,000 to $49,999 | 8 | 16.0% |
| $50,000 to $74,999 | 21 | 42.0% |
| $75,000 to $99,999 | 7 | 14.0% |
| $100,000 to $149,999 | 2 | 4.0% |
| $150,000 to $199,999 | 4 | 8.0% |
| $200,000+ | 0 | 0.0% |
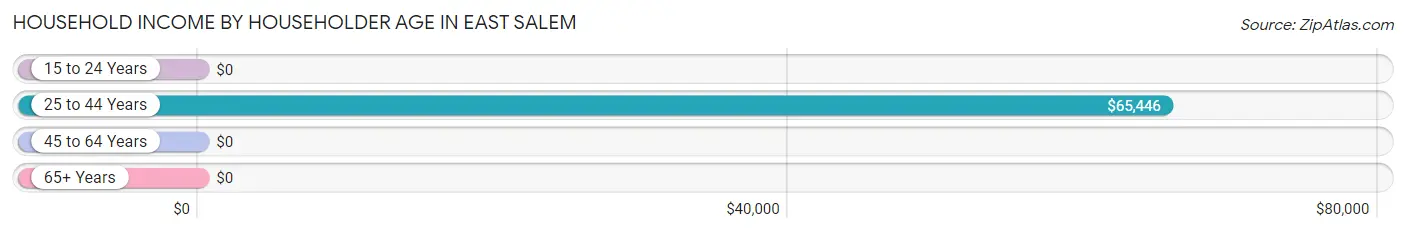
Household Income by Householder Age in East Salem
The median household income in East Salem is $65,357, with the highest median household income of $65,446 found in the 25 to 44 years age bracket for the primary householder. A total of 35 households (70.0%) fall into this category. Meanwhile, the 15 to 24 years age bracket for the primary householder has the lowest median household income of $0, with 3 households (6.0%) in this group.
| Income Bracket | # Households | Median Income |
| 15 to 24 Years | 3 (6.0%) | $0 |
| 25 to 44 Years | 35 (70.0%) | $65,446 |
| 45 to 64 Years | 9 (18.0%) | $0 |
| 65+ Years | 3 (6.0%) | $0 |
| Total | 50 (100.0%) | $65,357 |
Poverty in East Salem
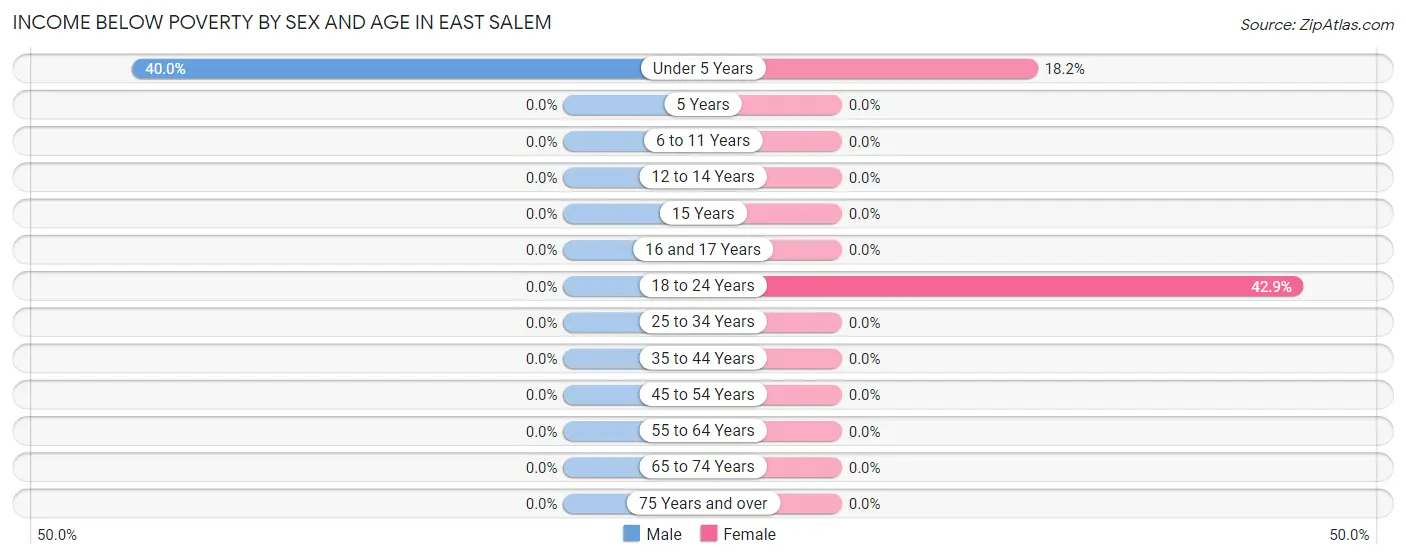
Income Below Poverty by Sex and Age in East Salem
With 3.3% poverty level for males and 6.2% for females among the residents of East Salem, under 5 year old males and 18 to 24 year old females are the most vulnerable to poverty, with 2 males (40.0%) and 3 females (42.9%) in their respective age groups living below the poverty level.
| Age Bracket | Male | Female |
| Under 5 Years | 2 (40.0%) | 2 (18.2%) |
| 5 Years | 0 (0.0%) | 0 (0.0%) |
| 6 to 11 Years | 0 (0.0%) | 0 (0.0%) |
| 12 to 14 Years | 0 (0.0%) | 0 (0.0%) |
| 15 Years | 0 (0.0%) | 0 (0.0%) |
| 16 and 17 Years | 0 (0.0%) | 0 (0.0%) |
| 18 to 24 Years | 0 (0.0%) | 3 (42.9%) |
| 25 to 34 Years | 0 (0.0%) | 0 (0.0%) |
| 35 to 44 Years | 0 (0.0%) | 0 (0.0%) |
| 45 to 54 Years | 0 (0.0%) | 0 (0.0%) |
| 55 to 64 Years | 0 (0.0%) | 0 (0.0%) |
| 65 to 74 Years | 0 (0.0%) | 0 (0.0%) |
| 75 Years and over | 0 (0.0%) | 0 (0.0%) |
| Total | 2 (3.3%) | 5 (6.2%) |
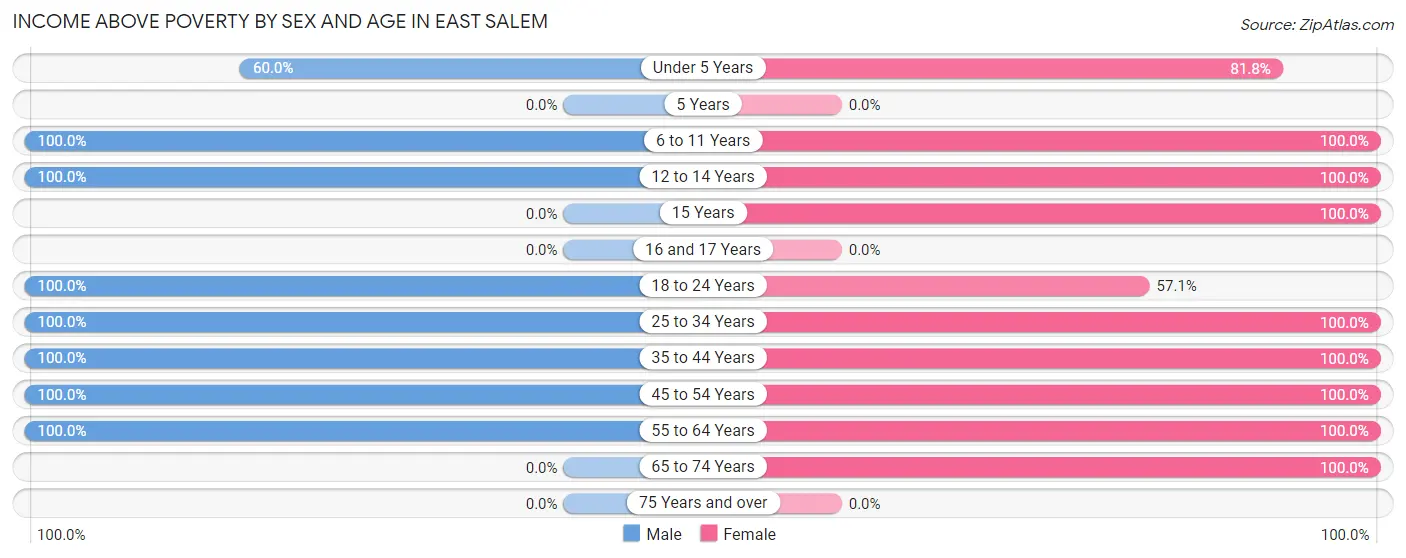
Income Above Poverty by Sex and Age in East Salem
According to the poverty statistics in East Salem, males aged 6 to 11 years and females aged 6 to 11 years are the age groups that are most secure financially, with 100.0% of males and 100.0% of females in these age groups living above the poverty line.
| Age Bracket | Male | Female |
| Under 5 Years | 3 (60.0%) | 9 (81.8%) |
| 5 Years | 0 (0.0%) | 0 (0.0%) |
| 6 to 11 Years | 7 (100.0%) | 10 (100.0%) |
| 12 to 14 Years | 2 (100.0%) | 3 (100.0%) |
| 15 Years | 0 (0.0%) | 7 (100.0%) |
| 16 and 17 Years | 0 (0.0%) | 0 (0.0%) |
| 18 to 24 Years | 3 (100.0%) | 4 (57.1%) |
| 25 to 34 Years | 21 (100.0%) | 18 (100.0%) |
| 35 to 44 Years | 15 (100.0%) | 10 (100.0%) |
| 45 to 54 Years | 5 (100.0%) | 6 (100.0%) |
| 55 to 64 Years | 3 (100.0%) | 5 (100.0%) |
| 65 to 74 Years | 0 (0.0%) | 3 (100.0%) |
| 75 Years and over | 0 (0.0%) | 0 (0.0%) |
| Total | 59 (96.7%) | 75 (93.8%) |
Income Below Poverty Among Married-Couple Families in East Salem

| Children | Above Poverty | Below Poverty |
| No Children | 6 (100.0%) | 0 (0.0%) |
| 1 or 2 Children | 3 (100.0%) | 0 (0.0%) |
| 3 or 4 Children | 10 (100.0%) | 0 (0.0%) |
| 5 or more Children | 0 (0.0%) | 0 (0.0%) |
| Total | 19 (100.0%) | 0 (0.0%) |
Income Below Poverty Among Single-Parent Households in East Salem
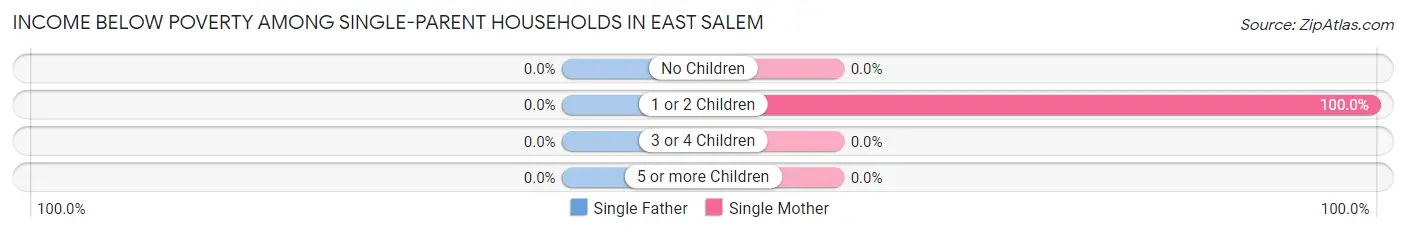
| Children | Single Father | Single Mother |
| No Children | 0 (0.0%) | 0 (0.0%) |
| 1 or 2 Children | 0 (0.0%) | 3 (100.0%) |
| 3 or 4 Children | 0 (0.0%) | 0 (0.0%) |
| 5 or more Children | 0 (0.0%) | 0 (0.0%) |
| Total | 0 (0.0%) | 3 (100.0%) |
Income Below Poverty Among Married-Couple vs Single-Parent Households in East Salem
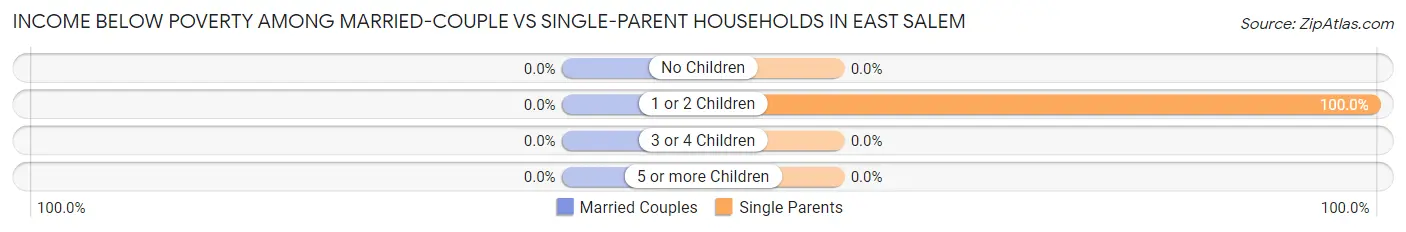
| Children | Married-Couple Families | Single-Parent Households |
| No Children | 0 (0.0%) | 0 (0.0%) |
| 1 or 2 Children | 0 (0.0%) | 3 (100.0%) |
| 3 or 4 Children | 0 (0.0%) | 0 (0.0%) |
| 5 or more Children | 0 (0.0%) | 0 (0.0%) |
| Total | 0 (0.0%) | 3 (100.0%) |
Race in East Salem
The most populous races in East Salem are White / Caucasian (117 | 83.0%), Two or more Races (24 | 17.0%), and Hispanic or Latino (19 | 13.5%).
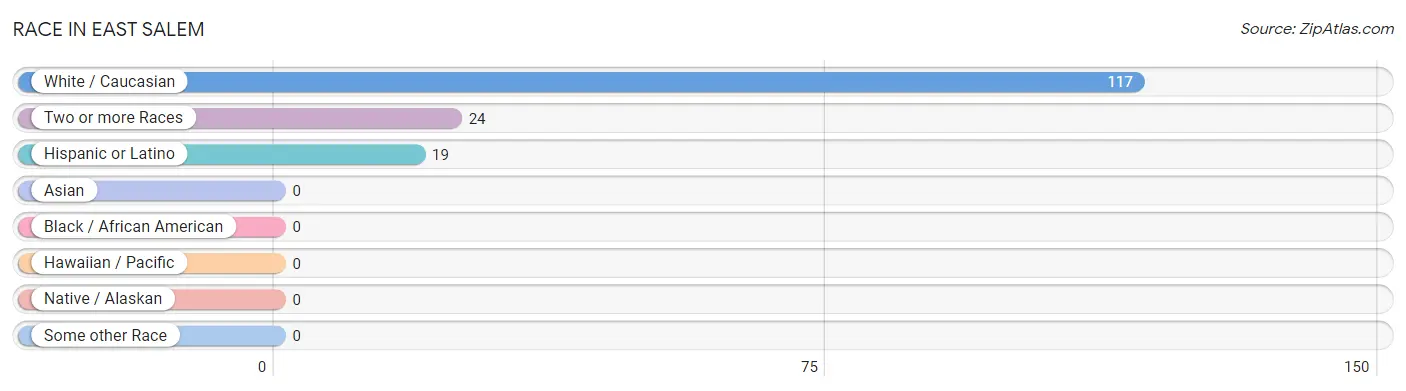
| Race | # Population | % Population |
| Asian | 0 | 0.0% |
| Black / African American | 0 | 0.0% |
| Hawaiian / Pacific | 0 | 0.0% |
| Hispanic or Latino | 19 | 13.5% |
| Native / Alaskan | 0 | 0.0% |
| White / Caucasian | 117 | 83.0% |
| Two or more Races | 24 | 17.0% |
| Some other Race | 0 | 0.0% |
| Total | 141 | 100.0% |
Ancestry in East Salem
The most populous ancestries reported in East Salem are German (52 | 36.9%), Central American (19 | 13.5%), Italian (19 | 13.5%), Salvadoran (19 | 13.5%), and Portuguese (14 | 9.9%), together accounting for 87.3% of all East Salem residents.
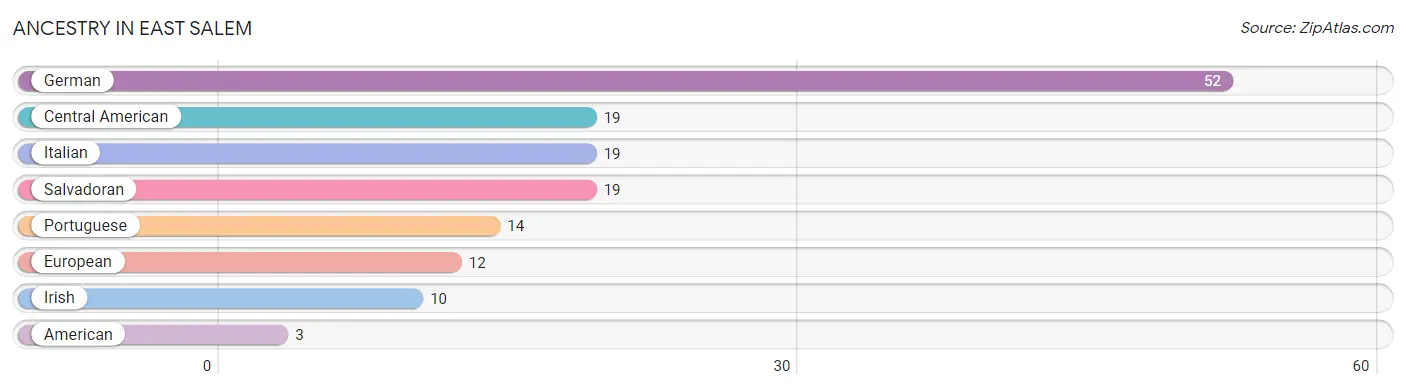
| Ancestry | # Population | % Population |
| American | 3 | 2.1% |
| Central American | 19 | 13.5% |
| European | 12 | 8.5% |
| German | 52 | 36.9% |
| Irish | 10 | 7.1% |
| Italian | 19 | 13.5% |
| Portuguese | 14 | 9.9% |
| Salvadoran | 19 | 13.5% | View All 8 Rows |
Immigrants in East Salem

| Immigration Origin | # Population | % Population | View All 0 Rows |
Sex and Age in East Salem
Sex and Age in East Salem
The most populous age groups in East Salem are 25 to 29 Years (21 | 34.4%) for men and 25 to 29 Years (14 | 17.5%) for women.
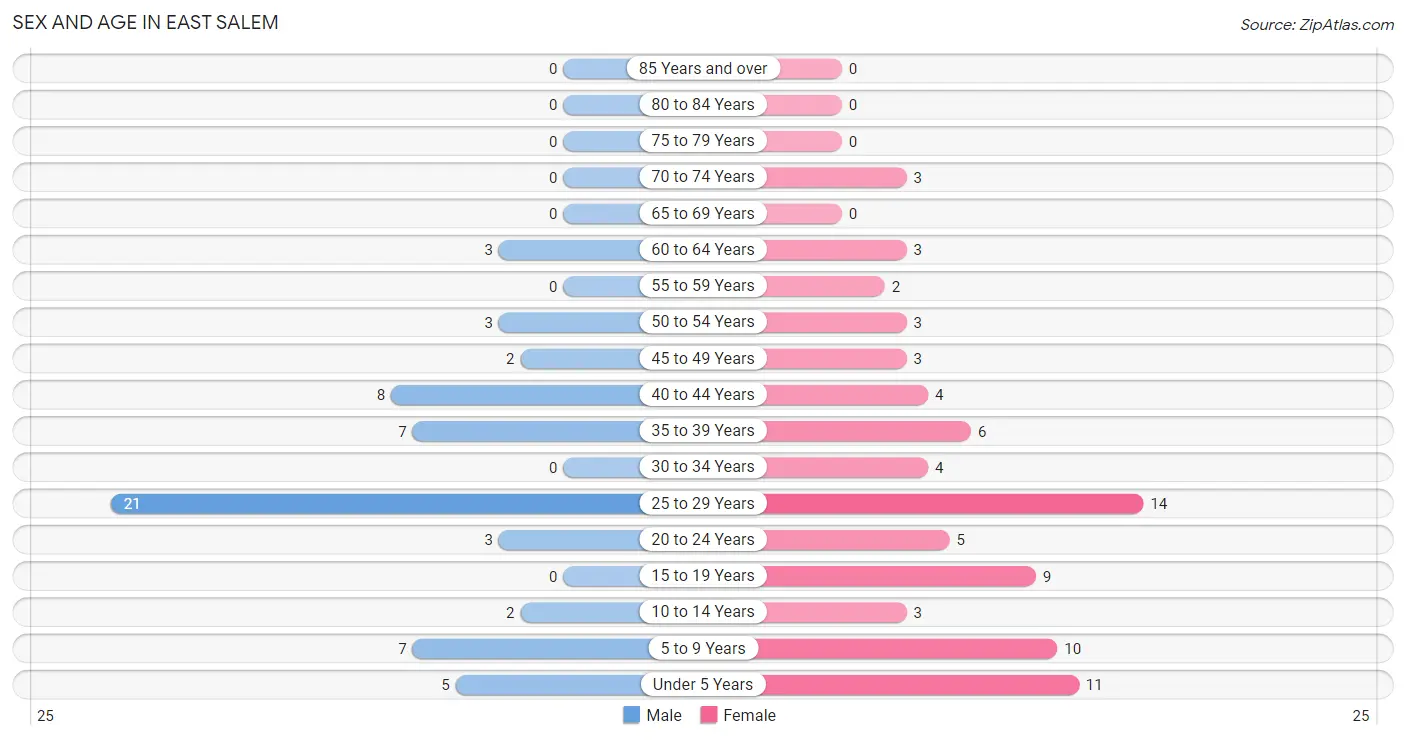
| Age Bracket | Male | Female |
| Under 5 Years | 5 (8.2%) | 11 (13.8%) |
| 5 to 9 Years | 7 (11.5%) | 10 (12.5%) |
| 10 to 14 Years | 2 (3.3%) | 3 (3.7%) |
| 15 to 19 Years | 0 (0.0%) | 9 (11.3%) |
| 20 to 24 Years | 3 (4.9%) | 5 (6.2%) |
| 25 to 29 Years | 21 (34.4%) | 14 (17.5%) |
| 30 to 34 Years | 0 (0.0%) | 4 (5.0%) |
| 35 to 39 Years | 7 (11.5%) | 6 (7.5%) |
| 40 to 44 Years | 8 (13.1%) | 4 (5.0%) |
| 45 to 49 Years | 2 (3.3%) | 3 (3.7%) |
| 50 to 54 Years | 3 (4.9%) | 3 (3.7%) |
| 55 to 59 Years | 0 (0.0%) | 2 (2.5%) |
| 60 to 64 Years | 3 (4.9%) | 3 (3.7%) |
| 65 to 69 Years | 0 (0.0%) | 0 (0.0%) |
| 70 to 74 Years | 0 (0.0%) | 3 (3.7%) |
| 75 to 79 Years | 0 (0.0%) | 0 (0.0%) |
| 80 to 84 Years | 0 (0.0%) | 0 (0.0%) |
| 85 Years and over | 0 (0.0%) | 0 (0.0%) |
| Total | 61 (100.0%) | 80 (100.0%) |
Families and Households in East Salem
Median Family Size in East Salem
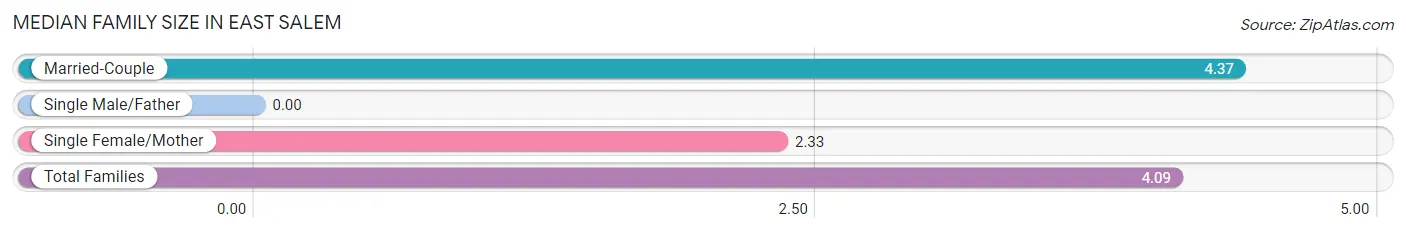
| Family Type | # Families | Family Size |
| Married-Couple | 19 (86.4%) | 4.37 |
| Single Male/Father | 0 (0.0%) | - |
| Single Female/Mother | 3 (13.6%) | 2.33 |
| Total Families | 22 (100.0%) | 4.09 |
Median Household Size in East Salem
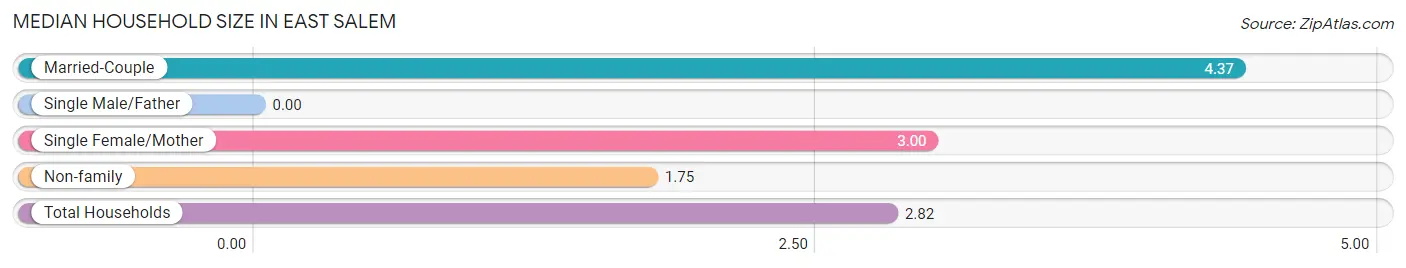
| Household Type | # Households | Household Size |
| Married-Couple | 19 (38.0%) | 4.37 |
| Single Male/Father | 0 (0.0%) | - |
| Single Female/Mother | 3 (6.0%) | 3.00 |
| Non-family | 28 (56.0%) | 1.75 |
| Total Households | 50 (100.0%) | 2.82 |
Household Size by Marriage Status in East Salem
Out of a total of 50 households in East Salem, 22 (44.0%) are family households, while 28 (56.0%) are nonfamily households. The most numerous type of family households are 5-person households, comprising 7, and the most common type of nonfamily households are 2-person households, comprising 16.
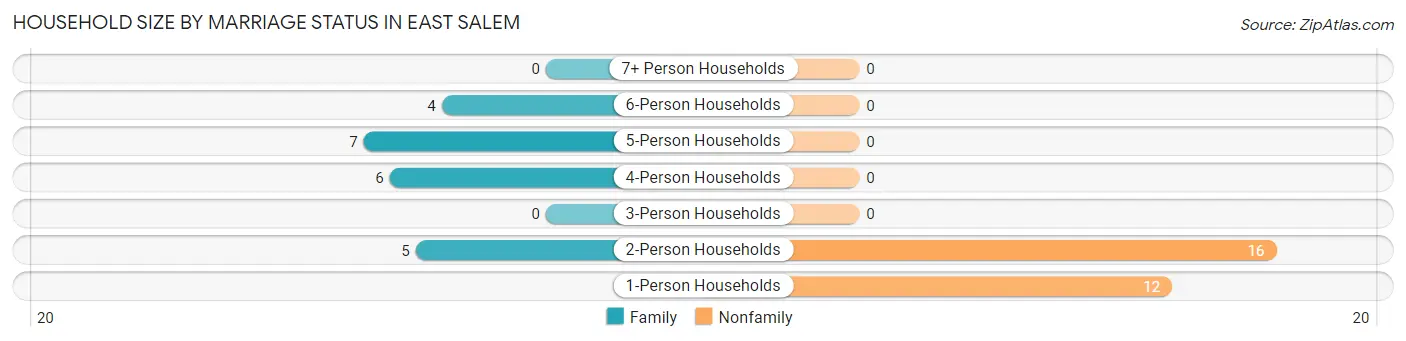
| Household Size | Family Households | Nonfamily Households |
| 1-Person Households | - | 12 (24.0%) |
| 2-Person Households | 5 (10.0%) | 16 (32.0%) |
| 3-Person Households | 0 (0.0%) | 0 (0.0%) |
| 4-Person Households | 6 (12.0%) | 0 (0.0%) |
| 5-Person Households | 7 (14.0%) | 0 (0.0%) |
| 6-Person Households | 4 (8.0%) | 0 (0.0%) |
| 7+ Person Households | 0 (0.0%) | 0 (0.0%) |
| Total | 22 (44.0%) | 28 (56.0%) |
Female Fertility in East Salem
Fertility by Age in East Salem
Average fertility rate in East Salem is 67.0 births per 1,000 women. Women in the age bracket of 20 to 34 years have the highest fertility rate with 130.0 births per 1,000 women. Women in the age bracket of 20 to 34 years acount for 100.0% of all women with births.
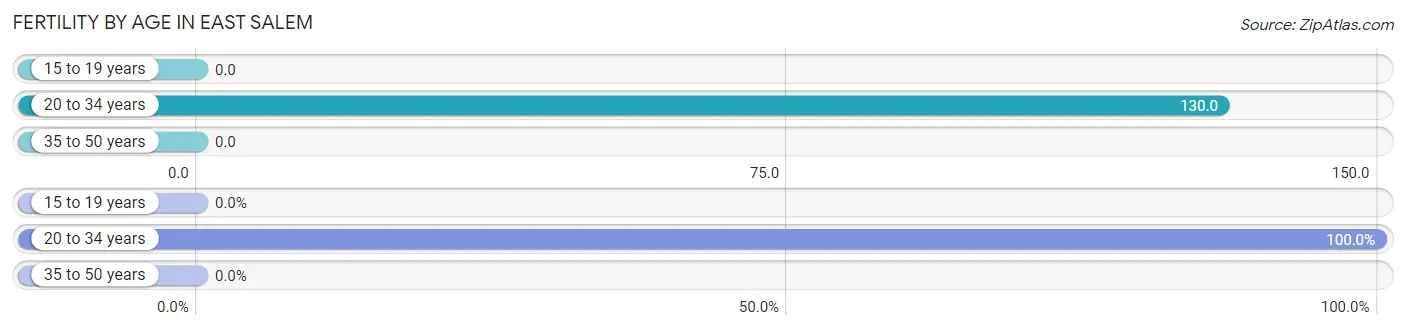
| Age Bracket | Women with Births | Births / 1,000 Women |
| 15 to 19 years | 0 (0.0%) | 0.0 |
| 20 to 34 years | 3 (100.0%) | 130.0 |
| 35 to 50 years | 0 (0.0%) | 0.0 |
| Total | 3 (100.0%) | 67.0 |
Fertility by Age by Marriage Status in East Salem
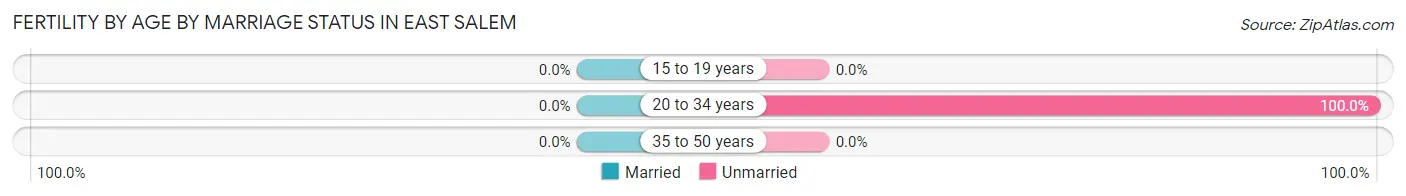
| Age Bracket | Married | Unmarried |
| 15 to 19 years | 0 (0.0%) | 0 (0.0%) |
| 20 to 34 years | 0 (0.0%) | 3 (100.0%) |
| 35 to 50 years | 0 (0.0%) | 0 (0.0%) |
| Total | 0 (0.0%) | 3 (100.0%) |
Fertility by Education in East Salem
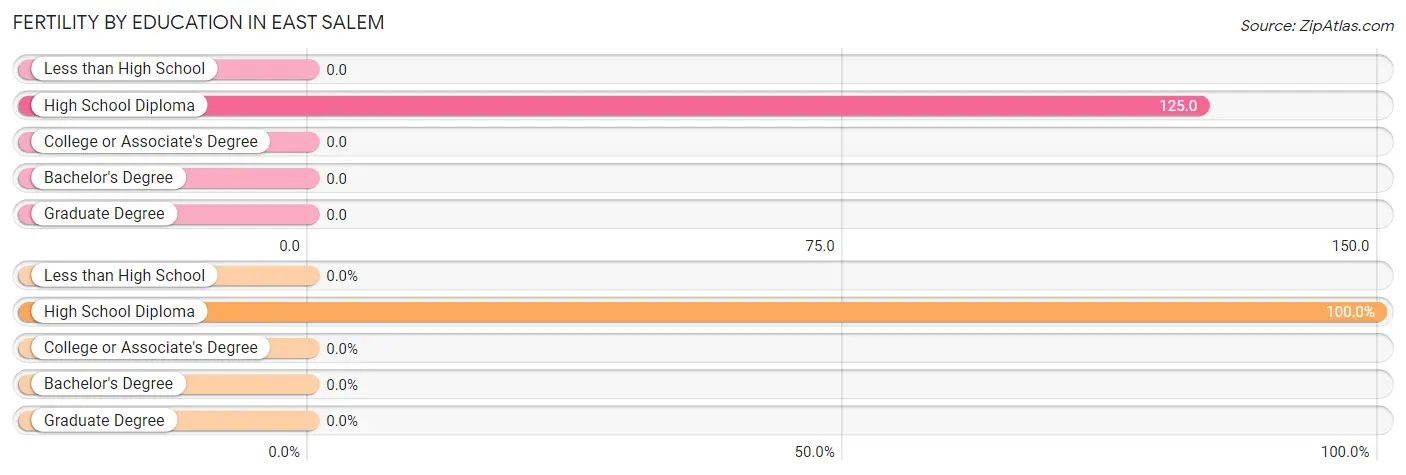
| Educational Attainment | Women with Births | Births / 1,000 Women |
| Less than High School | 0 (0.0%) | 0.0 |
| High School Diploma | 3 (100.0%) | 125.0 |
| College or Associate's Degree | 0 (0.0%) | 0.0 |
| Bachelor's Degree | 0 (0.0%) | 0.0 |
| Graduate Degree | 0 (0.0%) | 0.0 |
| Total | 3 (100.0%) | 67.0 |
Fertility by Education by Marriage Status in East Salem
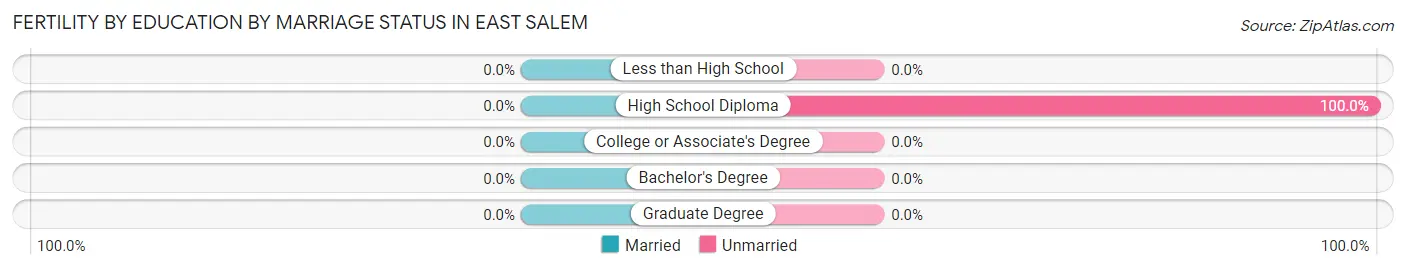
| Educational Attainment | Married | Unmarried |
| Less than High School | 0 (0.0%) | 0 (0.0%) |
| High School Diploma | 0 (0.0%) | 3 (100.0%) |
| College or Associate's Degree | 0 (0.0%) | 0 (0.0%) |
| Bachelor's Degree | 0 (0.0%) | 0 (0.0%) |
| Graduate Degree | 0 (0.0%) | 0 (0.0%) |
| Total | 0 (0.0%) | 3 (100.0%) |
Employment Characteristics in East Salem
Employment by Class of Employer in East Salem
Among the 82 employed individuals in East Salem, private company employees (69 | 84.2%), self-employed (not incorporated) (10 | 12.2%), and state government employees (3 | 3.7%) make up the most common classes of employment.
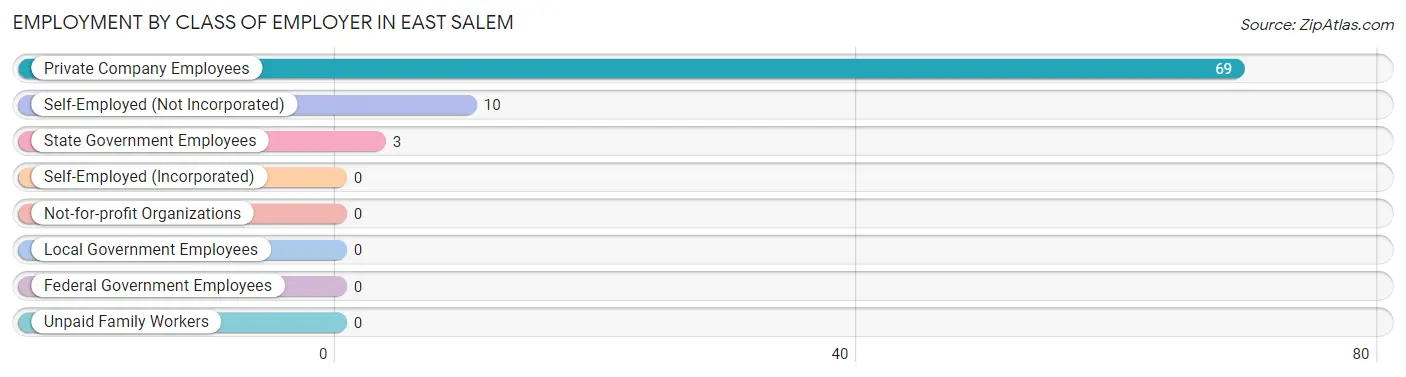
| Employer Class | # Employees | % Employees |
| Private Company Employees | 69 | 84.2% |
| Self-Employed (Incorporated) | 0 | 0.0% |
| Self-Employed (Not Incorporated) | 10 | 12.2% |
| Not-for-profit Organizations | 0 | 0.0% |
| Local Government Employees | 0 | 0.0% |
| State Government Employees | 3 | 3.7% |
| Federal Government Employees | 0 | 0.0% |
| Unpaid Family Workers | 0 | 0.0% |
| Total | 82 | 100.0% |
Employment Status by Age in East Salem
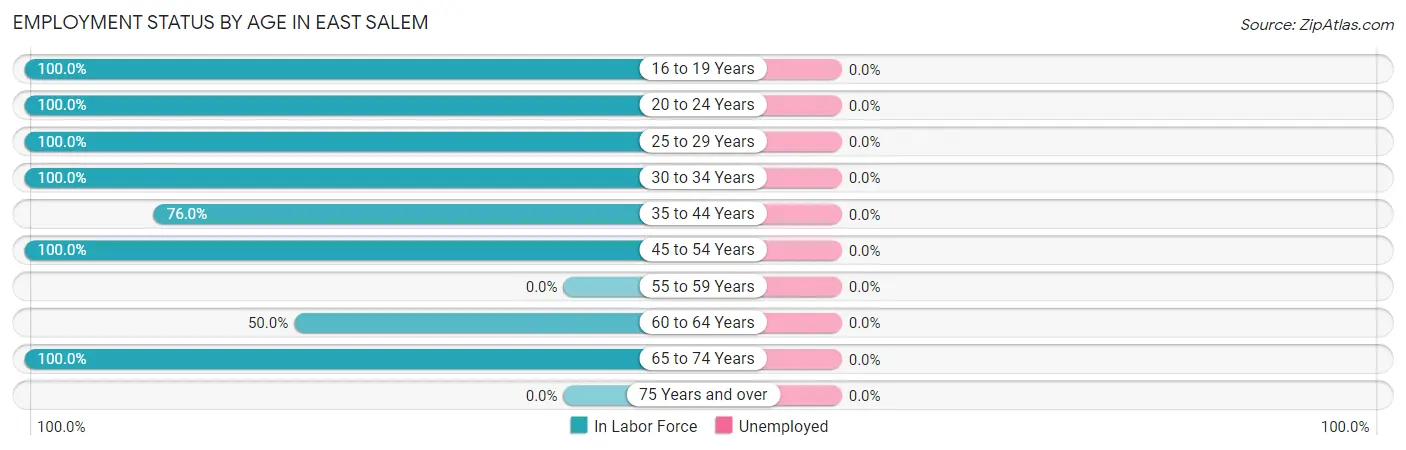
| Age Bracket | In Labor Force | Unemployed |
| 16 to 19 Years | 2 (100.0%) | 0 (0.0%) |
| 20 to 24 Years | 8 (100.0%) | 0 (0.0%) |
| 25 to 29 Years | 35 (100.0%) | 0 (0.0%) |
| 30 to 34 Years | 4 (100.0%) | 0 (0.0%) |
| 35 to 44 Years | 19 (76.0%) | 0 (0.0%) |
| 45 to 54 Years | 11 (100.0%) | 0 (0.0%) |
| 55 to 59 Years | 0 (0.0%) | 0 (0.0%) |
| 60 to 64 Years | 3 (50.0%) | 0 (0.0%) |
| 65 to 74 Years | 3 (100.0%) | 0 (0.0%) |
| 75 Years and over | 0 (0.0%) | 0 (0.0%) |
| Total | 85 (88.5%) | 0 (0.0%) |
Employment Status by Educational Attainment in East Salem
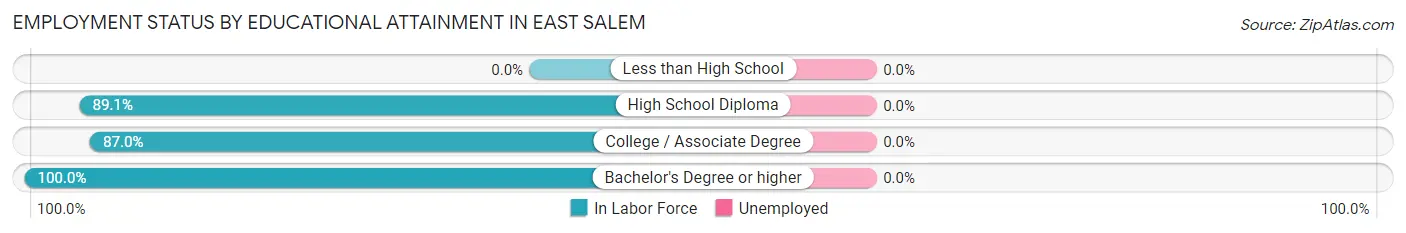
| Educational Attainment | In Labor Force | Unemployed |
| Less than High School | 0 (0.0%) | 0 (0.0%) |
| High School Diploma | 41 (89.1%) | 0 (0.0%) |
| College / Associate Degree | 20 (87.0%) | 0 (0.0%) |
| Bachelor's Degree or higher | 11 (100.0%) | 0 (0.0%) |
| Total | 72 (86.7%) | 0 (0.0%) |
Employment Occupations by Sex in East Salem
Management, Business, Science and Arts Occupations
The most common Management, Business, Science and Arts occupations in East Salem are Business & Financial (4 | 4.7%), Management (3 | 3.5%), Computers, Engineering & Science (3 | 3.5%), and Computers & Mathematics (3 | 3.5%).
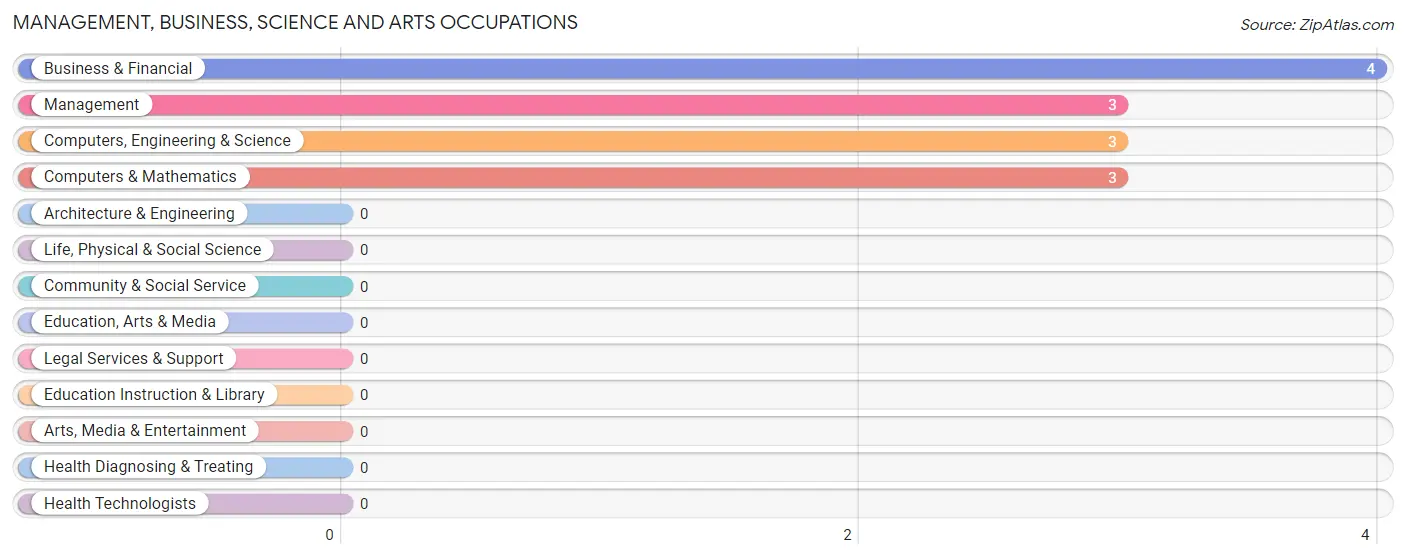
Management, Business, Science and Arts Occupations by Sex
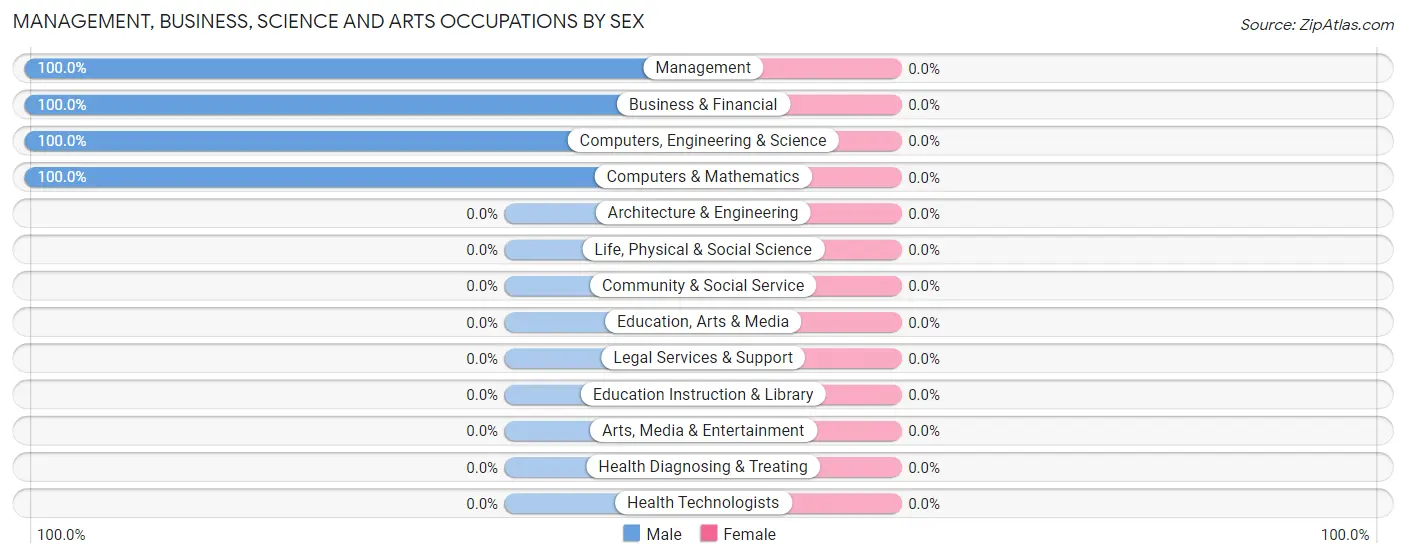
| Occupation | Male | Female |
| Management | 3 (100.0%) | 0 (0.0%) |
| Business & Financial | 4 (100.0%) | 0 (0.0%) |
| Computers, Engineering & Science | 3 (100.0%) | 0 (0.0%) |
| Computers & Mathematics | 3 (100.0%) | 0 (0.0%) |
| Architecture & Engineering | 0 (0.0%) | 0 (0.0%) |
| Life, Physical & Social Science | 0 (0.0%) | 0 (0.0%) |
| Community & Social Service | 0 (0.0%) | 0 (0.0%) |
| Education, Arts & Media | 0 (0.0%) | 0 (0.0%) |
| Legal Services & Support | 0 (0.0%) | 0 (0.0%) |
| Education Instruction & Library | 0 (0.0%) | 0 (0.0%) |
| Arts, Media & Entertainment | 0 (0.0%) | 0 (0.0%) |
| Health Diagnosing & Treating | 0 (0.0%) | 0 (0.0%) |
| Health Technologists | 0 (0.0%) | 0 (0.0%) |
| Total (Category) | 10 (100.0%) | 0 (0.0%) |
| Total (Overall) | 47 (55.3%) | 38 (44.7%) |
Services Occupations
The most common Services occupations in East Salem are Personal Care & Service (12 | 14.1%), and Healthcare Support (7 | 8.2%).
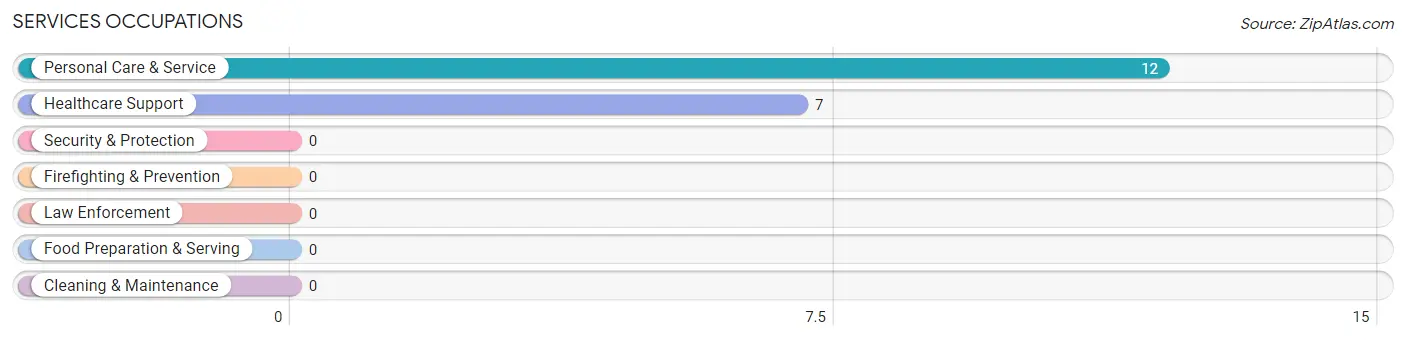
Services Occupations by Sex
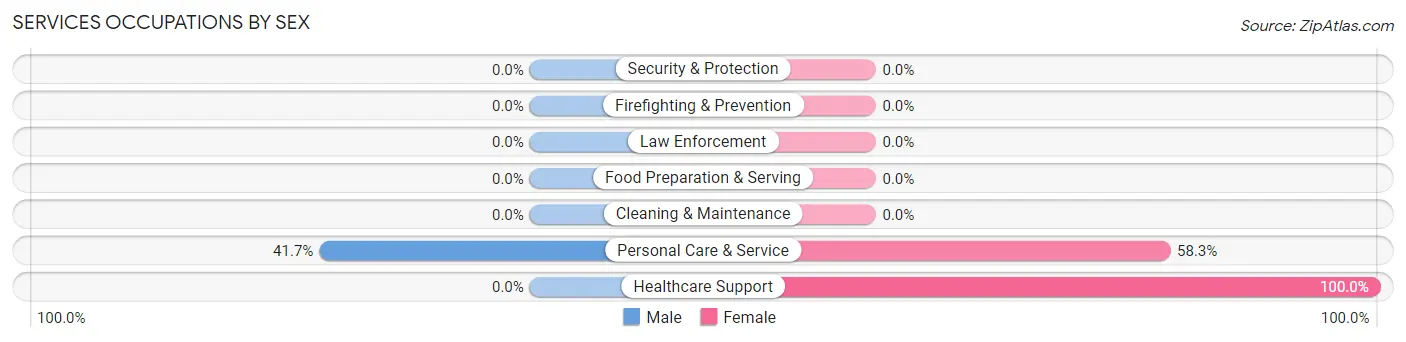
| Occupation | Male | Female |
| Healthcare Support | 0 (0.0%) | 7 (100.0%) |
| Security & Protection | 0 (0.0%) | 0 (0.0%) |
| Firefighting & Prevention | 0 (0.0%) | 0 (0.0%) |
| Law Enforcement | 0 (0.0%) | 0 (0.0%) |
| Food Preparation & Serving | 0 (0.0%) | 0 (0.0%) |
| Cleaning & Maintenance | 0 (0.0%) | 0 (0.0%) |
| Personal Care & Service | 5 (41.7%) | 7 (58.3%) |
| Total (Category) | 5 (26.3%) | 14 (73.7%) |
| Total (Overall) | 47 (55.3%) | 38 (44.7%) |
Sales and Office Occupations
The most common Sales and Office occupations in East Salem are Sales & Related (8 | 9.4%), and Office & Administration (5 | 5.9%).
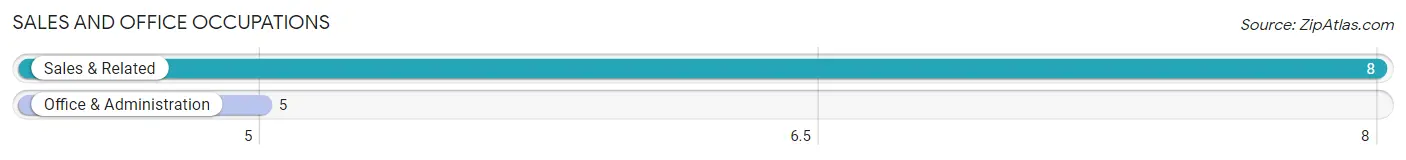
Sales and Office Occupations by Sex
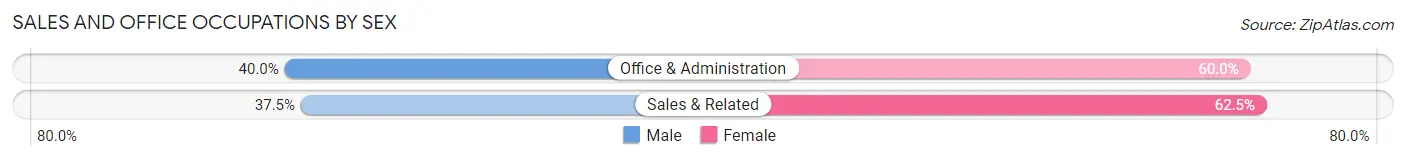
| Occupation | Male | Female |
| Sales & Related | 3 (37.5%) | 5 (62.5%) |
| Office & Administration | 2 (40.0%) | 3 (60.0%) |
| Total (Category) | 5 (38.5%) | 8 (61.5%) |
| Total (Overall) | 47 (55.3%) | 38 (44.7%) |
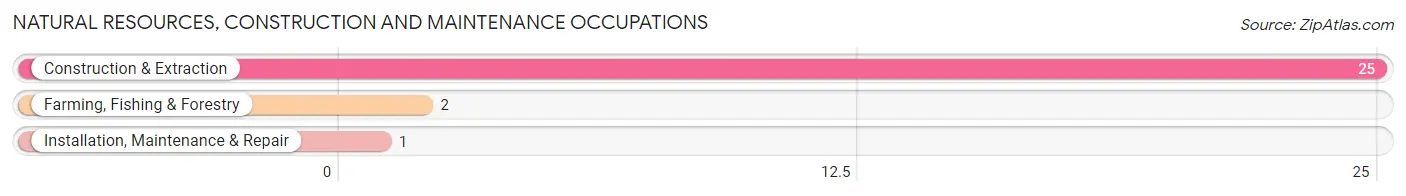
Natural Resources, Construction and Maintenance Occupations
The most common Natural Resources, Construction and Maintenance occupations in East Salem are Construction & Extraction (25 | 29.4%), Farming, Fishing & Forestry (2 | 2.4%), and Installation, Maintenance & Repair (1 | 1.2%).
Natural Resources, Construction and Maintenance Occupations by Sex
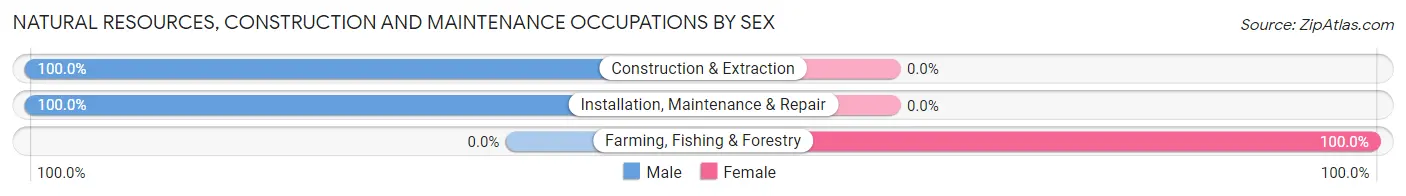
| Occupation | Male | Female |
| Farming, Fishing & Forestry | 0 (0.0%) | 2 (100.0%) |
| Construction & Extraction | 25 (100.0%) | 0 (0.0%) |
| Installation, Maintenance & Repair | 1 (100.0%) | 0 (0.0%) |
| Total (Category) | 26 (92.9%) | 2 (7.1%) |
| Total (Overall) | 47 (55.3%) | 38 (44.7%) |
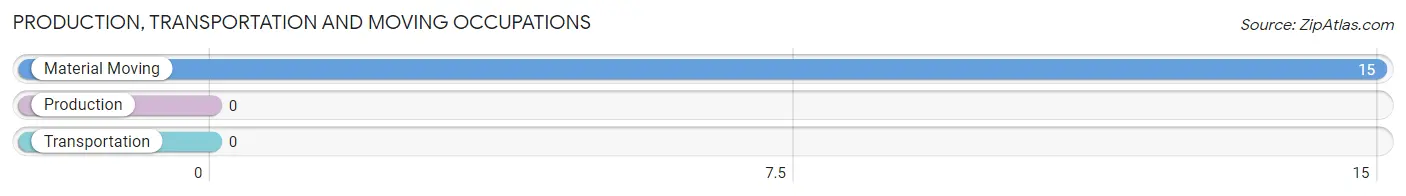
Production, Transportation and Moving Occupations
The most common Production, Transportation and Moving occupations in East Salem are , and Material Moving (15 | 17.6%).
Production, Transportation and Moving Occupations by Sex
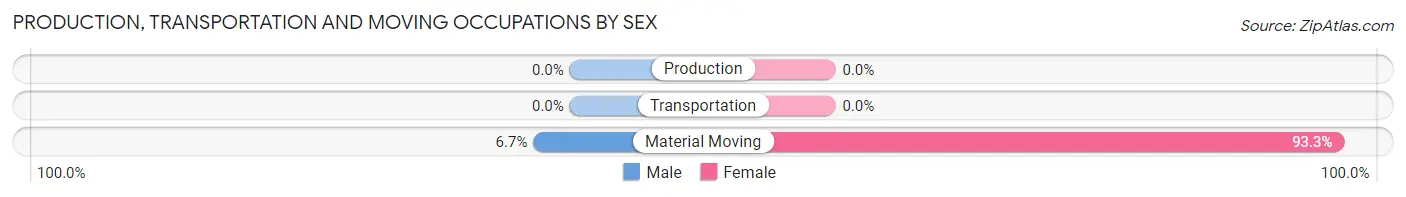
| Occupation | Male | Female |
| Production | 0 (0.0%) | 0 (0.0%) |
| Transportation | 0 (0.0%) | 0 (0.0%) |
| Material Moving | 1 (6.7%) | 14 (93.3%) |
| Total (Category) | 1 (6.7%) | 14 (93.3%) |
| Total (Overall) | 47 (55.3%) | 38 (44.7%) |
Employment Industries by Sex in East Salem
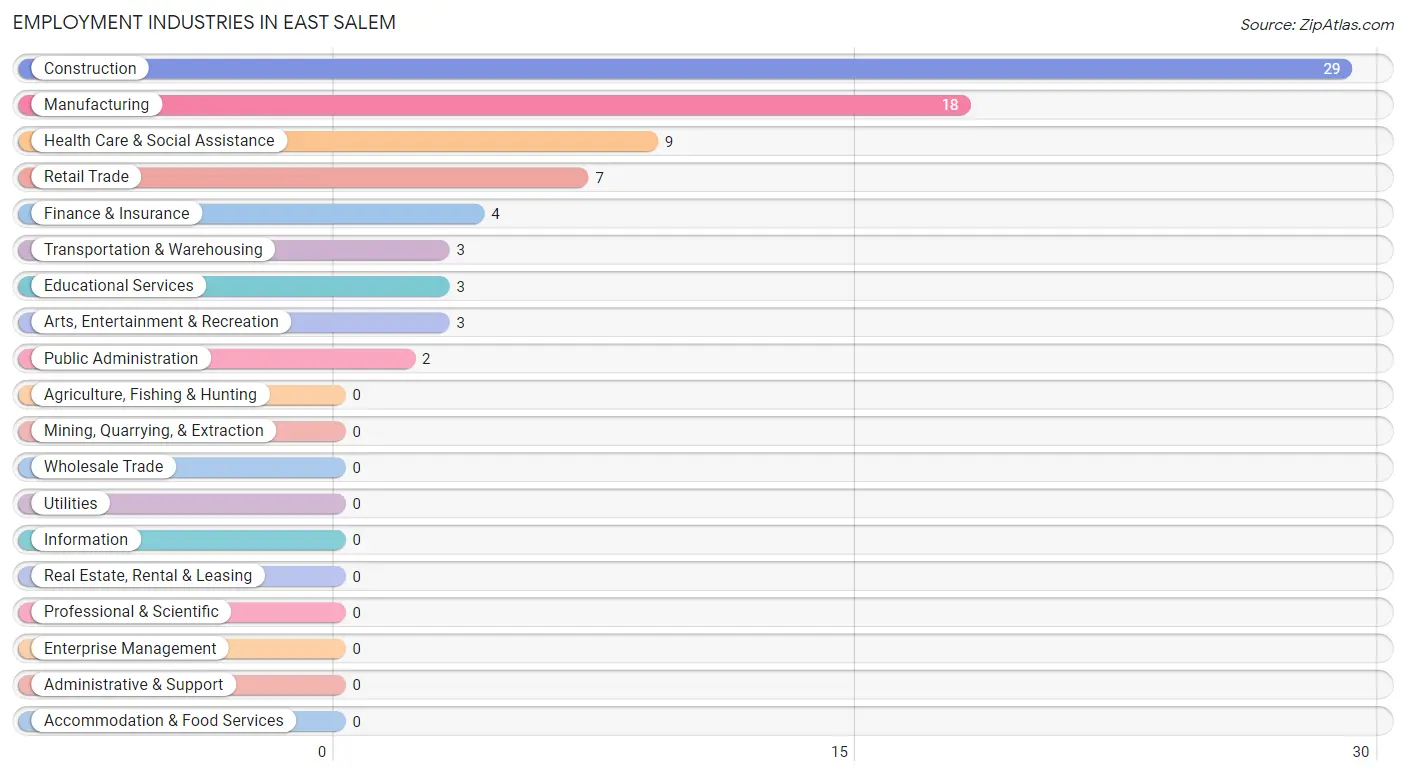
Employment Industries in East Salem
The major employment industries in East Salem include Construction (29 | 34.1%), Manufacturing (18 | 21.2%), Health Care & Social Assistance (9 | 10.6%), Retail Trade (7 | 8.2%), and Finance & Insurance (4 | 4.7%).
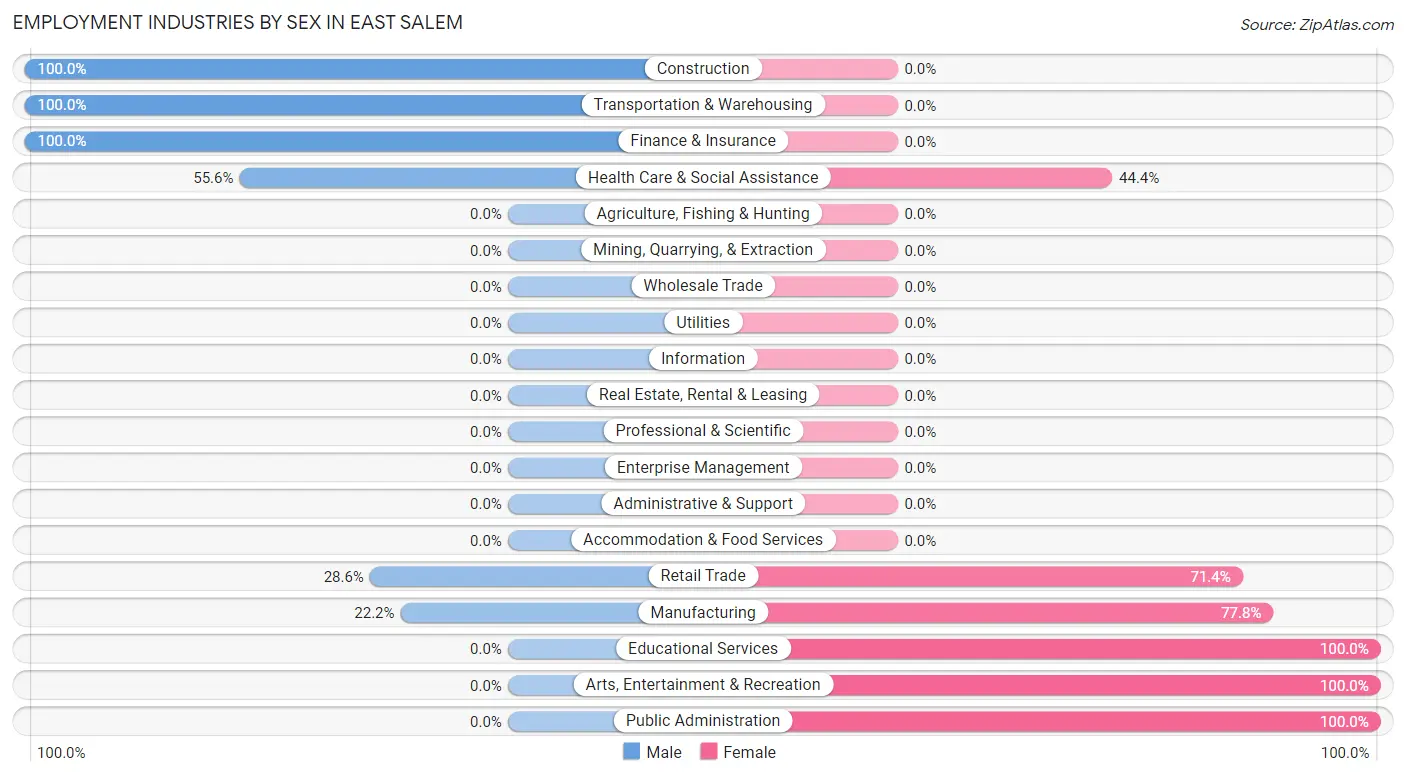
Employment Industries by Sex in East Salem
The East Salem industries that see more men than women are Construction (100.0%), Transportation & Warehousing (100.0%), and Finance & Insurance (100.0%), whereas the industries that tend to have a higher number of women are Educational Services (100.0%), Arts, Entertainment & Recreation (100.0%), and Public Administration (100.0%).
| Industry | Male | Female |
| Agriculture, Fishing & Hunting | 0 (0.0%) | 0 (0.0%) |
| Mining, Quarrying, & Extraction | 0 (0.0%) | 0 (0.0%) |
| Construction | 29 (100.0%) | 0 (0.0%) |
| Manufacturing | 4 (22.2%) | 14 (77.8%) |
| Wholesale Trade | 0 (0.0%) | 0 (0.0%) |
| Retail Trade | 2 (28.6%) | 5 (71.4%) |
| Transportation & Warehousing | 3 (100.0%) | 0 (0.0%) |
| Utilities | 0 (0.0%) | 0 (0.0%) |
| Information | 0 (0.0%) | 0 (0.0%) |
| Finance & Insurance | 4 (100.0%) | 0 (0.0%) |
| Real Estate, Rental & Leasing | 0 (0.0%) | 0 (0.0%) |
| Professional & Scientific | 0 (0.0%) | 0 (0.0%) |
| Enterprise Management | 0 (0.0%) | 0 (0.0%) |
| Administrative & Support | 0 (0.0%) | 0 (0.0%) |
| Educational Services | 0 (0.0%) | 3 (100.0%) |
| Health Care & Social Assistance | 5 (55.6%) | 4 (44.4%) |
| Arts, Entertainment & Recreation | 0 (0.0%) | 3 (100.0%) |
| Accommodation & Food Services | 0 (0.0%) | 0 (0.0%) |
| Public Administration | 0 (0.0%) | 2 (100.0%) |
| Total | 47 (55.3%) | 38 (44.7%) |
Education in East Salem
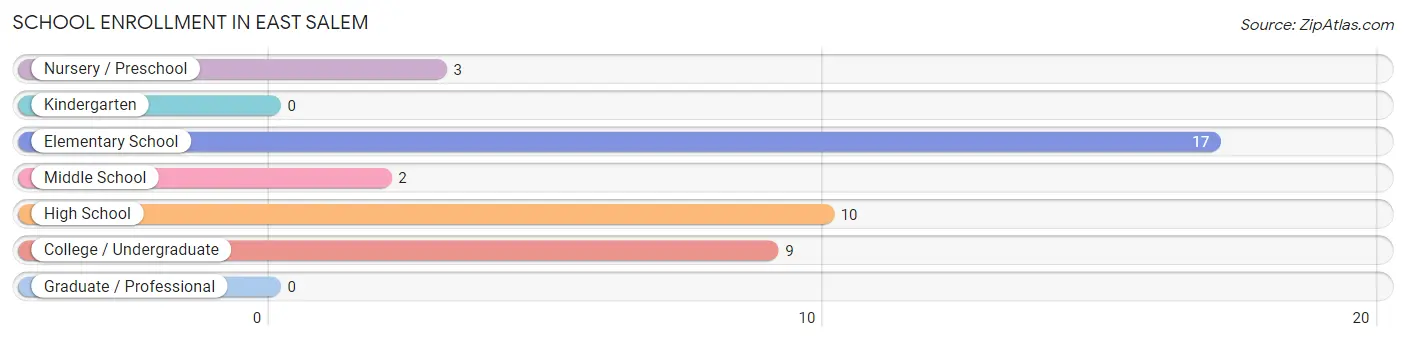
School Enrollment in East Salem
The most common levels of schooling among the 41 students in East Salem are elementary school (17 | 41.5%), high school (10 | 24.4%), and college / undergraduate (9 | 22.0%).
| School Level | # Students | % Students |
| Nursery / Preschool | 3 | 7.3% |
| Kindergarten | 0 | 0.0% |
| Elementary School | 17 | 41.5% |
| Middle School | 2 | 4.9% |
| High School | 10 | 24.4% |
| College / Undergraduate | 9 | 22.0% |
| Graduate / Professional | 0 | 0.0% |
| Total | 41 | 100.0% |
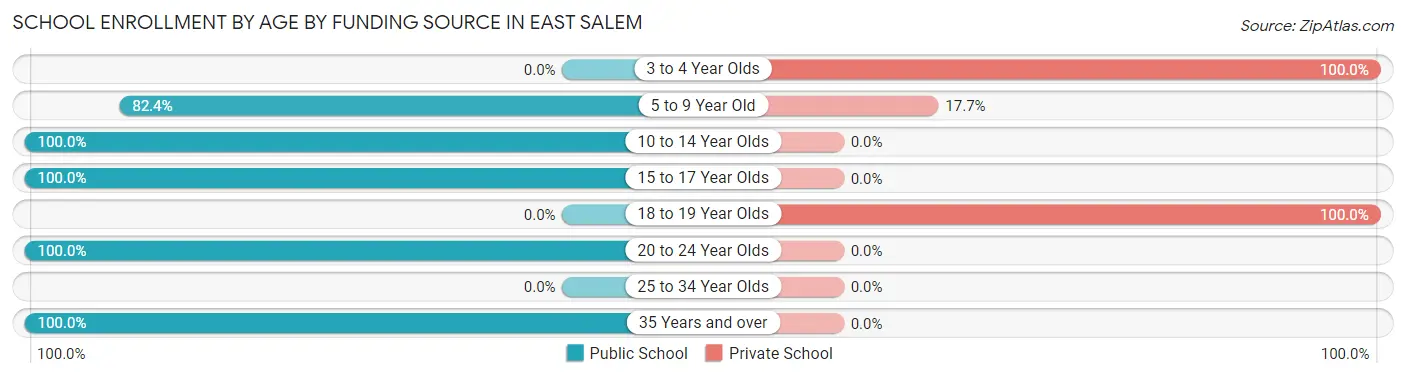
School Enrollment by Age by Funding Source in East Salem
Out of a total of 41 students who are enrolled in schools in East Salem, 8 (19.5%) attend a private institution, while the remaining 33 (80.5%) are enrolled in public schools. The age group of 3 to 4 year olds has the highest likelihood of being enrolled in private schools, with 3 (100.0% in the age bracket) enrolled. Conversely, the age group of 10 to 14 year olds has the lowest likelihood of being enrolled in a private school, with 5 (100.0% in the age bracket) attending a public institution.
| Age Bracket | Public School | Private School |
| 3 to 4 Year Olds | 0 (0.0%) | 3 (100.0%) |
| 5 to 9 Year Old | 14 (82.4%) | 3 (17.6%) |
| 10 to 14 Year Olds | 5 (100.0%) | 0 (0.0%) |
| 15 to 17 Year Olds | 7 (100.0%) | 0 (0.0%) |
| 18 to 19 Year Olds | 0 (0.0%) | 2 (100.0%) |
| 20 to 24 Year Olds | 2 (100.0%) | 0 (0.0%) |
| 25 to 34 Year Olds | 0 (0.0%) | 0 (0.0%) |
| 35 Years and over | 5 (100.0%) | 0 (0.0%) |
| Total | 33 (80.5%) | 8 (19.5%) |
Educational Attainment by Field of Study in East Salem
Social sciences (3 | 27.3%), business (3 | 27.3%), liberal arts & history (3 | 27.3%), and arts & humanities (2 | 18.2%) are the most common fields of study among 11 individuals in East Salem who have obtained a bachelor's degree or higher.
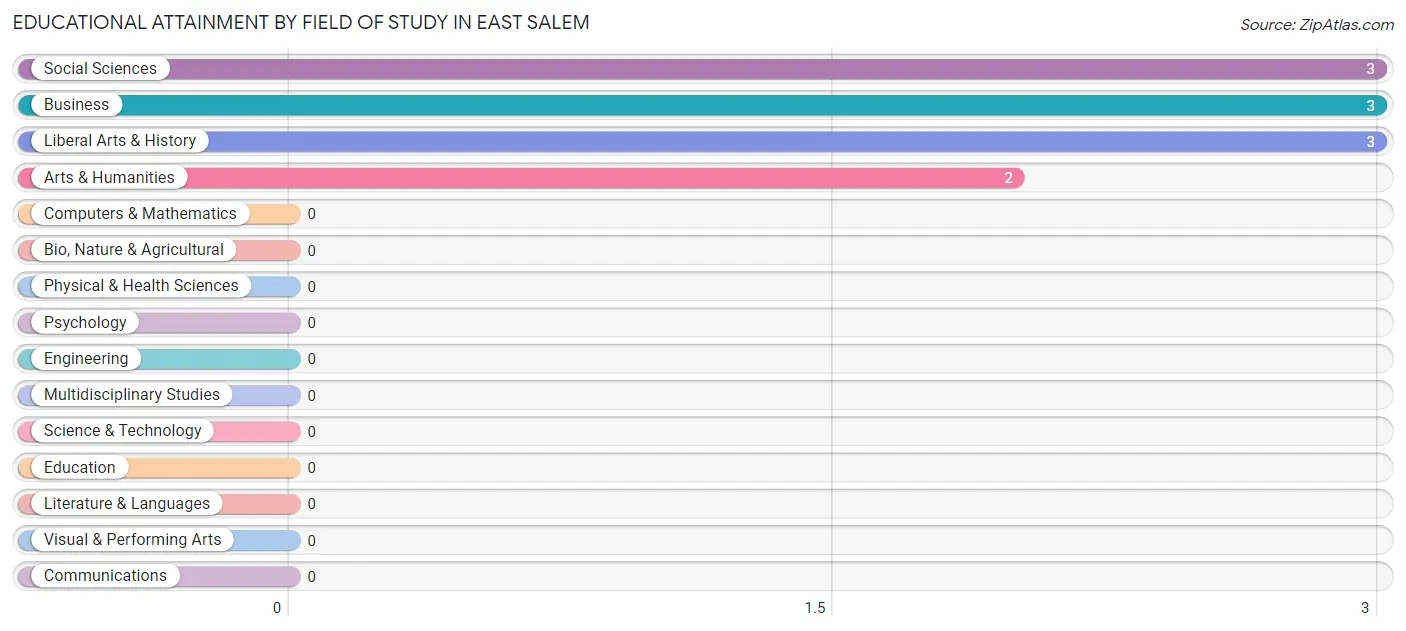
| Field of Study | # Graduates | % Graduates |
| Computers & Mathematics | 0 | 0.0% |
| Bio, Nature & Agricultural | 0 | 0.0% |
| Physical & Health Sciences | 0 | 0.0% |
| Psychology | 0 | 0.0% |
| Social Sciences | 3 | 27.3% |
| Engineering | 0 | 0.0% |
| Multidisciplinary Studies | 0 | 0.0% |
| Science & Technology | 0 | 0.0% |
| Business | 3 | 27.3% |
| Education | 0 | 0.0% |
| Literature & Languages | 0 | 0.0% |
| Liberal Arts & History | 3 | 27.3% |
| Visual & Performing Arts | 0 | 0.0% |
| Communications | 0 | 0.0% |
| Arts & Humanities | 2 | 18.2% |
| Total | 11 | 100.0% |
Transportation & Commute in East Salem
Vehicle Availability by Sex in East Salem
The most prevalent vehicle ownership categories in East Salem are males with 2 vehicles (39, accounting for 83.0%) and females with 2 vehicles (17, making up 111.4%).
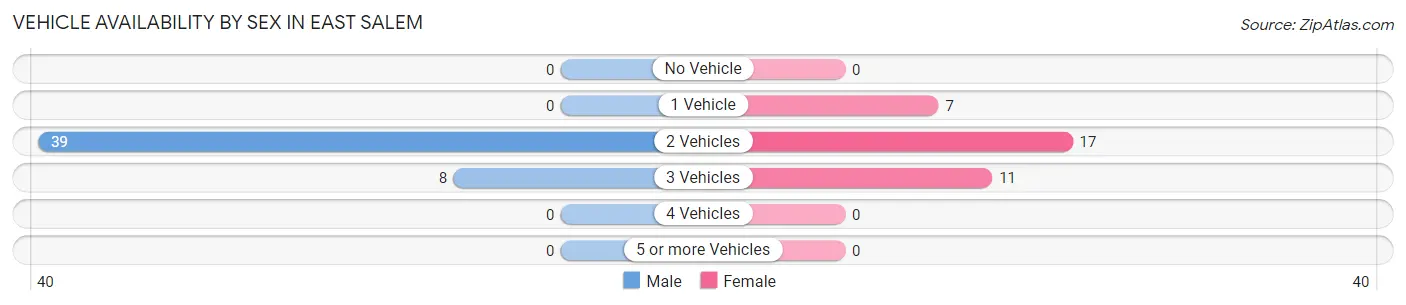
| Vehicles Available | Male | Female |
| No Vehicle | 0 (0.0%) | 0 (0.0%) |
| 1 Vehicle | 0 (0.0%) | 7 (20.0%) |
| 2 Vehicles | 39 (83.0%) | 17 (48.6%) |
| 3 Vehicles | 8 (17.0%) | 11 (31.4%) |
| 4 Vehicles | 0 (0.0%) | 0 (0.0%) |
| 5 or more Vehicles | 0 (0.0%) | 0 (0.0%) |
| Total | 47 (100.0%) | 35 (100.0%) |
Commute Time in East Salem
The most frequently occuring commute durations in East Salem are 10 to 14 minutes (33 commuters, 40.7%), 60 to 89 minutes (14 commuters, 17.3%), and less than 5 minutes (8 commuters, 9.9%).
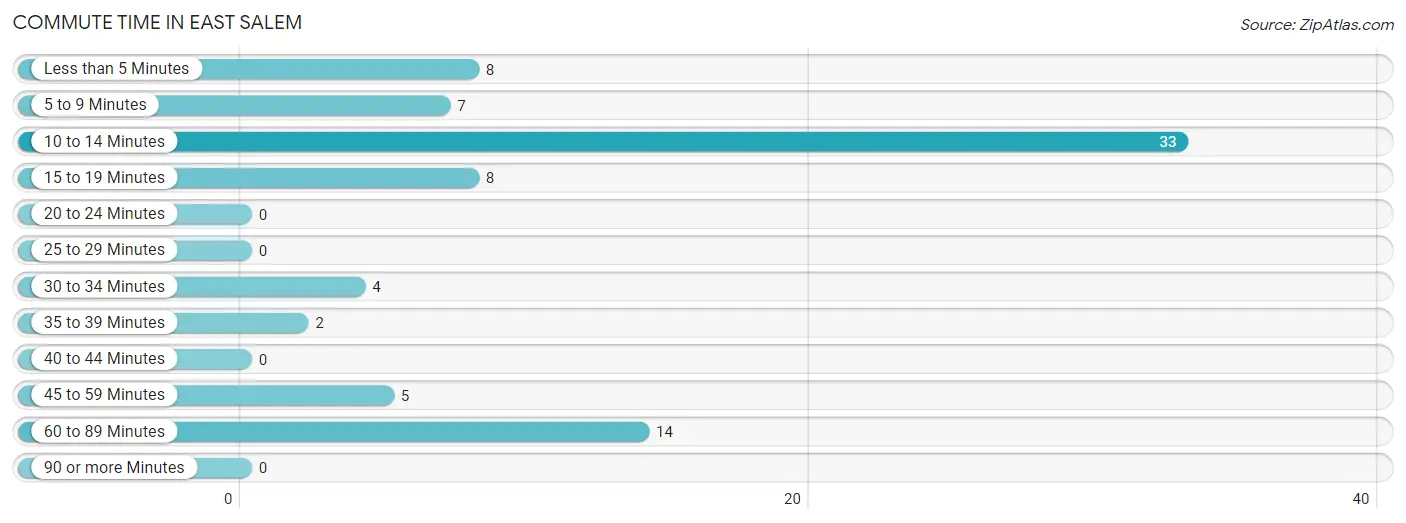
| Commute Time | # Commuters | % Commuters |
| Less than 5 Minutes | 8 | 9.9% |
| 5 to 9 Minutes | 7 | 8.6% |
| 10 to 14 Minutes | 33 | 40.7% |
| 15 to 19 Minutes | 8 | 9.9% |
| 20 to 24 Minutes | 0 | 0.0% |
| 25 to 29 Minutes | 0 | 0.0% |
| 30 to 34 Minutes | 4 | 4.9% |
| 35 to 39 Minutes | 2 | 2.5% |
| 40 to 44 Minutes | 0 | 0.0% |
| 45 to 59 Minutes | 5 | 6.2% |
| 60 to 89 Minutes | 14 | 17.3% |
| 90 or more Minutes | 0 | 0.0% |
Commute Time by Sex in East Salem
The most common commute times in East Salem are 10 to 14 minutes (19 commuters, 40.4%) for males and 10 to 14 minutes (14 commuters, 41.2%) for females.
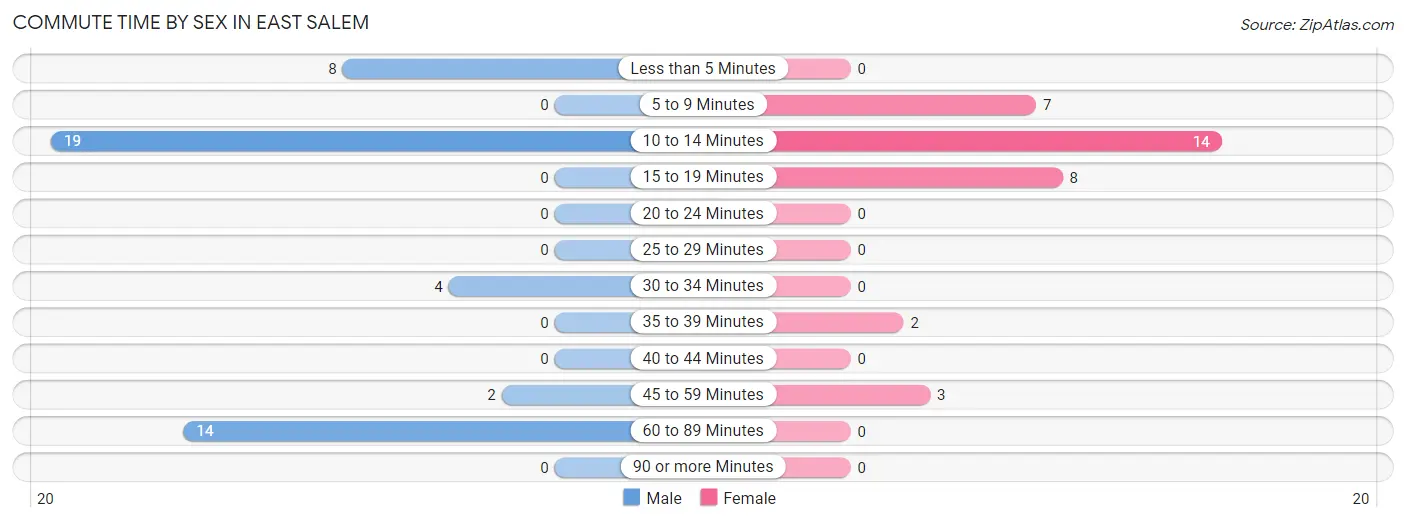
| Commute Time | Male | Female |
| Less than 5 Minutes | 8 (17.0%) | 0 (0.0%) |
| 5 to 9 Minutes | 0 (0.0%) | 7 (20.6%) |
| 10 to 14 Minutes | 19 (40.4%) | 14 (41.2%) |
| 15 to 19 Minutes | 0 (0.0%) | 8 (23.5%) |
| 20 to 24 Minutes | 0 (0.0%) | 0 (0.0%) |
| 25 to 29 Minutes | 0 (0.0%) | 0 (0.0%) |
| 30 to 34 Minutes | 4 (8.5%) | 0 (0.0%) |
| 35 to 39 Minutes | 0 (0.0%) | 2 (5.9%) |
| 40 to 44 Minutes | 0 (0.0%) | 0 (0.0%) |
| 45 to 59 Minutes | 2 (4.3%) | 3 (8.8%) |
| 60 to 89 Minutes | 14 (29.8%) | 0 (0.0%) |
| 90 or more Minutes | 0 (0.0%) | 0 (0.0%) |
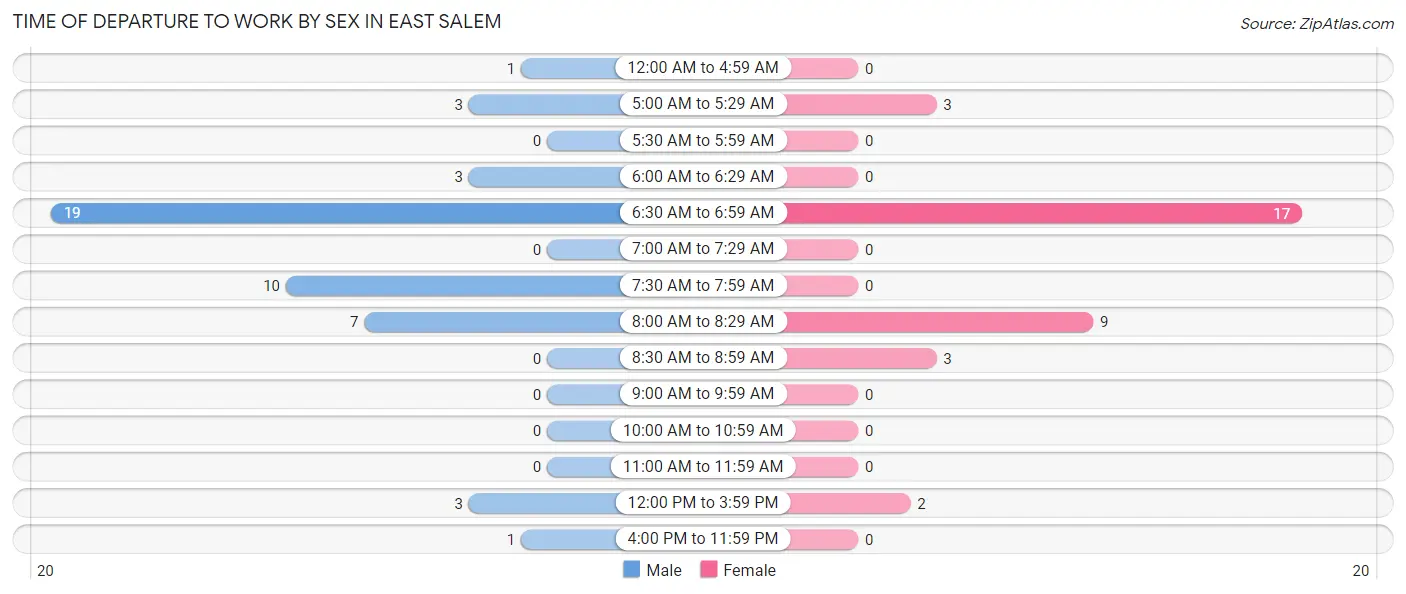
Time of Departure to Work by Sex in East Salem
The most frequent times of departure to work in East Salem are 6:30 AM to 6:59 AM (19, 40.4%) for males and 6:30 AM to 6:59 AM (17, 50.0%) for females.
| Time of Departure | Male | Female |
| 12:00 AM to 4:59 AM | 1 (2.1%) | 0 (0.0%) |
| 5:00 AM to 5:29 AM | 3 (6.4%) | 3 (8.8%) |
| 5:30 AM to 5:59 AM | 0 (0.0%) | 0 (0.0%) |
| 6:00 AM to 6:29 AM | 3 (6.4%) | 0 (0.0%) |
| 6:30 AM to 6:59 AM | 19 (40.4%) | 17 (50.0%) |
| 7:00 AM to 7:29 AM | 0 (0.0%) | 0 (0.0%) |
| 7:30 AM to 7:59 AM | 10 (21.3%) | 0 (0.0%) |
| 8:00 AM to 8:29 AM | 7 (14.9%) | 9 (26.5%) |
| 8:30 AM to 8:59 AM | 0 (0.0%) | 3 (8.8%) |
| 9:00 AM to 9:59 AM | 0 (0.0%) | 0 (0.0%) |
| 10:00 AM to 10:59 AM | 0 (0.0%) | 0 (0.0%) |
| 11:00 AM to 11:59 AM | 0 (0.0%) | 0 (0.0%) |
| 12:00 PM to 3:59 PM | 3 (6.4%) | 2 (5.9%) |
| 4:00 PM to 11:59 PM | 1 (2.1%) | 0 (0.0%) |
| Total | 47 (100.0%) | 34 (100.0%) |
Housing Occupancy in East Salem
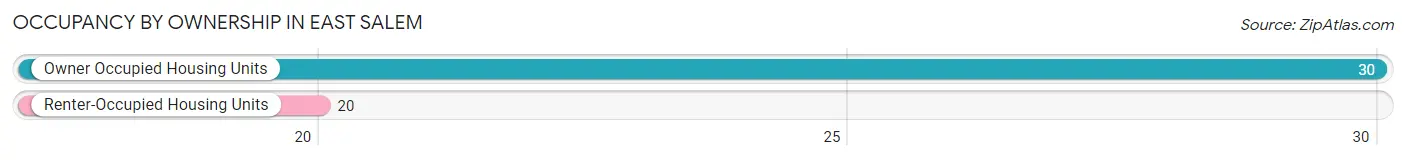
Occupancy by Ownership in East Salem
Of the total 50 dwellings in East Salem, owner-occupied units account for 30 (60.0%), while renter-occupied units make up 20 (40.0%).
| Occupancy | # Housing Units | % Housing Units |
| Owner Occupied Housing Units | 30 | 60.0% |
| Renter-Occupied Housing Units | 20 | 40.0% |
| Total Occupied Housing Units | 50 | 100.0% |
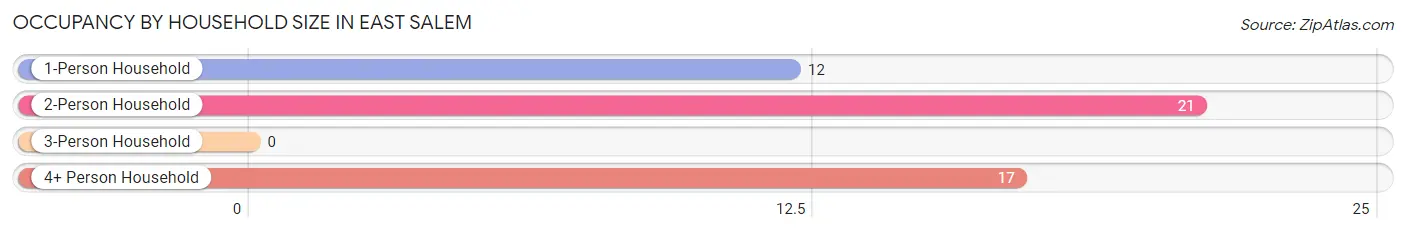
Occupancy by Household Size in East Salem
| Household Size | # Housing Units | % Housing Units |
| 1-Person Household | 12 | 24.0% |
| 2-Person Household | 21 | 42.0% |
| 3-Person Household | 0 | 0.0% |
| 4+ Person Household | 17 | 34.0% |
| Total Housing Units | 50 | 100.0% |
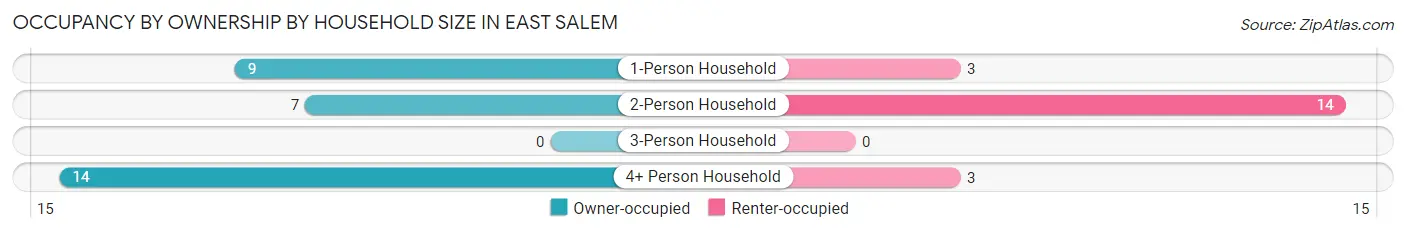
Occupancy by Ownership by Household Size in East Salem
| Household Size | Owner-occupied | Renter-occupied |
| 1-Person Household | 9 (75.0%) | 3 (25.0%) |
| 2-Person Household | 7 (33.3%) | 14 (66.7%) |
| 3-Person Household | 0 (0.0%) | 0 (0.0%) |
| 4+ Person Household | 14 (82.4%) | 3 (17.6%) |
| Total Housing Units | 30 (60.0%) | 20 (40.0%) |
Occupancy by Educational Attainment in East Salem
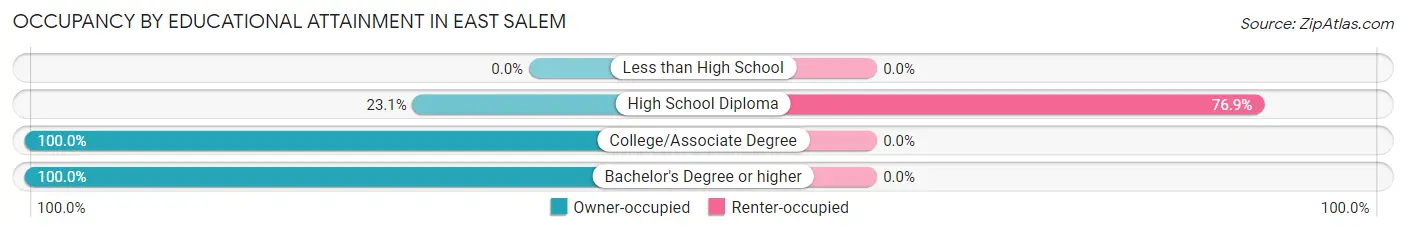
| Household Size | Owner-occupied | Renter-occupied |
| Less than High School | 0 (0.0%) | 0 (0.0%) |
| High School Diploma | 6 (23.1%) | 20 (76.9%) |
| College/Associate Degree | 16 (100.0%) | 0 (0.0%) |
| Bachelor's Degree or higher | 8 (100.0%) | 0 (0.0%) |
Occupancy by Age of Householder in East Salem
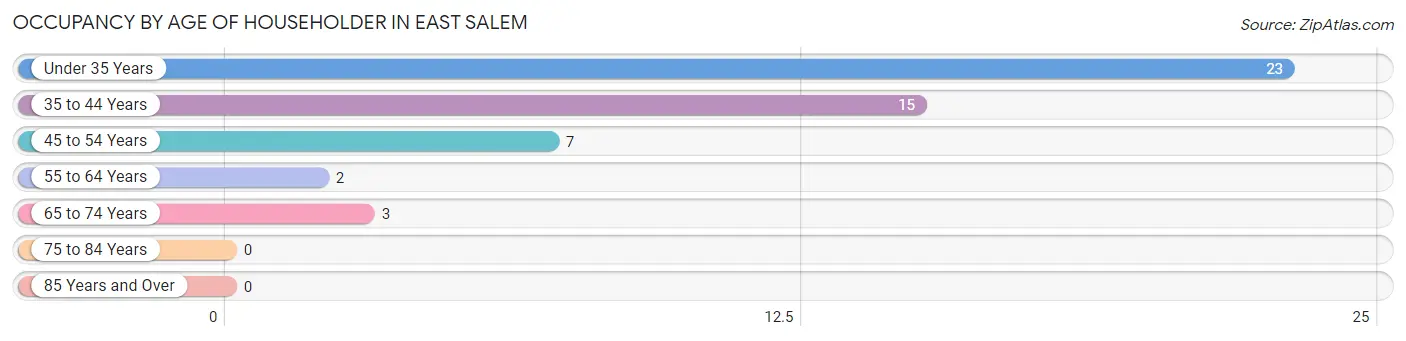
| Age Bracket | # Households | % Households |
| Under 35 Years | 23 | 46.0% |
| 35 to 44 Years | 15 | 30.0% |
| 45 to 54 Years | 7 | 14.0% |
| 55 to 64 Years | 2 | 4.0% |
| 65 to 74 Years | 3 | 6.0% |
| 75 to 84 Years | 0 | 0.0% |
| 85 Years and Over | 0 | 0.0% |
| Total | 50 | 100.0% |
Housing Finances in East Salem
Median Income by Occupancy in East Salem
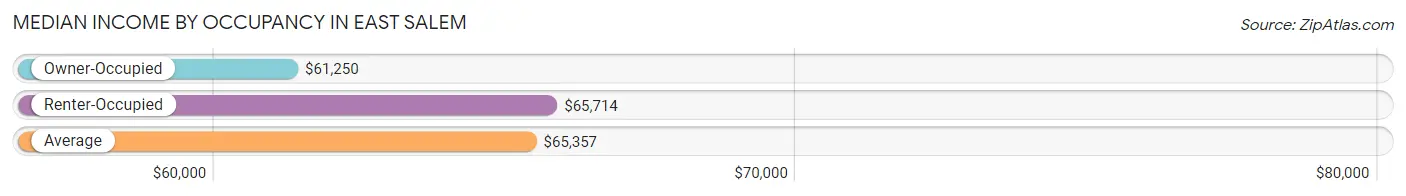
| Occupancy Type | # Households | Median Income |
| Owner-Occupied | 30 (60.0%) | $61,250 |
| Renter-Occupied | 20 (40.0%) | $65,714 |
| Average | 50 (100.0%) | $65,357 |
Occupancy by Householder Income Bracket in East Salem
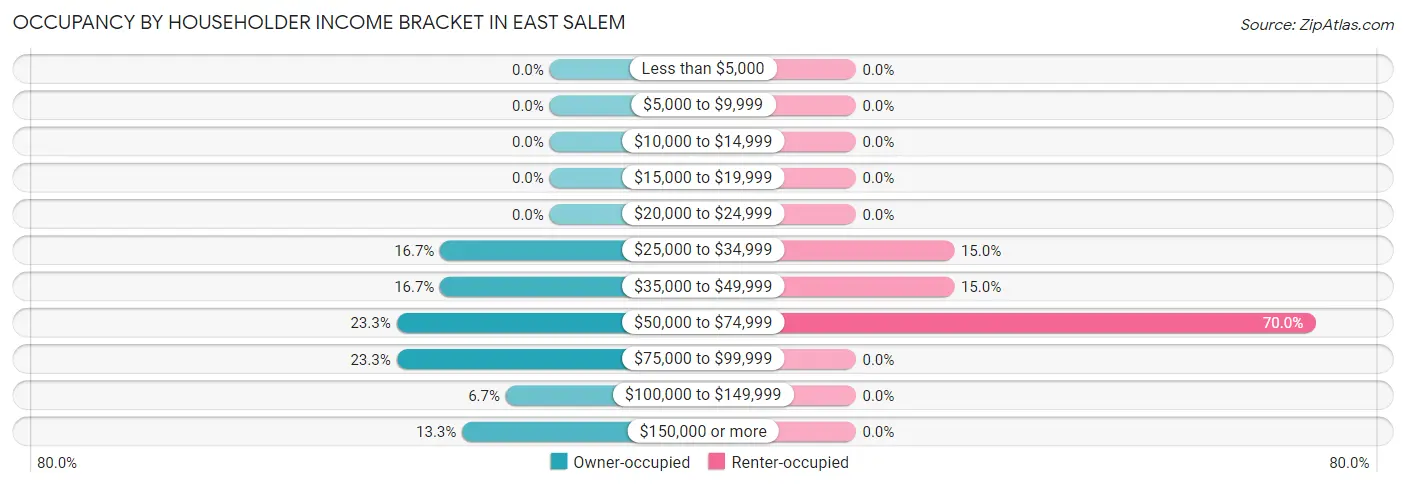
| Income Bracket | Owner-occupied | Renter-occupied |
| Less than $5,000 | 0 (0.0%) | 0 (0.0%) |
| $5,000 to $9,999 | 0 (0.0%) | 0 (0.0%) |
| $10,000 to $14,999 | 0 (0.0%) | 0 (0.0%) |
| $15,000 to $19,999 | 0 (0.0%) | 0 (0.0%) |
| $20,000 to $24,999 | 0 (0.0%) | 0 (0.0%) |
| $25,000 to $34,999 | 5 (16.7%) | 3 (15.0%) |
| $35,000 to $49,999 | 5 (16.7%) | 3 (15.0%) |
| $50,000 to $74,999 | 7 (23.3%) | 14 (70.0%) |
| $75,000 to $99,999 | 7 (23.3%) | 0 (0.0%) |
| $100,000 to $149,999 | 2 (6.7%) | 0 (0.0%) |
| $150,000 or more | 4 (13.3%) | 0 (0.0%) |
| Total | 30 (100.0%) | 20 (100.0%) |
Monthly Housing Cost Tiers in East Salem
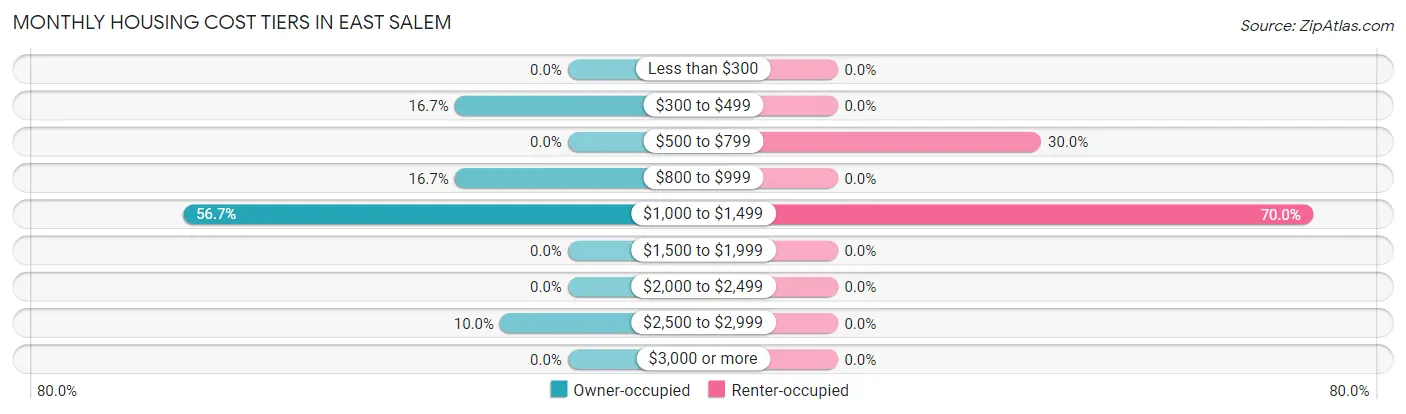
| Monthly Cost | Owner-occupied | Renter-occupied |
| Less than $300 | 0 (0.0%) | 0 (0.0%) |
| $300 to $499 | 5 (16.7%) | 0 (0.0%) |
| $500 to $799 | 0 (0.0%) | 6 (30.0%) |
| $800 to $999 | 5 (16.7%) | 0 (0.0%) |
| $1,000 to $1,499 | 17 (56.7%) | 14 (70.0%) |
| $1,500 to $1,999 | 0 (0.0%) | 0 (0.0%) |
| $2,000 to $2,499 | 0 (0.0%) | 0 (0.0%) |
| $2,500 to $2,999 | 3 (10.0%) | 0 (0.0%) |
| $3,000 or more | 0 (0.0%) | 0 (0.0%) |
| Total | 30 (100.0%) | 20 (100.0%) |
Physical Housing Characteristics in East Salem
Housing Structures in East Salem
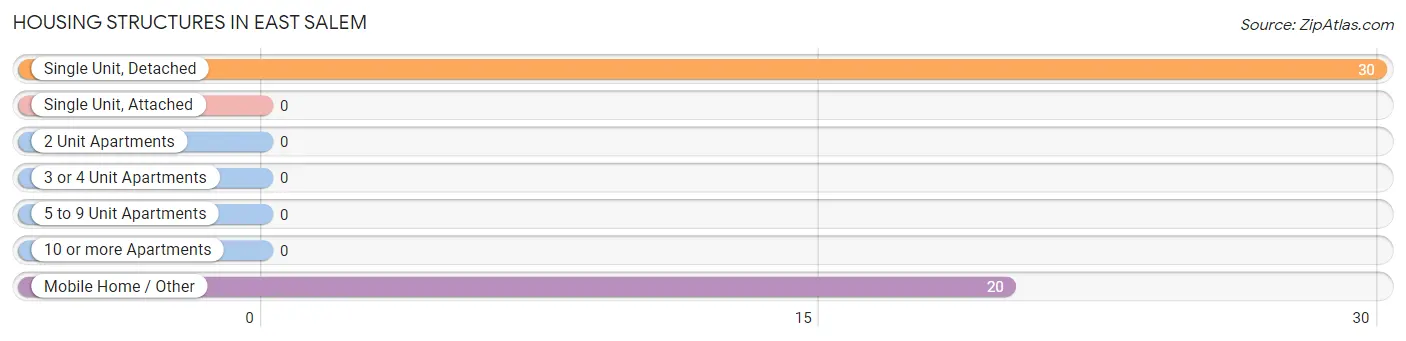
| Structure Type | # Housing Units | % Housing Units |
| Single Unit, Detached | 30 | 60.0% |
| Single Unit, Attached | 0 | 0.0% |
| 2 Unit Apartments | 0 | 0.0% |
| 3 or 4 Unit Apartments | 0 | 0.0% |
| 5 to 9 Unit Apartments | 0 | 0.0% |
| 10 or more Apartments | 0 | 0.0% |
| Mobile Home / Other | 20 | 40.0% |
| Total | 50 | 100.0% |
Housing Structures by Occupancy in East Salem
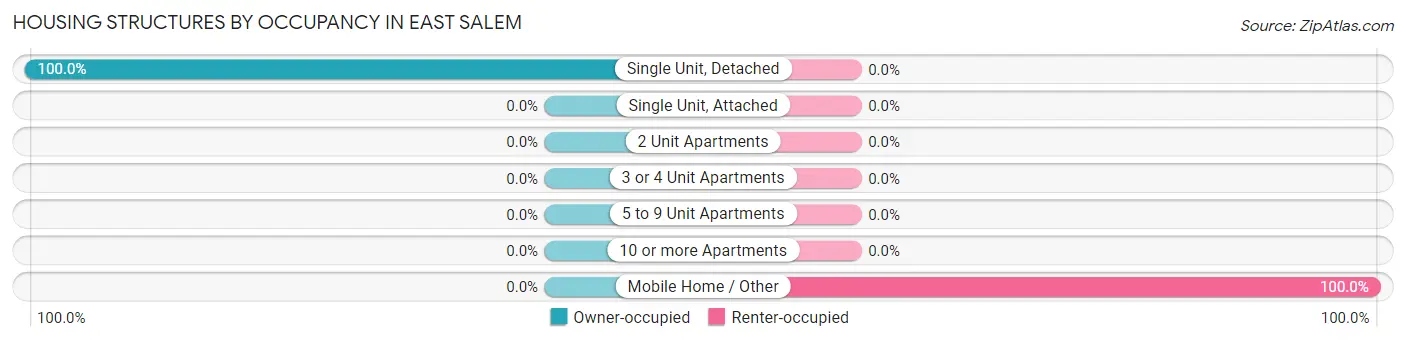
| Structure Type | Owner-occupied | Renter-occupied |
| Single Unit, Detached | 30 (100.0%) | 0 (0.0%) |
| Single Unit, Attached | 0 (0.0%) | 0 (0.0%) |
| 2 Unit Apartments | 0 (0.0%) | 0 (0.0%) |
| 3 or 4 Unit Apartments | 0 (0.0%) | 0 (0.0%) |
| 5 to 9 Unit Apartments | 0 (0.0%) | 0 (0.0%) |
| 10 or more Apartments | 0 (0.0%) | 0 (0.0%) |
| Mobile Home / Other | 0 (0.0%) | 20 (100.0%) |
| Total | 30 (60.0%) | 20 (40.0%) |
Housing Structures by Number of Rooms in East Salem
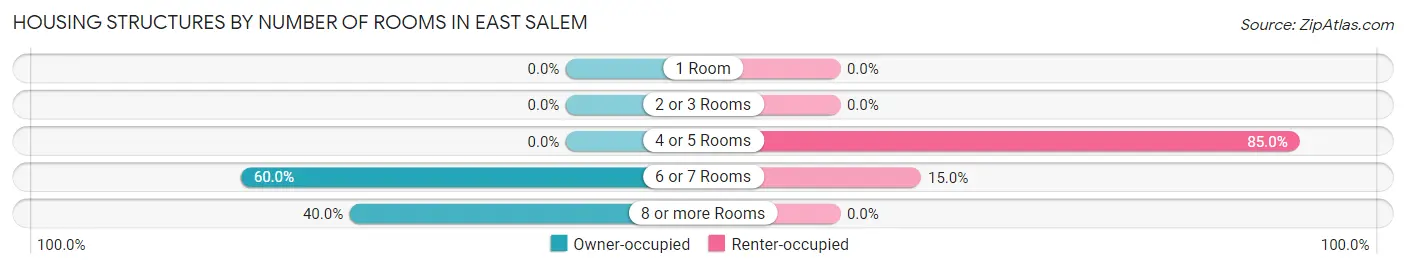
| Number of Rooms | Owner-occupied | Renter-occupied |
| 1 Room | 0 (0.0%) | 0 (0.0%) |
| 2 or 3 Rooms | 0 (0.0%) | 0 (0.0%) |
| 4 or 5 Rooms | 0 (0.0%) | 17 (85.0%) |
| 6 or 7 Rooms | 18 (60.0%) | 3 (15.0%) |
| 8 or more Rooms | 12 (40.0%) | 0 (0.0%) |
| Total | 30 (100.0%) | 20 (100.0%) |
Housing Structure by Heating Type in East Salem
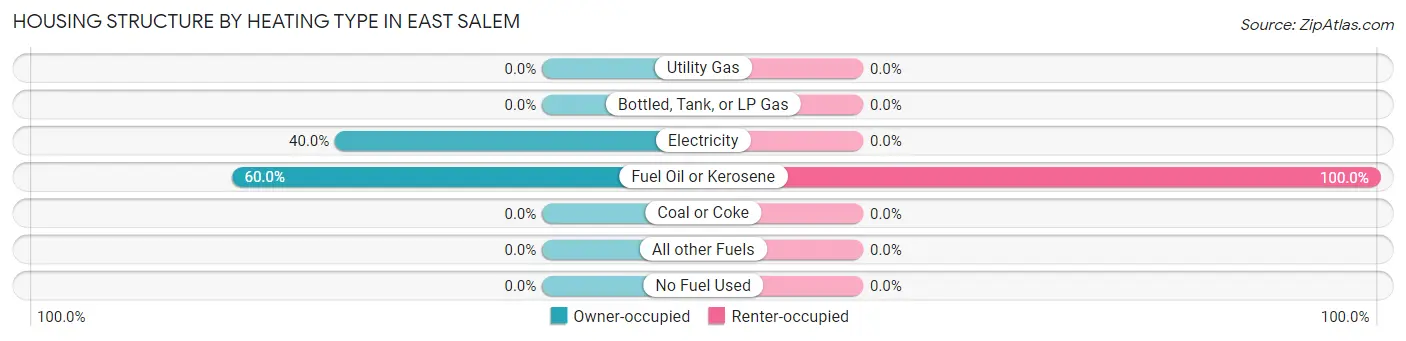
| Heating Type | Owner-occupied | Renter-occupied |
| Utility Gas | 0 (0.0%) | 0 (0.0%) |
| Bottled, Tank, or LP Gas | 0 (0.0%) | 0 (0.0%) |
| Electricity | 12 (40.0%) | 0 (0.0%) |
| Fuel Oil or Kerosene | 18 (60.0%) | 20 (100.0%) |
| Coal or Coke | 0 (0.0%) | 0 (0.0%) |
| All other Fuels | 0 (0.0%) | 0 (0.0%) |
| No Fuel Used | 0 (0.0%) | 0 (0.0%) |
| Total | 30 (100.0%) | 20 (100.0%) |
Household Vehicle Usage in East Salem
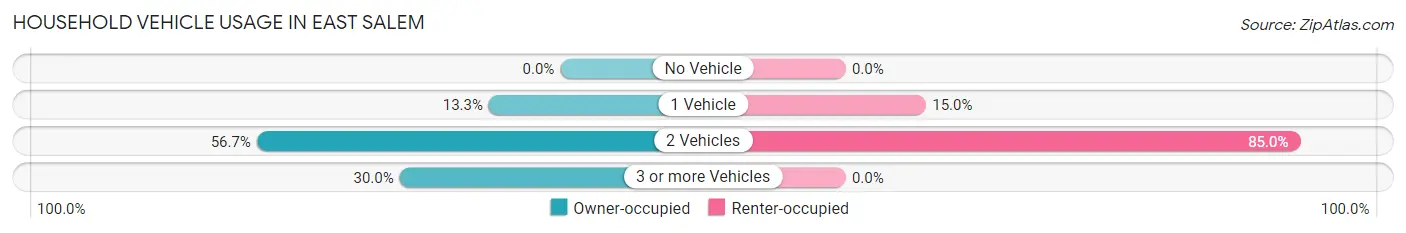
| Vehicles per Household | Owner-occupied | Renter-occupied |
| No Vehicle | 0 (0.0%) | 0 (0.0%) |
| 1 Vehicle | 4 (13.3%) | 3 (15.0%) |
| 2 Vehicles | 17 (56.7%) | 17 (85.0%) |
| 3 or more Vehicles | 9 (30.0%) | 0 (0.0%) |
| Total | 30 (100.0%) | 20 (100.0%) |
Real Estate & Mortgages in East Salem
Real Estate and Mortgage Overview in East Salem
| Characteristic | Without Mortgage | With Mortgage |
| Housing Units | 2 | 28 |
| Median Property Value | - | - |
| Median Household Income | - | - |
| Monthly Housing Costs | - | - |
| Real Estate Taxes | - | - |
Property Value by Mortgage Status in East Salem
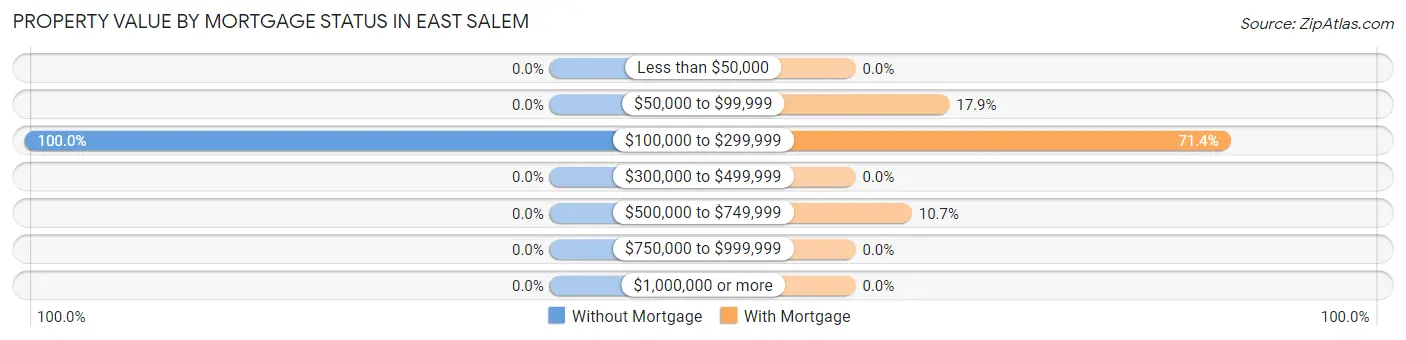
| Property Value | Without Mortgage | With Mortgage |
| Less than $50,000 | 0 (0.0%) | 0 (0.0%) |
| $50,000 to $99,999 | 0 (0.0%) | 5 (17.9%) |
| $100,000 to $299,999 | 2 (100.0%) | 20 (71.4%) |
| $300,000 to $499,999 | 0 (0.0%) | 0 (0.0%) |
| $500,000 to $749,999 | 0 (0.0%) | 3 (10.7%) |
| $750,000 to $999,999 | 0 (0.0%) | 0 (0.0%) |
| $1,000,000 or more | 0 (0.0%) | 0 (0.0%) |
| Total | 2 (100.0%) | 28 (100.0%) |
Household Income by Mortgage Status in East Salem
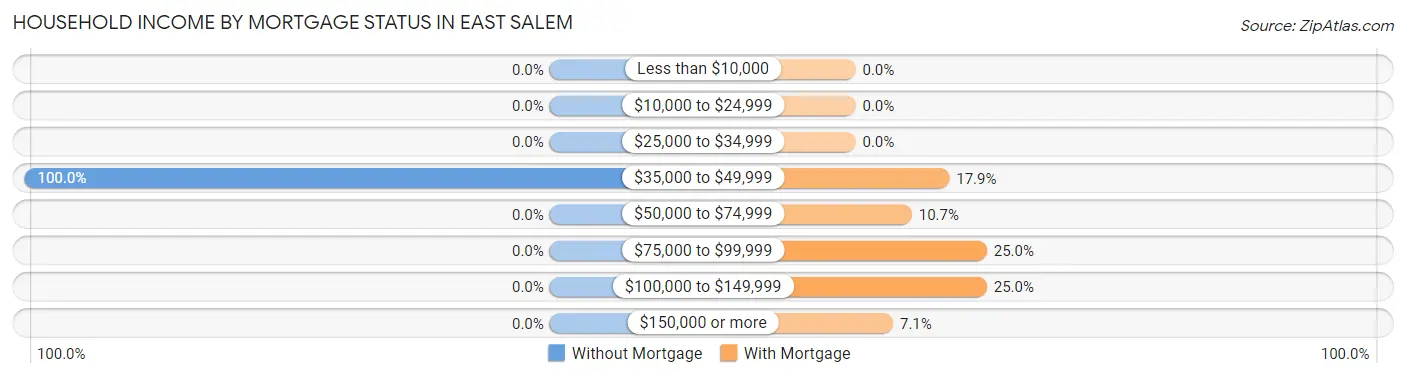
| Household Income | Without Mortgage | With Mortgage |
| Less than $10,000 | 0 (0.0%) | 0 (0.0%) |
| $10,000 to $24,999 | 0 (0.0%) | 0 (0.0%) |
| $25,000 to $34,999 | 0 (0.0%) | 0 (0.0%) |
| $35,000 to $49,999 | 2 (100.0%) | 5 (17.9%) |
| $50,000 to $74,999 | 0 (0.0%) | 3 (10.7%) |
| $75,000 to $99,999 | 0 (0.0%) | 7 (25.0%) |
| $100,000 to $149,999 | 0 (0.0%) | 7 (25.0%) |
| $150,000 or more | 0 (0.0%) | 2 (7.1%) |
| Total | 2 (100.0%) | 28 (100.0%) |
Property Value to Household Income Ratio in East Salem
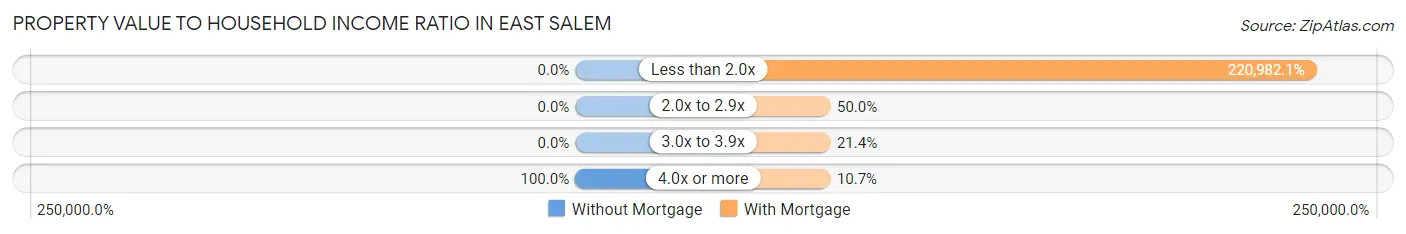
| Value-to-Income Ratio | Without Mortgage | With Mortgage |
| Less than 2.0x | 0 (0.0%) | 61,875 (220,982.1%) |
| 2.0x to 2.9x | 0 (0.0%) | 14 (50.0%) |
| 3.0x to 3.9x | 0 (0.0%) | 6 (21.4%) |
| 4.0x or more | 2 (100.0%) | 3 (10.7%) |
| Total | 2 (100.0%) | 28 (100.0%) |
Real Estate Taxes by Mortgage Status in East Salem
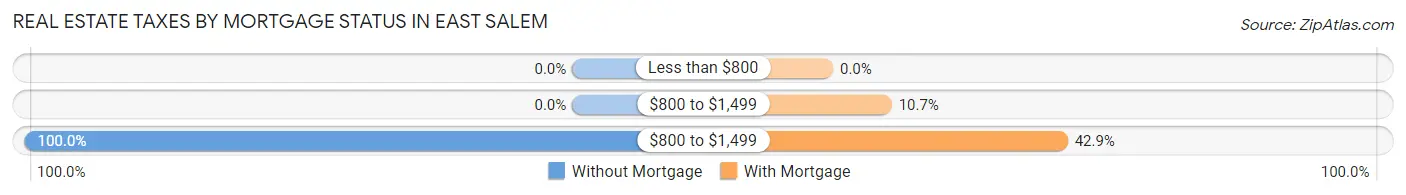
| Property Taxes | Without Mortgage | With Mortgage |
| Less than $800 | 0 (0.0%) | 0 (0.0%) |
| $800 to $1,499 | 0 (0.0%) | 3 (10.7%) |
| $800 to $1,499 | 2 (100.0%) | 12 (42.9%) |
| Total | 2 (100.0%) | 28 (100.0%) |
Health & Disability in East Salem
Health Insurance Coverage by Age in East Salem
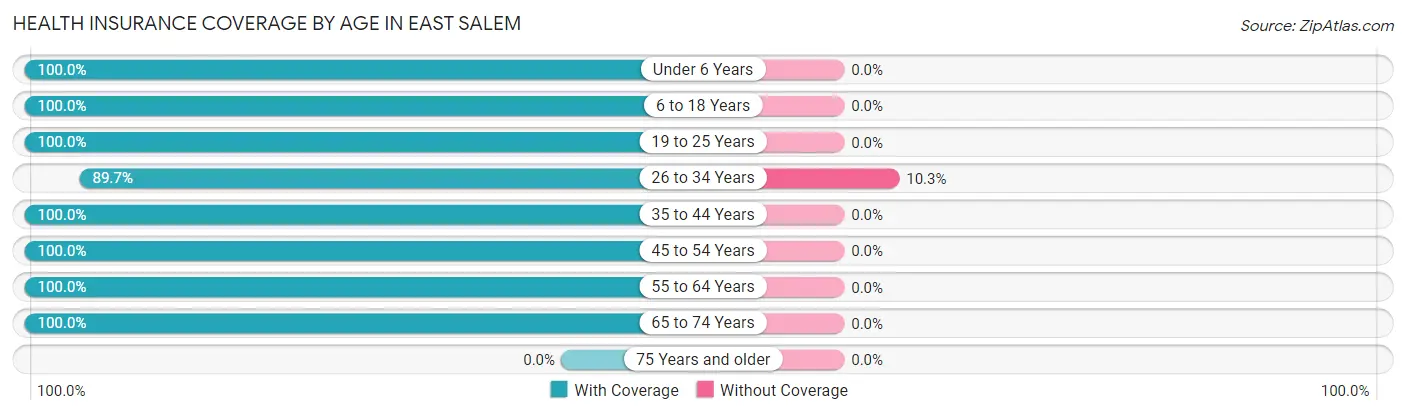
| Age Bracket | With Coverage | Without Coverage |
| Under 6 Years | 16 (100.0%) | 0 (0.0%) |
| 6 to 18 Years | 29 (100.0%) | 0 (0.0%) |
| 19 to 25 Years | 10 (100.0%) | 0 (0.0%) |
| 26 to 34 Years | 35 (89.7%) | 4 (10.3%) |
| 35 to 44 Years | 25 (100.0%) | 0 (0.0%) |
| 45 to 54 Years | 11 (100.0%) | 0 (0.0%) |
| 55 to 64 Years | 8 (100.0%) | 0 (0.0%) |
| 65 to 74 Years | 3 (100.0%) | 0 (0.0%) |
| 75 Years and older | 0 (0.0%) | 0 (0.0%) |
| Total | 137 (97.2%) | 4 (2.8%) |
Health Insurance Coverage by Citizenship Status in East Salem
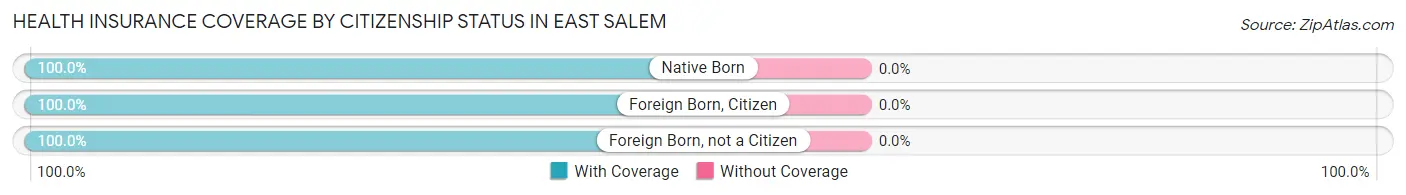
| Citizenship Status | With Coverage | Without Coverage |
| Native Born | 16 (100.0%) | 0 (0.0%) |
| Foreign Born, Citizen | 29 (100.0%) | 0 (0.0%) |
| Foreign Born, not a Citizen | 10 (100.0%) | 0 (0.0%) |
Health Insurance Coverage by Household Income in East Salem
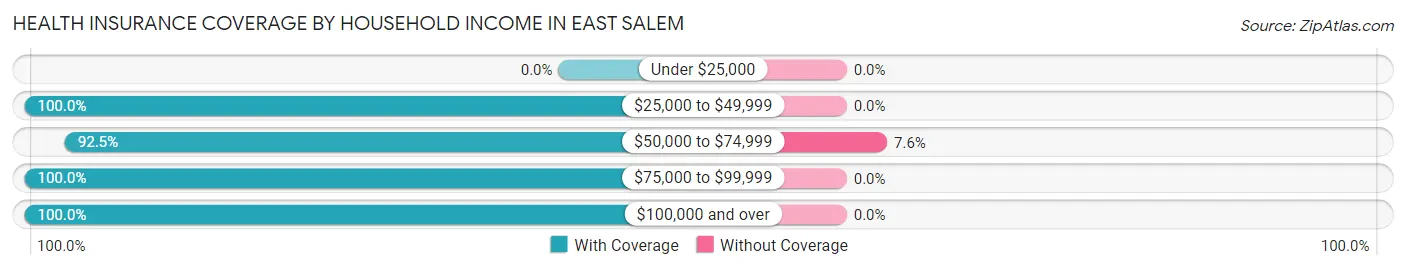
| Household Income | With Coverage | Without Coverage |
| Under $25,000 | 0 (0.0%) | 0 (0.0%) |
| $25,000 to $49,999 | 37 (100.0%) | 0 (0.0%) |
| $50,000 to $74,999 | 49 (92.4%) | 4 (7.5%) |
| $75,000 to $99,999 | 33 (100.0%) | 0 (0.0%) |
| $100,000 and over | 18 (100.0%) | 0 (0.0%) |
Public vs Private Health Insurance Coverage by Age in East Salem
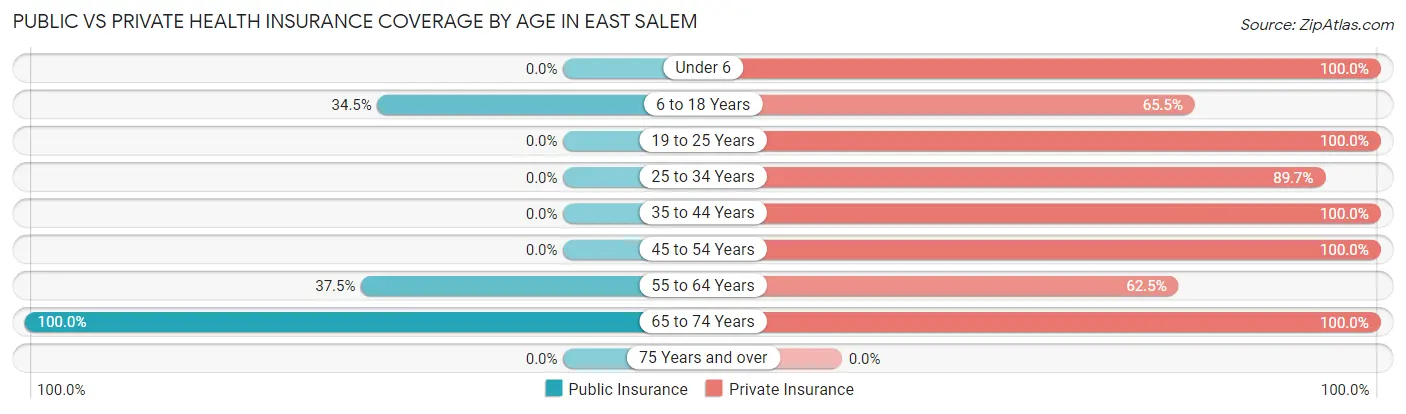
| Age Bracket | Public Insurance | Private Insurance |
| Under 6 | 0 (0.0%) | 16 (100.0%) |
| 6 to 18 Years | 10 (34.5%) | 19 (65.5%) |
| 19 to 25 Years | 0 (0.0%) | 10 (100.0%) |
| 25 to 34 Years | 0 (0.0%) | 35 (89.7%) |
| 35 to 44 Years | 0 (0.0%) | 25 (100.0%) |
| 45 to 54 Years | 0 (0.0%) | 11 (100.0%) |
| 55 to 64 Years | 3 (37.5%) | 5 (62.5%) |
| 65 to 74 Years | 3 (100.0%) | 3 (100.0%) |
| 75 Years and over | 0 (0.0%) | 0 (0.0%) |
| Total | 16 (11.4%) | 124 (87.9%) |
Disability Status by Sex by Age in East Salem
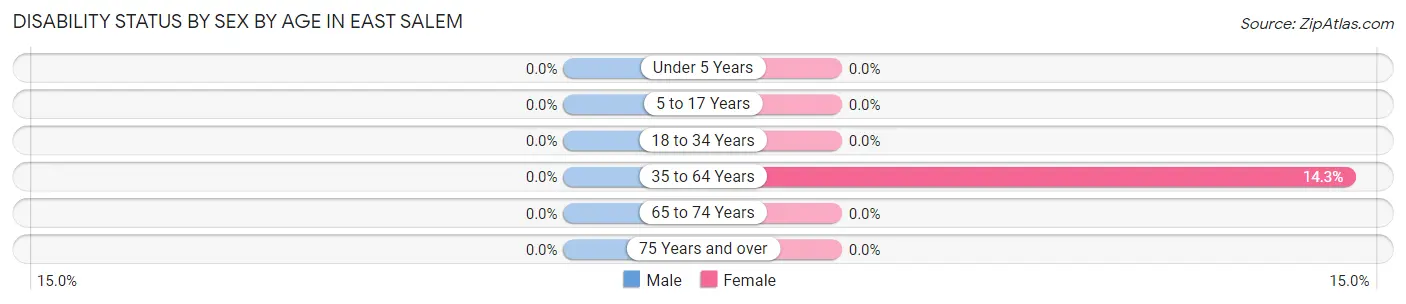
| Age Bracket | Male | Female |
| Under 5 Years | 0 (0.0%) | 0 (0.0%) |
| 5 to 17 Years | 0 (0.0%) | 0 (0.0%) |
| 18 to 34 Years | 0 (0.0%) | 0 (0.0%) |
| 35 to 64 Years | 0 (0.0%) | 3 (14.3%) |
| 65 to 74 Years | 0 (0.0%) | 0 (0.0%) |
| 75 Years and over | 0 (0.0%) | 0 (0.0%) |
Disability Class by Sex by Age in East Salem
Disability Class: Hearing Difficulty
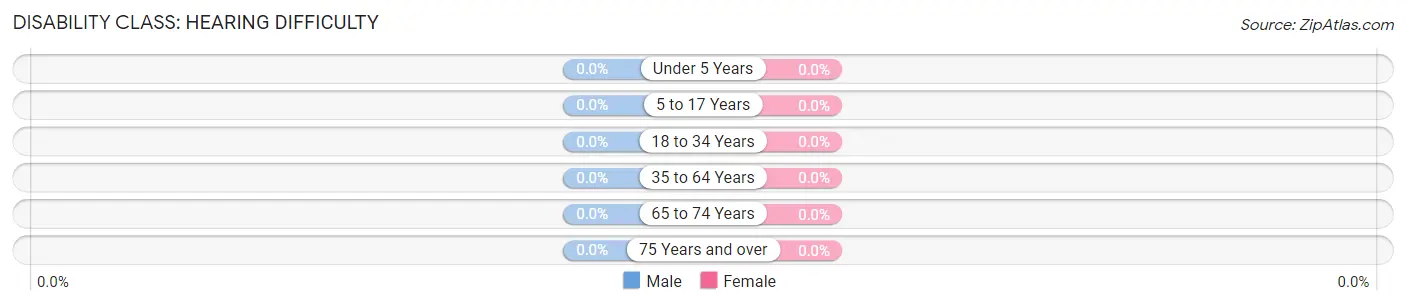
| Age Bracket | Male | Female |
| Under 5 Years | 0 (0.0%) | 0 (0.0%) |
| 5 to 17 Years | 0 (0.0%) | 0 (0.0%) |
| 18 to 34 Years | 0 (0.0%) | 0 (0.0%) |
| 35 to 64 Years | 0 (0.0%) | 0 (0.0%) |
| 65 to 74 Years | 0 (0.0%) | 0 (0.0%) |
| 75 Years and over | 0 (0.0%) | 0 (0.0%) |
Disability Class: Vision Difficulty
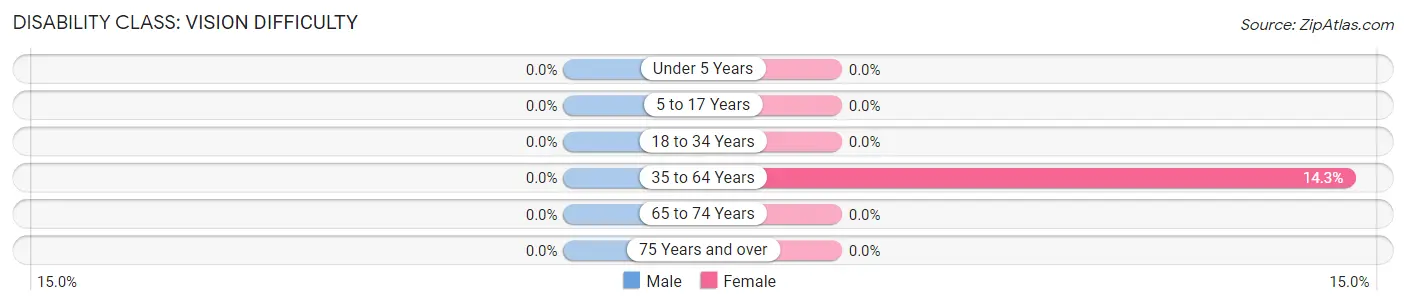
| Age Bracket | Male | Female |
| Under 5 Years | 0 (0.0%) | 0 (0.0%) |
| 5 to 17 Years | 0 (0.0%) | 0 (0.0%) |
| 18 to 34 Years | 0 (0.0%) | 0 (0.0%) |
| 35 to 64 Years | 0 (0.0%) | 3 (14.3%) |
| 65 to 74 Years | 0 (0.0%) | 0 (0.0%) |
| 75 Years and over | 0 (0.0%) | 0 (0.0%) |
Disability Class: Cognitive Difficulty
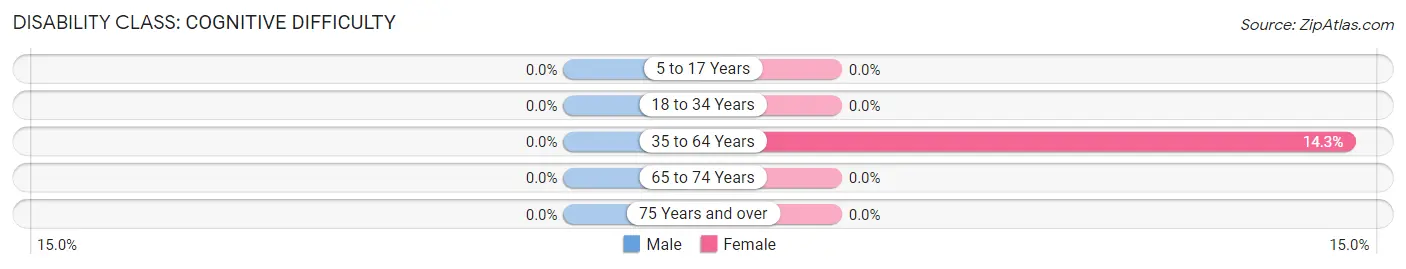
| Age Bracket | Male | Female |
| 5 to 17 Years | 0 (0.0%) | 0 (0.0%) |
| 18 to 34 Years | 0 (0.0%) | 0 (0.0%) |
| 35 to 64 Years | 0 (0.0%) | 3 (14.3%) |
| 65 to 74 Years | 0 (0.0%) | 0 (0.0%) |
| 75 Years and over | 0 (0.0%) | 0 (0.0%) |
Disability Class: Ambulatory Difficulty
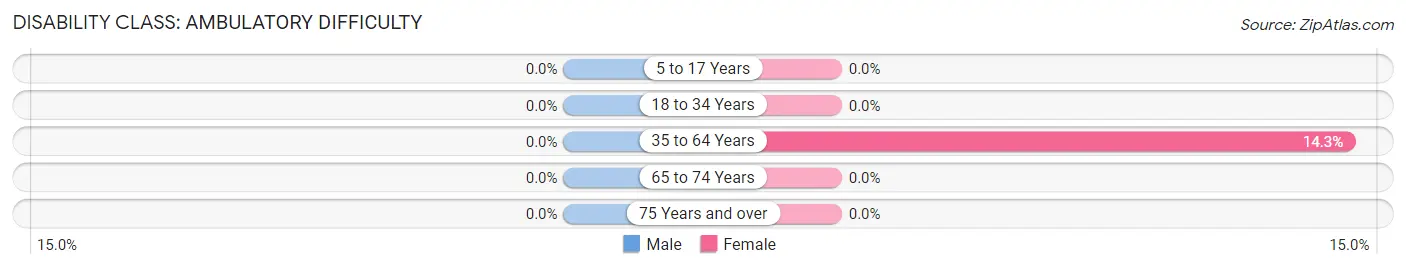
| Age Bracket | Male | Female |
| 5 to 17 Years | 0 (0.0%) | 0 (0.0%) |
| 18 to 34 Years | 0 (0.0%) | 0 (0.0%) |
| 35 to 64 Years | 0 (0.0%) | 3 (14.3%) |
| 65 to 74 Years | 0 (0.0%) | 0 (0.0%) |
| 75 Years and over | 0 (0.0%) | 0 (0.0%) |
Disability Class: Self-Care Difficulty
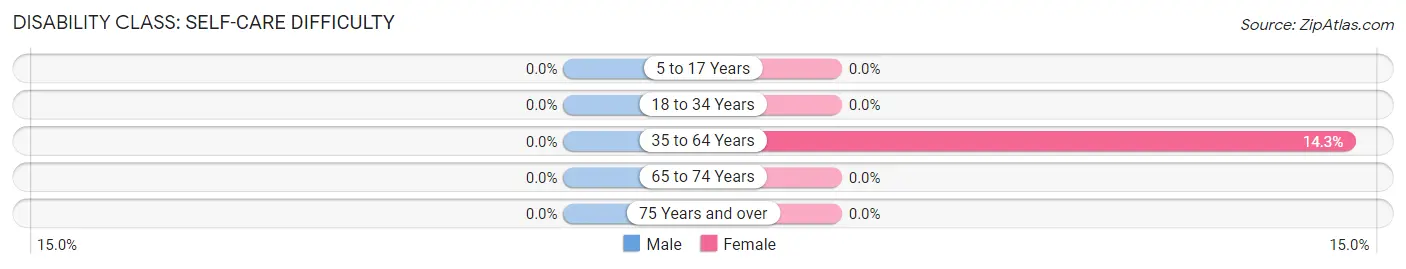
| Age Bracket | Male | Female |
| 5 to 17 Years | 0 (0.0%) | 0 (0.0%) |
| 18 to 34 Years | 0 (0.0%) | 0 (0.0%) |
| 35 to 64 Years | 0 (0.0%) | 3 (14.3%) |
| 65 to 74 Years | 0 (0.0%) | 0 (0.0%) |
| 75 Years and over | 0 (0.0%) | 0 (0.0%) |
Technology Access in East Salem
Computing Device Access in East Salem
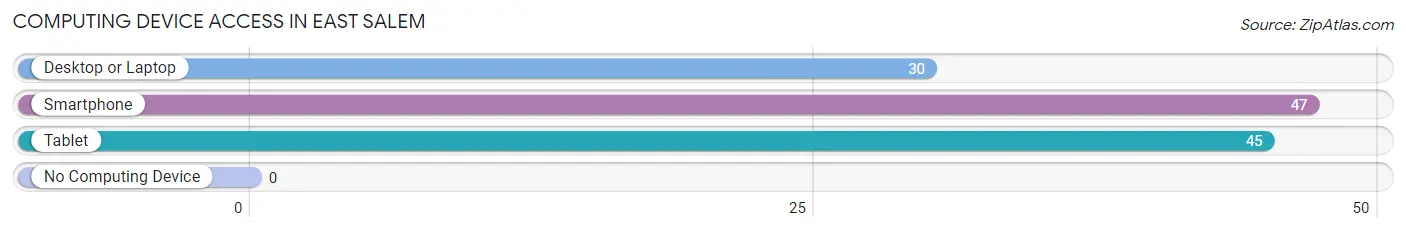
| Device Type | # Households | % Households |
| Desktop or Laptop | 30 | 60.0% |
| Smartphone | 47 | 94.0% |
| Tablet | 45 | 90.0% |
| No Computing Device | 0 | 0.0% |
| Total | 50 | 100.0% |
Internet Access in East Salem
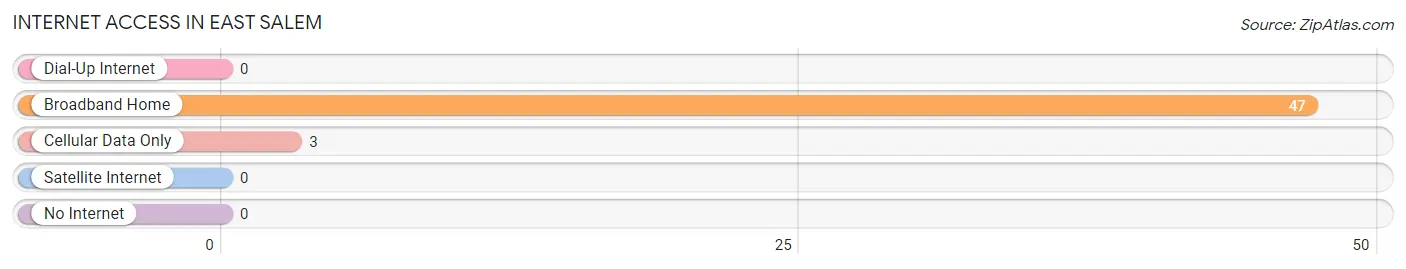
| Internet Type | # Households | % Households |
| Dial-Up Internet | 0 | 0.0% |
| Broadband Home | 47 | 94.0% |
| Cellular Data Only | 3 | 6.0% |
| Satellite Internet | 0 | 0.0% |
| No Internet | 0 | 0.0% |
| Total | 50 | 100.0% |
East Salem Summary
Salem Township is located in the northwest corner of Westmoreland County, Pennsylvania. It is bordered by the townships of Bell, Donegal, and Ligonier. The township is home to the unincorporated communities of East Salem and West Salem.
History
The area that is now Salem Township was first settled in the late 1700s by German and Scotch-Irish immigrants. The first settlers were mostly farmers, and the area was known for its fertile soil and abundant natural resources. The township was officially established in 1845, and the first township meeting was held in 1846.
The township was named after Salem, Massachusetts, which was the hometown of many of the early settlers. The township was divided into two parts, East Salem and West Salem, in 1851.
Geography
Salem Township is located in the northwest corner of Westmoreland County, Pennsylvania. It is bordered by the townships of Bell, Donegal, and Ligonier. The township is home to the unincorporated communities of East Salem and West Salem.
The township is located in the Laurel Highlands region of Pennsylvania. The terrain is mostly hilly and forested, with some open fields and meadows. The highest point in the township is located at the intersection of East Salem and West Salem roads, at an elevation of 1,890 feet.
The township is home to several streams, including the Loyalhanna Creek, which flows through the township from east to west. The Loyalhanna Creek is a tributary of the Allegheny River.
Economy
The economy of Salem Township is largely based on agriculture. The township is home to several farms, which produce a variety of crops, including corn, soybeans, hay, and wheat. The township also has several small businesses, including a sawmill, a feed mill, and a lumber yard.
The township is also home to several recreational activities, including fishing, hunting, and camping. The Loyalhanna Creek is a popular destination for fishing and canoeing.
Demographics
As of the 2010 census, the population of Salem Township was 1,845. The racial makeup of the township was 97.3% White, 0.7% African American, 0.2% Native American, 0.2% Asian, and 1.6% from other races. Hispanic or Latino of any race were 1.2% of the population.
The median household income in the township was $45,000, and the median family income was $50,000. The per capita income was $20,000. About 8.3% of families and 10.2% of the population were below the poverty line.
Common Questions
What is Per Capita Income in East Salem?
Per Capita income in East Salem is $25,072.
What is the Median Family Income in East Salem?
Median Family Income in East Salem is $73,750.
What is the Median Household income in East Salem?
Median Household Income in East Salem is $65,357.
What is Income or Wage Gap in East Salem?
Income or Wage Gap in East Salem is 4.9%.
Women in East Salem earn 95.1 cents for every dollar earned by a man.
What is Inequality or Gini Index in East Salem?
Inequality or Gini Index in East Salem is 0.27.
What is the Total Population of East Salem?
Total Population of East Salem is 141.
What is the Total Male Population of East Salem?
Total Male Population of East Salem is 61.
What is the Total Female Population of East Salem?
Total Female Population of East Salem is 80.
What is the Ratio of Males per 100 Females in East Salem?
There are 76.25 Males per 100 Females in East Salem.
What is the Ratio of Females per 100 Males in East Salem?
There are 131.15 Females per 100 Males in East Salem.
What is the Median Population Age in East Salem?
Median Population Age in East Salem is 26.8 Years.
What is the Average Family Size in East Salem
Average Family Size in East Salem is 4.1 People.
What is the Average Household Size in East Salem
Average Household Size in East Salem is 2.8 People.
How Large is the Labor Force in East Salem?
There are 85 People in the Labor Forcein in East Salem.
What is the Percentage of People in the Labor Force in East Salem?
88.5% of People are in the Labor Force in East Salem.