Orbisonia borough, PA Map & Demographics
Orbisonia borough Overview
$24,005
PER CAPITA INCOME
$80,982
AVG FAMILY INCOME
$34,861
AVG HOUSEHOLD INCOME
0.44
INEQUALITY / GINI INDEX
481
TOTAL POPULATION
222
MALE POPULATION
259
FEMALE POPULATION
85.71
MALES / 100 FEMALES
116.67
FEMALES / 100 MALES
40.5
MEDIAN AGE
3.5
AVG FAMILY SIZE
2.5
AVG HOUSEHOLD SIZE
165
LABOR FORCE [ PEOPLE ]
45.6%
PERCENT IN LABOR FORCE
1.8%
UNEMPLOYMENT RATE
Income in Orbisonia borough
Income Overview in Orbisonia borough
Per Capita Income in Orbisonia borough is $24,005, while median incomes of families and households are $80,982 and $34,861 respectively.
| Characteristic | Number | Measure |
| Per Capita Income | 481 | $24,005 |
| Median Family Income | 103 | $80,982 |
| Mean Family Income | 103 | $79,597 |
| Median Household Income | 189 | $34,861 |
| Mean Household Income | 189 | $56,710 |
| Income Deficit | 103 | $0 |
| Wage / Income Gap (%) | 481 | 0.00% |
| Wage / Income Gap ($) | 481 | 100.00¢ per $1 |
| Gini / Inequality Index | 481 | 0.44 |
Earnings by Sex in Orbisonia borough
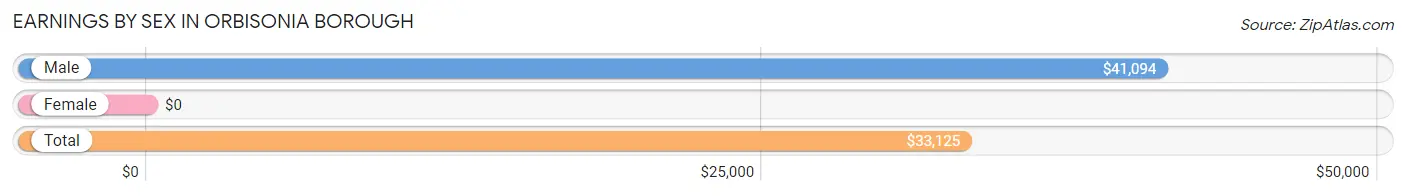
| Sex | Number | Average Earnings |
| Male | 105 (58.0%) | $41,094 |
| Female | 76 (42.0%) | $0 |
| Total | 181 (100.0%) | $33,125 |
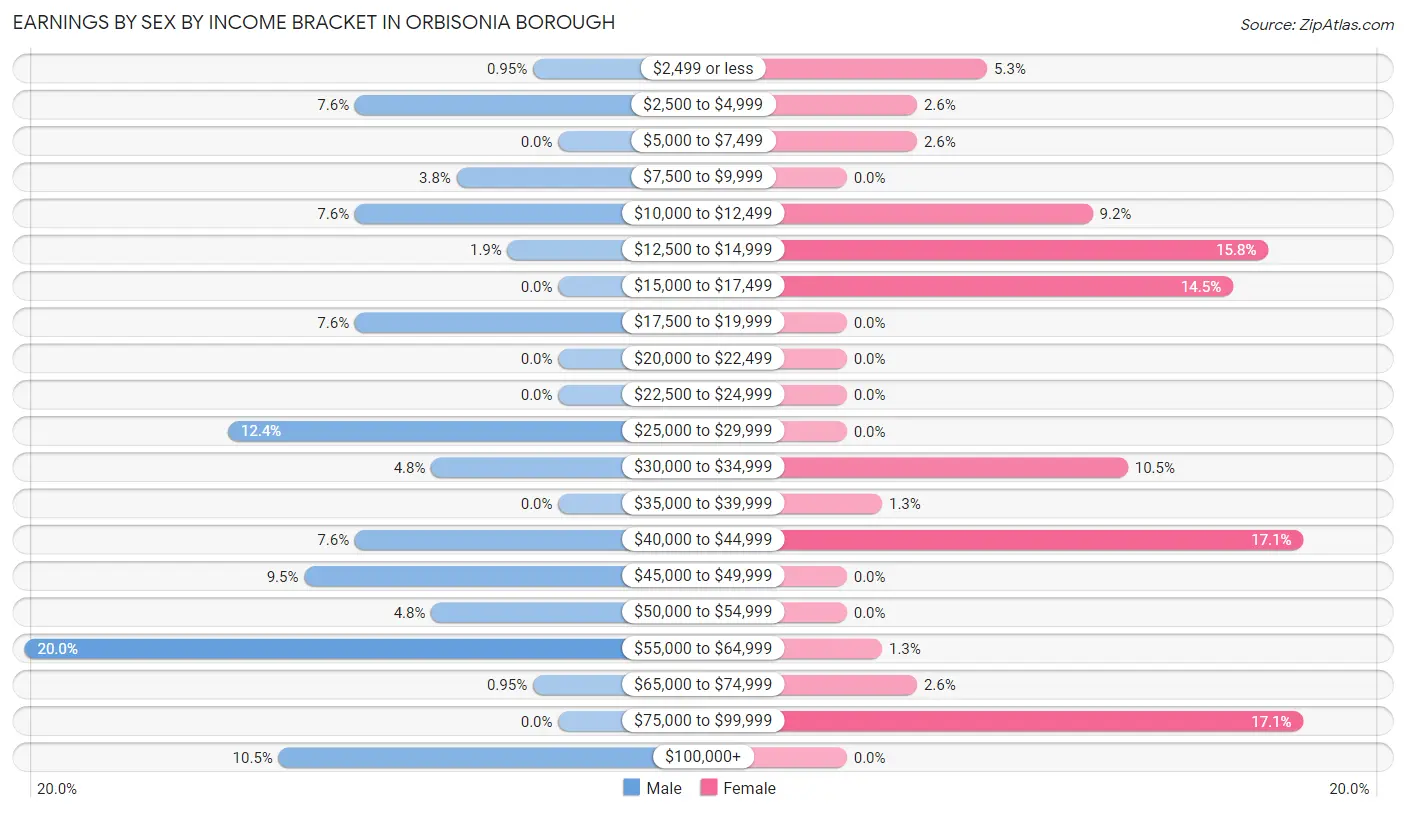
Earnings by Sex by Income Bracket in Orbisonia borough
The most common earnings brackets in Orbisonia borough are $55,000 to $64,999 for men (21 | 20.0%) and $40,000 to $44,999 for women (13 | 17.1%).
| Income | Male | Female |
| $2,499 or less | 1 (0.9%) | 4 (5.3%) |
| $2,500 to $4,999 | 8 (7.6%) | 2 (2.6%) |
| $5,000 to $7,499 | 0 (0.0%) | 2 (2.6%) |
| $7,500 to $9,999 | 4 (3.8%) | 0 (0.0%) |
| $10,000 to $12,499 | 8 (7.6%) | 7 (9.2%) |
| $12,500 to $14,999 | 2 (1.9%) | 12 (15.8%) |
| $15,000 to $17,499 | 0 (0.0%) | 11 (14.5%) |
| $17,500 to $19,999 | 8 (7.6%) | 0 (0.0%) |
| $20,000 to $22,499 | 0 (0.0%) | 0 (0.0%) |
| $22,500 to $24,999 | 0 (0.0%) | 0 (0.0%) |
| $25,000 to $29,999 | 13 (12.4%) | 0 (0.0%) |
| $30,000 to $34,999 | 5 (4.8%) | 8 (10.5%) |
| $35,000 to $39,999 | 0 (0.0%) | 1 (1.3%) |
| $40,000 to $44,999 | 8 (7.6%) | 13 (17.1%) |
| $45,000 to $49,999 | 10 (9.5%) | 0 (0.0%) |
| $50,000 to $54,999 | 5 (4.8%) | 0 (0.0%) |
| $55,000 to $64,999 | 21 (20.0%) | 1 (1.3%) |
| $65,000 to $74,999 | 1 (0.9%) | 2 (2.6%) |
| $75,000 to $99,999 | 0 (0.0%) | 13 (17.1%) |
| $100,000+ | 11 (10.5%) | 0 (0.0%) |
| Total | 105 (100.0%) | 76 (100.0%) |
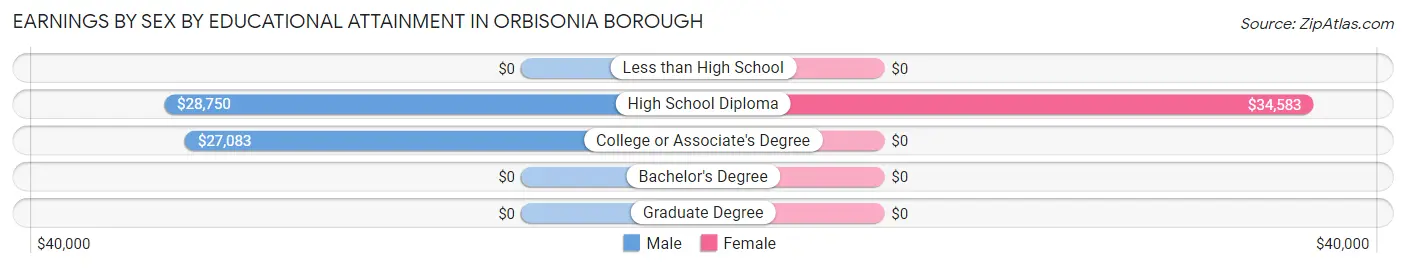
Earnings by Sex by Educational Attainment in Orbisonia borough
Average earnings in Orbisonia borough are $40,313 for men and $32,708 for women, a difference of 18.9%. Men with an educational attainment of high school diploma enjoy the highest average annual earnings of $28,750, while those with college or associate's degree education earn the least with $27,083. Women with an educational attainment of high school diploma earn the most with the average annual earnings of $34,583, while those with high school diploma education have the smallest earnings of $34,583.
| Educational Attainment | Male Income | Female Income |
| Less than High School | - | - |
| High School Diploma | $28,750 | $34,583 |
| College or Associate's Degree | $27,083 | $0 |
| Bachelor's Degree | - | - |
| Graduate Degree | - | - |
| Total | $40,313 | $32,708 |
Family Income in Orbisonia borough
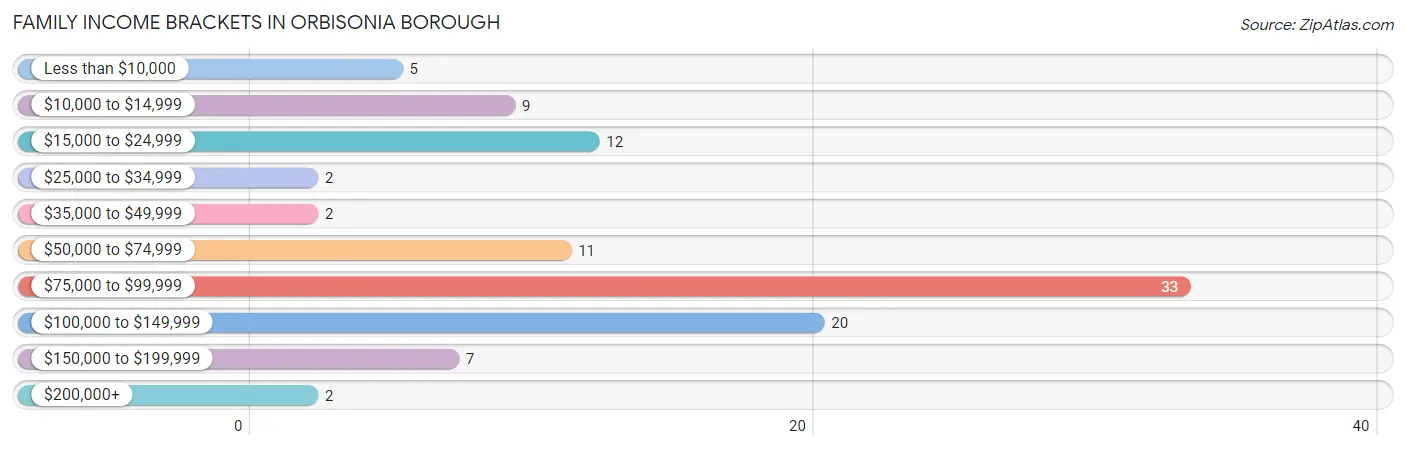
Family Income Brackets in Orbisonia borough
According to the Orbisonia borough family income data, there are 33 families falling into the $75,000 to $99,999 income range, which is the most common income bracket and makes up 32.0% of all families. Conversely, the $25,000 to $34,999 income bracket is the least frequent group with only 2 families (1.9%) belonging to this category.
| Income Bracket | # Families | % Families |
| Less than $10,000 | 5 | 4.9% |
| $10,000 to $14,999 | 9 | 8.7% |
| $15,000 to $24,999 | 12 | 11.7% |
| $25,000 to $34,999 | 2 | 1.9% |
| $35,000 to $49,999 | 2 | 1.9% |
| $50,000 to $74,999 | 11 | 10.7% |
| $75,000 to $99,999 | 33 | 32.0% |
| $100,000 to $149,999 | 20 | 19.4% |
| $150,000 to $199,999 | 7 | 6.8% |
| $200,000+ | 2 | 1.9% |
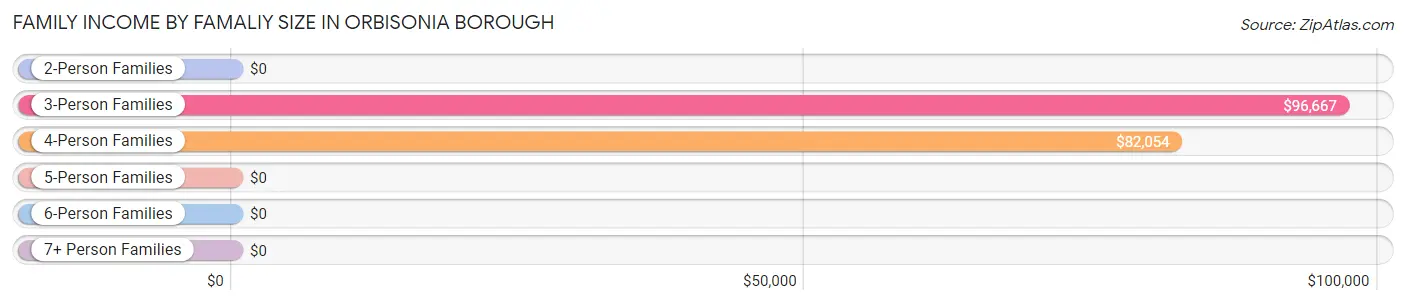
Family Income by Famaliy Size in Orbisonia borough
3-person families (14 | 13.6%) account for the highest median family income in Orbisonia borough with $96,667 per family, while 3-person families (14 | 13.6%) have the highest median income of $32,222 per family member.
| Income Bracket | # Families | Median Income |
| 2-Person Families | 41 (39.8%) | $0 |
| 3-Person Families | 14 (13.6%) | $96,667 |
| 4-Person Families | 31 (30.1%) | $82,054 |
| 5-Person Families | 9 (8.7%) | $0 |
| 6-Person Families | 8 (7.8%) | $0 |
| 7+ Person Families | 0 (0.0%) | $0 |
| Total | 103 (100.0%) | $80,982 |
Family Income by Number of Earners in Orbisonia borough
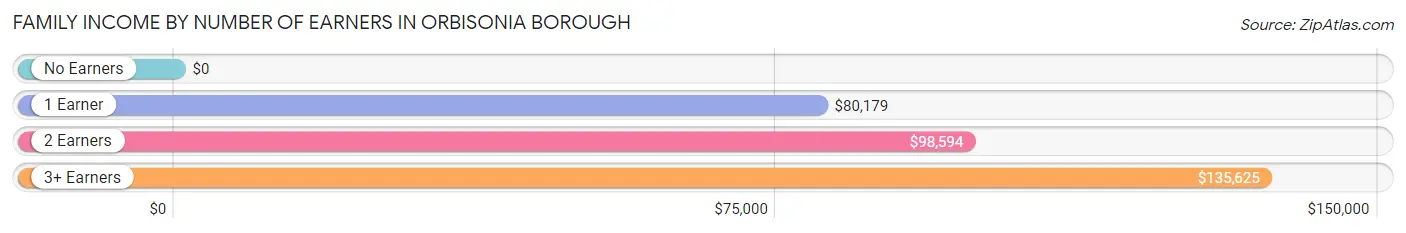
| Number of Earners | # Families | Median Income |
| No Earners | 13 (12.6%) | $0 |
| 1 Earner | 46 (44.7%) | $80,179 |
| 2 Earners | 31 (30.1%) | $98,594 |
| 3+ Earners | 13 (12.6%) | $135,625 |
| Total | 103 (100.0%) | $80,982 |
Household Income in Orbisonia borough
Household Income Brackets in Orbisonia borough
With 36 households falling in the category, the $15,000 to $24,999 income range is the most frequent in Orbisonia borough, accounting for 19.1% of all households. In contrast, only 2 households (1.1%) fall into the $200,000+ income bracket, making it the least populous group.
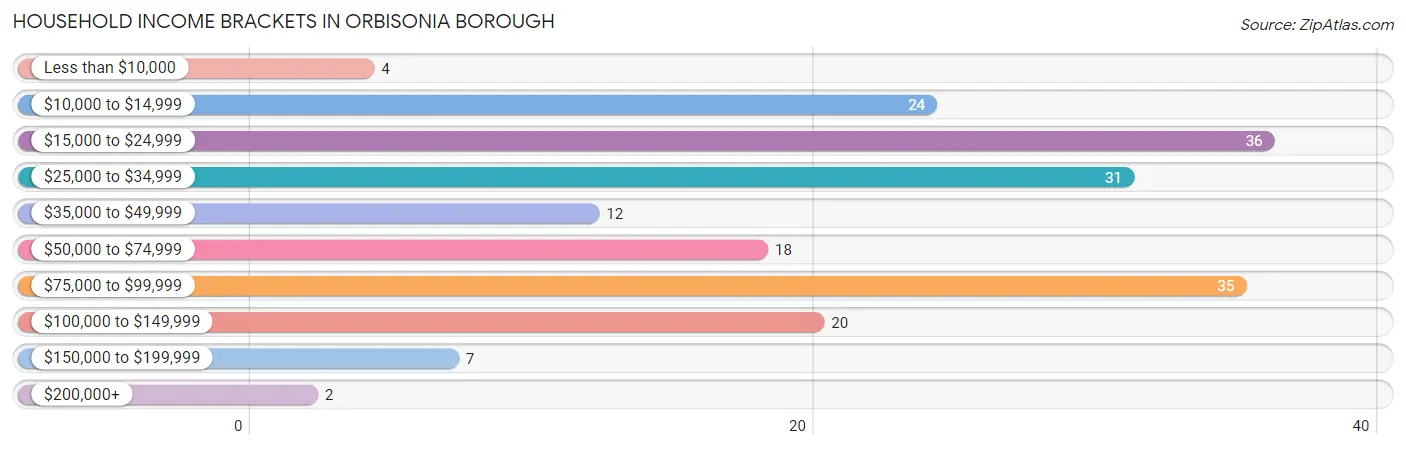
| Income Bracket | # Households | % Households |
| Less than $10,000 | 4 | 2.1% |
| $10,000 to $14,999 | 24 | 12.7% |
| $15,000 to $24,999 | 36 | 19.0% |
| $25,000 to $34,999 | 31 | 16.4% |
| $35,000 to $49,999 | 12 | 6.3% |
| $50,000 to $74,999 | 18 | 9.5% |
| $75,000 to $99,999 | 35 | 18.5% |
| $100,000 to $149,999 | 20 | 10.6% |
| $150,000 to $199,999 | 7 | 3.7% |
| $200,000+ | 2 | 1.1% |
Household Income by Householder Age in Orbisonia borough
The median household income in Orbisonia borough is $34,861, with the highest median household income of $50,833 found in the 25 to 44 years age bracket for the primary householder. A total of 42 households (22.2%) fall into this category. Meanwhile, the 15 to 24 years age bracket for the primary householder has the lowest median household income of $0, with 2 households (1.1%) in this group.
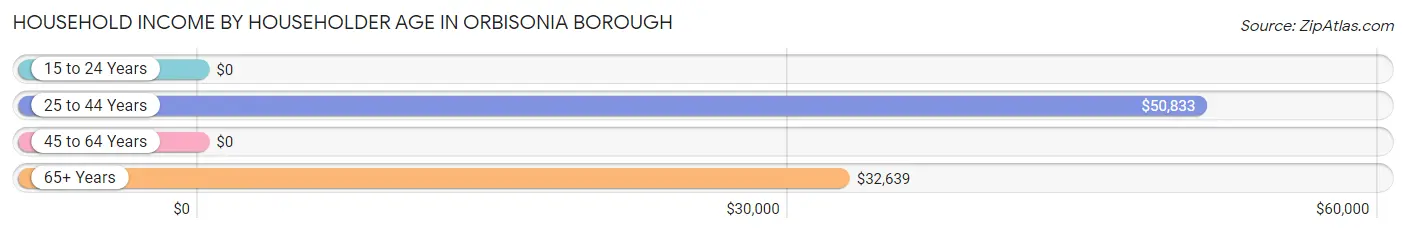
| Income Bracket | # Households | Median Income |
| 15 to 24 Years | 2 (1.1%) | $0 |
| 25 to 44 Years | 42 (22.2%) | $50,833 |
| 45 to 64 Years | 76 (40.2%) | $0 |
| 65+ Years | 69 (36.5%) | $32,639 |
| Total | 189 (100.0%) | $34,861 |
Poverty in Orbisonia borough
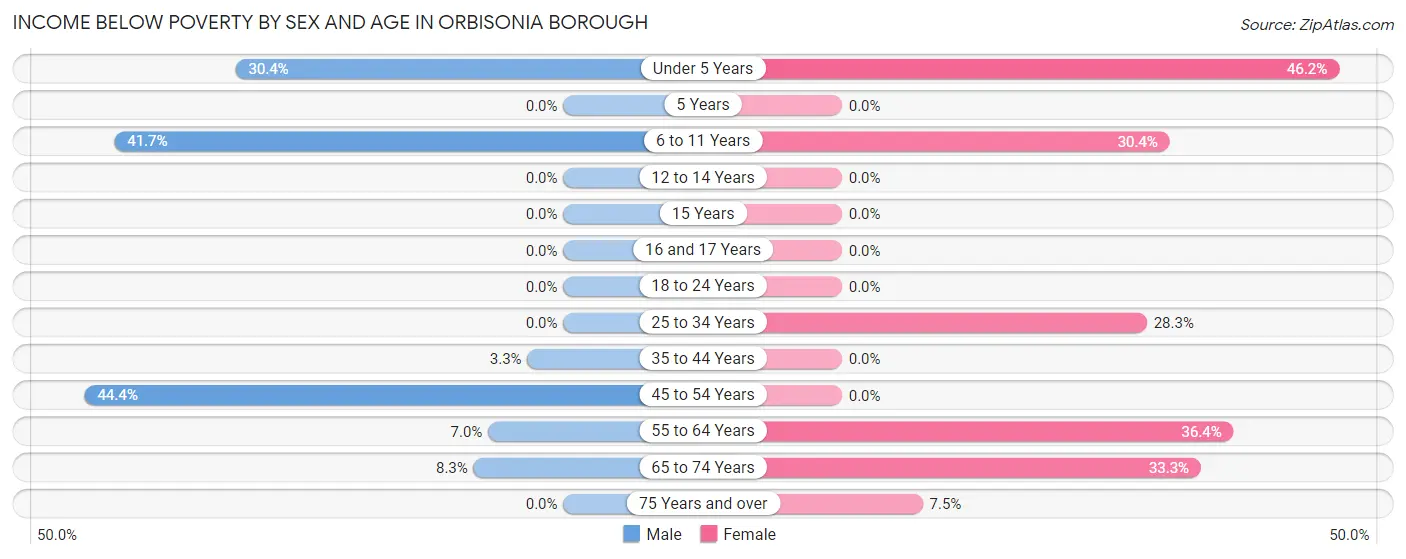
Income Below Poverty by Sex and Age in Orbisonia borough
With 15.8% poverty level for males and 22.8% for females among the residents of Orbisonia borough, 45 to 54 year old males and under 5 year old females are the most vulnerable to poverty, with 12 males (44.4%) and 18 females (46.2%) in their respective age groups living below the poverty level.
| Age Bracket | Male | Female |
| Under 5 Years | 7 (30.4%) | 18 (46.2%) |
| 5 Years | 0 (0.0%) | 0 (0.0%) |
| 6 to 11 Years | 10 (41.7%) | 7 (30.4%) |
| 12 to 14 Years | 0 (0.0%) | 0 (0.0%) |
| 15 Years | 0 (0.0%) | 0 (0.0%) |
| 16 and 17 Years | 0 (0.0%) | 0 (0.0%) |
| 18 to 24 Years | 0 (0.0%) | 0 (0.0%) |
| 25 to 34 Years | 0 (0.0%) | 15 (28.3%) |
| 35 to 44 Years | 1 (3.3%) | 0 (0.0%) |
| 45 to 54 Years | 12 (44.4%) | 0 (0.0%) |
| 55 to 64 Years | 3 (7.0%) | 8 (36.4%) |
| 65 to 74 Years | 2 (8.3%) | 8 (33.3%) |
| 75 Years and over | 0 (0.0%) | 3 (7.5%) |
| Total | 35 (15.8%) | 59 (22.8%) |
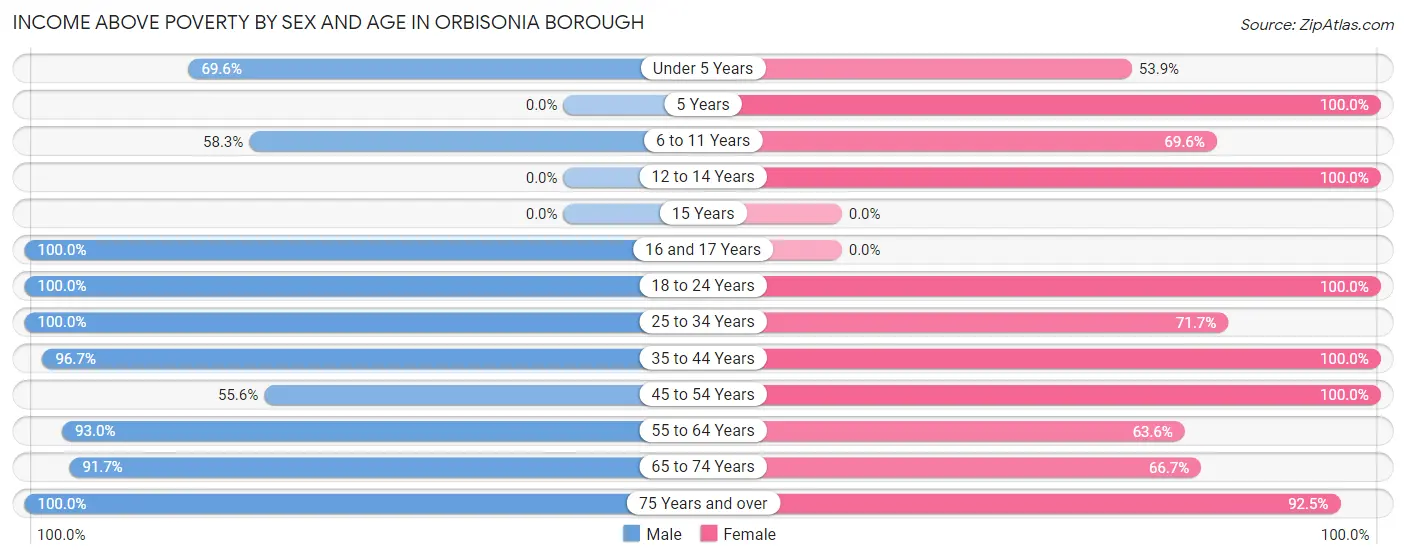
Income Above Poverty by Sex and Age in Orbisonia borough
According to the poverty statistics in Orbisonia borough, males aged 16 and 17 years and females aged 5 years are the age groups that are most secure financially, with 100.0% of males and 100.0% of females in these age groups living above the poverty line.
| Age Bracket | Male | Female |
| Under 5 Years | 16 (69.6%) | 21 (53.8%) |
| 5 Years | 0 (0.0%) | 3 (100.0%) |
| 6 to 11 Years | 14 (58.3%) | 16 (69.6%) |
| 12 to 14 Years | 0 (0.0%) | 7 (100.0%) |
| 15 Years | 0 (0.0%) | 0 (0.0%) |
| 16 and 17 Years | 4 (100.0%) | 0 (0.0%) |
| 18 to 24 Years | 15 (100.0%) | 5 (100.0%) |
| 25 to 34 Years | 20 (100.0%) | 38 (71.7%) |
| 35 to 44 Years | 29 (96.7%) | 19 (100.0%) |
| 45 to 54 Years | 15 (55.6%) | 24 (100.0%) |
| 55 to 64 Years | 40 (93.0%) | 14 (63.6%) |
| 65 to 74 Years | 22 (91.7%) | 16 (66.7%) |
| 75 Years and over | 12 (100.0%) | 37 (92.5%) |
| Total | 187 (84.2%) | 200 (77.2%) |
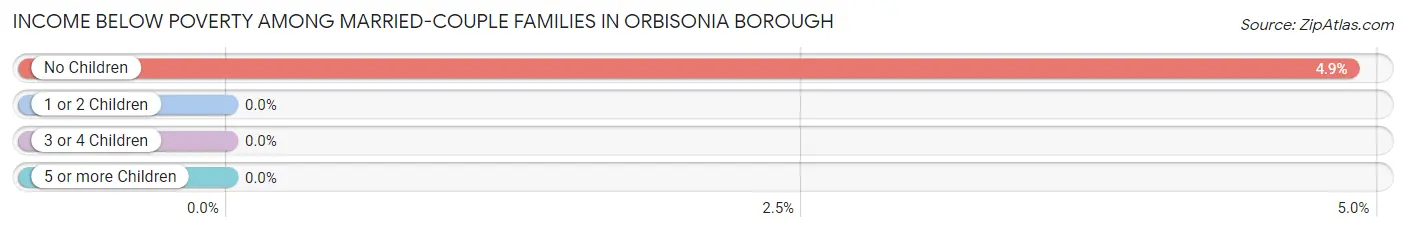
Income Below Poverty Among Married-Couple Families in Orbisonia borough
The poverty statistics for married-couple families in Orbisonia borough show that 2.9% or 2 of the total 68 families live below the poverty line. Families with no children have the highest poverty rate of 4.9%, comprising of 2 families. On the other hand, families with 1 or 2 children have the lowest poverty rate of 0.0%, which includes 0 families.
| Children | Above Poverty | Below Poverty |
| No Children | 39 (95.1%) | 2 (4.9%) |
| 1 or 2 Children | 17 (100.0%) | 0 (0.0%) |
| 3 or 4 Children | 10 (100.0%) | 0 (0.0%) |
| 5 or more Children | 0 (0.0%) | 0 (0.0%) |
| Total | 66 (97.1%) | 2 (2.9%) |
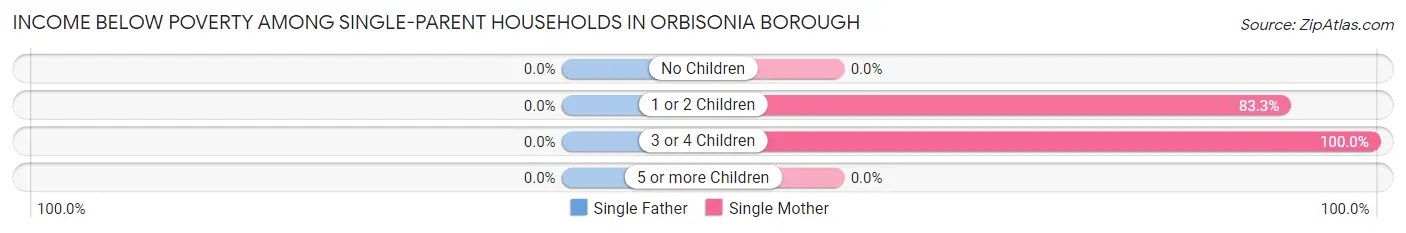
Income Below Poverty Among Single-Parent Households in Orbisonia borough
| Children | Single Father | Single Mother |
| No Children | 0 (0.0%) | 0 (0.0%) |
| 1 or 2 Children | 0 (0.0%) | 10 (83.3%) |
| 3 or 4 Children | 0 (0.0%) | 5 (100.0%) |
| 5 or more Children | 0 (0.0%) | 0 (0.0%) |
| Total | 0 (0.0%) | 15 (88.2%) |
Income Below Poverty Among Married-Couple vs Single-Parent Households in Orbisonia borough
The poverty data for Orbisonia borough shows that 2 of the married-couple family households (2.9%) and 15 of the single-parent households (42.9%) are living below the poverty level. Within the married-couple family households, those with no children have the highest poverty rate, with 2 households (4.9%) falling below the poverty line. Among the single-parent households, those with 3 or 4 children have the highest poverty rate, with 5 household (100.0%) living below poverty.
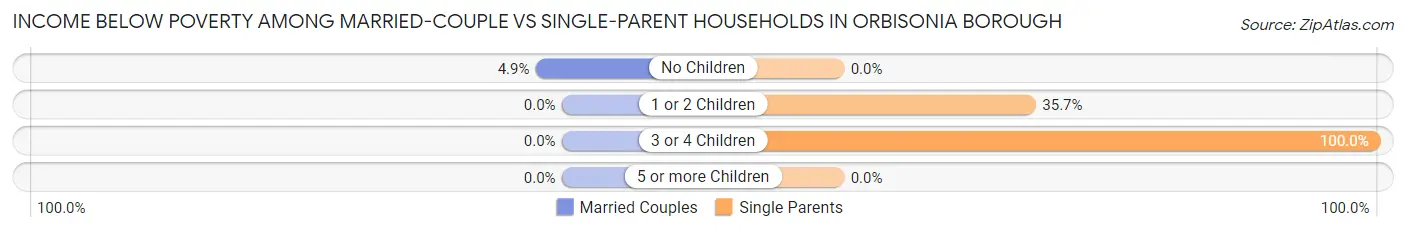
| Children | Married-Couple Families | Single-Parent Households |
| No Children | 2 (4.9%) | 0 (0.0%) |
| 1 or 2 Children | 0 (0.0%) | 10 (35.7%) |
| 3 or 4 Children | 0 (0.0%) | 5 (100.0%) |
| 5 or more Children | 0 (0.0%) | 0 (0.0%) |
| Total | 2 (2.9%) | 15 (42.9%) |
Race in Orbisonia borough
The most populous races in Orbisonia borough are White / Caucasian (473 | 98.3%), Hispanic or Latino (12 | 2.5%), and Black / African American (6 | 1.3%).
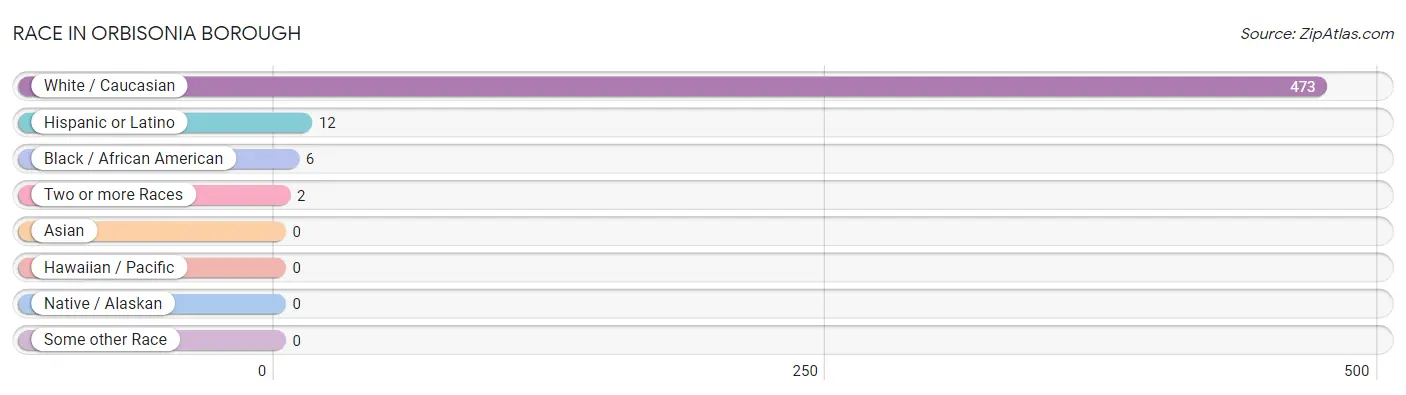
| Race | # Population | % Population |
| Asian | 0 | 0.0% |
| Black / African American | 6 | 1.3% |
| Hawaiian / Pacific | 0 | 0.0% |
| Hispanic or Latino | 12 | 2.5% |
| Native / Alaskan | 0 | 0.0% |
| White / Caucasian | 473 | 98.3% |
| Two or more Races | 2 | 0.4% |
| Some other Race | 0 | 0.0% |
| Total | 481 | 100.0% |
Ancestry in Orbisonia borough
The most populous ancestries reported in Orbisonia borough are German (185 | 38.5%), Italian (56 | 11.6%), Irish (50 | 10.4%), Scotch-Irish (46 | 9.6%), and English (21 | 4.4%), together accounting for 74.4% of all Orbisonia borough residents.
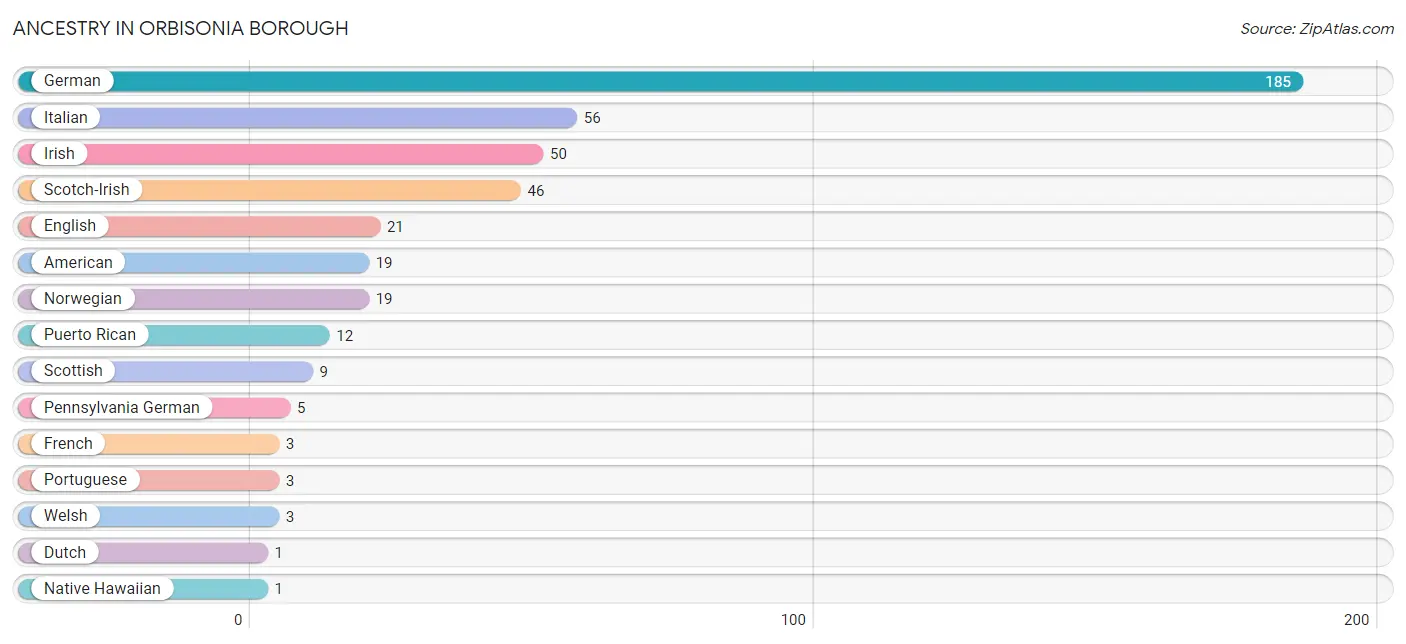
| Ancestry | # Population | % Population |
| American | 19 | 4.0% |
| Dutch | 1 | 0.2% |
| English | 21 | 4.4% |
| French | 3 | 0.6% |
| German | 185 | 38.5% |
| Irish | 50 | 10.4% |
| Italian | 56 | 11.6% |
| Native Hawaiian | 1 | 0.2% |
| Norwegian | 19 | 4.0% |
| Pennsylvania German | 5 | 1.0% |
| Portuguese | 3 | 0.6% |
| Puerto Rican | 12 | 2.5% |
| Scotch-Irish | 46 | 9.6% |
| Scottish | 9 | 1.9% |
| Welsh | 3 | 0.6% | View All 15 Rows |
Immigrants in Orbisonia borough

| Immigration Origin | # Population | % Population | View All 0 Rows |
Sex and Age in Orbisonia borough
Sex and Age in Orbisonia borough
The most populous age groups in Orbisonia borough are 55 to 59 Years (36 | 16.2%) for men and Under 5 Years (39 | 15.1%) for women.
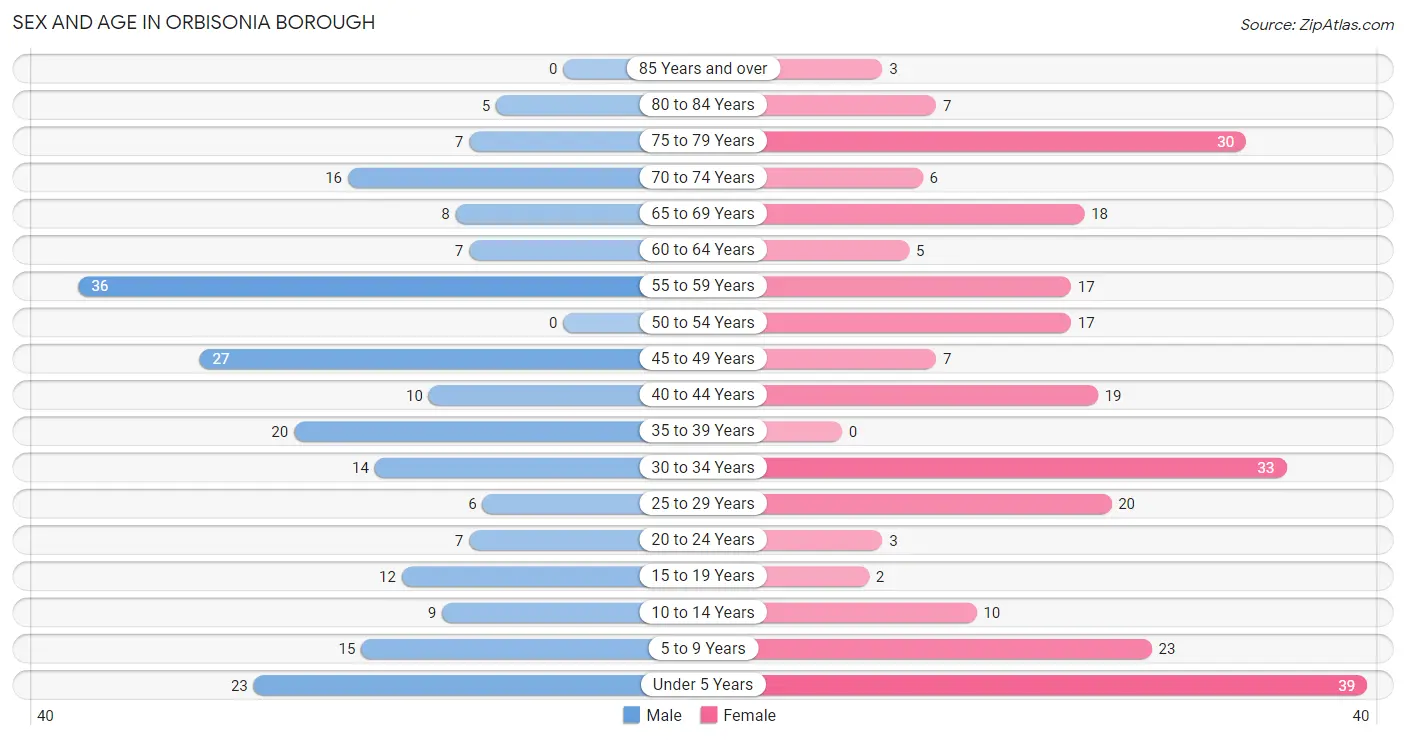
| Age Bracket | Male | Female |
| Under 5 Years | 23 (10.4%) | 39 (15.1%) |
| 5 to 9 Years | 15 (6.8%) | 23 (8.9%) |
| 10 to 14 Years | 9 (4.1%) | 10 (3.9%) |
| 15 to 19 Years | 12 (5.4%) | 2 (0.8%) |
| 20 to 24 Years | 7 (3.2%) | 3 (1.2%) |
| 25 to 29 Years | 6 (2.7%) | 20 (7.7%) |
| 30 to 34 Years | 14 (6.3%) | 33 (12.7%) |
| 35 to 39 Years | 20 (9.0%) | 0 (0.0%) |
| 40 to 44 Years | 10 (4.5%) | 19 (7.3%) |
| 45 to 49 Years | 27 (12.2%) | 7 (2.7%) |
| 50 to 54 Years | 0 (0.0%) | 17 (6.6%) |
| 55 to 59 Years | 36 (16.2%) | 17 (6.6%) |
| 60 to 64 Years | 7 (3.2%) | 5 (1.9%) |
| 65 to 69 Years | 8 (3.6%) | 18 (7.0%) |
| 70 to 74 Years | 16 (7.2%) | 6 (2.3%) |
| 75 to 79 Years | 7 (3.2%) | 30 (11.6%) |
| 80 to 84 Years | 5 (2.2%) | 7 (2.7%) |
| 85 Years and over | 0 (0.0%) | 3 (1.2%) |
| Total | 222 (100.0%) | 259 (100.0%) |
Families and Households in Orbisonia borough
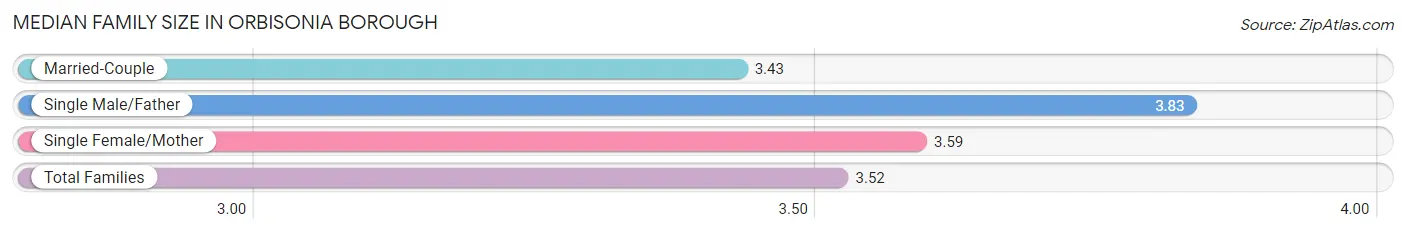
Median Family Size in Orbisonia borough
The median family size in Orbisonia borough is 3.52 persons per family, with single male/father families (18 | 17.5%) accounting for the largest median family size of 3.83 persons per family. On the other hand, married-couple families (68 | 66.0%) represent the smallest median family size with 3.43 persons per family.
| Family Type | # Families | Family Size |
| Married-Couple | 68 (66.0%) | 3.43 |
| Single Male/Father | 18 (17.5%) | 3.83 |
| Single Female/Mother | 17 (16.5%) | 3.59 |
| Total Families | 103 (100.0%) | 3.52 |
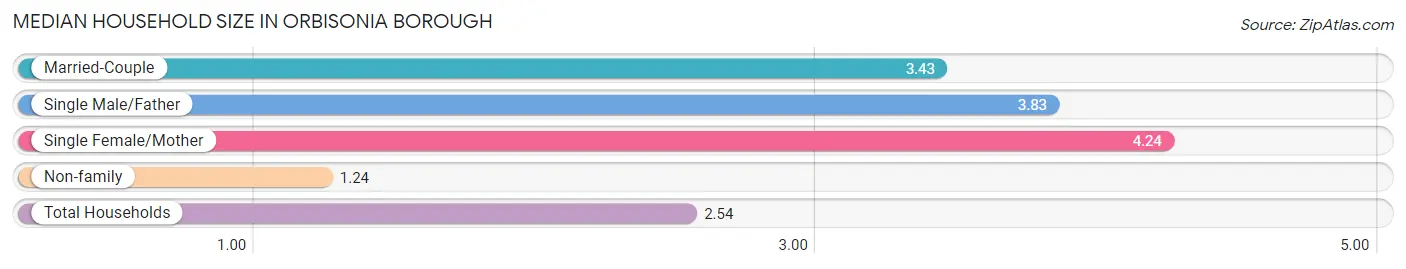
Median Household Size in Orbisonia borough
The median household size in Orbisonia borough is 2.54 persons per household, with single female/mother households (17 | 9.0%) accounting for the largest median household size of 4.24 persons per household. non-family households (86 | 45.5%) represent the smallest median household size with 1.24 persons per household.
| Household Type | # Households | Household Size |
| Married-Couple | 68 (36.0%) | 3.43 |
| Single Male/Father | 18 (9.5%) | 3.83 |
| Single Female/Mother | 17 (9.0%) | 4.24 |
| Non-family | 86 (45.5%) | 1.24 |
| Total Households | 189 (100.0%) | 2.54 |
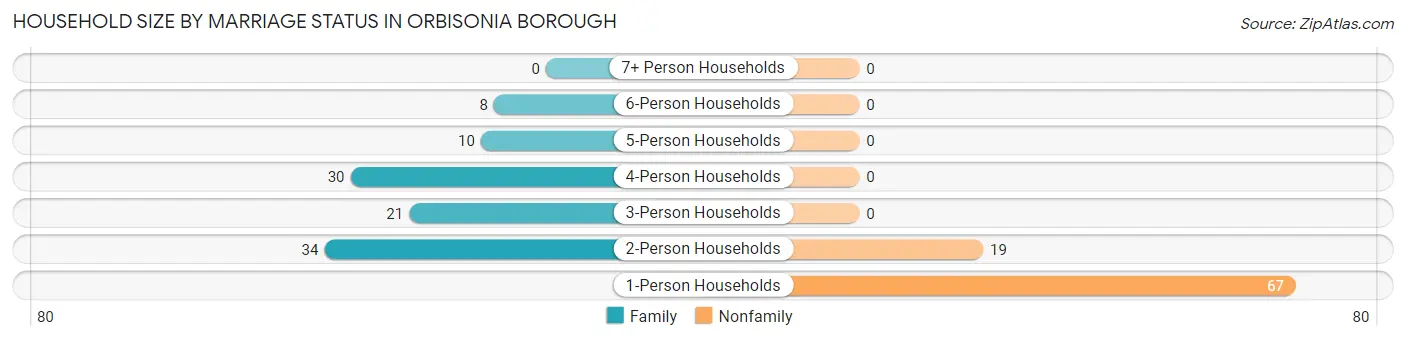
Household Size by Marriage Status in Orbisonia borough
Out of a total of 189 households in Orbisonia borough, 103 (54.5%) are family households, while 86 (45.5%) are nonfamily households. The most numerous type of family households are 2-person households, comprising 34, and the most common type of nonfamily households are 1-person households, comprising 67.
| Household Size | Family Households | Nonfamily Households |
| 1-Person Households | - | 67 (35.4%) |
| 2-Person Households | 34 (18.0%) | 19 (10.1%) |
| 3-Person Households | 21 (11.1%) | 0 (0.0%) |
| 4-Person Households | 30 (15.9%) | 0 (0.0%) |
| 5-Person Households | 10 (5.3%) | 0 (0.0%) |
| 6-Person Households | 8 (4.2%) | 0 (0.0%) |
| 7+ Person Households | 0 (0.0%) | 0 (0.0%) |
| Total | 103 (54.5%) | 86 (45.5%) |
Female Fertility in Orbisonia borough
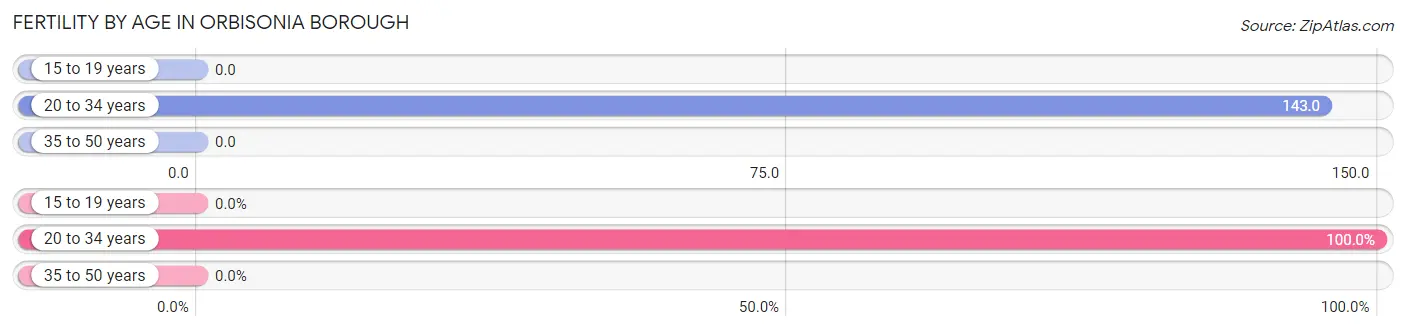
Fertility by Age in Orbisonia borough
Average fertility rate in Orbisonia borough is 95.0 births per 1,000 women. Women in the age bracket of 20 to 34 years have the highest fertility rate with 143.0 births per 1,000 women. Women in the age bracket of 20 to 34 years acount for 100.0% of all women with births.
| Age Bracket | Women with Births | Births / 1,000 Women |
| 15 to 19 years | 0 (0.0%) | 0.0 |
| 20 to 34 years | 8 (100.0%) | 143.0 |
| 35 to 50 years | 0 (0.0%) | 0.0 |
| Total | 8 (100.0%) | 95.0 |
Fertility by Age by Marriage Status in Orbisonia borough
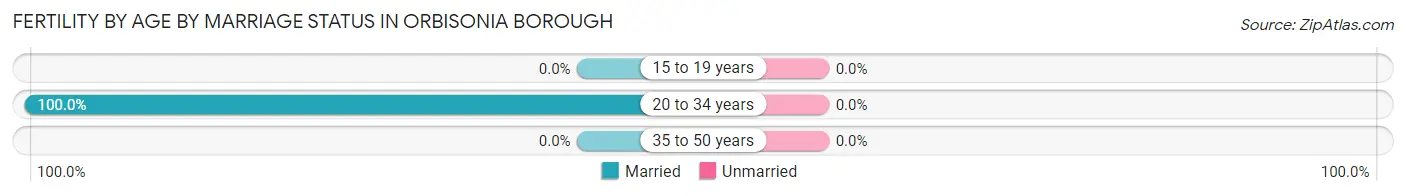
| Age Bracket | Married | Unmarried |
| 15 to 19 years | 0 (0.0%) | 0 (0.0%) |
| 20 to 34 years | 8 (100.0%) | 0 (0.0%) |
| 35 to 50 years | 0 (0.0%) | 0 (0.0%) |
| Total | 8 (100.0%) | 0 (0.0%) |
Fertility by Education in Orbisonia borough
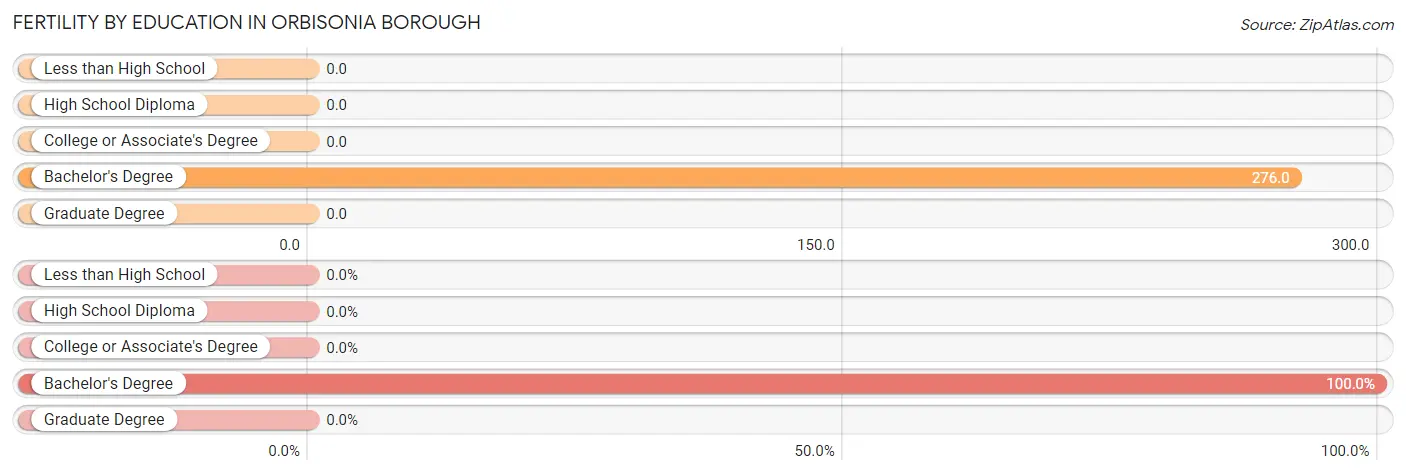
| Educational Attainment | Women with Births | Births / 1,000 Women |
| Less than High School | 0 (0.0%) | 0.0 |
| High School Diploma | 0 (0.0%) | 0.0 |
| College or Associate's Degree | 0 (0.0%) | 0.0 |
| Bachelor's Degree | 8 (100.0%) | 276.0 |
| Graduate Degree | 0 (0.0%) | 0.0 |
| Total | 8 (100.0%) | 95.0 |
Fertility by Education by Marriage Status in Orbisonia borough
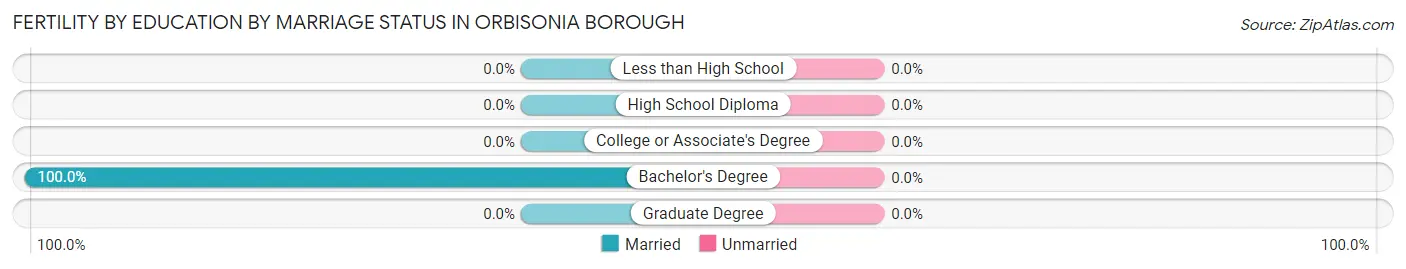
| Educational Attainment | Married | Unmarried |
| Less than High School | 0 (0.0%) | 0 (0.0%) |
| High School Diploma | 0 (0.0%) | 0 (0.0%) |
| College or Associate's Degree | 0 (0.0%) | 0 (0.0%) |
| Bachelor's Degree | 8 (100.0%) | 0 (0.0%) |
| Graduate Degree | 0 (0.0%) | 0 (0.0%) |
| Total | 8 (100.0%) | 0 (0.0%) |
Employment Characteristics in Orbisonia borough
Employment by Class of Employer in Orbisonia borough
Among the 162 employed individuals in Orbisonia borough, private company employees (110 | 67.9%), local government employees (27 | 16.7%), and self-employed (not incorporated) (8 | 4.9%) make up the most common classes of employment.
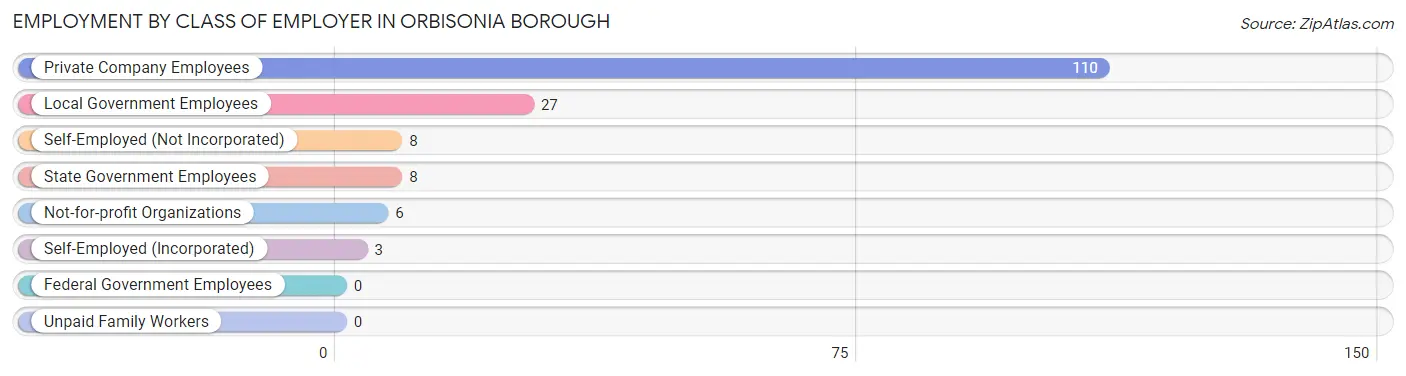
| Employer Class | # Employees | % Employees |
| Private Company Employees | 110 | 67.9% |
| Self-Employed (Incorporated) | 3 | 1.8% |
| Self-Employed (Not Incorporated) | 8 | 4.9% |
| Not-for-profit Organizations | 6 | 3.7% |
| Local Government Employees | 27 | 16.7% |
| State Government Employees | 8 | 4.9% |
| Federal Government Employees | 0 | 0.0% |
| Unpaid Family Workers | 0 | 0.0% |
| Total | 162 | 100.0% |
Employment Status by Age in Orbisonia borough
According to the labor force statistics for Orbisonia borough, out of the total population over 16 years of age (362), 45.6% or 165 individuals are in the labor force, with 1.8% or 3 of them unemployed. The age group with the highest labor force participation rate is 20 to 24 years, with 100.0% or 10 individuals in the labor force. Within the labor force, the 65 to 74 years age range has the highest percentage of unemployed individuals, with 10.0% or 1 of them being unemployed.
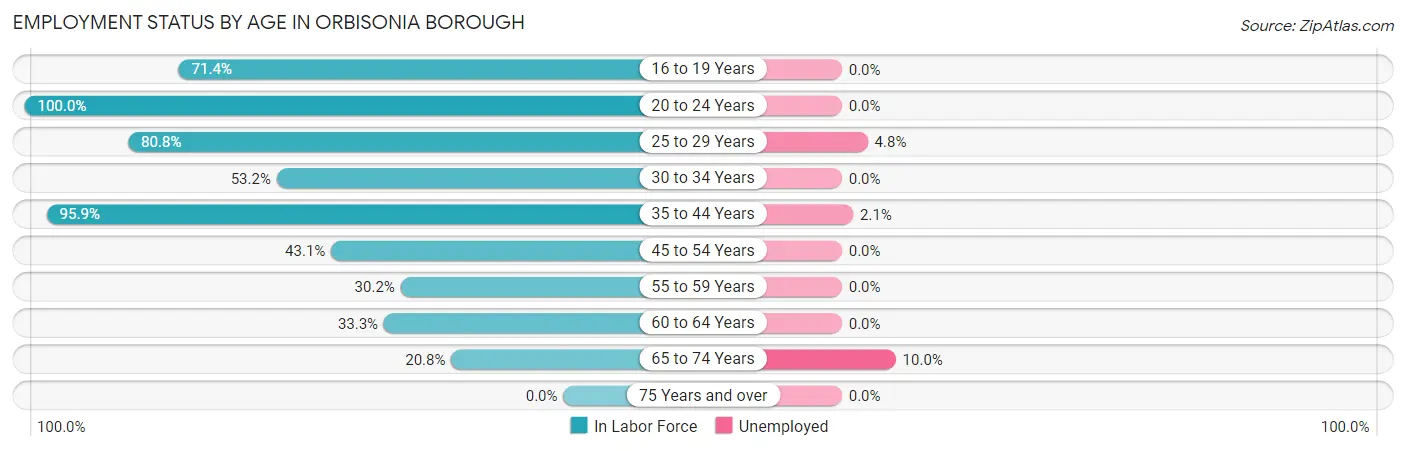
| Age Bracket | In Labor Force | Unemployed |
| 16 to 19 Years | 10 (71.4%) | 0 (0.0%) |
| 20 to 24 Years | 10 (100.0%) | 0 (0.0%) |
| 25 to 29 Years | 21 (80.8%) | 1 (4.8%) |
| 30 to 34 Years | 25 (53.2%) | 0 (0.0%) |
| 35 to 44 Years | 47 (95.9%) | 1 (2.1%) |
| 45 to 54 Years | 22 (43.1%) | 0 (0.0%) |
| 55 to 59 Years | 16 (30.2%) | 0 (0.0%) |
| 60 to 64 Years | 4 (33.3%) | 0 (0.0%) |
| 65 to 74 Years | 10 (20.8%) | 1 (10.0%) |
| 75 Years and over | 0 (0.0%) | 0 (0.0%) |
| Total | 165 (45.6%) | 3 (1.8%) |
Employment Status by Educational Attainment in Orbisonia borough
According to labor force statistics for Orbisonia borough, 56.7% of individuals (135) out of the total population between 25 and 64 years of age (238) are in the labor force, with 1.5% or 2 of them being unemployed. The group with the highest labor force participation rate are those with the educational attainment of bachelor's degree or higher, with 70.2% or 59 individuals in the labor force. Within the labor force, individuals with high school diploma education have the highest percentage of unemployment, with 1.9% or 1 of them being unemployed.
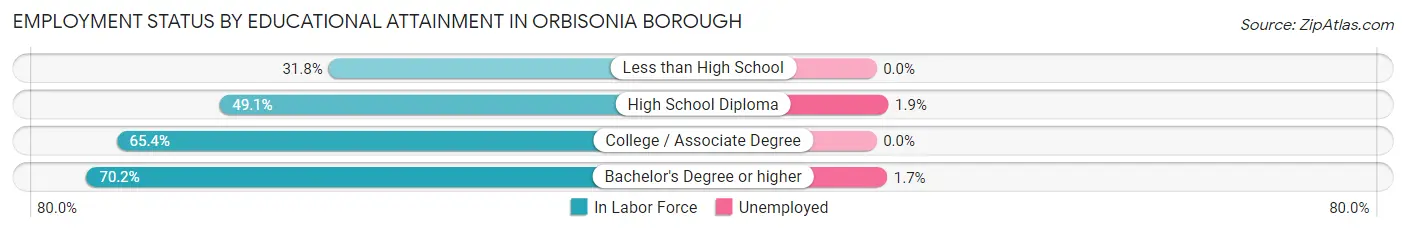
| Educational Attainment | In Labor Force | Unemployed |
| Less than High School | 7 (31.8%) | 0 (0.0%) |
| High School Diploma | 52 (49.1%) | 2 (1.9%) |
| College / Associate Degree | 17 (65.4%) | 0 (0.0%) |
| Bachelor's Degree or higher | 59 (70.2%) | 1 (1.7%) |
| Total | 135 (56.7%) | 4 (1.5%) |
Employment Occupations by Sex in Orbisonia borough
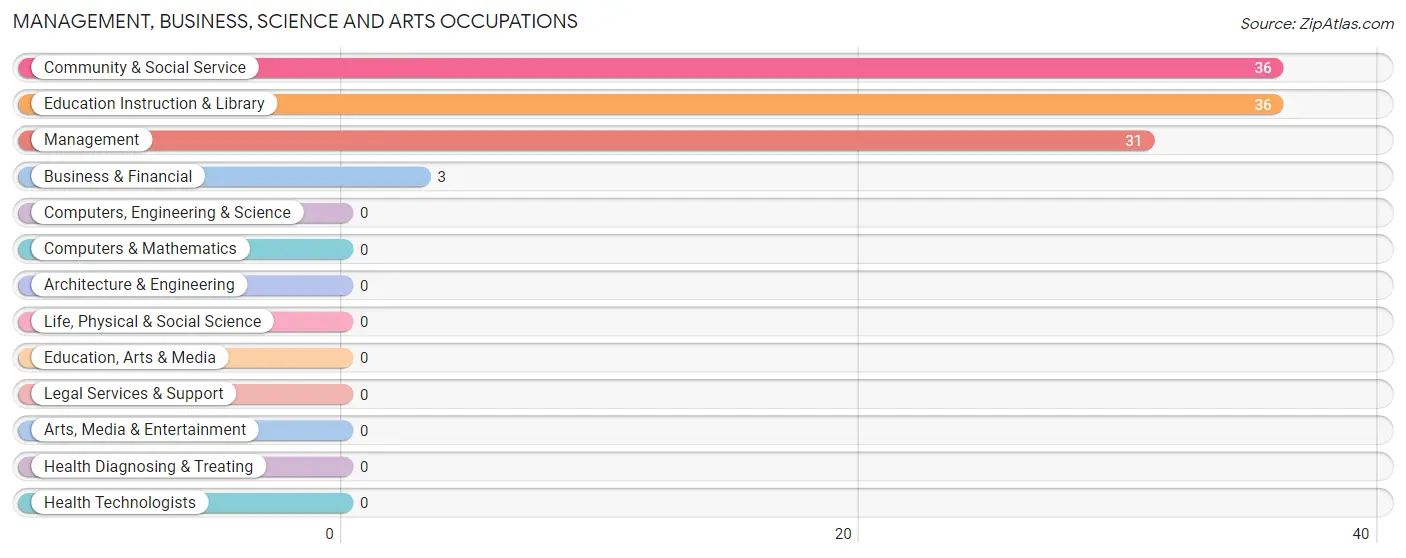
Management, Business, Science and Arts Occupations
The most common Management, Business, Science and Arts occupations in Orbisonia borough are Community & Social Service (36 | 22.2%), Education Instruction & Library (36 | 22.2%), Management (31 | 19.1%), and Business & Financial (3 | 1.8%).
Management, Business, Science and Arts Occupations by Sex
Within the Management, Business, Science and Arts occupations in Orbisonia borough, the most male-oriented occupations are Management (77.4%), Business & Financial (33.3%), and Community & Social Service (30.6%), while the most female-oriented occupations are Community & Social Service (69.4%), Education Instruction & Library (69.4%), and Business & Financial (66.7%).
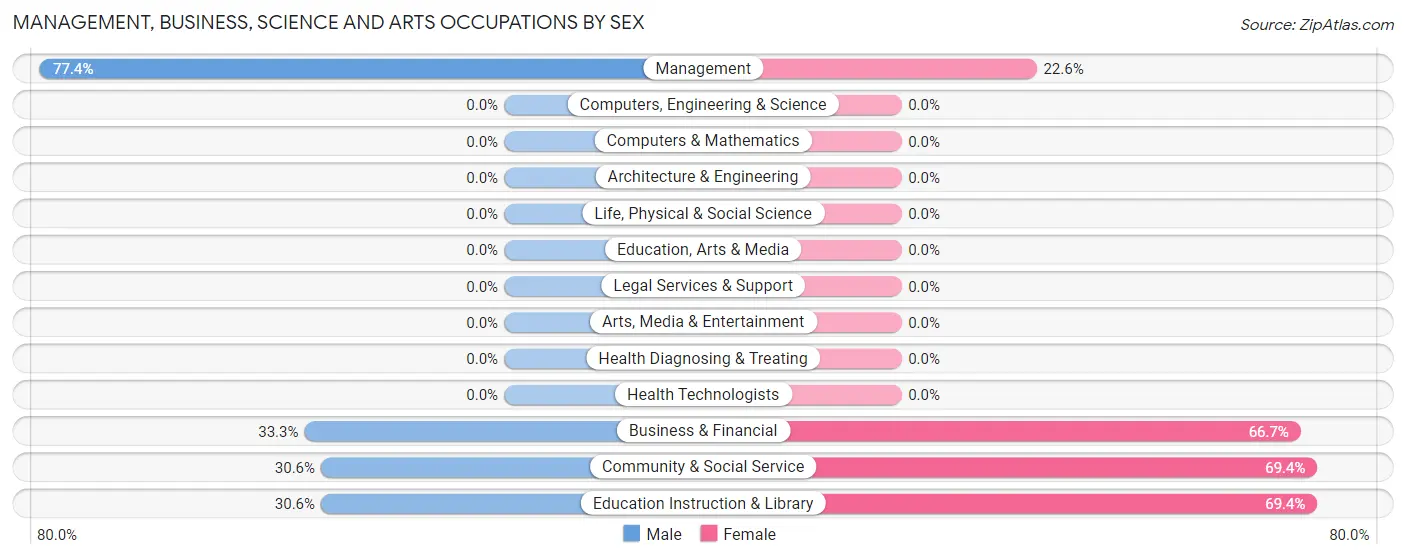
| Occupation | Male | Female |
| Management | 24 (77.4%) | 7 (22.6%) |
| Business & Financial | 1 (33.3%) | 2 (66.7%) |
| Computers, Engineering & Science | 0 (0.0%) | 0 (0.0%) |
| Computers & Mathematics | 0 (0.0%) | 0 (0.0%) |
| Architecture & Engineering | 0 (0.0%) | 0 (0.0%) |
| Life, Physical & Social Science | 0 (0.0%) | 0 (0.0%) |
| Community & Social Service | 11 (30.6%) | 25 (69.4%) |
| Education, Arts & Media | 0 (0.0%) | 0 (0.0%) |
| Legal Services & Support | 0 (0.0%) | 0 (0.0%) |
| Education Instruction & Library | 11 (30.6%) | 25 (69.4%) |
| Arts, Media & Entertainment | 0 (0.0%) | 0 (0.0%) |
| Health Diagnosing & Treating | 0 (0.0%) | 0 (0.0%) |
| Health Technologists | 0 (0.0%) | 0 (0.0%) |
| Total (Category) | 36 (51.4%) | 34 (48.6%) |
| Total (Overall) | 93 (57.4%) | 69 (42.6%) |
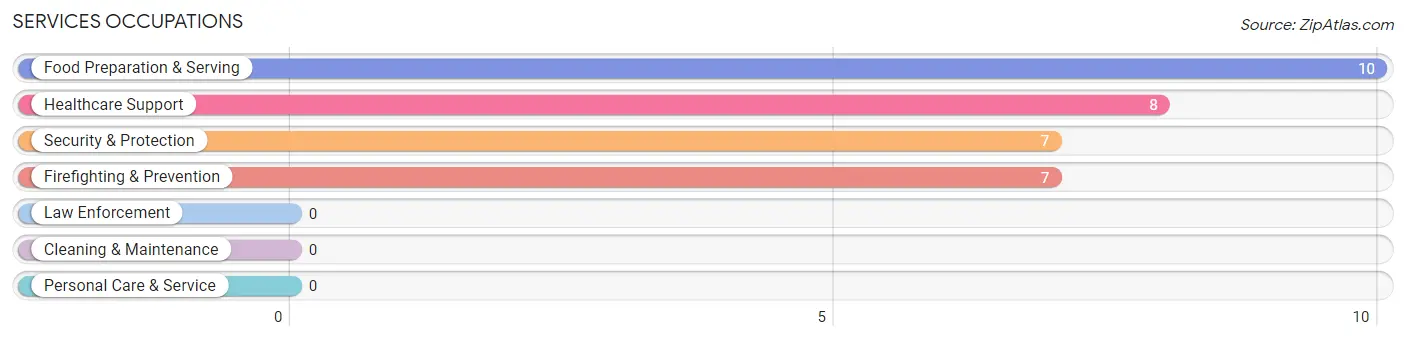
Services Occupations
The most common Services occupations in Orbisonia borough are Food Preparation & Serving (10 | 6.2%), Healthcare Support (8 | 4.9%), Security & Protection (7 | 4.3%), and Firefighting & Prevention (7 | 4.3%).
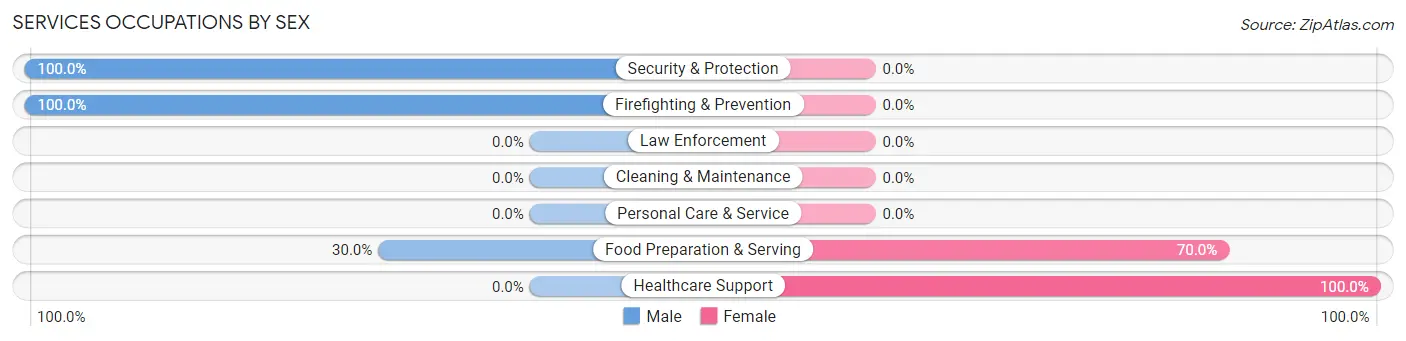
Services Occupations by Sex
Within the Services occupations in Orbisonia borough, the most male-oriented occupations are Security & Protection (100.0%), Firefighting & Prevention (100.0%), and Food Preparation & Serving (30.0%), while the most female-oriented occupations are Healthcare Support (100.0%), and Food Preparation & Serving (70.0%).
| Occupation | Male | Female |
| Healthcare Support | 0 (0.0%) | 8 (100.0%) |
| Security & Protection | 7 (100.0%) | 0 (0.0%) |
| Firefighting & Prevention | 7 (100.0%) | 0 (0.0%) |
| Law Enforcement | 0 (0.0%) | 0 (0.0%) |
| Food Preparation & Serving | 3 (30.0%) | 7 (70.0%) |
| Cleaning & Maintenance | 0 (0.0%) | 0 (0.0%) |
| Personal Care & Service | 0 (0.0%) | 0 (0.0%) |
| Total (Category) | 10 (40.0%) | 15 (60.0%) |
| Total (Overall) | 93 (57.4%) | 69 (42.6%) |
Sales and Office Occupations
The most common Sales and Office occupations in Orbisonia borough are Sales & Related (8 | 4.9%), and Office & Administration (7 | 4.3%).

Sales and Office Occupations by Sex

| Occupation | Male | Female |
| Sales & Related | 0 (0.0%) | 8 (100.0%) |
| Office & Administration | 2 (28.6%) | 5 (71.4%) |
| Total (Category) | 2 (13.3%) | 13 (86.7%) |
| Total (Overall) | 93 (57.4%) | 69 (42.6%) |
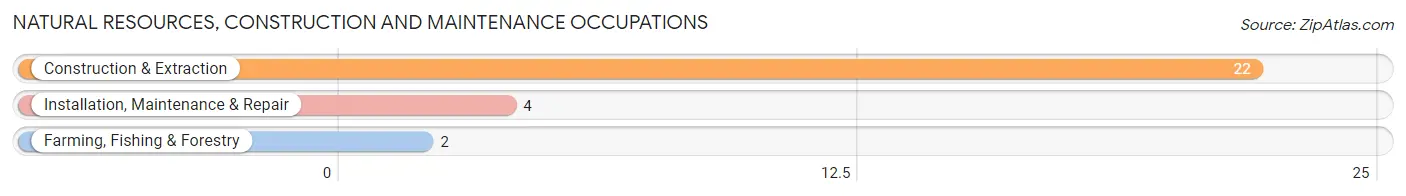
Natural Resources, Construction and Maintenance Occupations
The most common Natural Resources, Construction and Maintenance occupations in Orbisonia borough are Construction & Extraction (22 | 13.6%), Installation, Maintenance & Repair (4 | 2.5%), and Farming, Fishing & Forestry (2 | 1.2%).
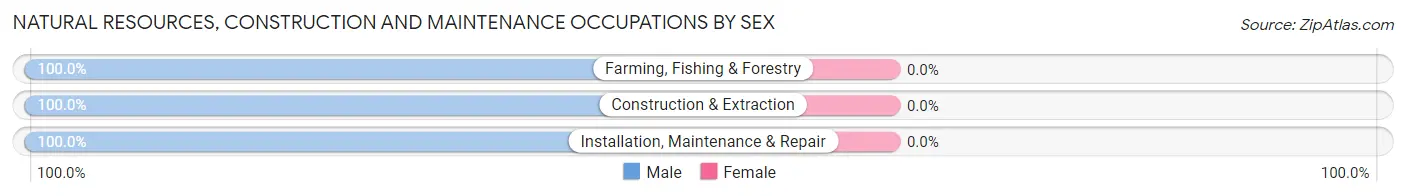
Natural Resources, Construction and Maintenance Occupations by Sex
| Occupation | Male | Female |
| Farming, Fishing & Forestry | 2 (100.0%) | 0 (0.0%) |
| Construction & Extraction | 22 (100.0%) | 0 (0.0%) |
| Installation, Maintenance & Repair | 4 (100.0%) | 0 (0.0%) |
| Total (Category) | 28 (100.0%) | 0 (0.0%) |
| Total (Overall) | 93 (57.4%) | 69 (42.6%) |
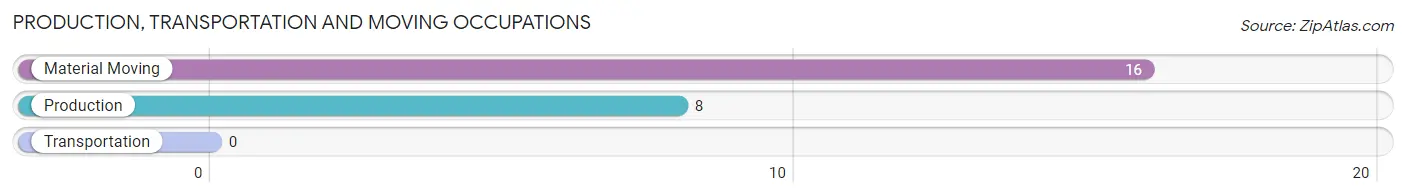
Production, Transportation and Moving Occupations
The most common Production, Transportation and Moving occupations in Orbisonia borough are Material Moving (16 | 9.9%), and Production (8 | 4.9%).
Production, Transportation and Moving Occupations by Sex
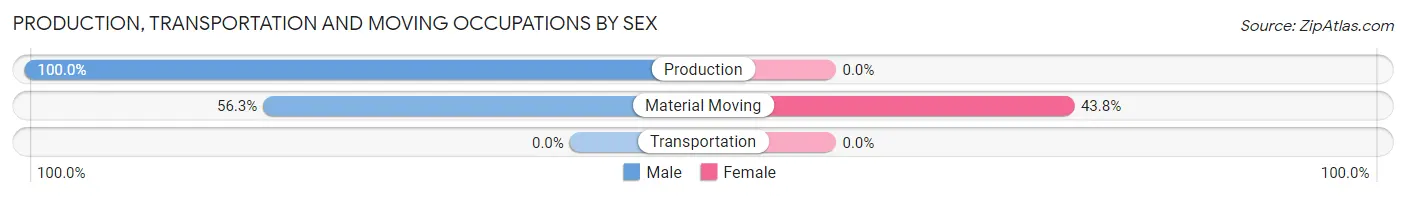
| Occupation | Male | Female |
| Production | 8 (100.0%) | 0 (0.0%) |
| Transportation | 0 (0.0%) | 0 (0.0%) |
| Material Moving | 9 (56.2%) | 7 (43.8%) |
| Total (Category) | 17 (70.8%) | 7 (29.2%) |
| Total (Overall) | 93 (57.4%) | 69 (42.6%) |
Employment Industries by Sex in Orbisonia borough
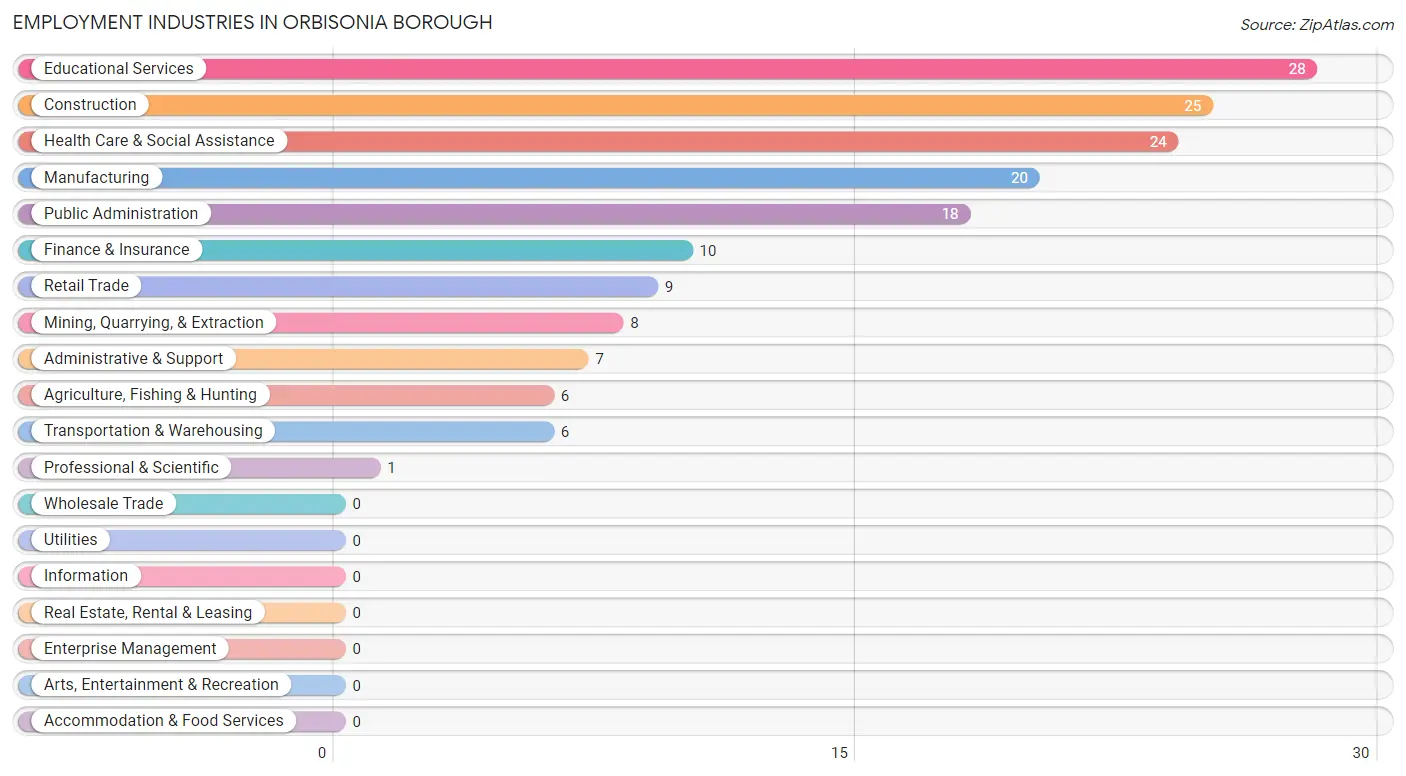
Employment Industries in Orbisonia borough
The major employment industries in Orbisonia borough include Educational Services (28 | 17.3%), Construction (25 | 15.4%), Health Care & Social Assistance (24 | 14.8%), Manufacturing (20 | 12.3%), and Public Administration (18 | 11.1%).
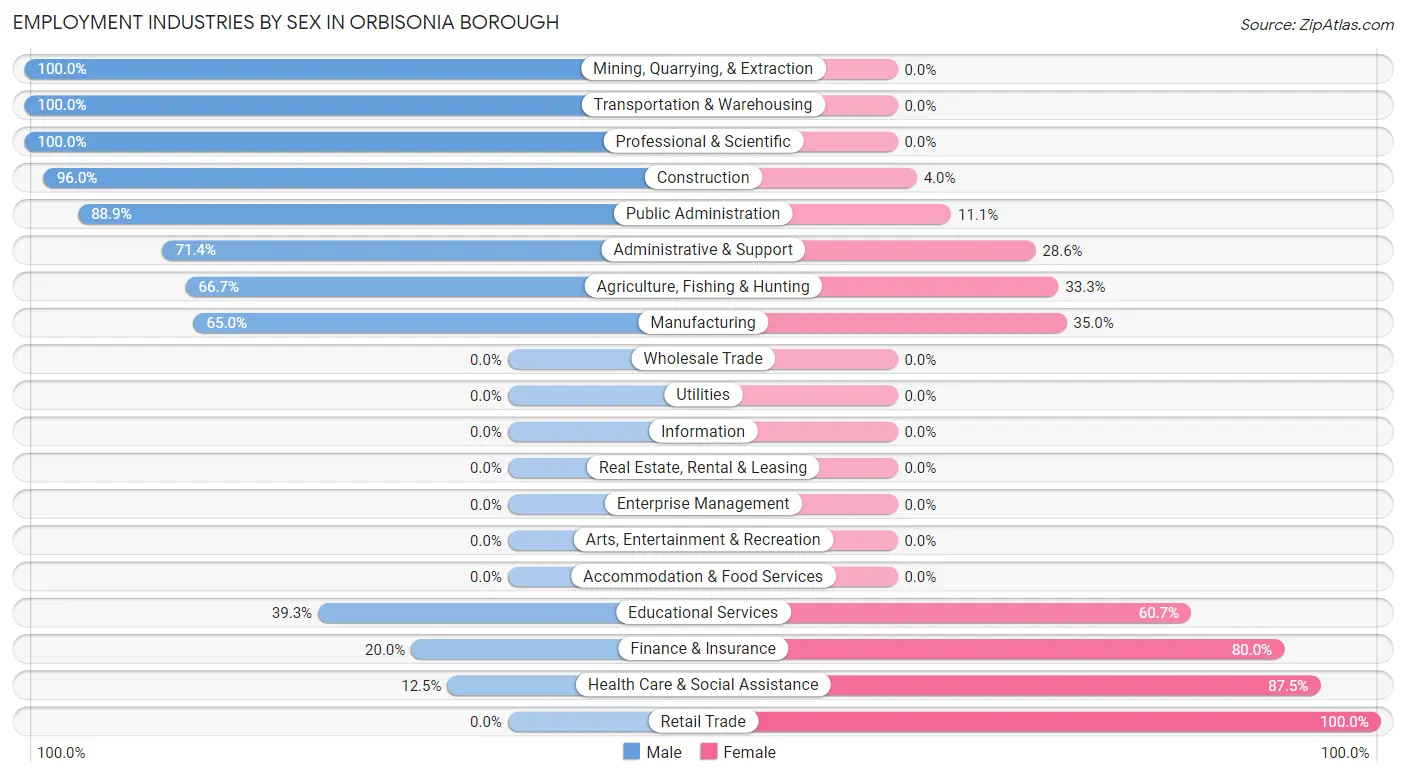
Employment Industries by Sex in Orbisonia borough
The Orbisonia borough industries that see more men than women are Mining, Quarrying, & Extraction (100.0%), Transportation & Warehousing (100.0%), and Professional & Scientific (100.0%), whereas the industries that tend to have a higher number of women are Retail Trade (100.0%), Health Care & Social Assistance (87.5%), and Finance & Insurance (80.0%).
| Industry | Male | Female |
| Agriculture, Fishing & Hunting | 4 (66.7%) | 2 (33.3%) |
| Mining, Quarrying, & Extraction | 8 (100.0%) | 0 (0.0%) |
| Construction | 24 (96.0%) | 1 (4.0%) |
| Manufacturing | 13 (65.0%) | 7 (35.0%) |
| Wholesale Trade | 0 (0.0%) | 0 (0.0%) |
| Retail Trade | 0 (0.0%) | 9 (100.0%) |
| Transportation & Warehousing | 6 (100.0%) | 0 (0.0%) |
| Utilities | 0 (0.0%) | 0 (0.0%) |
| Information | 0 (0.0%) | 0 (0.0%) |
| Finance & Insurance | 2 (20.0%) | 8 (80.0%) |
| Real Estate, Rental & Leasing | 0 (0.0%) | 0 (0.0%) |
| Professional & Scientific | 1 (100.0%) | 0 (0.0%) |
| Enterprise Management | 0 (0.0%) | 0 (0.0%) |
| Administrative & Support | 5 (71.4%) | 2 (28.6%) |
| Educational Services | 11 (39.3%) | 17 (60.7%) |
| Health Care & Social Assistance | 3 (12.5%) | 21 (87.5%) |
| Arts, Entertainment & Recreation | 0 (0.0%) | 0 (0.0%) |
| Accommodation & Food Services | 0 (0.0%) | 0 (0.0%) |
| Public Administration | 16 (88.9%) | 2 (11.1%) |
| Total | 93 (57.4%) | 69 (42.6%) |
Education in Orbisonia borough
School Enrollment in Orbisonia borough
The most common levels of schooling among the 81 students in Orbisonia borough are elementary school (37 | 45.7%), nursery / preschool (14 | 17.3%), and graduate / professional (9 | 11.1%).
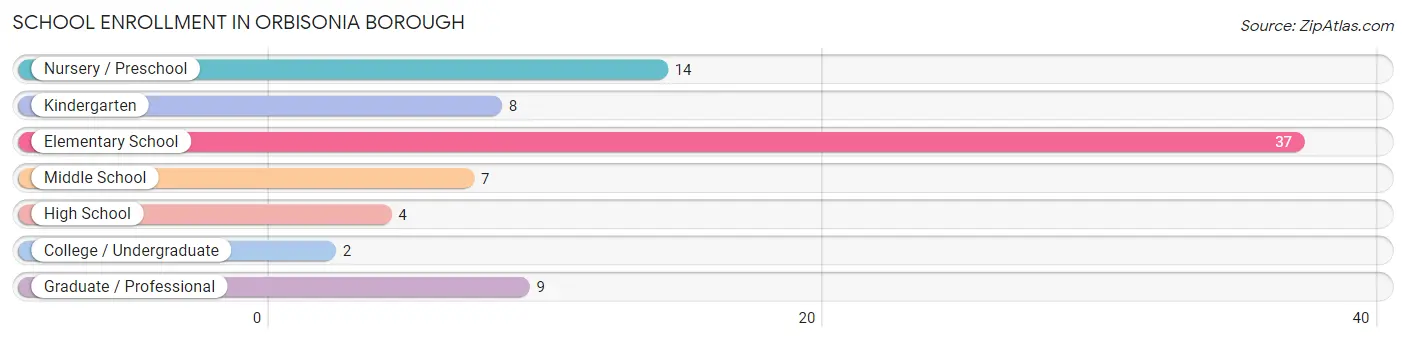
| School Level | # Students | % Students |
| Nursery / Preschool | 14 | 17.3% |
| Kindergarten | 8 | 9.9% |
| Elementary School | 37 | 45.7% |
| Middle School | 7 | 8.6% |
| High School | 4 | 4.9% |
| College / Undergraduate | 2 | 2.5% |
| Graduate / Professional | 9 | 11.1% |
| Total | 81 | 100.0% |
School Enrollment by Age by Funding Source in Orbisonia borough
Out of a total of 81 students who are enrolled in schools in Orbisonia borough, 12 (14.8%) attend a private institution, while the remaining 69 (85.2%) are enrolled in public schools. The age group of 3 to 4 year olds has the highest likelihood of being enrolled in private schools, with 9 (81.8% in the age bracket) enrolled. Conversely, the age group of 10 to 14 year olds has the lowest likelihood of being enrolled in a private school, with 19 (100.0% in the age bracket) attending a public institution.
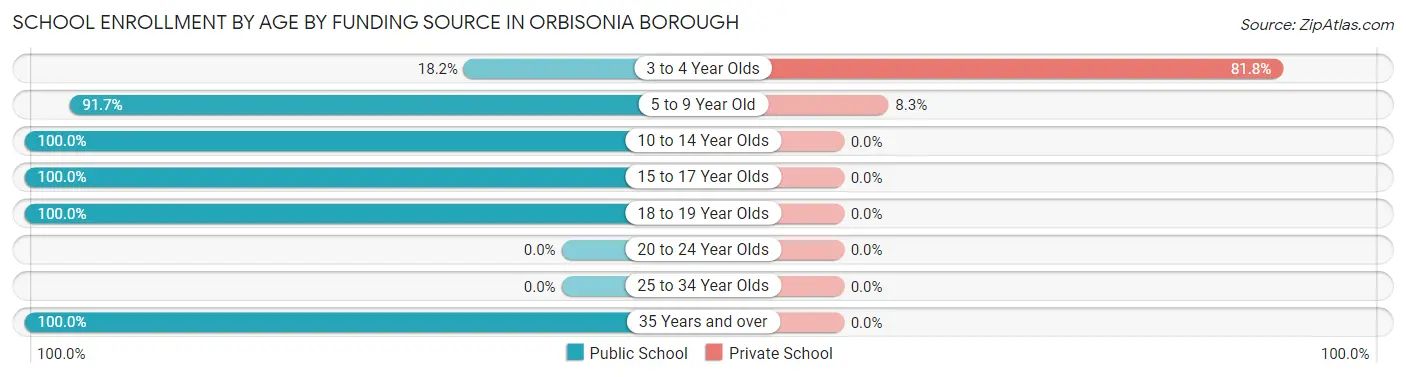
| Age Bracket | Public School | Private School |
| 3 to 4 Year Olds | 2 (18.2%) | 9 (81.8%) |
| 5 to 9 Year Old | 33 (91.7%) | 3 (8.3%) |
| 10 to 14 Year Olds | 19 (100.0%) | 0 (0.0%) |
| 15 to 17 Year Olds | 4 (100.0%) | 0 (0.0%) |
| 18 to 19 Year Olds | 2 (100.0%) | 0 (0.0%) |
| 20 to 24 Year Olds | 0 (0.0%) | 0 (0.0%) |
| 25 to 34 Year Olds | 0 (0.0%) | 0 (0.0%) |
| 35 Years and over | 9 (100.0%) | 0 (0.0%) |
| Total | 69 (85.2%) | 12 (14.8%) |
Educational Attainment by Field of Study in Orbisonia borough
Education (36 | 34.6%), liberal arts & history (24 | 23.1%), social sciences (20 | 19.2%), psychology (11 | 10.6%), and literature & languages (8 | 7.7%) are the most common fields of study among 104 individuals in Orbisonia borough who have obtained a bachelor's degree or higher.
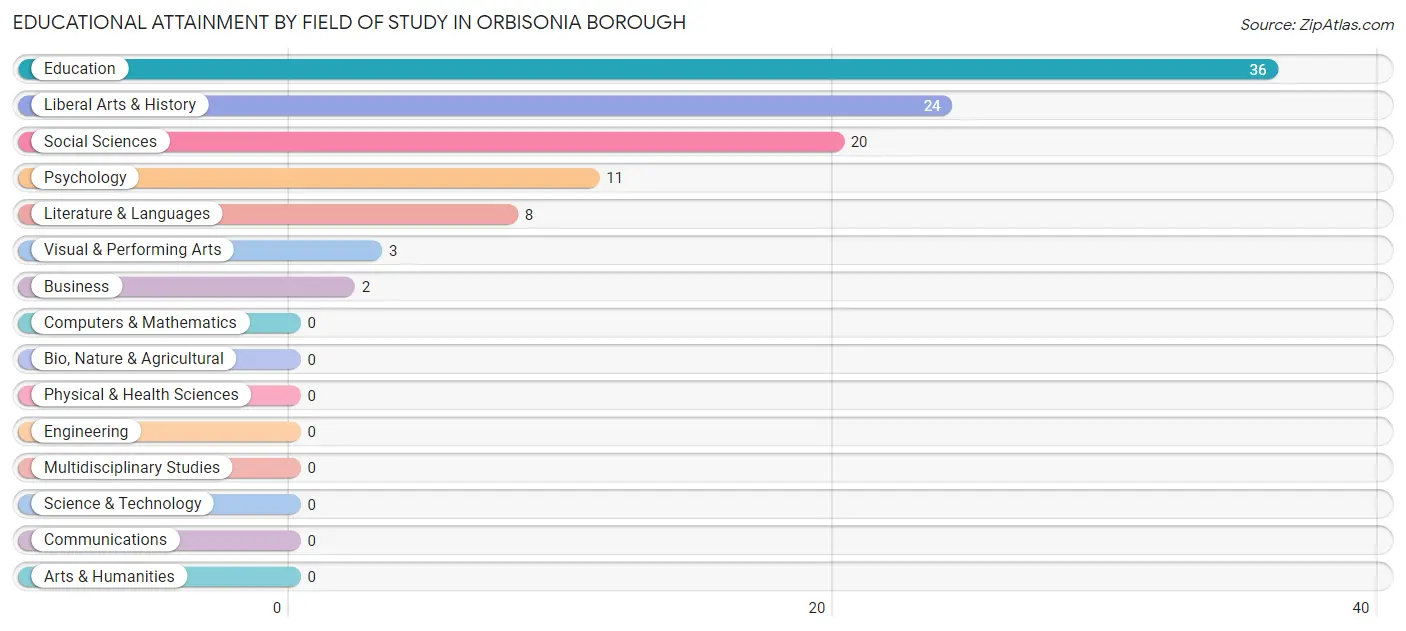
| Field of Study | # Graduates | % Graduates |
| Computers & Mathematics | 0 | 0.0% |
| Bio, Nature & Agricultural | 0 | 0.0% |
| Physical & Health Sciences | 0 | 0.0% |
| Psychology | 11 | 10.6% |
| Social Sciences | 20 | 19.2% |
| Engineering | 0 | 0.0% |
| Multidisciplinary Studies | 0 | 0.0% |
| Science & Technology | 0 | 0.0% |
| Business | 2 | 1.9% |
| Education | 36 | 34.6% |
| Literature & Languages | 8 | 7.7% |
| Liberal Arts & History | 24 | 23.1% |
| Visual & Performing Arts | 3 | 2.9% |
| Communications | 0 | 0.0% |
| Arts & Humanities | 0 | 0.0% |
| Total | 104 | 100.0% |
Transportation & Commute in Orbisonia borough
Vehicle Availability by Sex in Orbisonia borough
The most prevalent vehicle ownership categories in Orbisonia borough are males with 2 vehicles (33, accounting for 35.5%) and females with 2 vehicles (24, making up 47.8%).
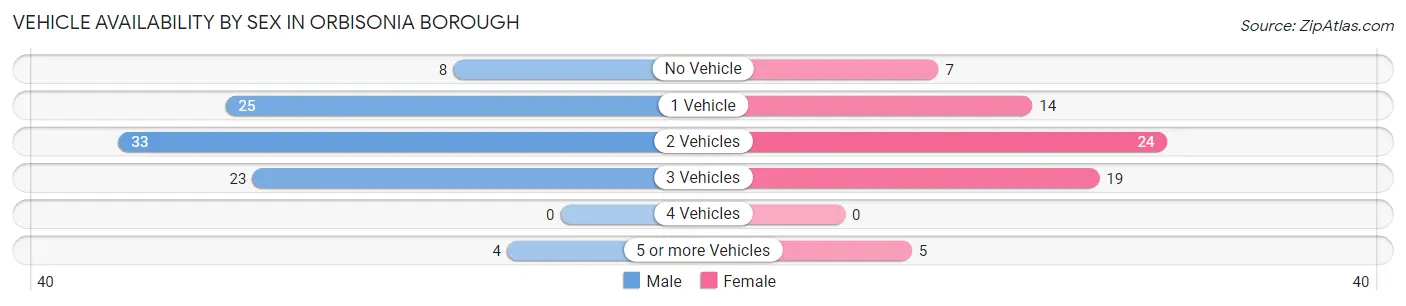
| Vehicles Available | Male | Female |
| No Vehicle | 8 (8.6%) | 7 (10.1%) |
| 1 Vehicle | 25 (26.9%) | 14 (20.3%) |
| 2 Vehicles | 33 (35.5%) | 24 (34.8%) |
| 3 Vehicles | 23 (24.7%) | 19 (27.5%) |
| 4 Vehicles | 0 (0.0%) | 0 (0.0%) |
| 5 or more Vehicles | 4 (4.3%) | 5 (7.2%) |
| Total | 93 (100.0%) | 69 (100.0%) |
Commute Time in Orbisonia borough
The most frequently occuring commute durations in Orbisonia borough are less than 5 minutes (28 commuters, 20.9%), 30 to 34 minutes (17 commuters, 12.7%), and 15 to 19 minutes (16 commuters, 11.9%).
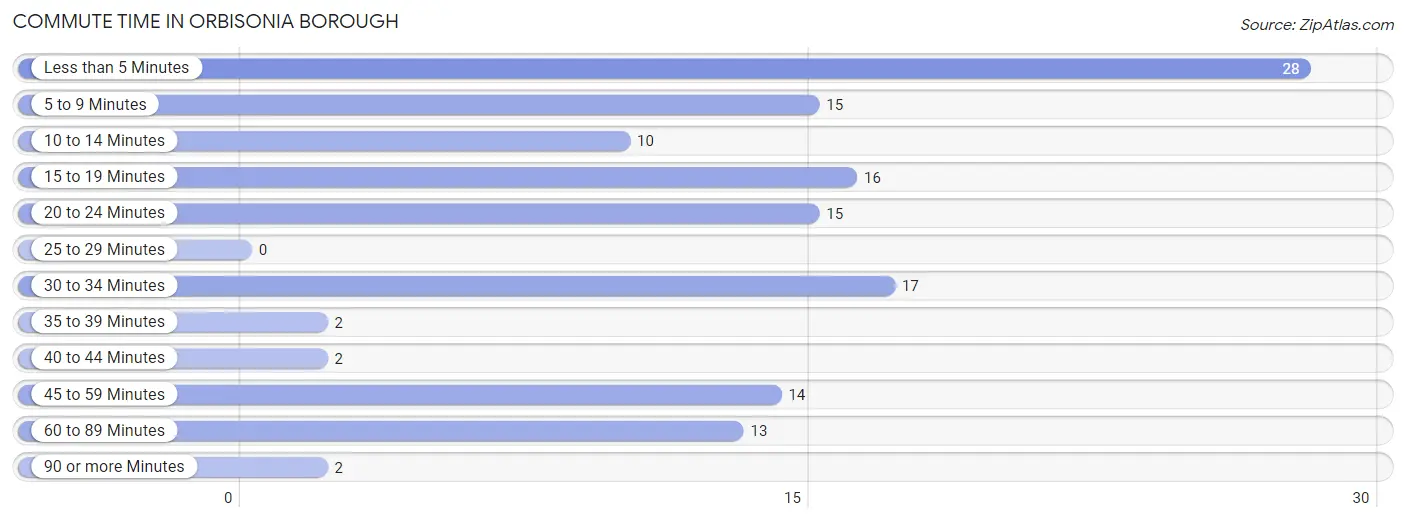
| Commute Time | # Commuters | % Commuters |
| Less than 5 Minutes | 28 | 20.9% |
| 5 to 9 Minutes | 15 | 11.2% |
| 10 to 14 Minutes | 10 | 7.5% |
| 15 to 19 Minutes | 16 | 11.9% |
| 20 to 24 Minutes | 15 | 11.2% |
| 25 to 29 Minutes | 0 | 0.0% |
| 30 to 34 Minutes | 17 | 12.7% |
| 35 to 39 Minutes | 2 | 1.5% |
| 40 to 44 Minutes | 2 | 1.5% |
| 45 to 59 Minutes | 14 | 10.4% |
| 60 to 89 Minutes | 13 | 9.7% |
| 90 or more Minutes | 2 | 1.5% |
Commute Time by Sex in Orbisonia borough
The most common commute times in Orbisonia borough are 45 to 59 minutes (14 commuters, 20.6%) for males and less than 5 minutes (25 commuters, 37.9%) for females.
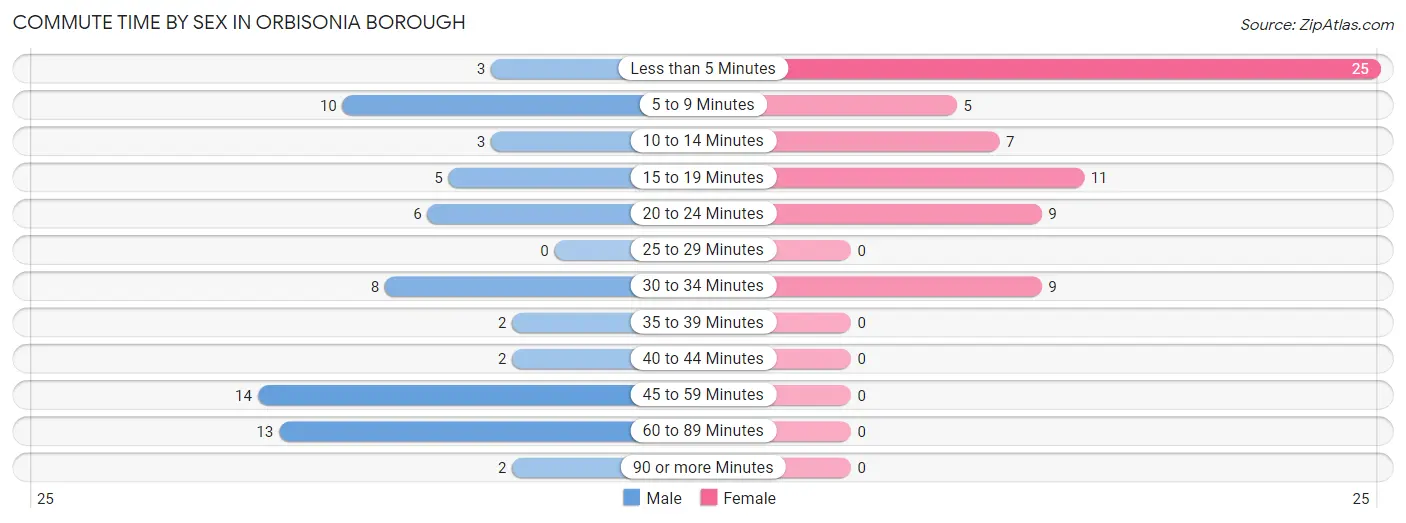
| Commute Time | Male | Female |
| Less than 5 Minutes | 3 (4.4%) | 25 (37.9%) |
| 5 to 9 Minutes | 10 (14.7%) | 5 (7.6%) |
| 10 to 14 Minutes | 3 (4.4%) | 7 (10.6%) |
| 15 to 19 Minutes | 5 (7.3%) | 11 (16.7%) |
| 20 to 24 Minutes | 6 (8.8%) | 9 (13.6%) |
| 25 to 29 Minutes | 0 (0.0%) | 0 (0.0%) |
| 30 to 34 Minutes | 8 (11.8%) | 9 (13.6%) |
| 35 to 39 Minutes | 2 (2.9%) | 0 (0.0%) |
| 40 to 44 Minutes | 2 (2.9%) | 0 (0.0%) |
| 45 to 59 Minutes | 14 (20.6%) | 0 (0.0%) |
| 60 to 89 Minutes | 13 (19.1%) | 0 (0.0%) |
| 90 or more Minutes | 2 (2.9%) | 0 (0.0%) |
Time of Departure to Work by Sex in Orbisonia borough
The most frequent times of departure to work in Orbisonia borough are 5:00 AM to 5:29 AM (18, 26.5%) for males and 7:30 AM to 7:59 AM (20, 30.3%) for females.
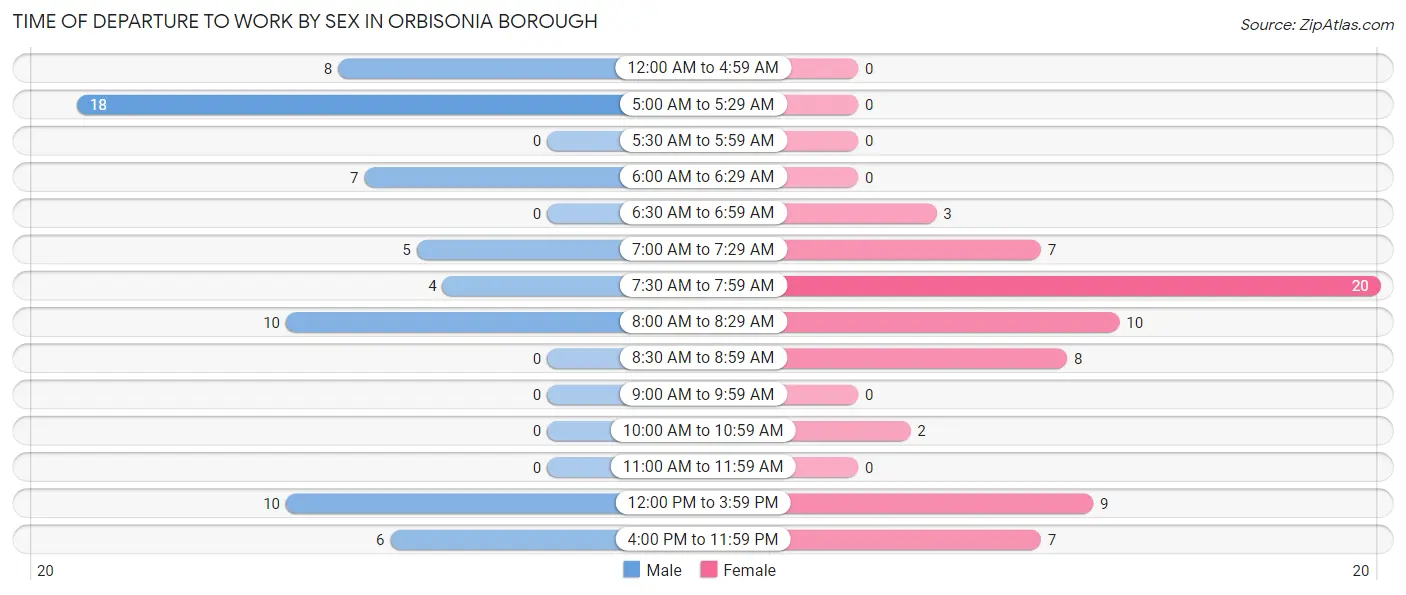
| Time of Departure | Male | Female |
| 12:00 AM to 4:59 AM | 8 (11.8%) | 0 (0.0%) |
| 5:00 AM to 5:29 AM | 18 (26.5%) | 0 (0.0%) |
| 5:30 AM to 5:59 AM | 0 (0.0%) | 0 (0.0%) |
| 6:00 AM to 6:29 AM | 7 (10.3%) | 0 (0.0%) |
| 6:30 AM to 6:59 AM | 0 (0.0%) | 3 (4.5%) |
| 7:00 AM to 7:29 AM | 5 (7.3%) | 7 (10.6%) |
| 7:30 AM to 7:59 AM | 4 (5.9%) | 20 (30.3%) |
| 8:00 AM to 8:29 AM | 10 (14.7%) | 10 (15.1%) |
| 8:30 AM to 8:59 AM | 0 (0.0%) | 8 (12.1%) |
| 9:00 AM to 9:59 AM | 0 (0.0%) | 0 (0.0%) |
| 10:00 AM to 10:59 AM | 0 (0.0%) | 2 (3.0%) |
| 11:00 AM to 11:59 AM | 0 (0.0%) | 0 (0.0%) |
| 12:00 PM to 3:59 PM | 10 (14.7%) | 9 (13.6%) |
| 4:00 PM to 11:59 PM | 6 (8.8%) | 7 (10.6%) |
| Total | 68 (100.0%) | 66 (100.0%) |
Housing Occupancy in Orbisonia borough
Occupancy by Ownership in Orbisonia borough
Of the total 189 dwellings in Orbisonia borough, owner-occupied units account for 122 (64.5%), while renter-occupied units make up 67 (35.4%).
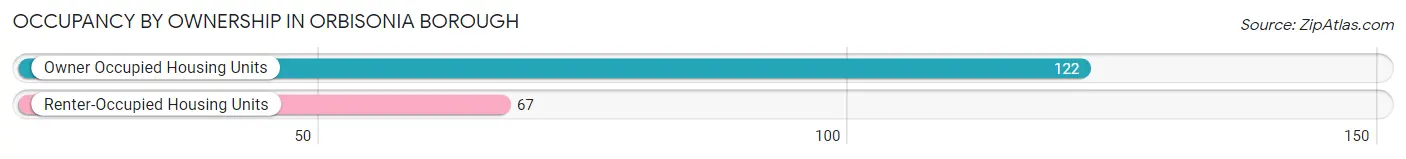
| Occupancy | # Housing Units | % Housing Units |
| Owner Occupied Housing Units | 122 | 64.5% |
| Renter-Occupied Housing Units | 67 | 35.4% |
| Total Occupied Housing Units | 189 | 100.0% |
Occupancy by Household Size in Orbisonia borough
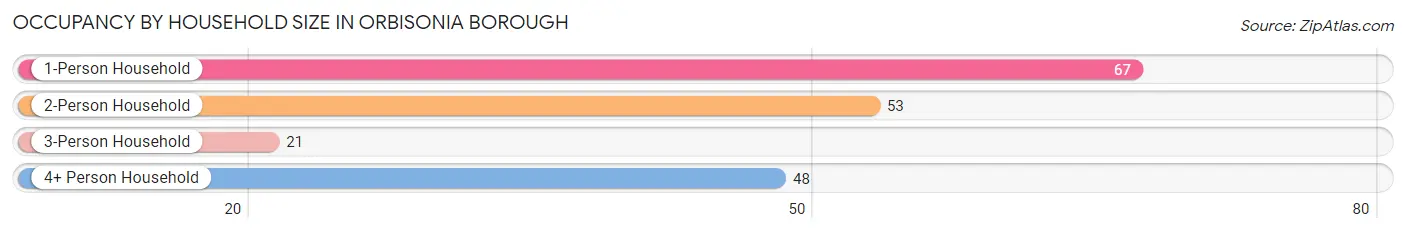
| Household Size | # Housing Units | % Housing Units |
| 1-Person Household | 67 | 35.4% |
| 2-Person Household | 53 | 28.0% |
| 3-Person Household | 21 | 11.1% |
| 4+ Person Household | 48 | 25.4% |
| Total Housing Units | 189 | 100.0% |
Occupancy by Ownership by Household Size in Orbisonia borough
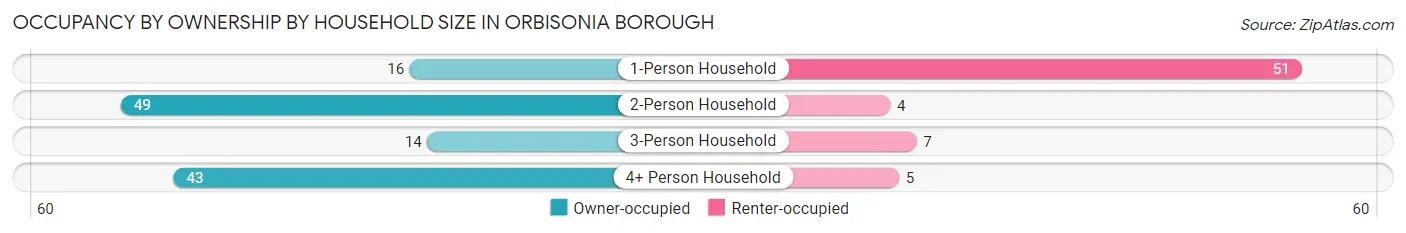
| Household Size | Owner-occupied | Renter-occupied |
| 1-Person Household | 16 (23.9%) | 51 (76.1%) |
| 2-Person Household | 49 (92.4%) | 4 (7.5%) |
| 3-Person Household | 14 (66.7%) | 7 (33.3%) |
| 4+ Person Household | 43 (89.6%) | 5 (10.4%) |
| Total Housing Units | 122 (64.5%) | 67 (35.4%) |
Occupancy by Educational Attainment in Orbisonia borough
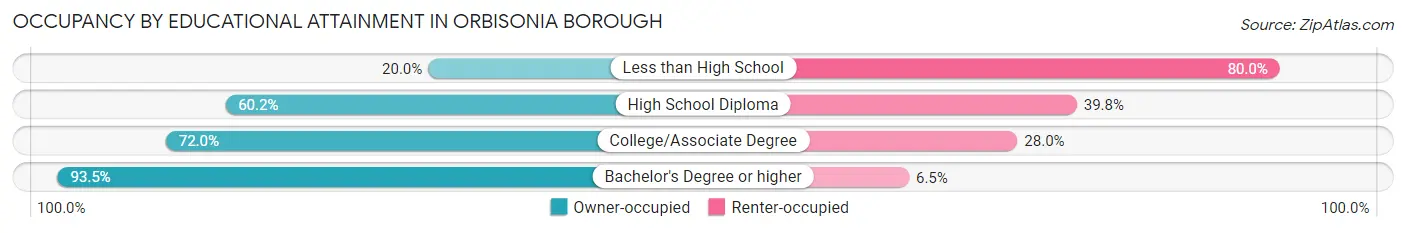
| Household Size | Owner-occupied | Renter-occupied |
| Less than High School | 5 (20.0%) | 20 (80.0%) |
| High School Diploma | 56 (60.2%) | 37 (39.8%) |
| College/Associate Degree | 18 (72.0%) | 7 (28.0%) |
| Bachelor's Degree or higher | 43 (93.5%) | 3 (6.5%) |
Occupancy by Age of Householder in Orbisonia borough
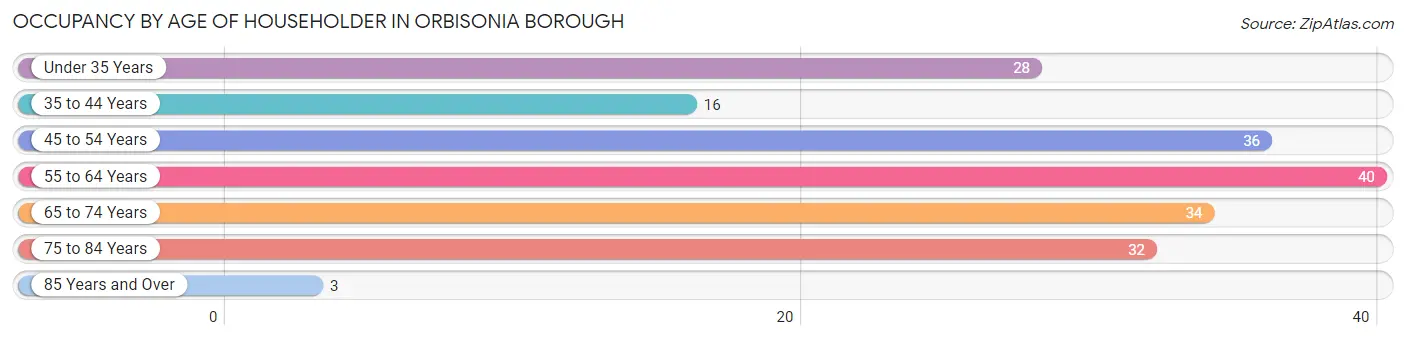
| Age Bracket | # Households | % Households |
| Under 35 Years | 28 | 14.8% |
| 35 to 44 Years | 16 | 8.5% |
| 45 to 54 Years | 36 | 19.1% |
| 55 to 64 Years | 40 | 21.2% |
| 65 to 74 Years | 34 | 18.0% |
| 75 to 84 Years | 32 | 16.9% |
| 85 Years and Over | 3 | 1.6% |
| Total | 189 | 100.0% |
Housing Finances in Orbisonia borough
Median Income by Occupancy in Orbisonia borough
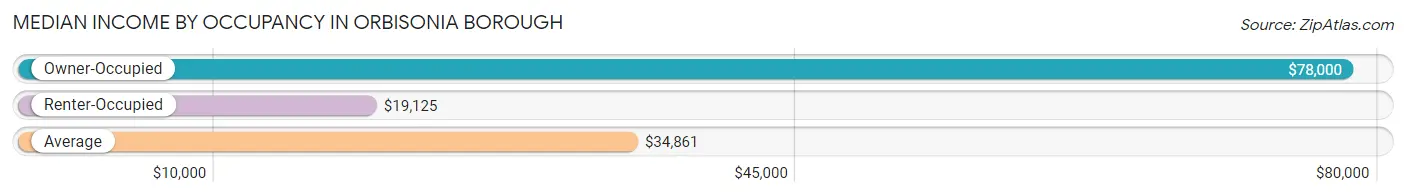
| Occupancy Type | # Households | Median Income |
| Owner-Occupied | 122 (64.5%) | $78,000 |
| Renter-Occupied | 67 (35.4%) | $19,125 |
| Average | 189 (100.0%) | $34,861 |
Occupancy by Householder Income Bracket in Orbisonia borough
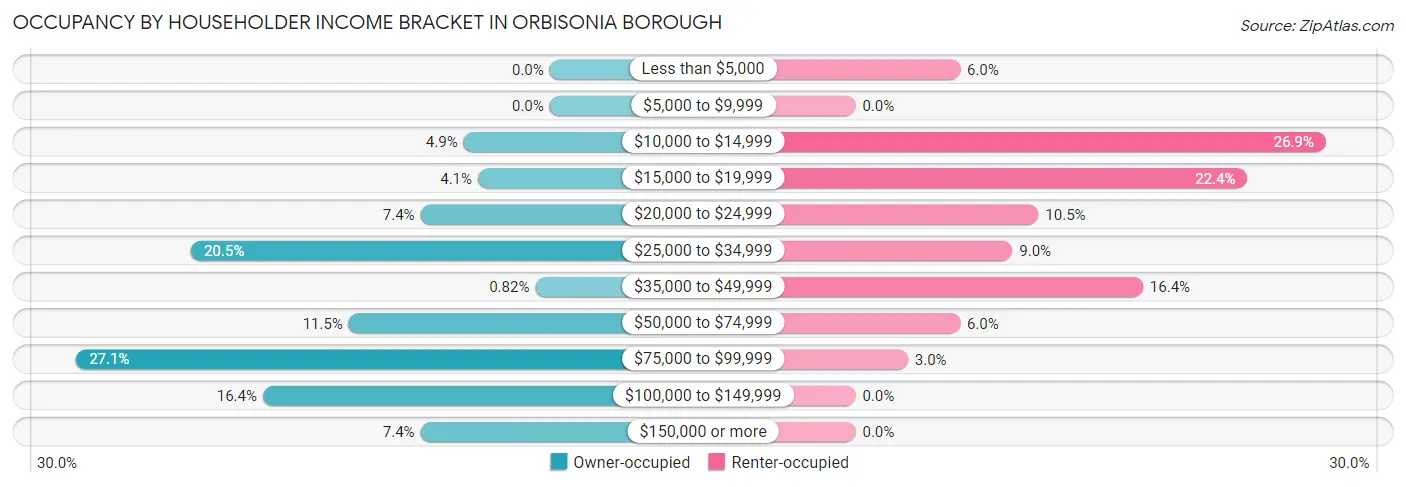
| Income Bracket | Owner-occupied | Renter-occupied |
| Less than $5,000 | 0 (0.0%) | 4 (6.0%) |
| $5,000 to $9,999 | 0 (0.0%) | 0 (0.0%) |
| $10,000 to $14,999 | 6 (4.9%) | 18 (26.9%) |
| $15,000 to $19,999 | 5 (4.1%) | 15 (22.4%) |
| $20,000 to $24,999 | 9 (7.4%) | 7 (10.4%) |
| $25,000 to $34,999 | 25 (20.5%) | 6 (9.0%) |
| $35,000 to $49,999 | 1 (0.8%) | 11 (16.4%) |
| $50,000 to $74,999 | 14 (11.5%) | 4 (6.0%) |
| $75,000 to $99,999 | 33 (27.1%) | 2 (3.0%) |
| $100,000 to $149,999 | 20 (16.4%) | 0 (0.0%) |
| $150,000 or more | 9 (7.4%) | 0 (0.0%) |
| Total | 122 (100.0%) | 67 (100.0%) |
Monthly Housing Cost Tiers in Orbisonia borough
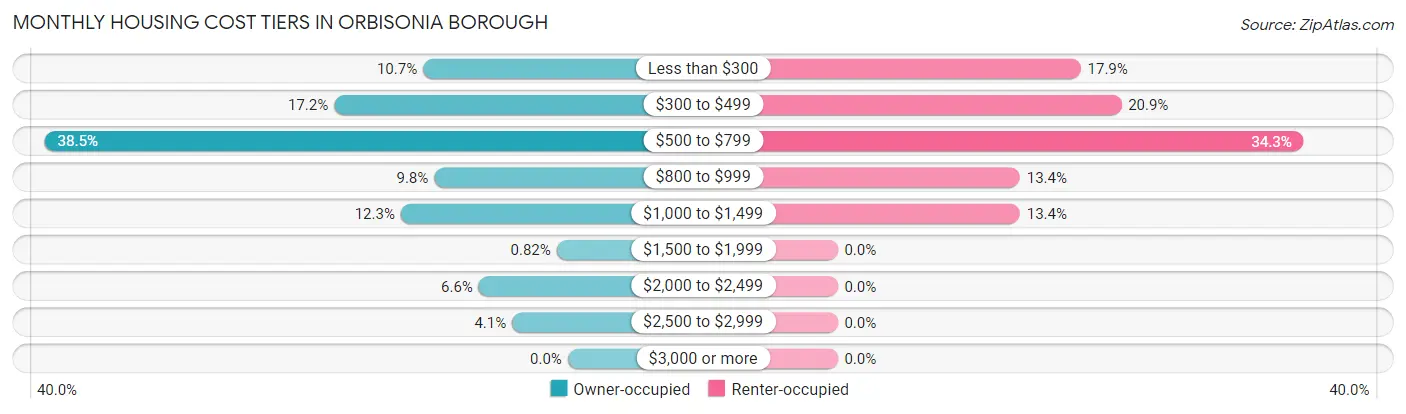
| Monthly Cost | Owner-occupied | Renter-occupied |
| Less than $300 | 13 (10.7%) | 12 (17.9%) |
| $300 to $499 | 21 (17.2%) | 14 (20.9%) |
| $500 to $799 | 47 (38.5%) | 23 (34.3%) |
| $800 to $999 | 12 (9.8%) | 9 (13.4%) |
| $1,000 to $1,499 | 15 (12.3%) | 9 (13.4%) |
| $1,500 to $1,999 | 1 (0.8%) | 0 (0.0%) |
| $2,000 to $2,499 | 8 (6.6%) | 0 (0.0%) |
| $2,500 to $2,999 | 5 (4.1%) | 0 (0.0%) |
| $3,000 or more | 0 (0.0%) | 0 (0.0%) |
| Total | 122 (100.0%) | 67 (100.0%) |
Physical Housing Characteristics in Orbisonia borough
Housing Structures in Orbisonia borough
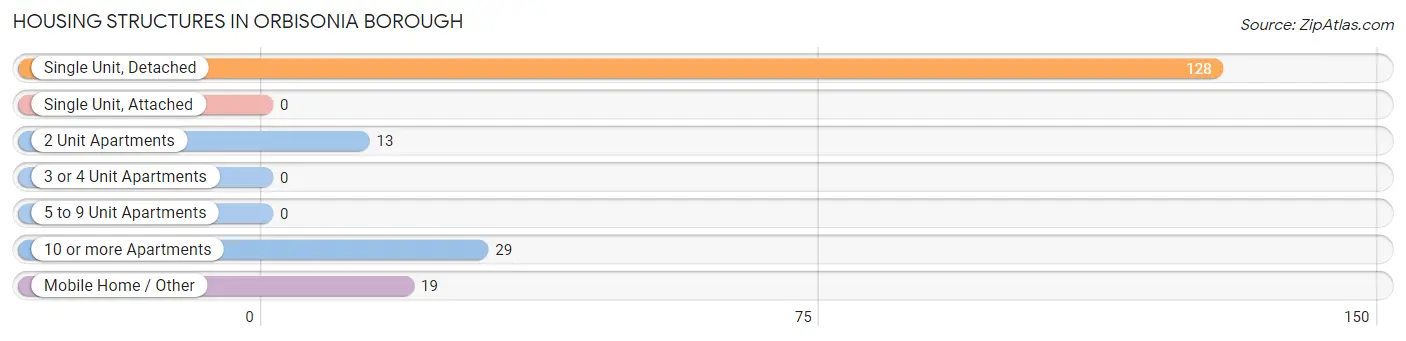
| Structure Type | # Housing Units | % Housing Units |
| Single Unit, Detached | 128 | 67.7% |
| Single Unit, Attached | 0 | 0.0% |
| 2 Unit Apartments | 13 | 6.9% |
| 3 or 4 Unit Apartments | 0 | 0.0% |
| 5 to 9 Unit Apartments | 0 | 0.0% |
| 10 or more Apartments | 29 | 15.3% |
| Mobile Home / Other | 19 | 10.1% |
| Total | 189 | 100.0% |
Housing Structures by Occupancy in Orbisonia borough
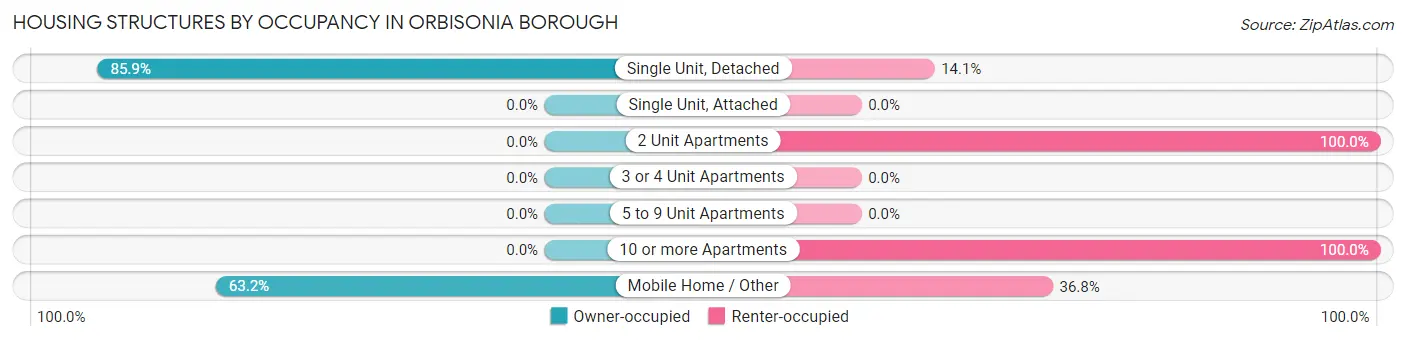
| Structure Type | Owner-occupied | Renter-occupied |
| Single Unit, Detached | 110 (85.9%) | 18 (14.1%) |
| Single Unit, Attached | 0 (0.0%) | 0 (0.0%) |
| 2 Unit Apartments | 0 (0.0%) | 13 (100.0%) |
| 3 or 4 Unit Apartments | 0 (0.0%) | 0 (0.0%) |
| 5 to 9 Unit Apartments | 0 (0.0%) | 0 (0.0%) |
| 10 or more Apartments | 0 (0.0%) | 29 (100.0%) |
| Mobile Home / Other | 12 (63.2%) | 7 (36.8%) |
| Total | 122 (64.5%) | 67 (35.4%) |
Housing Structures by Number of Rooms in Orbisonia borough
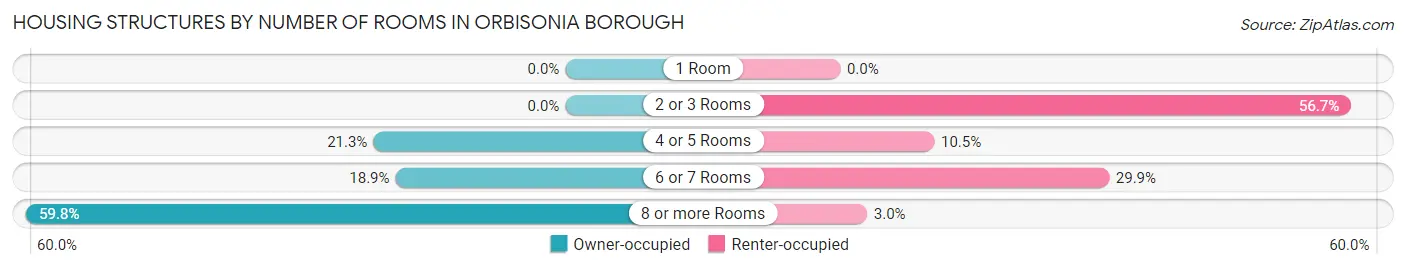
| Number of Rooms | Owner-occupied | Renter-occupied |
| 1 Room | 0 (0.0%) | 0 (0.0%) |
| 2 or 3 Rooms | 0 (0.0%) | 38 (56.7%) |
| 4 or 5 Rooms | 26 (21.3%) | 7 (10.4%) |
| 6 or 7 Rooms | 23 (18.9%) | 20 (29.8%) |
| 8 or more Rooms | 73 (59.8%) | 2 (3.0%) |
| Total | 122 (100.0%) | 67 (100.0%) |
Housing Structure by Heating Type in Orbisonia borough
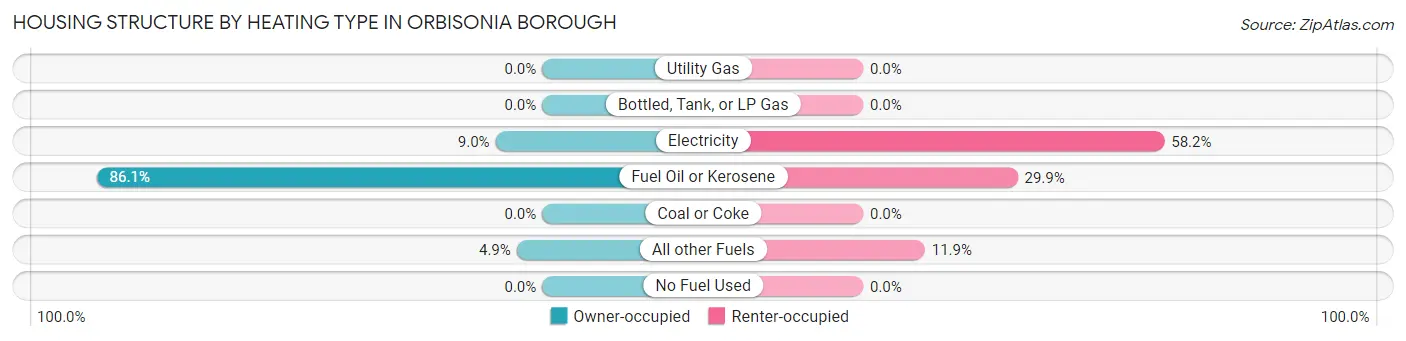
| Heating Type | Owner-occupied | Renter-occupied |
| Utility Gas | 0 (0.0%) | 0 (0.0%) |
| Bottled, Tank, or LP Gas | 0 (0.0%) | 0 (0.0%) |
| Electricity | 11 (9.0%) | 39 (58.2%) |
| Fuel Oil or Kerosene | 105 (86.1%) | 20 (29.8%) |
| Coal or Coke | 0 (0.0%) | 0 (0.0%) |
| All other Fuels | 6 (4.9%) | 8 (11.9%) |
| No Fuel Used | 0 (0.0%) | 0 (0.0%) |
| Total | 122 (100.0%) | 67 (100.0%) |
Household Vehicle Usage in Orbisonia borough
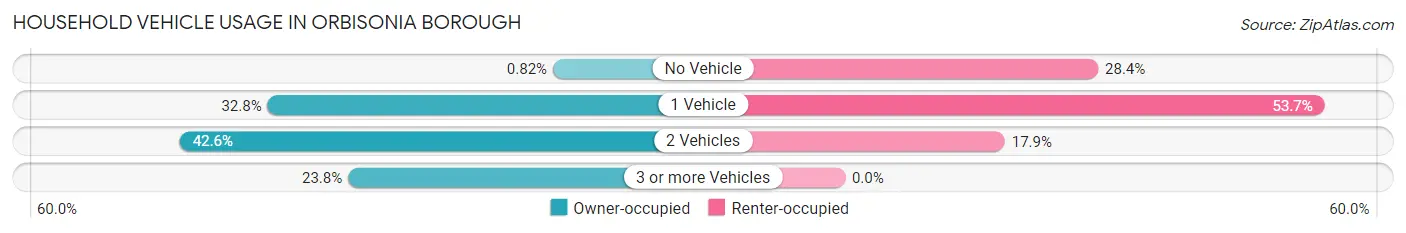
| Vehicles per Household | Owner-occupied | Renter-occupied |
| No Vehicle | 1 (0.8%) | 19 (28.4%) |
| 1 Vehicle | 40 (32.8%) | 36 (53.7%) |
| 2 Vehicles | 52 (42.6%) | 12 (17.9%) |
| 3 or more Vehicles | 29 (23.8%) | 0 (0.0%) |
| Total | 122 (100.0%) | 67 (100.0%) |
Real Estate & Mortgages in Orbisonia borough
Real Estate and Mortgage Overview in Orbisonia borough
| Characteristic | Without Mortgage | With Mortgage |
| Housing Units | 60 | 62 |
| Median Property Value | $135,900 | $89,200 |
| Median Household Income | - | - |
| Monthly Housing Costs | $517 | $0 |
| Real Estate Taxes | $1,273 | $0 |
Property Value by Mortgage Status in Orbisonia borough
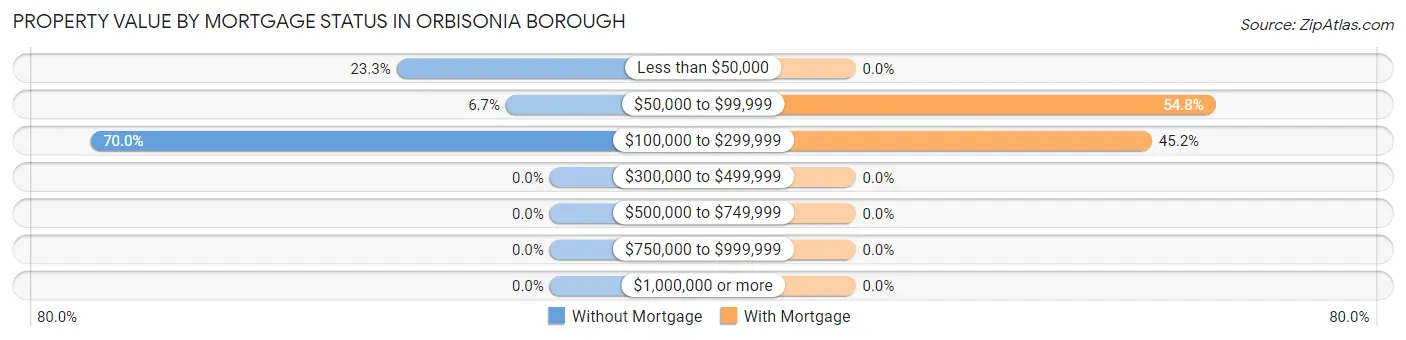
| Property Value | Without Mortgage | With Mortgage |
| Less than $50,000 | 14 (23.3%) | 0 (0.0%) |
| $50,000 to $99,999 | 4 (6.7%) | 34 (54.8%) |
| $100,000 to $299,999 | 42 (70.0%) | 28 (45.2%) |
| $300,000 to $499,999 | 0 (0.0%) | 0 (0.0%) |
| $500,000 to $749,999 | 0 (0.0%) | 0 (0.0%) |
| $750,000 to $999,999 | 0 (0.0%) | 0 (0.0%) |
| $1,000,000 or more | 0 (0.0%) | 0 (0.0%) |
| Total | 60 (100.0%) | 62 (100.0%) |
Household Income by Mortgage Status in Orbisonia borough
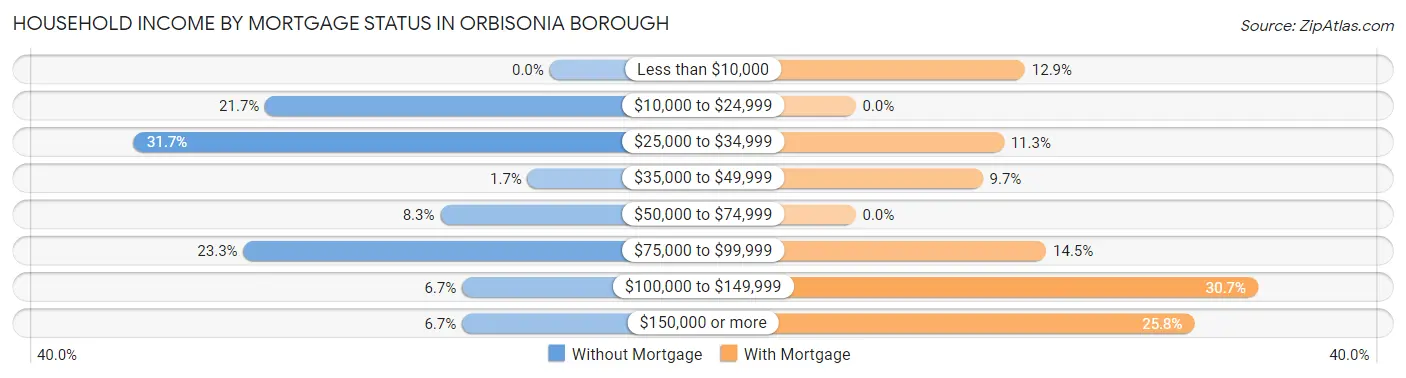
| Household Income | Without Mortgage | With Mortgage |
| Less than $10,000 | 0 (0.0%) | 8 (12.9%) |
| $10,000 to $24,999 | 13 (21.7%) | 0 (0.0%) |
| $25,000 to $34,999 | 19 (31.7%) | 7 (11.3%) |
| $35,000 to $49,999 | 1 (1.7%) | 6 (9.7%) |
| $50,000 to $74,999 | 5 (8.3%) | 0 (0.0%) |
| $75,000 to $99,999 | 14 (23.3%) | 9 (14.5%) |
| $100,000 to $149,999 | 4 (6.7%) | 19 (30.6%) |
| $150,000 or more | 4 (6.7%) | 16 (25.8%) |
| Total | 60 (100.0%) | 62 (100.0%) |
Property Value to Household Income Ratio in Orbisonia borough
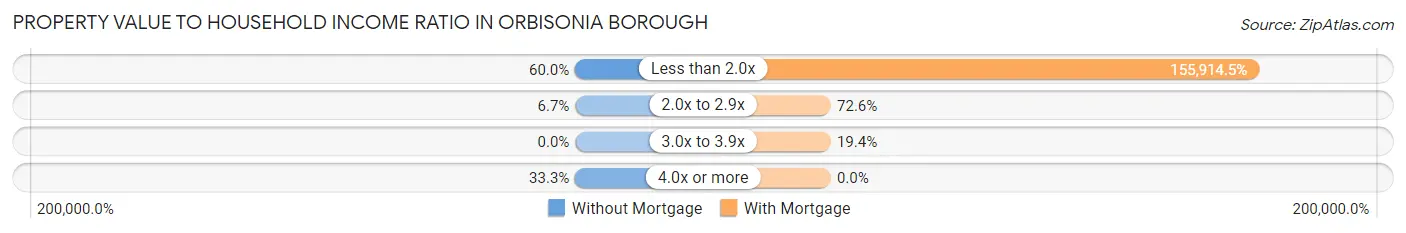
| Value-to-Income Ratio | Without Mortgage | With Mortgage |
| Less than 2.0x | 36 (60.0%) | 96,667 (155,914.5%) |
| 2.0x to 2.9x | 4 (6.7%) | 45 (72.6%) |
| 3.0x to 3.9x | 0 (0.0%) | 12 (19.4%) |
| 4.0x or more | 20 (33.3%) | 0 (0.0%) |
| Total | 60 (100.0%) | 62 (100.0%) |
Real Estate Taxes by Mortgage Status in Orbisonia borough
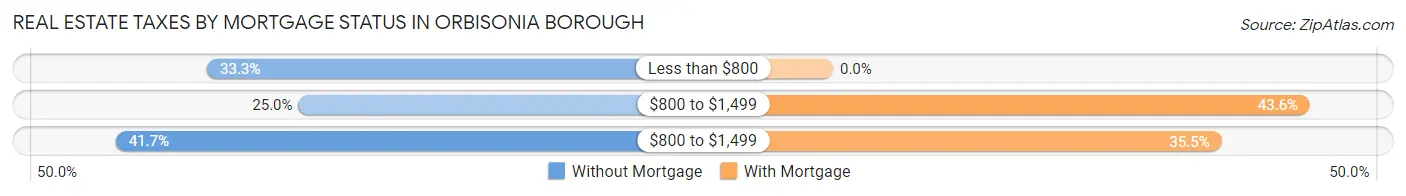
| Property Taxes | Without Mortgage | With Mortgage |
| Less than $800 | 20 (33.3%) | 0 (0.0%) |
| $800 to $1,499 | 15 (25.0%) | 27 (43.5%) |
| $800 to $1,499 | 25 (41.7%) | 22 (35.5%) |
| Total | 60 (100.0%) | 62 (100.0%) |
Health & Disability in Orbisonia borough
Health Insurance Coverage by Age in Orbisonia borough
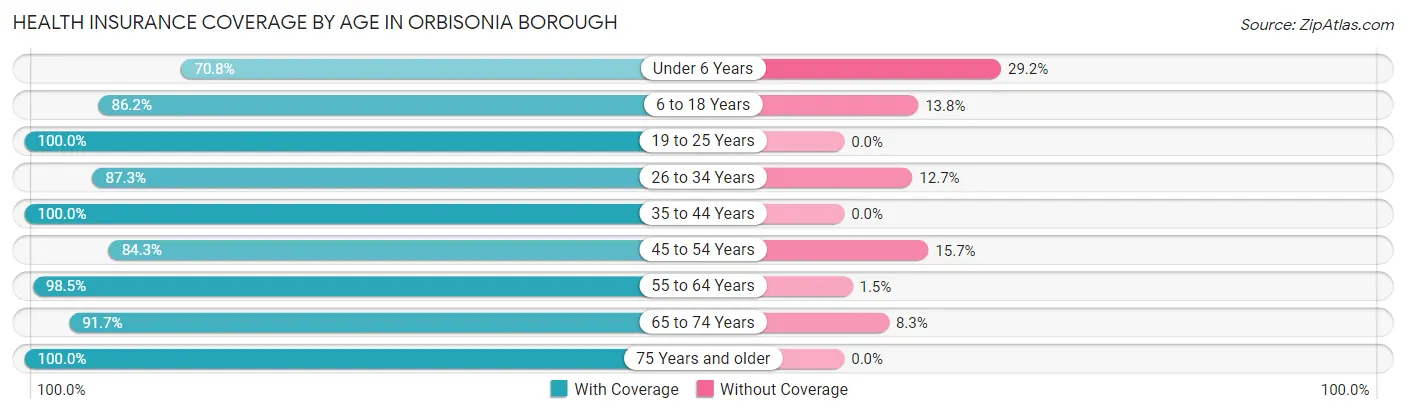
| Age Bracket | With Coverage | Without Coverage |
| Under 6 Years | 46 (70.8%) | 19 (29.2%) |
| 6 to 18 Years | 50 (86.2%) | 8 (13.8%) |
| 19 to 25 Years | 30 (100.0%) | 0 (0.0%) |
| 26 to 34 Years | 55 (87.3%) | 8 (12.7%) |
| 35 to 44 Years | 49 (100.0%) | 0 (0.0%) |
| 45 to 54 Years | 43 (84.3%) | 8 (15.7%) |
| 55 to 64 Years | 64 (98.5%) | 1 (1.5%) |
| 65 to 74 Years | 44 (91.7%) | 4 (8.3%) |
| 75 Years and older | 52 (100.0%) | 0 (0.0%) |
| Total | 433 (90.0%) | 48 (10.0%) |
Health Insurance Coverage by Citizenship Status in Orbisonia borough
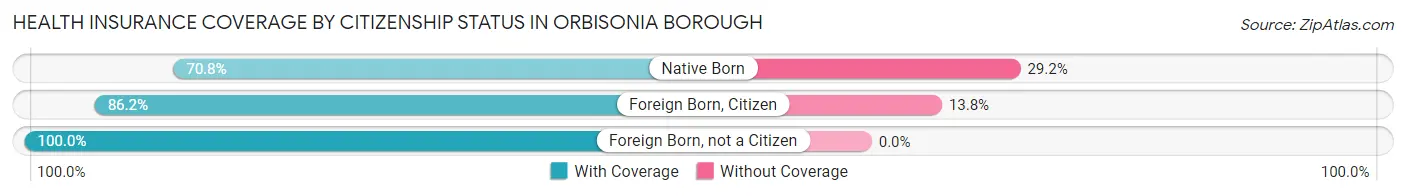
| Citizenship Status | With Coverage | Without Coverage |
| Native Born | 46 (70.8%) | 19 (29.2%) |
| Foreign Born, Citizen | 50 (86.2%) | 8 (13.8%) |
| Foreign Born, not a Citizen | 30 (100.0%) | 0 (0.0%) |
Health Insurance Coverage by Household Income in Orbisonia borough
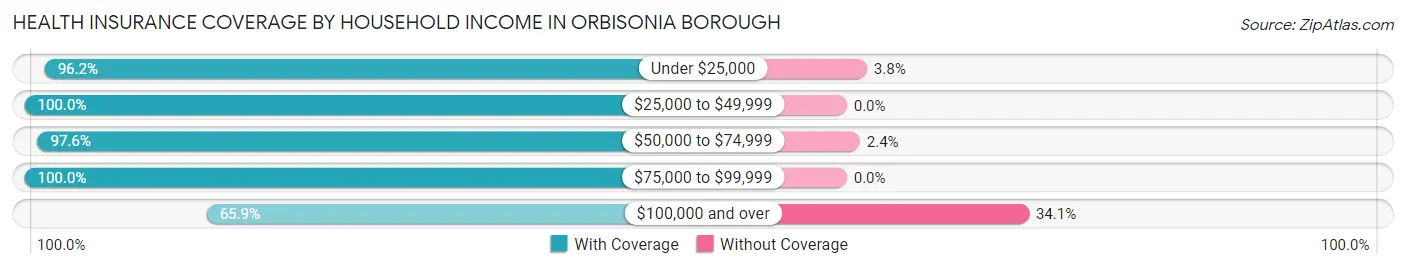
| Household Income | With Coverage | Without Coverage |
| Under $25,000 | 102 (96.2%) | 4 (3.8%) |
| $25,000 to $49,999 | 85 (100.0%) | 0 (0.0%) |
| $50,000 to $74,999 | 40 (97.6%) | 1 (2.4%) |
| $75,000 to $99,999 | 123 (100.0%) | 0 (0.0%) |
| $100,000 and over | 83 (65.9%) | 43 (34.1%) |
Public vs Private Health Insurance Coverage by Age in Orbisonia borough
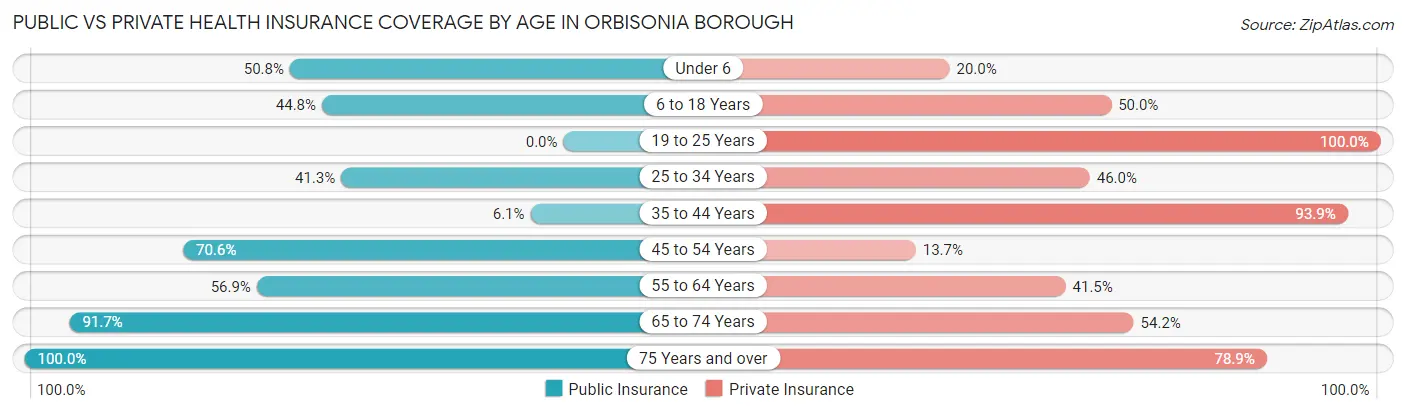
| Age Bracket | Public Insurance | Private Insurance |
| Under 6 | 33 (50.8%) | 13 (20.0%) |
| 6 to 18 Years | 26 (44.8%) | 29 (50.0%) |
| 19 to 25 Years | 0 (0.0%) | 30 (100.0%) |
| 25 to 34 Years | 26 (41.3%) | 29 (46.0%) |
| 35 to 44 Years | 3 (6.1%) | 46 (93.9%) |
| 45 to 54 Years | 36 (70.6%) | 7 (13.7%) |
| 55 to 64 Years | 37 (56.9%) | 27 (41.5%) |
| 65 to 74 Years | 44 (91.7%) | 26 (54.2%) |
| 75 Years and over | 52 (100.0%) | 41 (78.8%) |
| Total | 257 (53.4%) | 248 (51.6%) |
Disability Status by Sex by Age in Orbisonia borough
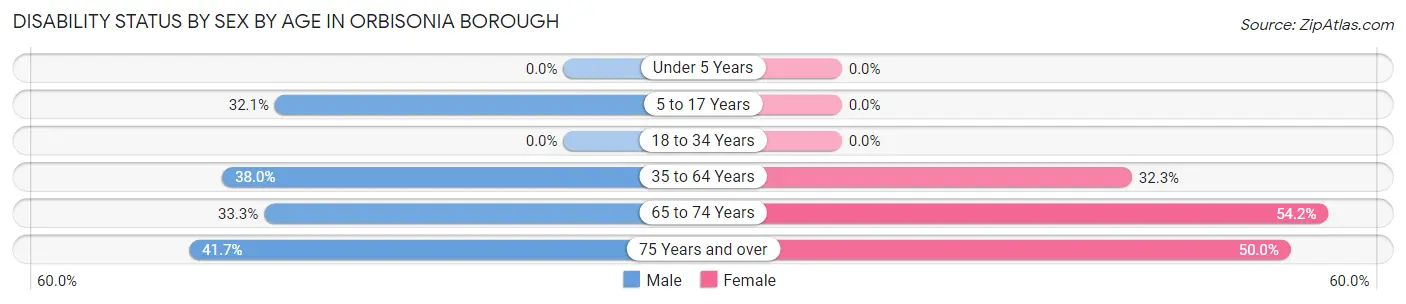
| Age Bracket | Male | Female |
| Under 5 Years | 0 (0.0%) | 0 (0.0%) |
| 5 to 17 Years | 9 (32.1%) | 0 (0.0%) |
| 18 to 34 Years | 0 (0.0%) | 0 (0.0%) |
| 35 to 64 Years | 38 (38.0%) | 21 (32.3%) |
| 65 to 74 Years | 8 (33.3%) | 13 (54.2%) |
| 75 Years and over | 5 (41.7%) | 20 (50.0%) |
Disability Class by Sex by Age in Orbisonia borough
Disability Class: Hearing Difficulty
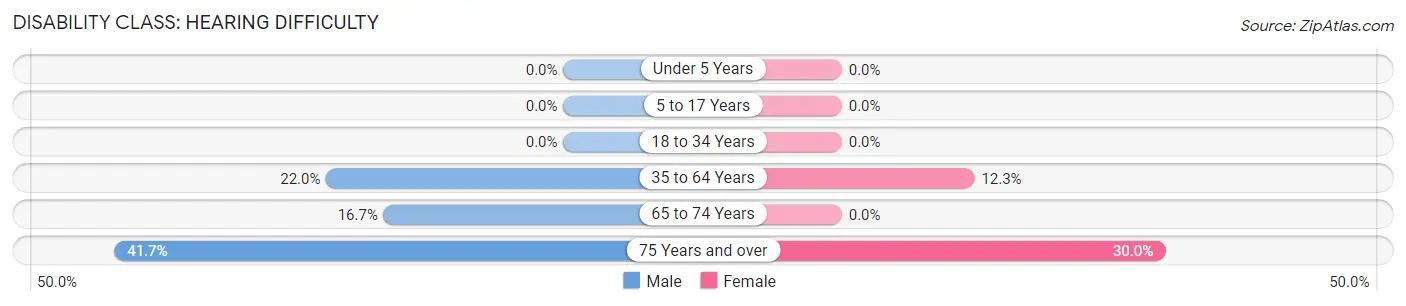
| Age Bracket | Male | Female |
| Under 5 Years | 0 (0.0%) | 0 (0.0%) |
| 5 to 17 Years | 0 (0.0%) | 0 (0.0%) |
| 18 to 34 Years | 0 (0.0%) | 0 (0.0%) |
| 35 to 64 Years | 22 (22.0%) | 8 (12.3%) |
| 65 to 74 Years | 4 (16.7%) | 0 (0.0%) |
| 75 Years and over | 5 (41.7%) | 12 (30.0%) |
Disability Class: Vision Difficulty
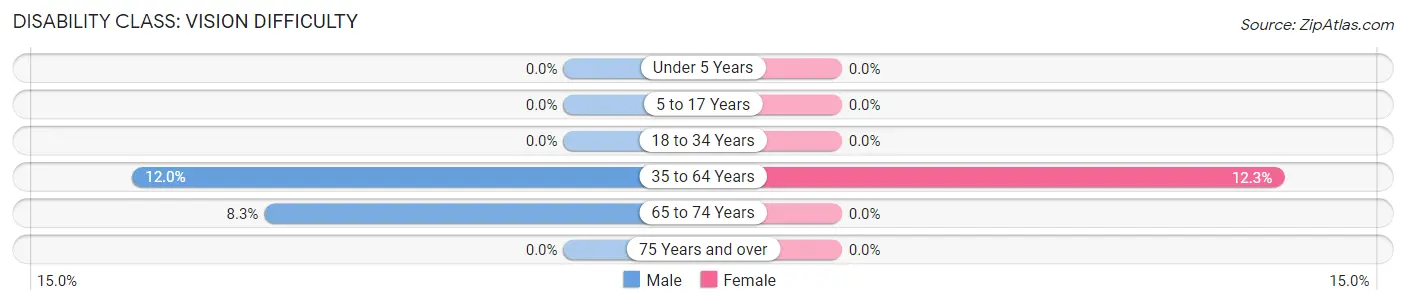
| Age Bracket | Male | Female |
| Under 5 Years | 0 (0.0%) | 0 (0.0%) |
| 5 to 17 Years | 0 (0.0%) | 0 (0.0%) |
| 18 to 34 Years | 0 (0.0%) | 0 (0.0%) |
| 35 to 64 Years | 12 (12.0%) | 8 (12.3%) |
| 65 to 74 Years | 2 (8.3%) | 0 (0.0%) |
| 75 Years and over | 0 (0.0%) | 0 (0.0%) |
Disability Class: Cognitive Difficulty
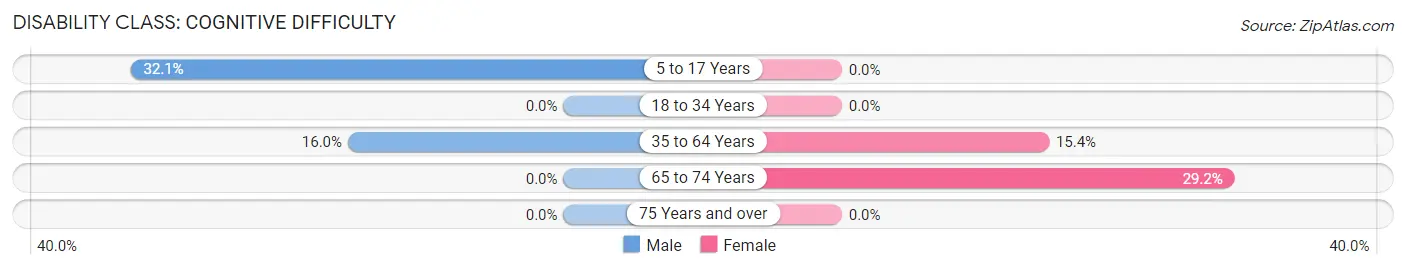
| Age Bracket | Male | Female |
| 5 to 17 Years | 9 (32.1%) | 0 (0.0%) |
| 18 to 34 Years | 0 (0.0%) | 0 (0.0%) |
| 35 to 64 Years | 16 (16.0%) | 10 (15.4%) |
| 65 to 74 Years | 0 (0.0%) | 7 (29.2%) |
| 75 Years and over | 0 (0.0%) | 0 (0.0%) |
Disability Class: Ambulatory Difficulty
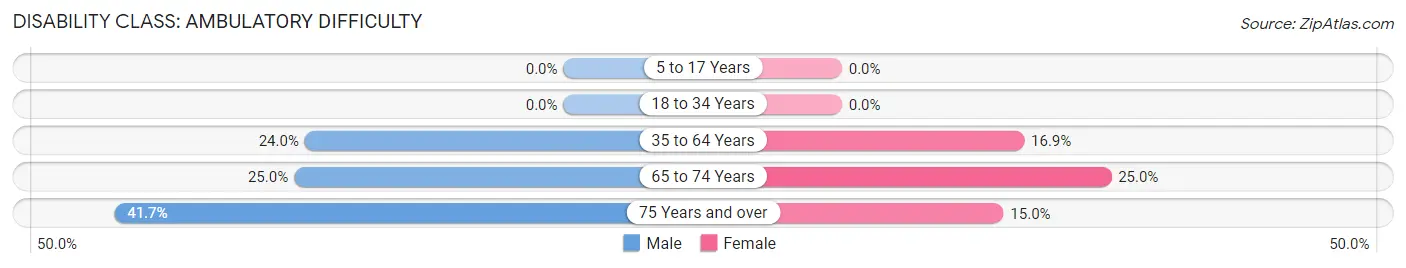
| Age Bracket | Male | Female |
| 5 to 17 Years | 0 (0.0%) | 0 (0.0%) |
| 18 to 34 Years | 0 (0.0%) | 0 (0.0%) |
| 35 to 64 Years | 24 (24.0%) | 11 (16.9%) |
| 65 to 74 Years | 6 (25.0%) | 6 (25.0%) |
| 75 Years and over | 5 (41.7%) | 6 (15.0%) |
Disability Class: Self-Care Difficulty
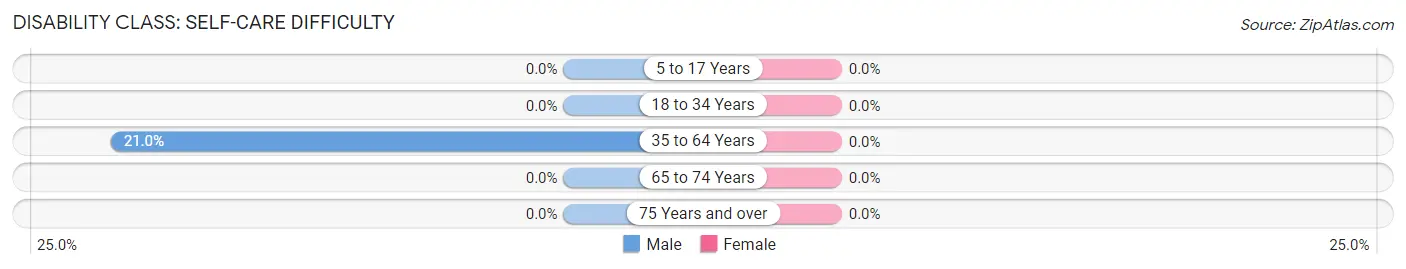
| Age Bracket | Male | Female |
| 5 to 17 Years | 0 (0.0%) | 0 (0.0%) |
| 18 to 34 Years | 0 (0.0%) | 0 (0.0%) |
| 35 to 64 Years | 21 (21.0%) | 0 (0.0%) |
| 65 to 74 Years | 0 (0.0%) | 0 (0.0%) |
| 75 Years and over | 0 (0.0%) | 0 (0.0%) |
Technology Access in Orbisonia borough
Computing Device Access in Orbisonia borough
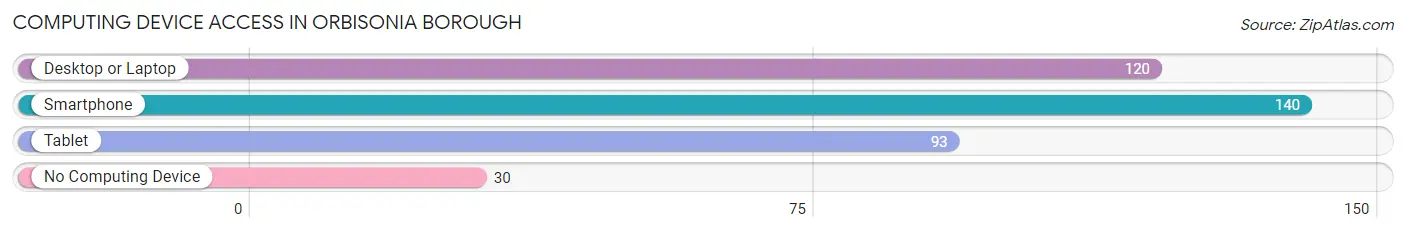
| Device Type | # Households | % Households |
| Desktop or Laptop | 120 | 63.5% |
| Smartphone | 140 | 74.1% |
| Tablet | 93 | 49.2% |
| No Computing Device | 30 | 15.9% |
| Total | 189 | 100.0% |
Internet Access in Orbisonia borough
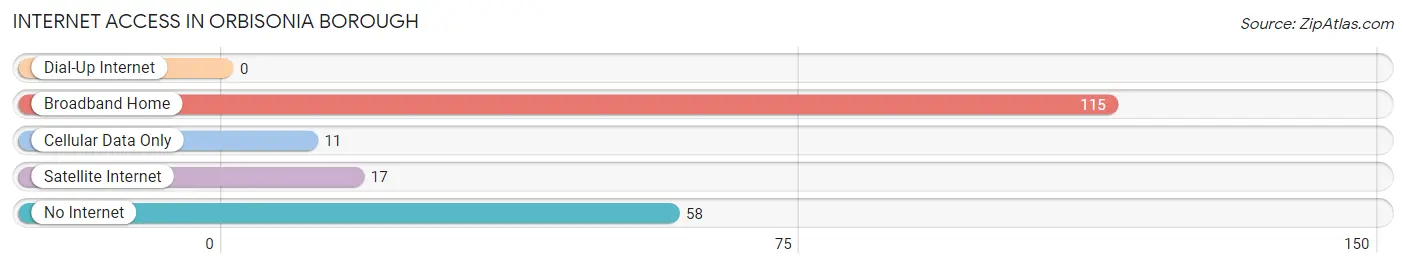
| Internet Type | # Households | % Households |
| Dial-Up Internet | 0 | 0.0% |
| Broadband Home | 115 | 60.9% |
| Cellular Data Only | 11 | 5.8% |
| Satellite Internet | 17 | 9.0% |
| No Internet | 58 | 30.7% |
| Total | 189 | 100.0% |
Orbisonia borough Summary
Orbisonia Borough is a small borough located in Huntingdon County, Pennsylvania. It is situated in the foothills of the Allegheny Mountains and is part of the Altoona Metropolitan Statistical Area. The borough has a population of approximately 500 people and covers an area of 0.3 square miles.
History
The area that is now Orbisonia Borough was first settled in the late 1700s by German and Scots-Irish immigrants. The town was originally known as “Mountain Town” and was later renamed “Orbisonia” after the Orbison family, who were early settlers in the area. The town was officially incorporated in 1876.
In the late 1800s, Orbisonia was a thriving industrial center, with several coal mines, a tannery, a sawmill, and a brickyard. The town was also home to the East Broad Top Railroad, which operated from 1874 to 1956. The railroad was a major employer in the area and helped to spur economic growth.
In the early 1900s, Orbisonia was a popular tourist destination, with several hotels and resorts. The town was also home to a number of churches, including the First United Methodist Church, which was founded in 1876.
Geography
Orbisonia Borough is located in Huntingdon County, Pennsylvania. It is situated in the foothills of the Allegheny Mountains and is part of the Altoona Metropolitan Statistical Area. The borough has a total area of 0.3 square miles, all of which is land.
The borough is bordered by the townships of Shirley, Cromwell, and Hopewell. The town is located along U.S. Route 22, which runs through the center of town. The nearest major cities are Altoona (25 miles to the east) and Harrisburg (90 miles to the west).
Economy
The economy of Orbisonia Borough is largely based on tourism and agriculture. The town is home to several small businesses, including a grocery store, a hardware store, and a restaurant. The town is also home to a number of bed and breakfasts, which attract visitors from all over the region.
Agriculture is also an important part of the local economy. The borough is home to several farms, which produce a variety of crops, including corn, soybeans, and hay.
Demographics
As of the 2010 census, there were 500 people living in Orbisonia Borough. The racial makeup of the borough was 97.2% White, 0.6% African American, 0.2% Native American, 0.2% Asian, and 1.8% from two or more races. Hispanic or Latino of any race were 0.6% of the population.
The median household income in Orbisonia Borough was $37,500, and the median family income was $41,250. The per capita income for the borough was $17,857. About 11.2% of families and 13.2% of the population were below the poverty line, including 17.6% of those under age 18 and none of those age 65 or over.
Common Questions
What is Per Capita Income in Orbisonia borough?
Per Capita income in Orbisonia borough is $24,005.
What is the Median Family Income in Orbisonia borough?
Median Family Income in Orbisonia borough is $80,982.
What is the Median Household income in Orbisonia borough?
Median Household Income in Orbisonia borough is $34,861.
What is Inequality or Gini Index in Orbisonia borough?
Inequality or Gini Index in Orbisonia borough is 0.44.
What is the Total Population of Orbisonia borough?
Total Population of Orbisonia borough is 481.
What is the Total Male Population of Orbisonia borough?
Total Male Population of Orbisonia borough is 222.
What is the Total Female Population of Orbisonia borough?
Total Female Population of Orbisonia borough is 259.
What is the Ratio of Males per 100 Females in Orbisonia borough?
There are 85.71 Males per 100 Females in Orbisonia borough.
What is the Ratio of Females per 100 Males in Orbisonia borough?
There are 116.67 Females per 100 Males in Orbisonia borough.
What is the Median Population Age in Orbisonia borough?
Median Population Age in Orbisonia borough is 40.5 Years.
What is the Average Family Size in Orbisonia borough
Average Family Size in Orbisonia borough is 3.5 People.
What is the Average Household Size in Orbisonia borough
Average Household Size in Orbisonia borough is 2.5 People.
How Large is the Labor Force in Orbisonia borough?
There are 165 People in the Labor Forcein in Orbisonia borough.
What is the Percentage of People in the Labor Force in Orbisonia borough?
45.6% of People are in the Labor Force in Orbisonia borough.
What is the Unemployment Rate in Orbisonia borough?
Unemployment Rate in Orbisonia borough is 1.8%.