Kratzerville, PA Map & Demographics
Kratzerville Map
Kratzerville Overview
$45,888
PER CAPITA INCOME
$93,333
AVG FAMILY INCOME
$88,333
AVG HOUSEHOLD INCOME
40.5%
WAGE / INCOME GAP [ % ]
59.5¢/ $1
WAGE / INCOME GAP [ $ ]
0.35
INEQUALITY / GINI INDEX
320
TOTAL POPULATION
187
MALE POPULATION
133
FEMALE POPULATION
140.60
MALES / 100 FEMALES
71.12
FEMALES / 100 MALES
55.8
MEDIAN AGE
2.3
AVG FAMILY SIZE
1.9
AVG HOUSEHOLD SIZE
162
LABOR FORCE [ PEOPLE ]
56.3%
PERCENT IN LABOR FORCE
1.2%
UNEMPLOYMENT RATE
Income in Kratzerville
Income Overview in Kratzerville
Per Capita Income in Kratzerville is $45,888, while median incomes of families and households are $93,333 and $88,333 respectively.
| Characteristic | Number | Measure |
| Per Capita Income | 320 | $45,888 |
| Median Family Income | 96 | $93,333 |
| Mean Family Income | 96 | $111,961 |
| Median Household Income | 166 | $88,333 |
| Mean Household Income | 166 | $95,875 |
| Income Deficit | 96 | $0 |
| Wage / Income Gap (%) | 320 | 40.46% |
| Wage / Income Gap ($) | 320 | 59.54¢ per $1 |
| Gini / Inequality Index | 320 | 0.35 |
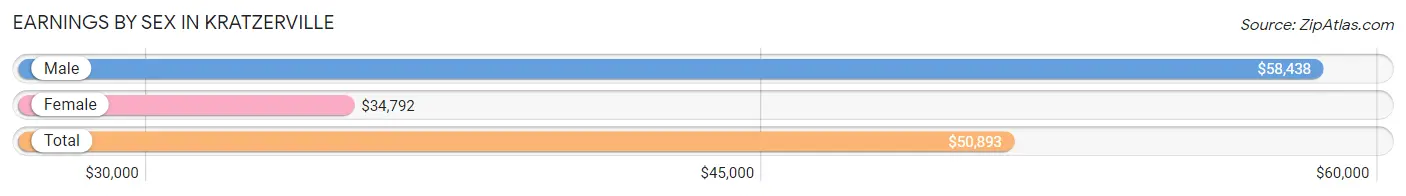
Earnings by Sex in Kratzerville
Average Earnings in Kratzerville are $50,893, $58,438 for men and $34,792 for women, a difference of 40.5%.
| Sex | Number | Average Earnings |
| Male | 118 (65.2%) | $58,438 |
| Female | 63 (34.8%) | $34,792 |
| Total | 181 (100.0%) | $50,893 |
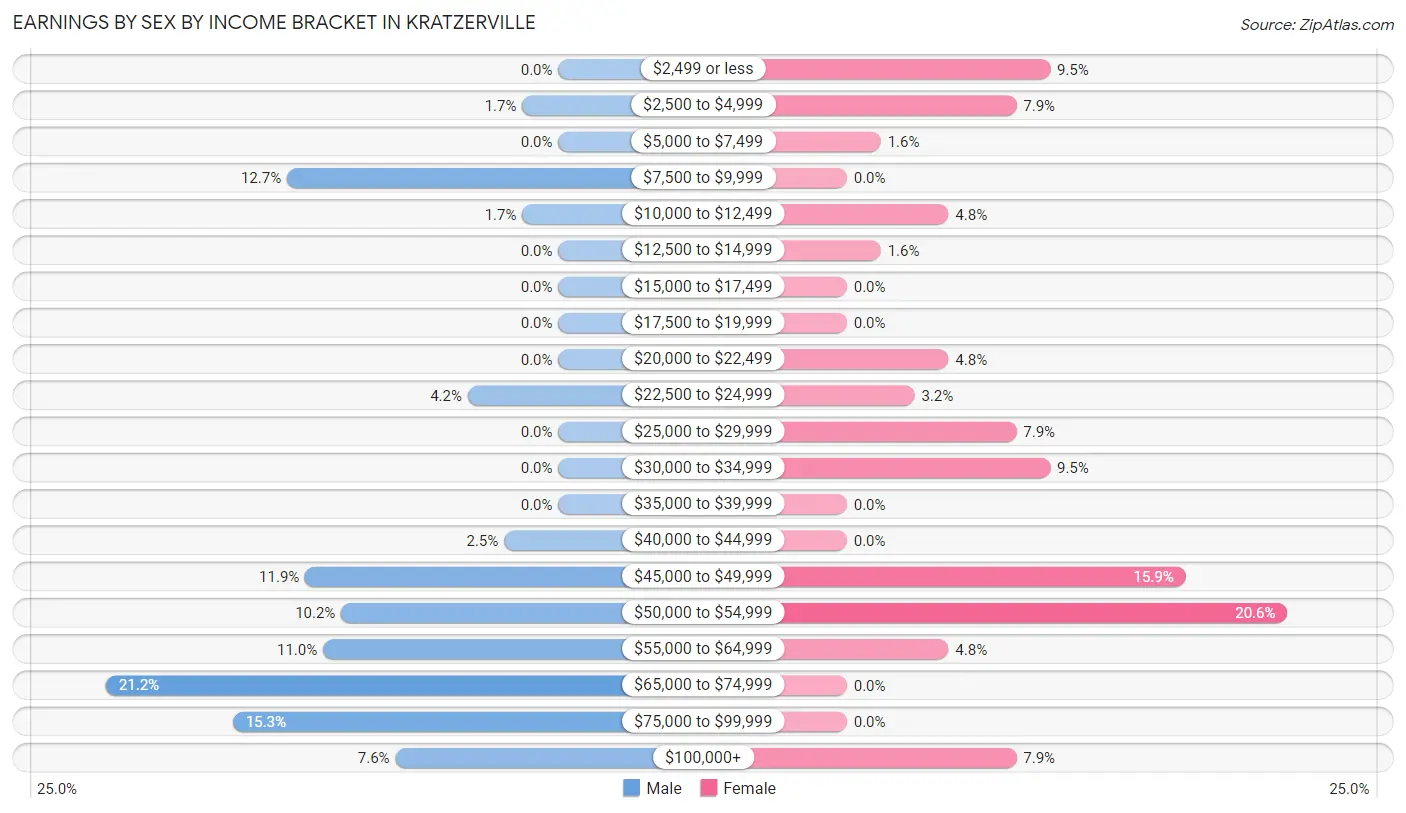
Earnings by Sex by Income Bracket in Kratzerville
The most common earnings brackets in Kratzerville are $65,000 to $74,999 for men (25 | 21.2%) and $50,000 to $54,999 for women (13 | 20.6%).
| Income | Male | Female |
| $2,499 or less | 0 (0.0%) | 6 (9.5%) |
| $2,500 to $4,999 | 2 (1.7%) | 5 (7.9%) |
| $5,000 to $7,499 | 0 (0.0%) | 1 (1.6%) |
| $7,500 to $9,999 | 15 (12.7%) | 0 (0.0%) |
| $10,000 to $12,499 | 2 (1.7%) | 3 (4.8%) |
| $12,500 to $14,999 | 0 (0.0%) | 1 (1.6%) |
| $15,000 to $17,499 | 0 (0.0%) | 0 (0.0%) |
| $17,500 to $19,999 | 0 (0.0%) | 0 (0.0%) |
| $20,000 to $22,499 | 0 (0.0%) | 3 (4.8%) |
| $22,500 to $24,999 | 5 (4.2%) | 2 (3.2%) |
| $25,000 to $29,999 | 0 (0.0%) | 5 (7.9%) |
| $30,000 to $34,999 | 0 (0.0%) | 6 (9.5%) |
| $35,000 to $39,999 | 0 (0.0%) | 0 (0.0%) |
| $40,000 to $44,999 | 3 (2.5%) | 0 (0.0%) |
| $45,000 to $49,999 | 14 (11.9%) | 10 (15.9%) |
| $50,000 to $54,999 | 12 (10.2%) | 13 (20.6%) |
| $55,000 to $64,999 | 13 (11.0%) | 3 (4.8%) |
| $65,000 to $74,999 | 25 (21.2%) | 0 (0.0%) |
| $75,000 to $99,999 | 18 (15.2%) | 0 (0.0%) |
| $100,000+ | 9 (7.6%) | 5 (7.9%) |
| Total | 118 (100.0%) | 63 (100.0%) |
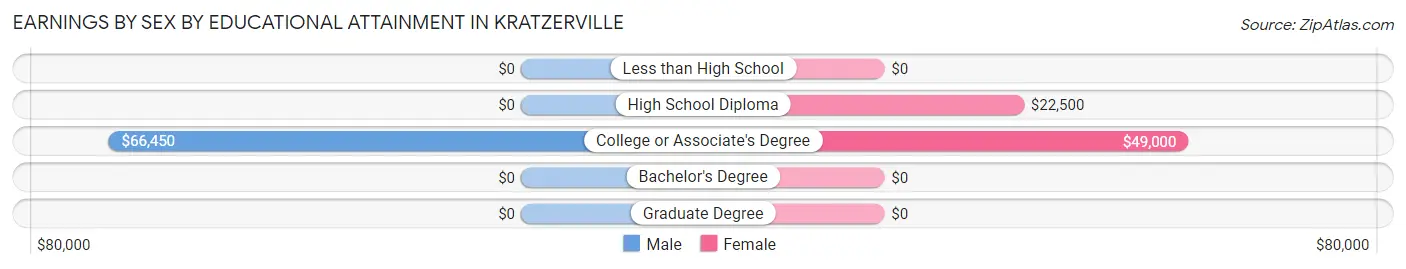
Earnings by Sex by Educational Attainment in Kratzerville
Average earnings in Kratzerville are $59,531 for men and $46,000 for women, a difference of 22.7%. Men with an educational attainment of college or associate's degree enjoy the highest average annual earnings of $66,450, while those with college or associate's degree education earn the least with $66,450. Women with an educational attainment of college or associate's degree earn the most with the average annual earnings of $49,000, while those with high school diploma education have the smallest earnings of $22,500.
| Educational Attainment | Male Income | Female Income |
| Less than High School | - | - |
| High School Diploma | - | - |
| College or Associate's Degree | $66,450 | $49,000 |
| Bachelor's Degree | - | - |
| Graduate Degree | - | - |
| Total | $59,531 | $46,000 |
Family Income in Kratzerville
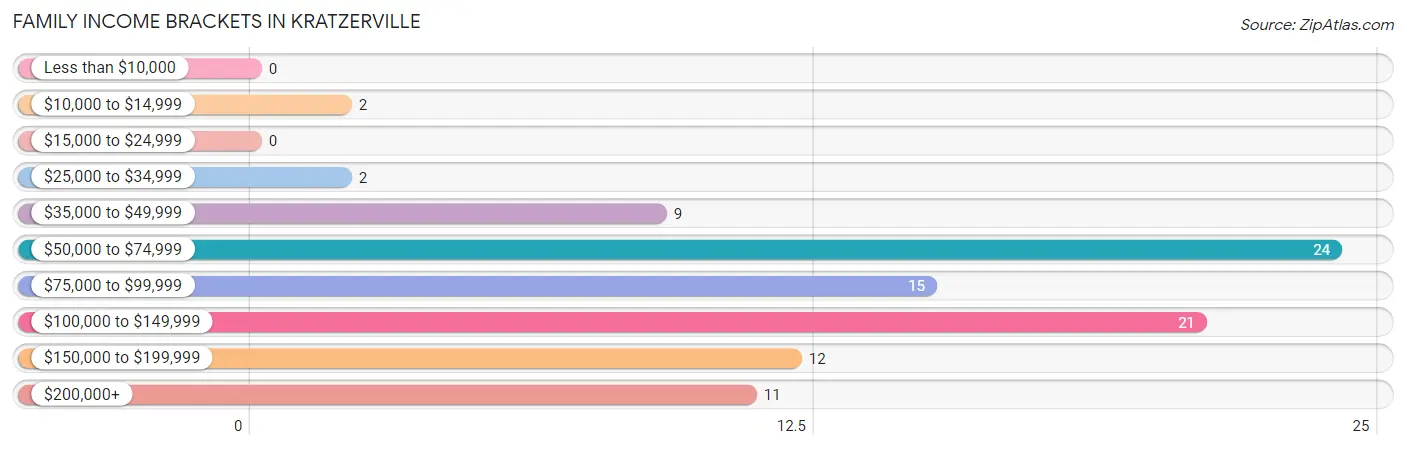
Family Income Brackets in Kratzerville
According to the Kratzerville family income data, there are 24 families falling into the $50,000 to $74,999 income range, which is the most common income bracket and makes up 25.0% of all families.
| Income Bracket | # Families | % Families |
| Less than $10,000 | 0 | 0.0% |
| $10,000 to $14,999 | 2 | 2.1% |
| $15,000 to $24,999 | 0 | 0.0% |
| $25,000 to $34,999 | 2 | 2.1% |
| $35,000 to $49,999 | 9 | 9.4% |
| $50,000 to $74,999 | 24 | 25.0% |
| $75,000 to $99,999 | 15 | 15.6% |
| $100,000 to $149,999 | 21 | 21.9% |
| $150,000 to $199,999 | 12 | 12.5% |
| $200,000+ | 11 | 11.5% |
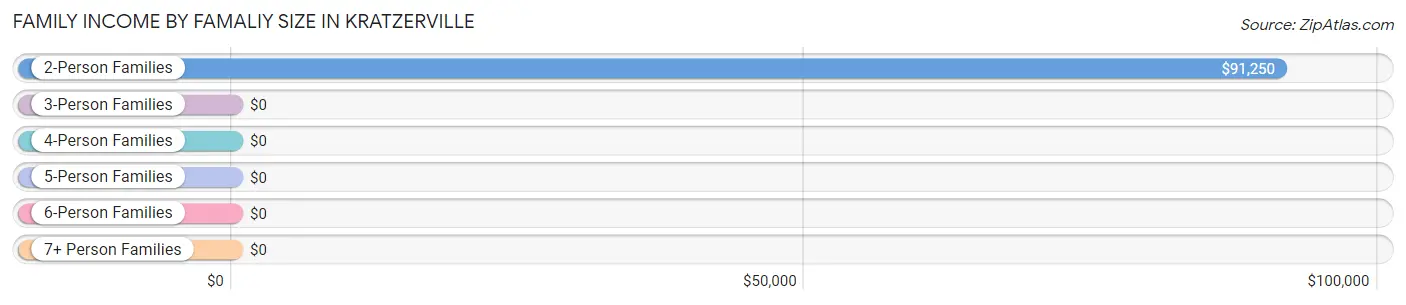
Family Income by Famaliy Size in Kratzerville
2-person families (71 | 74.0%) account for the highest median family income in Kratzerville with $91,250 per family, while 2-person families (71 | 74.0%) have the highest median income of $45,625 per family member.
| Income Bracket | # Families | Median Income |
| 2-Person Families | 71 (74.0%) | $91,250 |
| 3-Person Families | 12 (12.5%) | $0 |
| 4-Person Families | 8 (8.3%) | $0 |
| 5-Person Families | 5 (5.2%) | $0 |
| 6-Person Families | 0 (0.0%) | $0 |
| 7+ Person Families | 0 (0.0%) | $0 |
| Total | 96 (100.0%) | $93,333 |
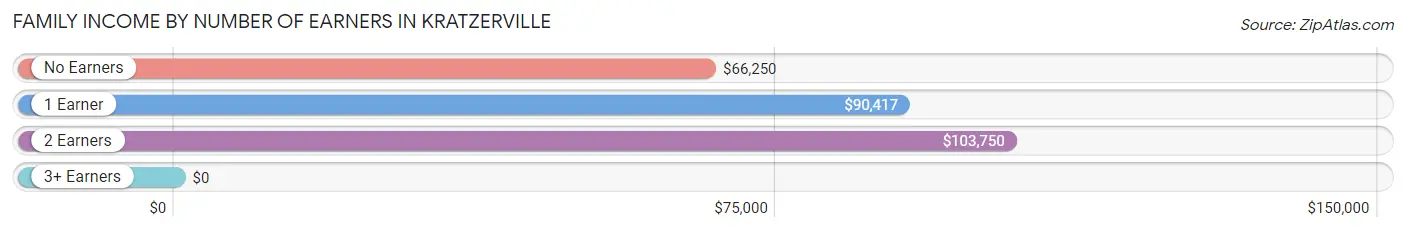
Family Income by Number of Earners in Kratzerville
| Number of Earners | # Families | Median Income |
| No Earners | 26 (27.1%) | $66,250 |
| 1 Earner | 27 (28.1%) | $90,417 |
| 2 Earners | 37 (38.5%) | $103,750 |
| 3+ Earners | 6 (6.2%) | $0 |
| Total | 96 (100.0%) | $93,333 |
Household Income in Kratzerville
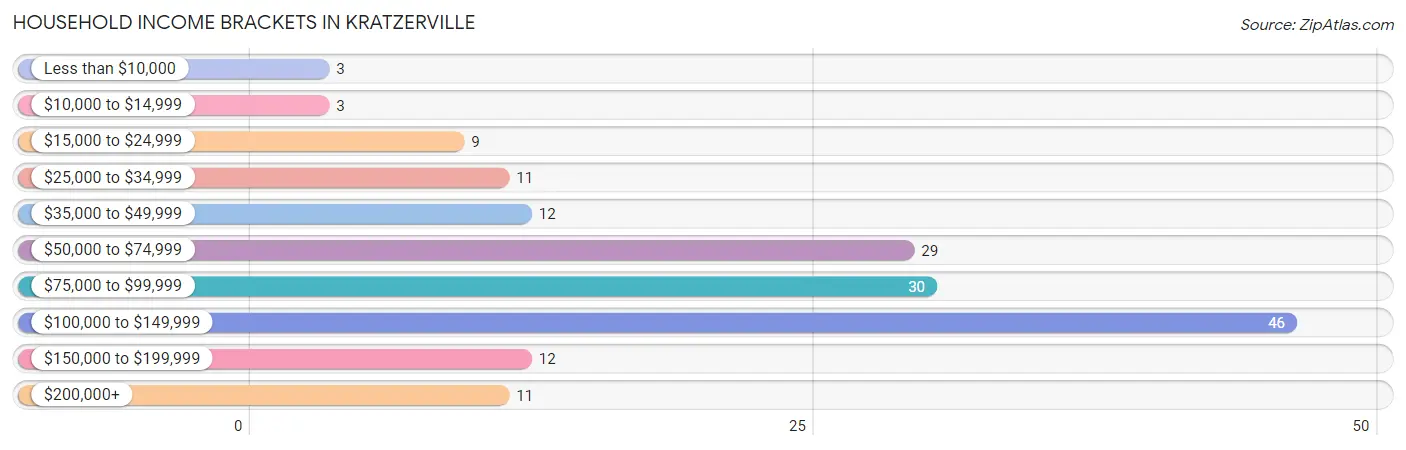
Household Income Brackets in Kratzerville
With 46 households falling in the category, the $100,000 to $149,999 income range is the most frequent in Kratzerville, accounting for 27.7% of all households. In contrast, only 3 households (1.8%) fall into the less than $10,000 income bracket, making it the least populous group.
| Income Bracket | # Households | % Households |
| Less than $10,000 | 3 | 1.8% |
| $10,000 to $14,999 | 3 | 1.8% |
| $15,000 to $24,999 | 9 | 5.4% |
| $25,000 to $34,999 | 11 | 6.6% |
| $35,000 to $49,999 | 12 | 7.2% |
| $50,000 to $74,999 | 29 | 17.5% |
| $75,000 to $99,999 | 30 | 18.1% |
| $100,000 to $149,999 | 46 | 27.7% |
| $150,000 to $199,999 | 12 | 7.2% |
| $200,000+ | 11 | 6.6% |
Household Income by Householder Age in Kratzerville
The median household income in Kratzerville is $88,333, with the highest median household income of $103,750 found in the 45 to 64 years age bracket for the primary householder. A total of 71 households (42.8%) fall into this category. Meanwhile, the 15 to 24 years age bracket for the primary householder has the lowest median household income of $0, with 1 households (0.6%) in this group.
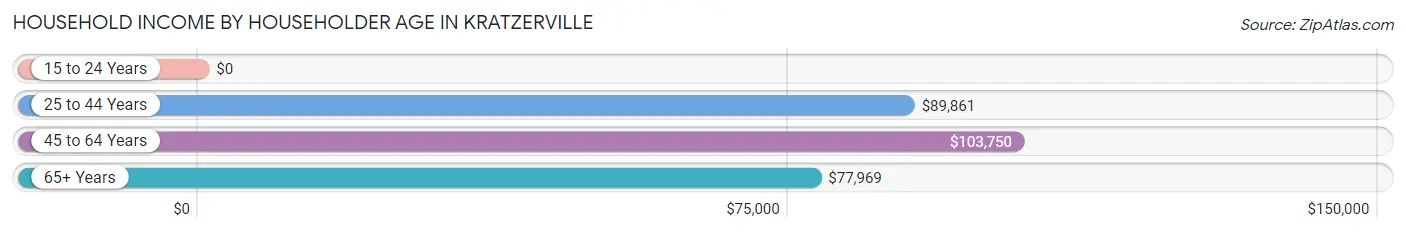
| Income Bracket | # Households | Median Income |
| 15 to 24 Years | 1 (0.6%) | $0 |
| 25 to 44 Years | 33 (19.9%) | $89,861 |
| 45 to 64 Years | 71 (42.8%) | $103,750 |
| 65+ Years | 61 (36.7%) | $77,969 |
| Total | 166 (100.0%) | $88,333 |
Poverty in Kratzerville
Income Below Poverty by Sex and Age in Kratzerville
With 11.2% poverty level for males and 3.8% for females among the residents of Kratzerville, 18 to 24 year old males and 18 to 24 year old females are the most vulnerable to poverty, with 4 males (57.1%) and 1 females (25.0%) in their respective age groups living below the poverty level.
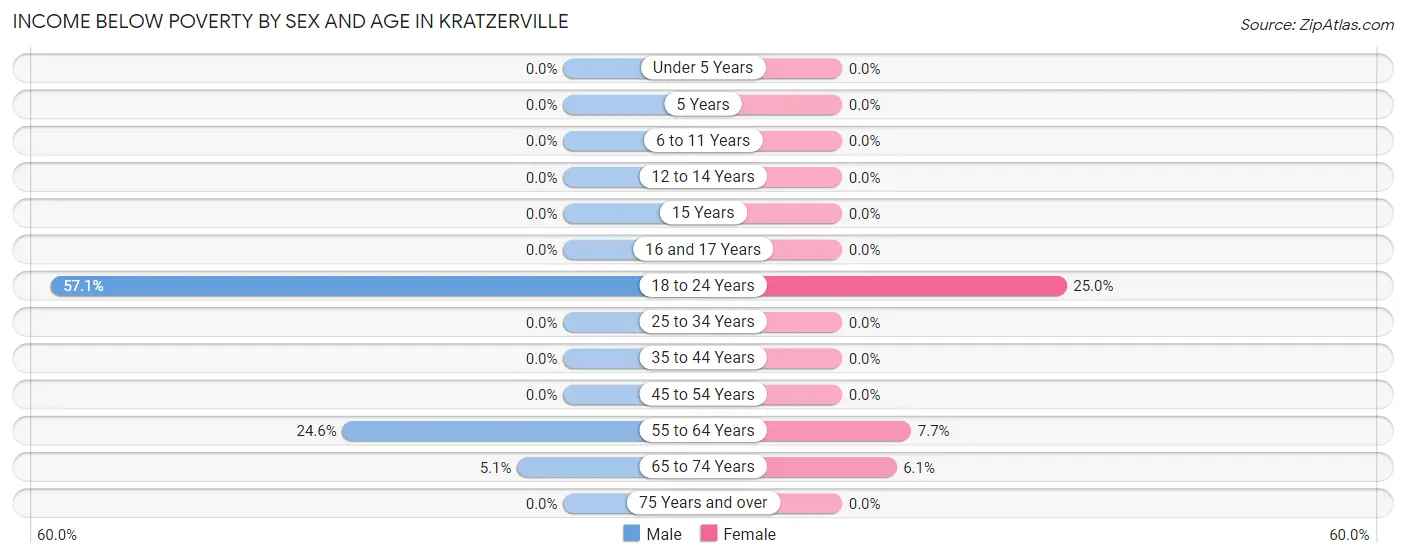
| Age Bracket | Male | Female |
| Under 5 Years | 0 (0.0%) | 0 (0.0%) |
| 5 Years | 0 (0.0%) | 0 (0.0%) |
| 6 to 11 Years | 0 (0.0%) | 0 (0.0%) |
| 12 to 14 Years | 0 (0.0%) | 0 (0.0%) |
| 15 Years | 0 (0.0%) | 0 (0.0%) |
| 16 and 17 Years | 0 (0.0%) | 0 (0.0%) |
| 18 to 24 Years | 4 (57.1%) | 1 (25.0%) |
| 25 to 34 Years | 0 (0.0%) | 0 (0.0%) |
| 35 to 44 Years | 0 (0.0%) | 0 (0.0%) |
| 45 to 54 Years | 0 (0.0%) | 0 (0.0%) |
| 55 to 64 Years | 15 (24.6%) | 2 (7.7%) |
| 65 to 74 Years | 2 (5.1%) | 2 (6.1%) |
| 75 Years and over | 0 (0.0%) | 0 (0.0%) |
| Total | 21 (11.2%) | 5 (3.8%) |
Income Above Poverty by Sex and Age in Kratzerville
According to the poverty statistics in Kratzerville, males aged under 5 years and females aged under 5 years are the age groups that are most secure financially, with 100.0% of males and 100.0% of females in these age groups living above the poverty line.
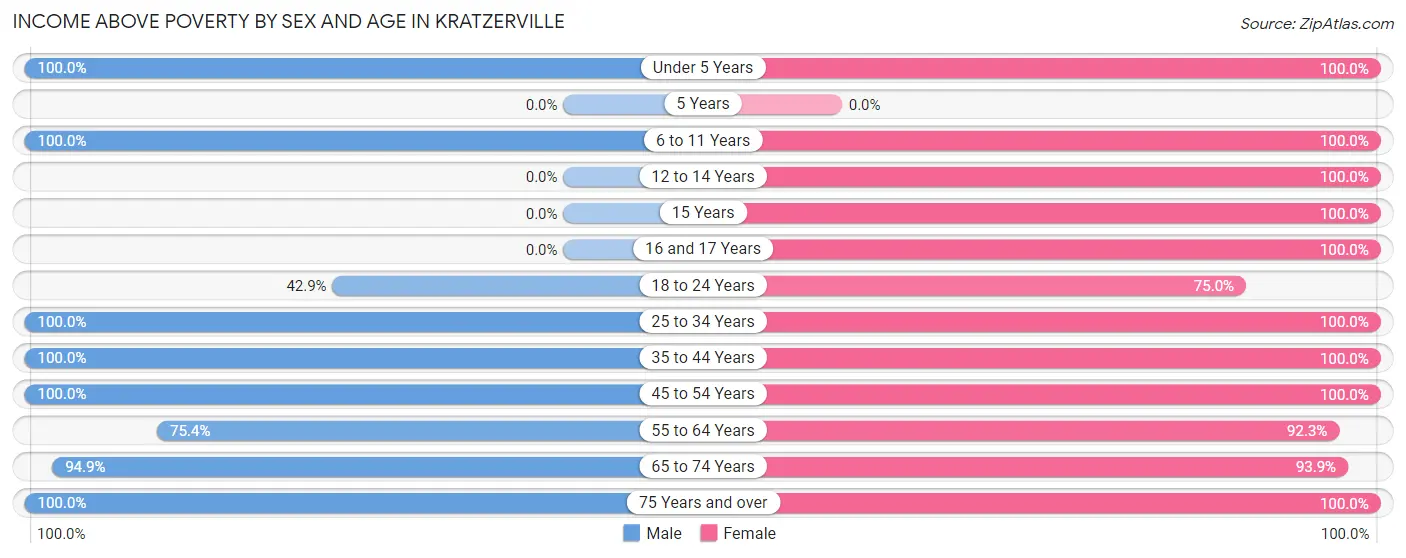
| Age Bracket | Male | Female |
| Under 5 Years | 8 (100.0%) | 5 (100.0%) |
| 5 Years | 0 (0.0%) | 0 (0.0%) |
| 6 to 11 Years | 9 (100.0%) | 4 (100.0%) |
| 12 to 14 Years | 0 (0.0%) | 4 (100.0%) |
| 15 Years | 0 (0.0%) | 2 (100.0%) |
| 16 and 17 Years | 0 (0.0%) | 1 (100.0%) |
| 18 to 24 Years | 3 (42.9%) | 3 (75.0%) |
| 25 to 34 Years | 22 (100.0%) | 17 (100.0%) |
| 35 to 44 Years | 9 (100.0%) | 9 (100.0%) |
| 45 to 54 Years | 13 (100.0%) | 22 (100.0%) |
| 55 to 64 Years | 46 (75.4%) | 24 (92.3%) |
| 65 to 74 Years | 37 (94.9%) | 31 (93.9%) |
| 75 Years and over | 19 (100.0%) | 6 (100.0%) |
| Total | 166 (88.8%) | 128 (96.2%) |
Income Below Poverty Among Married-Couple Families in Kratzerville
The poverty statistics for married-couple families in Kratzerville show that 2.2% or 2 of the total 90 families live below the poverty line. Families with no children have the highest poverty rate of 2.7%, comprising of 2 families. On the other hand, families with 1 or 2 children have the lowest poverty rate of 0.0%, which includes 0 families.
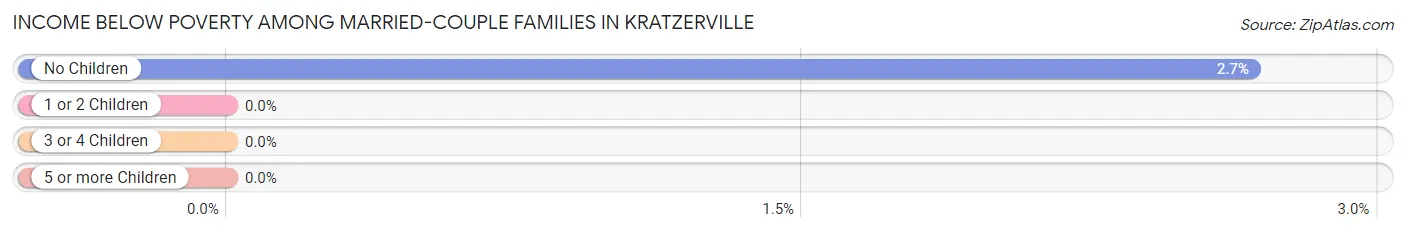
| Children | Above Poverty | Below Poverty |
| No Children | 73 (97.3%) | 2 (2.7%) |
| 1 or 2 Children | 10 (100.0%) | 0 (0.0%) |
| 3 or 4 Children | 5 (100.0%) | 0 (0.0%) |
| 5 or more Children | 0 (0.0%) | 0 (0.0%) |
| Total | 88 (97.8%) | 2 (2.2%) |
Income Below Poverty Among Single-Parent Households in Kratzerville
| Children | Single Father | Single Mother |
| No Children | 0 (0.0%) | 0 (0.0%) |
| 1 or 2 Children | 0 (0.0%) | 0 (0.0%) |
| 3 or 4 Children | 0 (0.0%) | 0 (0.0%) |
| 5 or more Children | 0 (0.0%) | 0 (0.0%) |
| Total | 0 (0.0%) | 0 (0.0%) |
Income Below Poverty Among Married-Couple vs Single-Parent Households in Kratzerville
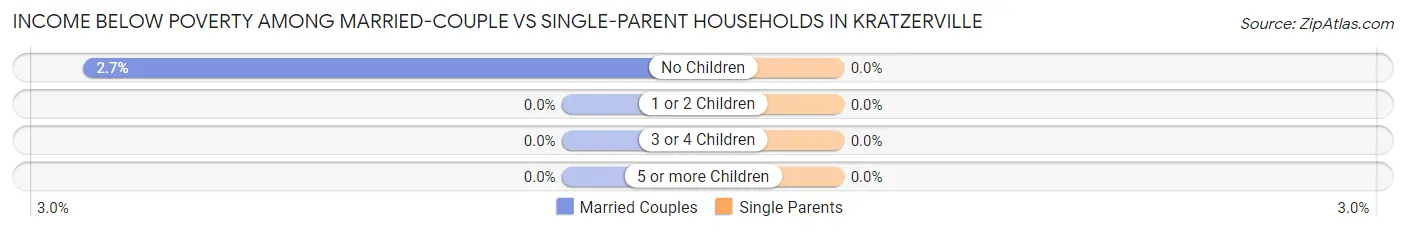
| Children | Married-Couple Families | Single-Parent Households |
| No Children | 2 (2.7%) | 0 (0.0%) |
| 1 or 2 Children | 0 (0.0%) | 0 (0.0%) |
| 3 or 4 Children | 0 (0.0%) | 0 (0.0%) |
| 5 or more Children | 0 (0.0%) | 0 (0.0%) |
| Total | 2 (2.2%) | 0 (0.0%) |
Race in Kratzerville
The most populous races in Kratzerville are White / Caucasian (309 | 96.6%), Two or more Races (11 | 3.4%), and Hispanic or Latino (4 | 1.3%).
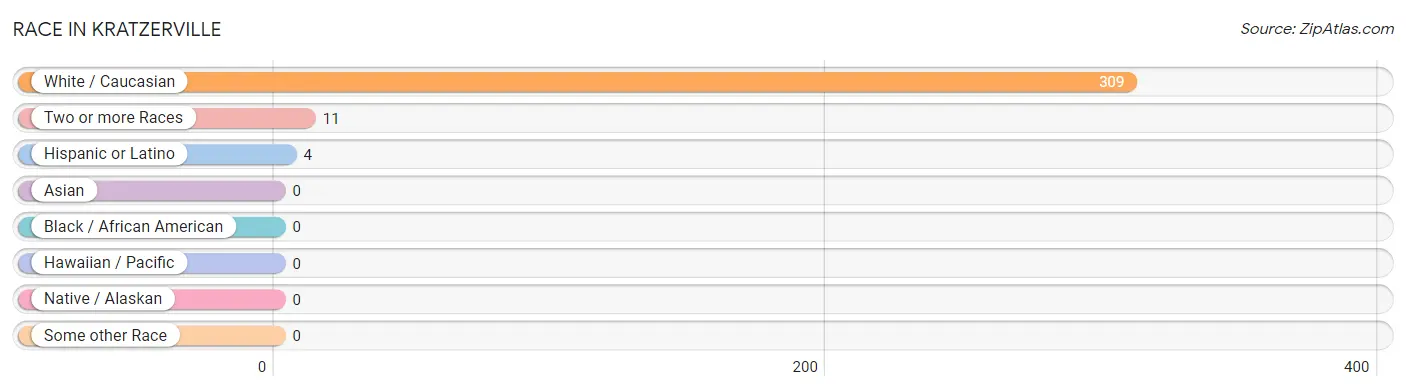
| Race | # Population | % Population |
| Asian | 0 | 0.0% |
| Black / African American | 0 | 0.0% |
| Hawaiian / Pacific | 0 | 0.0% |
| Hispanic or Latino | 4 | 1.3% |
| Native / Alaskan | 0 | 0.0% |
| White / Caucasian | 309 | 96.6% |
| Two or more Races | 11 | 3.4% |
| Some other Race | 0 | 0.0% |
| Total | 320 | 100.0% |
Ancestry in Kratzerville
The most populous ancestries reported in Kratzerville are German (140 | 43.8%), American (49 | 15.3%), Irish (28 | 8.7%), Italian (27 | 8.4%), and Dutch (25 | 7.8%), together accounting for 84.1% of all Kratzerville residents.
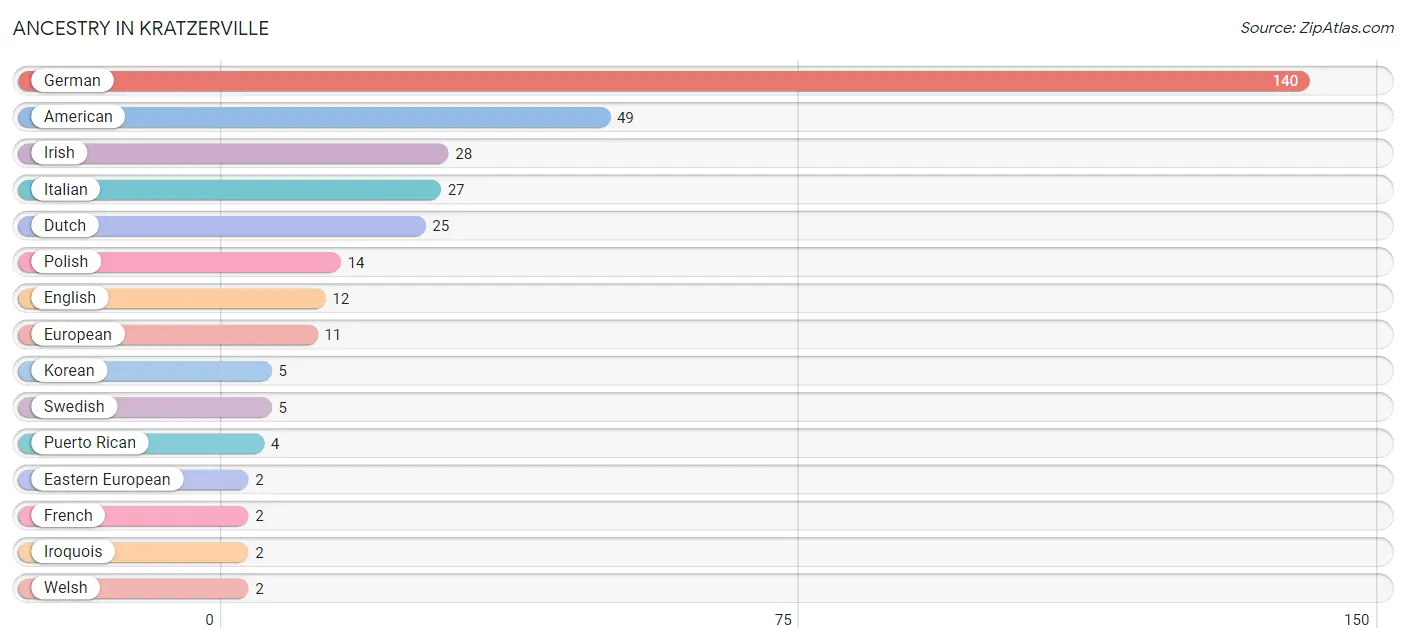
| Ancestry | # Population | % Population |
| American | 49 | 15.3% |
| Dutch | 25 | 7.8% |
| Eastern European | 2 | 0.6% |
| English | 12 | 3.7% |
| European | 11 | 3.4% |
| French | 2 | 0.6% |
| German | 140 | 43.8% |
| Irish | 28 | 8.7% |
| Iroquois | 2 | 0.6% |
| Italian | 27 | 8.4% |
| Korean | 5 | 1.6% |
| Polish | 14 | 4.4% |
| Puerto Rican | 4 | 1.3% |
| Swedish | 5 | 1.6% |
| Welsh | 2 | 0.6% | View All 15 Rows |
Immigrants in Kratzerville

| Immigration Origin | # Population | % Population | View All 0 Rows |
Sex and Age in Kratzerville
Sex and Age in Kratzerville
The most populous age groups in Kratzerville are 55 to 59 Years (37 | 19.8%) for men and 60 to 64 Years (17 | 12.8%) for women.
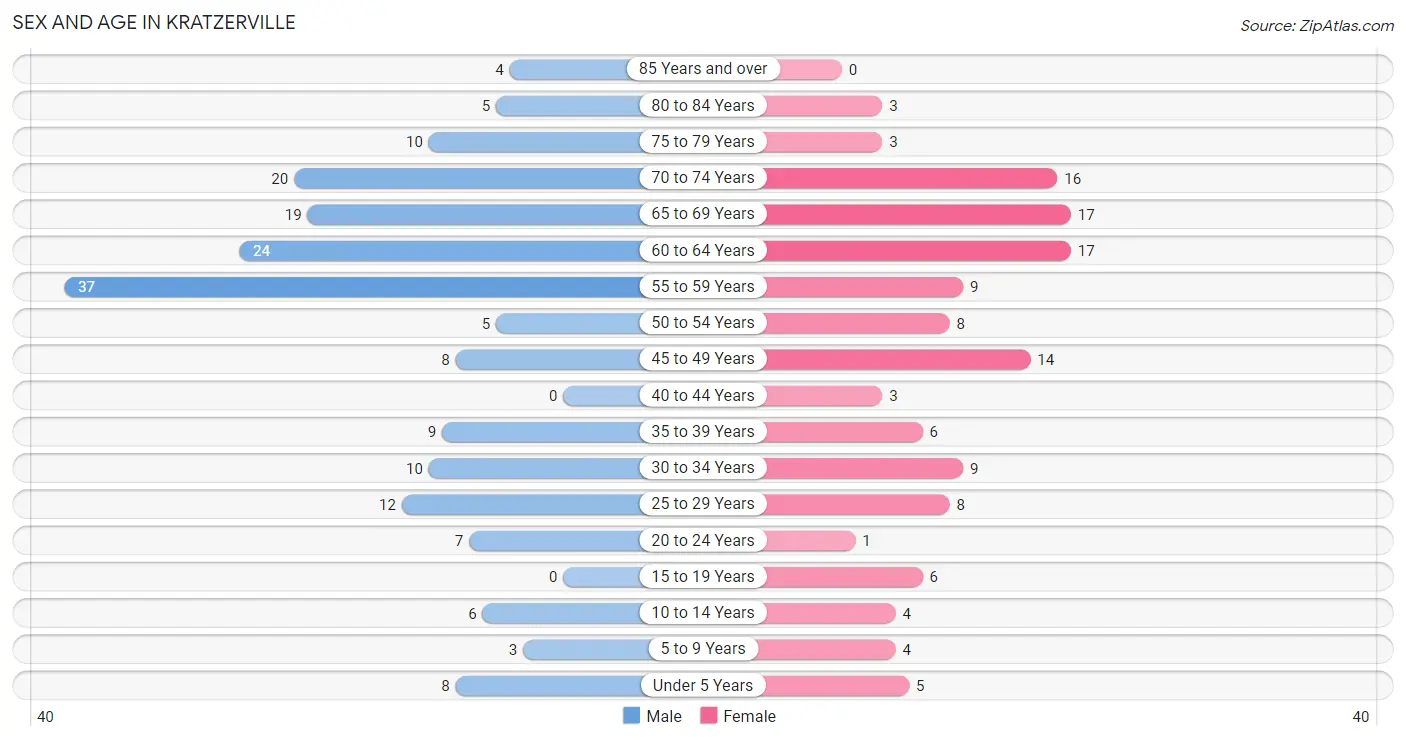
| Age Bracket | Male | Female |
| Under 5 Years | 8 (4.3%) | 5 (3.8%) |
| 5 to 9 Years | 3 (1.6%) | 4 (3.0%) |
| 10 to 14 Years | 6 (3.2%) | 4 (3.0%) |
| 15 to 19 Years | 0 (0.0%) | 6 (4.5%) |
| 20 to 24 Years | 7 (3.7%) | 1 (0.7%) |
| 25 to 29 Years | 12 (6.4%) | 8 (6.0%) |
| 30 to 34 Years | 10 (5.3%) | 9 (6.8%) |
| 35 to 39 Years | 9 (4.8%) | 6 (4.5%) |
| 40 to 44 Years | 0 (0.0%) | 3 (2.3%) |
| 45 to 49 Years | 8 (4.3%) | 14 (10.5%) |
| 50 to 54 Years | 5 (2.7%) | 8 (6.0%) |
| 55 to 59 Years | 37 (19.8%) | 9 (6.8%) |
| 60 to 64 Years | 24 (12.8%) | 17 (12.8%) |
| 65 to 69 Years | 19 (10.2%) | 17 (12.8%) |
| 70 to 74 Years | 20 (10.7%) | 16 (12.0%) |
| 75 to 79 Years | 10 (5.3%) | 3 (2.3%) |
| 80 to 84 Years | 5 (2.7%) | 3 (2.3%) |
| 85 Years and over | 4 (2.1%) | 0 (0.0%) |
| Total | 187 (100.0%) | 133 (100.0%) |
Families and Households in Kratzerville
Median Family Size in Kratzerville
The median family size in Kratzerville is 2.33 persons per family, with married-couple families (90 | 93.8%) accounting for the largest median family size of 2.34 persons per family. On the other hand, single male/father families (3 | 3.1%) represent the smallest median family size with 2.00 persons per family.
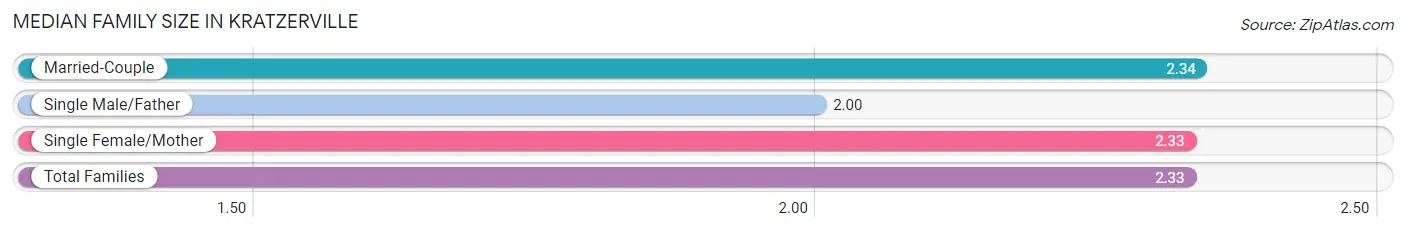
| Family Type | # Families | Family Size |
| Married-Couple | 90 (93.8%) | 2.34 |
| Single Male/Father | 3 (3.1%) | 2.00 |
| Single Female/Mother | 3 (3.1%) | 2.33 |
| Total Families | 96 (100.0%) | 2.33 |
Median Household Size in Kratzerville
The median household size in Kratzerville is 1.93 persons per household, with single male/father households (3 | 1.8%) accounting for the largest median household size of 2.67 persons per household. non-family households (70 | 42.2%) represent the smallest median household size with 1.34 persons per household.
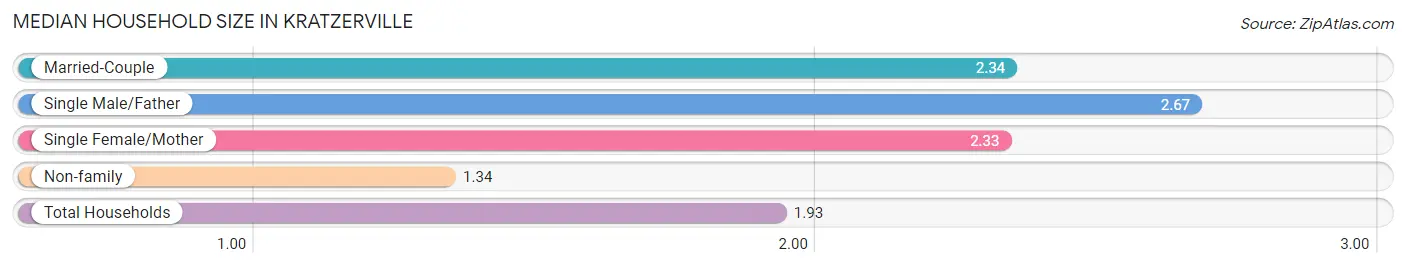
| Household Type | # Households | Household Size |
| Married-Couple | 90 (54.2%) | 2.34 |
| Single Male/Father | 3 (1.8%) | 2.67 |
| Single Female/Mother | 3 (1.8%) | 2.33 |
| Non-family | 70 (42.2%) | 1.34 |
| Total Households | 166 (100.0%) | 1.93 |
Household Size by Marriage Status in Kratzerville
Out of a total of 166 households in Kratzerville, 96 (57.8%) are family households, while 70 (42.2%) are nonfamily households. The most numerous type of family households are 2-person households, comprising 68, and the most common type of nonfamily households are 2-person households, comprising 37.
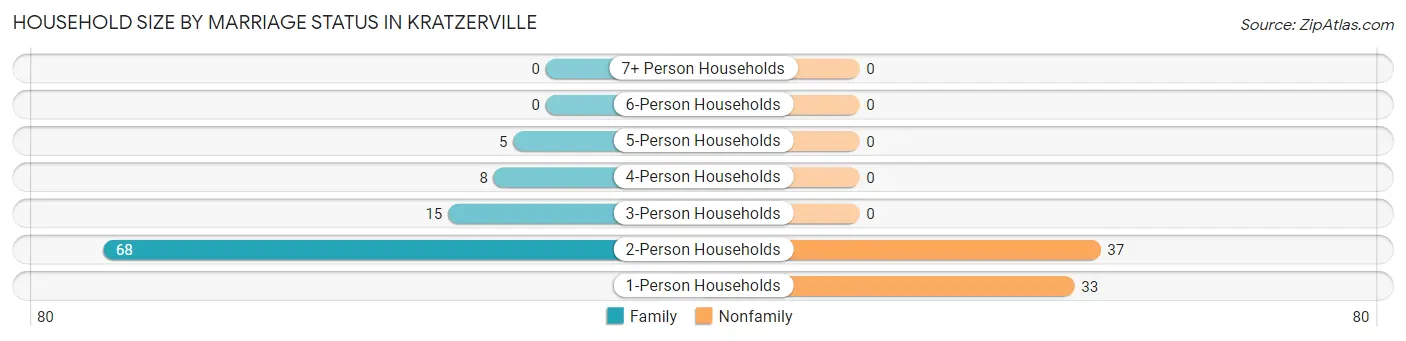
| Household Size | Family Households | Nonfamily Households |
| 1-Person Households | - | 33 (19.9%) |
| 2-Person Households | 68 (41.0%) | 37 (22.3%) |
| 3-Person Households | 15 (9.0%) | 0 (0.0%) |
| 4-Person Households | 8 (4.8%) | 0 (0.0%) |
| 5-Person Households | 5 (3.0%) | 0 (0.0%) |
| 6-Person Households | 0 (0.0%) | 0 (0.0%) |
| 7+ Person Households | 0 (0.0%) | 0 (0.0%) |
| Total | 96 (57.8%) | 70 (42.2%) |
Female Fertility in Kratzerville
Fertility by Age in Kratzerville
| Age Bracket | Women with Births | Births / 1,000 Women |
| 15 to 19 years | 0 (0.0%) | 0.0 |
| 20 to 34 years | 0 (0.0%) | 0.0 |
| 35 to 50 years | 0 (0.0%) | 0.0 |
| Total | 0 (0.0%) | 0.0 |
Fertility by Age by Marriage Status in Kratzerville
| Age Bracket | Married | Unmarried |
| 15 to 19 years | 0 (0.0%) | 0 (0.0%) |
| 20 to 34 years | 0 (0.0%) | 0 (0.0%) |
| 35 to 50 years | 0 (0.0%) | 0 (0.0%) |
| Total | 0 (0.0%) | 0 (0.0%) |
Fertility by Education in Kratzerville
| Educational Attainment | Women with Births | Births / 1,000 Women |
| Less than High School | 0 (0.0%) | 0.0 |
| High School Diploma | 0 (0.0%) | 0.0 |
| College or Associate's Degree | 0 (0.0%) | 0.0 |
| Bachelor's Degree | 0 (0.0%) | 0.0 |
| Graduate Degree | 0 (0.0%) | 0.0 |
| Total | 0 (0.0%) | 0.0 |
Fertility by Education by Marriage Status in Kratzerville
| Educational Attainment | Married | Unmarried |
| Less than High School | 0 (0.0%) | 0 (0.0%) |
| High School Diploma | 0 (0.0%) | 0 (0.0%) |
| College or Associate's Degree | 0 (0.0%) | 0 (0.0%) |
| Bachelor's Degree | 0 (0.0%) | 0 (0.0%) |
| Graduate Degree | 0 (0.0%) | 0 (0.0%) |
| Total | 0 (0.0%) | 0 (0.0%) |
Employment Characteristics in Kratzerville
Employment by Class of Employer in Kratzerville
Among the 160 employed individuals in Kratzerville, private company employees (119 | 74.4%), not-for-profit organizations (23 | 14.4%), and self-employed (not incorporated) (12 | 7.5%) make up the most common classes of employment.
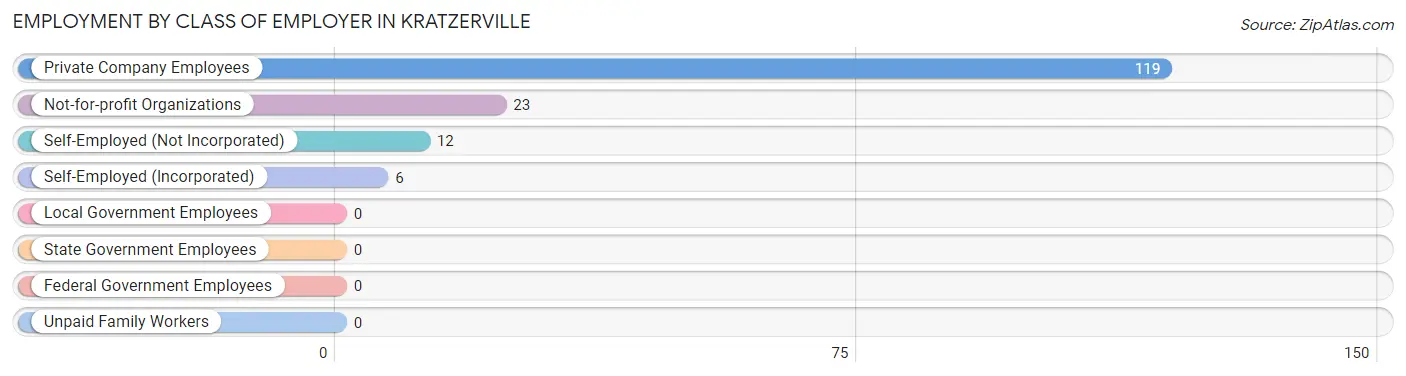
| Employer Class | # Employees | % Employees |
| Private Company Employees | 119 | 74.4% |
| Self-Employed (Incorporated) | 6 | 3.7% |
| Self-Employed (Not Incorporated) | 12 | 7.5% |
| Not-for-profit Organizations | 23 | 14.4% |
| Local Government Employees | 0 | 0.0% |
| State Government Employees | 0 | 0.0% |
| Federal Government Employees | 0 | 0.0% |
| Unpaid Family Workers | 0 | 0.0% |
| Total | 160 | 100.0% |
Employment Status by Age in Kratzerville
According to the labor force statistics for Kratzerville, out of the total population over 16 years of age (288), 56.3% or 162 individuals are in the labor force, with 1.2% or 2 of them unemployed. The age group with the highest labor force participation rate is 20 to 24 years, with 100.0% or 8 individuals in the labor force. Within the labor force, the 65 to 74 years age range has the highest percentage of unemployed individuals, with 6.1% or 2 of them being unemployed.
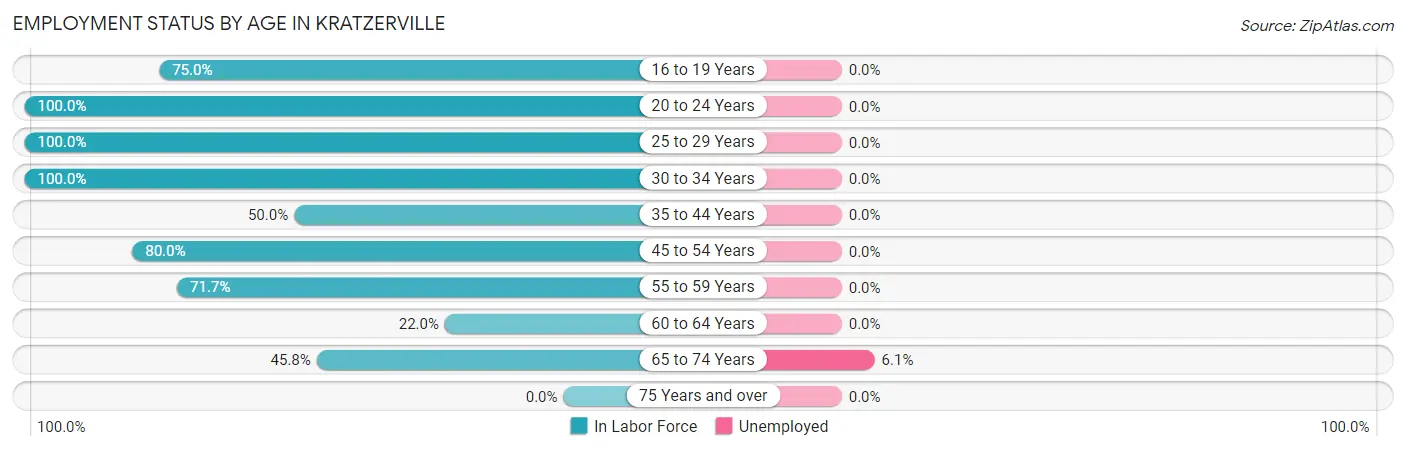
| Age Bracket | In Labor Force | Unemployed |
| 16 to 19 Years | 3 (75.0%) | 0 (0.0%) |
| 20 to 24 Years | 8 (100.0%) | 0 (0.0%) |
| 25 to 29 Years | 20 (100.0%) | 0 (0.0%) |
| 30 to 34 Years | 19 (100.0%) | 0 (0.0%) |
| 35 to 44 Years | 9 (50.0%) | 0 (0.0%) |
| 45 to 54 Years | 28 (80.0%) | 0 (0.0%) |
| 55 to 59 Years | 33 (71.7%) | 0 (0.0%) |
| 60 to 64 Years | 9 (22.0%) | 0 (0.0%) |
| 65 to 74 Years | 33 (45.8%) | 2 (6.1%) |
| 75 Years and over | 0 (0.0%) | 0 (0.0%) |
| Total | 162 (56.3%) | 2 (1.2%) |
Employment Status by Educational Attainment in Kratzerville
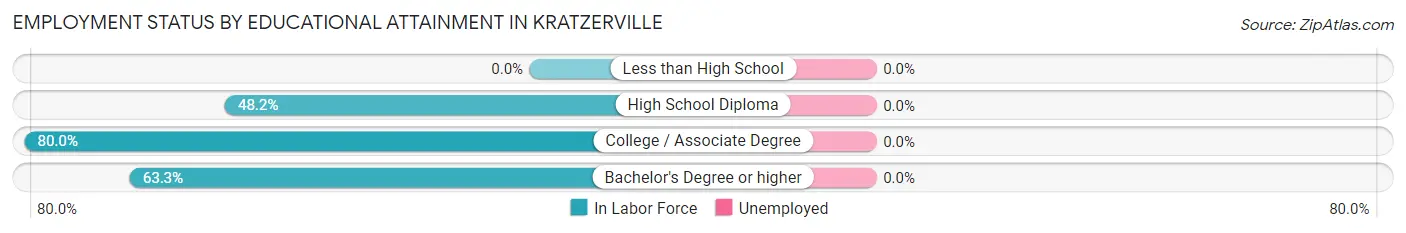
| Educational Attainment | In Labor Force | Unemployed |
| Less than High School | 0 (0.0%) | 0 (0.0%) |
| High School Diploma | 27 (48.2%) | 0 (0.0%) |
| College / Associate Degree | 72 (80.0%) | 0 (0.0%) |
| Bachelor's Degree or higher | 19 (63.3%) | 0 (0.0%) |
| Total | 118 (65.9%) | 0 (0.0%) |
Employment Occupations by Sex in Kratzerville
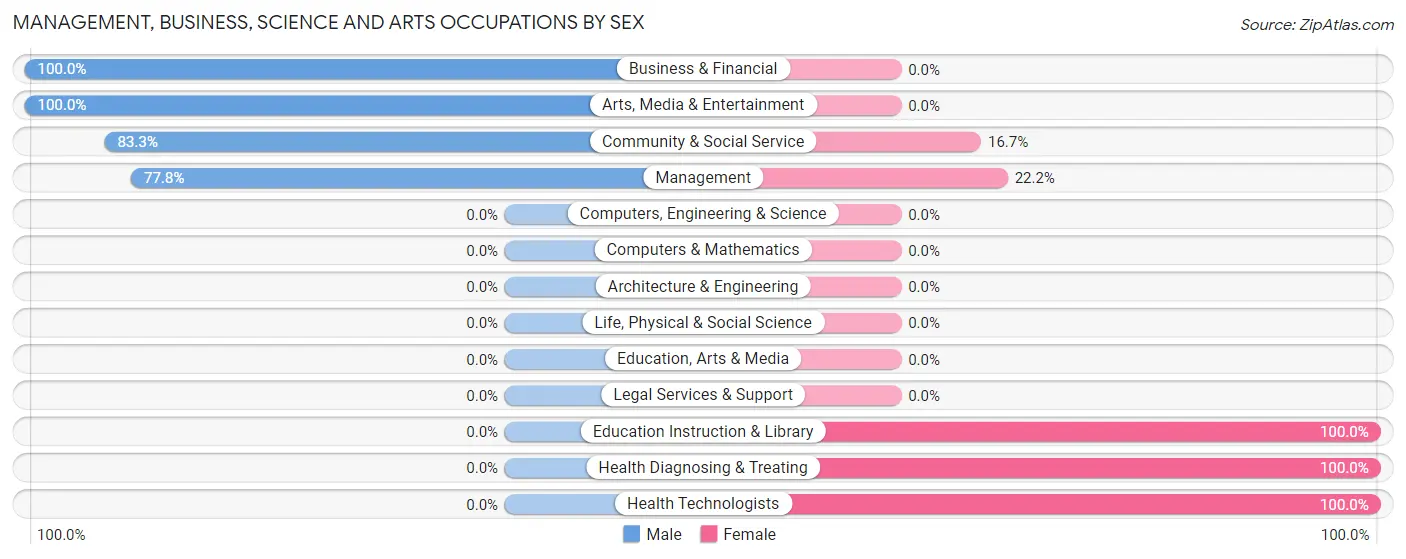
Management, Business, Science and Arts Occupations
The most common Management, Business, Science and Arts occupations in Kratzerville are Management (27 | 16.9%), Health Diagnosing & Treating (14 | 8.7%), Health Technologists (12 | 7.5%), Community & Social Service (6 | 3.7%), and Arts, Media & Entertainment (5 | 3.1%).
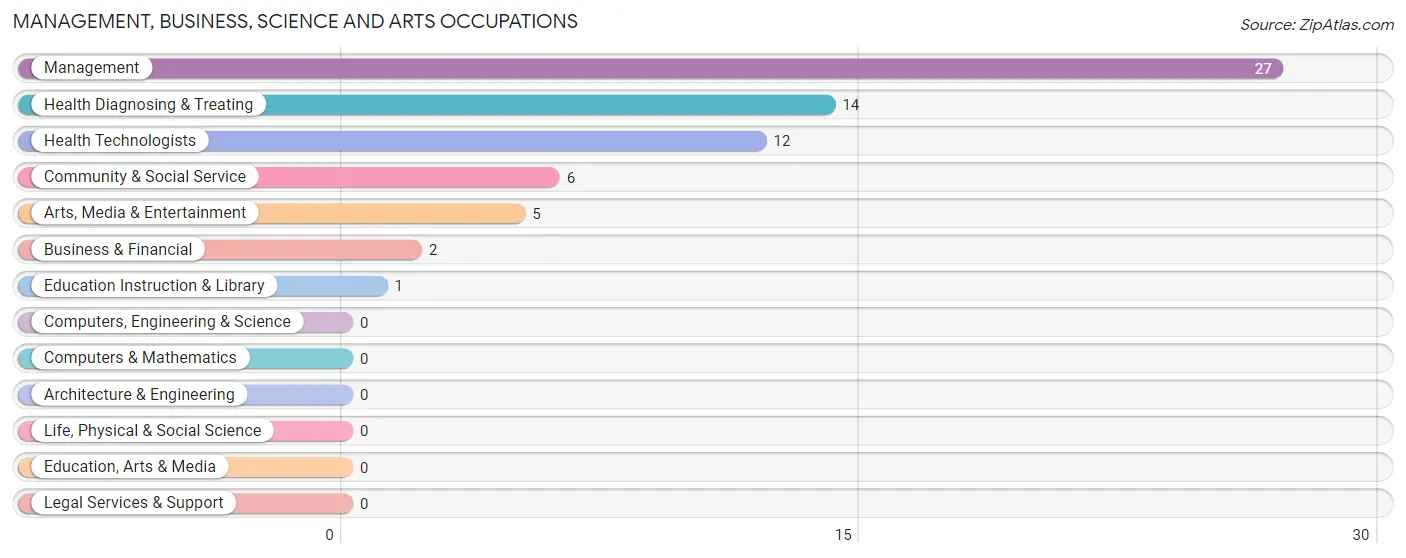
Management, Business, Science and Arts Occupations by Sex
Within the Management, Business, Science and Arts occupations in Kratzerville, the most male-oriented occupations are Business & Financial (100.0%), Arts, Media & Entertainment (100.0%), and Community & Social Service (83.3%), while the most female-oriented occupations are Education Instruction & Library (100.0%), Health Diagnosing & Treating (100.0%), and Health Technologists (100.0%).
| Occupation | Male | Female |
| Management | 21 (77.8%) | 6 (22.2%) |
| Business & Financial | 2 (100.0%) | 0 (0.0%) |
| Computers, Engineering & Science | 0 (0.0%) | 0 (0.0%) |
| Computers & Mathematics | 0 (0.0%) | 0 (0.0%) |
| Architecture & Engineering | 0 (0.0%) | 0 (0.0%) |
| Life, Physical & Social Science | 0 (0.0%) | 0 (0.0%) |
| Community & Social Service | 5 (83.3%) | 1 (16.7%) |
| Education, Arts & Media | 0 (0.0%) | 0 (0.0%) |
| Legal Services & Support | 0 (0.0%) | 0 (0.0%) |
| Education Instruction & Library | 0 (0.0%) | 1 (100.0%) |
| Arts, Media & Entertainment | 5 (100.0%) | 0 (0.0%) |
| Health Diagnosing & Treating | 0 (0.0%) | 14 (100.0%) |
| Health Technologists | 0 (0.0%) | 12 (100.0%) |
| Total (Category) | 28 (57.1%) | 21 (42.9%) |
| Total (Overall) | 103 (64.4%) | 57 (35.6%) |
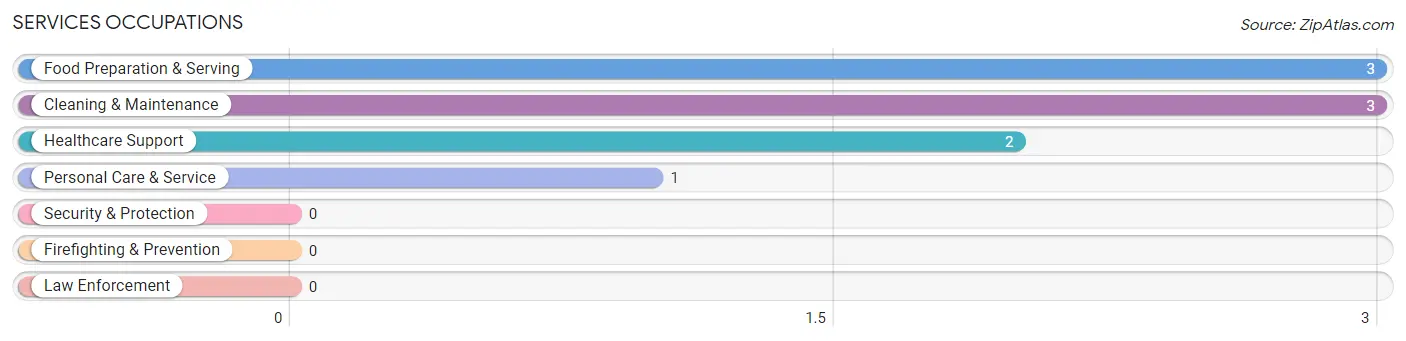
Services Occupations
The most common Services occupations in Kratzerville are Food Preparation & Serving (3 | 1.9%), Cleaning & Maintenance (3 | 1.9%), Healthcare Support (2 | 1.3%), and Personal Care & Service (1 | 0.6%).
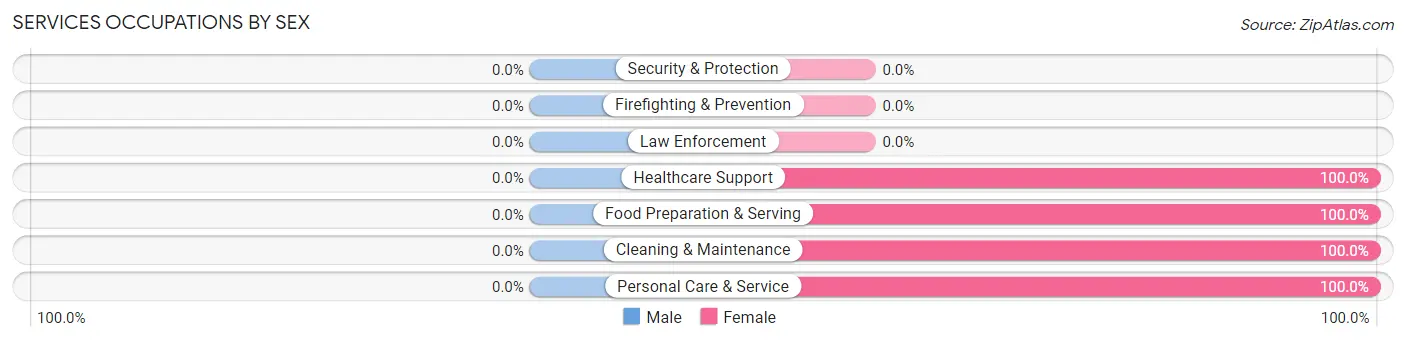
Services Occupations by Sex
| Occupation | Male | Female |
| Healthcare Support | 0 (0.0%) | 2 (100.0%) |
| Security & Protection | 0 (0.0%) | 0 (0.0%) |
| Firefighting & Prevention | 0 (0.0%) | 0 (0.0%) |
| Law Enforcement | 0 (0.0%) | 0 (0.0%) |
| Food Preparation & Serving | 0 (0.0%) | 3 (100.0%) |
| Cleaning & Maintenance | 0 (0.0%) | 3 (100.0%) |
| Personal Care & Service | 0 (0.0%) | 1 (100.0%) |
| Total (Category) | 0 (0.0%) | 9 (100.0%) |
| Total (Overall) | 103 (64.4%) | 57 (35.6%) |
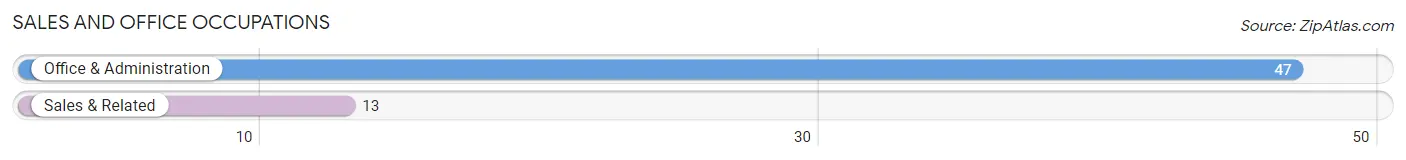
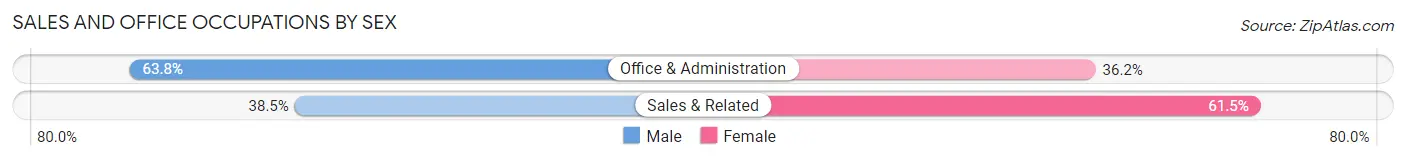
Sales and Office Occupations
The most common Sales and Office occupations in Kratzerville are Office & Administration (47 | 29.4%), and Sales & Related (13 | 8.1%).
Sales and Office Occupations by Sex
| Occupation | Male | Female |
| Sales & Related | 5 (38.5%) | 8 (61.5%) |
| Office & Administration | 30 (63.8%) | 17 (36.2%) |
| Total (Category) | 35 (58.3%) | 25 (41.7%) |
| Total (Overall) | 103 (64.4%) | 57 (35.6%) |
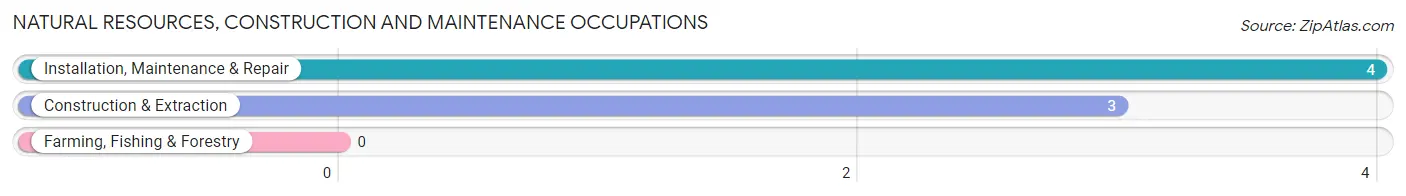
Natural Resources, Construction and Maintenance Occupations
The most common Natural Resources, Construction and Maintenance occupations in Kratzerville are Installation, Maintenance & Repair (4 | 2.5%), and Construction & Extraction (3 | 1.9%).
Natural Resources, Construction and Maintenance Occupations by Sex
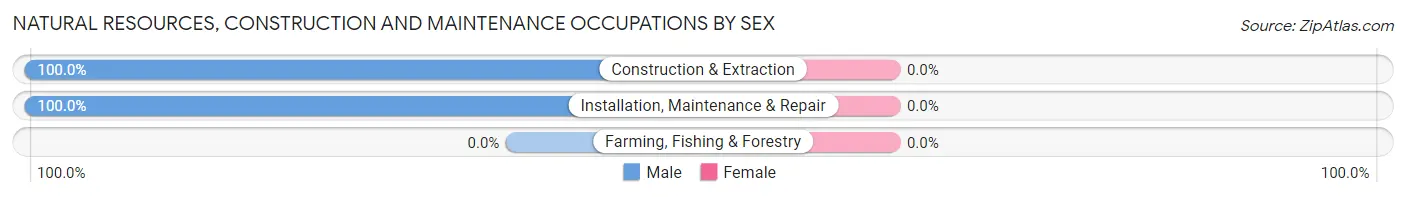
| Occupation | Male | Female |
| Farming, Fishing & Forestry | 0 (0.0%) | 0 (0.0%) |
| Construction & Extraction | 3 (100.0%) | 0 (0.0%) |
| Installation, Maintenance & Repair | 4 (100.0%) | 0 (0.0%) |
| Total (Category) | 7 (100.0%) | 0 (0.0%) |
| Total (Overall) | 103 (64.4%) | 57 (35.6%) |
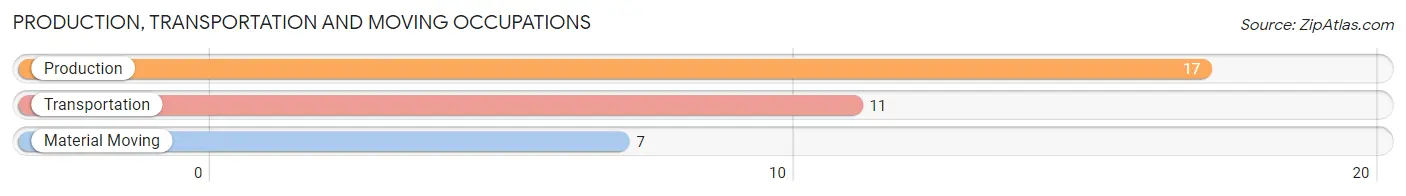
Production, Transportation and Moving Occupations
The most common Production, Transportation and Moving occupations in Kratzerville are Production (17 | 10.6%), Transportation (11 | 6.9%), and Material Moving (7 | 4.4%).
Production, Transportation and Moving Occupations by Sex
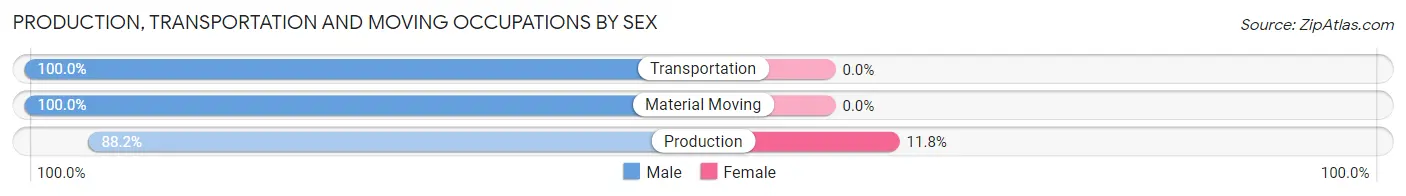
| Occupation | Male | Female |
| Production | 15 (88.2%) | 2 (11.8%) |
| Transportation | 11 (100.0%) | 0 (0.0%) |
| Material Moving | 7 (100.0%) | 0 (0.0%) |
| Total (Category) | 33 (94.3%) | 2 (5.7%) |
| Total (Overall) | 103 (64.4%) | 57 (35.6%) |
Employment Industries by Sex in Kratzerville
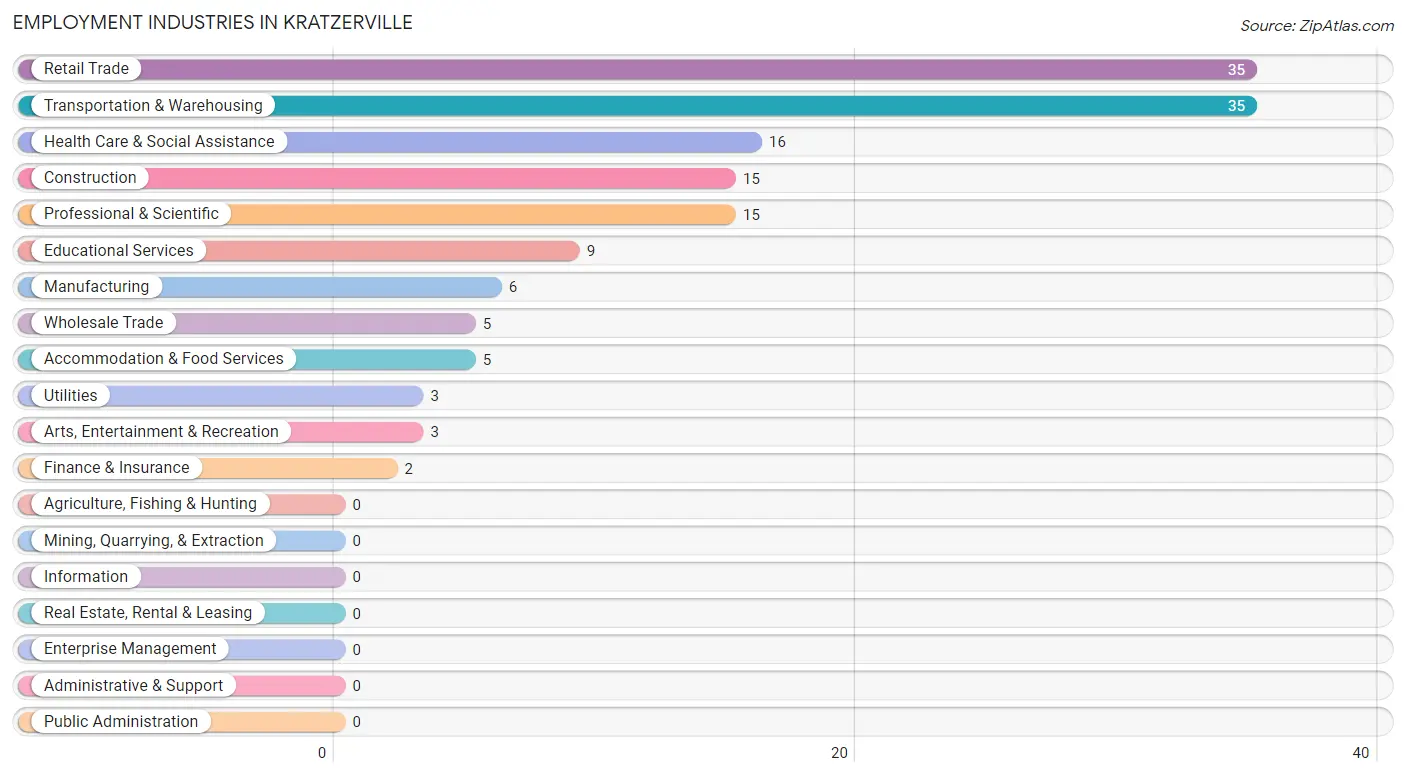
Employment Industries in Kratzerville
The major employment industries in Kratzerville include Retail Trade (35 | 21.9%), Transportation & Warehousing (35 | 21.9%), Health Care & Social Assistance (16 | 10.0%), Construction (15 | 9.4%), and Professional & Scientific (15 | 9.4%).
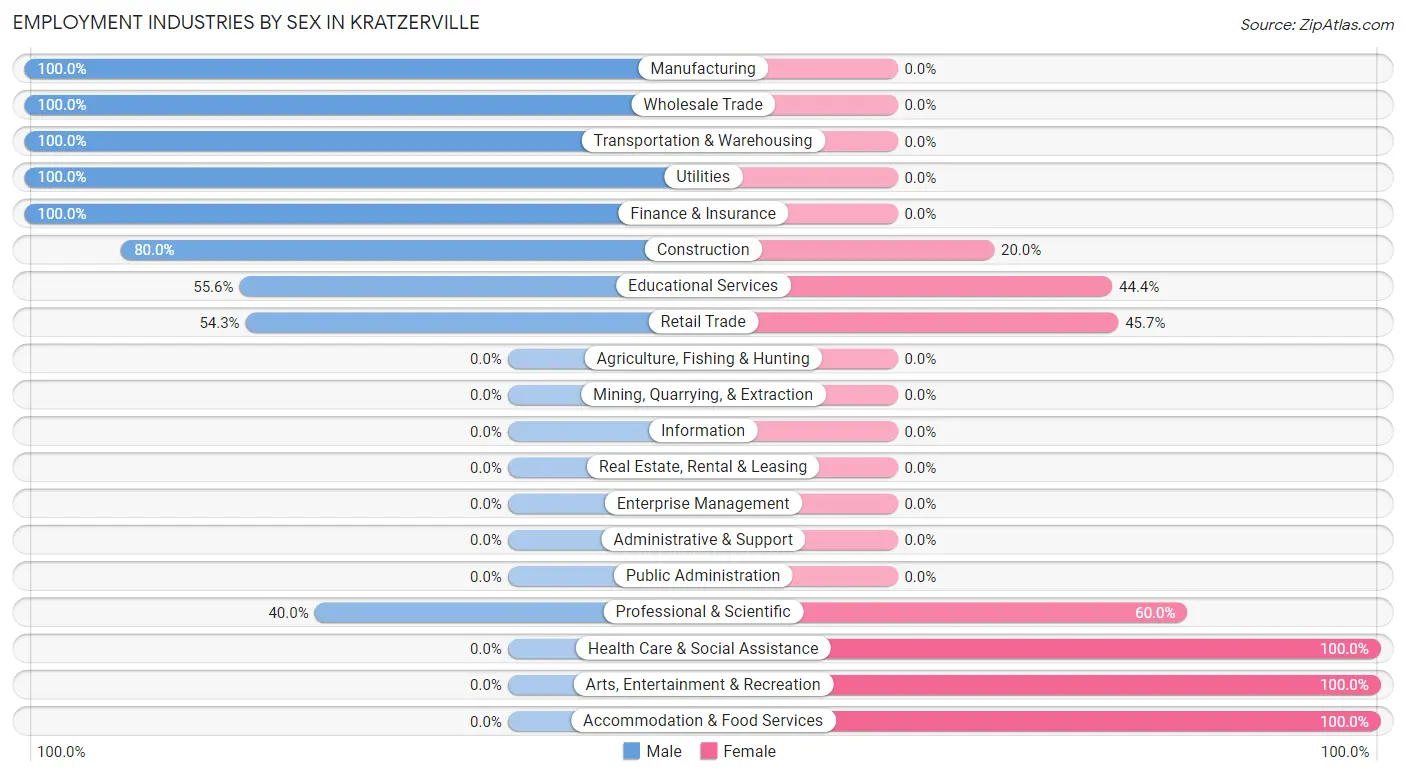
Employment Industries by Sex in Kratzerville
The Kratzerville industries that see more men than women are Manufacturing (100.0%), Wholesale Trade (100.0%), and Transportation & Warehousing (100.0%), whereas the industries that tend to have a higher number of women are Health Care & Social Assistance (100.0%), Arts, Entertainment & Recreation (100.0%), and Accommodation & Food Services (100.0%).
| Industry | Male | Female |
| Agriculture, Fishing & Hunting | 0 (0.0%) | 0 (0.0%) |
| Mining, Quarrying, & Extraction | 0 (0.0%) | 0 (0.0%) |
| Construction | 12 (80.0%) | 3 (20.0%) |
| Manufacturing | 6 (100.0%) | 0 (0.0%) |
| Wholesale Trade | 5 (100.0%) | 0 (0.0%) |
| Retail Trade | 19 (54.3%) | 16 (45.7%) |
| Transportation & Warehousing | 35 (100.0%) | 0 (0.0%) |
| Utilities | 3 (100.0%) | 0 (0.0%) |
| Information | 0 (0.0%) | 0 (0.0%) |
| Finance & Insurance | 2 (100.0%) | 0 (0.0%) |
| Real Estate, Rental & Leasing | 0 (0.0%) | 0 (0.0%) |
| Professional & Scientific | 6 (40.0%) | 9 (60.0%) |
| Enterprise Management | 0 (0.0%) | 0 (0.0%) |
| Administrative & Support | 0 (0.0%) | 0 (0.0%) |
| Educational Services | 5 (55.6%) | 4 (44.4%) |
| Health Care & Social Assistance | 0 (0.0%) | 16 (100.0%) |
| Arts, Entertainment & Recreation | 0 (0.0%) | 3 (100.0%) |
| Accommodation & Food Services | 0 (0.0%) | 5 (100.0%) |
| Public Administration | 0 (0.0%) | 0 (0.0%) |
| Total | 103 (64.4%) | 57 (35.6%) |
Education in Kratzerville
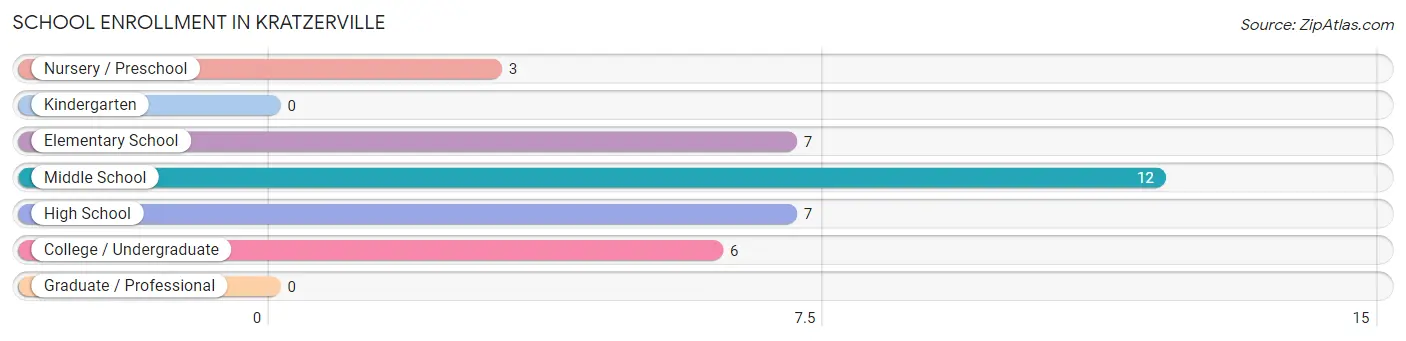
School Enrollment in Kratzerville
The most common levels of schooling among the 35 students in Kratzerville are middle school (12 | 34.3%), elementary school (7 | 20.0%), and high school (7 | 20.0%).
| School Level | # Students | % Students |
| Nursery / Preschool | 3 | 8.6% |
| Kindergarten | 0 | 0.0% |
| Elementary School | 7 | 20.0% |
| Middle School | 12 | 34.3% |
| High School | 7 | 20.0% |
| College / Undergraduate | 6 | 17.1% |
| Graduate / Professional | 0 | 0.0% |
| Total | 35 | 100.0% |
School Enrollment by Age by Funding Source in Kratzerville
Out of a total of 35 students who are enrolled in schools in Kratzerville, 15 (42.9%) attend a private institution, while the remaining 20 (57.1%) are enrolled in public schools. The age group of 3 to 4 year olds has the highest likelihood of being enrolled in private schools, with 3 (100.0% in the age bracket) enrolled. Conversely, the age group of 35 years and over has the lowest likelihood of being enrolled in a private school, with 12 (100.0% in the age bracket) attending a public institution.

| Age Bracket | Public School | Private School |
| 3 to 4 Year Olds | 0 (0.0%) | 3 (100.0%) |
| 5 to 9 Year Old | 0 (0.0%) | 7 (100.0%) |
| 10 to 14 Year Olds | 6 (60.0%) | 4 (40.0%) |
| 15 to 17 Year Olds | 2 (66.7%) | 1 (33.3%) |
| 18 to 19 Year Olds | 0 (0.0%) | 0 (0.0%) |
| 20 to 24 Year Olds | 0 (0.0%) | 0 (0.0%) |
| 25 to 34 Year Olds | 0 (0.0%) | 0 (0.0%) |
| 35 Years and over | 12 (100.0%) | 0 (0.0%) |
| Total | 20 (57.1%) | 15 (42.9%) |
Educational Attainment by Field of Study in Kratzerville
Liberal arts & history (12 | 32.4%), education (11 | 29.7%), bio, nature & agricultural (7 | 18.9%), science & technology (4 | 10.8%), and business (2 | 5.4%) are the most common fields of study among 37 individuals in Kratzerville who have obtained a bachelor's degree or higher.
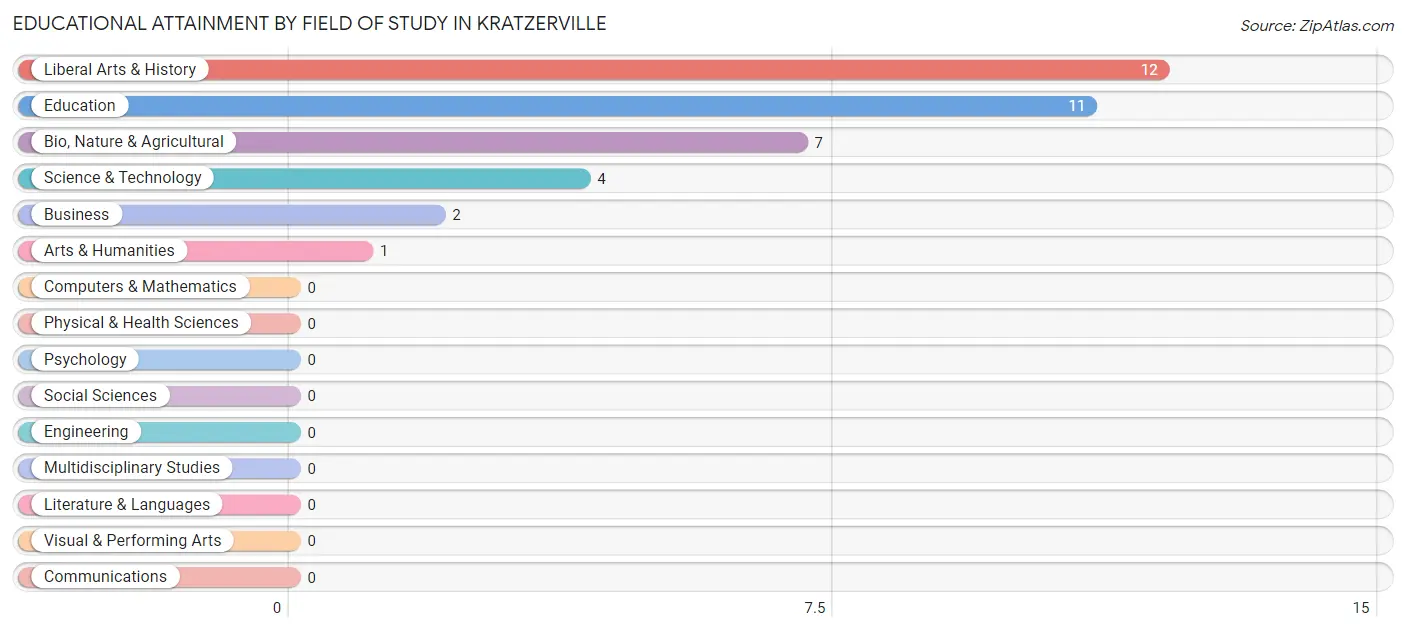
| Field of Study | # Graduates | % Graduates |
| Computers & Mathematics | 0 | 0.0% |
| Bio, Nature & Agricultural | 7 | 18.9% |
| Physical & Health Sciences | 0 | 0.0% |
| Psychology | 0 | 0.0% |
| Social Sciences | 0 | 0.0% |
| Engineering | 0 | 0.0% |
| Multidisciplinary Studies | 0 | 0.0% |
| Science & Technology | 4 | 10.8% |
| Business | 2 | 5.4% |
| Education | 11 | 29.7% |
| Literature & Languages | 0 | 0.0% |
| Liberal Arts & History | 12 | 32.4% |
| Visual & Performing Arts | 0 | 0.0% |
| Communications | 0 | 0.0% |
| Arts & Humanities | 1 | 2.7% |
| Total | 37 | 100.0% |
Transportation & Commute in Kratzerville
Vehicle Availability by Sex in Kratzerville
The most prevalent vehicle ownership categories in Kratzerville are males with 2 vehicles (68, accounting for 66.0%) and females with 2 vehicles (37, making up 119.3%).
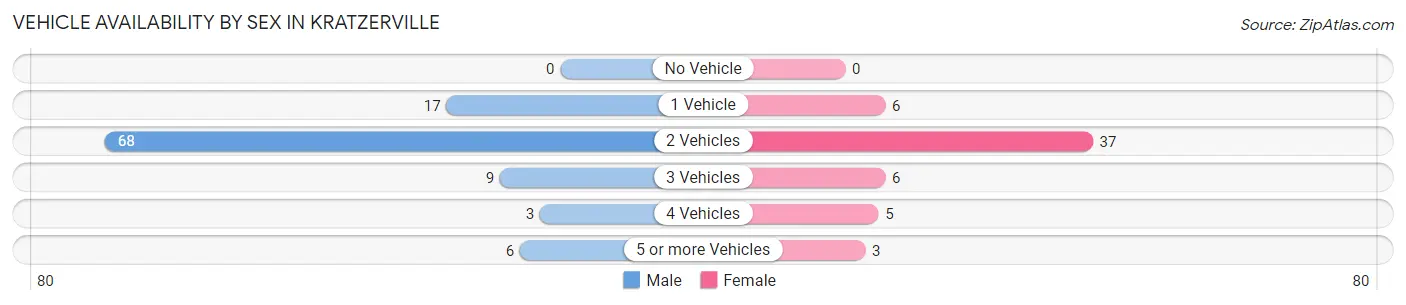
| Vehicles Available | Male | Female |
| No Vehicle | 0 (0.0%) | 0 (0.0%) |
| 1 Vehicle | 17 (16.5%) | 6 (10.5%) |
| 2 Vehicles | 68 (66.0%) | 37 (64.9%) |
| 3 Vehicles | 9 (8.7%) | 6 (10.5%) |
| 4 Vehicles | 3 (2.9%) | 5 (8.8%) |
| 5 or more Vehicles | 6 (5.8%) | 3 (5.3%) |
| Total | 103 (100.0%) | 57 (100.0%) |
Commute Time in Kratzerville
The most frequently occuring commute durations in Kratzerville are 15 to 19 minutes (37 commuters, 24.5%), 5 to 9 minutes (35 commuters, 23.2%), and 20 to 24 minutes (31 commuters, 20.5%).
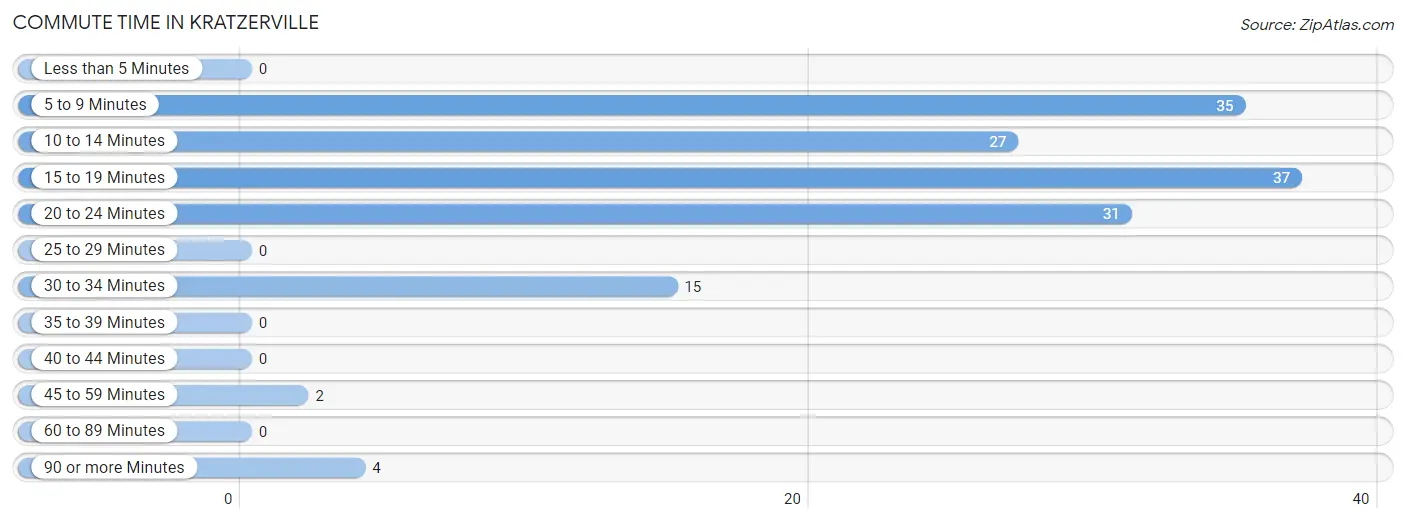
| Commute Time | # Commuters | % Commuters |
| Less than 5 Minutes | 0 | 0.0% |
| 5 to 9 Minutes | 35 | 23.2% |
| 10 to 14 Minutes | 27 | 17.9% |
| 15 to 19 Minutes | 37 | 24.5% |
| 20 to 24 Minutes | 31 | 20.5% |
| 25 to 29 Minutes | 0 | 0.0% |
| 30 to 34 Minutes | 15 | 9.9% |
| 35 to 39 Minutes | 0 | 0.0% |
| 40 to 44 Minutes | 0 | 0.0% |
| 45 to 59 Minutes | 2 | 1.3% |
| 60 to 89 Minutes | 0 | 0.0% |
| 90 or more Minutes | 4 | 2.6% |
Commute Time by Sex in Kratzerville
The most common commute times in Kratzerville are 5 to 9 minutes (33 commuters, 35.1%) for males and 10 to 14 minutes (19 commuters, 33.3%) for females.
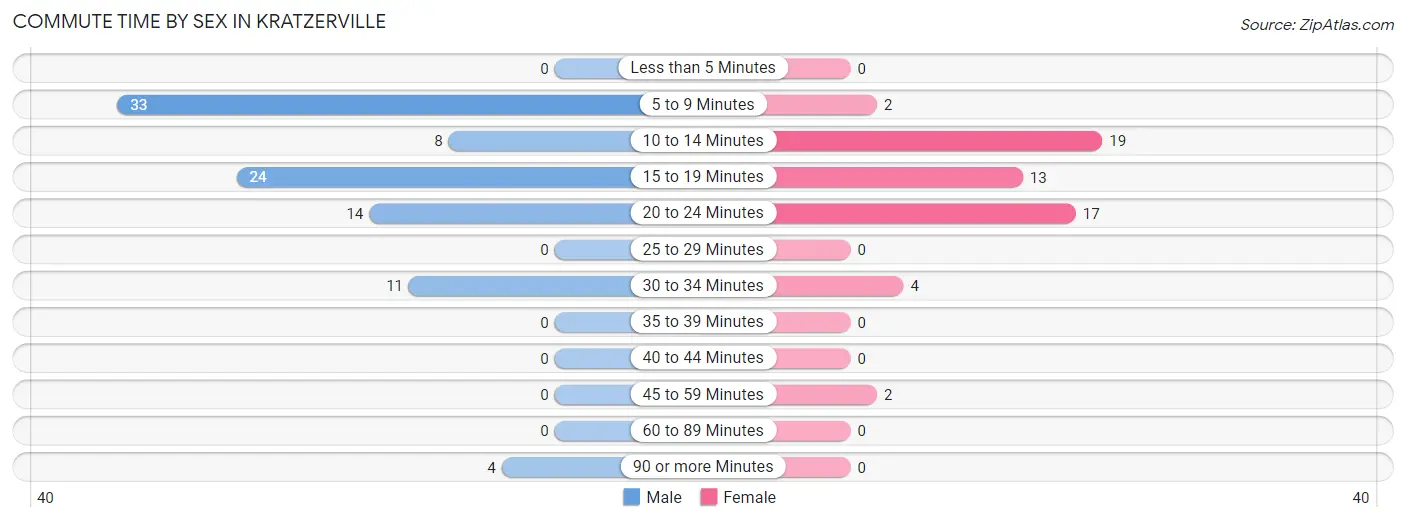
| Commute Time | Male | Female |
| Less than 5 Minutes | 0 (0.0%) | 0 (0.0%) |
| 5 to 9 Minutes | 33 (35.1%) | 2 (3.5%) |
| 10 to 14 Minutes | 8 (8.5%) | 19 (33.3%) |
| 15 to 19 Minutes | 24 (25.5%) | 13 (22.8%) |
| 20 to 24 Minutes | 14 (14.9%) | 17 (29.8%) |
| 25 to 29 Minutes | 0 (0.0%) | 0 (0.0%) |
| 30 to 34 Minutes | 11 (11.7%) | 4 (7.0%) |
| 35 to 39 Minutes | 0 (0.0%) | 0 (0.0%) |
| 40 to 44 Minutes | 0 (0.0%) | 0 (0.0%) |
| 45 to 59 Minutes | 0 (0.0%) | 2 (3.5%) |
| 60 to 89 Minutes | 0 (0.0%) | 0 (0.0%) |
| 90 or more Minutes | 4 (4.3%) | 0 (0.0%) |
Time of Departure to Work by Sex in Kratzerville
The most frequent times of departure to work in Kratzerville are 7:00 AM to 7:29 AM (39, 41.5%) for males and 8:30 AM to 8:59 AM (13, 22.8%) for females.
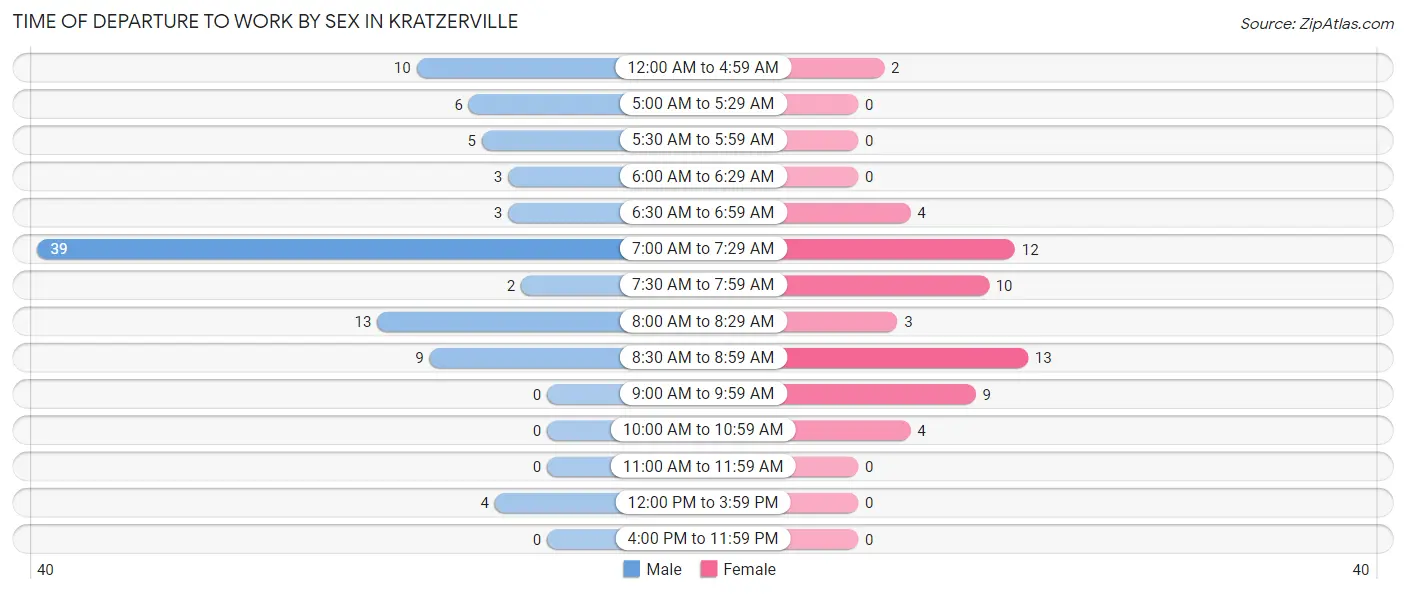
| Time of Departure | Male | Female |
| 12:00 AM to 4:59 AM | 10 (10.6%) | 2 (3.5%) |
| 5:00 AM to 5:29 AM | 6 (6.4%) | 0 (0.0%) |
| 5:30 AM to 5:59 AM | 5 (5.3%) | 0 (0.0%) |
| 6:00 AM to 6:29 AM | 3 (3.2%) | 0 (0.0%) |
| 6:30 AM to 6:59 AM | 3 (3.2%) | 4 (7.0%) |
| 7:00 AM to 7:29 AM | 39 (41.5%) | 12 (21.0%) |
| 7:30 AM to 7:59 AM | 2 (2.1%) | 10 (17.5%) |
| 8:00 AM to 8:29 AM | 13 (13.8%) | 3 (5.3%) |
| 8:30 AM to 8:59 AM | 9 (9.6%) | 13 (22.8%) |
| 9:00 AM to 9:59 AM | 0 (0.0%) | 9 (15.8%) |
| 10:00 AM to 10:59 AM | 0 (0.0%) | 4 (7.0%) |
| 11:00 AM to 11:59 AM | 0 (0.0%) | 0 (0.0%) |
| 12:00 PM to 3:59 PM | 4 (4.3%) | 0 (0.0%) |
| 4:00 PM to 11:59 PM | 0 (0.0%) | 0 (0.0%) |
| Total | 94 (100.0%) | 57 (100.0%) |
Housing Occupancy in Kratzerville
Occupancy by Ownership in Kratzerville
Of the total 166 dwellings in Kratzerville, owner-occupied units account for 114 (68.7%), while renter-occupied units make up 52 (31.3%).
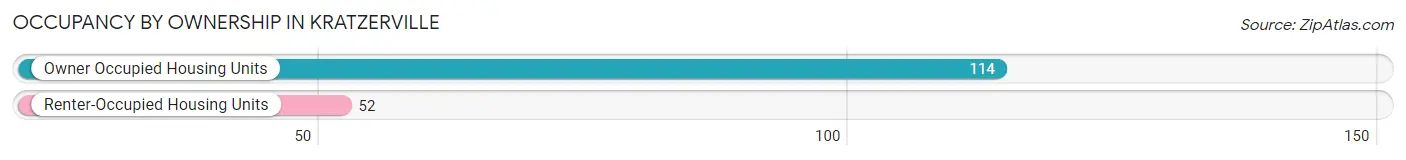
| Occupancy | # Housing Units | % Housing Units |
| Owner Occupied Housing Units | 114 | 68.7% |
| Renter-Occupied Housing Units | 52 | 31.3% |
| Total Occupied Housing Units | 166 | 100.0% |
Occupancy by Household Size in Kratzerville
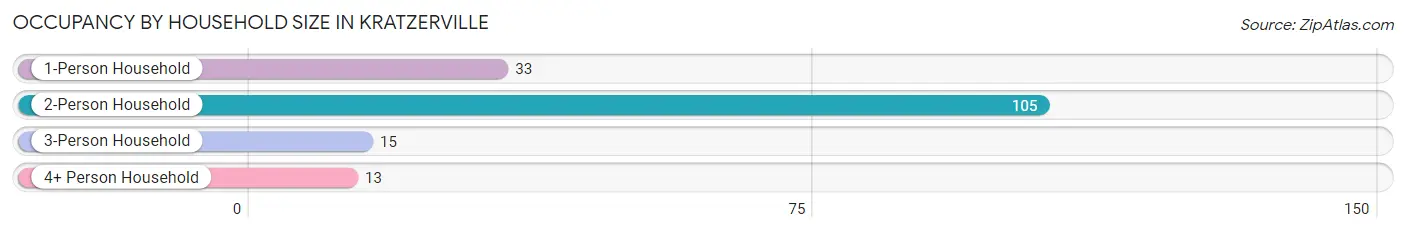
| Household Size | # Housing Units | % Housing Units |
| 1-Person Household | 33 | 19.9% |
| 2-Person Household | 105 | 63.2% |
| 3-Person Household | 15 | 9.0% |
| 4+ Person Household | 13 | 7.8% |
| Total Housing Units | 166 | 100.0% |
Occupancy by Ownership by Household Size in Kratzerville
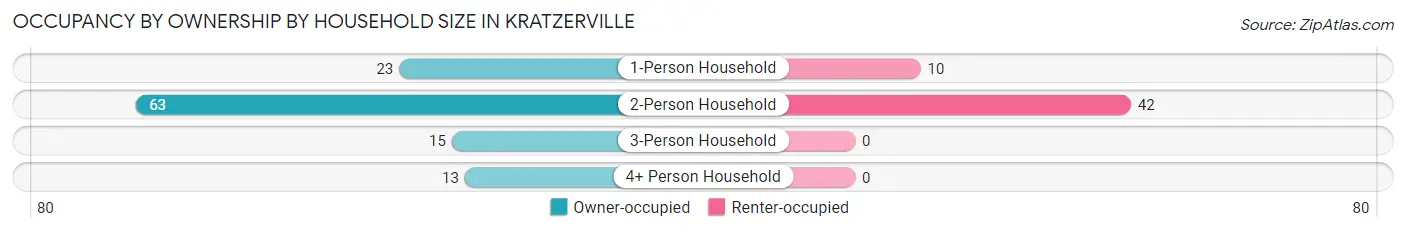
| Household Size | Owner-occupied | Renter-occupied |
| 1-Person Household | 23 (69.7%) | 10 (30.3%) |
| 2-Person Household | 63 (60.0%) | 42 (40.0%) |
| 3-Person Household | 15 (100.0%) | 0 (0.0%) |
| 4+ Person Household | 13 (100.0%) | 0 (0.0%) |
| Total Housing Units | 114 (68.7%) | 52 (31.3%) |
Occupancy by Educational Attainment in Kratzerville
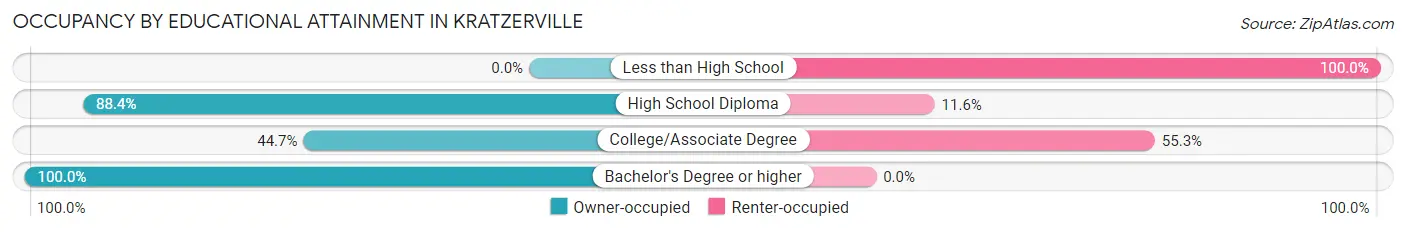
| Household Size | Owner-occupied | Renter-occupied |
| Less than High School | 0 (0.0%) | 2 (100.0%) |
| High School Diploma | 61 (88.4%) | 8 (11.6%) |
| College/Associate Degree | 34 (44.7%) | 42 (55.3%) |
| Bachelor's Degree or higher | 19 (100.0%) | 0 (0.0%) |
Occupancy by Age of Householder in Kratzerville
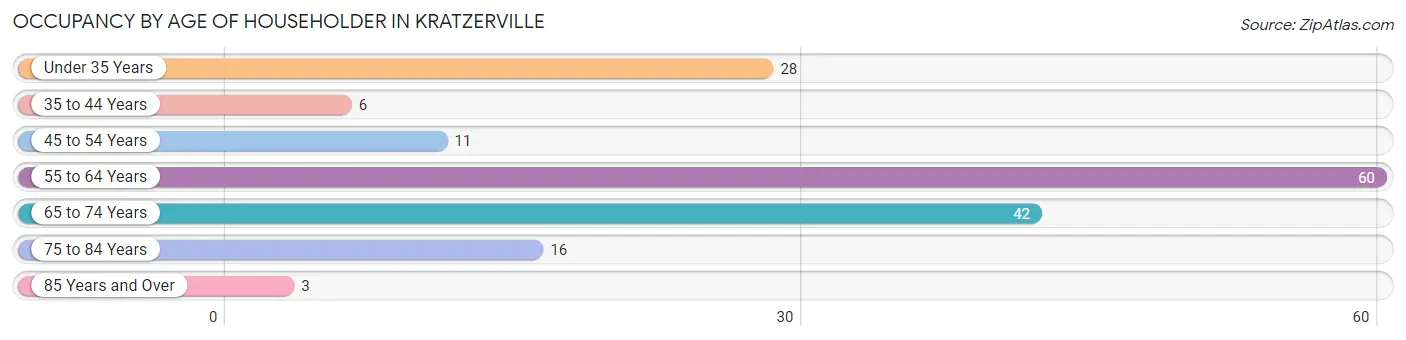
| Age Bracket | # Households | % Households |
| Under 35 Years | 28 | 16.9% |
| 35 to 44 Years | 6 | 3.6% |
| 45 to 54 Years | 11 | 6.6% |
| 55 to 64 Years | 60 | 36.1% |
| 65 to 74 Years | 42 | 25.3% |
| 75 to 84 Years | 16 | 9.6% |
| 85 Years and Over | 3 | 1.8% |
| Total | 166 | 100.0% |
Housing Finances in Kratzerville
Median Income by Occupancy in Kratzerville
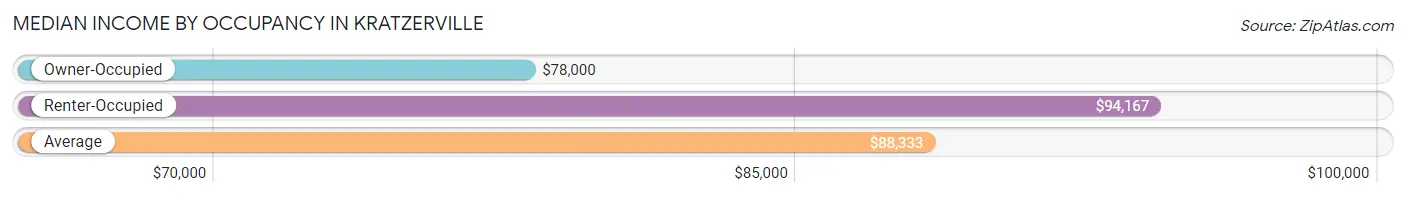
| Occupancy Type | # Households | Median Income |
| Owner-Occupied | 114 (68.7%) | $78,000 |
| Renter-Occupied | 52 (31.3%) | $94,167 |
| Average | 166 (100.0%) | $88,333 |
Occupancy by Householder Income Bracket in Kratzerville
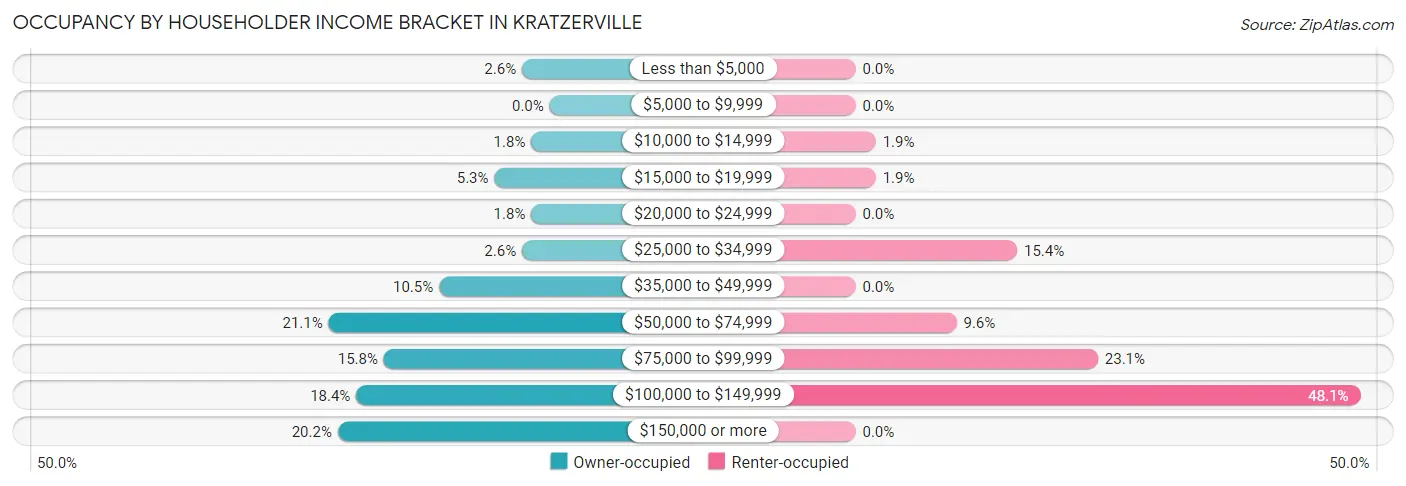
| Income Bracket | Owner-occupied | Renter-occupied |
| Less than $5,000 | 3 (2.6%) | 0 (0.0%) |
| $5,000 to $9,999 | 0 (0.0%) | 0 (0.0%) |
| $10,000 to $14,999 | 2 (1.8%) | 1 (1.9%) |
| $15,000 to $19,999 | 6 (5.3%) | 1 (1.9%) |
| $20,000 to $24,999 | 2 (1.8%) | 0 (0.0%) |
| $25,000 to $34,999 | 3 (2.6%) | 8 (15.4%) |
| $35,000 to $49,999 | 12 (10.5%) | 0 (0.0%) |
| $50,000 to $74,999 | 24 (21.0%) | 5 (9.6%) |
| $75,000 to $99,999 | 18 (15.8%) | 12 (23.1%) |
| $100,000 to $149,999 | 21 (18.4%) | 25 (48.1%) |
| $150,000 or more | 23 (20.2%) | 0 (0.0%) |
| Total | 114 (100.0%) | 52 (100.0%) |
Monthly Housing Cost Tiers in Kratzerville
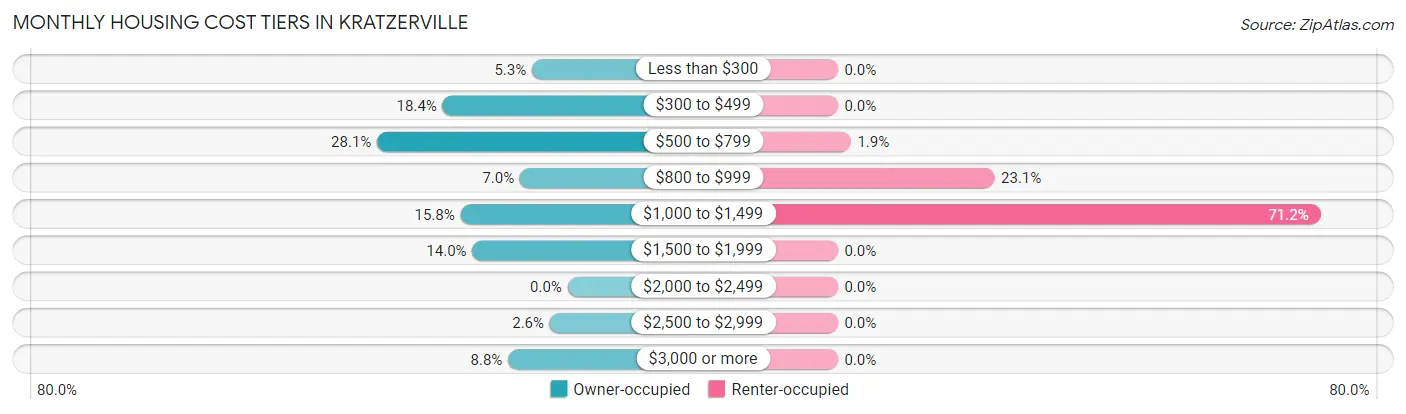
| Monthly Cost | Owner-occupied | Renter-occupied |
| Less than $300 | 6 (5.3%) | 0 (0.0%) |
| $300 to $499 | 21 (18.4%) | 0 (0.0%) |
| $500 to $799 | 32 (28.1%) | 1 (1.9%) |
| $800 to $999 | 8 (7.0%) | 12 (23.1%) |
| $1,000 to $1,499 | 18 (15.8%) | 37 (71.2%) |
| $1,500 to $1,999 | 16 (14.0%) | 0 (0.0%) |
| $2,000 to $2,499 | 0 (0.0%) | 0 (0.0%) |
| $2,500 to $2,999 | 3 (2.6%) | 0 (0.0%) |
| $3,000 or more | 10 (8.8%) | 0 (0.0%) |
| Total | 114 (100.0%) | 52 (100.0%) |
Physical Housing Characteristics in Kratzerville
Housing Structures in Kratzerville
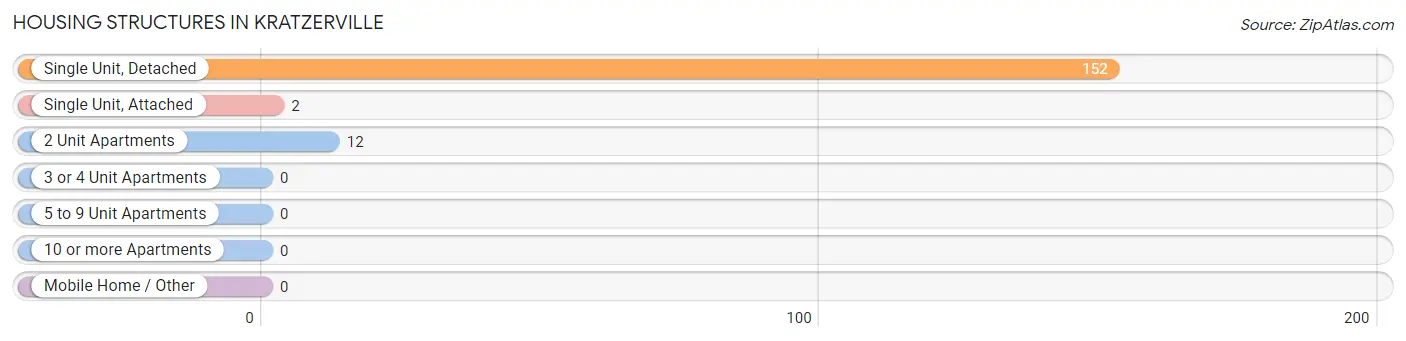
| Structure Type | # Housing Units | % Housing Units |
| Single Unit, Detached | 152 | 91.6% |
| Single Unit, Attached | 2 | 1.2% |
| 2 Unit Apartments | 12 | 7.2% |
| 3 or 4 Unit Apartments | 0 | 0.0% |
| 5 to 9 Unit Apartments | 0 | 0.0% |
| 10 or more Apartments | 0 | 0.0% |
| Mobile Home / Other | 0 | 0.0% |
| Total | 166 | 100.0% |
Housing Structures by Occupancy in Kratzerville
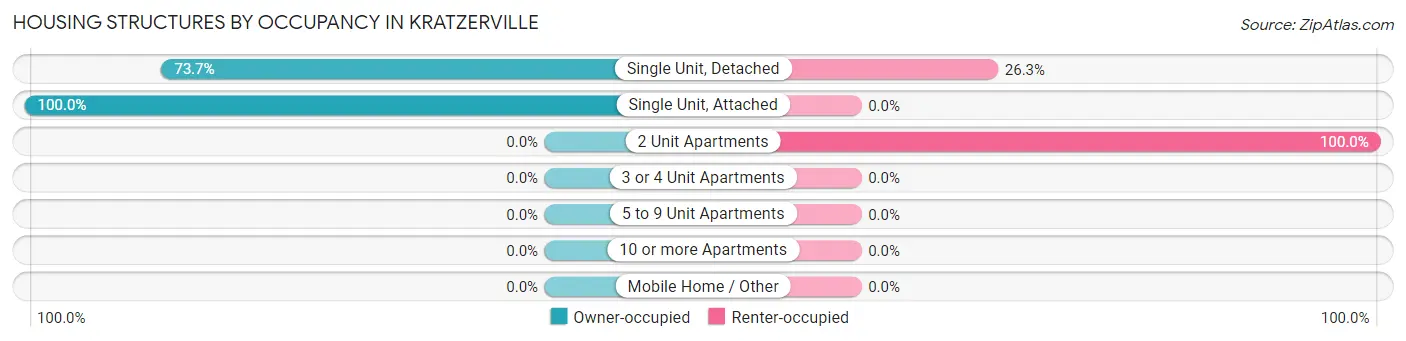
| Structure Type | Owner-occupied | Renter-occupied |
| Single Unit, Detached | 112 (73.7%) | 40 (26.3%) |
| Single Unit, Attached | 2 (100.0%) | 0 (0.0%) |
| 2 Unit Apartments | 0 (0.0%) | 12 (100.0%) |
| 3 or 4 Unit Apartments | 0 (0.0%) | 0 (0.0%) |
| 5 to 9 Unit Apartments | 0 (0.0%) | 0 (0.0%) |
| 10 or more Apartments | 0 (0.0%) | 0 (0.0%) |
| Mobile Home / Other | 0 (0.0%) | 0 (0.0%) |
| Total | 114 (68.7%) | 52 (31.3%) |
Housing Structures by Number of Rooms in Kratzerville
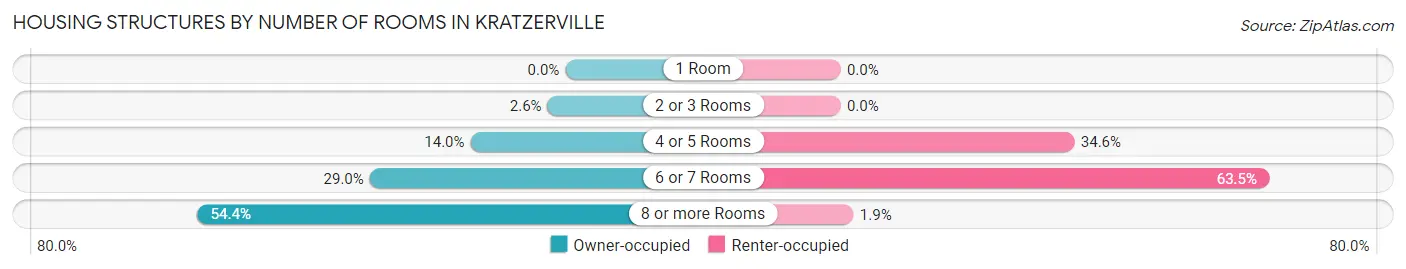
| Number of Rooms | Owner-occupied | Renter-occupied |
| 1 Room | 0 (0.0%) | 0 (0.0%) |
| 2 or 3 Rooms | 3 (2.6%) | 0 (0.0%) |
| 4 or 5 Rooms | 16 (14.0%) | 18 (34.6%) |
| 6 or 7 Rooms | 33 (28.9%) | 33 (63.5%) |
| 8 or more Rooms | 62 (54.4%) | 1 (1.9%) |
| Total | 114 (100.0%) | 52 (100.0%) |
Housing Structure by Heating Type in Kratzerville
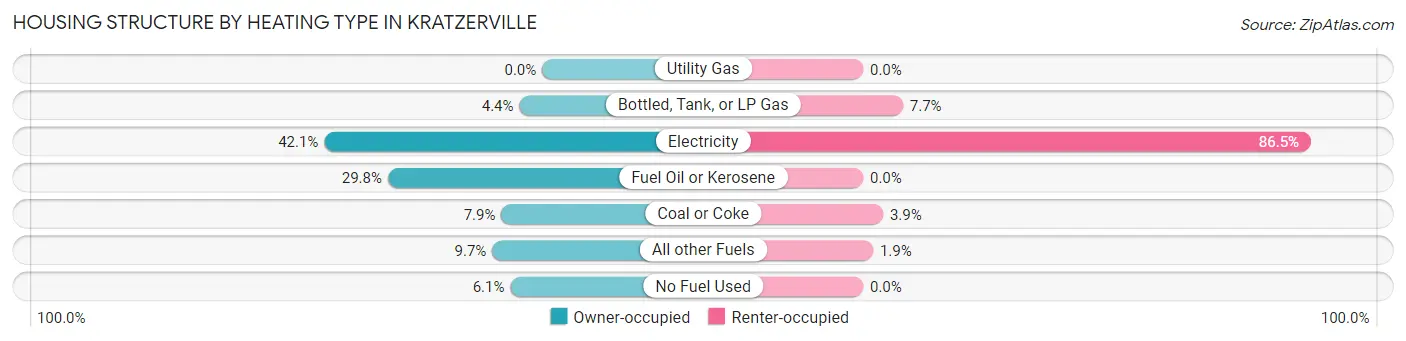
| Heating Type | Owner-occupied | Renter-occupied |
| Utility Gas | 0 (0.0%) | 0 (0.0%) |
| Bottled, Tank, or LP Gas | 5 (4.4%) | 4 (7.7%) |
| Electricity | 48 (42.1%) | 45 (86.5%) |
| Fuel Oil or Kerosene | 34 (29.8%) | 0 (0.0%) |
| Coal or Coke | 9 (7.9%) | 2 (3.8%) |
| All other Fuels | 11 (9.7%) | 1 (1.9%) |
| No Fuel Used | 7 (6.1%) | 0 (0.0%) |
| Total | 114 (100.0%) | 52 (100.0%) |
Household Vehicle Usage in Kratzerville
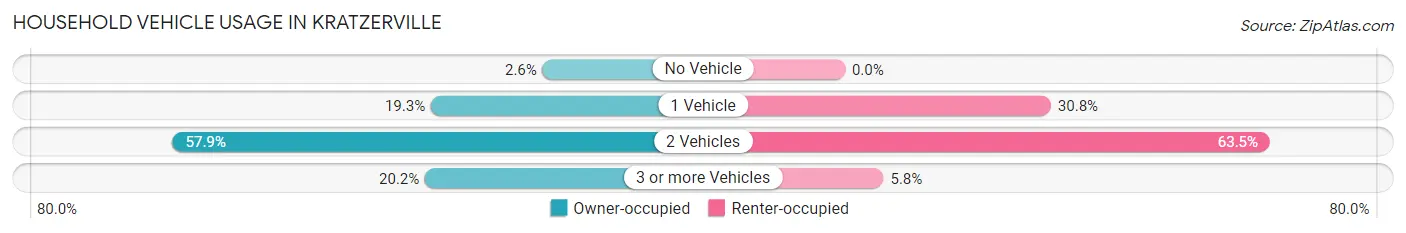
| Vehicles per Household | Owner-occupied | Renter-occupied |
| No Vehicle | 3 (2.6%) | 0 (0.0%) |
| 1 Vehicle | 22 (19.3%) | 16 (30.8%) |
| 2 Vehicles | 66 (57.9%) | 33 (63.5%) |
| 3 or more Vehicles | 23 (20.2%) | 3 (5.8%) |
| Total | 114 (100.0%) | 52 (100.0%) |
Real Estate & Mortgages in Kratzerville
Real Estate and Mortgage Overview in Kratzerville
| Characteristic | Without Mortgage | With Mortgage |
| Housing Units | 66 | 48 |
| Median Property Value | $232,400 | $268,800 |
| Median Household Income | $76,667 | $16 |
| Monthly Housing Costs | $555 | $10 |
| Real Estate Taxes | $2,529 | $0 |
Property Value by Mortgage Status in Kratzerville
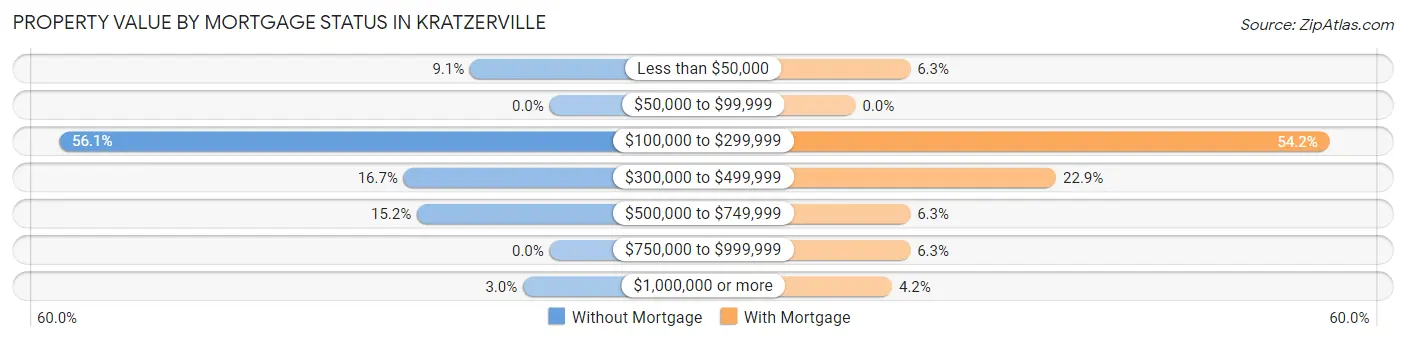
| Property Value | Without Mortgage | With Mortgage |
| Less than $50,000 | 6 (9.1%) | 3 (6.2%) |
| $50,000 to $99,999 | 0 (0.0%) | 0 (0.0%) |
| $100,000 to $299,999 | 37 (56.1%) | 26 (54.2%) |
| $300,000 to $499,999 | 11 (16.7%) | 11 (22.9%) |
| $500,000 to $749,999 | 10 (15.1%) | 3 (6.2%) |
| $750,000 to $999,999 | 0 (0.0%) | 3 (6.2%) |
| $1,000,000 or more | 2 (3.0%) | 2 (4.2%) |
| Total | 66 (100.0%) | 48 (100.0%) |
Household Income by Mortgage Status in Kratzerville
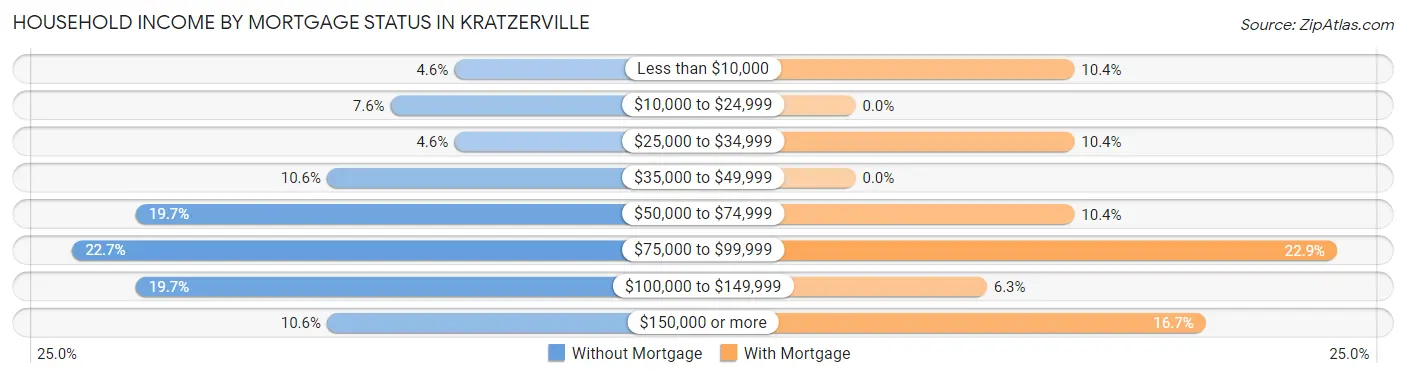
| Household Income | Without Mortgage | With Mortgage |
| Less than $10,000 | 3 (4.5%) | 5 (10.4%) |
| $10,000 to $24,999 | 5 (7.6%) | 0 (0.0%) |
| $25,000 to $34,999 | 3 (4.5%) | 5 (10.4%) |
| $35,000 to $49,999 | 7 (10.6%) | 0 (0.0%) |
| $50,000 to $74,999 | 13 (19.7%) | 5 (10.4%) |
| $75,000 to $99,999 | 15 (22.7%) | 11 (22.9%) |
| $100,000 to $149,999 | 13 (19.7%) | 3 (6.2%) |
| $150,000 or more | 7 (10.6%) | 8 (16.7%) |
| Total | 66 (100.0%) | 48 (100.0%) |
Property Value to Household Income Ratio in Kratzerville
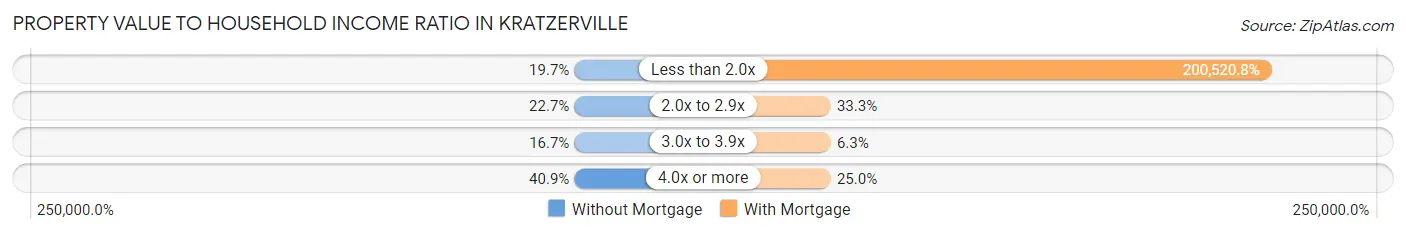
| Value-to-Income Ratio | Without Mortgage | With Mortgage |
| Less than 2.0x | 13 (19.7%) | 96,250 (200,520.8%) |
| 2.0x to 2.9x | 15 (22.7%) | 16 (33.3%) |
| 3.0x to 3.9x | 11 (16.7%) | 3 (6.2%) |
| 4.0x or more | 27 (40.9%) | 12 (25.0%) |
| Total | 66 (100.0%) | 48 (100.0%) |
Real Estate Taxes by Mortgage Status in Kratzerville
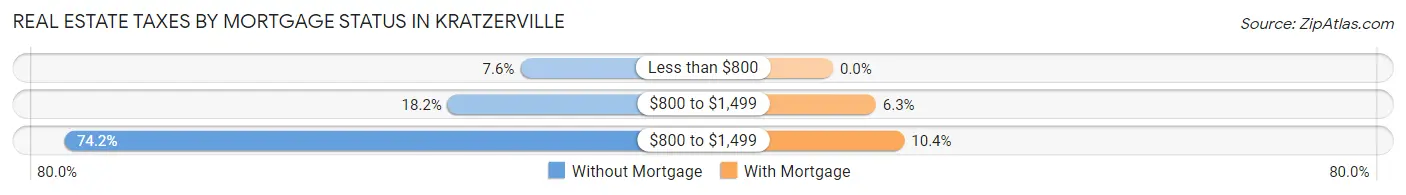
| Property Taxes | Without Mortgage | With Mortgage |
| Less than $800 | 5 (7.6%) | 0 (0.0%) |
| $800 to $1,499 | 12 (18.2%) | 3 (6.2%) |
| $800 to $1,499 | 49 (74.2%) | 5 (10.4%) |
| Total | 66 (100.0%) | 48 (100.0%) |
Health & Disability in Kratzerville
Health Insurance Coverage by Age in Kratzerville
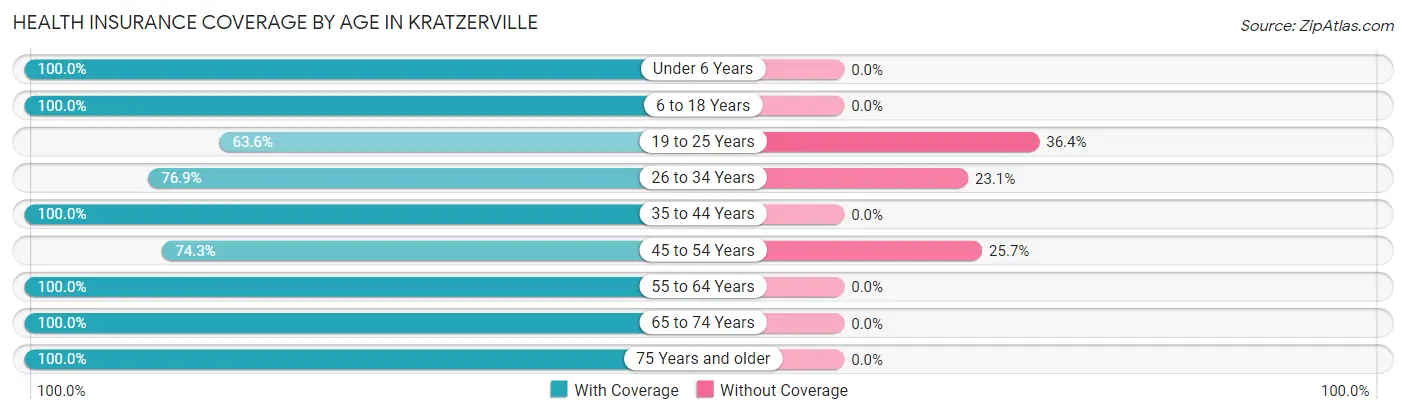
| Age Bracket | With Coverage | Without Coverage |
| Under 6 Years | 13 (100.0%) | 0 (0.0%) |
| 6 to 18 Years | 20 (100.0%) | 0 (0.0%) |
| 19 to 25 Years | 7 (63.6%) | 4 (36.4%) |
| 26 to 34 Years | 30 (76.9%) | 9 (23.1%) |
| 35 to 44 Years | 18 (100.0%) | 0 (0.0%) |
| 45 to 54 Years | 26 (74.3%) | 9 (25.7%) |
| 55 to 64 Years | 87 (100.0%) | 0 (0.0%) |
| 65 to 74 Years | 72 (100.0%) | 0 (0.0%) |
| 75 Years and older | 25 (100.0%) | 0 (0.0%) |
| Total | 298 (93.1%) | 22 (6.9%) |
Health Insurance Coverage by Citizenship Status in Kratzerville
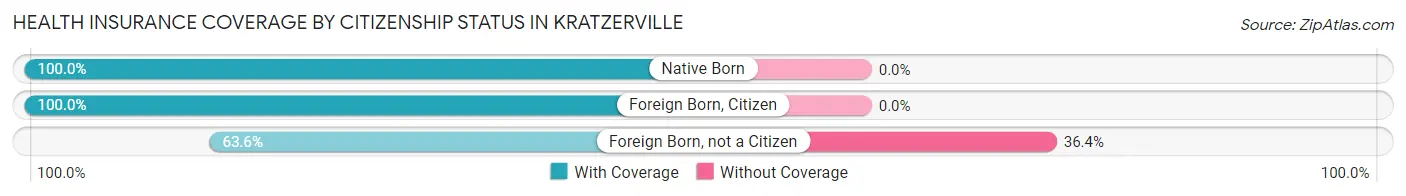
| Citizenship Status | With Coverage | Without Coverage |
| Native Born | 13 (100.0%) | 0 (0.0%) |
| Foreign Born, Citizen | 20 (100.0%) | 0 (0.0%) |
| Foreign Born, not a Citizen | 7 (63.6%) | 4 (36.4%) |
Health Insurance Coverage by Household Income in Kratzerville
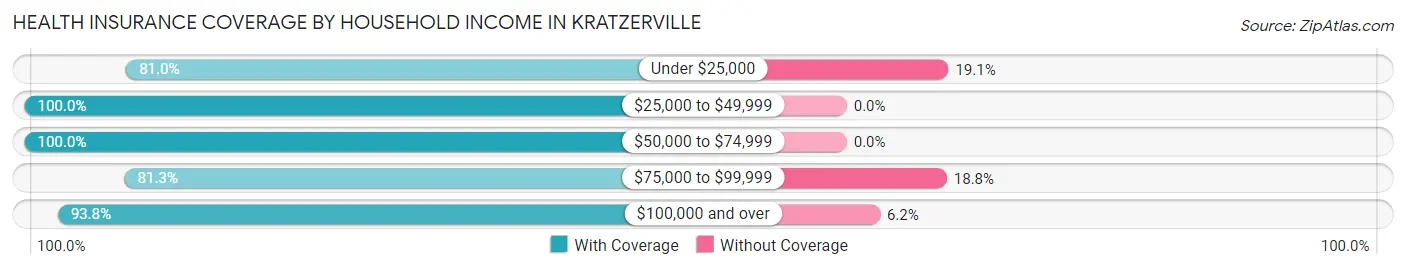
| Household Income | With Coverage | Without Coverage |
| Under $25,000 | 17 (80.9%) | 4 (19.1%) |
| $25,000 to $49,999 | 47 (100.0%) | 0 (0.0%) |
| $50,000 to $74,999 | 59 (100.0%) | 0 (0.0%) |
| $75,000 to $99,999 | 39 (81.2%) | 9 (18.8%) |
| $100,000 and over | 136 (93.8%) | 9 (6.2%) |
Public vs Private Health Insurance Coverage by Age in Kratzerville
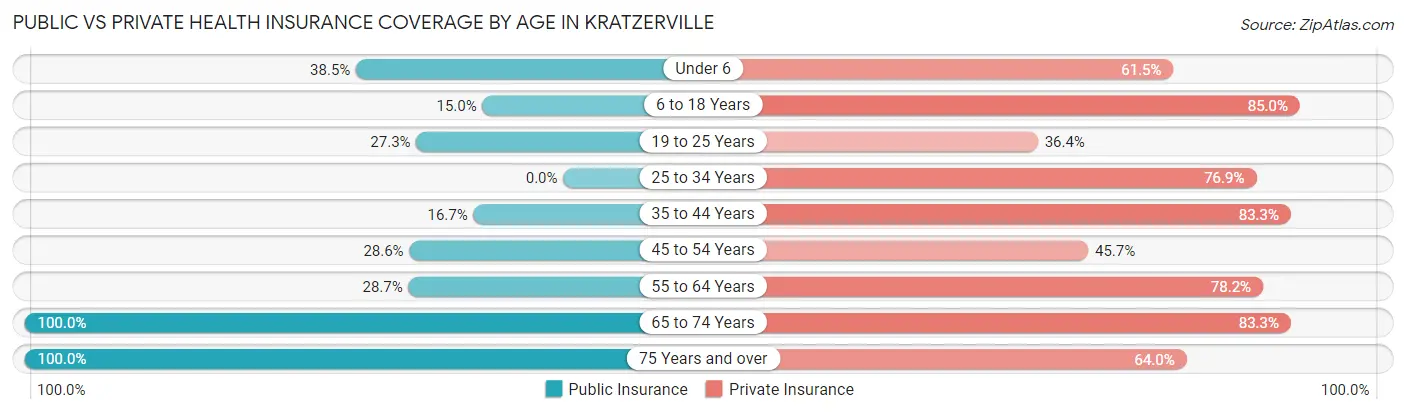
| Age Bracket | Public Insurance | Private Insurance |
| Under 6 | 5 (38.5%) | 8 (61.5%) |
| 6 to 18 Years | 3 (15.0%) | 17 (85.0%) |
| 19 to 25 Years | 3 (27.3%) | 4 (36.4%) |
| 25 to 34 Years | 0 (0.0%) | 30 (76.9%) |
| 35 to 44 Years | 3 (16.7%) | 15 (83.3%) |
| 45 to 54 Years | 10 (28.6%) | 16 (45.7%) |
| 55 to 64 Years | 25 (28.7%) | 68 (78.2%) |
| 65 to 74 Years | 72 (100.0%) | 60 (83.3%) |
| 75 Years and over | 25 (100.0%) | 16 (64.0%) |
| Total | 146 (45.6%) | 234 (73.1%) |
Disability Status by Sex by Age in Kratzerville
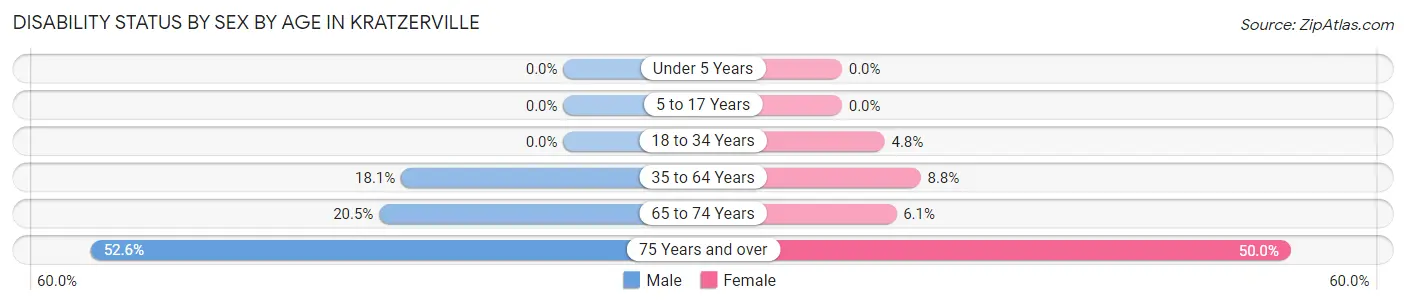
| Age Bracket | Male | Female |
| Under 5 Years | 0 (0.0%) | 0 (0.0%) |
| 5 to 17 Years | 0 (0.0%) | 0 (0.0%) |
| 18 to 34 Years | 0 (0.0%) | 1 (4.8%) |
| 35 to 64 Years | 15 (18.1%) | 5 (8.8%) |
| 65 to 74 Years | 8 (20.5%) | 2 (6.1%) |
| 75 Years and over | 10 (52.6%) | 3 (50.0%) |
Disability Class by Sex by Age in Kratzerville
Disability Class: Hearing Difficulty
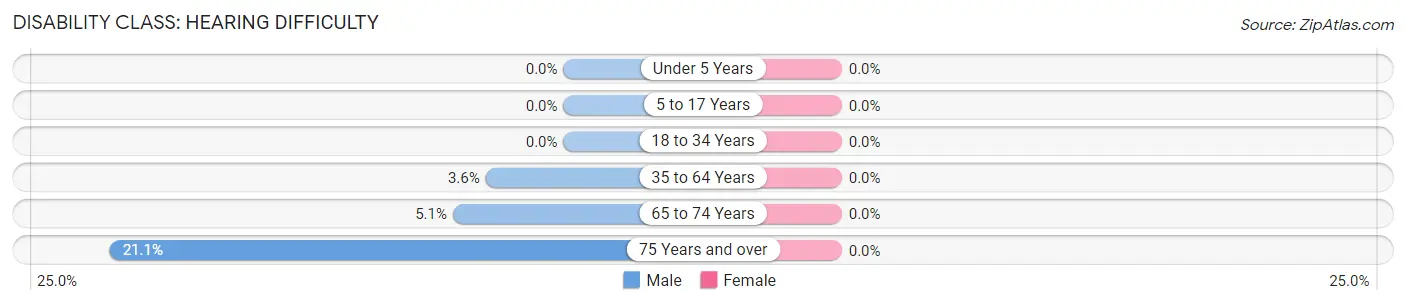
| Age Bracket | Male | Female |
| Under 5 Years | 0 (0.0%) | 0 (0.0%) |
| 5 to 17 Years | 0 (0.0%) | 0 (0.0%) |
| 18 to 34 Years | 0 (0.0%) | 0 (0.0%) |
| 35 to 64 Years | 3 (3.6%) | 0 (0.0%) |
| 65 to 74 Years | 2 (5.1%) | 0 (0.0%) |
| 75 Years and over | 4 (21.0%) | 0 (0.0%) |
Disability Class: Vision Difficulty
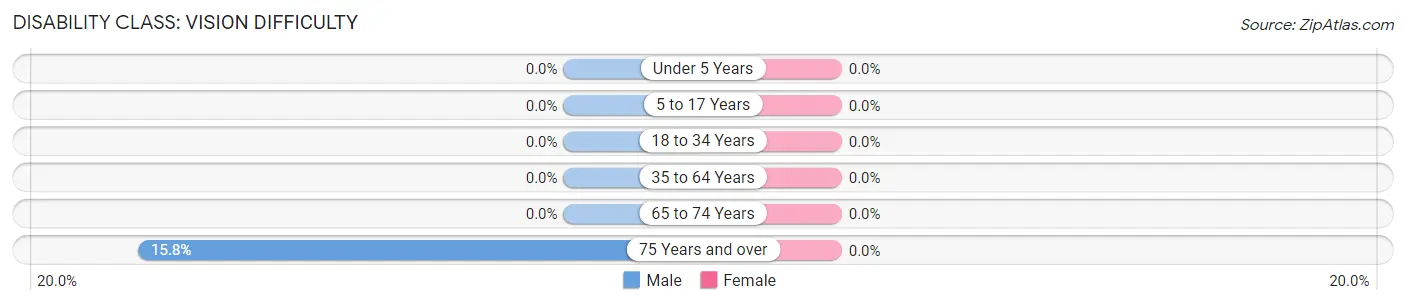
| Age Bracket | Male | Female |
| Under 5 Years | 0 (0.0%) | 0 (0.0%) |
| 5 to 17 Years | 0 (0.0%) | 0 (0.0%) |
| 18 to 34 Years | 0 (0.0%) | 0 (0.0%) |
| 35 to 64 Years | 0 (0.0%) | 0 (0.0%) |
| 65 to 74 Years | 0 (0.0%) | 0 (0.0%) |
| 75 Years and over | 3 (15.8%) | 0 (0.0%) |
Disability Class: Cognitive Difficulty
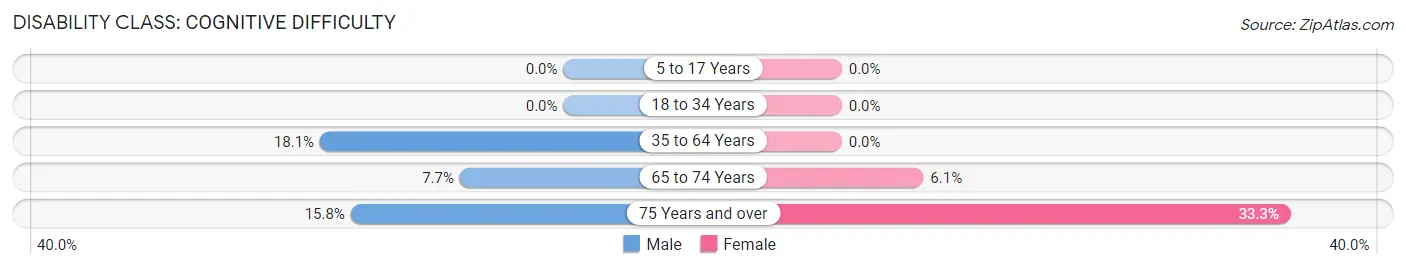
| Age Bracket | Male | Female |
| 5 to 17 Years | 0 (0.0%) | 0 (0.0%) |
| 18 to 34 Years | 0 (0.0%) | 0 (0.0%) |
| 35 to 64 Years | 15 (18.1%) | 0 (0.0%) |
| 65 to 74 Years | 3 (7.7%) | 2 (6.1%) |
| 75 Years and over | 3 (15.8%) | 2 (33.3%) |
Disability Class: Ambulatory Difficulty
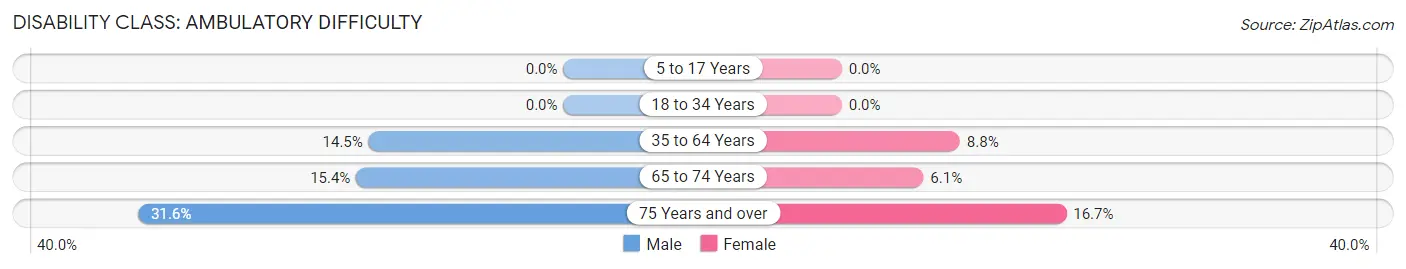
| Age Bracket | Male | Female |
| 5 to 17 Years | 0 (0.0%) | 0 (0.0%) |
| 18 to 34 Years | 0 (0.0%) | 0 (0.0%) |
| 35 to 64 Years | 12 (14.5%) | 5 (8.8%) |
| 65 to 74 Years | 6 (15.4%) | 2 (6.1%) |
| 75 Years and over | 6 (31.6%) | 1 (16.7%) |
Disability Class: Self-Care Difficulty
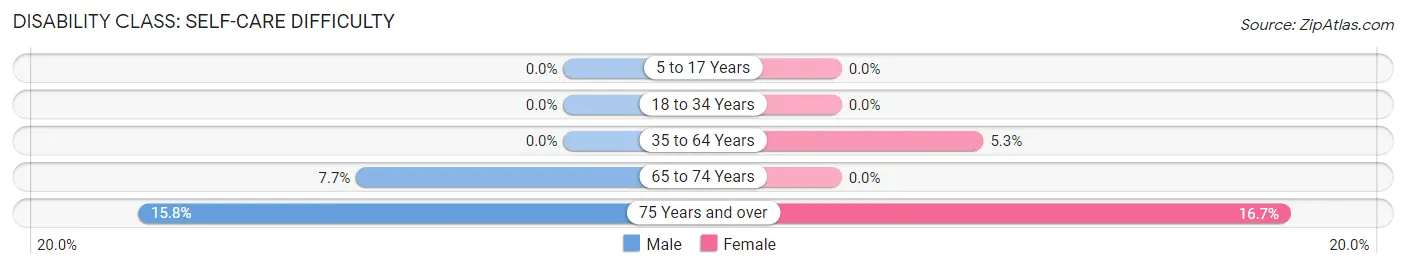
| Age Bracket | Male | Female |
| 5 to 17 Years | 0 (0.0%) | 0 (0.0%) |
| 18 to 34 Years | 0 (0.0%) | 0 (0.0%) |
| 35 to 64 Years | 0 (0.0%) | 3 (5.3%) |
| 65 to 74 Years | 3 (7.7%) | 0 (0.0%) |
| 75 Years and over | 3 (15.8%) | 1 (16.7%) |
Technology Access in Kratzerville
Computing Device Access in Kratzerville
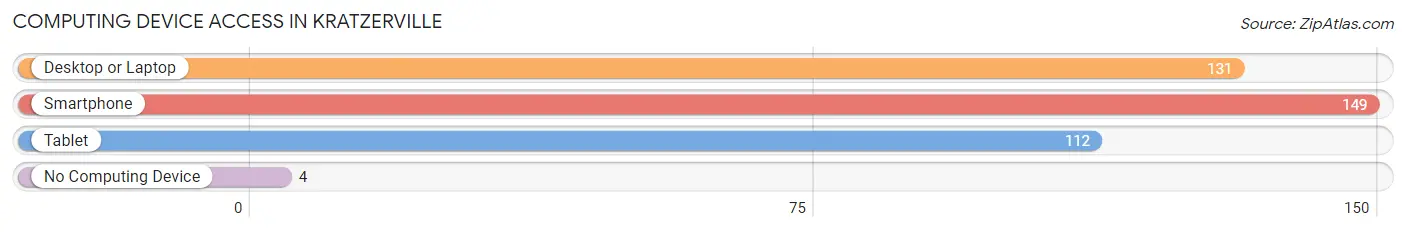
| Device Type | # Households | % Households |
| Desktop or Laptop | 131 | 78.9% |
| Smartphone | 149 | 89.8% |
| Tablet | 112 | 67.5% |
| No Computing Device | 4 | 2.4% |
| Total | 166 | 100.0% |
Internet Access in Kratzerville
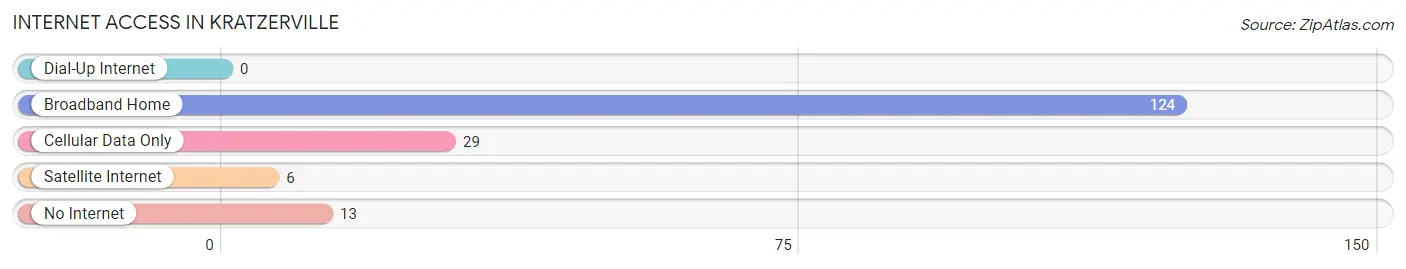
| Internet Type | # Households | % Households |
| Dial-Up Internet | 0 | 0.0% |
| Broadband Home | 124 | 74.7% |
| Cellular Data Only | 29 | 17.5% |
| Satellite Internet | 6 | 3.6% |
| No Internet | 13 | 7.8% |
| Total | 166 | 100.0% |
Kratzerville Summary
Kratzerville is a small borough located in Snyder County, Pennsylvania. It is situated in the Susquehanna Valley, approximately 10 miles south of Selinsgrove and 8 miles north of Middleburg. The population of Kratzerville was 545 at the 2010 census.
History
Kratzerville was founded in 1845 by John Kratzer, a German immigrant who had settled in the area in 1837. Kratzer purchased a tract of land from the Snyder family and laid out the town. He named it Kratzerville in honor of his family.
The town grew slowly but steadily, and by the late 19th century it had become a thriving community. It was home to a variety of businesses, including a hotel, a general store, a blacksmith shop, a sawmill, and a gristmill.
In the early 20th century, Kratzerville experienced a period of decline. The population decreased as people moved away in search of better economic opportunities. By the 1950s, the town had become a virtual ghost town.
However, in the late 20th century, Kratzerville experienced a resurgence. The population began to grow again, and new businesses opened. Today, Kratzerville is a vibrant community with a strong sense of identity and pride.
Geography
Kratzerville is located in the Susquehanna Valley, approximately 10 miles south of Selinsgrove and 8 miles north of Middleburg. The borough is situated on the east bank of the Susquehanna River, and is surrounded by rolling hills and farmland.
The climate in Kratzerville is humid continental, with hot summers and cold winters. The average annual temperature is 52°F (11°C), and the average annual precipitation is 40 inches (101 cm).
Economy
Kratzerville’s economy is largely based on agriculture and tourism. The town is home to several farms, which produce a variety of crops, including corn, soybeans, and hay.
Tourism is also an important part of the local economy. Kratzerville is home to several historic sites, including the Kratzer House, the Kratzer Mill, and the Kratzer Cemetery. The town also hosts a variety of festivals and events throughout the year, including the Kratzerville Fall Festival and the Kratzerville Summer Music Festival.
Demographics
As of the 2010 census, the population of Kratzerville was 545. The racial makeup of the town was 97.3% White, 0.7% African American, 0.2% Native American, 0.2% Asian, and 1.6% from other races.
The median household income in Kratzerville was $41,250, and the median family income was $50,000. The per capita income was $20,945. About 8.3% of families and 10.2% of the population were below the poverty line.
Kratzerville is served by the Selinsgrove Area School District. The town is home to one elementary school, one middle school, and one high school.
Kratzerville is a small but vibrant community with a strong sense of identity and pride. The town is home to a variety of businesses and attractions, and is a popular destination for tourists and locals alike.
Common Questions
What is Per Capita Income in Kratzerville?
Per Capita income in Kratzerville is $45,888.
What is the Median Family Income in Kratzerville?
Median Family Income in Kratzerville is $93,333.
What is the Median Household income in Kratzerville?
Median Household Income in Kratzerville is $88,333.
What is Income or Wage Gap in Kratzerville?
Income or Wage Gap in Kratzerville is 40.5%.
Women in Kratzerville earn 59.5 cents for every dollar earned by a man.
What is Inequality or Gini Index in Kratzerville?
Inequality or Gini Index in Kratzerville is 0.35.
What is the Total Population of Kratzerville?
Total Population of Kratzerville is 320.
What is the Total Male Population of Kratzerville?
Total Male Population of Kratzerville is 187.
What is the Total Female Population of Kratzerville?
Total Female Population of Kratzerville is 133.
What is the Ratio of Males per 100 Females in Kratzerville?
There are 140.60 Males per 100 Females in Kratzerville.
What is the Ratio of Females per 100 Males in Kratzerville?
There are 71.12 Females per 100 Males in Kratzerville.
What is the Median Population Age in Kratzerville?
Median Population Age in Kratzerville is 55.8 Years.
What is the Average Family Size in Kratzerville
Average Family Size in Kratzerville is 2.3 People.
What is the Average Household Size in Kratzerville
Average Household Size in Kratzerville is 1.9 People.
How Large is the Labor Force in Kratzerville?
There are 162 People in the Labor Forcein in Kratzerville.
What is the Percentage of People in the Labor Force in Kratzerville?
56.3% of People are in the Labor Force in Kratzerville.
What is the Unemployment Rate in Kratzerville?
Unemployment Rate in Kratzerville is 1.2%.