Seneca, PA Map & Demographics
Seneca Map
Seneca Overview
$32,226
PER CAPITA INCOME
$70,938
AVG FAMILY INCOME
$55,357
AVG HOUSEHOLD INCOME
24.7%
WAGE / INCOME GAP [ % ]
75.3¢/ $1
WAGE / INCOME GAP [ $ ]
0.39
INEQUALITY / GINI INDEX
911
TOTAL POPULATION
440
MALE POPULATION
471
FEMALE POPULATION
93.42
MALES / 100 FEMALES
107.05
FEMALES / 100 MALES
43.9
MEDIAN AGE
2.6
AVG FAMILY SIZE
2.1
AVG HOUSEHOLD SIZE
374
LABOR FORCE [ PEOPLE ]
52.8%
PERCENT IN LABOR FORCE
4.3%
UNEMPLOYMENT RATE
Seneca Zip Codes
Income in Seneca
Income Overview in Seneca
Per Capita Income in Seneca is $32,226, while median incomes of families and households are $70,938 and $55,357 respectively.
| Characteristic | Number | Measure |
| Per Capita Income | 911 | $32,226 |
| Median Family Income | 295 | $70,938 |
| Mean Family Income | 295 | $87,264 |
| Median Household Income | 426 | $55,357 |
| Mean Household Income | 426 | $73,819 |
| Income Deficit | 295 | $0 |
| Wage / Income Gap (%) | 911 | 24.66% |
| Wage / Income Gap ($) | 911 | 75.34¢ per $1 |
| Gini / Inequality Index | 911 | 0.39 |
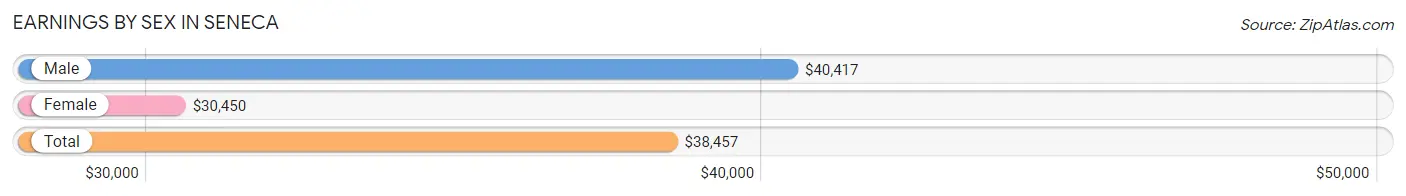
Earnings by Sex in Seneca
Average Earnings in Seneca are $38,457, $40,417 for men and $30,450 for women, a difference of 24.7%.
| Sex | Number | Average Earnings |
| Male | 279 (65.2%) | $40,417 |
| Female | 149 (34.8%) | $30,450 |
| Total | 428 (100.0%) | $38,457 |
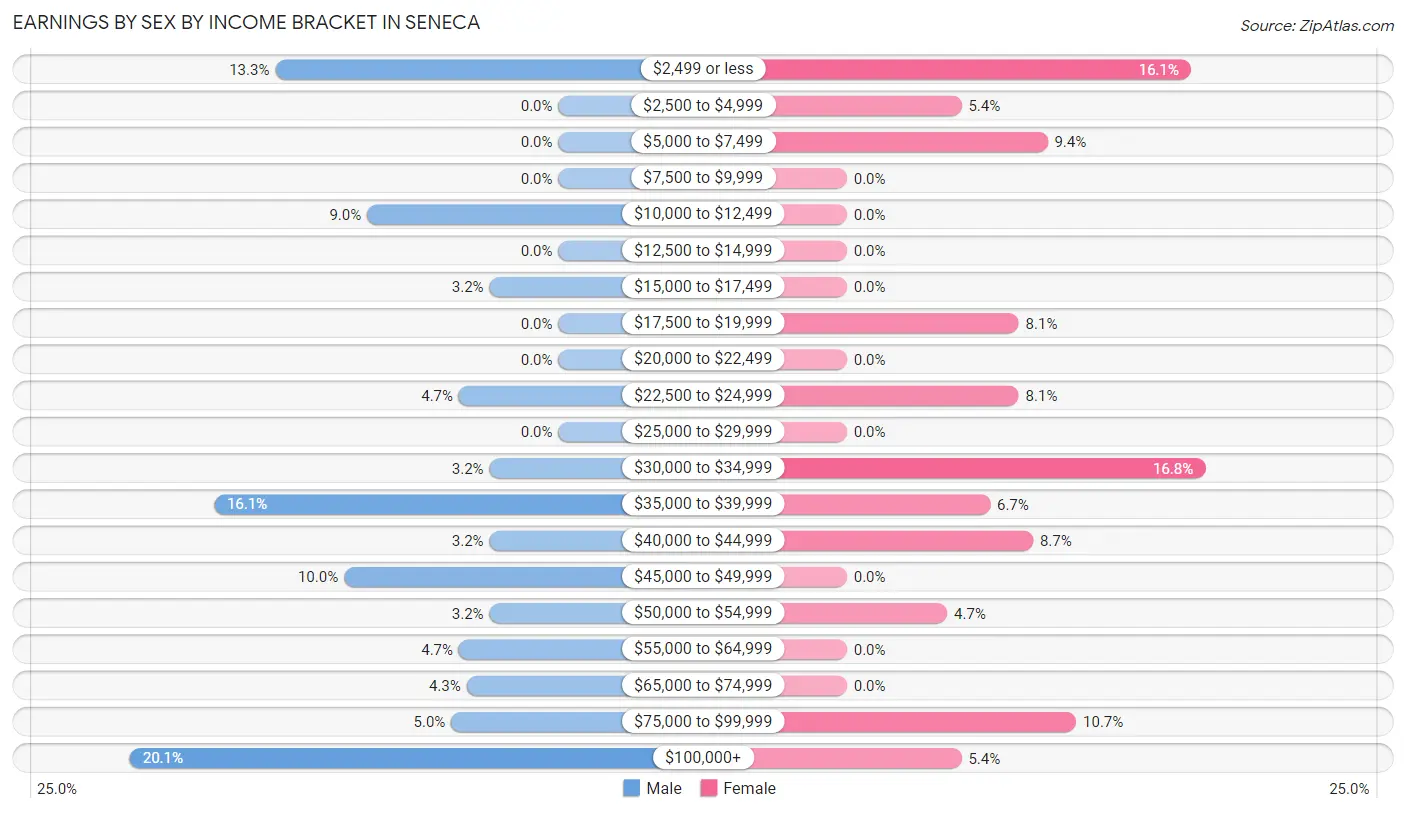
Earnings by Sex by Income Bracket in Seneca
The most common earnings brackets in Seneca are $100,000+ for men (56 | 20.1%) and $30,000 to $34,999 for women (25 | 16.8%).
| Income | Male | Female |
| $2,499 or less | 37 (13.3%) | 24 (16.1%) |
| $2,500 to $4,999 | 0 (0.0%) | 8 (5.4%) |
| $5,000 to $7,499 | 0 (0.0%) | 14 (9.4%) |
| $7,500 to $9,999 | 0 (0.0%) | 0 (0.0%) |
| $10,000 to $12,499 | 25 (9.0%) | 0 (0.0%) |
| $12,500 to $14,999 | 0 (0.0%) | 0 (0.0%) |
| $15,000 to $17,499 | 9 (3.2%) | 0 (0.0%) |
| $17,500 to $19,999 | 0 (0.0%) | 12 (8.1%) |
| $20,000 to $22,499 | 0 (0.0%) | 0 (0.0%) |
| $22,500 to $24,999 | 13 (4.7%) | 12 (8.1%) |
| $25,000 to $29,999 | 0 (0.0%) | 0 (0.0%) |
| $30,000 to $34,999 | 9 (3.2%) | 25 (16.8%) |
| $35,000 to $39,999 | 45 (16.1%) | 10 (6.7%) |
| $40,000 to $44,999 | 9 (3.2%) | 13 (8.7%) |
| $45,000 to $49,999 | 28 (10.0%) | 0 (0.0%) |
| $50,000 to $54,999 | 9 (3.2%) | 7 (4.7%) |
| $55,000 to $64,999 | 13 (4.7%) | 0 (0.0%) |
| $65,000 to $74,999 | 12 (4.3%) | 0 (0.0%) |
| $75,000 to $99,999 | 14 (5.0%) | 16 (10.7%) |
| $100,000+ | 56 (20.1%) | 8 (5.4%) |
| Total | 279 (100.0%) | 149 (100.0%) |
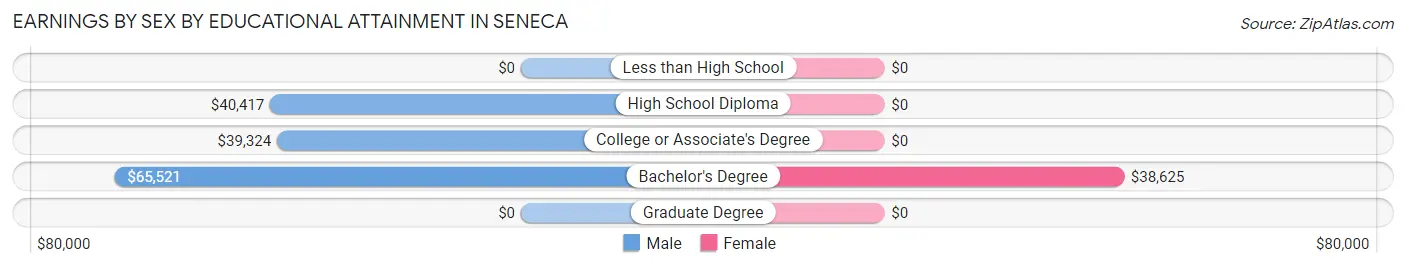
Earnings by Sex by Educational Attainment in Seneca
Average earnings in Seneca are $47,115 for men and $30,450 for women, a difference of 35.4%. Men with an educational attainment of bachelor's degree enjoy the highest average annual earnings of $65,521, while those with college or associate's degree education earn the least with $39,324. Women with an educational attainment of bachelor's degree earn the most with the average annual earnings of $38,625, while those with bachelor's degree education have the smallest earnings of $38,625.
| Educational Attainment | Male Income | Female Income |
| Less than High School | - | - |
| High School Diploma | $40,417 | $0 |
| College or Associate's Degree | $39,324 | $0 |
| Bachelor's Degree | $65,521 | $38,625 |
| Graduate Degree | - | - |
| Total | $47,115 | $30,450 |
Family Income in Seneca
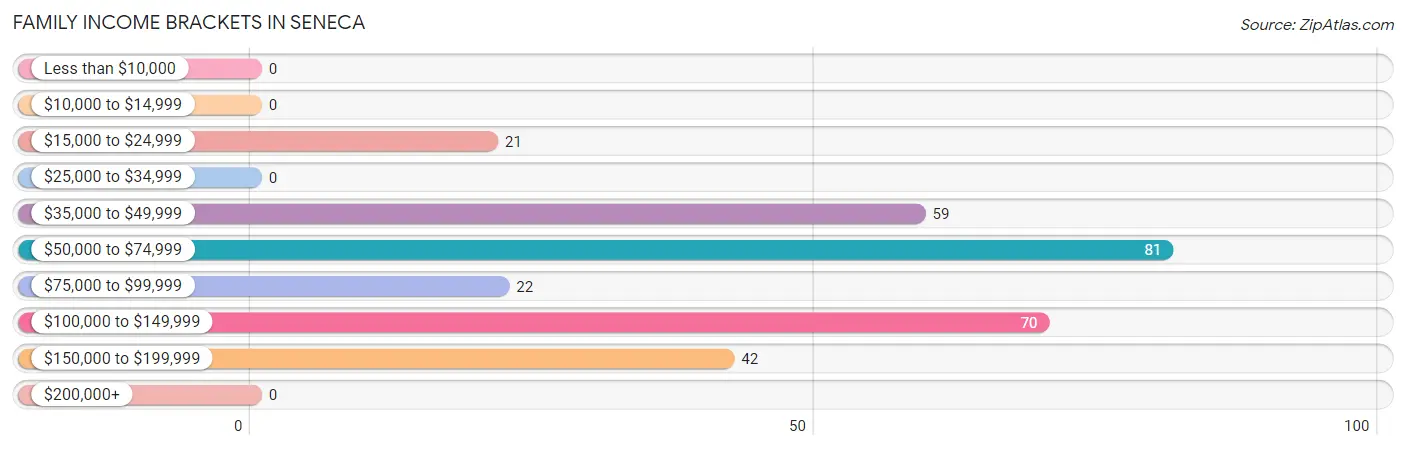
Family Income Brackets in Seneca
According to the Seneca family income data, there are 81 families falling into the $50,000 to $74,999 income range, which is the most common income bracket and makes up 27.5% of all families.
| Income Bracket | # Families | % Families |
| Less than $10,000 | 0 | 0.0% |
| $10,000 to $14,999 | 0 | 0.0% |
| $15,000 to $24,999 | 21 | 7.1% |
| $25,000 to $34,999 | 0 | 0.0% |
| $35,000 to $49,999 | 59 | 20.0% |
| $50,000 to $74,999 | 81 | 27.5% |
| $75,000 to $99,999 | 22 | 7.5% |
| $100,000 to $149,999 | 70 | 23.7% |
| $150,000 to $199,999 | 42 | 14.2% |
| $200,000+ | 0 | 0.0% |
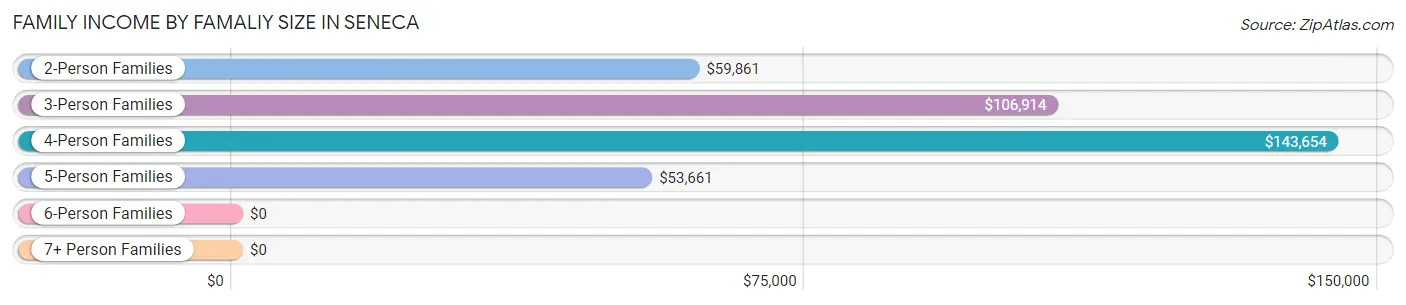
Family Income by Famaliy Size in Seneca
4-person families (28 | 9.5%) account for the highest median family income in Seneca with $143,654 per family, while 4-person families (28 | 9.5%) have the highest median income of $35,914 per family member.
| Income Bracket | # Families | Median Income |
| 2-Person Families | 179 (60.7%) | $59,861 |
| 3-Person Families | 49 (16.6%) | $106,914 |
| 4-Person Families | 28 (9.5%) | $143,654 |
| 5-Person Families | 39 (13.2%) | $53,661 |
| 6-Person Families | 0 (0.0%) | $0 |
| 7+ Person Families | 0 (0.0%) | $0 |
| Total | 295 (100.0%) | $70,938 |
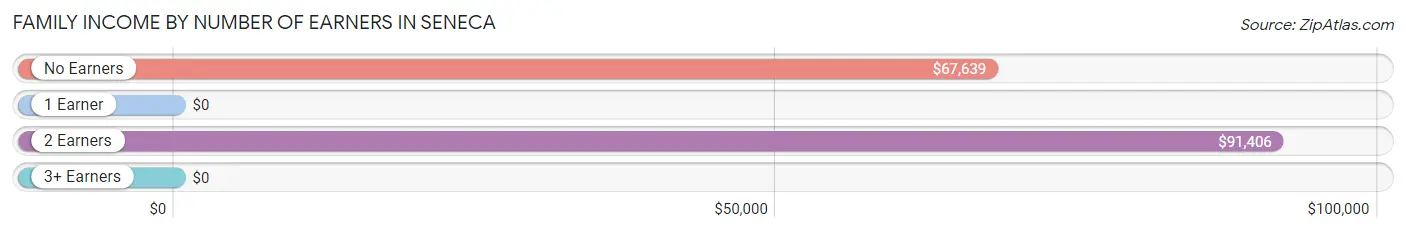
Family Income by Number of Earners in Seneca
| Number of Earners | # Families | Median Income |
| No Earners | 47 (15.9%) | $67,639 |
| 1 Earner | 147 (49.8%) | $0 |
| 2 Earners | 81 (27.5%) | $91,406 |
| 3+ Earners | 20 (6.8%) | $0 |
| Total | 295 (100.0%) | $70,938 |
Household Income in Seneca
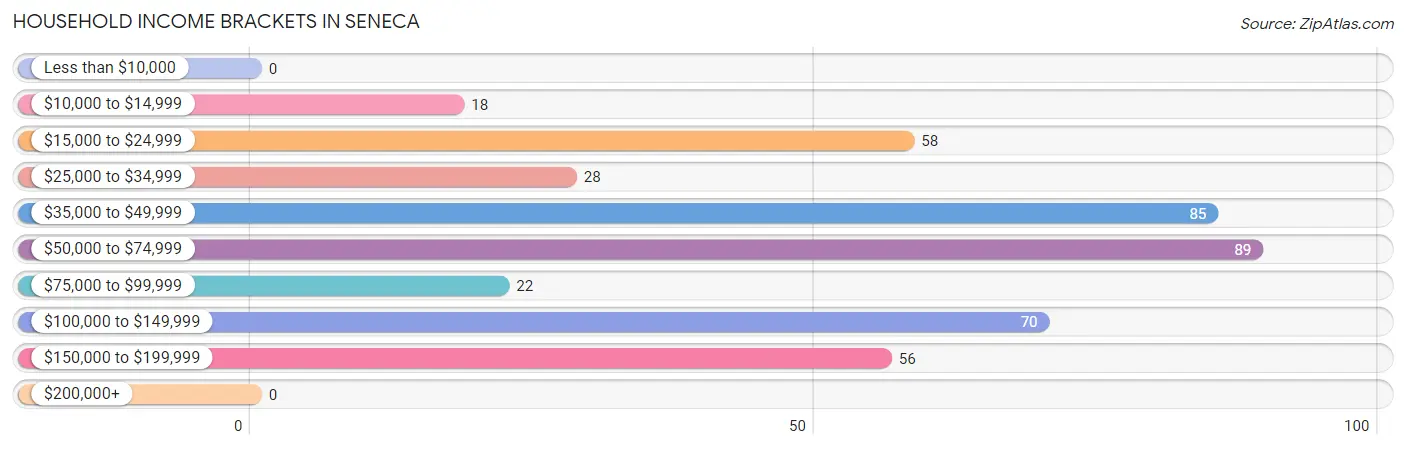
Household Income Brackets in Seneca
With 89 households falling in the category, the $50,000 to $74,999 income range is the most frequent in Seneca, accounting for 20.9% of all households.
| Income Bracket | # Households | % Households |
| Less than $10,000 | 0 | 0.0% |
| $10,000 to $14,999 | 18 | 4.2% |
| $15,000 to $24,999 | 58 | 13.6% |
| $25,000 to $34,999 | 28 | 6.6% |
| $35,000 to $49,999 | 85 | 20.0% |
| $50,000 to $74,999 | 89 | 20.9% |
| $75,000 to $99,999 | 22 | 5.2% |
| $100,000 to $149,999 | 70 | 16.4% |
| $150,000 to $199,999 | 56 | 13.1% |
| $200,000+ | 0 | 0.0% |
Household Income by Householder Age in Seneca
The median household income in Seneca is $55,357, with the highest median household income of $57,054 found in the 65+ years age bracket for the primary householder. A total of 183 households (43.0%) fall into this category.
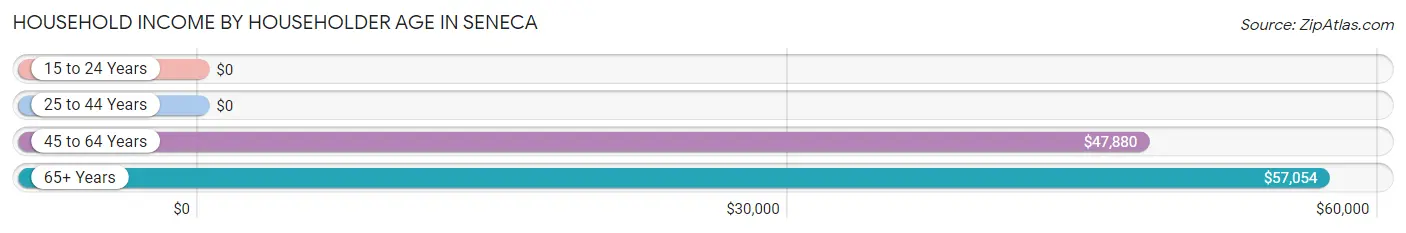
| Income Bracket | # Households | Median Income |
| 15 to 24 Years | 0 (0.0%) | $0 |
| 25 to 44 Years | 136 (31.9%) | $0 |
| 45 to 64 Years | 107 (25.1%) | $47,880 |
| 65+ Years | 183 (43.0%) | $57,054 |
| Total | 426 (100.0%) | $55,357 |
Poverty in Seneca
Income Below Poverty by Sex and Age in Seneca
With 5.0% poverty level for males and 8.3% for females among the residents of Seneca, 55 to 64 year old males and 55 to 64 year old females are the most vulnerable to poverty, with 22 males (28.6%) and 21 females (27.6%) in their respective age groups living below the poverty level.
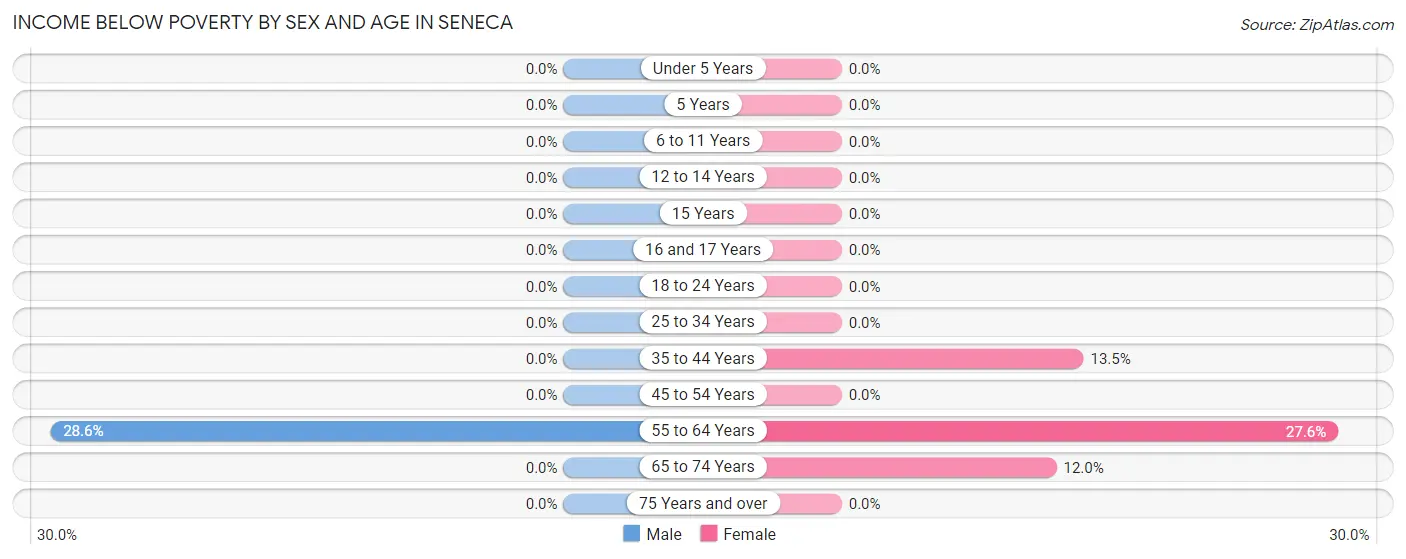
| Age Bracket | Male | Female |
| Under 5 Years | 0 (0.0%) | 0 (0.0%) |
| 5 Years | 0 (0.0%) | 0 (0.0%) |
| 6 to 11 Years | 0 (0.0%) | 0 (0.0%) |
| 12 to 14 Years | 0 (0.0%) | 0 (0.0%) |
| 15 Years | 0 (0.0%) | 0 (0.0%) |
| 16 and 17 Years | 0 (0.0%) | 0 (0.0%) |
| 18 to 24 Years | 0 (0.0%) | 0 (0.0%) |
| 25 to 34 Years | 0 (0.0%) | 0 (0.0%) |
| 35 to 44 Years | 0 (0.0%) | 7 (13.5%) |
| 45 to 54 Years | 0 (0.0%) | 0 (0.0%) |
| 55 to 64 Years | 22 (28.6%) | 21 (27.6%) |
| 65 to 74 Years | 0 (0.0%) | 11 (12.0%) |
| 75 Years and over | 0 (0.0%) | 0 (0.0%) |
| Total | 22 (5.0%) | 39 (8.3%) |
Income Above Poverty by Sex and Age in Seneca
According to the poverty statistics in Seneca, males aged under 5 years and females aged under 5 years are the age groups that are most secure financially, with 100.0% of males and 100.0% of females in these age groups living above the poverty line.
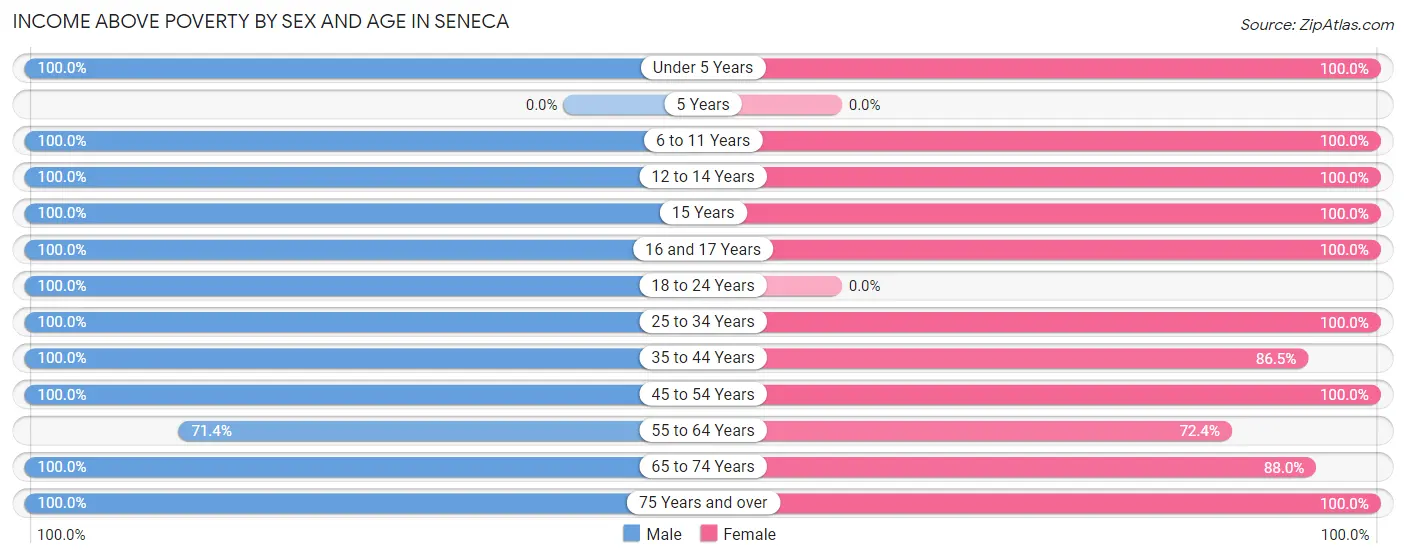
| Age Bracket | Male | Female |
| Under 5 Years | 6 (100.0%) | 59 (100.0%) |
| 5 Years | 0 (0.0%) | 0 (0.0%) |
| 6 to 11 Years | 13 (100.0%) | 13 (100.0%) |
| 12 to 14 Years | 18 (100.0%) | 58 (100.0%) |
| 15 Years | 16 (100.0%) | 19 (100.0%) |
| 16 and 17 Years | 21 (100.0%) | 7 (100.0%) |
| 18 to 24 Years | 16 (100.0%) | 0 (0.0%) |
| 25 to 34 Years | 22 (100.0%) | 21 (100.0%) |
| 35 to 44 Years | 118 (100.0%) | 45 (86.5%) |
| 45 to 54 Years | 30 (100.0%) | 18 (100.0%) |
| 55 to 64 Years | 55 (71.4%) | 55 (72.4%) |
| 65 to 74 Years | 90 (100.0%) | 81 (88.0%) |
| 75 Years and over | 13 (100.0%) | 56 (100.0%) |
| Total | 418 (95.0%) | 432 (91.7%) |
Income Below Poverty Among Married-Couple Families in Seneca
The poverty statistics for married-couple families in Seneca show that 8.9% or 21 of the total 237 families live below the poverty line. Families with no children have the highest poverty rate of 14.8%, comprising of 21 families. On the other hand, families with 1 or 2 children have the lowest poverty rate of 0.0%, which includes 0 families.
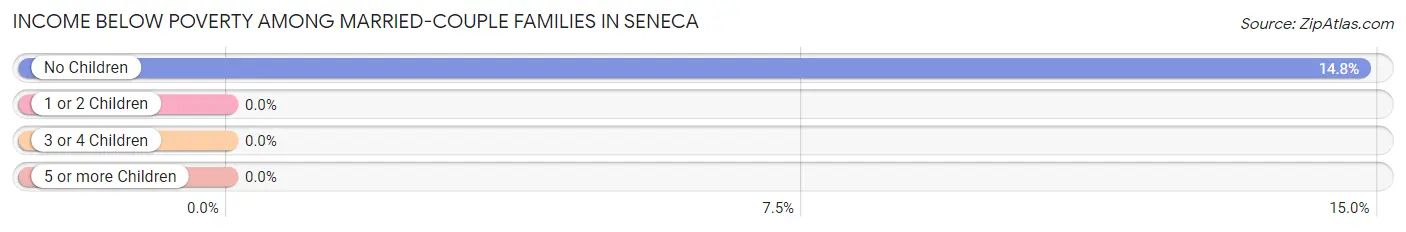
| Children | Above Poverty | Below Poverty |
| No Children | 121 (85.2%) | 21 (14.8%) |
| 1 or 2 Children | 69 (100.0%) | 0 (0.0%) |
| 3 or 4 Children | 26 (100.0%) | 0 (0.0%) |
| 5 or more Children | 0 (0.0%) | 0 (0.0%) |
| Total | 216 (91.1%) | 21 (8.9%) |
Income Below Poverty Among Single-Parent Households in Seneca
| Children | Single Father | Single Mother |
| No Children | 0 (0.0%) | 0 (0.0%) |
| 1 or 2 Children | 0 (0.0%) | 0 (0.0%) |
| 3 or 4 Children | 0 (0.0%) | 0 (0.0%) |
| 5 or more Children | 0 (0.0%) | 0 (0.0%) |
| Total | 0 (0.0%) | 0 (0.0%) |
Income Below Poverty Among Married-Couple vs Single-Parent Households in Seneca
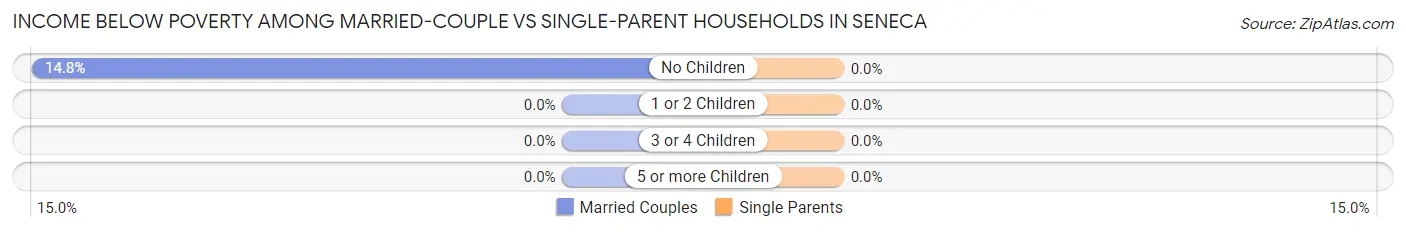
| Children | Married-Couple Families | Single-Parent Households |
| No Children | 21 (14.8%) | 0 (0.0%) |
| 1 or 2 Children | 0 (0.0%) | 0 (0.0%) |
| 3 or 4 Children | 0 (0.0%) | 0 (0.0%) |
| 5 or more Children | 0 (0.0%) | 0 (0.0%) |
| Total | 21 (8.9%) | 0 (0.0%) |
Race in Seneca
The most populous races in Seneca are White / Caucasian (886 | 97.3%), Two or more Races (13 | 1.4%), and Asian (12 | 1.3%).
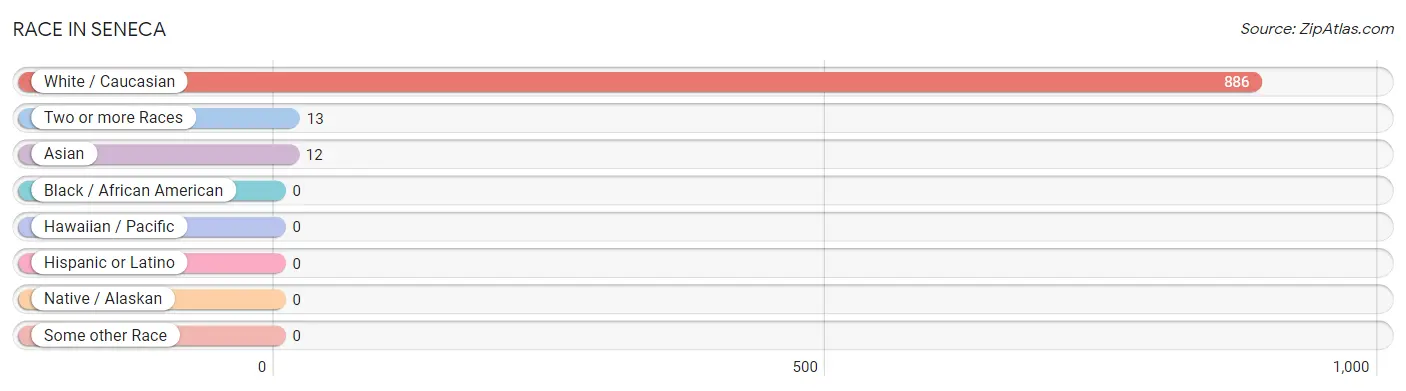
| Race | # Population | % Population |
| Asian | 12 | 1.3% |
| Black / African American | 0 | 0.0% |
| Hawaiian / Pacific | 0 | 0.0% |
| Hispanic or Latino | 0 | 0.0% |
| Native / Alaskan | 0 | 0.0% |
| White / Caucasian | 886 | 97.3% |
| Two or more Races | 13 | 1.4% |
| Some other Race | 0 | 0.0% |
| Total | 911 | 100.0% |
Ancestry in Seneca
The most populous ancestries reported in Seneca are German (342 | 37.5%), Italian (136 | 14.9%), English (127 | 13.9%), American (102 | 11.2%), and Irish (62 | 6.8%), together accounting for 84.4% of all Seneca residents.
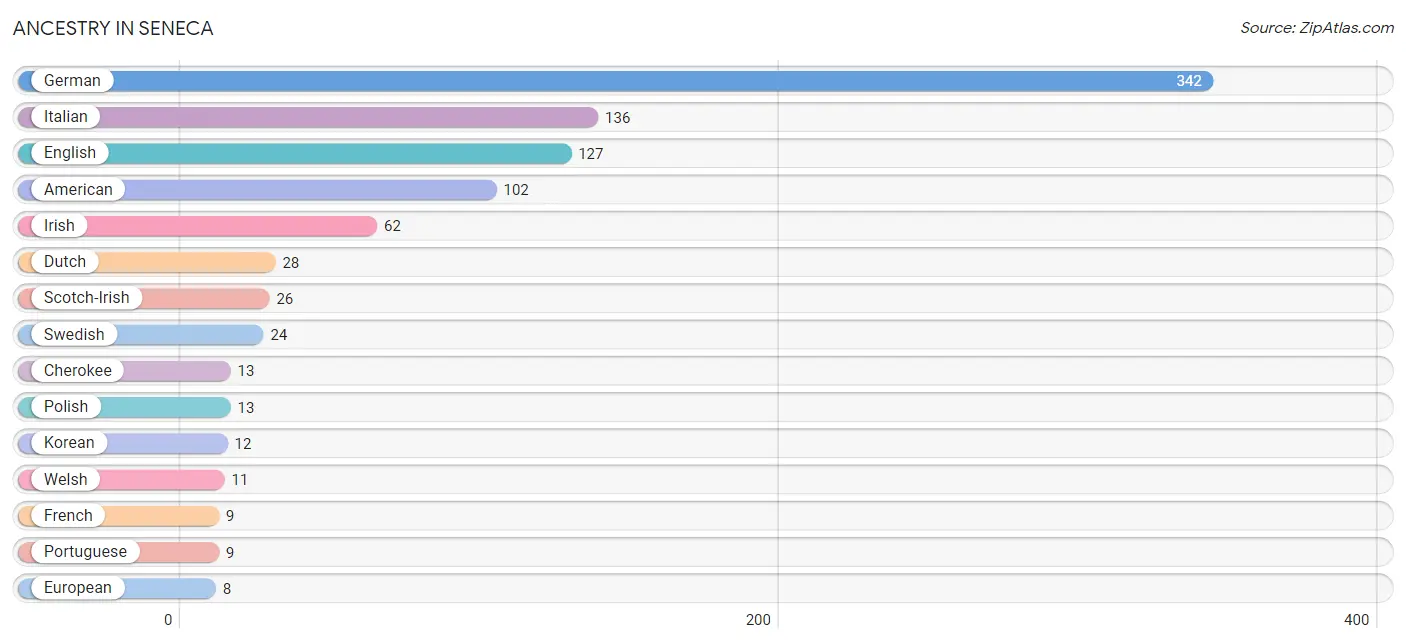
| Ancestry | # Population | % Population |
| American | 102 | 11.2% |
| Cherokee | 13 | 1.4% |
| Dutch | 28 | 3.1% |
| English | 127 | 13.9% |
| European | 8 | 0.9% |
| French | 9 | 1.0% |
| German | 342 | 37.5% |
| Irish | 62 | 6.8% |
| Italian | 136 | 14.9% |
| Korean | 12 | 1.3% |
| Pennsylvania German | 7 | 0.8% |
| Polish | 13 | 1.4% |
| Portuguese | 9 | 1.0% |
| Scotch-Irish | 26 | 2.9% |
| Slovene | 5 | 0.5% |
| Swedish | 24 | 2.6% |
| Welsh | 11 | 1.2% | View All 17 Rows |
Immigrants in Seneca
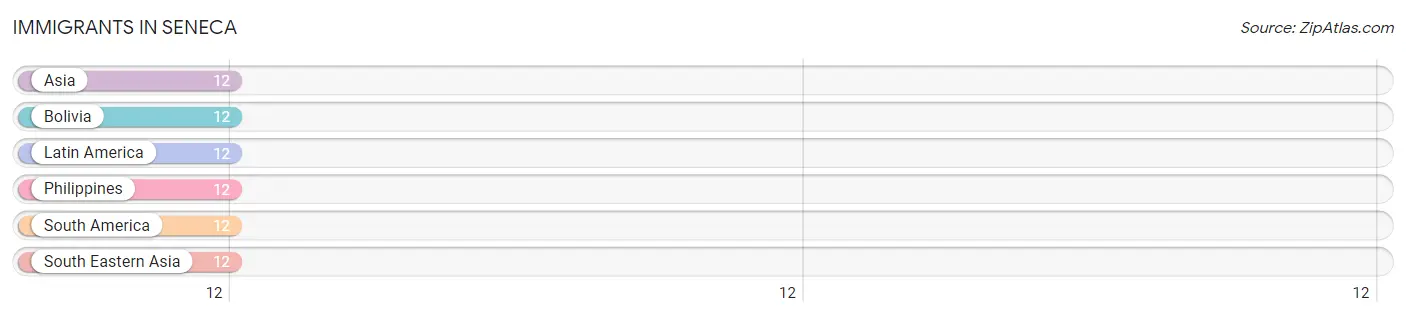
The most numerous immigrant groups reported in Seneca came from Asia (12 | 1.3%), Bolivia (12 | 1.3%), Latin America (12 | 1.3%), Philippines (12 | 1.3%), and South America (12 | 1.3%), together accounting for 6.6% of all Seneca residents.
| Immigration Origin | # Population | % Population |
| Asia | 12 | 1.3% |
| Bolivia | 12 | 1.3% |
| Latin America | 12 | 1.3% |
| Philippines | 12 | 1.3% |
| South America | 12 | 1.3% |
| South Eastern Asia | 12 | 1.3% | View All 6 Rows |
Sex and Age in Seneca
Sex and Age in Seneca
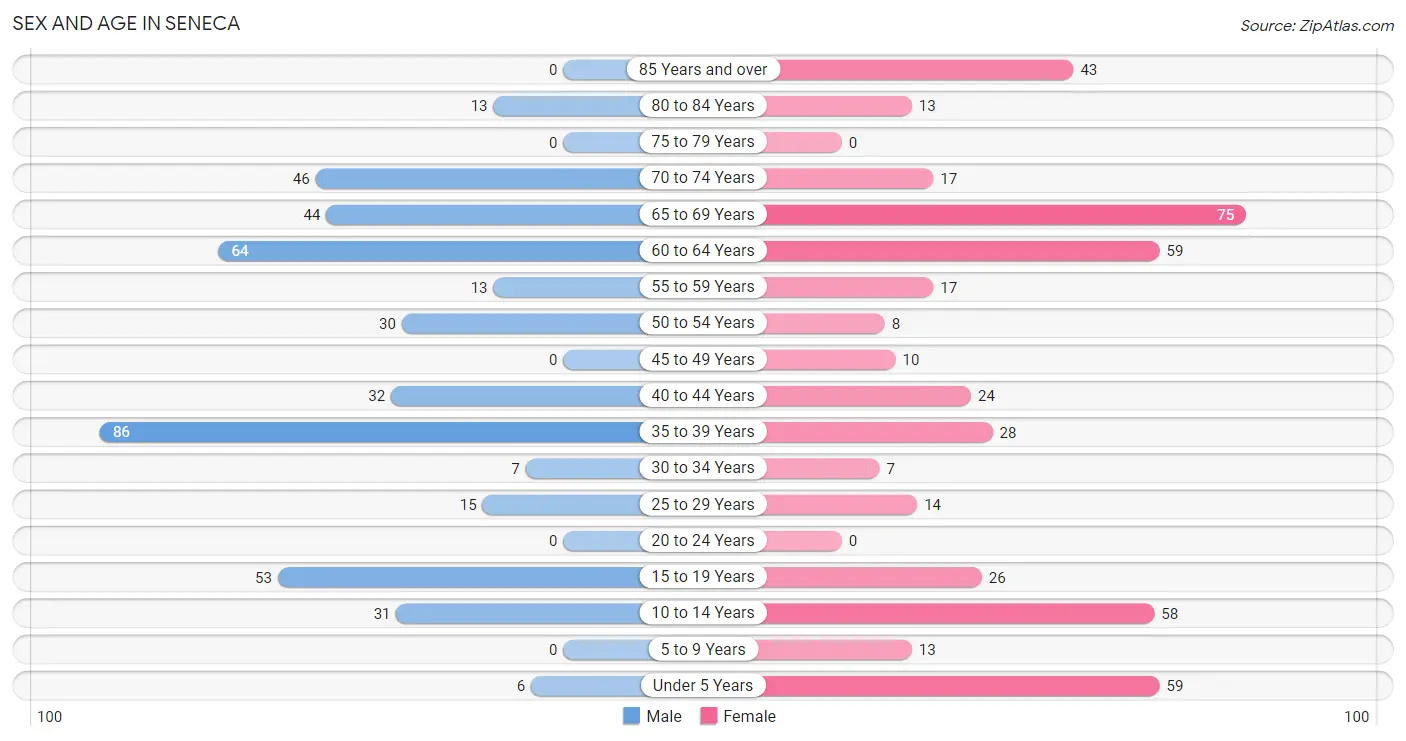
The most populous age groups in Seneca are 35 to 39 Years (86 | 19.6%) for men and 65 to 69 Years (75 | 15.9%) for women.
| Age Bracket | Male | Female |
| Under 5 Years | 6 (1.4%) | 59 (12.5%) |
| 5 to 9 Years | 0 (0.0%) | 13 (2.8%) |
| 10 to 14 Years | 31 (7.0%) | 58 (12.3%) |
| 15 to 19 Years | 53 (12.0%) | 26 (5.5%) |
| 20 to 24 Years | 0 (0.0%) | 0 (0.0%) |
| 25 to 29 Years | 15 (3.4%) | 14 (3.0%) |
| 30 to 34 Years | 7 (1.6%) | 7 (1.5%) |
| 35 to 39 Years | 86 (19.6%) | 28 (5.9%) |
| 40 to 44 Years | 32 (7.3%) | 24 (5.1%) |
| 45 to 49 Years | 0 (0.0%) | 10 (2.1%) |
| 50 to 54 Years | 30 (6.8%) | 8 (1.7%) |
| 55 to 59 Years | 13 (2.9%) | 17 (3.6%) |
| 60 to 64 Years | 64 (14.5%) | 59 (12.5%) |
| 65 to 69 Years | 44 (10.0%) | 75 (15.9%) |
| 70 to 74 Years | 46 (10.4%) | 17 (3.6%) |
| 75 to 79 Years | 0 (0.0%) | 0 (0.0%) |
| 80 to 84 Years | 13 (2.9%) | 13 (2.8%) |
| 85 Years and over | 0 (0.0%) | 43 (9.1%) |
| Total | 440 (100.0%) | 471 (100.0%) |
Families and Households in Seneca
Median Family Size in Seneca
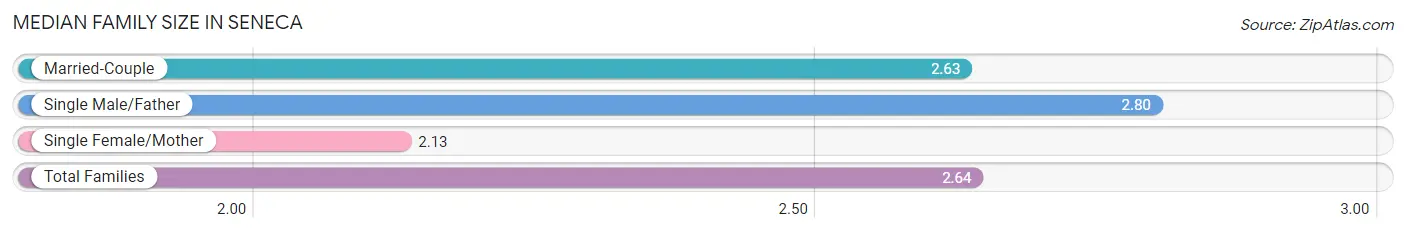
The median family size in Seneca is 2.64 persons per family, with single male/father families (50 | 17.0%) accounting for the largest median family size of 2.8 persons per family. On the other hand, single female/mother families (8 | 2.7%) represent the smallest median family size with 2.13 persons per family.
| Family Type | # Families | Family Size |
| Married-Couple | 237 (80.3%) | 2.63 |
| Single Male/Father | 50 (17.0%) | 2.80 |
| Single Female/Mother | 8 (2.7%) | 2.13 |
| Total Families | 295 (100.0%) | 2.64 |
Median Household Size in Seneca
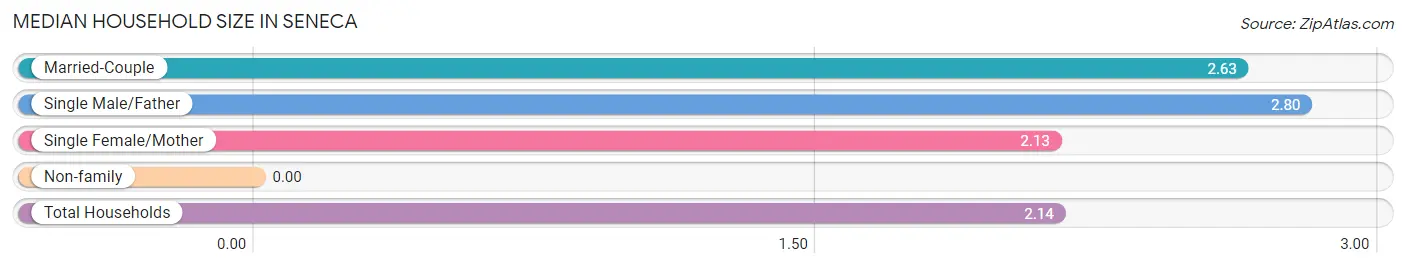
| Household Type | # Households | Household Size |
| Married-Couple | 237 (55.6%) | 2.63 |
| Single Male/Father | 50 (11.7%) | 2.80 |
| Single Female/Mother | 8 (1.9%) | 2.13 |
| Non-family | 131 (30.7%) | - |
| Total Households | 426 (100.0%) | 2.14 |
Household Size by Marriage Status in Seneca
Out of a total of 426 households in Seneca, 295 (69.3%) are family households, while 131 (30.7%) are nonfamily households. The most numerous type of family households are 2-person households, comprising 179, and the most common type of nonfamily households are 1-person households, comprising 131.
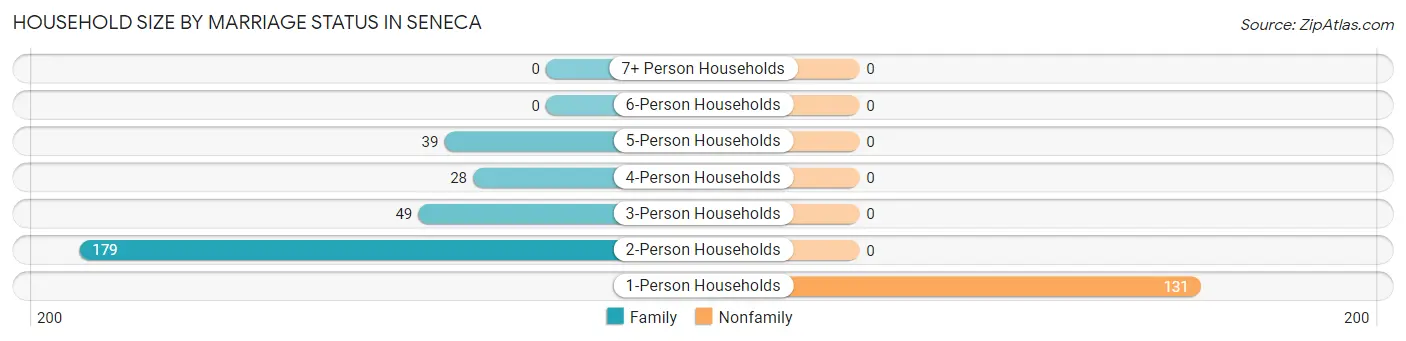
| Household Size | Family Households | Nonfamily Households |
| 1-Person Households | - | 131 (30.7%) |
| 2-Person Households | 179 (42.0%) | 0 (0.0%) |
| 3-Person Households | 49 (11.5%) | 0 (0.0%) |
| 4-Person Households | 28 (6.6%) | 0 (0.0%) |
| 5-Person Households | 39 (9.1%) | 0 (0.0%) |
| 6-Person Households | 0 (0.0%) | 0 (0.0%) |
| 7+ Person Households | 0 (0.0%) | 0 (0.0%) |
| Total | 295 (69.3%) | 131 (30.7%) |
Female Fertility in Seneca
Fertility by Age in Seneca
Average fertility rate in Seneca is 128.0 births per 1,000 women. Women in the age bracket of 20 to 34 years have the highest fertility rate with 667.0 births per 1,000 women. Women in the age bracket of 20 to 34 years acount for 100.0% of all women with births.
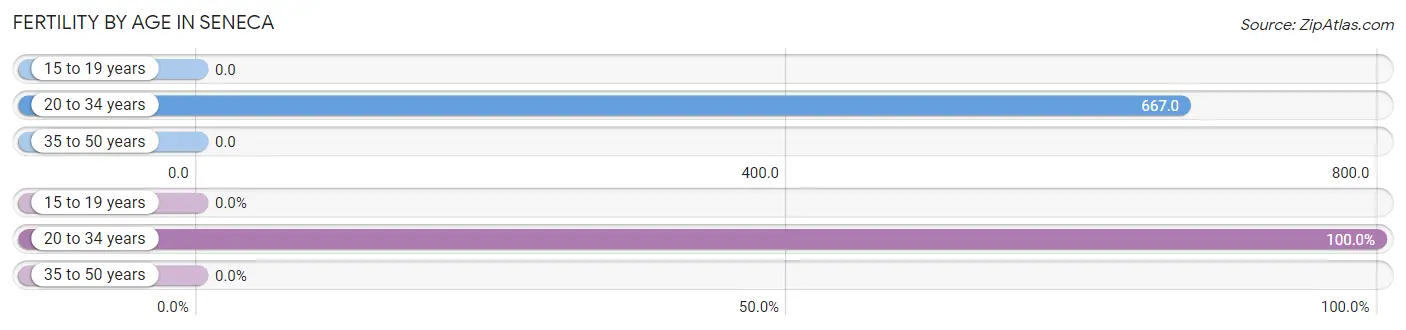
| Age Bracket | Women with Births | Births / 1,000 Women |
| 15 to 19 years | 0 (0.0%) | 0.0 |
| 20 to 34 years | 14 (100.0%) | 667.0 |
| 35 to 50 years | 0 (0.0%) | 0.0 |
| Total | 14 (100.0%) | 128.0 |
Fertility by Age by Marriage Status in Seneca
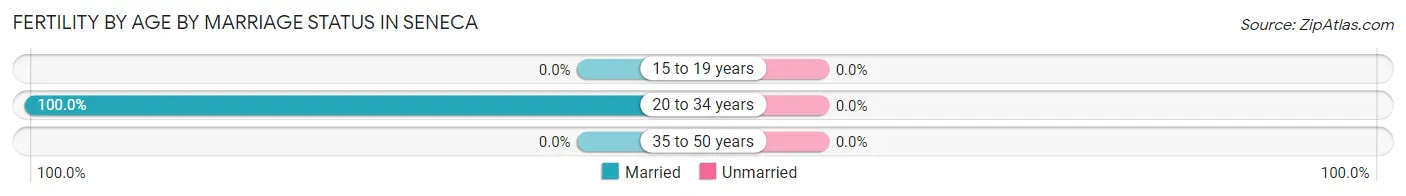
| Age Bracket | Married | Unmarried |
| 15 to 19 years | 0 (0.0%) | 0 (0.0%) |
| 20 to 34 years | 14 (100.0%) | 0 (0.0%) |
| 35 to 50 years | 0 (0.0%) | 0 (0.0%) |
| Total | 14 (100.0%) | 0 (0.0%) |
Fertility by Education in Seneca
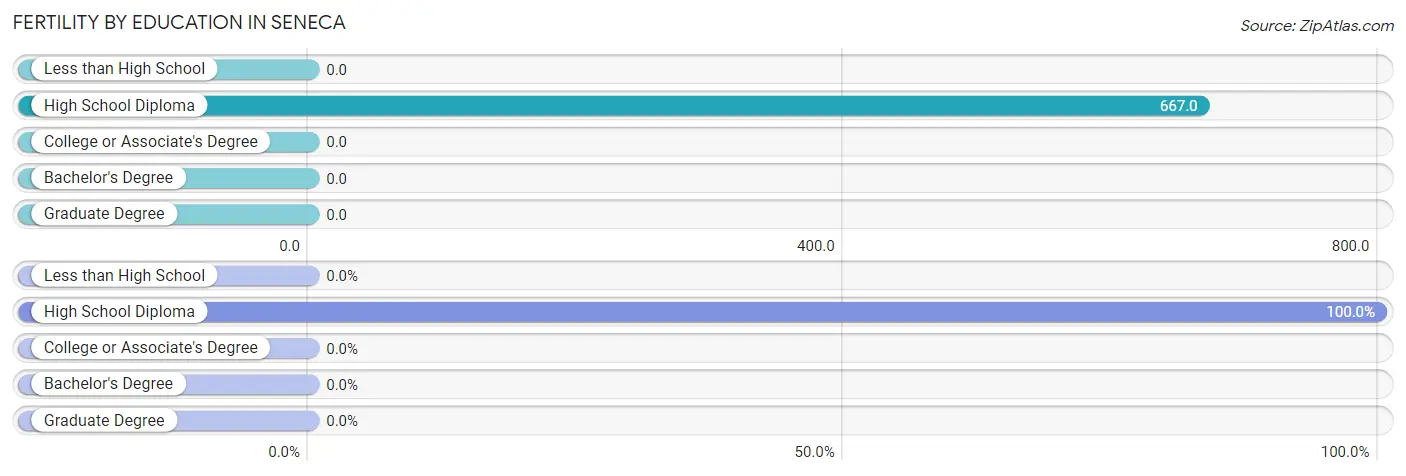
| Educational Attainment | Women with Births | Births / 1,000 Women |
| Less than High School | 0 (0.0%) | 0.0 |
| High School Diploma | 14 (100.0%) | 667.0 |
| College or Associate's Degree | 0 (0.0%) | 0.0 |
| Bachelor's Degree | 0 (0.0%) | 0.0 |
| Graduate Degree | 0 (0.0%) | 0.0 |
| Total | 14 (100.0%) | 128.0 |
Fertility by Education by Marriage Status in Seneca
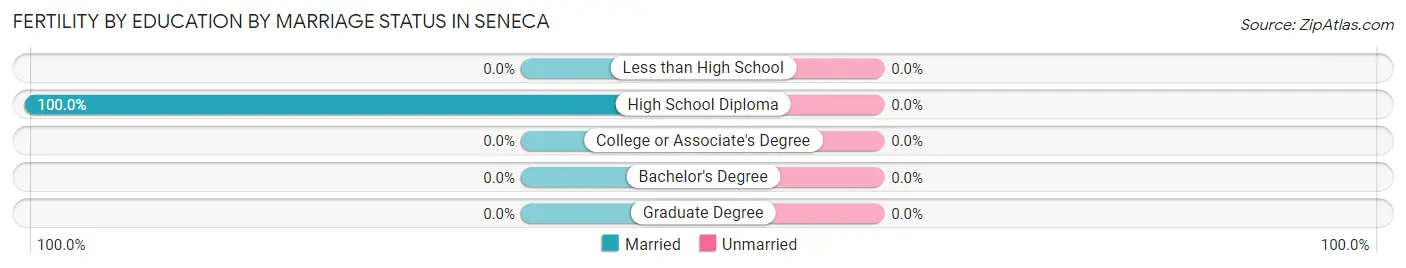
| Educational Attainment | Married | Unmarried |
| Less than High School | 0 (0.0%) | 0 (0.0%) |
| High School Diploma | 14 (100.0%) | 0 (0.0%) |
| College or Associate's Degree | 0 (0.0%) | 0 (0.0%) |
| Bachelor's Degree | 0 (0.0%) | 0 (0.0%) |
| Graduate Degree | 0 (0.0%) | 0 (0.0%) |
| Total | 14 (100.0%) | 0 (0.0%) |
Employment Characteristics in Seneca
Employment by Class of Employer in Seneca
Among the 346 employed individuals in Seneca, private company employees (215 | 62.1%), not-for-profit organizations (61 | 17.6%), and state government employees (29 | 8.4%) make up the most common classes of employment.
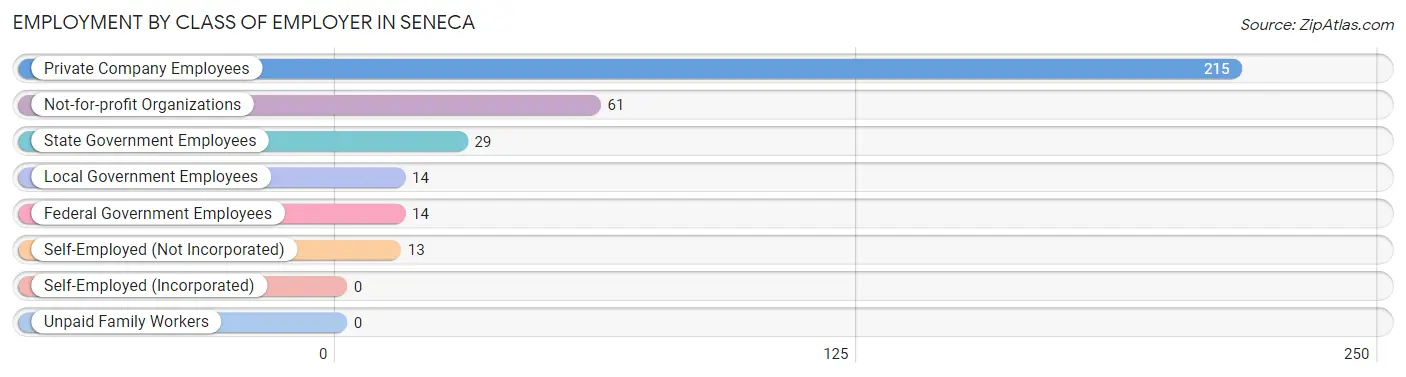
| Employer Class | # Employees | % Employees |
| Private Company Employees | 215 | 62.1% |
| Self-Employed (Incorporated) | 0 | 0.0% |
| Self-Employed (Not Incorporated) | 13 | 3.8% |
| Not-for-profit Organizations | 61 | 17.6% |
| Local Government Employees | 14 | 4.1% |
| State Government Employees | 29 | 8.4% |
| Federal Government Employees | 14 | 4.1% |
| Unpaid Family Workers | 0 | 0.0% |
| Total | 346 | 100.0% |
Employment Status by Age in Seneca
According to the labor force statistics for Seneca, out of the total population over 16 years of age (709), 52.8% or 374 individuals are in the labor force, with 4.3% or 16 of them unemployed. The age group with the highest labor force participation rate is 25 to 29 years, with 100.0% or 29 individuals in the labor force. Within the labor force, the 60 to 64 years age range has the highest percentage of unemployed individuals, with 25.4% or 16 of them being unemployed.
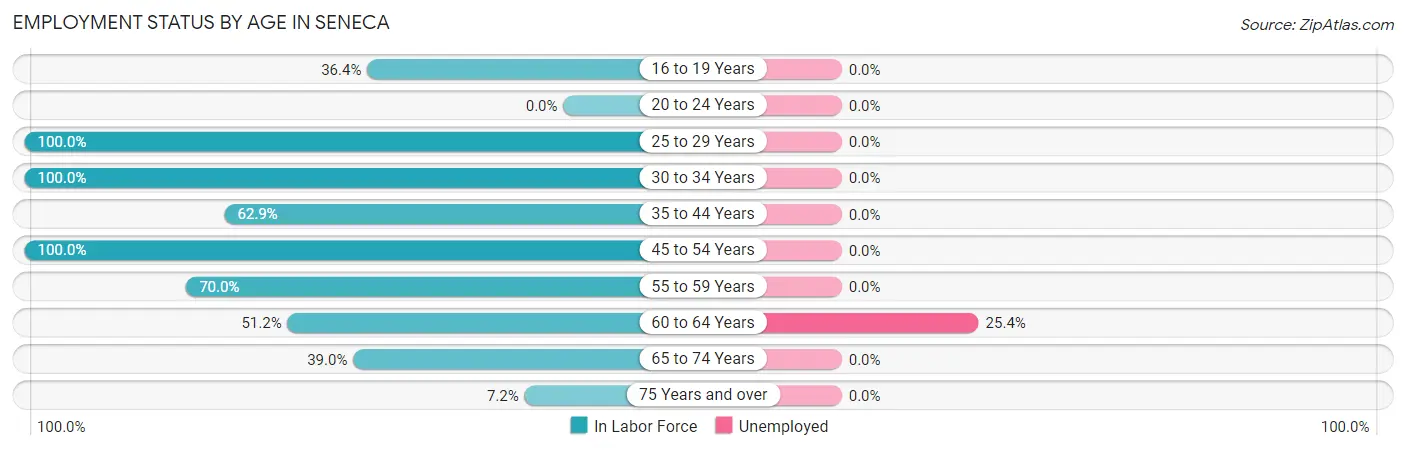
| Age Bracket | In Labor Force | Unemployed |
| 16 to 19 Years | 16 (36.4%) | 0 (0.0%) |
| 20 to 24 Years | 0 (0.0%) | 0 (0.0%) |
| 25 to 29 Years | 29 (100.0%) | 0 (0.0%) |
| 30 to 34 Years | 14 (100.0%) | 0 (0.0%) |
| 35 to 44 Years | 107 (62.9%) | 0 (0.0%) |
| 45 to 54 Years | 48 (100.0%) | 0 (0.0%) |
| 55 to 59 Years | 21 (70.0%) | 0 (0.0%) |
| 60 to 64 Years | 63 (51.2%) | 16 (25.4%) |
| 65 to 74 Years | 71 (39.0%) | 0 (0.0%) |
| 75 Years and over | 5 (7.2%) | 0 (0.0%) |
| Total | 374 (52.8%) | 16 (4.3%) |
Employment Status by Educational Attainment in Seneca
According to labor force statistics for Seneca, 68.1% of individuals (282) out of the total population between 25 and 64 years of age (414) are in the labor force, with 5.7% or 16 of them being unemployed. The group with the highest labor force participation rate are those with the educational attainment of bachelor's degree or higher, with 100.0% or 74 individuals in the labor force. Within the labor force, individuals with college / associate degree education have the highest percentage of unemployment, with 13.3% or 16 of them being unemployed.
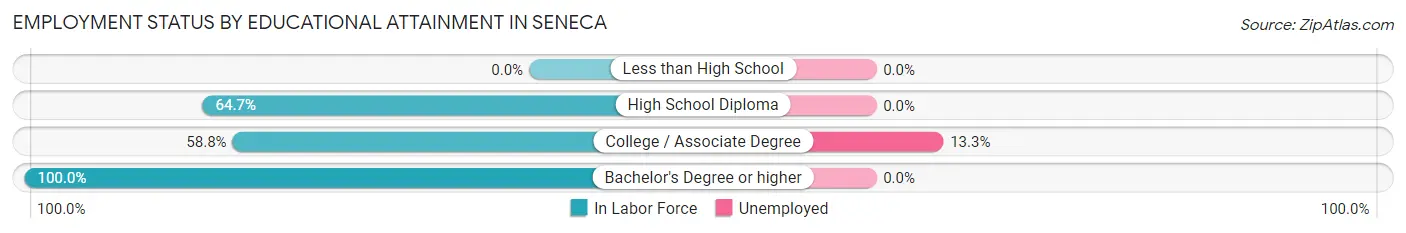
| Educational Attainment | In Labor Force | Unemployed |
| Less than High School | 0 (0.0%) | 0 (0.0%) |
| High School Diploma | 88 (64.7%) | 0 (0.0%) |
| College / Associate Degree | 120 (58.8%) | 27 (13.3%) |
| Bachelor's Degree or higher | 74 (100.0%) | 0 (0.0%) |
| Total | 282 (68.1%) | 24 (5.7%) |
Employment Occupations by Sex in Seneca
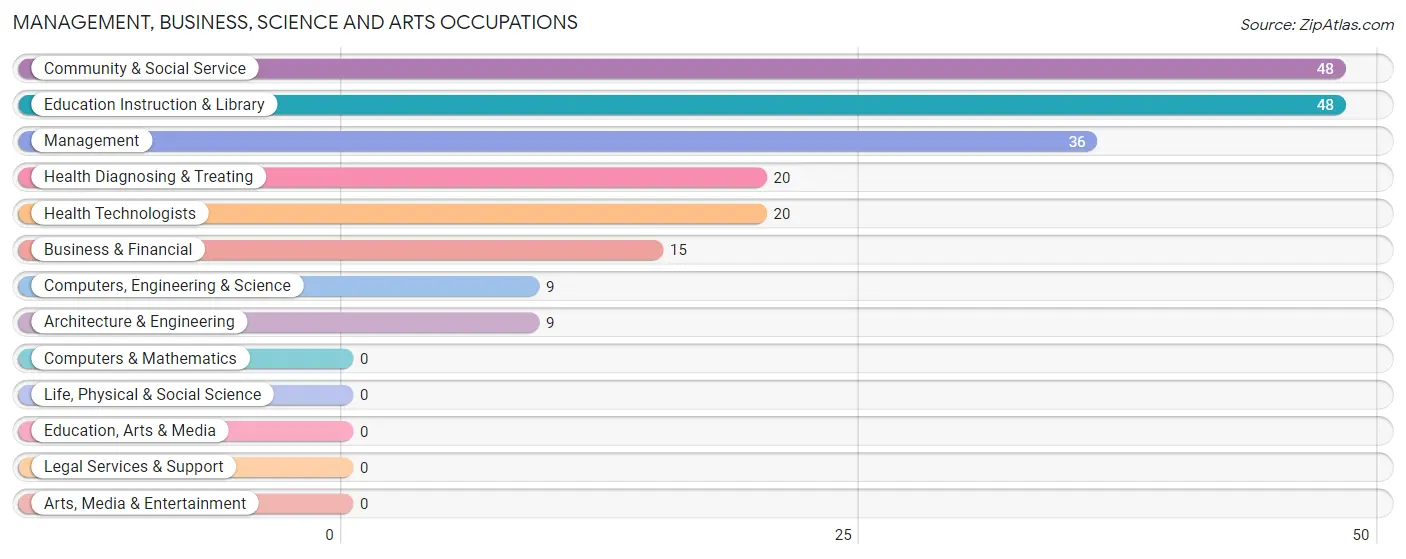
Management, Business, Science and Arts Occupations
The most common Management, Business, Science and Arts occupations in Seneca are Community & Social Service (48 | 13.4%), Education Instruction & Library (48 | 13.4%), Management (36 | 10.1%), Health Diagnosing & Treating (20 | 5.6%), and Health Technologists (20 | 5.6%).
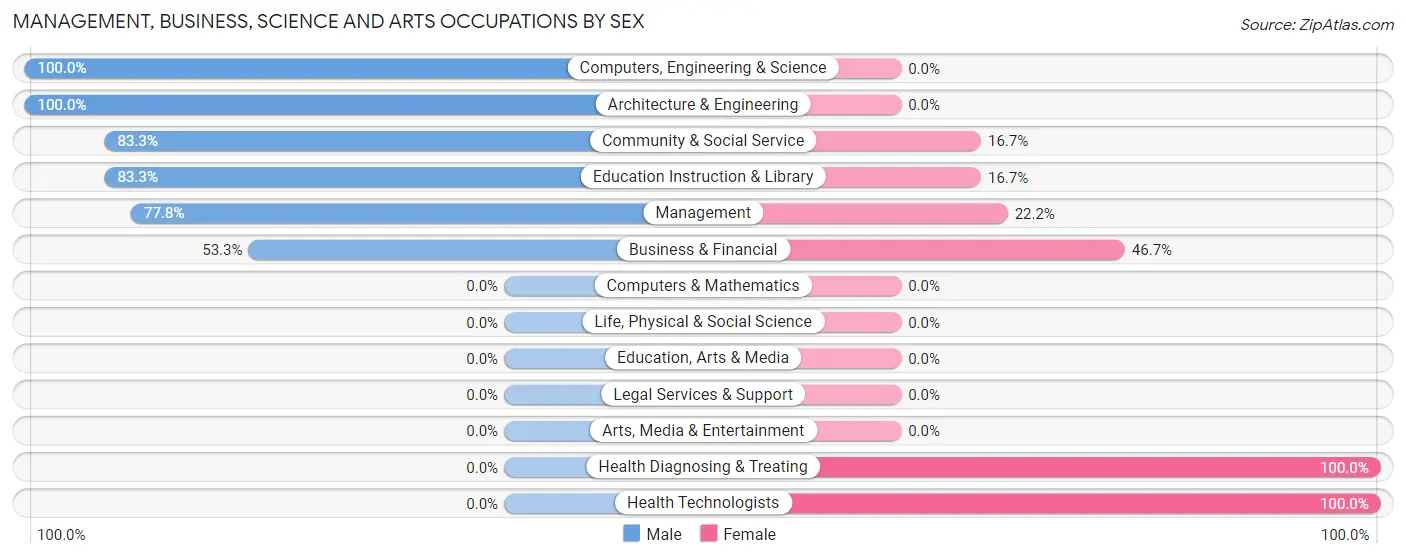
Management, Business, Science and Arts Occupations by Sex
Within the Management, Business, Science and Arts occupations in Seneca, the most male-oriented occupations are Computers, Engineering & Science (100.0%), Architecture & Engineering (100.0%), and Community & Social Service (83.3%), while the most female-oriented occupations are Health Diagnosing & Treating (100.0%), Health Technologists (100.0%), and Business & Financial (46.7%).
| Occupation | Male | Female |
| Management | 28 (77.8%) | 8 (22.2%) |
| Business & Financial | 8 (53.3%) | 7 (46.7%) |
| Computers, Engineering & Science | 9 (100.0%) | 0 (0.0%) |
| Computers & Mathematics | 0 (0.0%) | 0 (0.0%) |
| Architecture & Engineering | 9 (100.0%) | 0 (0.0%) |
| Life, Physical & Social Science | 0 (0.0%) | 0 (0.0%) |
| Community & Social Service | 40 (83.3%) | 8 (16.7%) |
| Education, Arts & Media | 0 (0.0%) | 0 (0.0%) |
| Legal Services & Support | 0 (0.0%) | 0 (0.0%) |
| Education Instruction & Library | 40 (83.3%) | 8 (16.7%) |
| Arts, Media & Entertainment | 0 (0.0%) | 0 (0.0%) |
| Health Diagnosing & Treating | 0 (0.0%) | 20 (100.0%) |
| Health Technologists | 0 (0.0%) | 20 (100.0%) |
| Total (Category) | 85 (66.4%) | 43 (33.6%) |
| Total (Overall) | 233 (65.1%) | 125 (34.9%) |
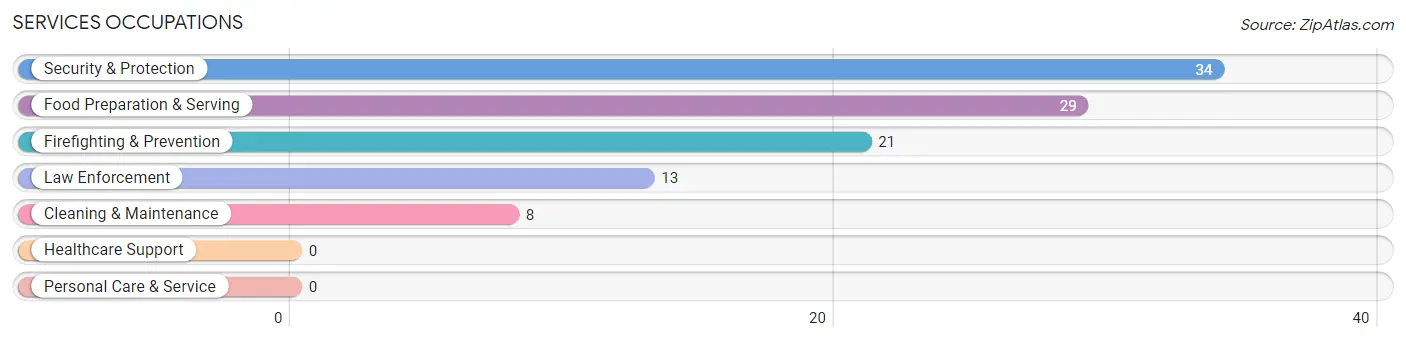
Services Occupations
The most common Services occupations in Seneca are Security & Protection (34 | 9.5%), Food Preparation & Serving (29 | 8.1%), Firefighting & Prevention (21 | 5.9%), Law Enforcement (13 | 3.6%), and Cleaning & Maintenance (8 | 2.2%).
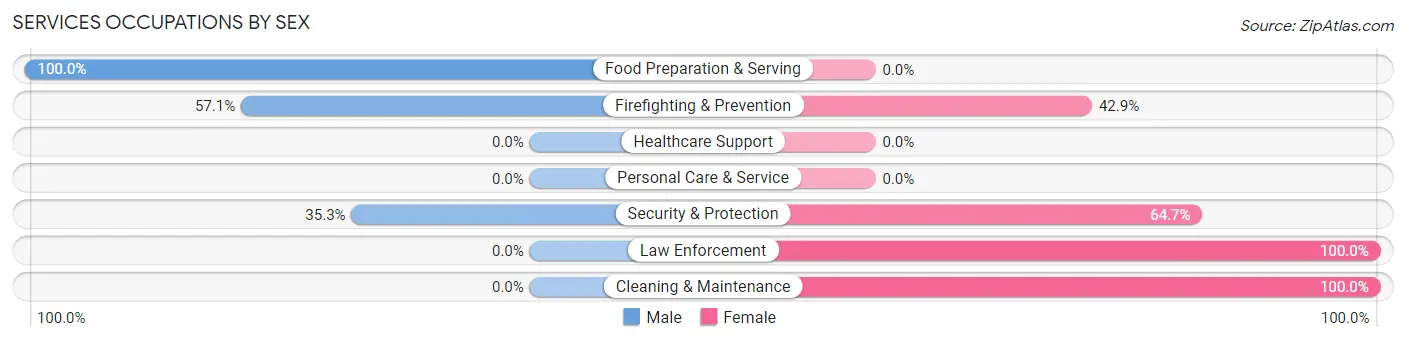
Services Occupations by Sex
Within the Services occupations in Seneca, the most male-oriented occupations are Food Preparation & Serving (100.0%), Firefighting & Prevention (57.1%), and Security & Protection (35.3%), while the most female-oriented occupations are Law Enforcement (100.0%), Cleaning & Maintenance (100.0%), and Security & Protection (64.7%).
| Occupation | Male | Female |
| Healthcare Support | 0 (0.0%) | 0 (0.0%) |
| Security & Protection | 12 (35.3%) | 22 (64.7%) |
| Firefighting & Prevention | 12 (57.1%) | 9 (42.9%) |
| Law Enforcement | 0 (0.0%) | 13 (100.0%) |
| Food Preparation & Serving | 29 (100.0%) | 0 (0.0%) |
| Cleaning & Maintenance | 0 (0.0%) | 8 (100.0%) |
| Personal Care & Service | 0 (0.0%) | 0 (0.0%) |
| Total (Category) | 41 (57.8%) | 30 (42.2%) |
| Total (Overall) | 233 (65.1%) | 125 (34.9%) |
Sales and Office Occupations
The most common Sales and Office occupations in Seneca are Office & Administration (52 | 14.5%), and Sales & Related (9 | 2.5%).
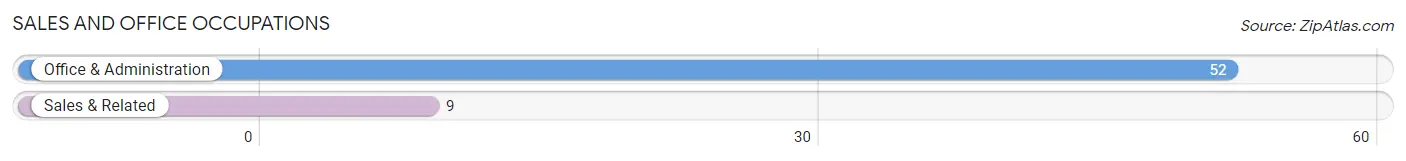
Sales and Office Occupations by Sex
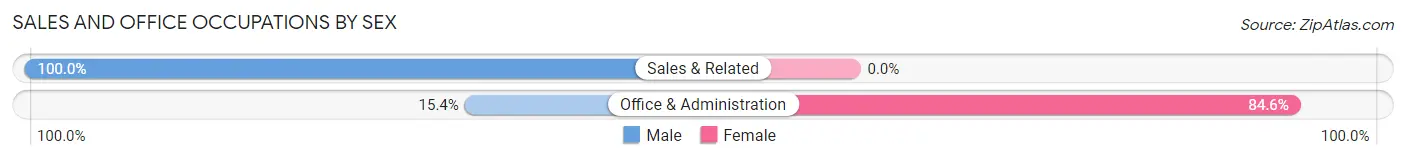
| Occupation | Male | Female |
| Sales & Related | 9 (100.0%) | 0 (0.0%) |
| Office & Administration | 8 (15.4%) | 44 (84.6%) |
| Total (Category) | 17 (27.9%) | 44 (72.1%) |
| Total (Overall) | 233 (65.1%) | 125 (34.9%) |
Natural Resources, Construction and Maintenance Occupations
The most common Natural Resources, Construction and Maintenance occupations in Seneca are , and Installation, Maintenance & Repair (7 | 2.0%).
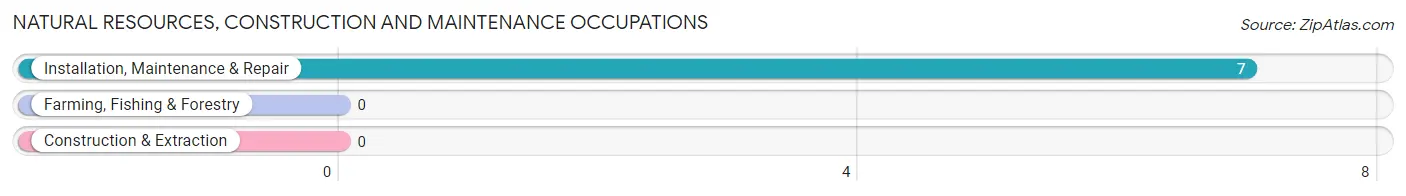
Natural Resources, Construction and Maintenance Occupations by Sex
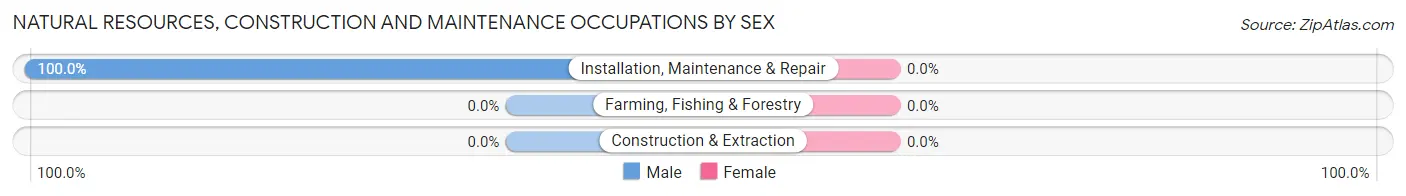
| Occupation | Male | Female |
| Farming, Fishing & Forestry | 0 (0.0%) | 0 (0.0%) |
| Construction & Extraction | 0 (0.0%) | 0 (0.0%) |
| Installation, Maintenance & Repair | 7 (100.0%) | 0 (0.0%) |
| Total (Category) | 7 (100.0%) | 0 (0.0%) |
| Total (Overall) | 233 (65.1%) | 125 (34.9%) |
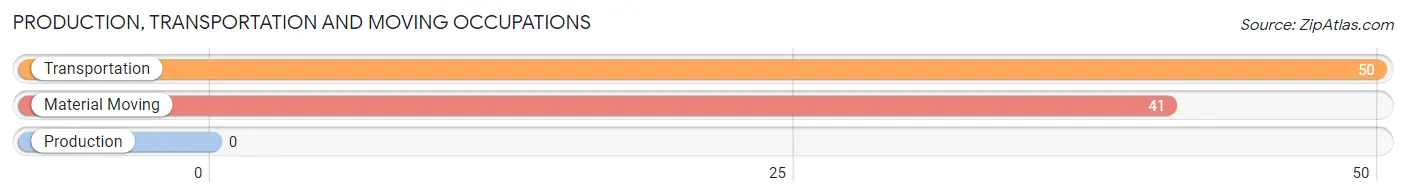
Production, Transportation and Moving Occupations
The most common Production, Transportation and Moving occupations in Seneca are Transportation (50 | 14.0%), and Material Moving (41 | 11.5%).
Production, Transportation and Moving Occupations by Sex
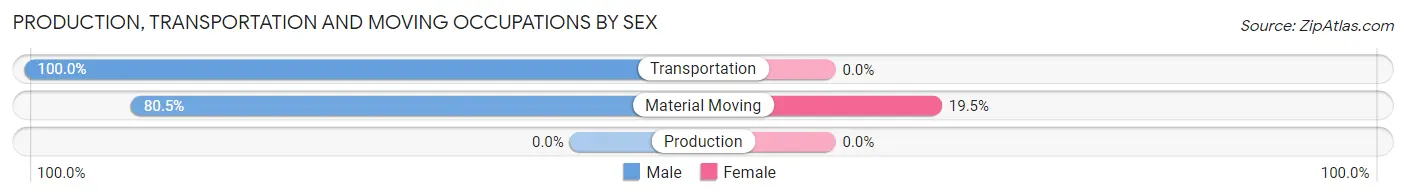
| Occupation | Male | Female |
| Production | 0 (0.0%) | 0 (0.0%) |
| Transportation | 50 (100.0%) | 0 (0.0%) |
| Material Moving | 33 (80.5%) | 8 (19.5%) |
| Total (Category) | 83 (91.2%) | 8 (8.8%) |
| Total (Overall) | 233 (65.1%) | 125 (34.9%) |
Employment Industries by Sex in Seneca
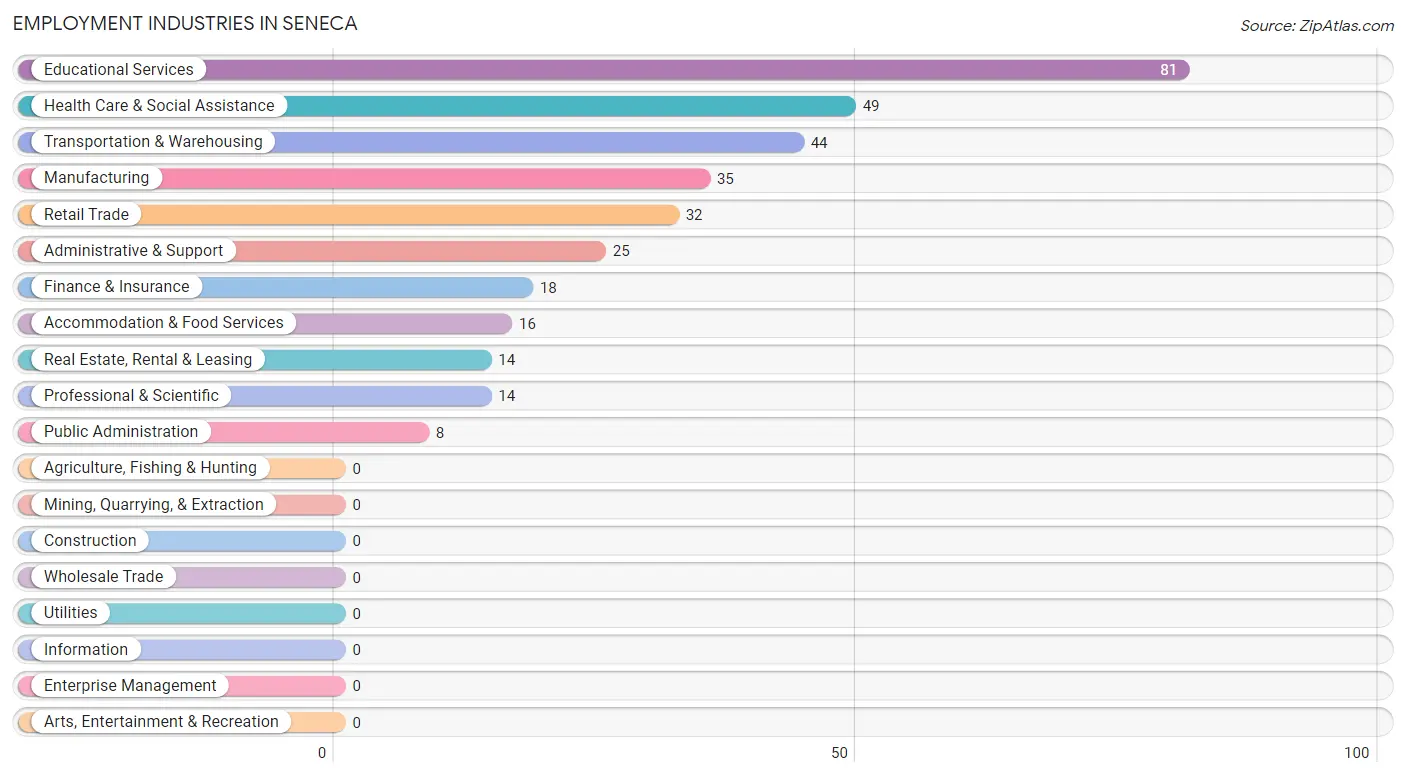
Employment Industries in Seneca
The major employment industries in Seneca include Educational Services (81 | 22.6%), Health Care & Social Assistance (49 | 13.7%), Transportation & Warehousing (44 | 12.3%), Manufacturing (35 | 9.8%), and Retail Trade (32 | 8.9%).
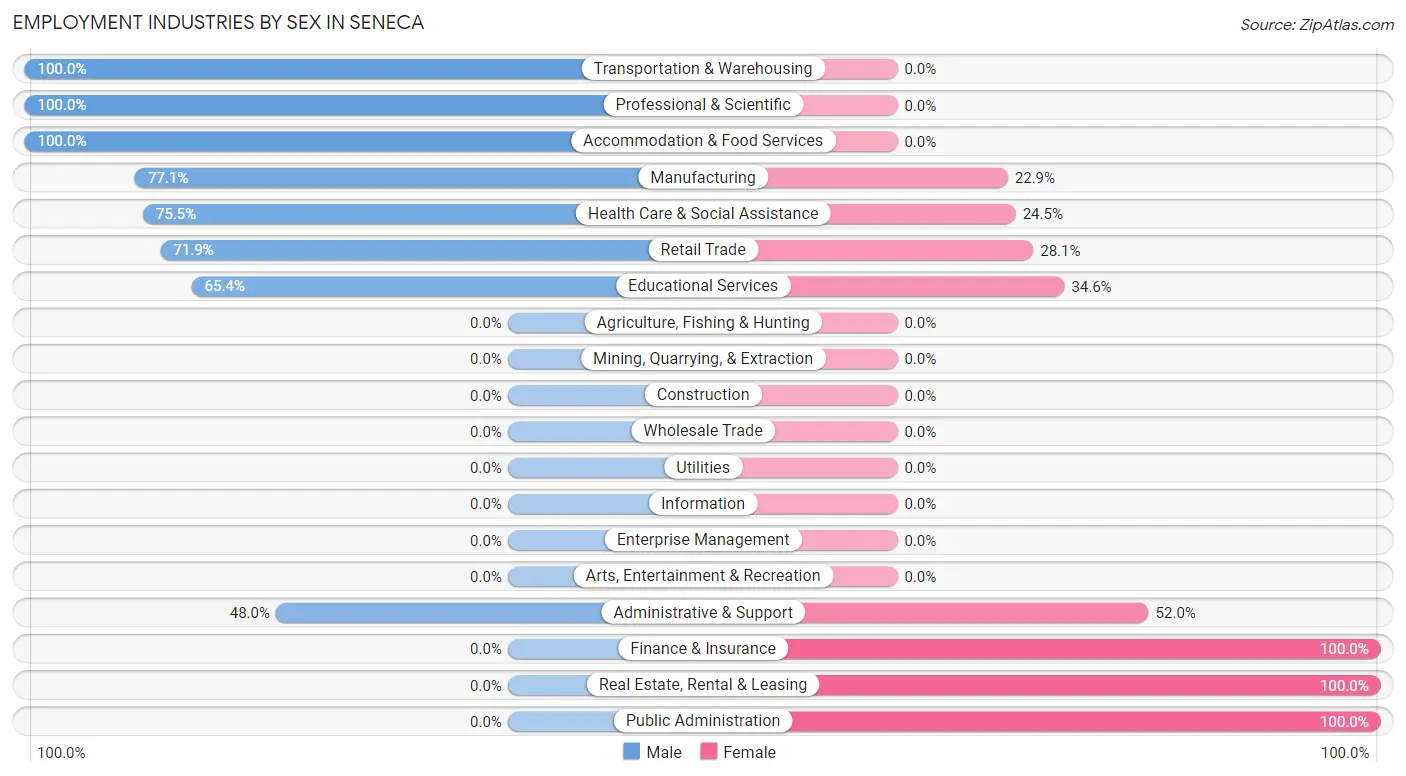
Employment Industries by Sex in Seneca
The Seneca industries that see more men than women are Transportation & Warehousing (100.0%), Professional & Scientific (100.0%), and Accommodation & Food Services (100.0%), whereas the industries that tend to have a higher number of women are Finance & Insurance (100.0%), Real Estate, Rental & Leasing (100.0%), and Public Administration (100.0%).
| Industry | Male | Female |
| Agriculture, Fishing & Hunting | 0 (0.0%) | 0 (0.0%) |
| Mining, Quarrying, & Extraction | 0 (0.0%) | 0 (0.0%) |
| Construction | 0 (0.0%) | 0 (0.0%) |
| Manufacturing | 27 (77.1%) | 8 (22.9%) |
| Wholesale Trade | 0 (0.0%) | 0 (0.0%) |
| Retail Trade | 23 (71.9%) | 9 (28.1%) |
| Transportation & Warehousing | 44 (100.0%) | 0 (0.0%) |
| Utilities | 0 (0.0%) | 0 (0.0%) |
| Information | 0 (0.0%) | 0 (0.0%) |
| Finance & Insurance | 0 (0.0%) | 18 (100.0%) |
| Real Estate, Rental & Leasing | 0 (0.0%) | 14 (100.0%) |
| Professional & Scientific | 14 (100.0%) | 0 (0.0%) |
| Enterprise Management | 0 (0.0%) | 0 (0.0%) |
| Administrative & Support | 12 (48.0%) | 13 (52.0%) |
| Educational Services | 53 (65.4%) | 28 (34.6%) |
| Health Care & Social Assistance | 37 (75.5%) | 12 (24.5%) |
| Arts, Entertainment & Recreation | 0 (0.0%) | 0 (0.0%) |
| Accommodation & Food Services | 16 (100.0%) | 0 (0.0%) |
| Public Administration | 0 (0.0%) | 8 (100.0%) |
| Total | 233 (65.1%) | 125 (34.9%) |
Education in Seneca
School Enrollment in Seneca
The most common levels of schooling among the 181 students in Seneca are high school (123 | 68.0%), middle school (45 | 24.9%), and elementary school (13 | 7.2%).
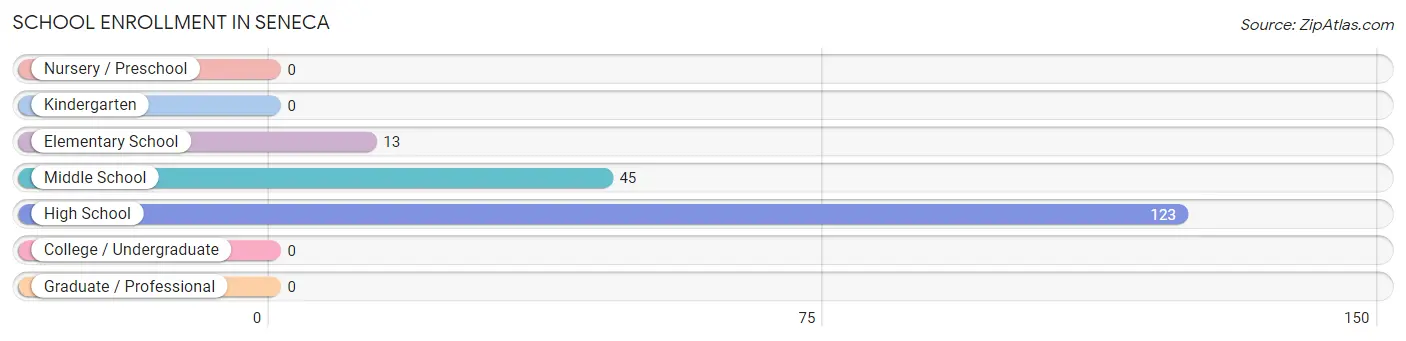
| School Level | # Students | % Students |
| Nursery / Preschool | 0 | 0.0% |
| Kindergarten | 0 | 0.0% |
| Elementary School | 13 | 7.2% |
| Middle School | 45 | 24.9% |
| High School | 123 | 68.0% |
| College / Undergraduate | 0 | 0.0% |
| Graduate / Professional | 0 | 0.0% |
| Total | 181 | 100.0% |
School Enrollment by Age by Funding Source in Seneca
Out of a total of 181 students who are enrolled in schools in Seneca, 66 (36.5%) attend a private institution, while the remaining 115 (63.5%) are enrolled in public schools. The age group of 15 to 17 year olds has the highest likelihood of being enrolled in private schools, with 40 (63.5% in the age bracket) enrolled. Conversely, the age group of 5 to 9 year old has the lowest likelihood of being enrolled in a private school, with 13 (100.0% in the age bracket) attending a public institution.
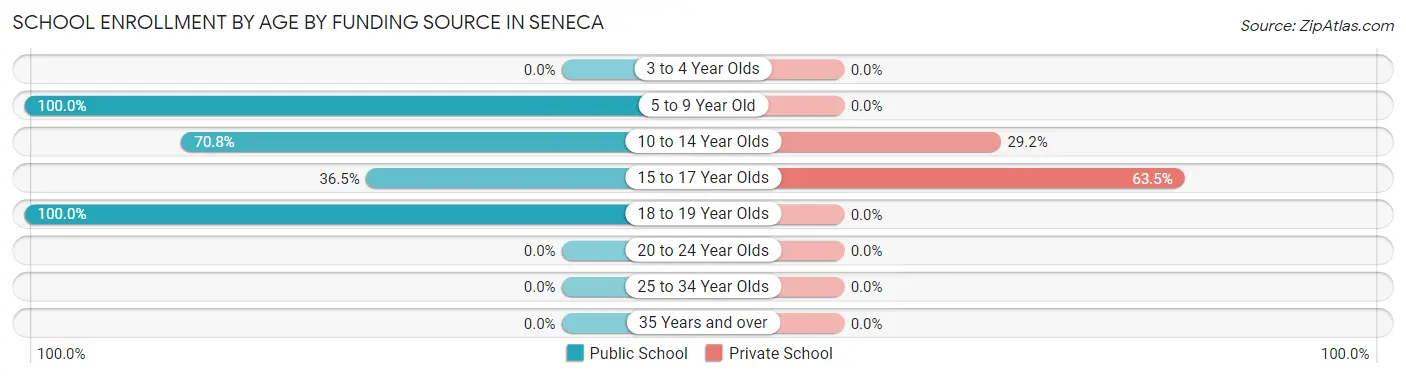
| Age Bracket | Public School | Private School |
| 3 to 4 Year Olds | 0 (0.0%) | 0 (0.0%) |
| 5 to 9 Year Old | 13 (100.0%) | 0 (0.0%) |
| 10 to 14 Year Olds | 63 (70.8%) | 26 (29.2%) |
| 15 to 17 Year Olds | 23 (36.5%) | 40 (63.5%) |
| 18 to 19 Year Olds | 16 (100.0%) | 0 (0.0%) |
| 20 to 24 Year Olds | 0 (0.0%) | 0 (0.0%) |
| 25 to 34 Year Olds | 0 (0.0%) | 0 (0.0%) |
| 35 Years and over | 0 (0.0%) | 0 (0.0%) |
| Total | 115 (63.5%) | 66 (36.5%) |
Educational Attainment by Field of Study in Seneca
Business (37 | 24.3%), liberal arts & history (26 | 17.1%), science & technology (21 | 13.8%), education (14 | 9.2%), and visual & performing arts (13 | 8.6%) are the most common fields of study among 152 individuals in Seneca who have obtained a bachelor's degree or higher.
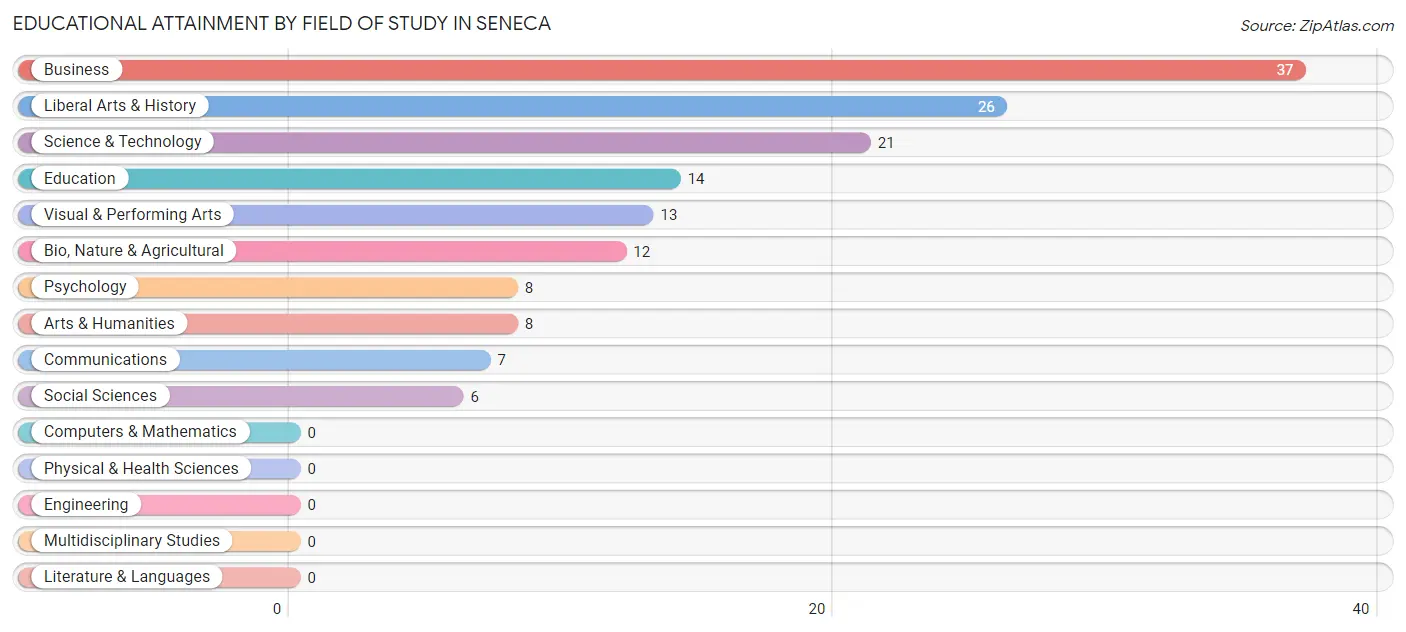
| Field of Study | # Graduates | % Graduates |
| Computers & Mathematics | 0 | 0.0% |
| Bio, Nature & Agricultural | 12 | 7.9% |
| Physical & Health Sciences | 0 | 0.0% |
| Psychology | 8 | 5.3% |
| Social Sciences | 6 | 4.0% |
| Engineering | 0 | 0.0% |
| Multidisciplinary Studies | 0 | 0.0% |
| Science & Technology | 21 | 13.8% |
| Business | 37 | 24.3% |
| Education | 14 | 9.2% |
| Literature & Languages | 0 | 0.0% |
| Liberal Arts & History | 26 | 17.1% |
| Visual & Performing Arts | 13 | 8.6% |
| Communications | 7 | 4.6% |
| Arts & Humanities | 8 | 5.3% |
| Total | 152 | 100.0% |
Transportation & Commute in Seneca
Vehicle Availability by Sex in Seneca
The most prevalent vehicle ownership categories in Seneca are males with 2 vehicles (87, accounting for 37.3%) and females with 2 vehicles (67, making up 77.0%).
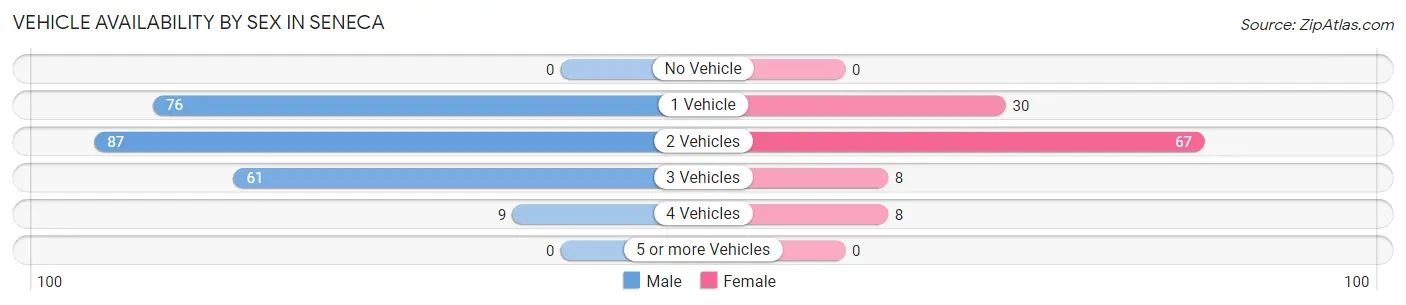
| Vehicles Available | Male | Female |
| No Vehicle | 0 (0.0%) | 0 (0.0%) |
| 1 Vehicle | 76 (32.6%) | 30 (26.6%) |
| 2 Vehicles | 87 (37.3%) | 67 (59.3%) |
| 3 Vehicles | 61 (26.2%) | 8 (7.1%) |
| 4 Vehicles | 9 (3.9%) | 8 (7.1%) |
| 5 or more Vehicles | 0 (0.0%) | 0 (0.0%) |
| Total | 233 (100.0%) | 113 (100.0%) |
Commute Time in Seneca
The most frequently occuring commute durations in Seneca are 15 to 19 minutes (82 commuters, 28.9%), 10 to 14 minutes (52 commuters, 18.3%), and 35 to 39 minutes (26 commuters, 9.1%).
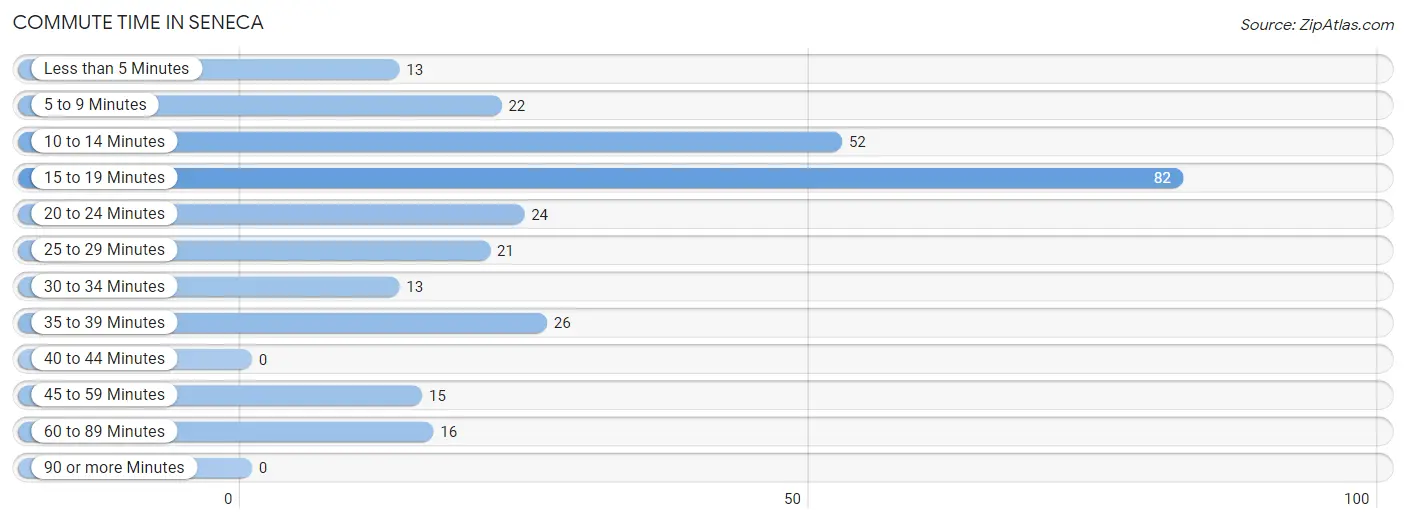
| Commute Time | # Commuters | % Commuters |
| Less than 5 Minutes | 13 | 4.6% |
| 5 to 9 Minutes | 22 | 7.7% |
| 10 to 14 Minutes | 52 | 18.3% |
| 15 to 19 Minutes | 82 | 28.9% |
| 20 to 24 Minutes | 24 | 8.5% |
| 25 to 29 Minutes | 21 | 7.4% |
| 30 to 34 Minutes | 13 | 4.6% |
| 35 to 39 Minutes | 26 | 9.1% |
| 40 to 44 Minutes | 0 | 0.0% |
| 45 to 59 Minutes | 15 | 5.3% |
| 60 to 89 Minutes | 16 | 5.6% |
| 90 or more Minutes | 0 | 0.0% |
Commute Time by Sex in Seneca
The most common commute times in Seneca are 15 to 19 minutes (63 commuters, 30.6%) for males and 20 to 24 minutes (24 commuters, 30.8%) for females.
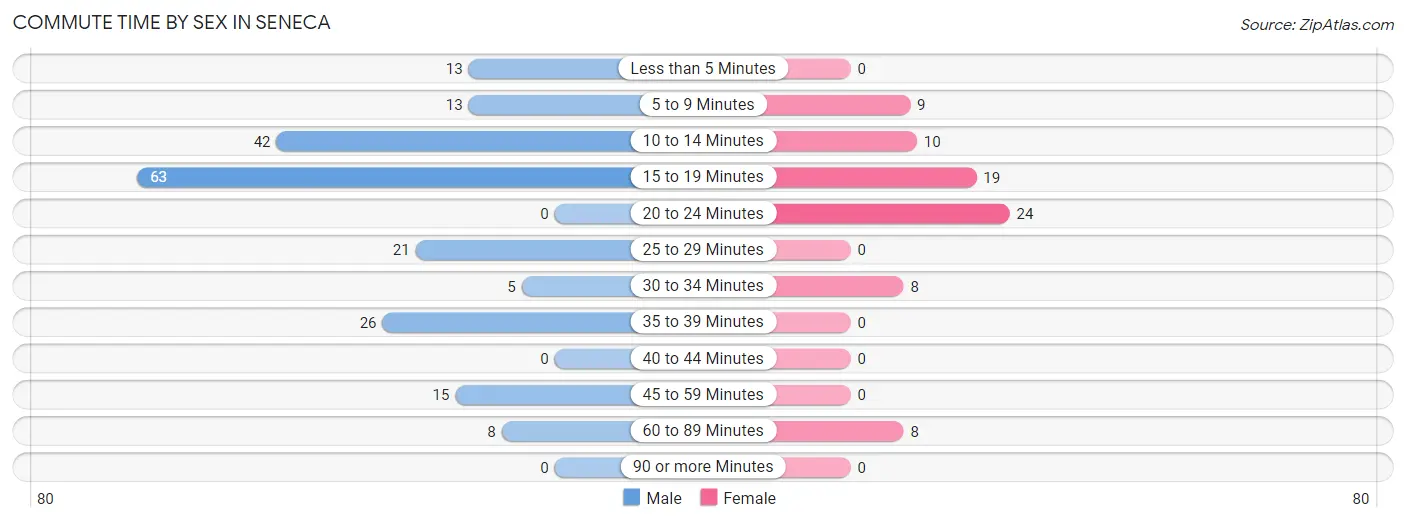
| Commute Time | Male | Female |
| Less than 5 Minutes | 13 (6.3%) | 0 (0.0%) |
| 5 to 9 Minutes | 13 (6.3%) | 9 (11.5%) |
| 10 to 14 Minutes | 42 (20.4%) | 10 (12.8%) |
| 15 to 19 Minutes | 63 (30.6%) | 19 (24.4%) |
| 20 to 24 Minutes | 0 (0.0%) | 24 (30.8%) |
| 25 to 29 Minutes | 21 (10.2%) | 0 (0.0%) |
| 30 to 34 Minutes | 5 (2.4%) | 8 (10.3%) |
| 35 to 39 Minutes | 26 (12.6%) | 0 (0.0%) |
| 40 to 44 Minutes | 0 (0.0%) | 0 (0.0%) |
| 45 to 59 Minutes | 15 (7.3%) | 0 (0.0%) |
| 60 to 89 Minutes | 8 (3.9%) | 8 (10.3%) |
| 90 or more Minutes | 0 (0.0%) | 0 (0.0%) |
Time of Departure to Work by Sex in Seneca
The most frequent times of departure to work in Seneca are 8:00 AM to 8:29 AM (73, 35.4%) for males and 8:00 AM to 8:29 AM (17, 21.8%) for females.
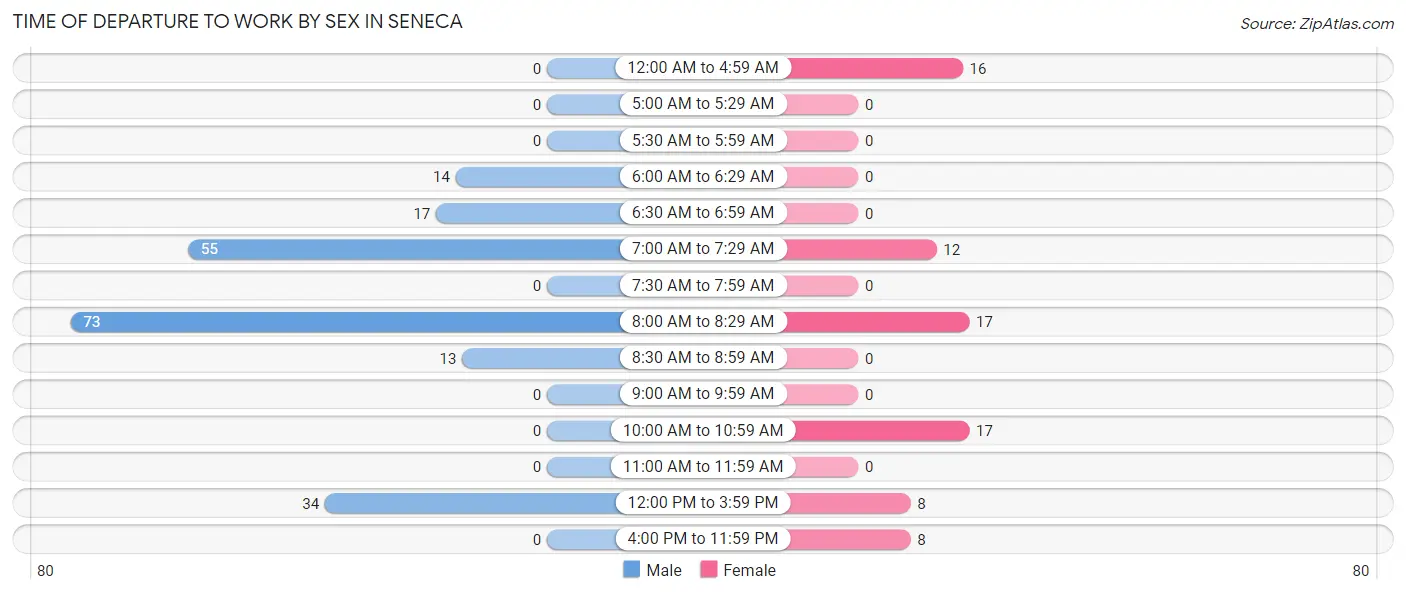
| Time of Departure | Male | Female |
| 12:00 AM to 4:59 AM | 0 (0.0%) | 16 (20.5%) |
| 5:00 AM to 5:29 AM | 0 (0.0%) | 0 (0.0%) |
| 5:30 AM to 5:59 AM | 0 (0.0%) | 0 (0.0%) |
| 6:00 AM to 6:29 AM | 14 (6.8%) | 0 (0.0%) |
| 6:30 AM to 6:59 AM | 17 (8.3%) | 0 (0.0%) |
| 7:00 AM to 7:29 AM | 55 (26.7%) | 12 (15.4%) |
| 7:30 AM to 7:59 AM | 0 (0.0%) | 0 (0.0%) |
| 8:00 AM to 8:29 AM | 73 (35.4%) | 17 (21.8%) |
| 8:30 AM to 8:59 AM | 13 (6.3%) | 0 (0.0%) |
| 9:00 AM to 9:59 AM | 0 (0.0%) | 0 (0.0%) |
| 10:00 AM to 10:59 AM | 0 (0.0%) | 17 (21.8%) |
| 11:00 AM to 11:59 AM | 0 (0.0%) | 0 (0.0%) |
| 12:00 PM to 3:59 PM | 34 (16.5%) | 8 (10.3%) |
| 4:00 PM to 11:59 PM | 0 (0.0%) | 8 (10.3%) |
| Total | 206 (100.0%) | 78 (100.0%) |
Housing Occupancy in Seneca
Occupancy by Ownership in Seneca
Of the total 426 dwellings in Seneca, owner-occupied units account for 354 (83.1%), while renter-occupied units make up 72 (16.9%).
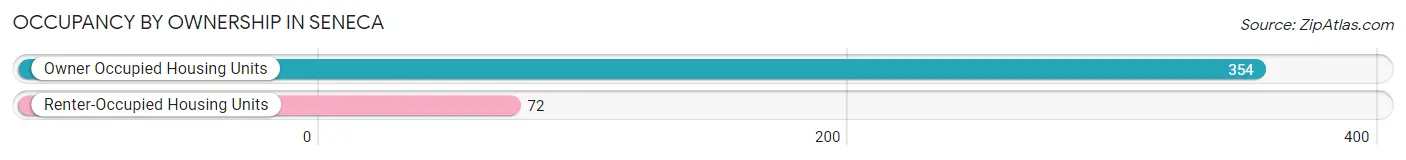
| Occupancy | # Housing Units | % Housing Units |
| Owner Occupied Housing Units | 354 | 83.1% |
| Renter-Occupied Housing Units | 72 | 16.9% |
| Total Occupied Housing Units | 426 | 100.0% |
Occupancy by Household Size in Seneca
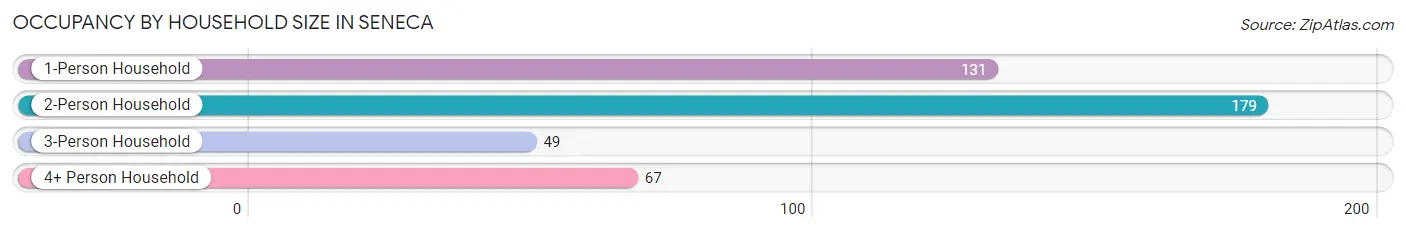
| Household Size | # Housing Units | % Housing Units |
| 1-Person Household | 131 | 30.7% |
| 2-Person Household | 179 | 42.0% |
| 3-Person Household | 49 | 11.5% |
| 4+ Person Household | 67 | 15.7% |
| Total Housing Units | 426 | 100.0% |
Occupancy by Ownership by Household Size in Seneca
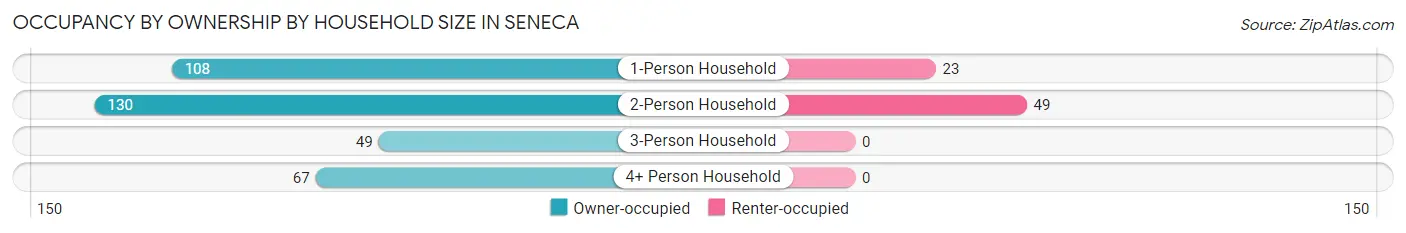
| Household Size | Owner-occupied | Renter-occupied |
| 1-Person Household | 108 (82.4%) | 23 (17.6%) |
| 2-Person Household | 130 (72.6%) | 49 (27.4%) |
| 3-Person Household | 49 (100.0%) | 0 (0.0%) |
| 4+ Person Household | 67 (100.0%) | 0 (0.0%) |
| Total Housing Units | 354 (83.1%) | 72 (16.9%) |
Occupancy by Educational Attainment in Seneca
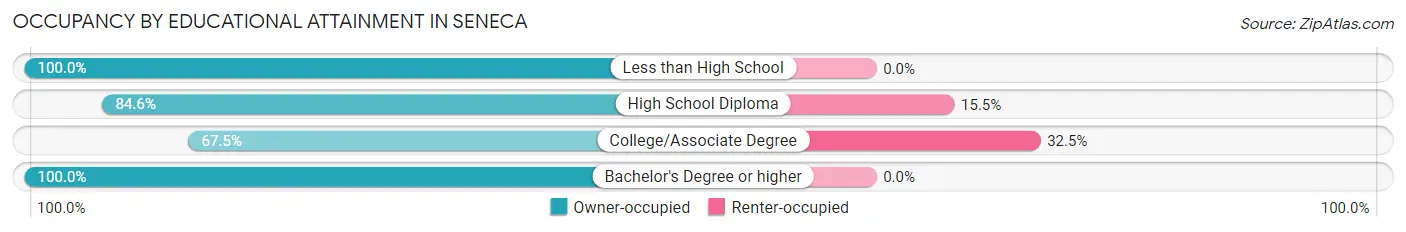
| Household Size | Owner-occupied | Renter-occupied |
| Less than High School | 24 (100.0%) | 0 (0.0%) |
| High School Diploma | 104 (84.6%) | 19 (15.4%) |
| College/Associate Degree | 110 (67.5%) | 53 (32.5%) |
| Bachelor's Degree or higher | 116 (100.0%) | 0 (0.0%) |
Occupancy by Age of Householder in Seneca
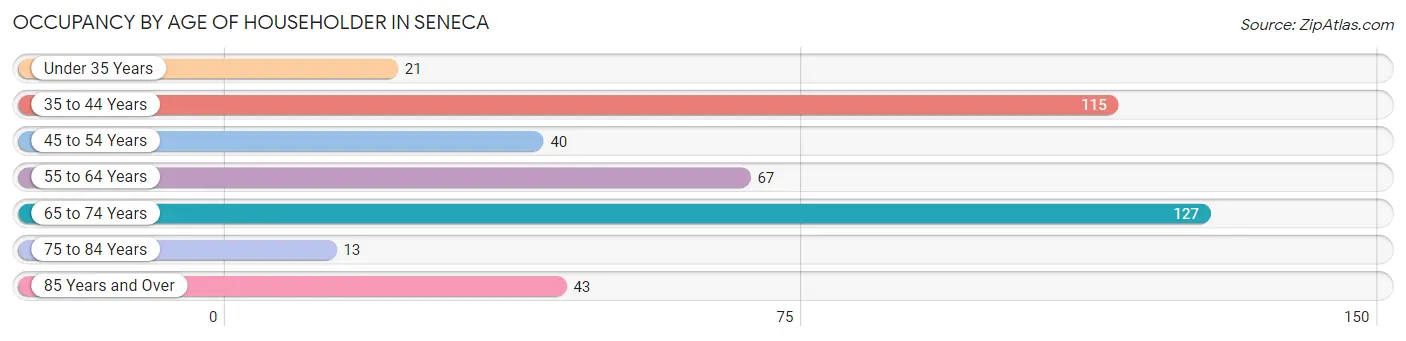
| Age Bracket | # Households | % Households |
| Under 35 Years | 21 | 4.9% |
| 35 to 44 Years | 115 | 27.0% |
| 45 to 54 Years | 40 | 9.4% |
| 55 to 64 Years | 67 | 15.7% |
| 65 to 74 Years | 127 | 29.8% |
| 75 to 84 Years | 13 | 3.0% |
| 85 Years and Over | 43 | 10.1% |
| Total | 426 | 100.0% |
Housing Finances in Seneca
Median Income by Occupancy in Seneca
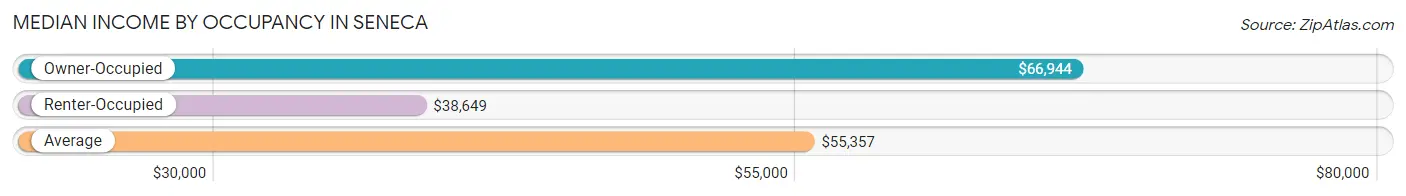
| Occupancy Type | # Households | Median Income |
| Owner-Occupied | 354 (83.1%) | $66,944 |
| Renter-Occupied | 72 (16.9%) | $38,649 |
| Average | 426 (100.0%) | $55,357 |
Occupancy by Householder Income Bracket in Seneca
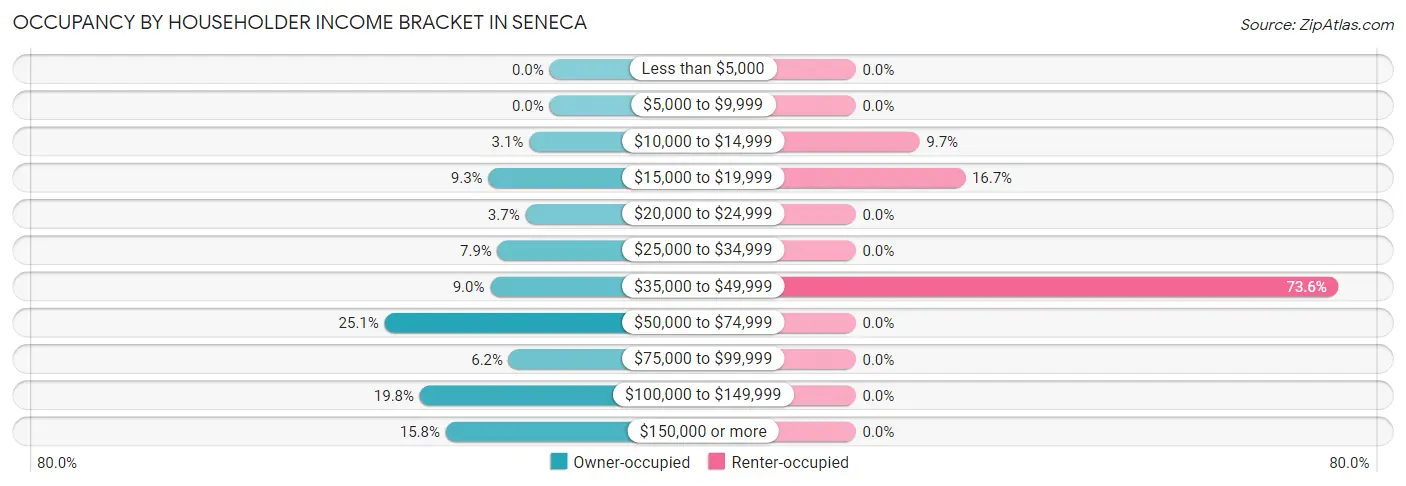
| Income Bracket | Owner-occupied | Renter-occupied |
| Less than $5,000 | 0 (0.0%) | 0 (0.0%) |
| $5,000 to $9,999 | 0 (0.0%) | 0 (0.0%) |
| $10,000 to $14,999 | 11 (3.1%) | 7 (9.7%) |
| $15,000 to $19,999 | 33 (9.3%) | 12 (16.7%) |
| $20,000 to $24,999 | 13 (3.7%) | 0 (0.0%) |
| $25,000 to $34,999 | 28 (7.9%) | 0 (0.0%) |
| $35,000 to $49,999 | 32 (9.0%) | 53 (73.6%) |
| $50,000 to $74,999 | 89 (25.1%) | 0 (0.0%) |
| $75,000 to $99,999 | 22 (6.2%) | 0 (0.0%) |
| $100,000 to $149,999 | 70 (19.8%) | 0 (0.0%) |
| $150,000 or more | 56 (15.8%) | 0 (0.0%) |
| Total | 354 (100.0%) | 72 (100.0%) |
Monthly Housing Cost Tiers in Seneca
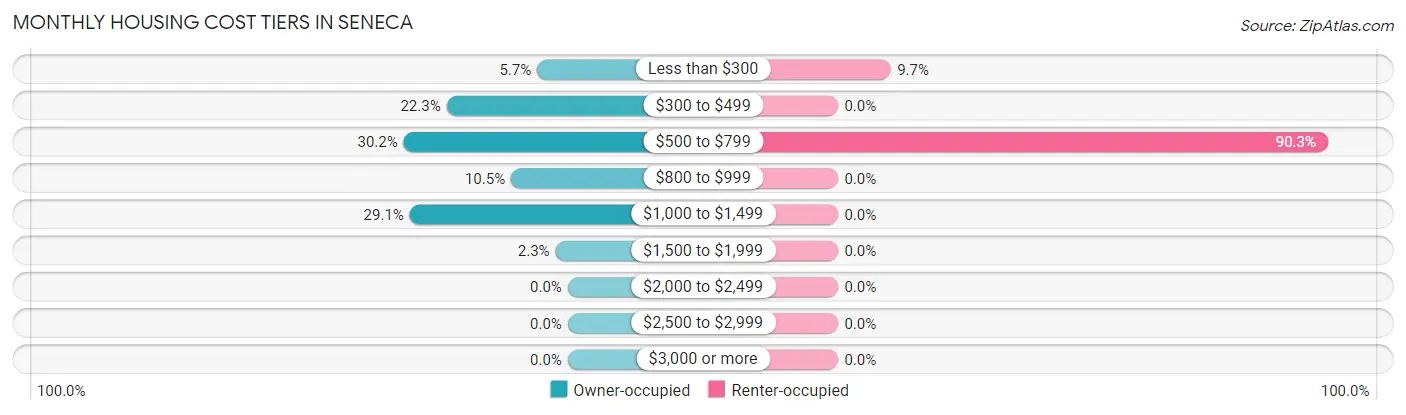
| Monthly Cost | Owner-occupied | Renter-occupied |
| Less than $300 | 20 (5.7%) | 7 (9.7%) |
| $300 to $499 | 79 (22.3%) | 0 (0.0%) |
| $500 to $799 | 107 (30.2%) | 65 (90.3%) |
| $800 to $999 | 37 (10.4%) | 0 (0.0%) |
| $1,000 to $1,499 | 103 (29.1%) | 0 (0.0%) |
| $1,500 to $1,999 | 8 (2.3%) | 0 (0.0%) |
| $2,000 to $2,499 | 0 (0.0%) | 0 (0.0%) |
| $2,500 to $2,999 | 0 (0.0%) | 0 (0.0%) |
| $3,000 or more | 0 (0.0%) | 0 (0.0%) |
| Total | 354 (100.0%) | 72 (100.0%) |
Physical Housing Characteristics in Seneca
Housing Structures in Seneca
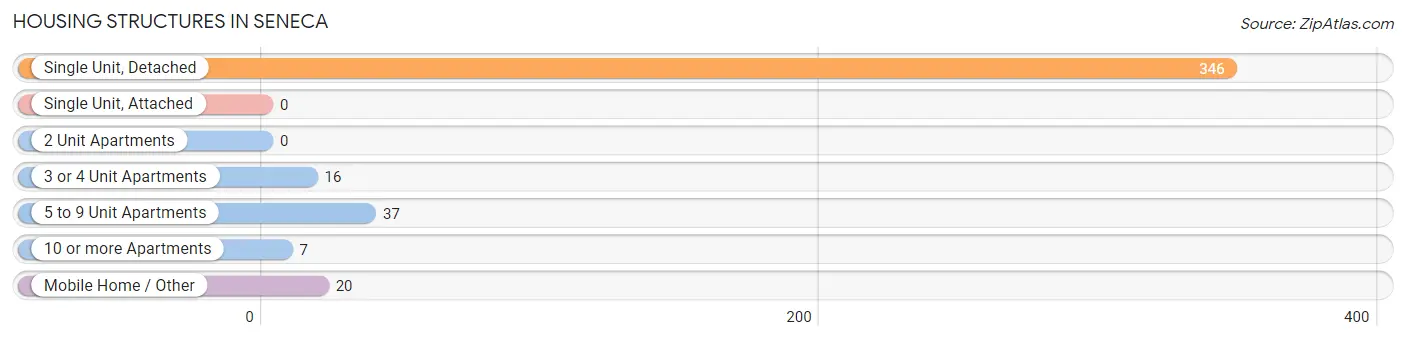
| Structure Type | # Housing Units | % Housing Units |
| Single Unit, Detached | 346 | 81.2% |
| Single Unit, Attached | 0 | 0.0% |
| 2 Unit Apartments | 0 | 0.0% |
| 3 or 4 Unit Apartments | 16 | 3.8% |
| 5 to 9 Unit Apartments | 37 | 8.7% |
| 10 or more Apartments | 7 | 1.6% |
| Mobile Home / Other | 20 | 4.7% |
| Total | 426 | 100.0% |
Housing Structures by Occupancy in Seneca
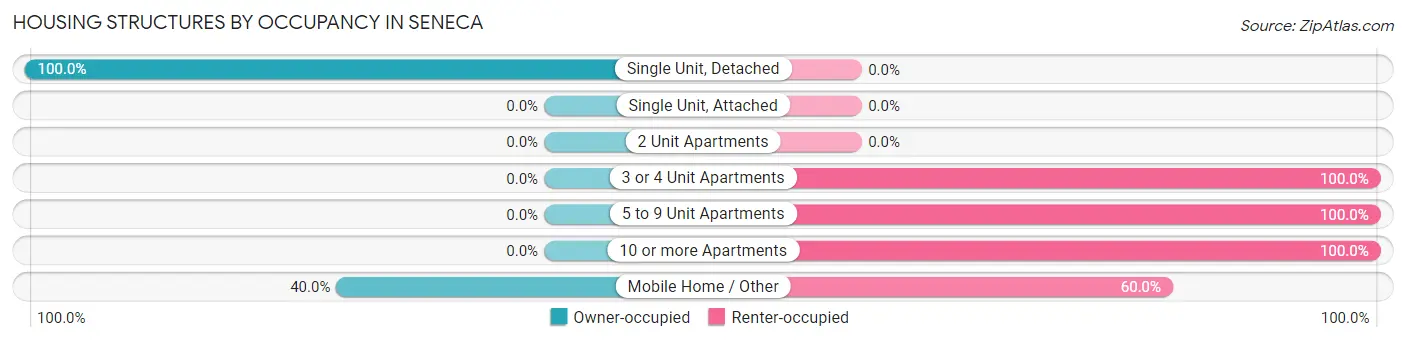
| Structure Type | Owner-occupied | Renter-occupied |
| Single Unit, Detached | 346 (100.0%) | 0 (0.0%) |
| Single Unit, Attached | 0 (0.0%) | 0 (0.0%) |
| 2 Unit Apartments | 0 (0.0%) | 0 (0.0%) |
| 3 or 4 Unit Apartments | 0 (0.0%) | 16 (100.0%) |
| 5 to 9 Unit Apartments | 0 (0.0%) | 37 (100.0%) |
| 10 or more Apartments | 0 (0.0%) | 7 (100.0%) |
| Mobile Home / Other | 8 (40.0%) | 12 (60.0%) |
| Total | 354 (83.1%) | 72 (16.9%) |
Housing Structures by Number of Rooms in Seneca
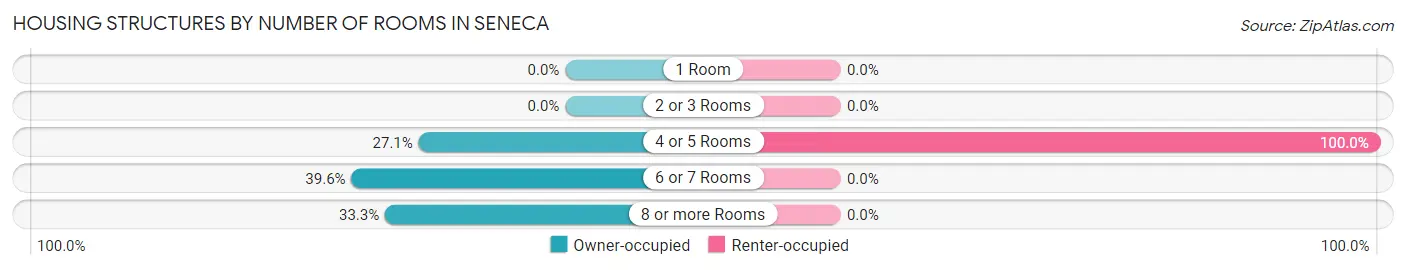
| Number of Rooms | Owner-occupied | Renter-occupied |
| 1 Room | 0 (0.0%) | 0 (0.0%) |
| 2 or 3 Rooms | 0 (0.0%) | 0 (0.0%) |
| 4 or 5 Rooms | 96 (27.1%) | 72 (100.0%) |
| 6 or 7 Rooms | 140 (39.6%) | 0 (0.0%) |
| 8 or more Rooms | 118 (33.3%) | 0 (0.0%) |
| Total | 354 (100.0%) | 72 (100.0%) |
Housing Structure by Heating Type in Seneca
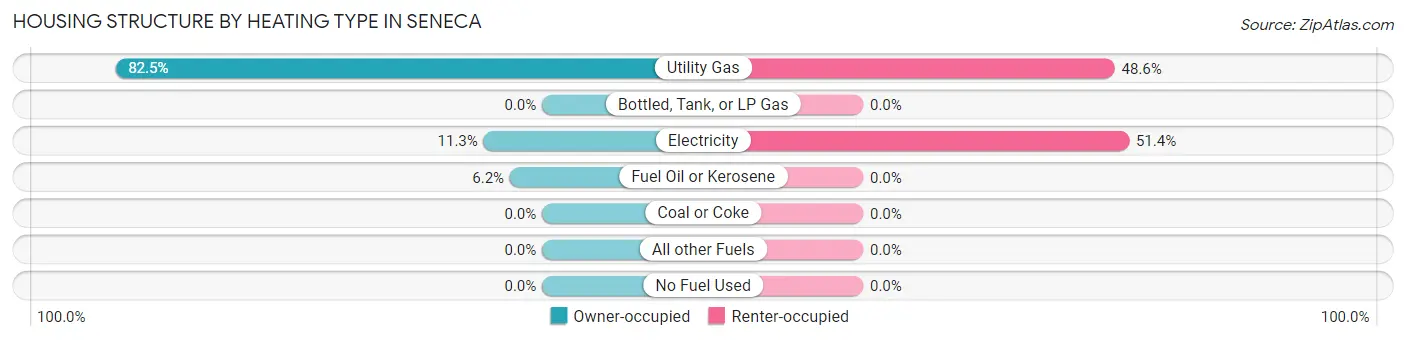
| Heating Type | Owner-occupied | Renter-occupied |
| Utility Gas | 292 (82.5%) | 35 (48.6%) |
| Bottled, Tank, or LP Gas | 0 (0.0%) | 0 (0.0%) |
| Electricity | 40 (11.3%) | 37 (51.4%) |
| Fuel Oil or Kerosene | 22 (6.2%) | 0 (0.0%) |
| Coal or Coke | 0 (0.0%) | 0 (0.0%) |
| All other Fuels | 0 (0.0%) | 0 (0.0%) |
| No Fuel Used | 0 (0.0%) | 0 (0.0%) |
| Total | 354 (100.0%) | 72 (100.0%) |
Household Vehicle Usage in Seneca
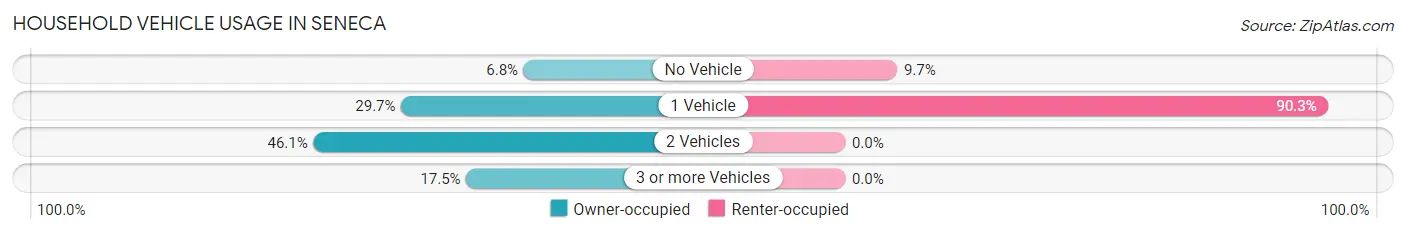
| Vehicles per Household | Owner-occupied | Renter-occupied |
| No Vehicle | 24 (6.8%) | 7 (9.7%) |
| 1 Vehicle | 105 (29.7%) | 65 (90.3%) |
| 2 Vehicles | 163 (46.1%) | 0 (0.0%) |
| 3 or more Vehicles | 62 (17.5%) | 0 (0.0%) |
| Total | 354 (100.0%) | 72 (100.0%) |
Real Estate & Mortgages in Seneca
Real Estate and Mortgage Overview in Seneca
| Characteristic | Without Mortgage | With Mortgage |
| Housing Units | 176 | 178 |
| Median Property Value | $106,100 | $158,300 |
| Median Household Income | $55,714 | $56 |
| Monthly Housing Costs | $494 | $0 |
| Real Estate Taxes | $1,761 | $0 |
Property Value by Mortgage Status in Seneca
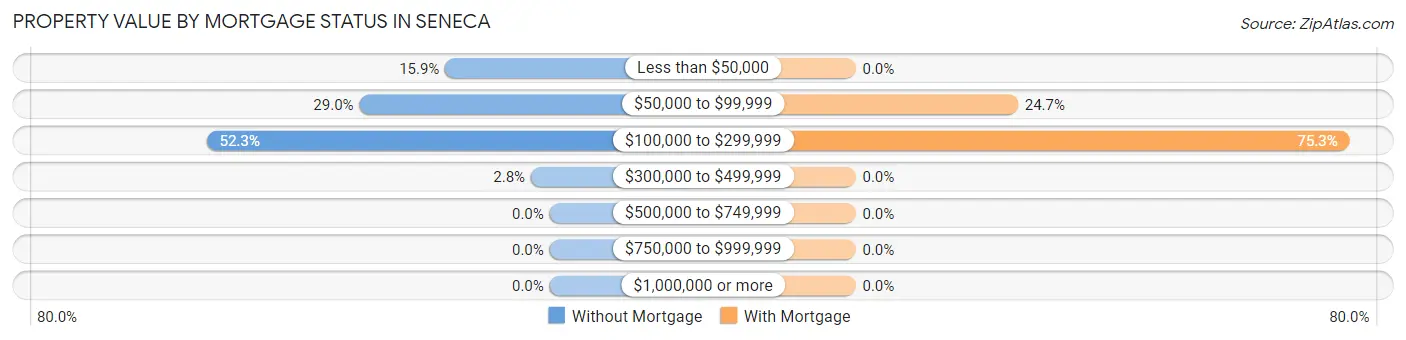
| Property Value | Without Mortgage | With Mortgage |
| Less than $50,000 | 28 (15.9%) | 0 (0.0%) |
| $50,000 to $99,999 | 51 (29.0%) | 44 (24.7%) |
| $100,000 to $299,999 | 92 (52.3%) | 134 (75.3%) |
| $300,000 to $499,999 | 5 (2.8%) | 0 (0.0%) |
| $500,000 to $749,999 | 0 (0.0%) | 0 (0.0%) |
| $750,000 to $999,999 | 0 (0.0%) | 0 (0.0%) |
| $1,000,000 or more | 0 (0.0%) | 0 (0.0%) |
| Total | 176 (100.0%) | 178 (100.0%) |
Household Income by Mortgage Status in Seneca
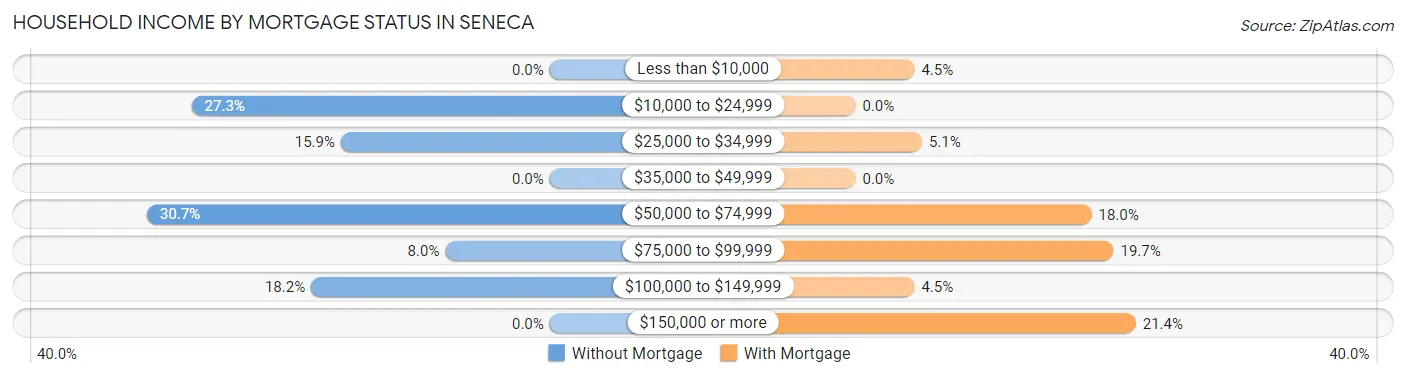
| Household Income | Without Mortgage | With Mortgage |
| Less than $10,000 | 0 (0.0%) | 8 (4.5%) |
| $10,000 to $24,999 | 48 (27.3%) | 0 (0.0%) |
| $25,000 to $34,999 | 28 (15.9%) | 9 (5.1%) |
| $35,000 to $49,999 | 0 (0.0%) | 0 (0.0%) |
| $50,000 to $74,999 | 54 (30.7%) | 32 (18.0%) |
| $75,000 to $99,999 | 14 (8.0%) | 35 (19.7%) |
| $100,000 to $149,999 | 32 (18.2%) | 8 (4.5%) |
| $150,000 or more | 0 (0.0%) | 38 (21.3%) |
| Total | 176 (100.0%) | 178 (100.0%) |
Property Value to Household Income Ratio in Seneca
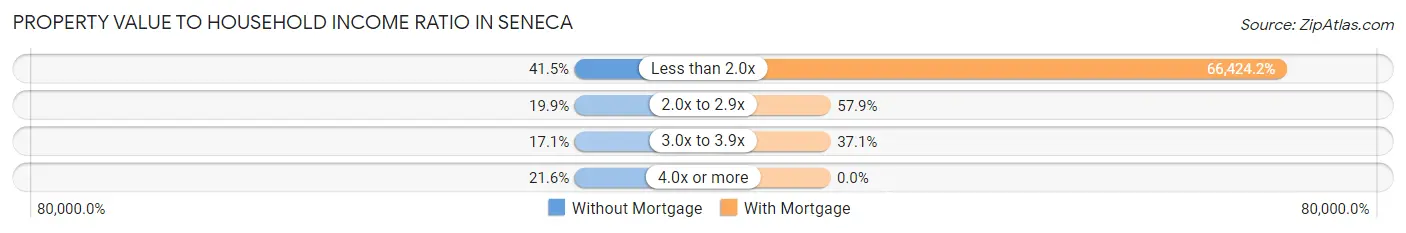
| Value-to-Income Ratio | Without Mortgage | With Mortgage |
| Less than 2.0x | 73 (41.5%) | 118,235 (66,424.2%) |
| 2.0x to 2.9x | 35 (19.9%) | 103 (57.9%) |
| 3.0x to 3.9x | 30 (17.1%) | 66 (37.1%) |
| 4.0x or more | 38 (21.6%) | 0 (0.0%) |
| Total | 176 (100.0%) | 178 (100.0%) |
Real Estate Taxes by Mortgage Status in Seneca
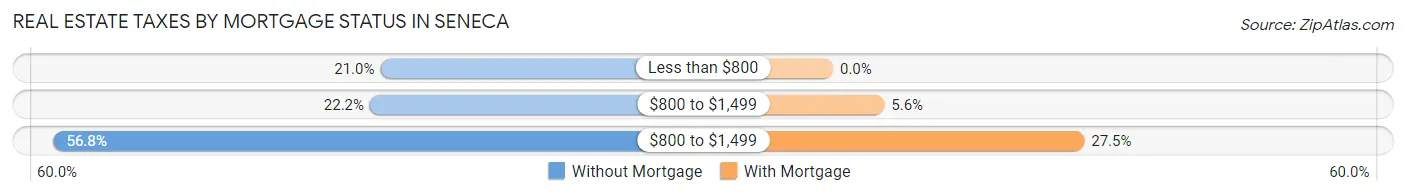
| Property Taxes | Without Mortgage | With Mortgage |
| Less than $800 | 37 (21.0%) | 0 (0.0%) |
| $800 to $1,499 | 39 (22.2%) | 10 (5.6%) |
| $800 to $1,499 | 100 (56.8%) | 49 (27.5%) |
| Total | 176 (100.0%) | 178 (100.0%) |
Health & Disability in Seneca
Health Insurance Coverage by Age in Seneca
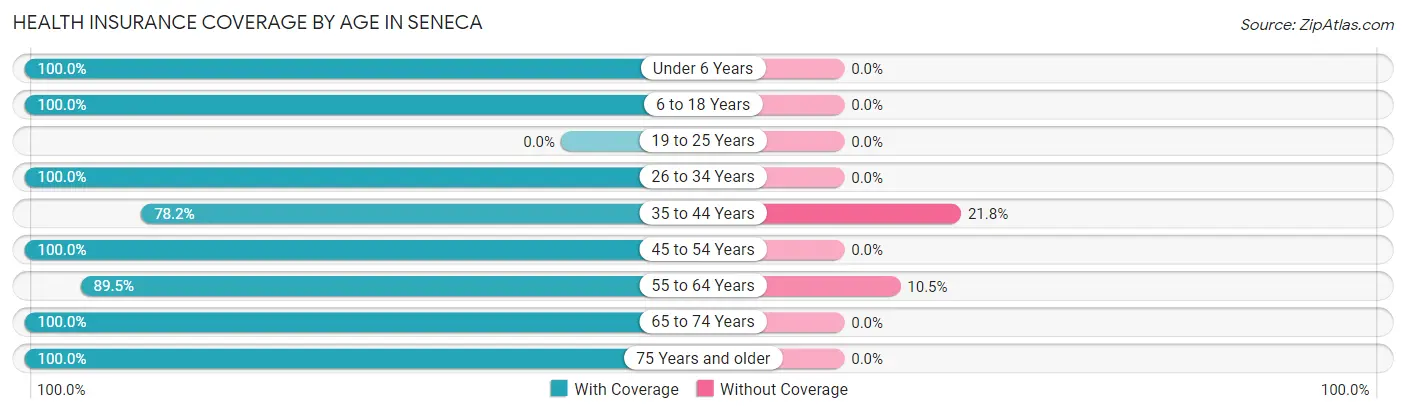
| Age Bracket | With Coverage | Without Coverage |
| Under 6 Years | 65 (100.0%) | 0 (0.0%) |
| 6 to 18 Years | 181 (100.0%) | 0 (0.0%) |
| 19 to 25 Years | 0 (0.0%) | 0 (0.0%) |
| 26 to 34 Years | 43 (100.0%) | 0 (0.0%) |
| 35 to 44 Years | 133 (78.2%) | 37 (21.8%) |
| 45 to 54 Years | 48 (100.0%) | 0 (0.0%) |
| 55 to 64 Years | 137 (89.5%) | 16 (10.5%) |
| 65 to 74 Years | 182 (100.0%) | 0 (0.0%) |
| 75 Years and older | 69 (100.0%) | 0 (0.0%) |
| Total | 858 (94.2%) | 53 (5.8%) |
Health Insurance Coverage by Citizenship Status in Seneca
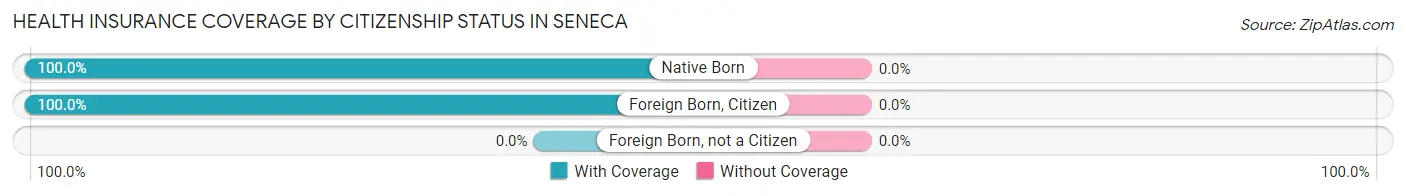
| Citizenship Status | With Coverage | Without Coverage |
| Native Born | 65 (100.0%) | 0 (0.0%) |
| Foreign Born, Citizen | 181 (100.0%) | 0 (0.0%) |
| Foreign Born, not a Citizen | 0 (0.0%) | 0 (0.0%) |
Health Insurance Coverage by Household Income in Seneca
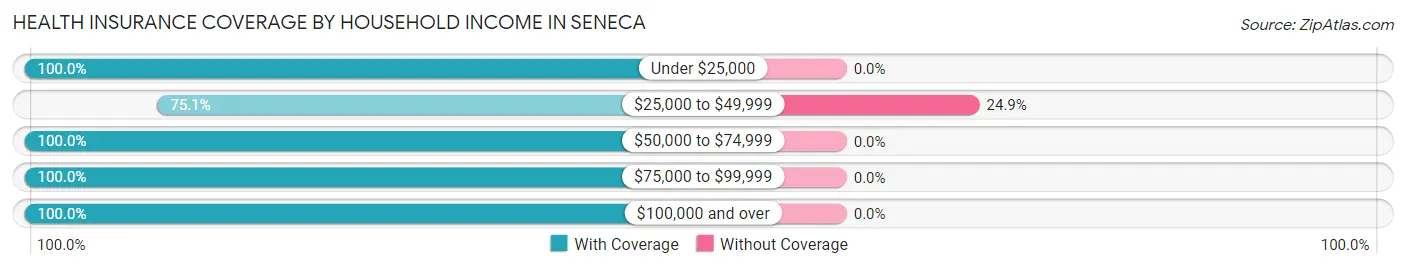
| Household Income | With Coverage | Without Coverage |
| Under $25,000 | 98 (100.0%) | 0 (0.0%) |
| $25,000 to $49,999 | 160 (75.1%) | 53 (24.9%) |
| $50,000 to $74,999 | 267 (100.0%) | 0 (0.0%) |
| $75,000 to $99,999 | 43 (100.0%) | 0 (0.0%) |
| $100,000 and over | 290 (100.0%) | 0 (0.0%) |
Public vs Private Health Insurance Coverage by Age in Seneca
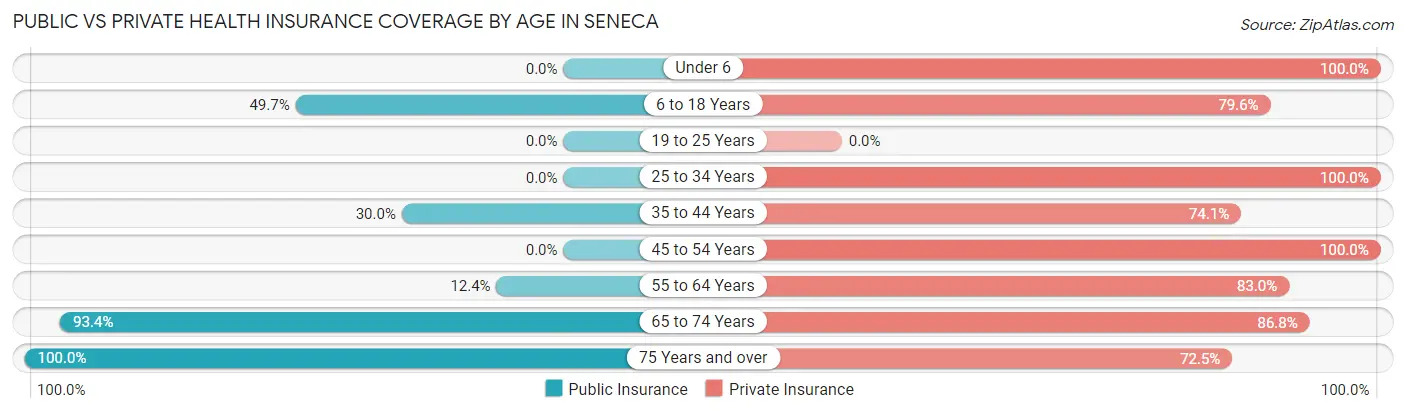
| Age Bracket | Public Insurance | Private Insurance |
| Under 6 | 0 (0.0%) | 65 (100.0%) |
| 6 to 18 Years | 90 (49.7%) | 144 (79.6%) |
| 19 to 25 Years | 0 (0.0%) | 0 (0.0%) |
| 25 to 34 Years | 0 (0.0%) | 43 (100.0%) |
| 35 to 44 Years | 51 (30.0%) | 126 (74.1%) |
| 45 to 54 Years | 0 (0.0%) | 48 (100.0%) |
| 55 to 64 Years | 19 (12.4%) | 127 (83.0%) |
| 65 to 74 Years | 170 (93.4%) | 158 (86.8%) |
| 75 Years and over | 69 (100.0%) | 50 (72.5%) |
| Total | 399 (43.8%) | 761 (83.5%) |
Disability Status by Sex by Age in Seneca
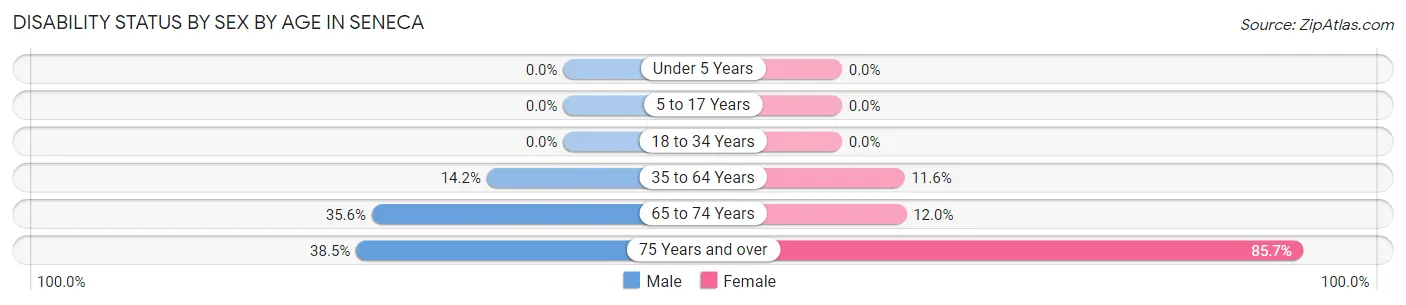
| Age Bracket | Male | Female |
| Under 5 Years | 0 (0.0%) | 0 (0.0%) |
| 5 to 17 Years | 0 (0.0%) | 0 (0.0%) |
| 18 to 34 Years | 0 (0.0%) | 0 (0.0%) |
| 35 to 64 Years | 32 (14.2%) | 17 (11.6%) |
| 65 to 74 Years | 32 (35.6%) | 11 (12.0%) |
| 75 Years and over | 5 (38.5%) | 48 (85.7%) |
Disability Class by Sex by Age in Seneca
Disability Class: Hearing Difficulty
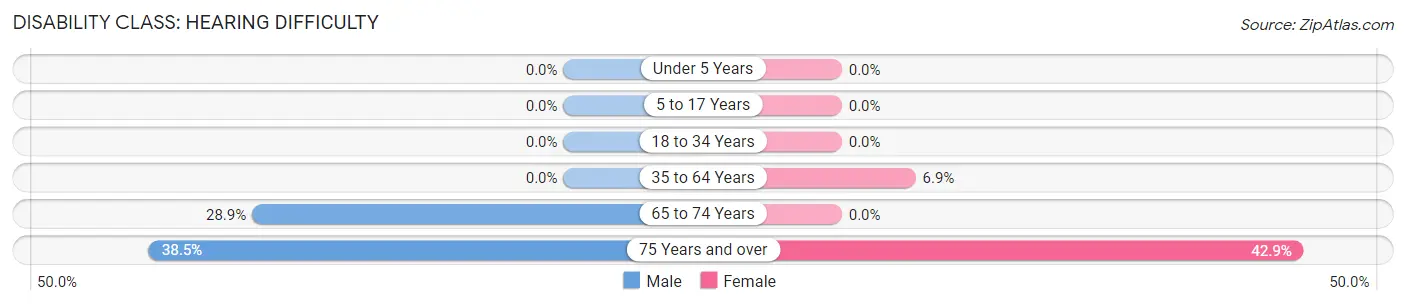
| Age Bracket | Male | Female |
| Under 5 Years | 0 (0.0%) | 0 (0.0%) |
| 5 to 17 Years | 0 (0.0%) | 0 (0.0%) |
| 18 to 34 Years | 0 (0.0%) | 0 (0.0%) |
| 35 to 64 Years | 0 (0.0%) | 10 (6.9%) |
| 65 to 74 Years | 26 (28.9%) | 0 (0.0%) |
| 75 Years and over | 5 (38.5%) | 24 (42.9%) |
Disability Class: Vision Difficulty
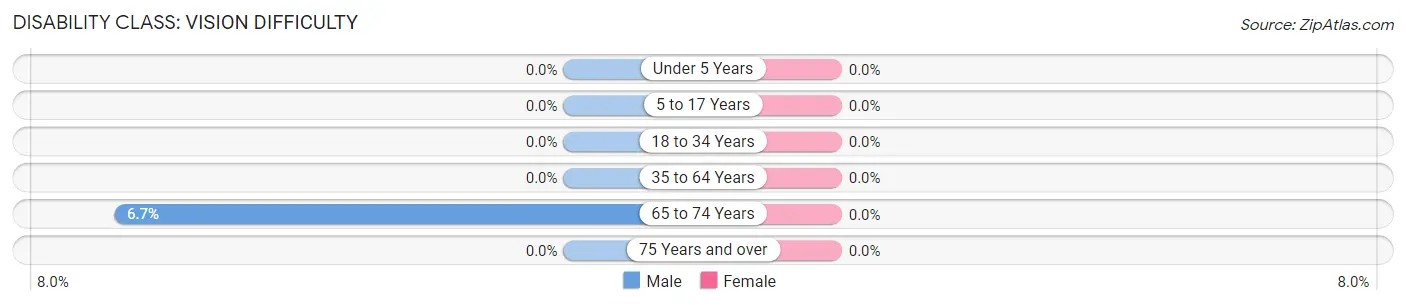
| Age Bracket | Male | Female |
| Under 5 Years | 0 (0.0%) | 0 (0.0%) |
| 5 to 17 Years | 0 (0.0%) | 0 (0.0%) |
| 18 to 34 Years | 0 (0.0%) | 0 (0.0%) |
| 35 to 64 Years | 0 (0.0%) | 0 (0.0%) |
| 65 to 74 Years | 6 (6.7%) | 0 (0.0%) |
| 75 Years and over | 0 (0.0%) | 0 (0.0%) |
Disability Class: Cognitive Difficulty
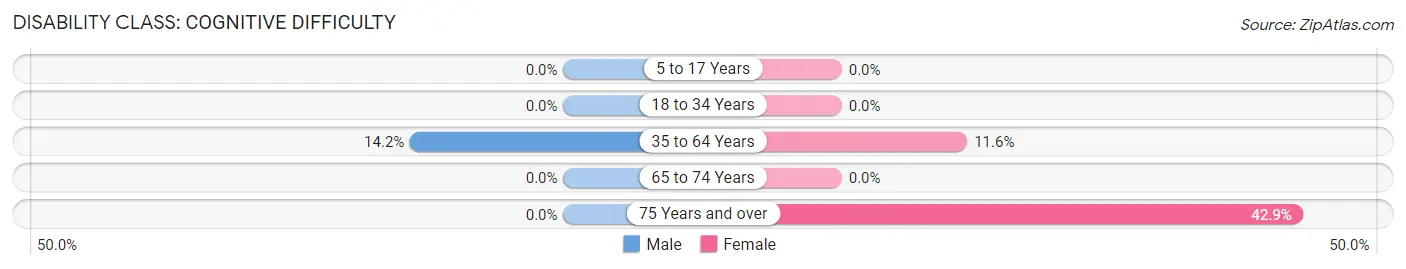
| Age Bracket | Male | Female |
| 5 to 17 Years | 0 (0.0%) | 0 (0.0%) |
| 18 to 34 Years | 0 (0.0%) | 0 (0.0%) |
| 35 to 64 Years | 32 (14.2%) | 17 (11.6%) |
| 65 to 74 Years | 0 (0.0%) | 0 (0.0%) |
| 75 Years and over | 0 (0.0%) | 24 (42.9%) |
Disability Class: Ambulatory Difficulty
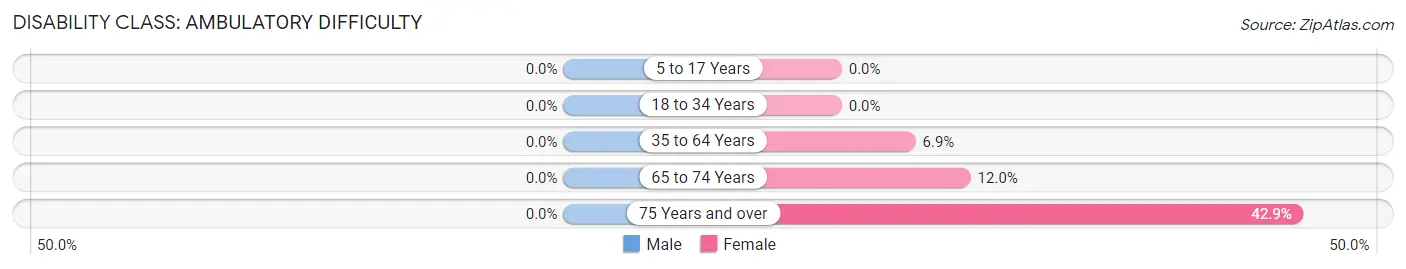
| Age Bracket | Male | Female |
| 5 to 17 Years | 0 (0.0%) | 0 (0.0%) |
| 18 to 34 Years | 0 (0.0%) | 0 (0.0%) |
| 35 to 64 Years | 0 (0.0%) | 10 (6.9%) |
| 65 to 74 Years | 0 (0.0%) | 11 (12.0%) |
| 75 Years and over | 0 (0.0%) | 24 (42.9%) |
Disability Class: Self-Care Difficulty
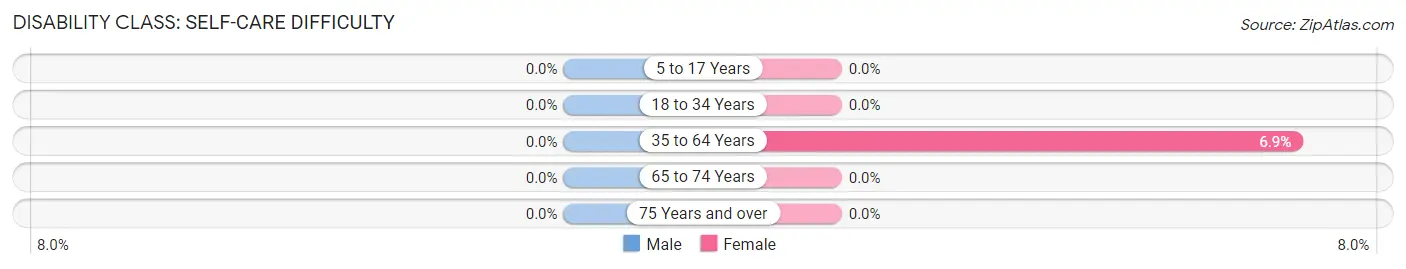
| Age Bracket | Male | Female |
| 5 to 17 Years | 0 (0.0%) | 0 (0.0%) |
| 18 to 34 Years | 0 (0.0%) | 0 (0.0%) |
| 35 to 64 Years | 0 (0.0%) | 10 (6.9%) |
| 65 to 74 Years | 0 (0.0%) | 0 (0.0%) |
| 75 Years and over | 0 (0.0%) | 0 (0.0%) |
Technology Access in Seneca
Computing Device Access in Seneca
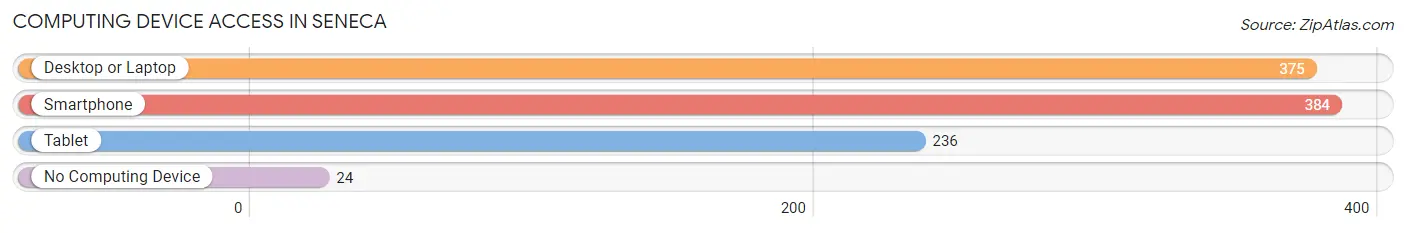
| Device Type | # Households | % Households |
| Desktop or Laptop | 375 | 88.0% |
| Smartphone | 384 | 90.1% |
| Tablet | 236 | 55.4% |
| No Computing Device | 24 | 5.6% |
| Total | 426 | 100.0% |
Internet Access in Seneca
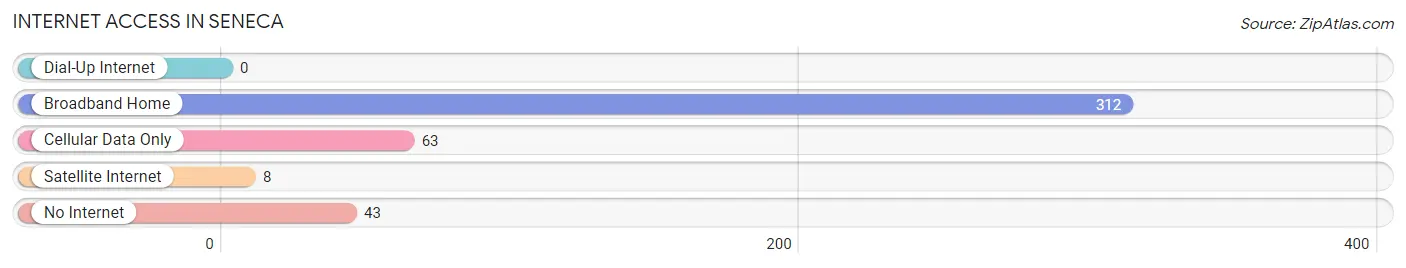
| Internet Type | # Households | % Households |
| Dial-Up Internet | 0 | 0.0% |
| Broadband Home | 312 | 73.2% |
| Cellular Data Only | 63 | 14.8% |
| Satellite Internet | 8 | 1.9% |
| No Internet | 43 | 10.1% |
| Total | 426 | 100.0% |
Seneca Summary
Seneca, Pennsylvania is a small borough located in Venango County, Pennsylvania. It is situated in the northwestern part of the state, approximately 40 miles south of Erie and 60 miles north of Pittsburgh. The population of Seneca was 1,845 as of the 2010 census.
History
The area that is now Seneca was first settled in the late 1700s by a group of Scots-Irish immigrants. The town was originally known as “Seneca Mills” and was incorporated in 1876. The name was changed to Seneca in 1883.
The town was an important stop on the Allegheny Valley Railroad, which ran from Pittsburgh to Oil City. The railroad was a major factor in the growth of the town, as it allowed for the transportation of goods and people.
The town was also home to several industries, including a sawmill, a grist mill, a tannery, and a brickyard. These industries provided employment for many of the town’s residents.
Geography
Seneca is located at 41°25'N 79°45'W (41.4167, -79.7500). It is situated in the northwestern part of the state, approximately 40 miles south of Erie and 60 miles north of Pittsburgh.
The borough is located in the Allegheny Plateau region of Pennsylvania. The terrain is mostly rolling hills, with some flat areas. The area is heavily forested, with a mix of deciduous and coniferous trees.
The climate in Seneca is classified as humid continental, with cold winters and warm summers. The average annual temperature is 48°F (9°C). The average annual precipitation is 40 inches (101 cm).
Economy
The economy of Seneca is largely based on agriculture and tourism. The town is home to several farms, which produce a variety of crops, including corn, soybeans, hay, and wheat.
The town is also a popular tourist destination, due to its proximity to several state parks and recreational areas. These include Allegheny National Forest, Cook Forest State Park, and Oil Creek State Park.
Demographics
As of the 2010 census, the population of Seneca was 1,845. The racial makeup of the town was 97.3% White, 0.7% African American, 0.2% Native American, 0.2% Asian, 0.2% from other races, and 1.4% from two or more races. Hispanic or Latino of any race were 0.7% of the population.
The median household income in Seneca was $37,917, and the median family income was $45,000. The per capita income was $19,845. About 11.2% of families and 14.2% of the population were below the poverty line, including 19.2% of those under age 18 and 8.3% of those age 65 or over.
Common Questions
What is Per Capita Income in Seneca?
Per Capita income in Seneca is $32,226.
What is the Median Family Income in Seneca?
Median Family Income in Seneca is $70,938.
What is the Median Household income in Seneca?
Median Household Income in Seneca is $55,357.
What is Income or Wage Gap in Seneca?
Income or Wage Gap in Seneca is 24.7%.
Women in Seneca earn 75.3 cents for every dollar earned by a man.
What is Inequality or Gini Index in Seneca?
Inequality or Gini Index in Seneca is 0.39.
What is the Total Population of Seneca?
Total Population of Seneca is 911.
What is the Total Male Population of Seneca?
Total Male Population of Seneca is 440.
What is the Total Female Population of Seneca?
Total Female Population of Seneca is 471.
What is the Ratio of Males per 100 Females in Seneca?
There are 93.42 Males per 100 Females in Seneca.
What is the Ratio of Females per 100 Males in Seneca?
There are 107.05 Females per 100 Males in Seneca.
What is the Median Population Age in Seneca?
Median Population Age in Seneca is 43.9 Years.
What is the Average Family Size in Seneca
Average Family Size in Seneca is 2.6 People.
What is the Average Household Size in Seneca
Average Household Size in Seneca is 2.1 People.
How Large is the Labor Force in Seneca?
There are 374 People in the Labor Forcein in Seneca.
What is the Percentage of People in the Labor Force in Seneca?
52.8% of People are in the Labor Force in Seneca.
What is the Unemployment Rate in Seneca?
Unemployment Rate in Seneca is 4.3%.