Slatedale, PA Map & Demographics
Slatedale Map
Slatedale Overview
$29,792
PER CAPITA INCOME
$116,343
AVG FAMILY INCOME
$116,088
AVG HOUSEHOLD INCOME
0.24
INEQUALITY / GINI INDEX
550
TOTAL POPULATION
304
MALE POPULATION
246
FEMALE POPULATION
123.58
MALES / 100 FEMALES
80.92
FEMALES / 100 MALES
35.9
MEDIAN AGE
3.5
AVG FAMILY SIZE
3.3
AVG HOUSEHOLD SIZE
308
LABOR FORCE [ PEOPLE ]
85.6%
PERCENT IN LABOR FORCE
Slatedale Zip Codes
Slatedale Area Codes
Income in Slatedale
Income Overview in Slatedale
Per Capita Income in Slatedale is $29,792, while median incomes of families and households are $116,343 and $116,088 respectively.
| Characteristic | Number | Measure |
| Per Capita Income | 550 | $29,792 |
| Median Family Income | 156 | $116,343 |
| Mean Family Income | 156 | $103,964 |
| Median Household Income | 167 | $116,088 |
| Mean Household Income | 167 | $98,097 |
| Income Deficit | 156 | $0 |
| Wage / Income Gap (%) | 550 | 0.00% |
| Wage / Income Gap ($) | 550 | 100.00¢ per $1 |
| Gini / Inequality Index | 550 | 0.24 |
Earnings by Sex in Slatedale
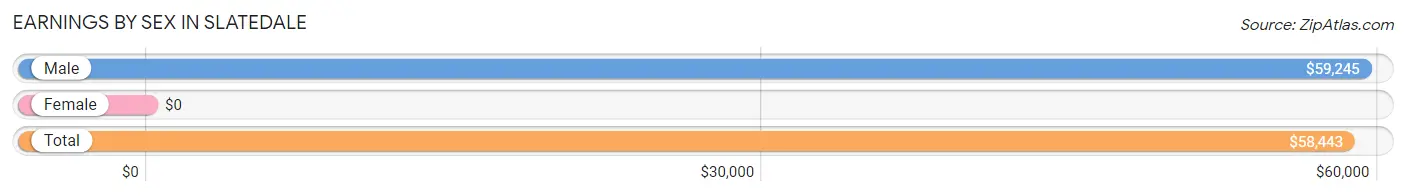
| Sex | Number | Average Earnings |
| Male | 132 (42.9%) | $59,245 |
| Female | 176 (57.1%) | $0 |
| Total | 308 (100.0%) | $58,443 |
Earnings by Sex by Income Bracket in Slatedale
The most common earnings brackets in Slatedale are $55,000 to $64,999 for men (53 | 40.2%) and $75,000 to $99,999 for women (53 | 30.1%).
| Income | Male | Female |
| $2,499 or less | 0 (0.0%) | 20 (11.4%) |
| $2,500 to $4,999 | 0 (0.0%) | 0 (0.0%) |
| $5,000 to $7,499 | 0 (0.0%) | 0 (0.0%) |
| $7,500 to $9,999 | 18 (13.6%) | 0 (0.0%) |
| $10,000 to $12,499 | 0 (0.0%) | 0 (0.0%) |
| $12,500 to $14,999 | 11 (8.3%) | 0 (0.0%) |
| $15,000 to $17,499 | 0 (0.0%) | 0 (0.0%) |
| $17,500 to $19,999 | 0 (0.0%) | 0 (0.0%) |
| $20,000 to $22,499 | 0 (0.0%) | 0 (0.0%) |
| $22,500 to $24,999 | 0 (0.0%) | 49 (27.8%) |
| $25,000 to $29,999 | 0 (0.0%) | 0 (0.0%) |
| $30,000 to $34,999 | 0 (0.0%) | 36 (20.4%) |
| $35,000 to $39,999 | 0 (0.0%) | 0 (0.0%) |
| $40,000 to $44,999 | 0 (0.0%) | 0 (0.0%) |
| $45,000 to $49,999 | 0 (0.0%) | 0 (0.0%) |
| $50,000 to $54,999 | 0 (0.0%) | 0 (0.0%) |
| $55,000 to $64,999 | 53 (40.2%) | 0 (0.0%) |
| $65,000 to $74,999 | 14 (10.6%) | 18 (10.2%) |
| $75,000 to $99,999 | 36 (27.3%) | 53 (30.1%) |
| $100,000+ | 0 (0.0%) | 0 (0.0%) |
| Total | 132 (100.0%) | 176 (100.0%) |
Earnings by Sex by Educational Attainment in Slatedale
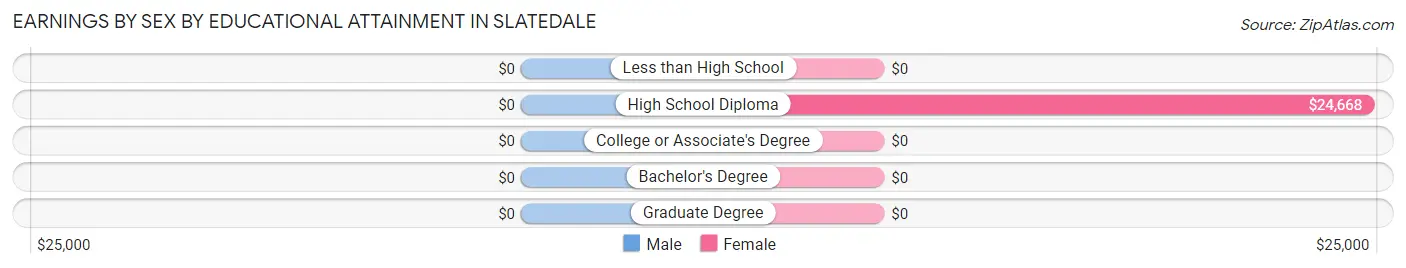
| Educational Attainment | Male Income | Female Income |
| Less than High School | - | - |
| High School Diploma | - | - |
| College or Associate's Degree | - | - |
| Bachelor's Degree | - | - |
| Graduate Degree | - | - |
| Total | $59,245 | $0 |
Family Income in Slatedale
Family Income Brackets in Slatedale
According to the Slatedale family income data, there are 107 families falling into the $100,000 to $149,999 income range, which is the most common income bracket and makes up 68.6% of all families.
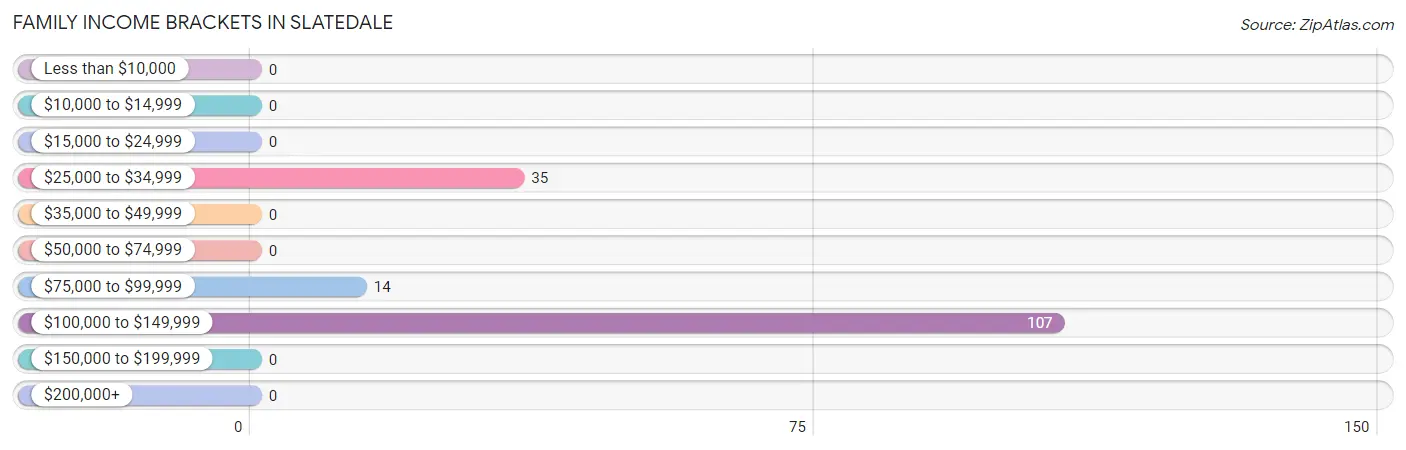
| Income Bracket | # Families | % Families |
| Less than $10,000 | 0 | 0.0% |
| $10,000 to $14,999 | 0 | 0.0% |
| $15,000 to $24,999 | 0 | 0.0% |
| $25,000 to $34,999 | 35 | 22.4% |
| $35,000 to $49,999 | 0 | 0.0% |
| $50,000 to $74,999 | 0 | 0.0% |
| $75,000 to $99,999 | 14 | 9.0% |
| $100,000 to $149,999 | 107 | 68.6% |
| $150,000 to $199,999 | 0 | 0.0% |
| $200,000+ | 0 | 0.0% |
Family Income by Famaliy Size in Slatedale
| Income Bracket | # Families | Median Income |
| 2-Person Families | 36 (23.1%) | $0 |
| 3-Person Families | 67 (42.9%) | $0 |
| 4-Person Families | 0 (0.0%) | $0 |
| 5-Person Families | 53 (34.0%) | $0 |
| 6-Person Families | 0 (0.0%) | $0 |
| 7+ Person Families | 0 (0.0%) | $0 |
| Total | 156 (100.0%) | $116,343 |
Family Income by Number of Earners in Slatedale
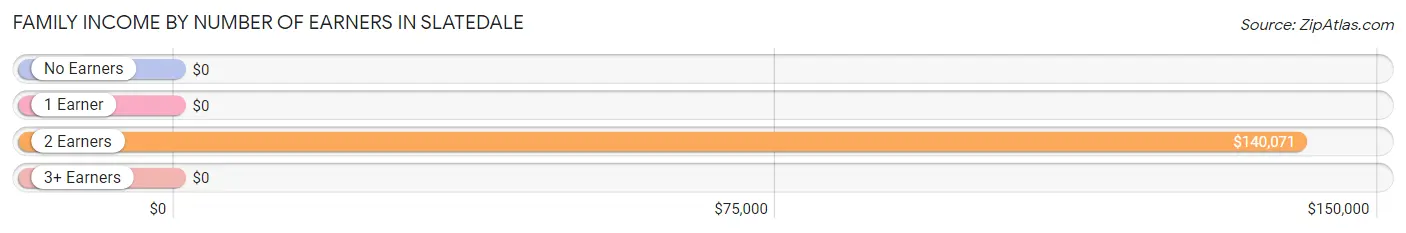
| Number of Earners | # Families | Median Income |
| No Earners | 0 (0.0%) | $0 |
| 1 Earner | 35 (22.4%) | $0 |
| 2 Earners | 103 (66.0%) | $140,071 |
| 3+ Earners | 18 (11.5%) | $0 |
| Total | 156 (100.0%) | $116,343 |
Household Income in Slatedale
Household Income Brackets in Slatedale
With 107 households falling in the category, the $100,000 to $149,999 income range is the most frequent in Slatedale, accounting for 64.1% of all households.
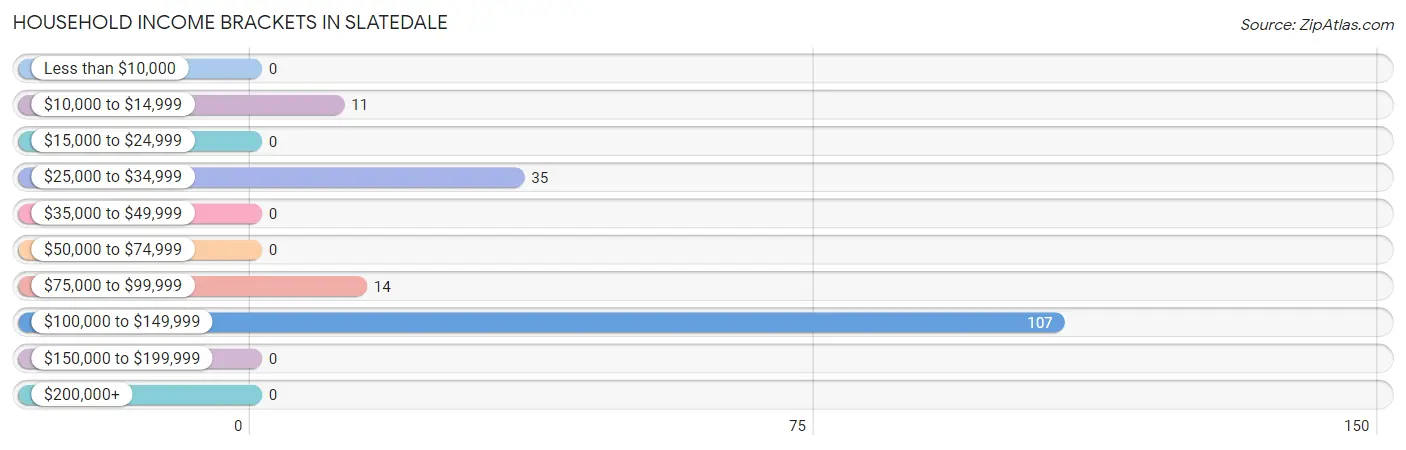
| Income Bracket | # Households | % Households |
| Less than $10,000 | 0 | 0.0% |
| $10,000 to $14,999 | 11 | 6.6% |
| $15,000 to $24,999 | 0 | 0.0% |
| $25,000 to $34,999 | 35 | 21.0% |
| $35,000 to $49,999 | 0 | 0.0% |
| $50,000 to $74,999 | 0 | 0.0% |
| $75,000 to $99,999 | 14 | 8.4% |
| $100,000 to $149,999 | 107 | 64.1% |
| $150,000 to $199,999 | 0 | 0.0% |
| $200,000+ | 0 | 0.0% |
Household Income by Householder Age in Slatedale
The median household income in Slatedale is $116,088, with the highest median household income of $116,875 found in the 25 to 44 years age bracket for the primary householder. A total of 124 households (74.3%) fall into this category.
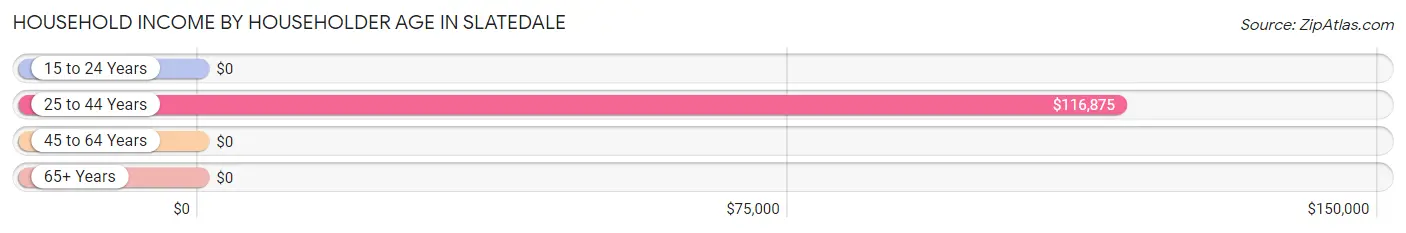
| Income Bracket | # Households | Median Income |
| 15 to 24 Years | 0 (0.0%) | $0 |
| 25 to 44 Years | 124 (74.3%) | $116,875 |
| 45 to 64 Years | 25 (15.0%) | $0 |
| 65+ Years | 18 (10.8%) | $0 |
| Total | 167 (100.0%) | $116,088 |
Poverty in Slatedale
Income Below Poverty by Sex and Age in Slatedale
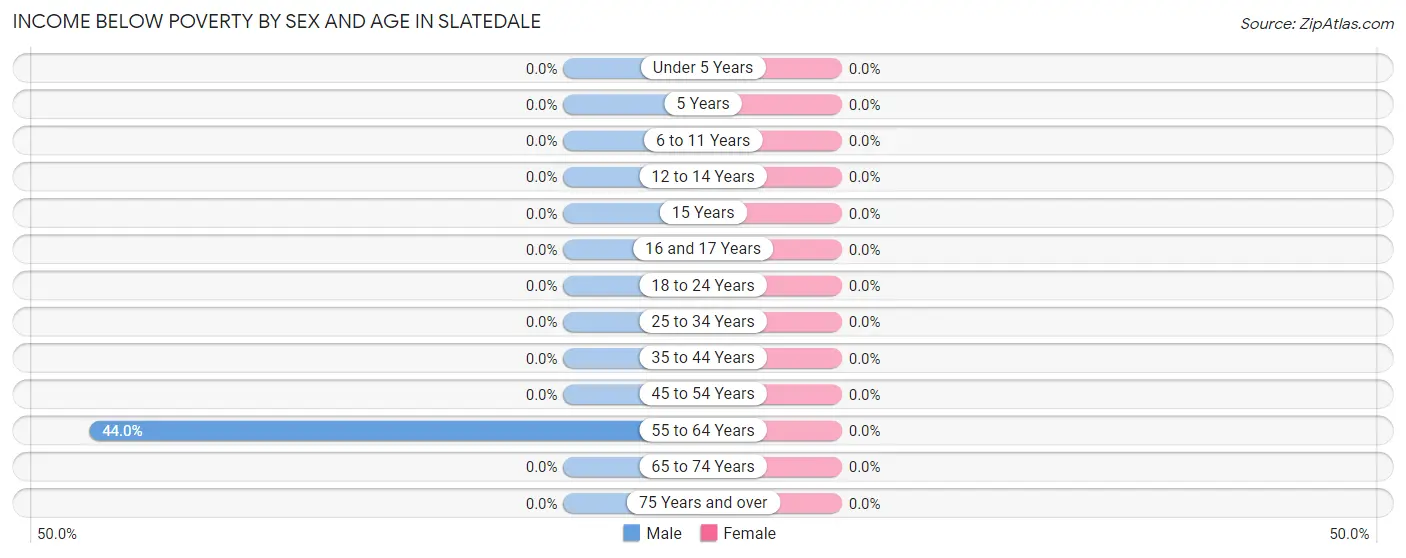
| Age Bracket | Male | Female |
| Under 5 Years | 0 (0.0%) | 0 (0.0%) |
| 5 Years | 0 (0.0%) | 0 (0.0%) |
| 6 to 11 Years | 0 (0.0%) | 0 (0.0%) |
| 12 to 14 Years | 0 (0.0%) | 0 (0.0%) |
| 15 Years | 0 (0.0%) | 0 (0.0%) |
| 16 and 17 Years | 0 (0.0%) | 0 (0.0%) |
| 18 to 24 Years | 0 (0.0%) | 0 (0.0%) |
| 25 to 34 Years | 0 (0.0%) | 0 (0.0%) |
| 35 to 44 Years | 0 (0.0%) | 0 (0.0%) |
| 45 to 54 Years | 0 (0.0%) | 0 (0.0%) |
| 55 to 64 Years | 11 (44.0%) | 0 (0.0%) |
| 65 to 74 Years | 0 (0.0%) | 0 (0.0%) |
| 75 Years and over | 0 (0.0%) | 0 (0.0%) |
| Total | 11 (3.6%) | 0 (0.0%) |
Income Above Poverty by Sex and Age in Slatedale
According to the poverty statistics in Slatedale, males aged under 5 years and females aged 6 to 11 years are the age groups that are most secure financially, with 100.0% of males and 100.0% of females in these age groups living above the poverty line.
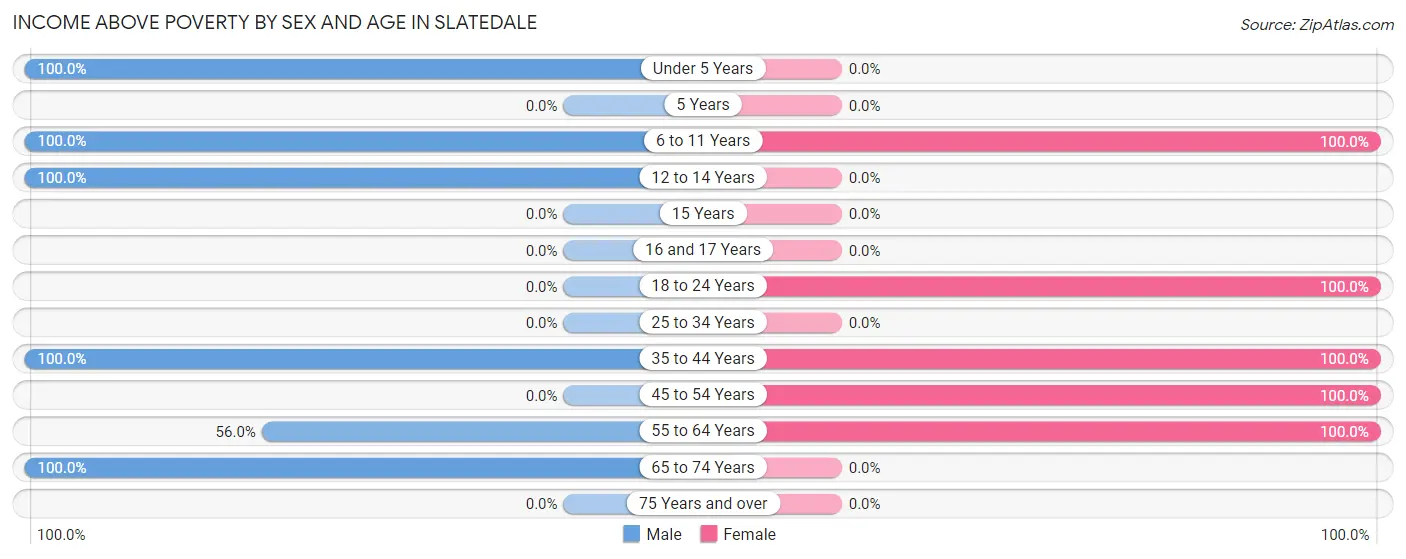
| Age Bracket | Male | Female |
| Under 5 Years | 52 (100.0%) | 0 (0.0%) |
| 5 Years | 0 (0.0%) | 0 (0.0%) |
| 6 to 11 Years | 51 (100.0%) | 53 (100.0%) |
| 12 to 14 Years | 34 (100.0%) | 0 (0.0%) |
| 15 Years | 0 (0.0%) | 0 (0.0%) |
| 16 and 17 Years | 0 (0.0%) | 0 (0.0%) |
| 18 to 24 Years | 0 (0.0%) | 37 (100.0%) |
| 25 to 34 Years | 0 (0.0%) | 0 (0.0%) |
| 35 to 44 Years | 124 (100.0%) | 88 (100.0%) |
| 45 to 54 Years | 0 (0.0%) | 54 (100.0%) |
| 55 to 64 Years | 14 (56.0%) | 14 (100.0%) |
| 65 to 74 Years | 18 (100.0%) | 0 (0.0%) |
| 75 Years and over | 0 (0.0%) | 0 (0.0%) |
| Total | 293 (96.4%) | 246 (100.0%) |
Income Below Poverty Among Married-Couple Families in Slatedale
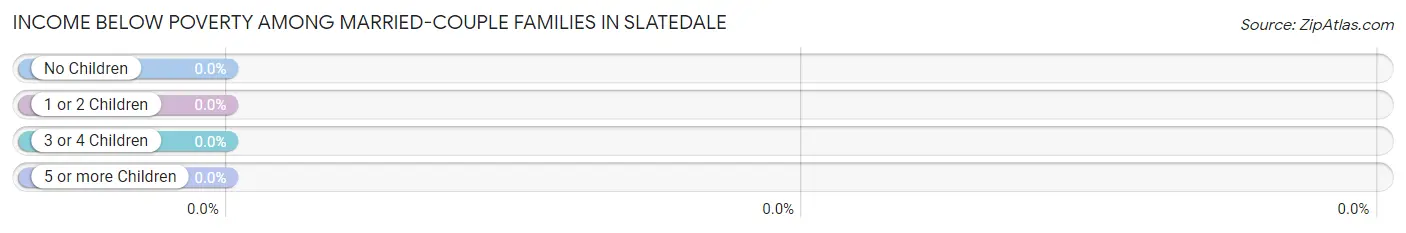
| Children | Above Poverty | Below Poverty |
| No Children | 68 (100.0%) | 0 (0.0%) |
| 1 or 2 Children | 35 (100.0%) | 0 (0.0%) |
| 3 or 4 Children | 53 (100.0%) | 0 (0.0%) |
| 5 or more Children | 0 (0.0%) | 0 (0.0%) |
| Total | 156 (100.0%) | 0 (0.0%) |
Income Below Poverty Among Single-Parent Households in Slatedale
| Children | Single Father | Single Mother |
| No Children | 0 (0.0%) | 0 (0.0%) |
| 1 or 2 Children | 0 (0.0%) | 0 (0.0%) |
| 3 or 4 Children | 0 (0.0%) | 0 (0.0%) |
| 5 or more Children | 0 (0.0%) | 0 (0.0%) |
| Total | 0 (0.0%) | 0 (0.0%) |
Income Below Poverty Among Married-Couple vs Single-Parent Households in Slatedale
| Children | Married-Couple Families | Single-Parent Households |
| No Children | 0 (0.0%) | 0 (0.0%) |
| 1 or 2 Children | 0 (0.0%) | 0 (0.0%) |
| 3 or 4 Children | 0 (0.0%) | 0 (0.0%) |
| 5 or more Children | 0 (0.0%) | 0 (0.0%) |
| Total | 0 (0.0%) | 0 (0.0%) |
Race in Slatedale
The most populous races in Slatedale are , and White / Caucasian (550 | 100.0%).
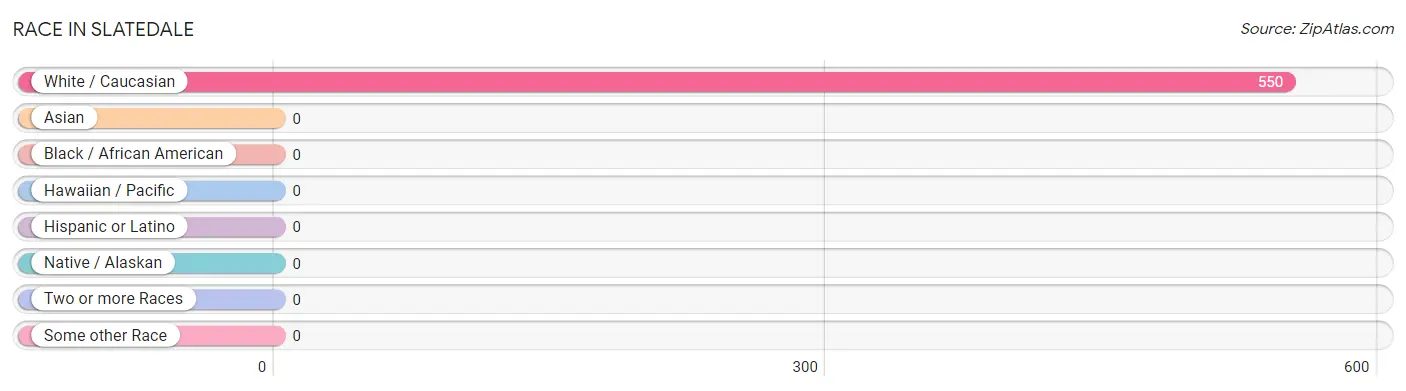
| Race | # Population | % Population |
| Asian | 0 | 0.0% |
| Black / African American | 0 | 0.0% |
| Hawaiian / Pacific | 0 | 0.0% |
| Hispanic or Latino | 0 | 0.0% |
| Native / Alaskan | 0 | 0.0% |
| White / Caucasian | 550 | 100.0% |
| Two or more Races | 0 | 0.0% |
| Some other Race | 0 | 0.0% |
| Total | 550 | 100.0% |
Ancestry in Slatedale
The most populous ancestries reported in Slatedale are Irish (263 | 47.8%), Italian (209 | 38.0%), German (162 | 29.4%), English (92 | 16.7%), and Polish (69 | 12.6%), together accounting for 144.6% of all Slatedale residents.
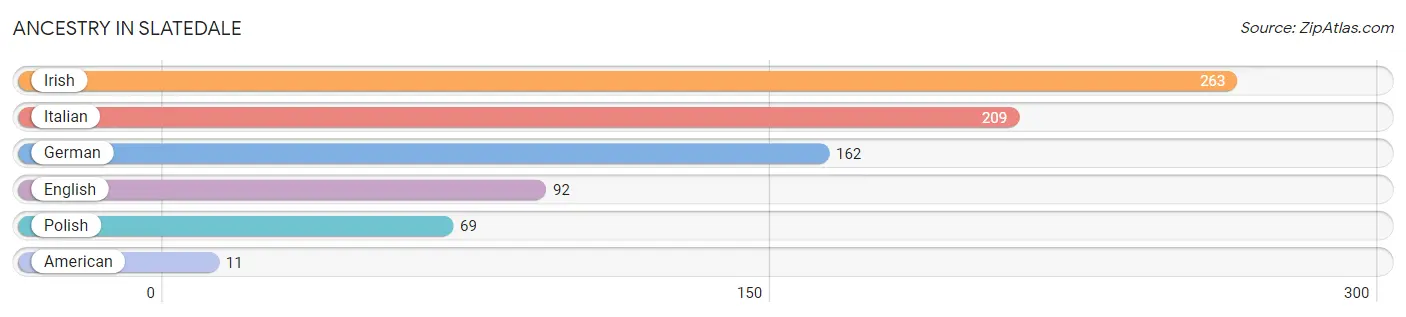
| Ancestry | # Population | % Population |
| American | 11 | 2.0% |
| English | 92 | 16.7% |
| German | 162 | 29.4% |
| Irish | 263 | 47.8% |
| Italian | 209 | 38.0% |
| Polish | 69 | 12.6% | View All 6 Rows |
Immigrants in Slatedale

| Immigration Origin | # Population | % Population | View All 0 Rows |
Sex and Age in Slatedale
Sex and Age in Slatedale
The most populous age groups in Slatedale are 40 to 44 Years (71 | 23.4%) for men and 45 to 49 Years (54 | 22.0%) for women.
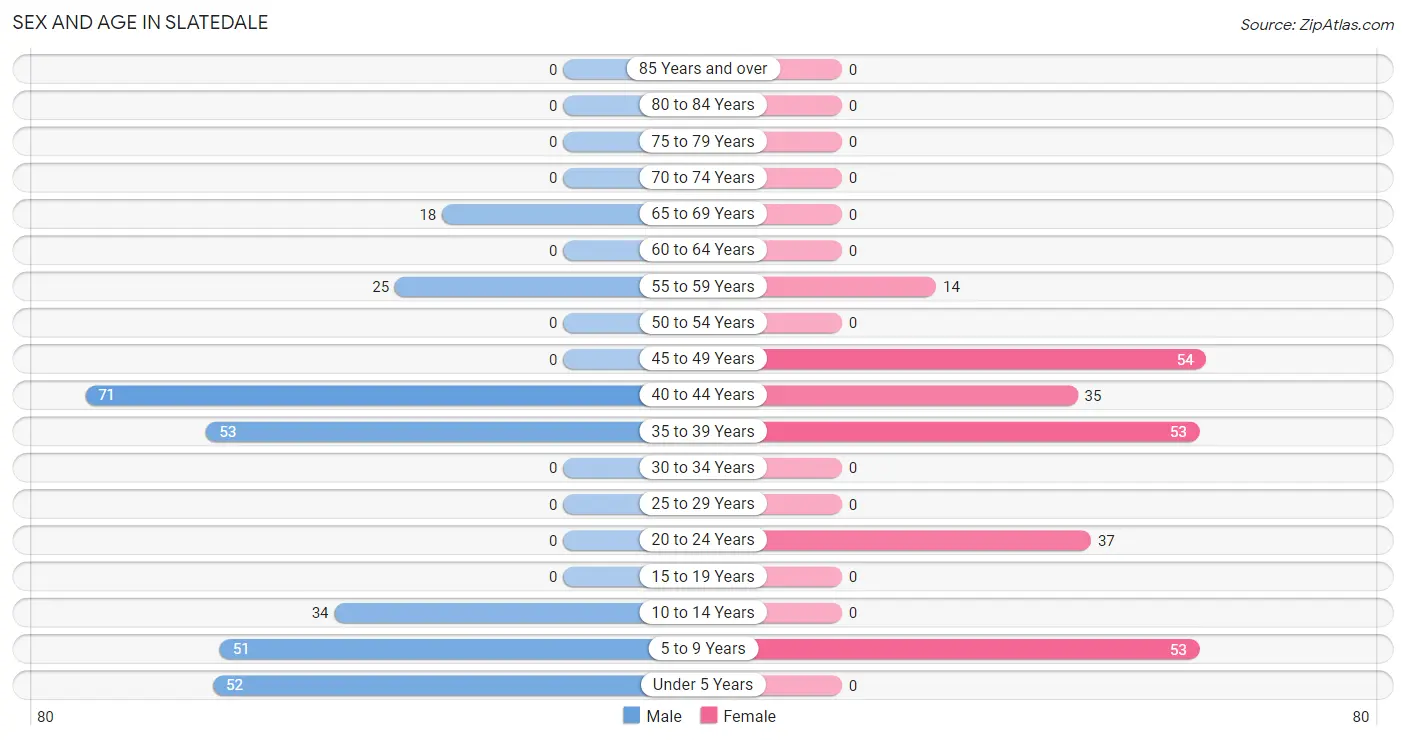
| Age Bracket | Male | Female |
| Under 5 Years | 52 (17.1%) | 0 (0.0%) |
| 5 to 9 Years | 51 (16.8%) | 53 (21.5%) |
| 10 to 14 Years | 34 (11.2%) | 0 (0.0%) |
| 15 to 19 Years | 0 (0.0%) | 0 (0.0%) |
| 20 to 24 Years | 0 (0.0%) | 37 (15.0%) |
| 25 to 29 Years | 0 (0.0%) | 0 (0.0%) |
| 30 to 34 Years | 0 (0.0%) | 0 (0.0%) |
| 35 to 39 Years | 53 (17.4%) | 53 (21.5%) |
| 40 to 44 Years | 71 (23.4%) | 35 (14.2%) |
| 45 to 49 Years | 0 (0.0%) | 54 (22.0%) |
| 50 to 54 Years | 0 (0.0%) | 0 (0.0%) |
| 55 to 59 Years | 25 (8.2%) | 14 (5.7%) |
| 60 to 64 Years | 0 (0.0%) | 0 (0.0%) |
| 65 to 69 Years | 18 (5.9%) | 0 (0.0%) |
| 70 to 74 Years | 0 (0.0%) | 0 (0.0%) |
| 75 to 79 Years | 0 (0.0%) | 0 (0.0%) |
| 80 to 84 Years | 0 (0.0%) | 0 (0.0%) |
| 85 Years and over | 0 (0.0%) | 0 (0.0%) |
| Total | 304 (100.0%) | 246 (100.0%) |
Families and Households in Slatedale
Median Family Size in Slatedale
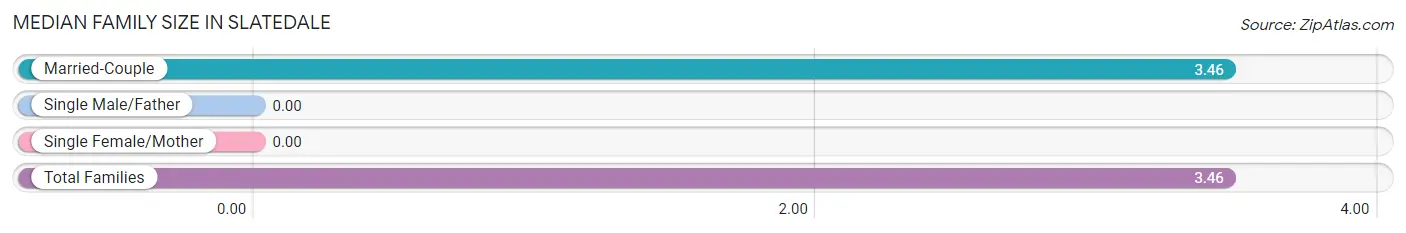
| Family Type | # Families | Family Size |
| Married-Couple | 156 (100.0%) | 3.46 |
| Single Male/Father | 0 (0.0%) | - |
| Single Female/Mother | 0 (0.0%) | - |
| Total Families | 156 (100.0%) | 3.46 |
Median Household Size in Slatedale
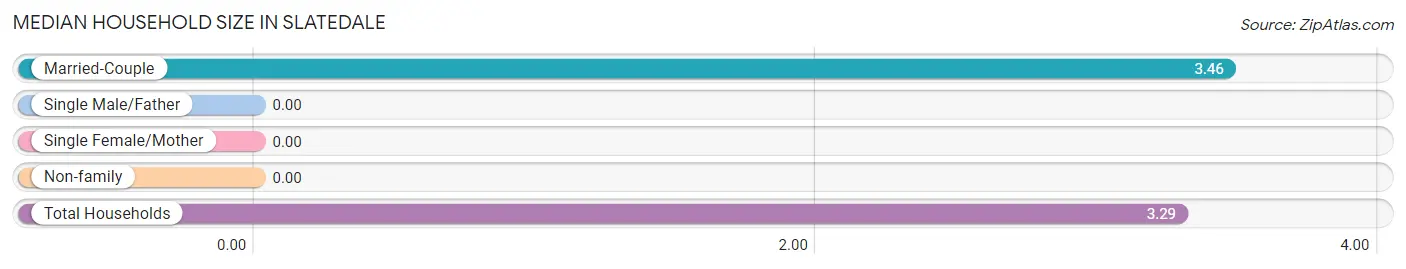
| Household Type | # Households | Household Size |
| Married-Couple | 156 (93.4%) | 3.46 |
| Single Male/Father | 0 (0.0%) | - |
| Single Female/Mother | 0 (0.0%) | - |
| Non-family | 11 (6.6%) | - |
| Total Households | 167 (100.0%) | 3.29 |
Household Size by Marriage Status in Slatedale
Out of a total of 167 households in Slatedale, 156 (93.4%) are family households, while 11 (6.6%) are nonfamily households. The most numerous type of family households are 3-person households, comprising 67, and the most common type of nonfamily households are 1-person households, comprising 11.
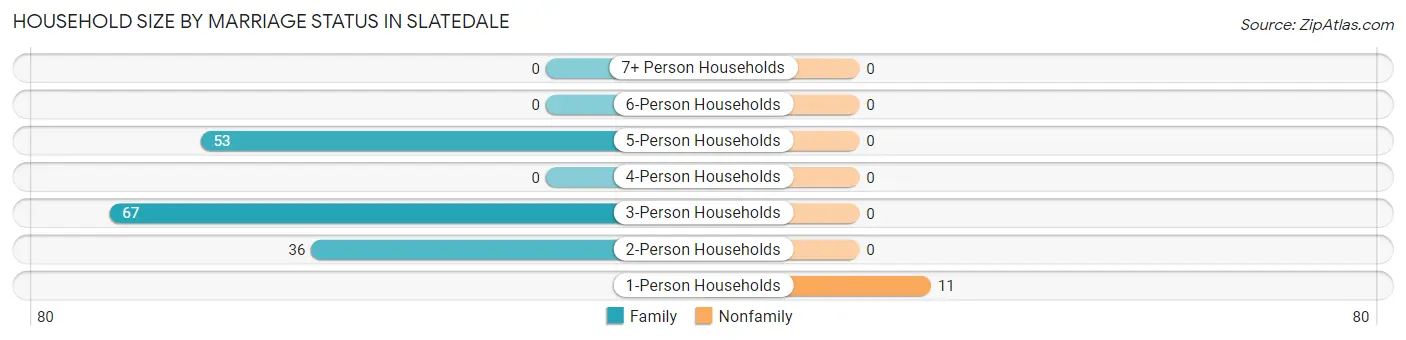
| Household Size | Family Households | Nonfamily Households |
| 1-Person Households | - | 11 (6.6%) |
| 2-Person Households | 36 (21.6%) | 0 (0.0%) |
| 3-Person Households | 67 (40.1%) | 0 (0.0%) |
| 4-Person Households | 0 (0.0%) | 0 (0.0%) |
| 5-Person Households | 53 (31.7%) | 0 (0.0%) |
| 6-Person Households | 0 (0.0%) | 0 (0.0%) |
| 7+ Person Households | 0 (0.0%) | 0 (0.0%) |
| Total | 156 (93.4%) | 11 (6.6%) |
Female Fertility in Slatedale
Fertility by Age in Slatedale
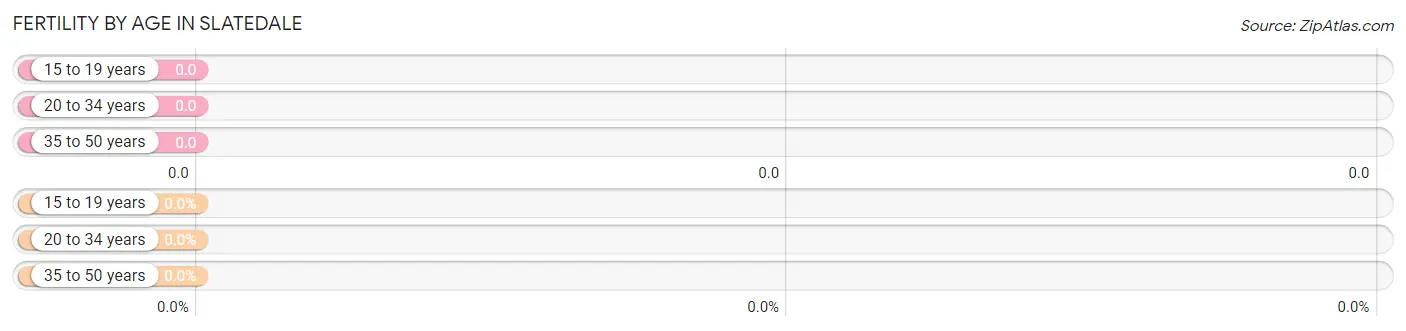
| Age Bracket | Women with Births | Births / 1,000 Women |
| 15 to 19 years | 0 (0.0%) | 0.0 |
| 20 to 34 years | 0 (0.0%) | 0.0 |
| 35 to 50 years | 0 (0.0%) | 0.0 |
| Total | 0 (0.0%) | 0.0 |
Fertility by Age by Marriage Status in Slatedale
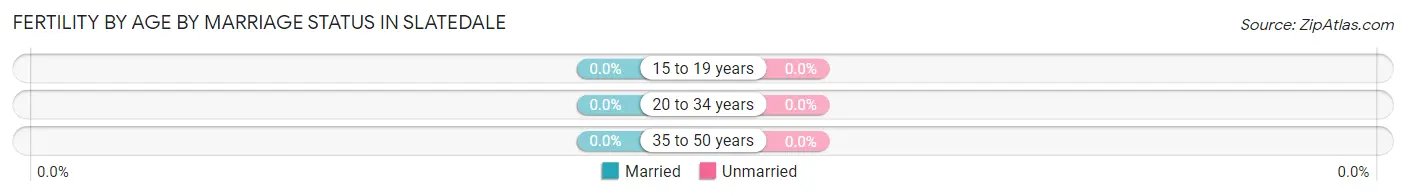
| Age Bracket | Married | Unmarried |
| 15 to 19 years | 0 (0.0%) | 0 (0.0%) |
| 20 to 34 years | 0 (0.0%) | 0 (0.0%) |
| 35 to 50 years | 0 (0.0%) | 0 (0.0%) |
| Total | 0 (0.0%) | 0 (0.0%) |
Fertility by Education in Slatedale
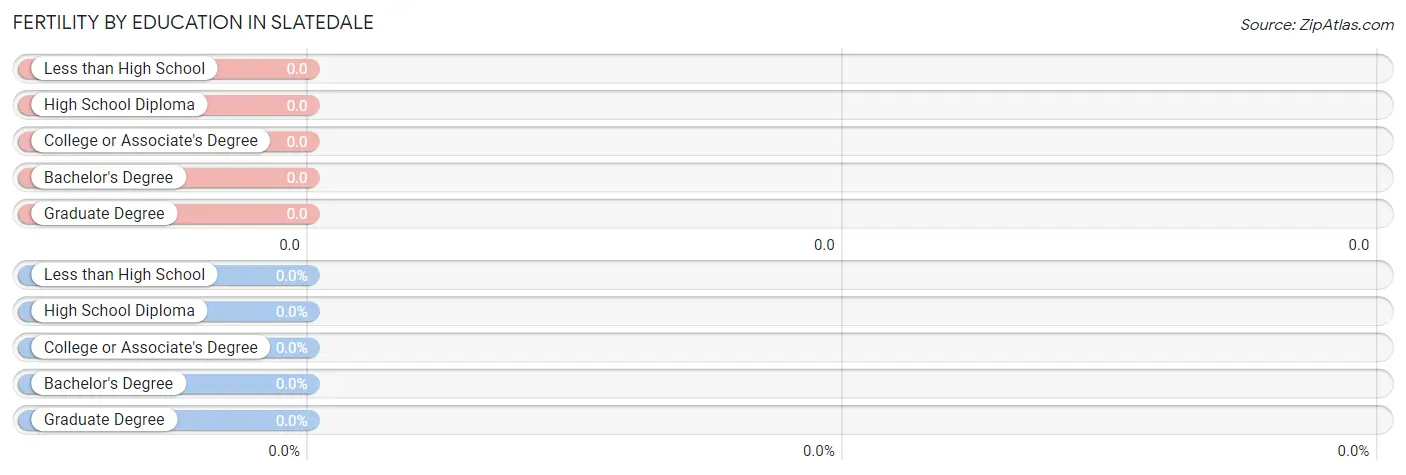
| Educational Attainment | Women with Births | Births / 1,000 Women |
| Less than High School | 0 (0.0%) | 0.0 |
| High School Diploma | 0 (0.0%) | 0.0 |
| College or Associate's Degree | 0 (0.0%) | 0.0 |
| Bachelor's Degree | 0 (0.0%) | 0.0 |
| Graduate Degree | 0 (0.0%) | 0.0 |
| Total | 0 (0.0%) | 0.0 |
Fertility by Education by Marriage Status in Slatedale
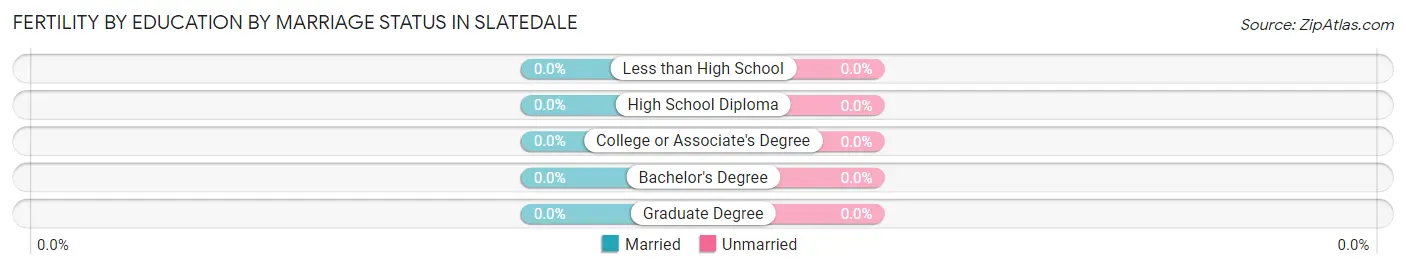
| Educational Attainment | Married | Unmarried |
| Less than High School | 0 (0.0%) | 0 (0.0%) |
| High School Diploma | 0 (0.0%) | 0 (0.0%) |
| College or Associate's Degree | 0 (0.0%) | 0 (0.0%) |
| Bachelor's Degree | 0 (0.0%) | 0 (0.0%) |
| Graduate Degree | 0 (0.0%) | 0 (0.0%) |
| Total | 0 (0.0%) | 0 (0.0%) |
Employment Characteristics in Slatedale
Employment by Class of Employer in Slatedale
Among the 308 employed individuals in Slatedale, private company employees (294 | 95.5%), and self-employed (not incorporated) (14 | 4.5%) make up the most common classes of employment.
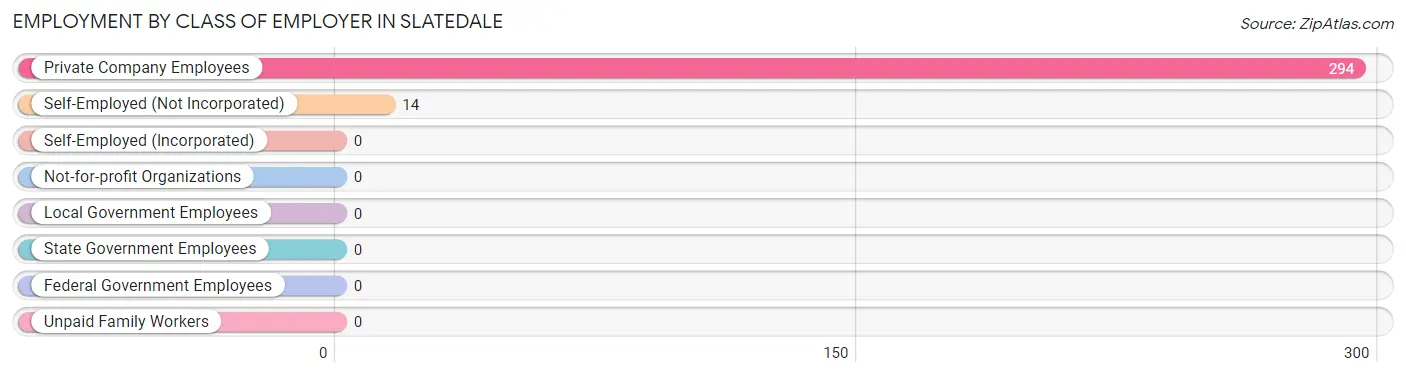
| Employer Class | # Employees | % Employees |
| Private Company Employees | 294 | 95.5% |
| Self-Employed (Incorporated) | 0 | 0.0% |
| Self-Employed (Not Incorporated) | 14 | 4.5% |
| Not-for-profit Organizations | 0 | 0.0% |
| Local Government Employees | 0 | 0.0% |
| State Government Employees | 0 | 0.0% |
| Federal Government Employees | 0 | 0.0% |
| Unpaid Family Workers | 0 | 0.0% |
| Total | 308 | 100.0% |
Employment Status by Age in Slatedale
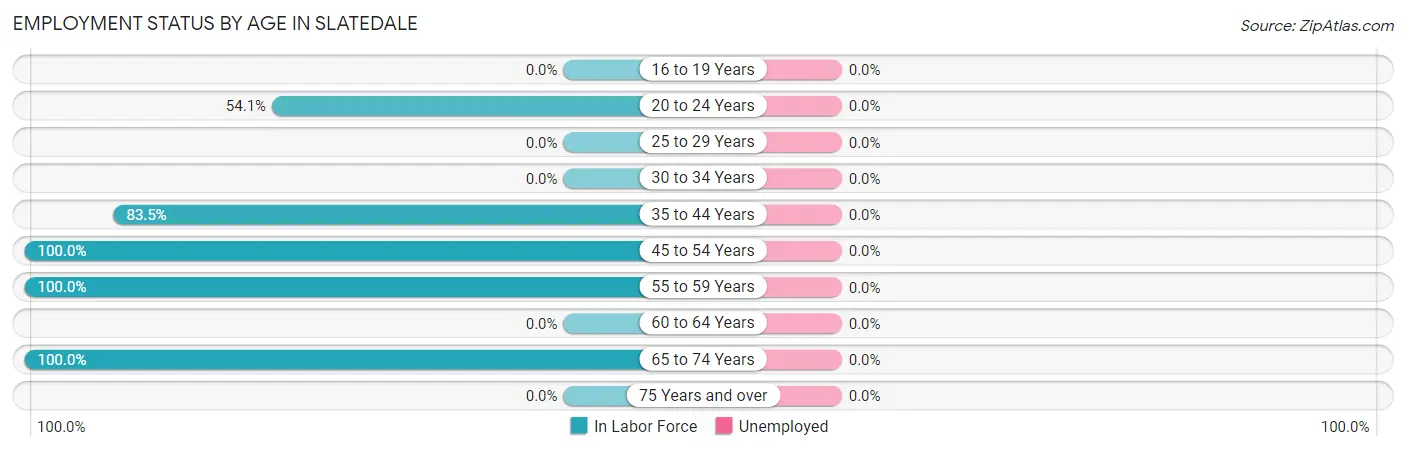
| Age Bracket | In Labor Force | Unemployed |
| 16 to 19 Years | 0 (0.0%) | 0 (0.0%) |
| 20 to 24 Years | 20 (54.1%) | 0 (0.0%) |
| 25 to 29 Years | 0 (0.0%) | 0 (0.0%) |
| 30 to 34 Years | 0 (0.0%) | 0 (0.0%) |
| 35 to 44 Years | 177 (83.5%) | 0 (0.0%) |
| 45 to 54 Years | 54 (100.0%) | 0 (0.0%) |
| 55 to 59 Years | 39 (100.0%) | 0 (0.0%) |
| 60 to 64 Years | 0 (0.0%) | 0 (0.0%) |
| 65 to 74 Years | 18 (100.0%) | 0 (0.0%) |
| 75 Years and over | 0 (0.0%) | 0 (0.0%) |
| Total | 308 (85.6%) | 0 (0.0%) |
Employment Status by Educational Attainment in Slatedale
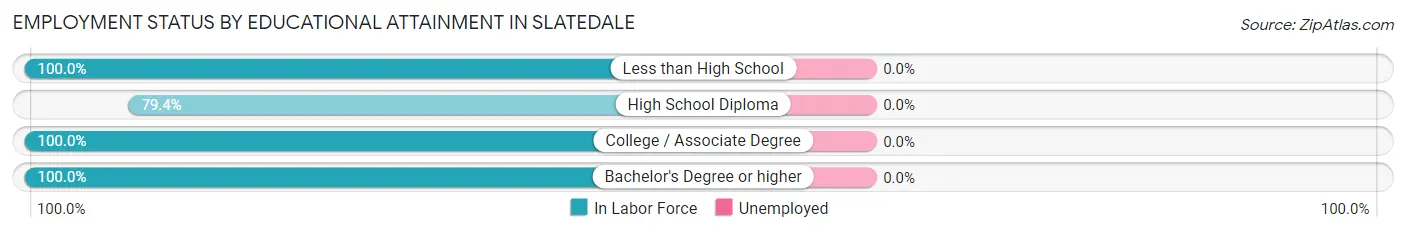
| Educational Attainment | In Labor Force | Unemployed |
| Less than High School | 11 (100.0%) | 0 (0.0%) |
| High School Diploma | 135 (79.4%) | 0 (0.0%) |
| College / Associate Degree | 18 (100.0%) | 0 (0.0%) |
| Bachelor's Degree or higher | 106 (100.0%) | 0 (0.0%) |
| Total | 270 (88.5%) | 0 (0.0%) |
Employment Occupations by Sex in Slatedale
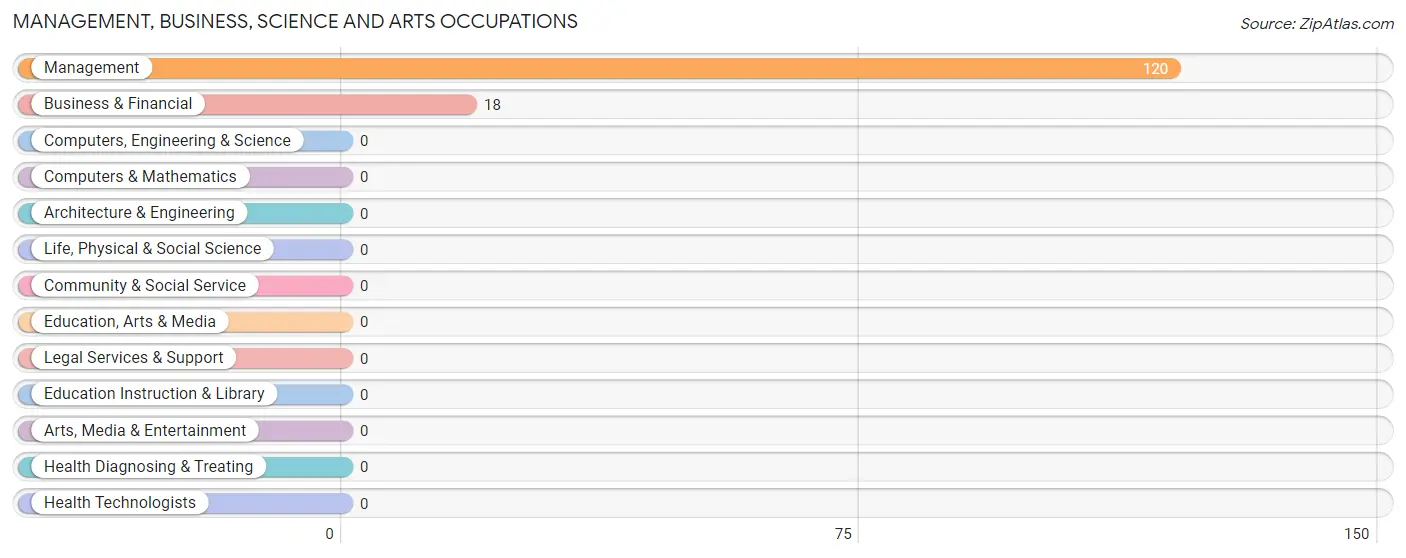
Management, Business, Science and Arts Occupations
The most common Management, Business, Science and Arts occupations in Slatedale are Management (120 | 39.0%), and Business & Financial (18 | 5.8%).
Management, Business, Science and Arts Occupations by Sex
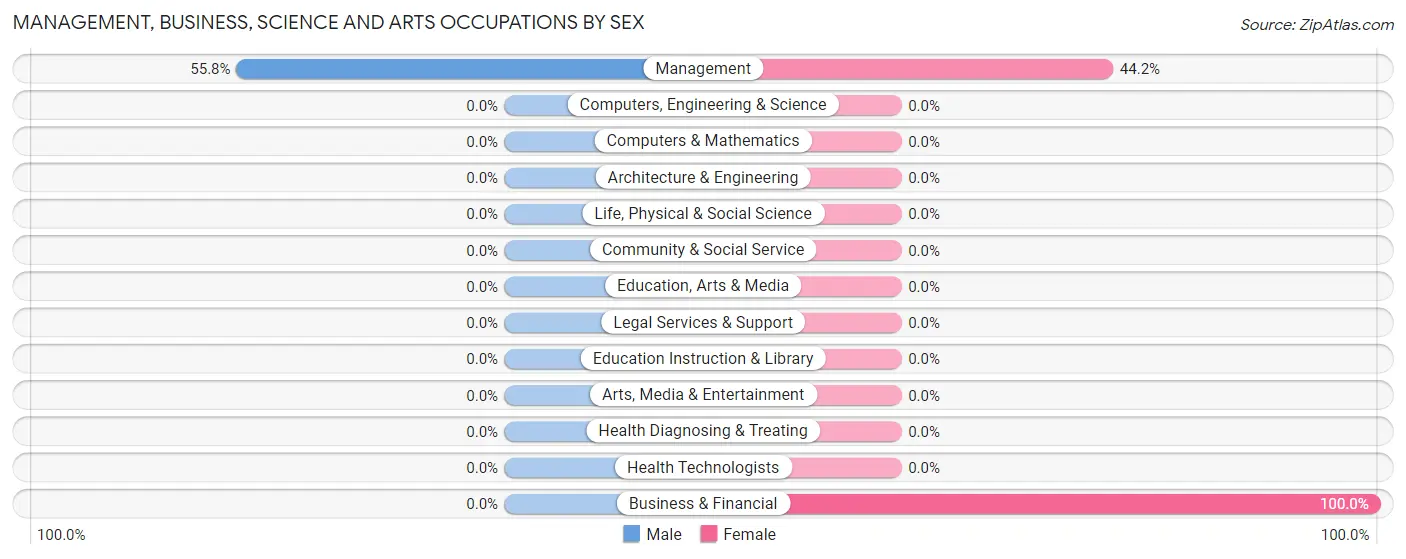
| Occupation | Male | Female |
| Management | 67 (55.8%) | 53 (44.2%) |
| Business & Financial | 0 (0.0%) | 18 (100.0%) |
| Computers, Engineering & Science | 0 (0.0%) | 0 (0.0%) |
| Computers & Mathematics | 0 (0.0%) | 0 (0.0%) |
| Architecture & Engineering | 0 (0.0%) | 0 (0.0%) |
| Life, Physical & Social Science | 0 (0.0%) | 0 (0.0%) |
| Community & Social Service | 0 (0.0%) | 0 (0.0%) |
| Education, Arts & Media | 0 (0.0%) | 0 (0.0%) |
| Legal Services & Support | 0 (0.0%) | 0 (0.0%) |
| Education Instruction & Library | 0 (0.0%) | 0 (0.0%) |
| Arts, Media & Entertainment | 0 (0.0%) | 0 (0.0%) |
| Health Diagnosing & Treating | 0 (0.0%) | 0 (0.0%) |
| Health Technologists | 0 (0.0%) | 0 (0.0%) |
| Total (Category) | 67 (48.5%) | 71 (51.4%) |
| Total (Overall) | 132 (42.9%) | 176 (57.1%) |
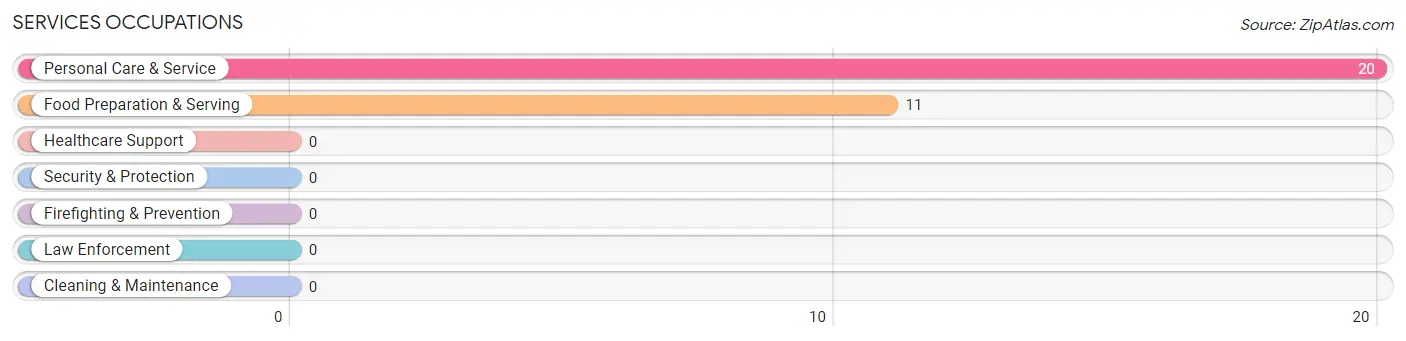
Services Occupations
The most common Services occupations in Slatedale are Personal Care & Service (20 | 6.5%), and Food Preparation & Serving (11 | 3.6%).
Services Occupations by Sex
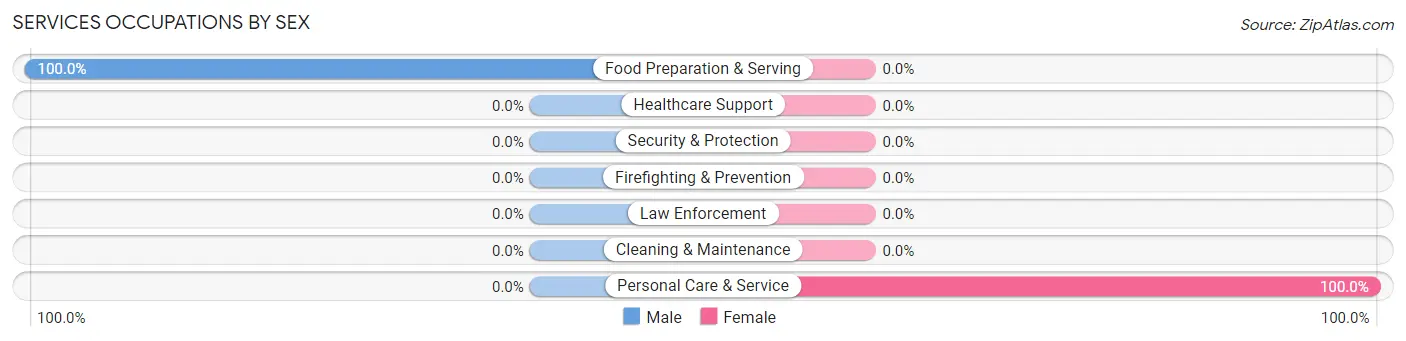
| Occupation | Male | Female |
| Healthcare Support | 0 (0.0%) | 0 (0.0%) |
| Security & Protection | 0 (0.0%) | 0 (0.0%) |
| Firefighting & Prevention | 0 (0.0%) | 0 (0.0%) |
| Law Enforcement | 0 (0.0%) | 0 (0.0%) |
| Food Preparation & Serving | 11 (100.0%) | 0 (0.0%) |
| Cleaning & Maintenance | 0 (0.0%) | 0 (0.0%) |
| Personal Care & Service | 0 (0.0%) | 20 (100.0%) |
| Total (Category) | 11 (35.5%) | 20 (64.5%) |
| Total (Overall) | 132 (42.9%) | 176 (57.1%) |
Sales and Office Occupations
The most common Sales and Office occupations in Slatedale are Sales & Related (50 | 16.2%), and Office & Administration (35 | 11.4%).
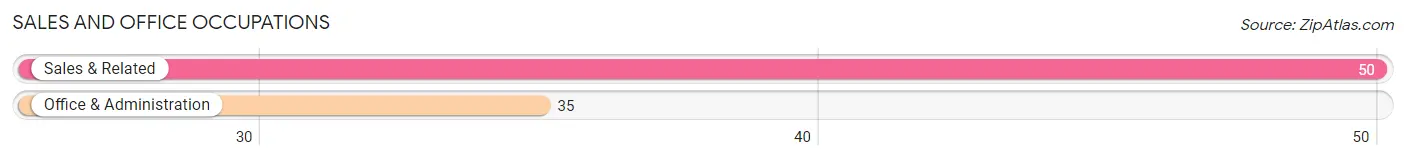
Sales and Office Occupations by Sex
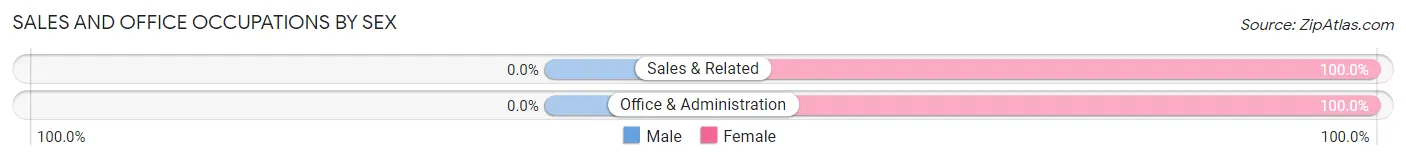
| Occupation | Male | Female |
| Sales & Related | 0 (0.0%) | 50 (100.0%) |
| Office & Administration | 0 (0.0%) | 35 (100.0%) |
| Total (Category) | 0 (0.0%) | 85 (100.0%) |
| Total (Overall) | 132 (42.9%) | 176 (57.1%) |
Natural Resources, Construction and Maintenance Occupations
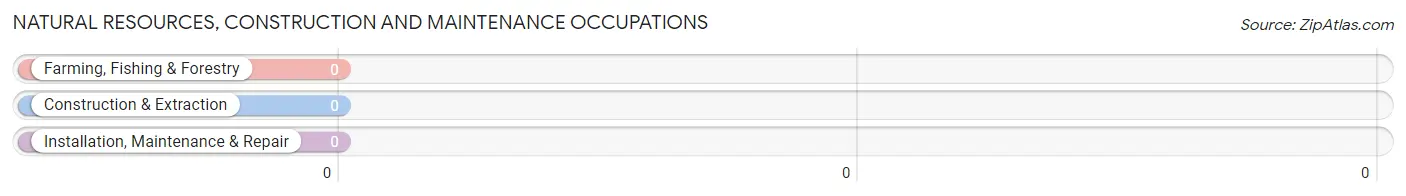
Natural Resources, Construction and Maintenance Occupations by Sex
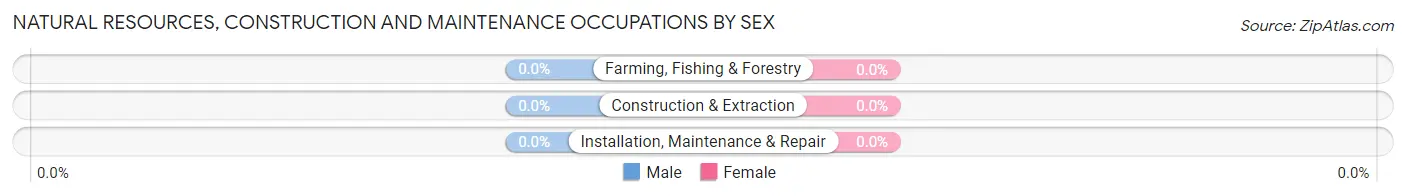
| Occupation | Male | Female |
| Farming, Fishing & Forestry | 0 (0.0%) | 0 (0.0%) |
| Construction & Extraction | 0 (0.0%) | 0 (0.0%) |
| Installation, Maintenance & Repair | 0 (0.0%) | 0 (0.0%) |
| Total (Category) | 0 (0.0%) | 0 (0.0%) |
| Total (Overall) | 132 (42.9%) | 176 (57.1%) |
Production, Transportation and Moving Occupations
The most common Production, Transportation and Moving occupations in Slatedale are Material Moving (36 | 11.7%), and Transportation (18 | 5.8%).
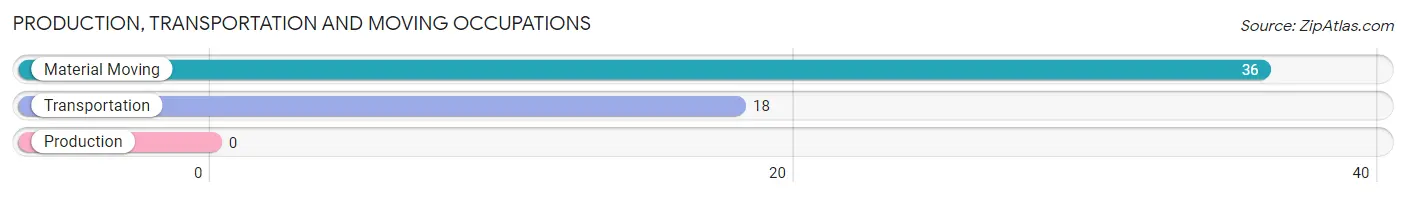
Production, Transportation and Moving Occupations by Sex
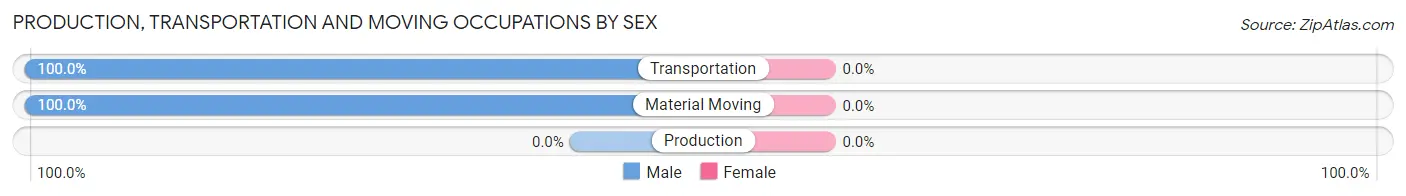
| Occupation | Male | Female |
| Production | 0 (0.0%) | 0 (0.0%) |
| Transportation | 18 (100.0%) | 0 (0.0%) |
| Material Moving | 36 (100.0%) | 0 (0.0%) |
| Total (Category) | 54 (100.0%) | 0 (0.0%) |
| Total (Overall) | 132 (42.9%) | 176 (57.1%) |
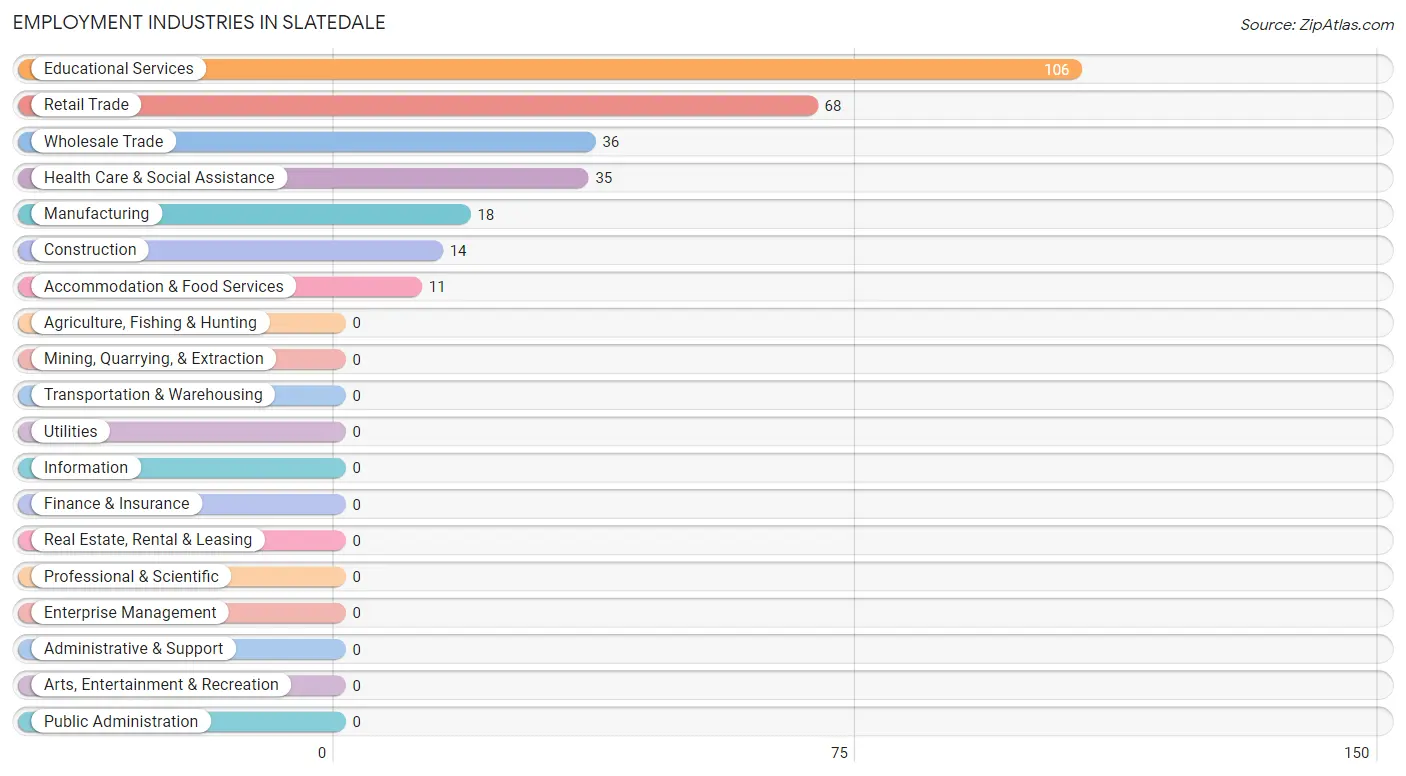
Employment Industries by Sex in Slatedale
Employment Industries in Slatedale
The major employment industries in Slatedale include Educational Services (106 | 34.4%), Retail Trade (68 | 22.1%), Wholesale Trade (36 | 11.7%), Health Care & Social Assistance (35 | 11.4%), and Manufacturing (18 | 5.8%).
Employment Industries by Sex in Slatedale
The Slatedale industries that see more men than women are Construction (100.0%), Wholesale Trade (100.0%), and Accommodation & Food Services (100.0%), whereas the industries that tend to have a higher number of women are Manufacturing (100.0%), Health Care & Social Assistance (100.0%), and Retail Trade (73.5%).
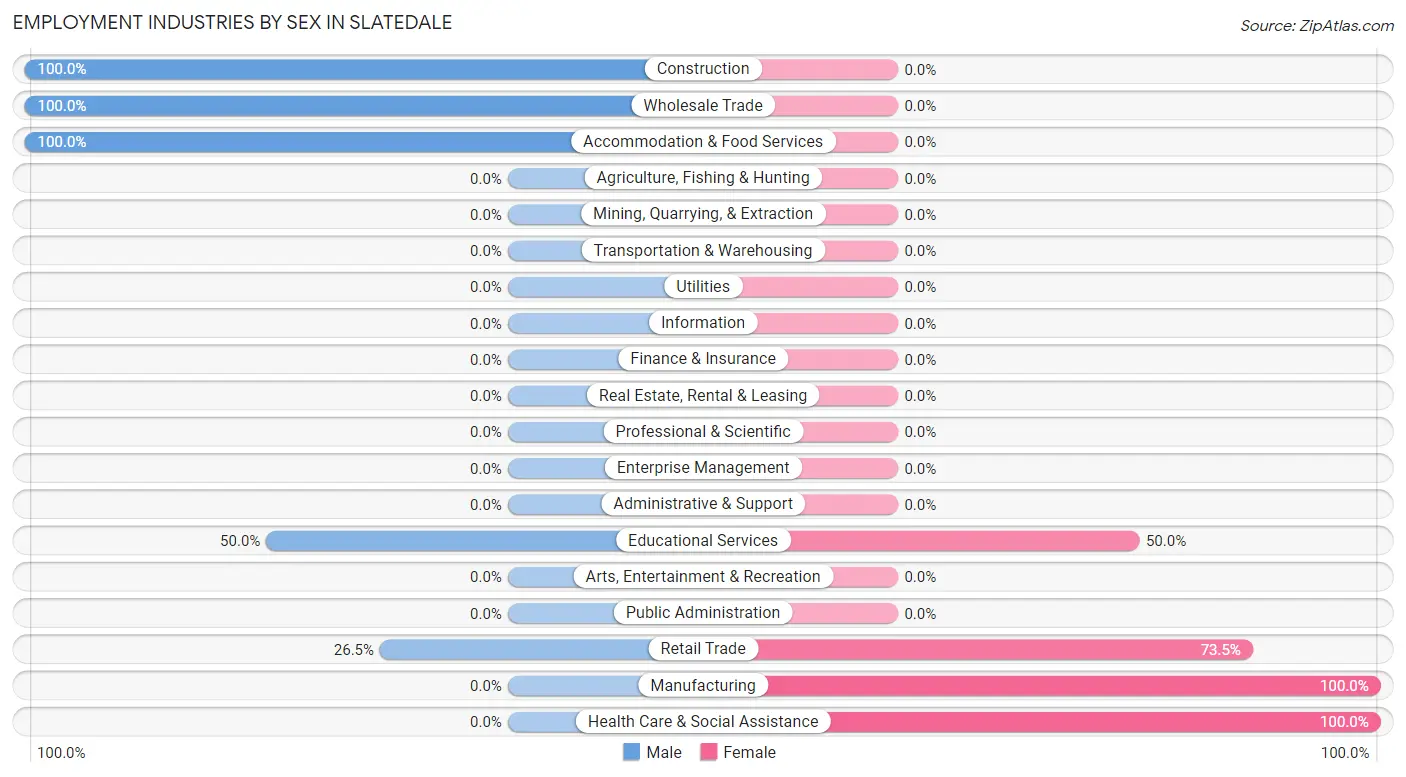
| Industry | Male | Female |
| Agriculture, Fishing & Hunting | 0 (0.0%) | 0 (0.0%) |
| Mining, Quarrying, & Extraction | 0 (0.0%) | 0 (0.0%) |
| Construction | 14 (100.0%) | 0 (0.0%) |
| Manufacturing | 0 (0.0%) | 18 (100.0%) |
| Wholesale Trade | 36 (100.0%) | 0 (0.0%) |
| Retail Trade | 18 (26.5%) | 50 (73.5%) |
| Transportation & Warehousing | 0 (0.0%) | 0 (0.0%) |
| Utilities | 0 (0.0%) | 0 (0.0%) |
| Information | 0 (0.0%) | 0 (0.0%) |
| Finance & Insurance | 0 (0.0%) | 0 (0.0%) |
| Real Estate, Rental & Leasing | 0 (0.0%) | 0 (0.0%) |
| Professional & Scientific | 0 (0.0%) | 0 (0.0%) |
| Enterprise Management | 0 (0.0%) | 0 (0.0%) |
| Administrative & Support | 0 (0.0%) | 0 (0.0%) |
| Educational Services | 53 (50.0%) | 53 (50.0%) |
| Health Care & Social Assistance | 0 (0.0%) | 35 (100.0%) |
| Arts, Entertainment & Recreation | 0 (0.0%) | 0 (0.0%) |
| Accommodation & Food Services | 11 (100.0%) | 0 (0.0%) |
| Public Administration | 0 (0.0%) | 0 (0.0%) |
| Total | 132 (42.9%) | 176 (57.1%) |
Education in Slatedale
School Enrollment in Slatedale
The most common levels of schooling among the 210 students in Slatedale are elementary school (104 | 49.5%), nursery / preschool (52 | 24.8%), and middle school (34 | 16.2%).
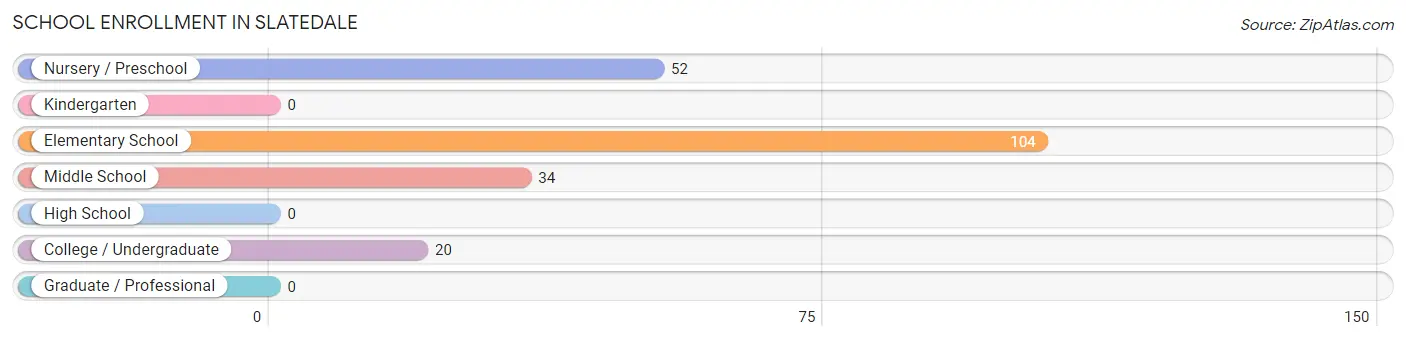
| School Level | # Students | % Students |
| Nursery / Preschool | 52 | 24.8% |
| Kindergarten | 0 | 0.0% |
| Elementary School | 104 | 49.5% |
| Middle School | 34 | 16.2% |
| High School | 0 | 0.0% |
| College / Undergraduate | 20 | 9.5% |
| Graduate / Professional | 0 | 0.0% |
| Total | 210 | 100.0% |
School Enrollment by Age by Funding Source in Slatedale
Out of a total of 210 students who are enrolled in schools in Slatedale, 156 (74.3%) attend a private institution, while the remaining 54 (25.7%) are enrolled in public schools. The age group of 3 to 4 year olds has the highest likelihood of being enrolled in private schools, with 52 (100.0% in the age bracket) enrolled. Conversely, the age group of 10 to 14 year olds has the lowest likelihood of being enrolled in a private school, with 34 (100.0% in the age bracket) attending a public institution.
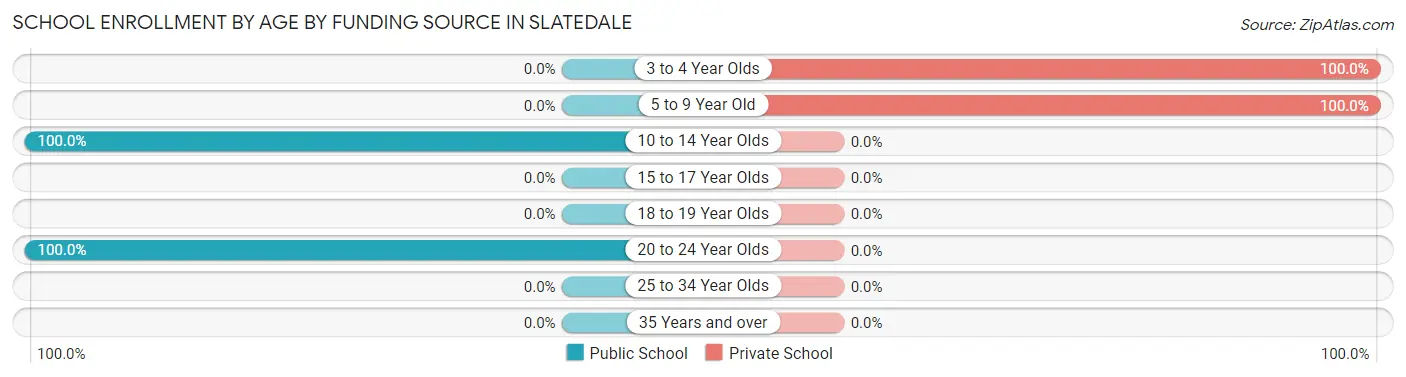
| Age Bracket | Public School | Private School |
| 3 to 4 Year Olds | 0 (0.0%) | 52 (100.0%) |
| 5 to 9 Year Old | 0 (0.0%) | 104 (100.0%) |
| 10 to 14 Year Olds | 34 (100.0%) | 0 (0.0%) |
| 15 to 17 Year Olds | 0 (0.0%) | 0 (0.0%) |
| 18 to 19 Year Olds | 0 (0.0%) | 0 (0.0%) |
| 20 to 24 Year Olds | 20 (100.0%) | 0 (0.0%) |
| 25 to 34 Year Olds | 0 (0.0%) | 0 (0.0%) |
| 35 Years and over | 0 (0.0%) | 0 (0.0%) |
| Total | 54 (25.7%) | 156 (74.3%) |
Educational Attainment by Field of Study in Slatedale
Business (53 | 42.7%), liberal arts & history (53 | 42.7%), and education (18 | 14.5%) are the most common fields of study among 124 individuals in Slatedale who have obtained a bachelor's degree or higher.
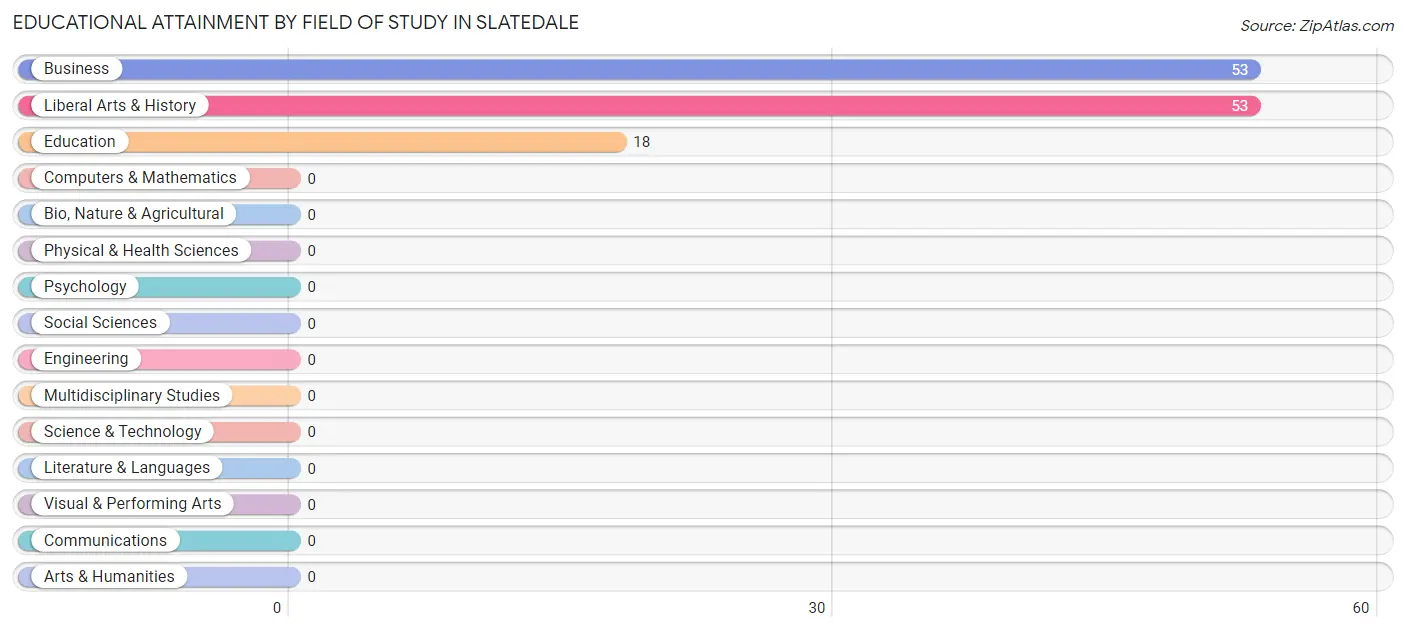
| Field of Study | # Graduates | % Graduates |
| Computers & Mathematics | 0 | 0.0% |
| Bio, Nature & Agricultural | 0 | 0.0% |
| Physical & Health Sciences | 0 | 0.0% |
| Psychology | 0 | 0.0% |
| Social Sciences | 0 | 0.0% |
| Engineering | 0 | 0.0% |
| Multidisciplinary Studies | 0 | 0.0% |
| Science & Technology | 0 | 0.0% |
| Business | 53 | 42.7% |
| Education | 18 | 14.5% |
| Literature & Languages | 0 | 0.0% |
| Liberal Arts & History | 53 | 42.7% |
| Visual & Performing Arts | 0 | 0.0% |
| Communications | 0 | 0.0% |
| Arts & Humanities | 0 | 0.0% |
| Total | 124 | 100.0% |
Transportation & Commute in Slatedale
Vehicle Availability by Sex in Slatedale
The most prevalent vehicle ownership categories in Slatedale are males with 2 vehicles (89, accounting for 67.4%) and females with 2 vehicles (124, making up 50.6%).
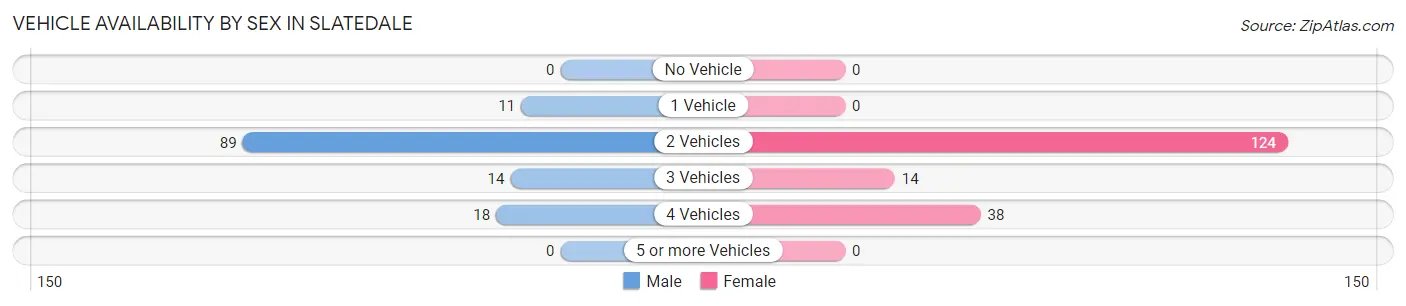
| Vehicles Available | Male | Female |
| No Vehicle | 0 (0.0%) | 0 (0.0%) |
| 1 Vehicle | 11 (8.3%) | 0 (0.0%) |
| 2 Vehicles | 89 (67.4%) | 124 (70.5%) |
| 3 Vehicles | 14 (10.6%) | 14 (8.0%) |
| 4 Vehicles | 18 (13.6%) | 38 (21.6%) |
| 5 or more Vehicles | 0 (0.0%) | 0 (0.0%) |
| Total | 132 (100.0%) | 176 (100.0%) |
Commute Time in Slatedale
The most frequently occuring commute durations in Slatedale are 40 to 44 minutes (106 commuters, 34.4%), 35 to 39 minutes (71 commuters, 23.1%), and 20 to 24 minutes (47 commuters, 15.3%).
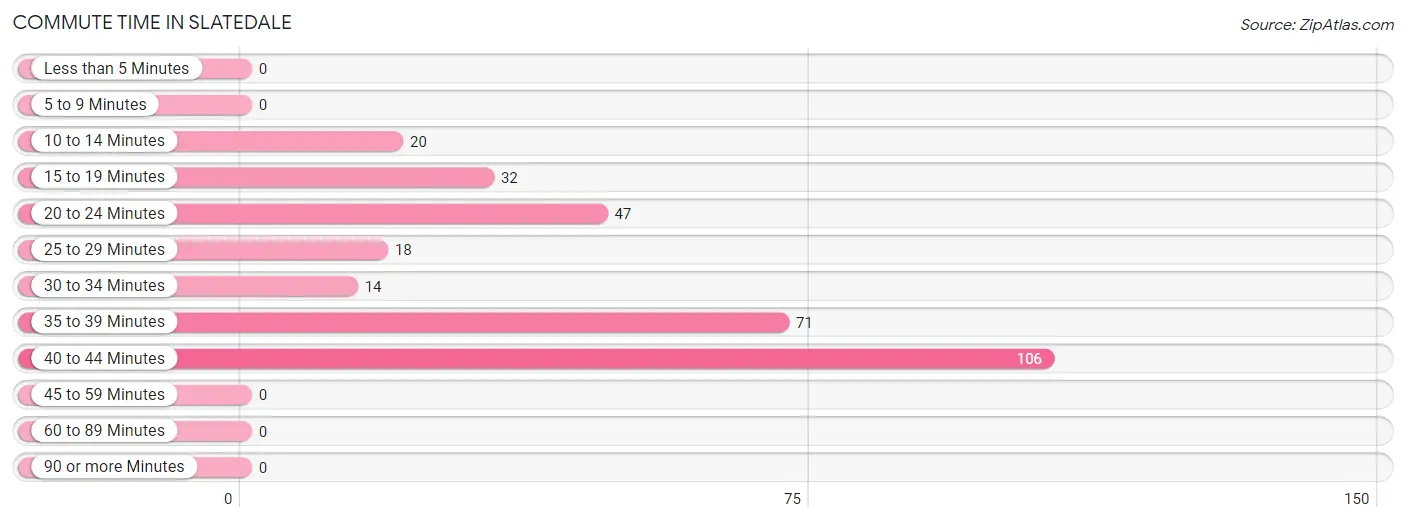
| Commute Time | # Commuters | % Commuters |
| Less than 5 Minutes | 0 | 0.0% |
| 5 to 9 Minutes | 0 | 0.0% |
| 10 to 14 Minutes | 20 | 6.5% |
| 15 to 19 Minutes | 32 | 10.4% |
| 20 to 24 Minutes | 47 | 15.3% |
| 25 to 29 Minutes | 18 | 5.8% |
| 30 to 34 Minutes | 14 | 4.5% |
| 35 to 39 Minutes | 71 | 23.1% |
| 40 to 44 Minutes | 106 | 34.4% |
| 45 to 59 Minutes | 0 | 0.0% |
| 60 to 89 Minutes | 0 | 0.0% |
| 90 or more Minutes | 0 | 0.0% |
Commute Time by Sex in Slatedale
The most common commute times in Slatedale are 40 to 44 minutes (53 commuters, 40.2%) for males and 40 to 44 minutes (53 commuters, 30.1%) for females.
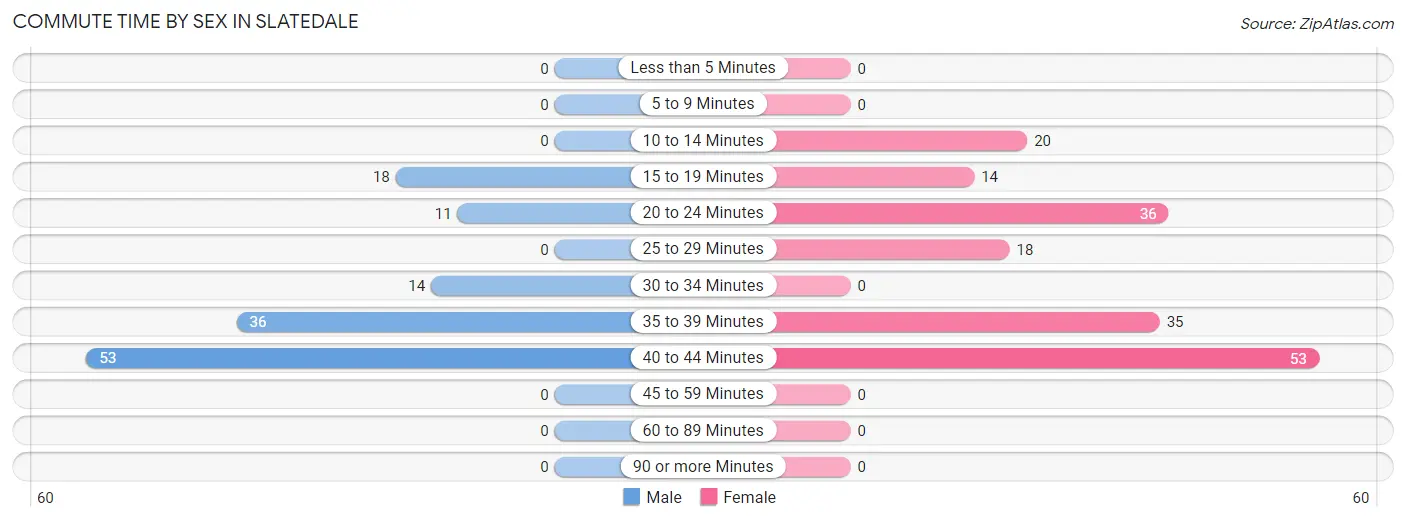
| Commute Time | Male | Female |
| Less than 5 Minutes | 0 (0.0%) | 0 (0.0%) |
| 5 to 9 Minutes | 0 (0.0%) | 0 (0.0%) |
| 10 to 14 Minutes | 0 (0.0%) | 20 (11.4%) |
| 15 to 19 Minutes | 18 (13.6%) | 14 (8.0%) |
| 20 to 24 Minutes | 11 (8.3%) | 36 (20.4%) |
| 25 to 29 Minutes | 0 (0.0%) | 18 (10.2%) |
| 30 to 34 Minutes | 14 (10.6%) | 0 (0.0%) |
| 35 to 39 Minutes | 36 (27.3%) | 35 (19.9%) |
| 40 to 44 Minutes | 53 (40.2%) | 53 (30.1%) |
| 45 to 59 Minutes | 0 (0.0%) | 0 (0.0%) |
| 60 to 89 Minutes | 0 (0.0%) | 0 (0.0%) |
| 90 or more Minutes | 0 (0.0%) | 0 (0.0%) |
Time of Departure to Work by Sex in Slatedale
The most frequent times of departure to work in Slatedale are 6:00 AM to 6:29 AM (89, 67.4%) for males and 7:30 AM to 7:59 AM (67, 38.1%) for females.
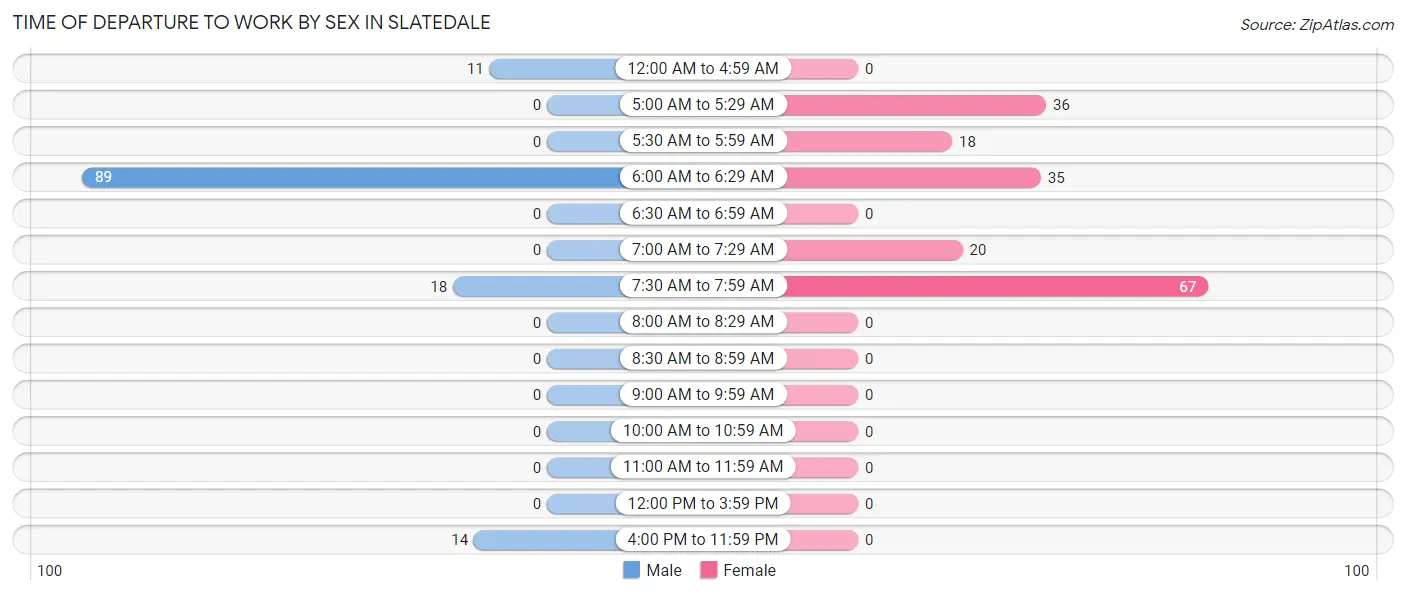
| Time of Departure | Male | Female |
| 12:00 AM to 4:59 AM | 11 (8.3%) | 0 (0.0%) |
| 5:00 AM to 5:29 AM | 0 (0.0%) | 36 (20.4%) |
| 5:30 AM to 5:59 AM | 0 (0.0%) | 18 (10.2%) |
| 6:00 AM to 6:29 AM | 89 (67.4%) | 35 (19.9%) |
| 6:30 AM to 6:59 AM | 0 (0.0%) | 0 (0.0%) |
| 7:00 AM to 7:29 AM | 0 (0.0%) | 20 (11.4%) |
| 7:30 AM to 7:59 AM | 18 (13.6%) | 67 (38.1%) |
| 8:00 AM to 8:29 AM | 0 (0.0%) | 0 (0.0%) |
| 8:30 AM to 8:59 AM | 0 (0.0%) | 0 (0.0%) |
| 9:00 AM to 9:59 AM | 0 (0.0%) | 0 (0.0%) |
| 10:00 AM to 10:59 AM | 0 (0.0%) | 0 (0.0%) |
| 11:00 AM to 11:59 AM | 0 (0.0%) | 0 (0.0%) |
| 12:00 PM to 3:59 PM | 0 (0.0%) | 0 (0.0%) |
| 4:00 PM to 11:59 PM | 14 (10.6%) | 0 (0.0%) |
| Total | 132 (100.0%) | 176 (100.0%) |
Housing Occupancy in Slatedale
Occupancy by Ownership in Slatedale
Of the total 167 dwellings in Slatedale, owner-occupied units account for 156 (93.4%), while renter-occupied units make up 11 (6.6%).
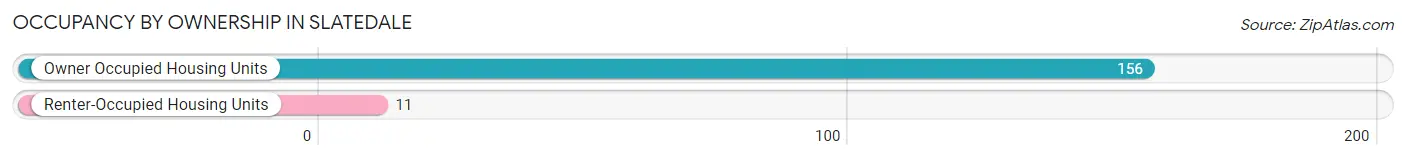
| Occupancy | # Housing Units | % Housing Units |
| Owner Occupied Housing Units | 156 | 93.4% |
| Renter-Occupied Housing Units | 11 | 6.6% |
| Total Occupied Housing Units | 167 | 100.0% |
Occupancy by Household Size in Slatedale
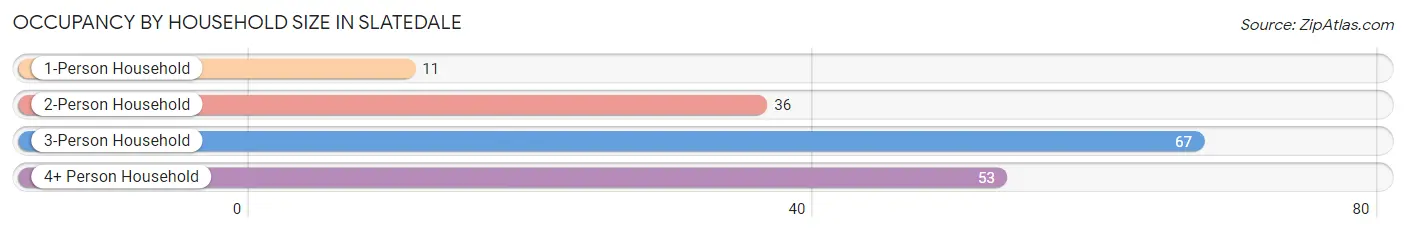
| Household Size | # Housing Units | % Housing Units |
| 1-Person Household | 11 | 6.6% |
| 2-Person Household | 36 | 21.6% |
| 3-Person Household | 67 | 40.1% |
| 4+ Person Household | 53 | 31.7% |
| Total Housing Units | 167 | 100.0% |
Occupancy by Ownership by Household Size in Slatedale
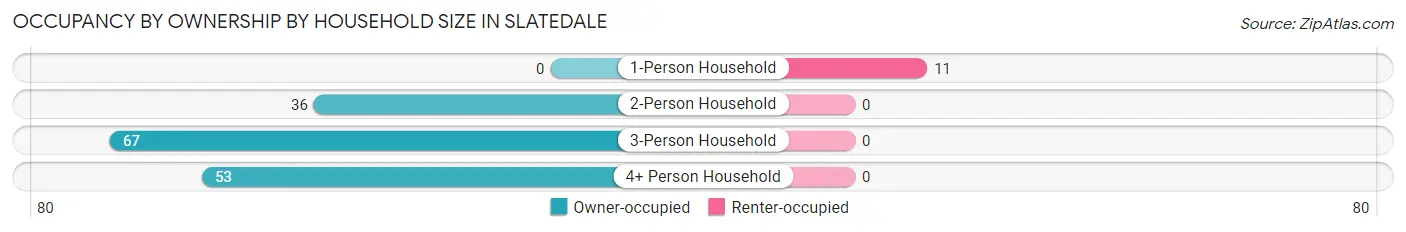
| Household Size | Owner-occupied | Renter-occupied |
| 1-Person Household | 0 (0.0%) | 11 (100.0%) |
| 2-Person Household | 36 (100.0%) | 0 (0.0%) |
| 3-Person Household | 67 (100.0%) | 0 (0.0%) |
| 4+ Person Household | 53 (100.0%) | 0 (0.0%) |
| Total Housing Units | 156 (93.4%) | 11 (6.6%) |
Occupancy by Educational Attainment in Slatedale
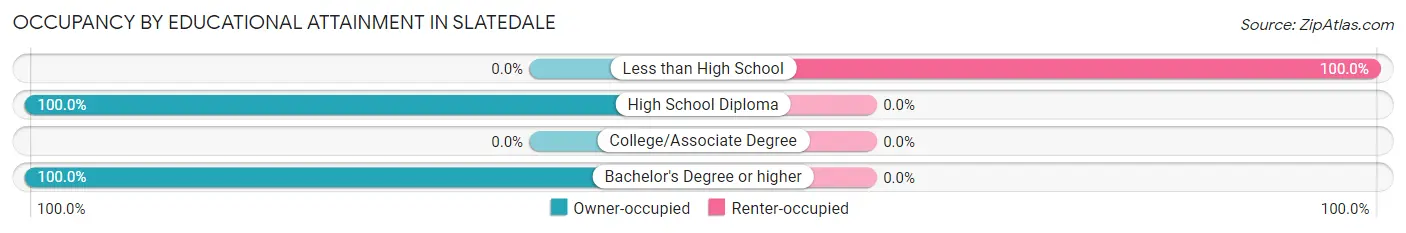
| Household Size | Owner-occupied | Renter-occupied |
| Less than High School | 0 (0.0%) | 11 (100.0%) |
| High School Diploma | 85 (100.0%) | 0 (0.0%) |
| College/Associate Degree | 0 (0.0%) | 0 (0.0%) |
| Bachelor's Degree or higher | 71 (100.0%) | 0 (0.0%) |
Occupancy by Age of Householder in Slatedale
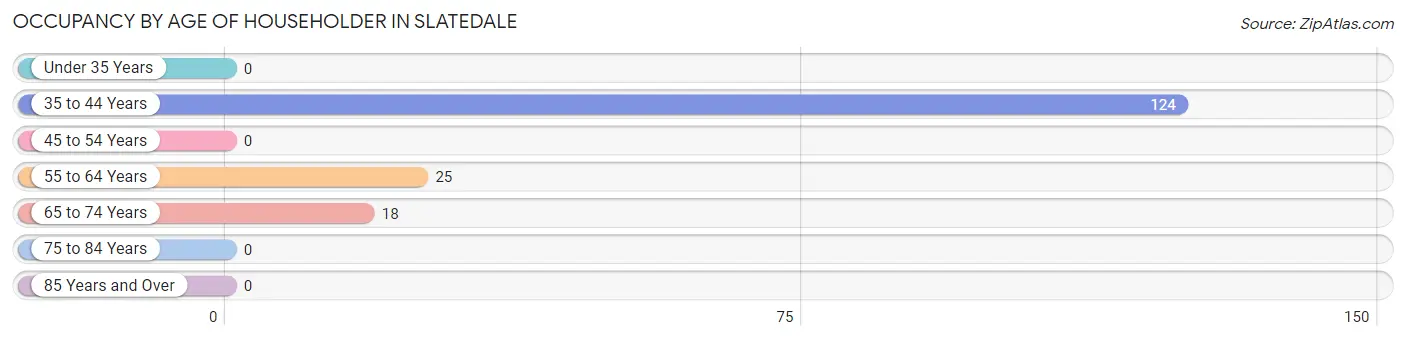
| Age Bracket | # Households | % Households |
| Under 35 Years | 0 | 0.0% |
| 35 to 44 Years | 124 | 74.3% |
| 45 to 54 Years | 0 | 0.0% |
| 55 to 64 Years | 25 | 15.0% |
| 65 to 74 Years | 18 | 10.8% |
| 75 to 84 Years | 0 | 0.0% |
| 85 Years and Over | 0 | 0.0% |
| Total | 167 | 100.0% |
Housing Finances in Slatedale
Median Income by Occupancy in Slatedale
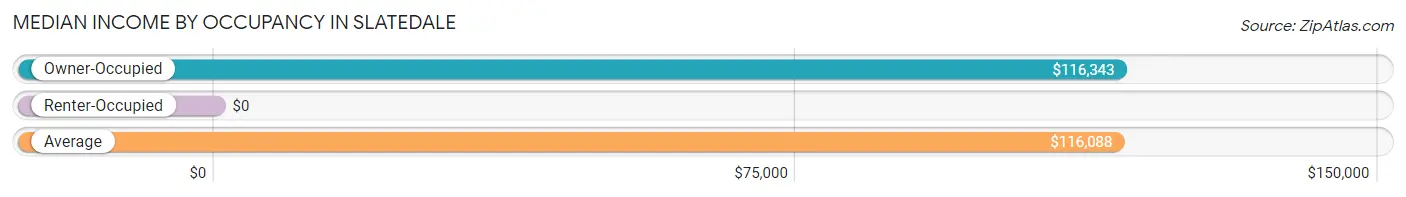
| Occupancy Type | # Households | Median Income |
| Owner-Occupied | 156 (93.4%) | $116,343 |
| Renter-Occupied | 11 (6.6%) | $0 |
| Average | 167 (100.0%) | $116,088 |
Occupancy by Householder Income Bracket in Slatedale
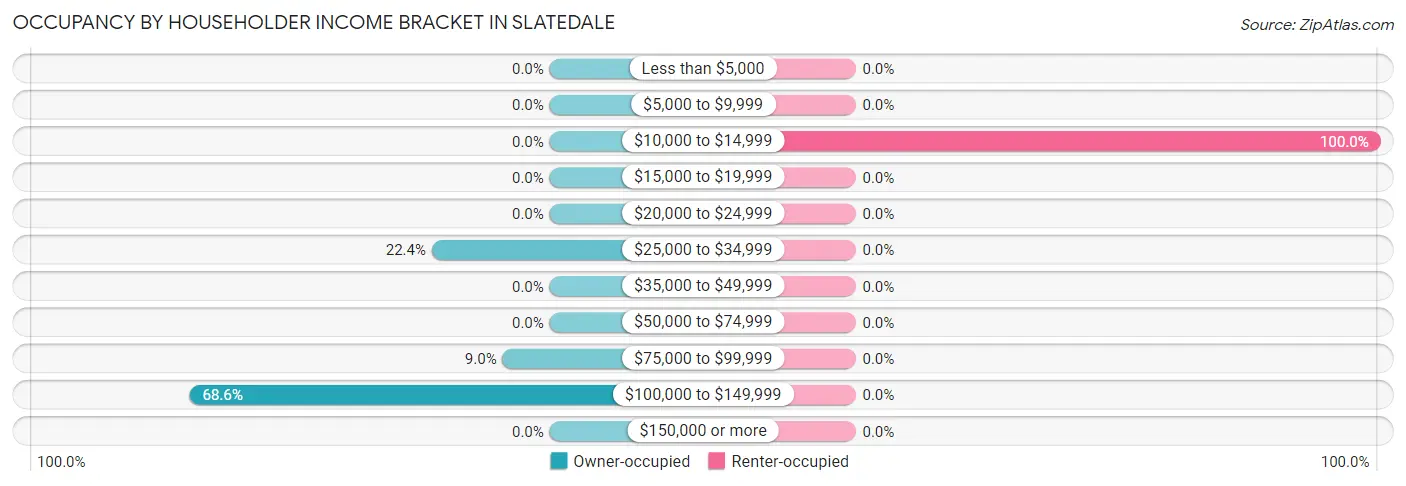
| Income Bracket | Owner-occupied | Renter-occupied |
| Less than $5,000 | 0 (0.0%) | 0 (0.0%) |
| $5,000 to $9,999 | 0 (0.0%) | 0 (0.0%) |
| $10,000 to $14,999 | 0 (0.0%) | 11 (100.0%) |
| $15,000 to $19,999 | 0 (0.0%) | 0 (0.0%) |
| $20,000 to $24,999 | 0 (0.0%) | 0 (0.0%) |
| $25,000 to $34,999 | 35 (22.4%) | 0 (0.0%) |
| $35,000 to $49,999 | 0 (0.0%) | 0 (0.0%) |
| $50,000 to $74,999 | 0 (0.0%) | 0 (0.0%) |
| $75,000 to $99,999 | 14 (9.0%) | 0 (0.0%) |
| $100,000 to $149,999 | 107 (68.6%) | 0 (0.0%) |
| $150,000 or more | 0 (0.0%) | 0 (0.0%) |
| Total | 156 (100.0%) | 11 (100.0%) |
Monthly Housing Cost Tiers in Slatedale
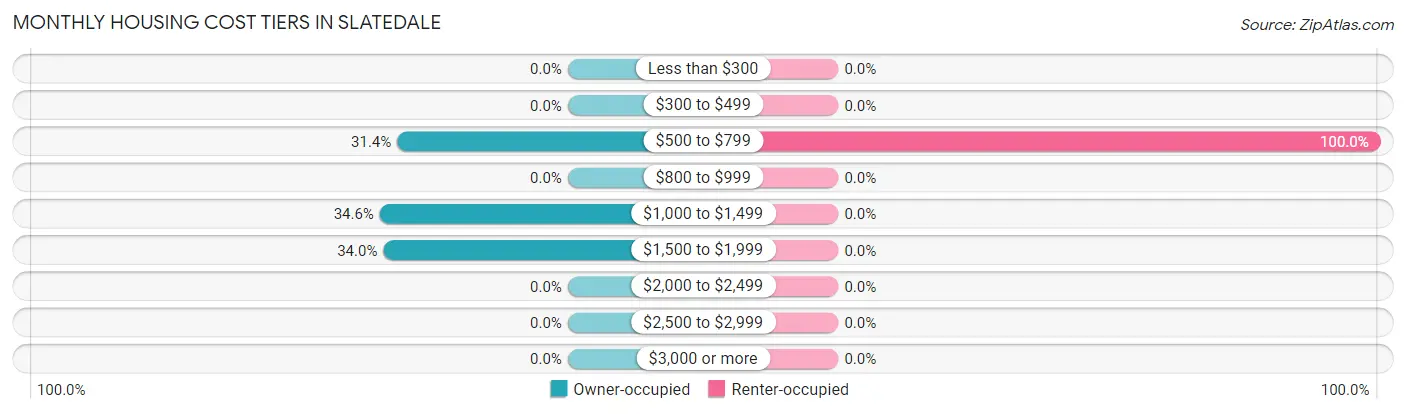
| Monthly Cost | Owner-occupied | Renter-occupied |
| Less than $300 | 0 (0.0%) | 0 (0.0%) |
| $300 to $499 | 0 (0.0%) | 0 (0.0%) |
| $500 to $799 | 49 (31.4%) | 11 (100.0%) |
| $800 to $999 | 0 (0.0%) | 0 (0.0%) |
| $1,000 to $1,499 | 54 (34.6%) | 0 (0.0%) |
| $1,500 to $1,999 | 53 (34.0%) | 0 (0.0%) |
| $2,000 to $2,499 | 0 (0.0%) | 0 (0.0%) |
| $2,500 to $2,999 | 0 (0.0%) | 0 (0.0%) |
| $3,000 or more | 0 (0.0%) | 0 (0.0%) |
| Total | 156 (100.0%) | 11 (100.0%) |
Physical Housing Characteristics in Slatedale
Housing Structures in Slatedale
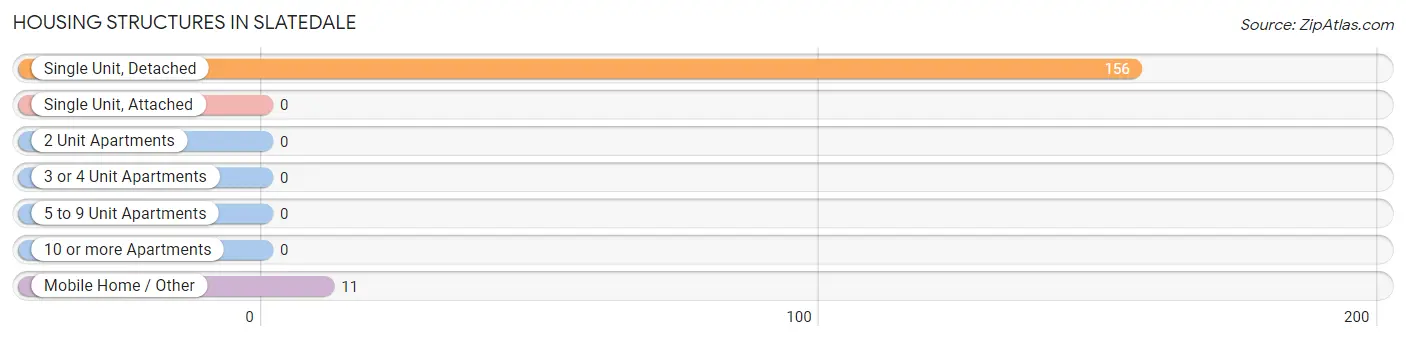
| Structure Type | # Housing Units | % Housing Units |
| Single Unit, Detached | 156 | 93.4% |
| Single Unit, Attached | 0 | 0.0% |
| 2 Unit Apartments | 0 | 0.0% |
| 3 or 4 Unit Apartments | 0 | 0.0% |
| 5 to 9 Unit Apartments | 0 | 0.0% |
| 10 or more Apartments | 0 | 0.0% |
| Mobile Home / Other | 11 | 6.6% |
| Total | 167 | 100.0% |
Housing Structures by Occupancy in Slatedale
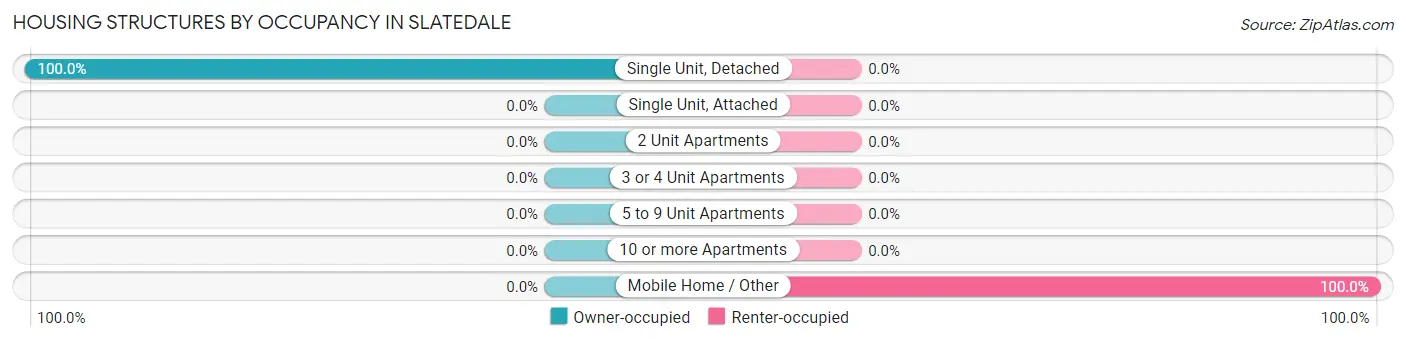
| Structure Type | Owner-occupied | Renter-occupied |
| Single Unit, Detached | 156 (100.0%) | 0 (0.0%) |
| Single Unit, Attached | 0 (0.0%) | 0 (0.0%) |
| 2 Unit Apartments | 0 (0.0%) | 0 (0.0%) |
| 3 or 4 Unit Apartments | 0 (0.0%) | 0 (0.0%) |
| 5 to 9 Unit Apartments | 0 (0.0%) | 0 (0.0%) |
| 10 or more Apartments | 0 (0.0%) | 0 (0.0%) |
| Mobile Home / Other | 0 (0.0%) | 11 (100.0%) |
| Total | 156 (93.4%) | 11 (6.6%) |
Housing Structures by Number of Rooms in Slatedale
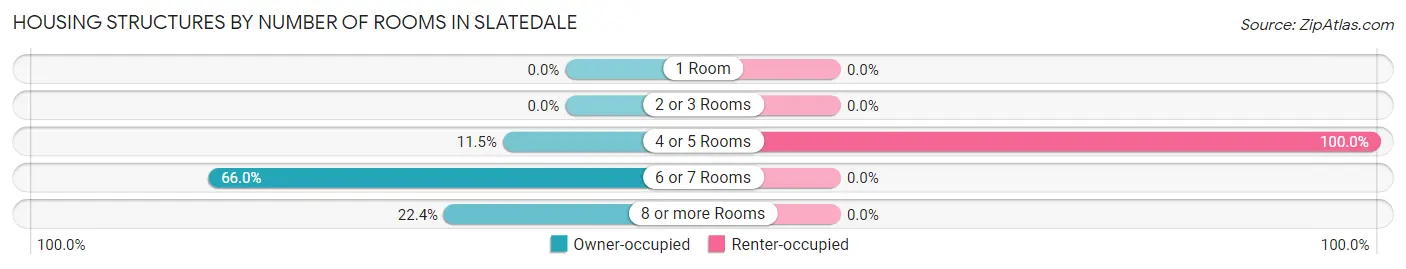
| Number of Rooms | Owner-occupied | Renter-occupied |
| 1 Room | 0 (0.0%) | 0 (0.0%) |
| 2 or 3 Rooms | 0 (0.0%) | 0 (0.0%) |
| 4 or 5 Rooms | 18 (11.5%) | 11 (100.0%) |
| 6 or 7 Rooms | 103 (66.0%) | 0 (0.0%) |
| 8 or more Rooms | 35 (22.4%) | 0 (0.0%) |
| Total | 156 (100.0%) | 11 (100.0%) |
Housing Structure by Heating Type in Slatedale
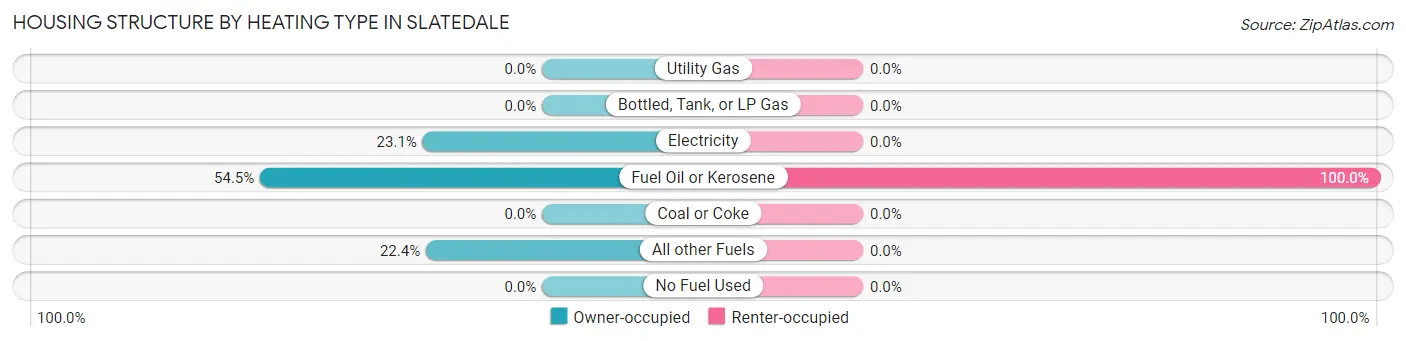
| Heating Type | Owner-occupied | Renter-occupied |
| Utility Gas | 0 (0.0%) | 0 (0.0%) |
| Bottled, Tank, or LP Gas | 0 (0.0%) | 0 (0.0%) |
| Electricity | 36 (23.1%) | 0 (0.0%) |
| Fuel Oil or Kerosene | 85 (54.5%) | 11 (100.0%) |
| Coal or Coke | 0 (0.0%) | 0 (0.0%) |
| All other Fuels | 35 (22.4%) | 0 (0.0%) |
| No Fuel Used | 0 (0.0%) | 0 (0.0%) |
| Total | 156 (100.0%) | 11 (100.0%) |
Household Vehicle Usage in Slatedale
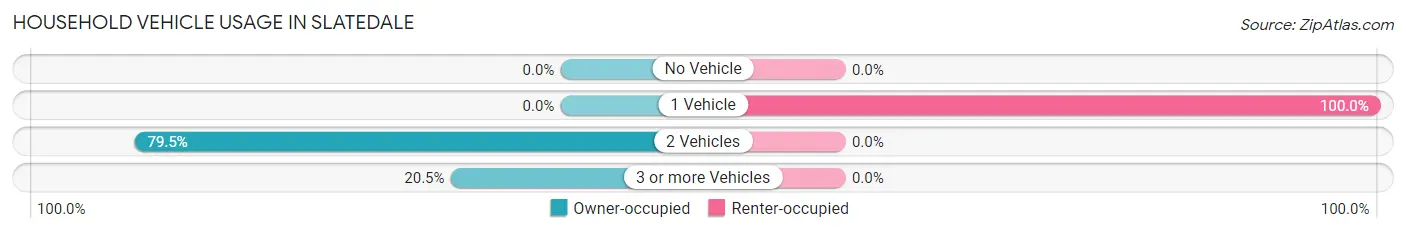
| Vehicles per Household | Owner-occupied | Renter-occupied |
| No Vehicle | 0 (0.0%) | 0 (0.0%) |
| 1 Vehicle | 0 (0.0%) | 11 (100.0%) |
| 2 Vehicles | 124 (79.5%) | 0 (0.0%) |
| 3 or more Vehicles | 32 (20.5%) | 0 (0.0%) |
| Total | 156 (100.0%) | 11 (100.0%) |
Real Estate & Mortgages in Slatedale
Real Estate and Mortgage Overview in Slatedale
| Characteristic | Without Mortgage | With Mortgage |
| Housing Units | 49 | 107 |
| Median Property Value | - | - |
| Median Household Income | - | - |
| Monthly Housing Costs | - | - |
| Real Estate Taxes | - | - |
Property Value by Mortgage Status in Slatedale
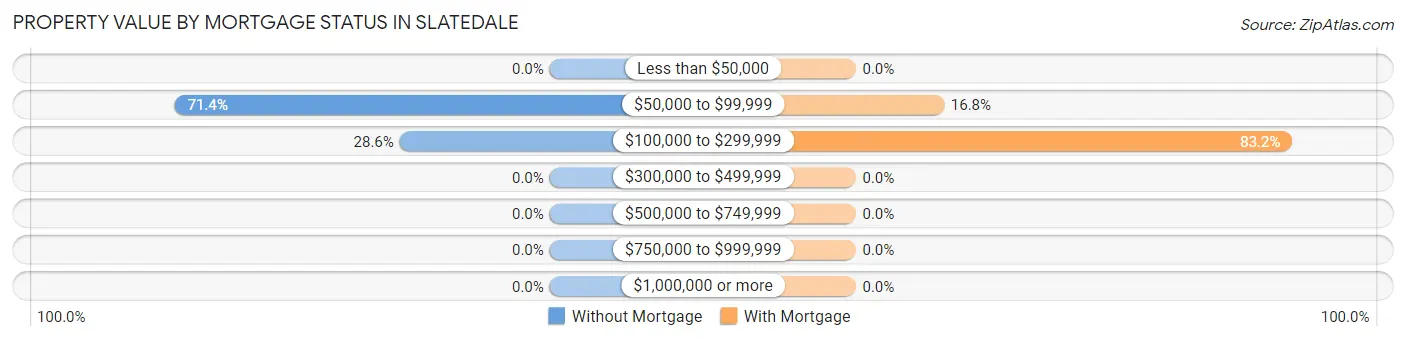
| Property Value | Without Mortgage | With Mortgage |
| Less than $50,000 | 0 (0.0%) | 0 (0.0%) |
| $50,000 to $99,999 | 35 (71.4%) | 18 (16.8%) |
| $100,000 to $299,999 | 14 (28.6%) | 89 (83.2%) |
| $300,000 to $499,999 | 0 (0.0%) | 0 (0.0%) |
| $500,000 to $749,999 | 0 (0.0%) | 0 (0.0%) |
| $750,000 to $999,999 | 0 (0.0%) | 0 (0.0%) |
| $1,000,000 or more | 0 (0.0%) | 0 (0.0%) |
| Total | 49 (100.0%) | 107 (100.0%) |
Household Income by Mortgage Status in Slatedale
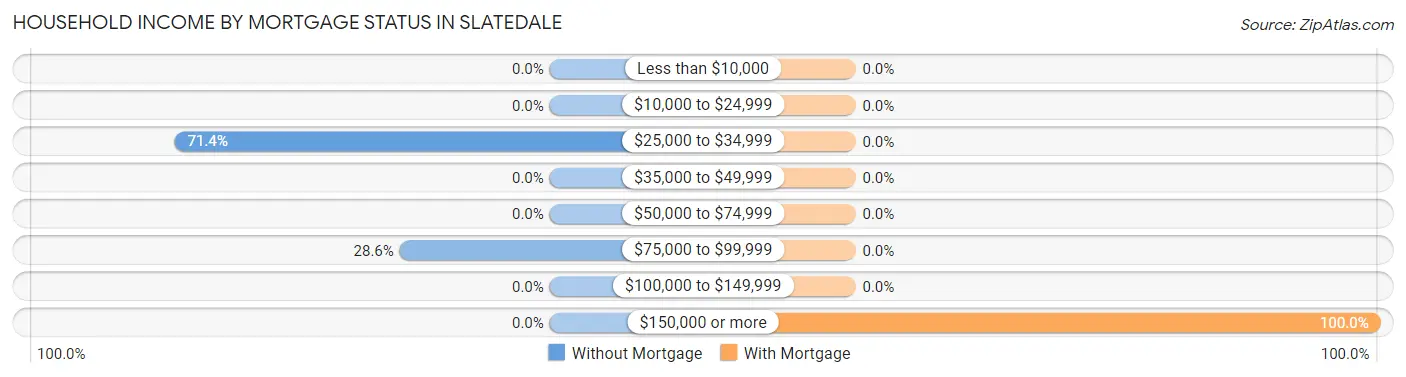
| Household Income | Without Mortgage | With Mortgage |
| Less than $10,000 | 0 (0.0%) | 0 (0.0%) |
| $10,000 to $24,999 | 0 (0.0%) | 0 (0.0%) |
| $25,000 to $34,999 | 35 (71.4%) | 0 (0.0%) |
| $35,000 to $49,999 | 0 (0.0%) | 0 (0.0%) |
| $50,000 to $74,999 | 0 (0.0%) | 0 (0.0%) |
| $75,000 to $99,999 | 14 (28.6%) | 0 (0.0%) |
| $100,000 to $149,999 | 0 (0.0%) | 0 (0.0%) |
| $150,000 or more | 0 (0.0%) | 107 (100.0%) |
| Total | 49 (100.0%) | 107 (100.0%) |
Property Value to Household Income Ratio in Slatedale
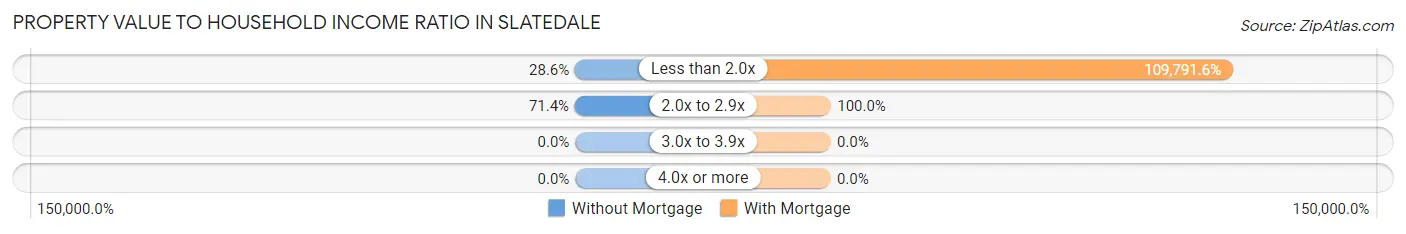
| Value-to-Income Ratio | Without Mortgage | With Mortgage |
| Less than 2.0x | 14 (28.6%) | 117,477 (109,791.6%) |
| 2.0x to 2.9x | 35 (71.4%) | 107 (100.0%) |
| 3.0x to 3.9x | 0 (0.0%) | 0 (0.0%) |
| 4.0x or more | 0 (0.0%) | 0 (0.0%) |
| Total | 49 (100.0%) | 107 (100.0%) |
Real Estate Taxes by Mortgage Status in Slatedale
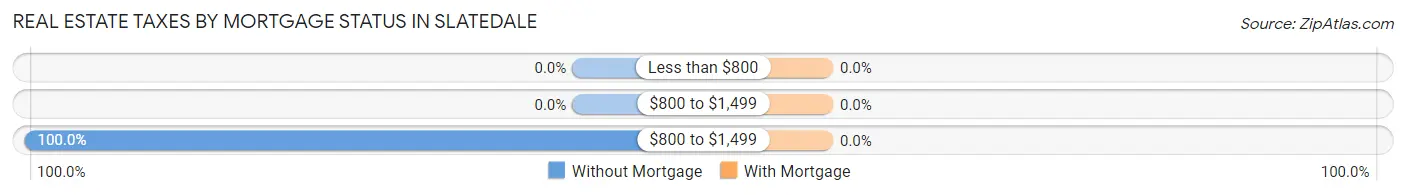
| Property Taxes | Without Mortgage | With Mortgage |
| Less than $800 | 0 (0.0%) | 0 (0.0%) |
| $800 to $1,499 | 0 (0.0%) | 0 (0.0%) |
| $800 to $1,499 | 49 (100.0%) | 0 (0.0%) |
| Total | 49 (100.0%) | 107 (100.0%) |
Health & Disability in Slatedale
Health Insurance Coverage by Age in Slatedale
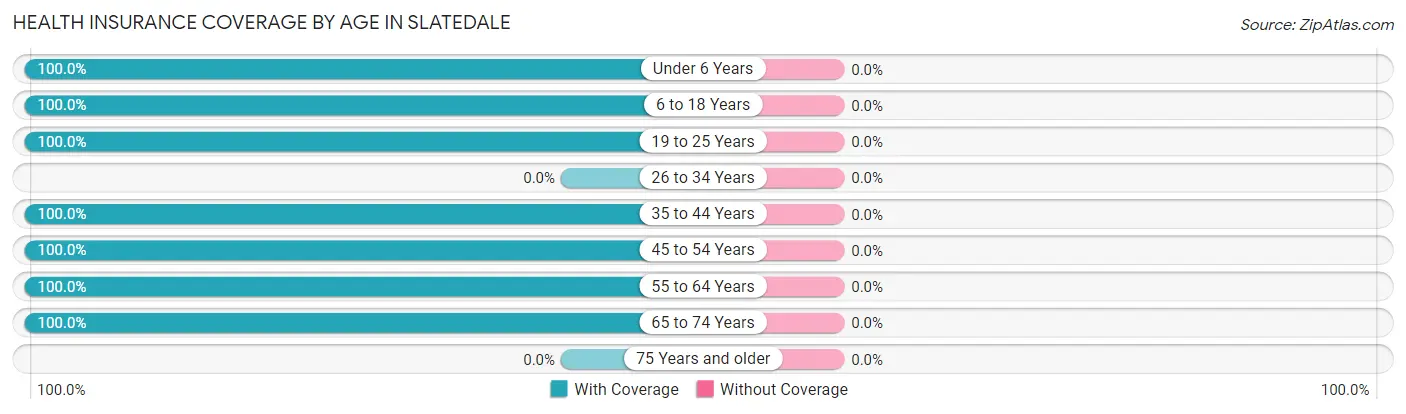
| Age Bracket | With Coverage | Without Coverage |
| Under 6 Years | 52 (100.0%) | 0 (0.0%) |
| 6 to 18 Years | 138 (100.0%) | 0 (0.0%) |
| 19 to 25 Years | 37 (100.0%) | 0 (0.0%) |
| 26 to 34 Years | 0 (0.0%) | 0 (0.0%) |
| 35 to 44 Years | 212 (100.0%) | 0 (0.0%) |
| 45 to 54 Years | 54 (100.0%) | 0 (0.0%) |
| 55 to 64 Years | 39 (100.0%) | 0 (0.0%) |
| 65 to 74 Years | 18 (100.0%) | 0 (0.0%) |
| 75 Years and older | 0 (0.0%) | 0 (0.0%) |
| Total | 550 (100.0%) | 0 (0.0%) |
Health Insurance Coverage by Citizenship Status in Slatedale
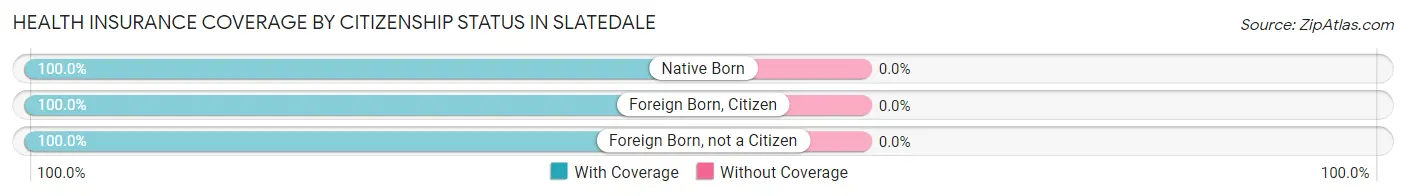
| Citizenship Status | With Coverage | Without Coverage |
| Native Born | 52 (100.0%) | 0 (0.0%) |
| Foreign Born, Citizen | 138 (100.0%) | 0 (0.0%) |
| Foreign Born, not a Citizen | 37 (100.0%) | 0 (0.0%) |
Health Insurance Coverage by Household Income in Slatedale
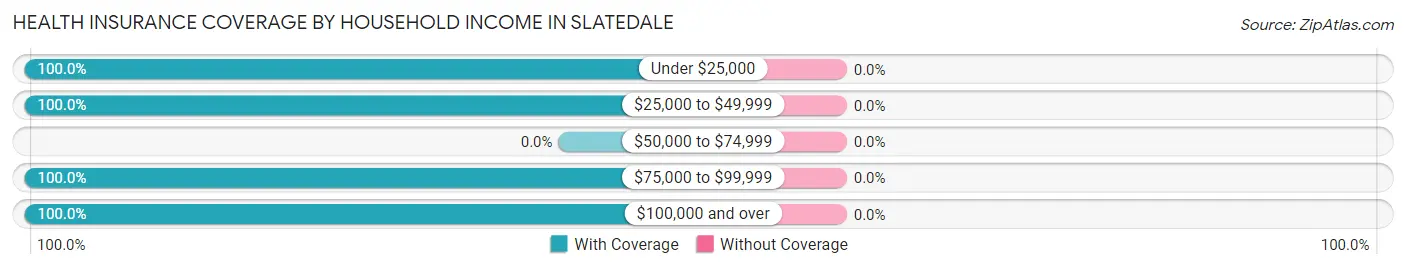
| Household Income | With Coverage | Without Coverage |
| Under $25,000 | 11 (100.0%) | 0 (0.0%) |
| $25,000 to $49,999 | 104 (100.0%) | 0 (0.0%) |
| $50,000 to $74,999 | 0 (0.0%) | 0 (0.0%) |
| $75,000 to $99,999 | 45 (100.0%) | 0 (0.0%) |
| $100,000 and over | 390 (100.0%) | 0 (0.0%) |
Public vs Private Health Insurance Coverage by Age in Slatedale
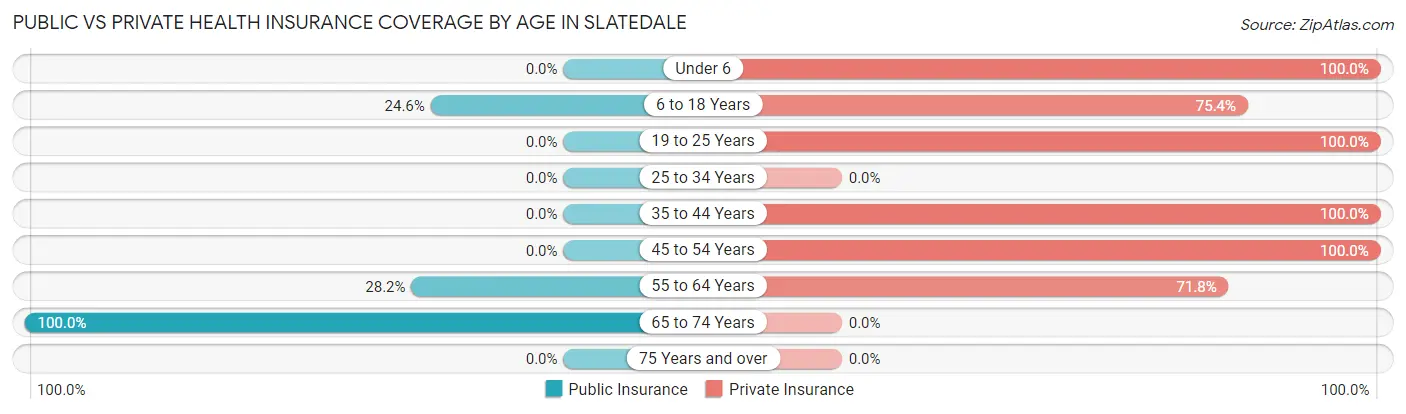
| Age Bracket | Public Insurance | Private Insurance |
| Under 6 | 0 (0.0%) | 52 (100.0%) |
| 6 to 18 Years | 34 (24.6%) | 104 (75.4%) |
| 19 to 25 Years | 0 (0.0%) | 37 (100.0%) |
| 25 to 34 Years | 0 (0.0%) | 0 (0.0%) |
| 35 to 44 Years | 0 (0.0%) | 212 (100.0%) |
| 45 to 54 Years | 0 (0.0%) | 54 (100.0%) |
| 55 to 64 Years | 11 (28.2%) | 28 (71.8%) |
| 65 to 74 Years | 18 (100.0%) | 0 (0.0%) |
| 75 Years and over | 0 (0.0%) | 0 (0.0%) |
| Total | 63 (11.5%) | 487 (88.5%) |
Disability Status by Sex by Age in Slatedale
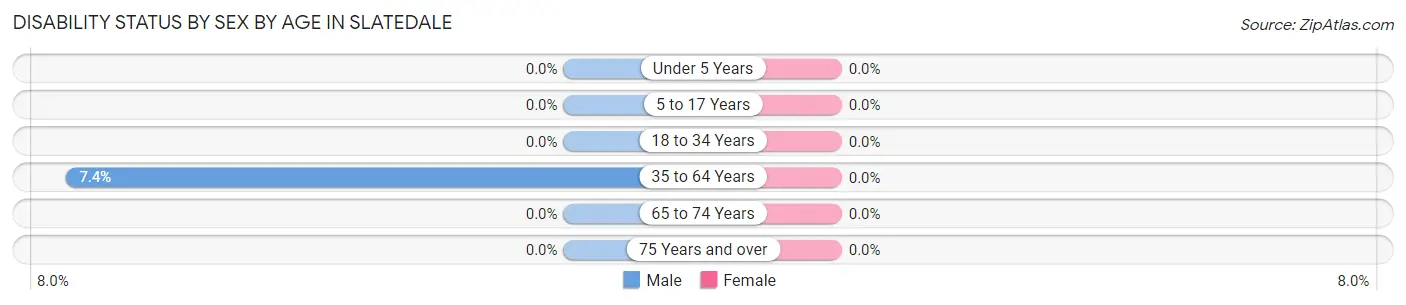
| Age Bracket | Male | Female |
| Under 5 Years | 0 (0.0%) | 0 (0.0%) |
| 5 to 17 Years | 0 (0.0%) | 0 (0.0%) |
| 18 to 34 Years | 0 (0.0%) | 0 (0.0%) |
| 35 to 64 Years | 11 (7.4%) | 0 (0.0%) |
| 65 to 74 Years | 0 (0.0%) | 0 (0.0%) |
| 75 Years and over | 0 (0.0%) | 0 (0.0%) |
Disability Class by Sex by Age in Slatedale
Disability Class: Hearing Difficulty
| Age Bracket | Male | Female |
| Under 5 Years | 0 (0.0%) | 0 (0.0%) |
| 5 to 17 Years | 0 (0.0%) | 0 (0.0%) |
| 18 to 34 Years | 0 (0.0%) | 0 (0.0%) |
| 35 to 64 Years | 0 (0.0%) | 0 (0.0%) |
| 65 to 74 Years | 0 (0.0%) | 0 (0.0%) |
| 75 Years and over | 0 (0.0%) | 0 (0.0%) |
Disability Class: Vision Difficulty
| Age Bracket | Male | Female |
| Under 5 Years | 0 (0.0%) | 0 (0.0%) |
| 5 to 17 Years | 0 (0.0%) | 0 (0.0%) |
| 18 to 34 Years | 0 (0.0%) | 0 (0.0%) |
| 35 to 64 Years | 0 (0.0%) | 0 (0.0%) |
| 65 to 74 Years | 0 (0.0%) | 0 (0.0%) |
| 75 Years and over | 0 (0.0%) | 0 (0.0%) |
Disability Class: Cognitive Difficulty
| Age Bracket | Male | Female |
| 5 to 17 Years | 0 (0.0%) | 0 (0.0%) |
| 18 to 34 Years | 0 (0.0%) | 0 (0.0%) |
| 35 to 64 Years | 0 (0.0%) | 0 (0.0%) |
| 65 to 74 Years | 0 (0.0%) | 0 (0.0%) |
| 75 Years and over | 0 (0.0%) | 0 (0.0%) |
Disability Class: Ambulatory Difficulty
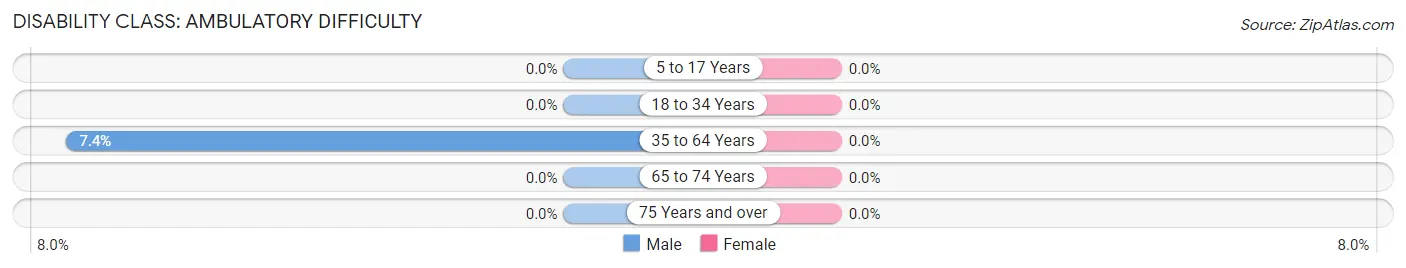
| Age Bracket | Male | Female |
| 5 to 17 Years | 0 (0.0%) | 0 (0.0%) |
| 18 to 34 Years | 0 (0.0%) | 0 (0.0%) |
| 35 to 64 Years | 11 (7.4%) | 0 (0.0%) |
| 65 to 74 Years | 0 (0.0%) | 0 (0.0%) |
| 75 Years and over | 0 (0.0%) | 0 (0.0%) |
Disability Class: Self-Care Difficulty
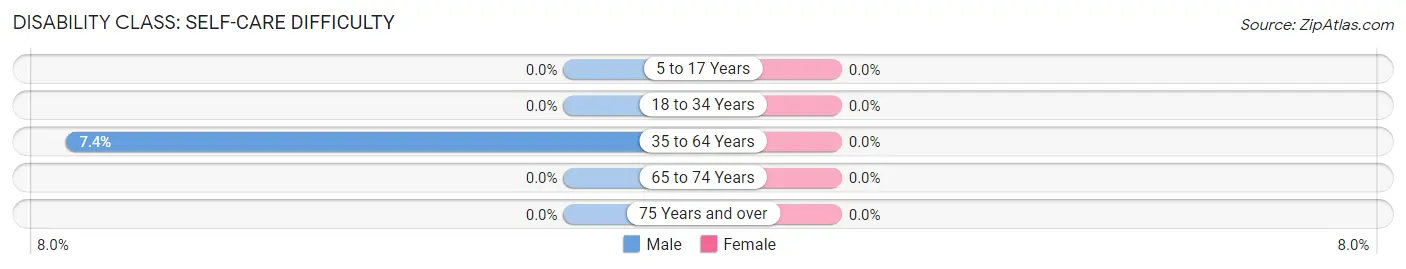
| Age Bracket | Male | Female |
| 5 to 17 Years | 0 (0.0%) | 0 (0.0%) |
| 18 to 34 Years | 0 (0.0%) | 0 (0.0%) |
| 35 to 64 Years | 11 (7.4%) | 0 (0.0%) |
| 65 to 74 Years | 0 (0.0%) | 0 (0.0%) |
| 75 Years and over | 0 (0.0%) | 0 (0.0%) |
Technology Access in Slatedale
Computing Device Access in Slatedale
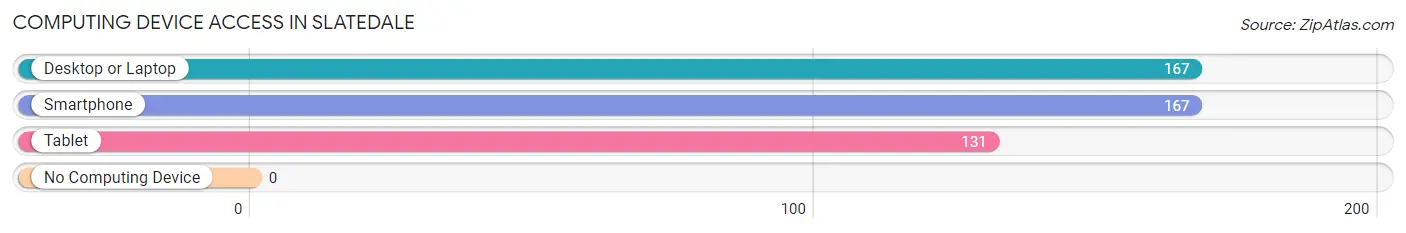
| Device Type | # Households | % Households |
| Desktop or Laptop | 167 | 100.0% |
| Smartphone | 167 | 100.0% |
| Tablet | 131 | 78.4% |
| No Computing Device | 0 | 0.0% |
| Total | 167 | 100.0% |
Internet Access in Slatedale
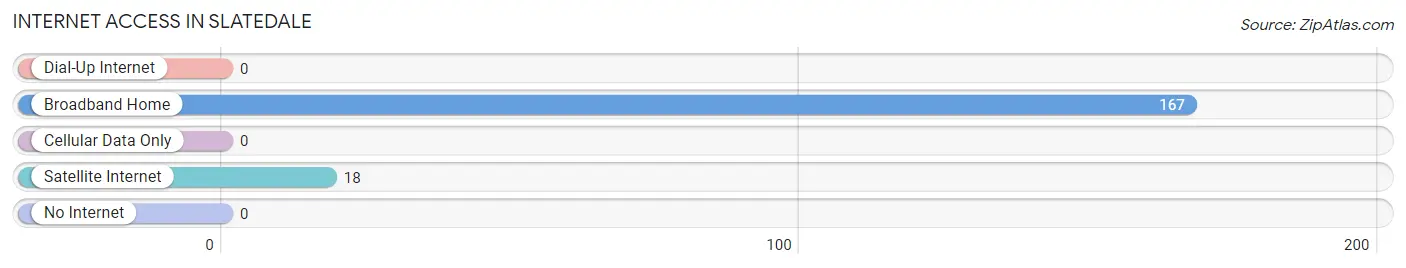
| Internet Type | # Households | % Households |
| Dial-Up Internet | 0 | 0.0% |
| Broadband Home | 167 | 100.0% |
| Cellular Data Only | 0 | 0.0% |
| Satellite Internet | 18 | 10.8% |
| No Internet | 0 | 0.0% |
| Total | 167 | 100.0% |
Slatedale Summary
Slatedale is a small borough located in Northampton County, Pennsylvania. It is situated in the Lehigh Valley region of the state, approximately 10 miles north of Allentown. The borough was incorporated in 1891 and has a population of approximately 1,000 people.
Geography
Slatedale is located in the Lehigh Valley region of Pennsylvania, approximately 10 miles north of Allentown. The borough is situated in the foothills of the Blue Mountain range, which is part of the Appalachian Mountains. The terrain is mostly hilly, with some flat areas. The borough is located in the Lehigh Valley watershed, which is part of the Delaware River watershed. The climate is humid continental, with hot summers and cold winters.
Economy
The economy of Slatedale is largely based on agriculture and manufacturing. The borough is home to several small farms, which produce a variety of crops, including corn, soybeans, and hay. There are also several small manufacturing businesses in the area, which produce a variety of products, including furniture, clothing, and electronics.
Demographics
As of the 2010 census, the population of Slatedale was 1,000 people. The racial makeup of the borough was 97.2% White, 0.7% African American, 0.2% Native American, 0.2% Asian, 0.2% from other races, and 1.7% from two or more races. Hispanic or Latino of any race were 1.2% of the population.
The median household income in Slatedale was $45,000, and the median family income was $50,000. The per capita income for the borough was $20,000. About 8.3% of families and 10.2% of the population were below the poverty line, including 14.3% of those under age 18 and 6.7% of those age 65 or over.
Education
Slatedale is served by the Northern Lehigh School District. The district operates two elementary schools, one middle school, and one high school. The borough is also home to several private schools, including a Catholic school and a Lutheran school.
Conclusion
Slatedale is a small borough located in Northampton County, Pennsylvania. It is situated in the Lehigh Valley region of the state, approximately 10 miles north of Allentown. The borough was incorporated in 1891 and has a population of approximately 1,000 people. The economy of Slatedale is largely based on agriculture and manufacturing, and the borough is served by the Northern Lehigh School District. The racial makeup of the borough is predominantly White, with a small percentage of African American, Native American, Asian, and other races. The median household income in Slatedale is $45,000, and the per capita income is $20,000.
Common Questions
What is Per Capita Income in Slatedale?
Per Capita income in Slatedale is $29,792.
What is the Median Family Income in Slatedale?
Median Family Income in Slatedale is $116,343.
What is the Median Household income in Slatedale?
Median Household Income in Slatedale is $116,088.
What is Inequality or Gini Index in Slatedale?
Inequality or Gini Index in Slatedale is 0.24.
What is the Total Population of Slatedale?
Total Population of Slatedale is 550.
What is the Total Male Population of Slatedale?
Total Male Population of Slatedale is 304.
What is the Total Female Population of Slatedale?
Total Female Population of Slatedale is 246.
What is the Ratio of Males per 100 Females in Slatedale?
There are 123.58 Males per 100 Females in Slatedale.
What is the Ratio of Females per 100 Males in Slatedale?
There are 80.92 Females per 100 Males in Slatedale.
What is the Median Population Age in Slatedale?
Median Population Age in Slatedale is 35.9 Years.
What is the Average Family Size in Slatedale
Average Family Size in Slatedale is 3.5 People.
What is the Average Household Size in Slatedale
Average Household Size in Slatedale is 3.3 People.
How Large is the Labor Force in Slatedale?
There are 308 People in the Labor Forcein in Slatedale.
What is the Percentage of People in the Labor Force in Slatedale?
85.6% of People are in the Labor Force in Slatedale.