Richlandtown borough, PA Map & Demographics
Richlandtown borough Overview
$34,509
PER CAPITA INCOME
$89,028
AVG FAMILY INCOME
$79,545
AVG HOUSEHOLD INCOME
16.4%
WAGE / INCOME GAP [ % ]
83.6¢/ $1
WAGE / INCOME GAP [ $ ]
0.35
INEQUALITY / GINI INDEX
1,237
TOTAL POPULATION
596
MALE POPULATION
641
FEMALE POPULATION
92.98
MALES / 100 FEMALES
107.55
FEMALES / 100 MALES
36.4
MEDIAN AGE
3.5
AVG FAMILY SIZE
2.6
AVG HOUSEHOLD SIZE
648
LABOR FORCE [ PEOPLE ]
68.2%
PERCENT IN LABOR FORCE
5.1%
UNEMPLOYMENT RATE
Income in Richlandtown borough
Income Overview in Richlandtown borough
Per Capita Income in Richlandtown borough is $34,509, while median incomes of families and households are $89,028 and $79,545 respectively.
| Characteristic | Number | Measure |
| Per Capita Income | 1,237 | $34,509 |
| Median Family Income | 257 | $89,028 |
| Mean Family Income | 257 | $113,469 |
| Median Household Income | 428 | $79,545 |
| Mean Household Income | 428 | $95,451 |
| Income Deficit | 257 | $0 |
| Wage / Income Gap (%) | 1,237 | 16.39% |
| Wage / Income Gap ($) | 1,237 | 83.61¢ per $1 |
| Gini / Inequality Index | 1,237 | 0.35 |
Earnings by Sex in Richlandtown borough
Average Earnings in Richlandtown borough are $45,216, $48,523 for men and $40,568 for women, a difference of 16.4%.
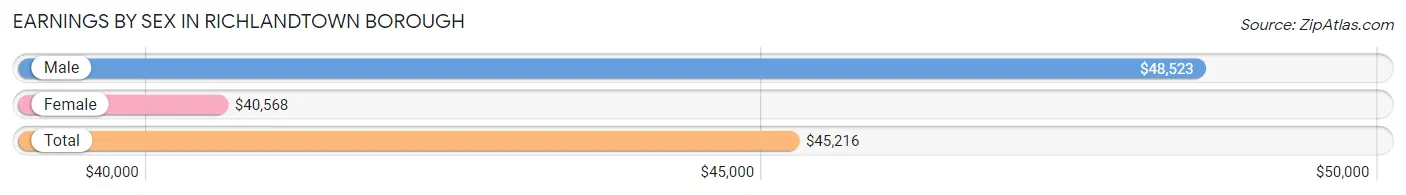
| Sex | Number | Average Earnings |
| Male | 381 (57.0%) | $48,523 |
| Female | 288 (43.0%) | $40,568 |
| Total | 669 (100.0%) | $45,216 |
Earnings by Sex by Income Bracket in Richlandtown borough
The most common earnings brackets in Richlandtown borough are $75,000 to $99,999 for men (70 | 18.4%) and $40,000 to $44,999 for women (34 | 11.8%).
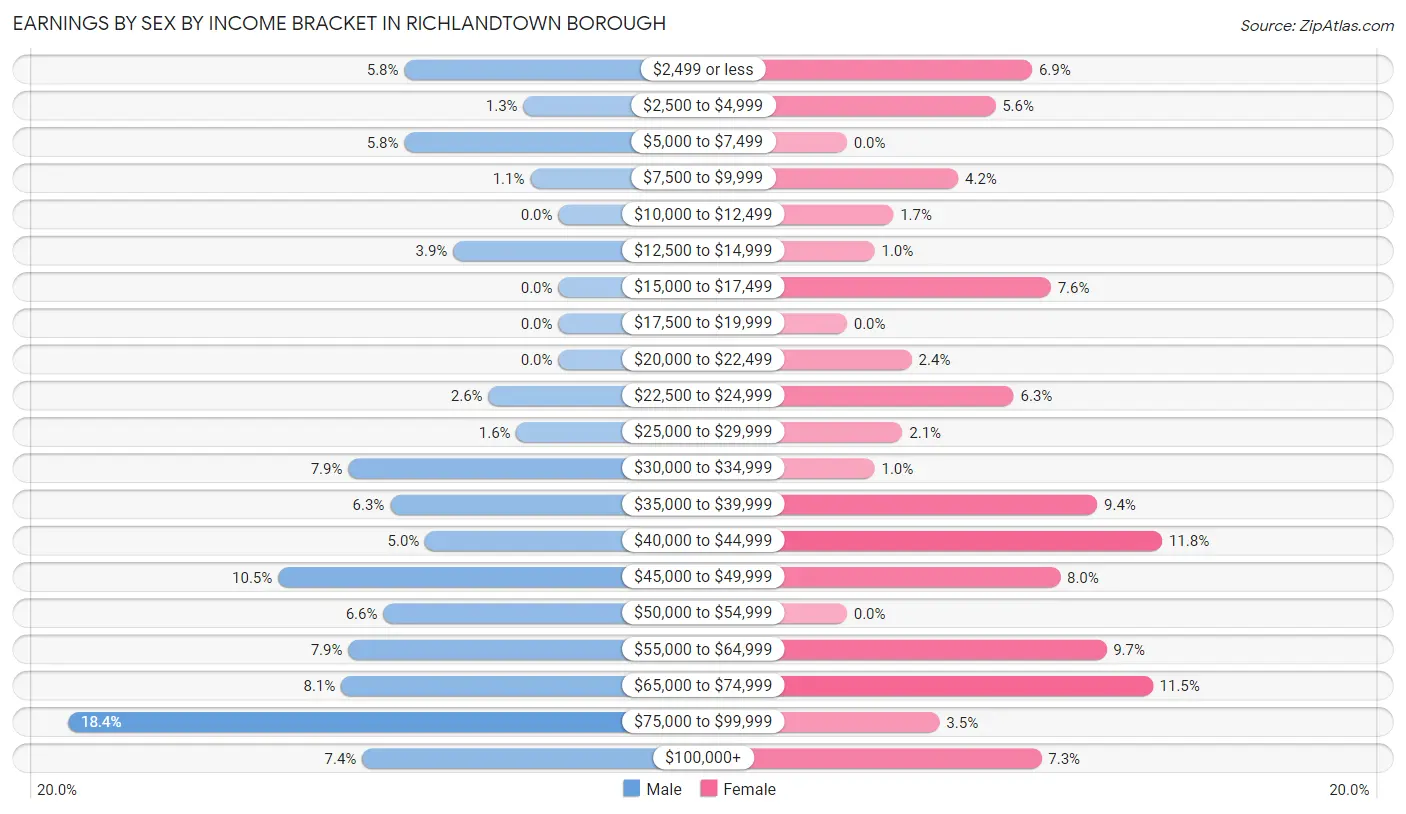
| Income | Male | Female |
| $2,499 or less | 22 (5.8%) | 20 (6.9%) |
| $2,500 to $4,999 | 5 (1.3%) | 16 (5.6%) |
| $5,000 to $7,499 | 22 (5.8%) | 0 (0.0%) |
| $7,500 to $9,999 | 4 (1.1%) | 12 (4.2%) |
| $10,000 to $12,499 | 0 (0.0%) | 5 (1.7%) |
| $12,500 to $14,999 | 15 (3.9%) | 3 (1.0%) |
| $15,000 to $17,499 | 0 (0.0%) | 22 (7.6%) |
| $17,500 to $19,999 | 0 (0.0%) | 0 (0.0%) |
| $20,000 to $22,499 | 0 (0.0%) | 7 (2.4%) |
| $22,500 to $24,999 | 10 (2.6%) | 18 (6.2%) |
| $25,000 to $29,999 | 6 (1.6%) | 6 (2.1%) |
| $30,000 to $34,999 | 30 (7.9%) | 3 (1.0%) |
| $35,000 to $39,999 | 24 (6.3%) | 27 (9.4%) |
| $40,000 to $44,999 | 19 (5.0%) | 34 (11.8%) |
| $45,000 to $49,999 | 40 (10.5%) | 23 (8.0%) |
| $50,000 to $54,999 | 25 (6.6%) | 0 (0.0%) |
| $55,000 to $64,999 | 30 (7.9%) | 28 (9.7%) |
| $65,000 to $74,999 | 31 (8.1%) | 33 (11.5%) |
| $75,000 to $99,999 | 70 (18.4%) | 10 (3.5%) |
| $100,000+ | 28 (7.3%) | 21 (7.3%) |
| Total | 381 (100.0%) | 288 (100.0%) |
Earnings by Sex by Educational Attainment in Richlandtown borough
Average earnings in Richlandtown borough are $52,440 for men and $42,604 for women, a difference of 18.8%. Men with an educational attainment of graduate degree enjoy the highest average annual earnings of $55,917, while those with high school diploma education earn the least with $48,636. Women with an educational attainment of graduate degree earn the most with the average annual earnings of $63,750, while those with high school diploma education have the smallest earnings of $37,396.
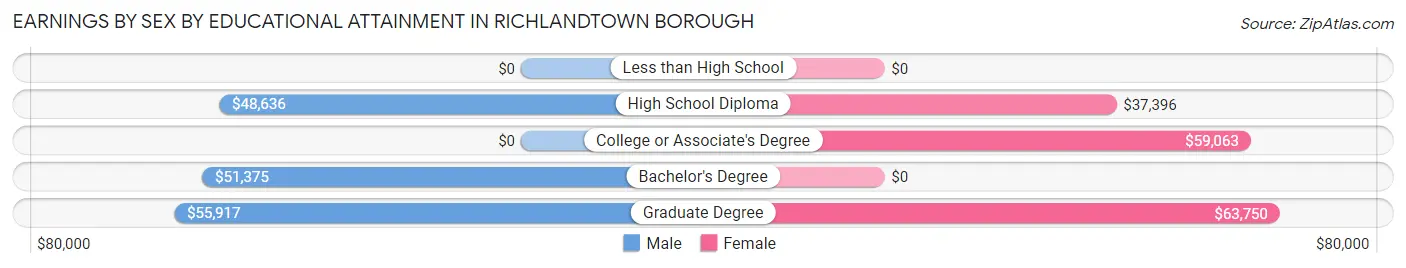
| Educational Attainment | Male Income | Female Income |
| Less than High School | - | - |
| High School Diploma | $48,636 | $37,396 |
| College or Associate's Degree | - | - |
| Bachelor's Degree | $51,375 | $0 |
| Graduate Degree | $55,917 | $63,750 |
| Total | $52,440 | $42,604 |
Family Income in Richlandtown borough
Family Income Brackets in Richlandtown borough
According to the Richlandtown borough family income data, there are 66 families falling into the $50,000 to $74,999 income range, which is the most common income bracket and makes up 25.7% of all families.
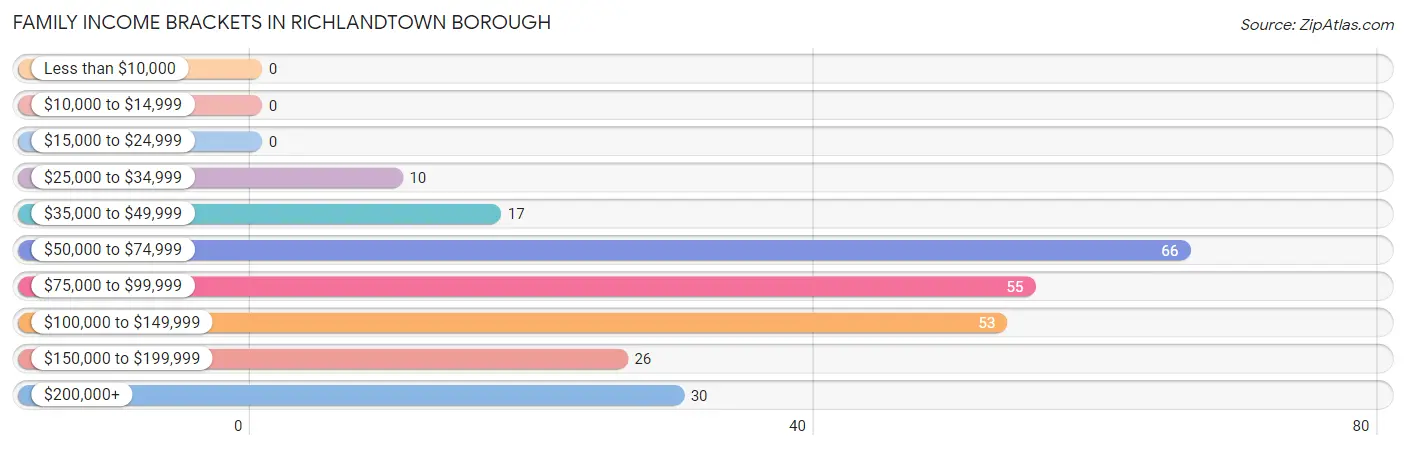
| Income Bracket | # Families | % Families |
| Less than $10,000 | 0 | 0.0% |
| $10,000 to $14,999 | 0 | 0.0% |
| $15,000 to $24,999 | 0 | 0.0% |
| $25,000 to $34,999 | 10 | 3.9% |
| $35,000 to $49,999 | 17 | 6.6% |
| $50,000 to $74,999 | 66 | 25.7% |
| $75,000 to $99,999 | 55 | 21.4% |
| $100,000 to $149,999 | 53 | 20.6% |
| $150,000 to $199,999 | 26 | 10.1% |
| $200,000+ | 30 | 11.7% |
Family Income by Famaliy Size in Richlandtown borough
5-person families (47 | 18.3%) account for the highest median family income in Richlandtown borough with $108,125 per family, while 3-person families (57 | 22.2%) have the highest median income of $33,295 per family member.
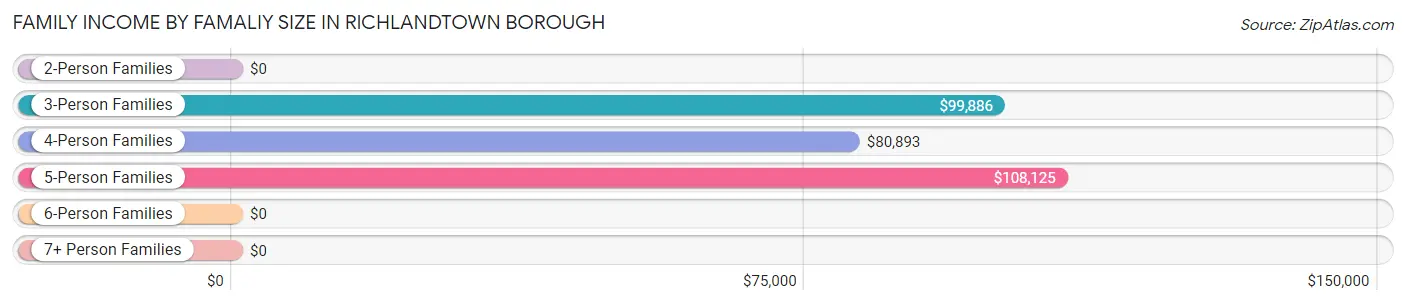
| Income Bracket | # Families | Median Income |
| 2-Person Families | 60 (23.4%) | $0 |
| 3-Person Families | 57 (22.2%) | $99,886 |
| 4-Person Families | 88 (34.2%) | $80,893 |
| 5-Person Families | 47 (18.3%) | $108,125 |
| 6-Person Families | 5 (1.9%) | $0 |
| 7+ Person Families | 0 (0.0%) | $0 |
| Total | 257 (100.0%) | $89,028 |
Family Income by Number of Earners in Richlandtown borough
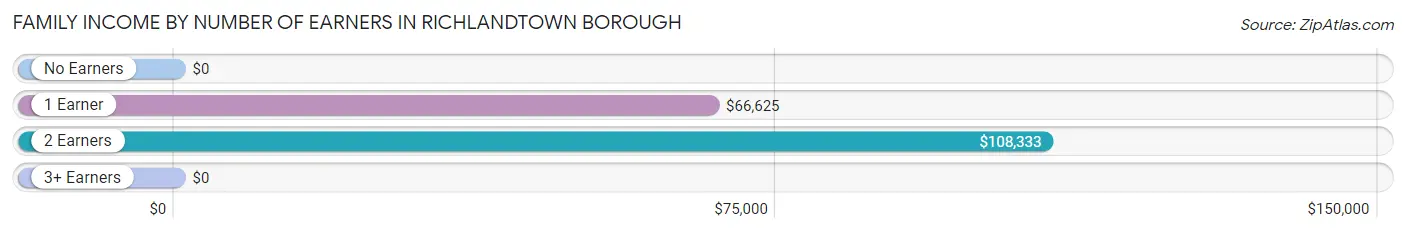
| Number of Earners | # Families | Median Income |
| No Earners | 20 (7.8%) | $0 |
| 1 Earner | 33 (12.8%) | $66,625 |
| 2 Earners | 122 (47.5%) | $108,333 |
| 3+ Earners | 82 (31.9%) | $0 |
| Total | 257 (100.0%) | $89,028 |
Household Income in Richlandtown borough
Household Income Brackets in Richlandtown borough
With 123 households falling in the category, the $50,000 to $74,999 income range is the most frequent in Richlandtown borough, accounting for 28.7% of all households. In contrast, only 7 households (1.6%) fall into the $10,000 to $14,999 income bracket, making it the least populous group.
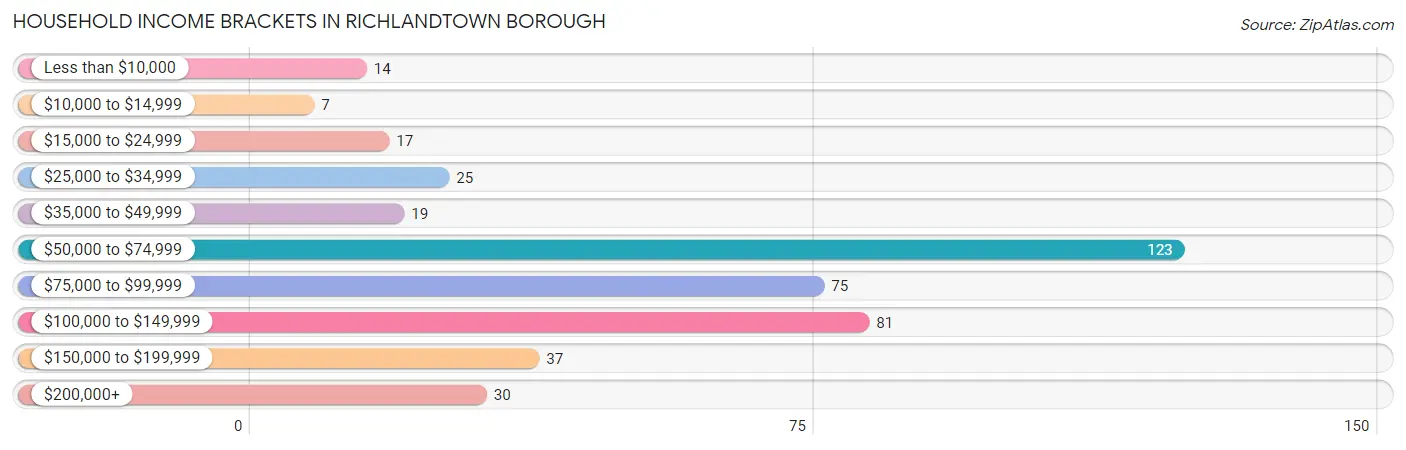
| Income Bracket | # Households | % Households |
| Less than $10,000 | 14 | 3.3% |
| $10,000 to $14,999 | 7 | 1.6% |
| $15,000 to $24,999 | 17 | 4.0% |
| $25,000 to $34,999 | 25 | 5.8% |
| $35,000 to $49,999 | 19 | 4.4% |
| $50,000 to $74,999 | 123 | 28.7% |
| $75,000 to $99,999 | 75 | 17.5% |
| $100,000 to $149,999 | 81 | 18.9% |
| $150,000 to $199,999 | 37 | 8.6% |
| $200,000+ | 30 | 7.0% |
Household Income by Householder Age in Richlandtown borough
The median household income in Richlandtown borough is $79,545, with the highest median household income of $99,091 found in the 25 to 44 years age bracket for the primary householder. A total of 136 households (31.8%) fall into this category. Meanwhile, the 15 to 24 years age bracket for the primary householder has the lowest median household income of $0, with 21 households (4.9%) in this group.
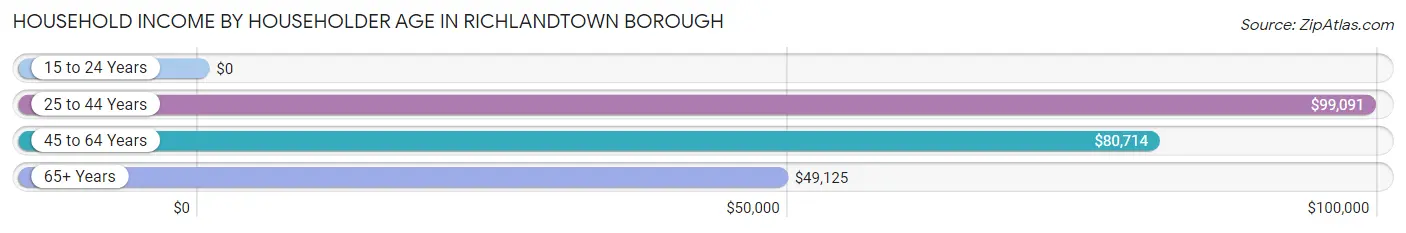
| Income Bracket | # Households | Median Income |
| 15 to 24 Years | 21 (4.9%) | $0 |
| 25 to 44 Years | 136 (31.8%) | $99,091 |
| 45 to 64 Years | 178 (41.6%) | $80,714 |
| 65+ Years | 93 (21.7%) | $49,125 |
| Total | 428 (100.0%) | $79,545 |
Poverty in Richlandtown borough
Income Below Poverty by Sex and Age in Richlandtown borough
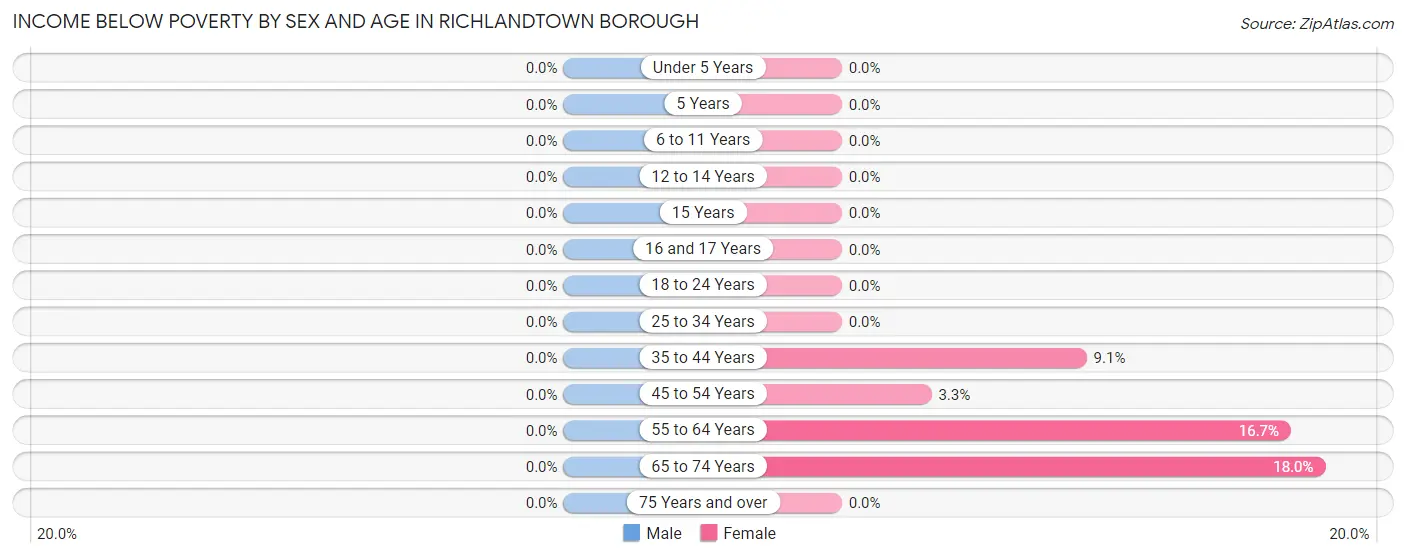
| Age Bracket | Male | Female |
| Under 5 Years | 0 (0.0%) | 0 (0.0%) |
| 5 Years | 0 (0.0%) | 0 (0.0%) |
| 6 to 11 Years | 0 (0.0%) | 0 (0.0%) |
| 12 to 14 Years | 0 (0.0%) | 0 (0.0%) |
| 15 Years | 0 (0.0%) | 0 (0.0%) |
| 16 and 17 Years | 0 (0.0%) | 0 (0.0%) |
| 18 to 24 Years | 0 (0.0%) | 0 (0.0%) |
| 25 to 34 Years | 0 (0.0%) | 0 (0.0%) |
| 35 to 44 Years | 0 (0.0%) | 7 (9.1%) |
| 45 to 54 Years | 0 (0.0%) | 3 (3.3%) |
| 55 to 64 Years | 0 (0.0%) | 7 (16.7%) |
| 65 to 74 Years | 0 (0.0%) | 7 (17.9%) |
| 75 Years and over | 0 (0.0%) | 0 (0.0%) |
| Total | 0 (0.0%) | 24 (4.4%) |
Income Above Poverty by Sex and Age in Richlandtown borough
According to the poverty statistics in Richlandtown borough, males aged under 5 years and females aged under 5 years are the age groups that are most secure financially, with 100.0% of males and 100.0% of females in these age groups living above the poverty line.
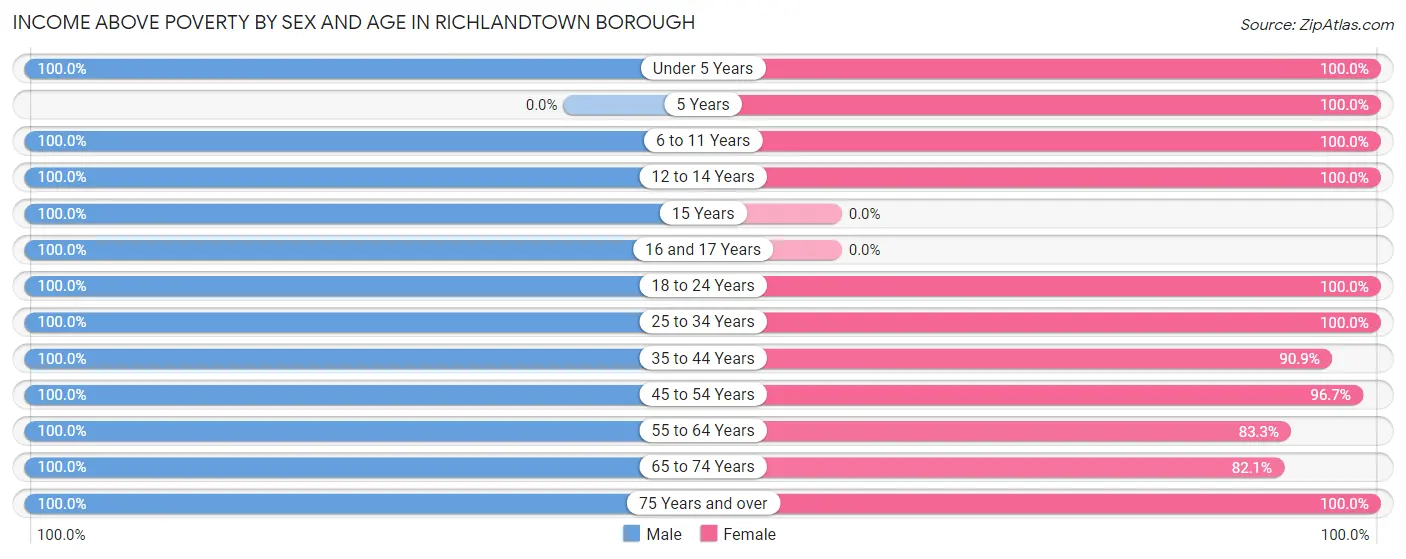
| Age Bracket | Male | Female |
| Under 5 Years | 51 (100.0%) | 45 (100.0%) |
| 5 Years | 0 (0.0%) | 7 (100.0%) |
| 6 to 11 Years | 30 (100.0%) | 73 (100.0%) |
| 12 to 14 Years | 12 (100.0%) | 45 (100.0%) |
| 15 Years | 24 (100.0%) | 0 (0.0%) |
| 16 and 17 Years | 11 (100.0%) | 0 (0.0%) |
| 18 to 24 Years | 47 (100.0%) | 35 (100.0%) |
| 25 to 34 Years | 141 (100.0%) | 60 (100.0%) |
| 35 to 44 Years | 46 (100.0%) | 70 (90.9%) |
| 45 to 54 Years | 86 (100.0%) | 87 (96.7%) |
| 55 to 64 Years | 48 (100.0%) | 35 (83.3%) |
| 65 to 74 Years | 18 (100.0%) | 32 (82.1%) |
| 75 Years and over | 36 (100.0%) | 34 (100.0%) |
| Total | 550 (100.0%) | 523 (95.6%) |
Income Below Poverty Among Married-Couple Families in Richlandtown borough
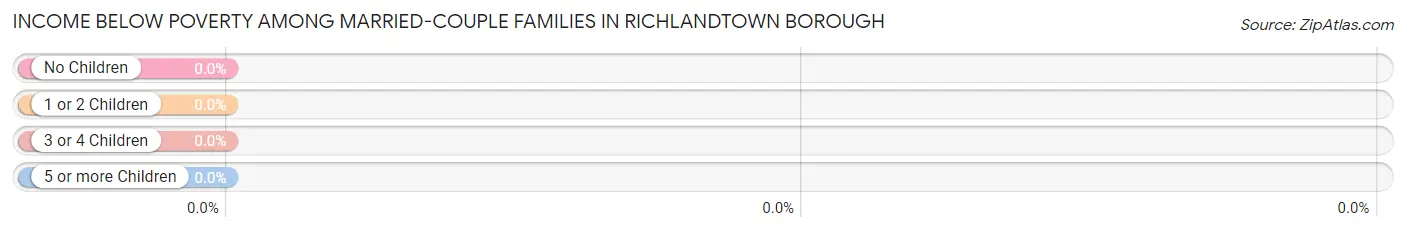
| Children | Above Poverty | Below Poverty |
| No Children | 75 (100.0%) | 0 (0.0%) |
| 1 or 2 Children | 118 (100.0%) | 0 (0.0%) |
| 3 or 4 Children | 30 (100.0%) | 0 (0.0%) |
| 5 or more Children | 0 (0.0%) | 0 (0.0%) |
| Total | 223 (100.0%) | 0 (0.0%) |
Income Below Poverty Among Single-Parent Households in Richlandtown borough
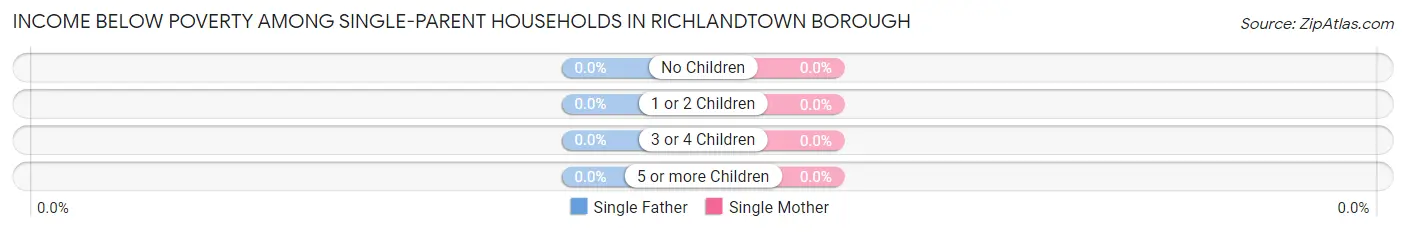
| Children | Single Father | Single Mother |
| No Children | 0 (0.0%) | 0 (0.0%) |
| 1 or 2 Children | 0 (0.0%) | 0 (0.0%) |
| 3 or 4 Children | 0 (0.0%) | 0 (0.0%) |
| 5 or more Children | 0 (0.0%) | 0 (0.0%) |
| Total | 0 (0.0%) | 0 (0.0%) |
Income Below Poverty Among Married-Couple vs Single-Parent Households in Richlandtown borough
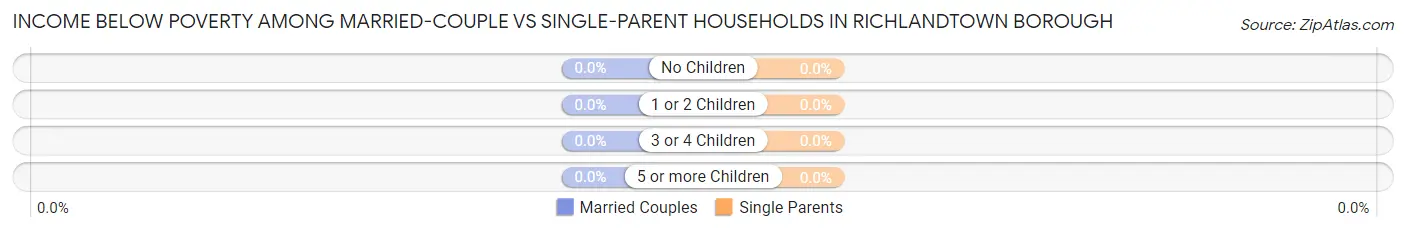
| Children | Married-Couple Families | Single-Parent Households |
| No Children | 0 (0.0%) | 0 (0.0%) |
| 1 or 2 Children | 0 (0.0%) | 0 (0.0%) |
| 3 or 4 Children | 0 (0.0%) | 0 (0.0%) |
| 5 or more Children | 0 (0.0%) | 0 (0.0%) |
| Total | 0 (0.0%) | 0 (0.0%) |
Race in Richlandtown borough
The most populous races in Richlandtown borough are White / Caucasian (1,094 | 88.4%), Hispanic or Latino (74 | 6.0%), and Two or more Races (65 | 5.2%).
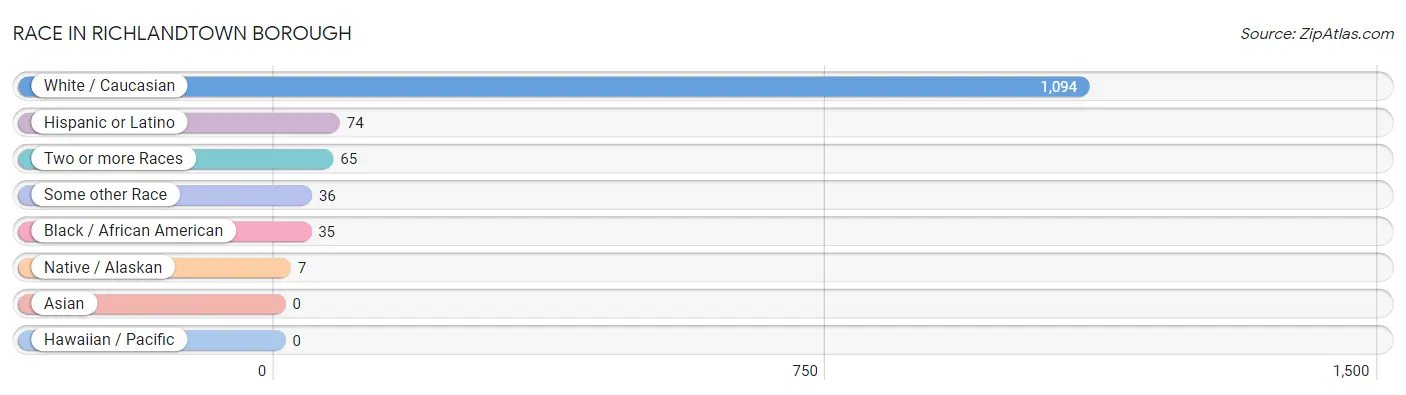
| Race | # Population | % Population |
| Asian | 0 | 0.0% |
| Black / African American | 35 | 2.8% |
| Hawaiian / Pacific | 0 | 0.0% |
| Hispanic or Latino | 74 | 6.0% |
| Native / Alaskan | 7 | 0.6% |
| White / Caucasian | 1,094 | 88.4% |
| Two or more Races | 65 | 5.2% |
| Some other Race | 36 | 2.9% |
| Total | 1,237 | 100.0% |
Ancestry in Richlandtown borough
The most populous ancestries reported in Richlandtown borough are German (428 | 34.6%), Irish (302 | 24.4%), Polish (130 | 10.5%), Italian (99 | 8.0%), and English (91 | 7.4%), together accounting for 84.9% of all Richlandtown borough residents.
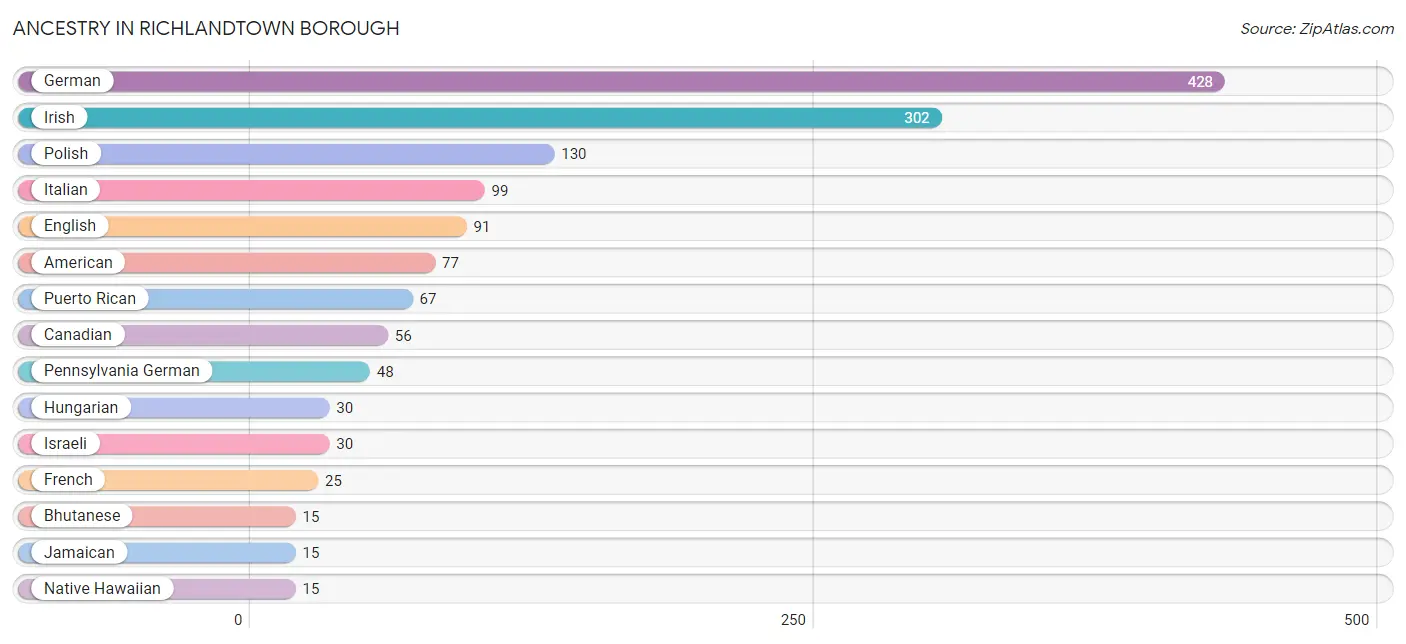
| Ancestry | # Population | % Population |
| American | 77 | 6.2% |
| Bhutanese | 15 | 1.2% |
| Canadian | 56 | 4.5% |
| Czech | 2 | 0.2% |
| Delaware | 7 | 0.6% |
| Dutch | 5 | 0.4% |
| English | 91 | 7.4% |
| French | 25 | 2.0% |
| German | 428 | 34.6% |
| Hungarian | 30 | 2.4% |
| Irish | 302 | 24.4% |
| Israeli | 30 | 2.4% |
| Italian | 99 | 8.0% |
| Jamaican | 15 | 1.2% |
| Native Hawaiian | 15 | 1.2% |
| Navajo | 7 | 0.6% |
| Norwegian | 2 | 0.2% |
| Pennsylvania German | 48 | 3.9% |
| Polish | 130 | 10.5% |
| Portuguese | 9 | 0.7% |
| Puerto Rican | 67 | 5.4% |
| Scotch-Irish | 9 | 0.7% |
| Scottish | 8 | 0.6% |
| Slavic | 10 | 0.8% |
| Slovak | 11 | 0.9% |
| Swedish | 4 | 0.3% |
| Swiss | 8 | 0.6% |
| Welsh | 7 | 0.6% | View All 28 Rows |
Immigrants in Richlandtown borough
The most numerous immigrant groups reported in Richlandtown borough came from Asia (32 | 2.6%), Latin America (23 | 1.9%), Indonesia (22 | 1.8%), South Eastern Asia (22 | 1.8%), and Caribbean (15 | 1.2%), together accounting for 9.2% of all Richlandtown borough residents.
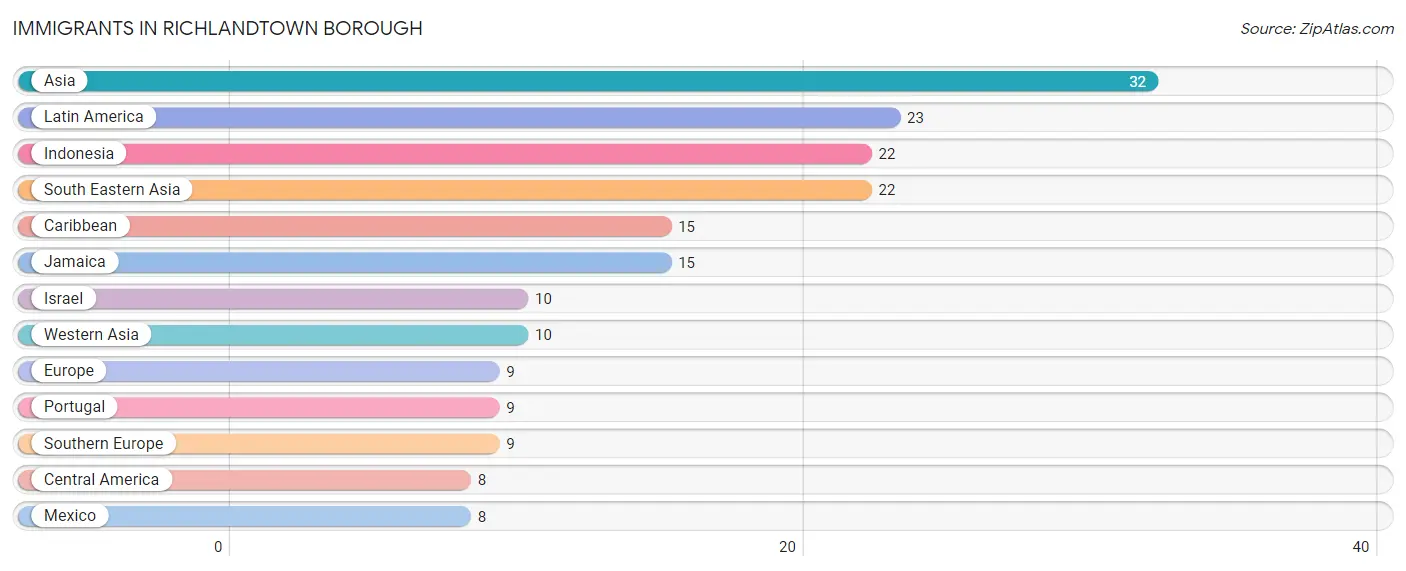
| Immigration Origin | # Population | % Population |
| Asia | 32 | 2.6% |
| Caribbean | 15 | 1.2% |
| Central America | 8 | 0.6% |
| Europe | 9 | 0.7% |
| Indonesia | 22 | 1.8% |
| Israel | 10 | 0.8% |
| Jamaica | 15 | 1.2% |
| Latin America | 23 | 1.9% |
| Mexico | 8 | 0.6% |
| Portugal | 9 | 0.7% |
| South Eastern Asia | 22 | 1.8% |
| Southern Europe | 9 | 0.7% |
| Western Asia | 10 | 0.8% | View All 13 Rows |
Sex and Age in Richlandtown borough
Sex and Age in Richlandtown borough
The most populous age groups in Richlandtown borough are 25 to 29 Years (81 | 13.6%) for men and 85 Years and over (69 | 10.8%) for women.
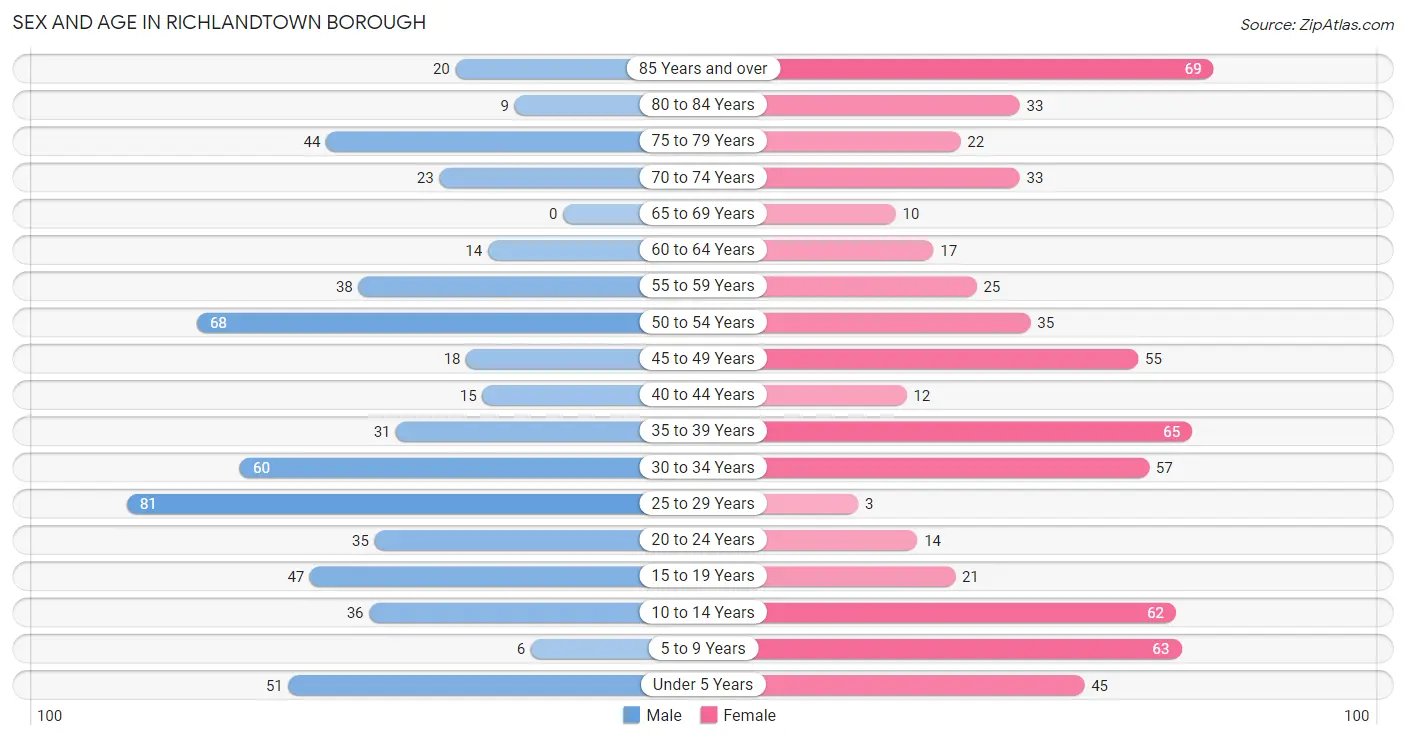
| Age Bracket | Male | Female |
| Under 5 Years | 51 (8.6%) | 45 (7.0%) |
| 5 to 9 Years | 6 (1.0%) | 63 (9.8%) |
| 10 to 14 Years | 36 (6.0%) | 62 (9.7%) |
| 15 to 19 Years | 47 (7.9%) | 21 (3.3%) |
| 20 to 24 Years | 35 (5.9%) | 14 (2.2%) |
| 25 to 29 Years | 81 (13.6%) | 3 (0.5%) |
| 30 to 34 Years | 60 (10.1%) | 57 (8.9%) |
| 35 to 39 Years | 31 (5.2%) | 65 (10.1%) |
| 40 to 44 Years | 15 (2.5%) | 12 (1.9%) |
| 45 to 49 Years | 18 (3.0%) | 55 (8.6%) |
| 50 to 54 Years | 68 (11.4%) | 35 (5.5%) |
| 55 to 59 Years | 38 (6.4%) | 25 (3.9%) |
| 60 to 64 Years | 14 (2.4%) | 17 (2.6%) |
| 65 to 69 Years | 0 (0.0%) | 10 (1.6%) |
| 70 to 74 Years | 23 (3.9%) | 33 (5.1%) |
| 75 to 79 Years | 44 (7.4%) | 22 (3.4%) |
| 80 to 84 Years | 9 (1.5%) | 33 (5.1%) |
| 85 Years and over | 20 (3.4%) | 69 (10.8%) |
| Total | 596 (100.0%) | 641 (100.0%) |
Families and Households in Richlandtown borough
Median Family Size in Richlandtown borough
The median family size in Richlandtown borough is 3.47 persons per family, with married-couple families (223 | 86.8%) accounting for the largest median family size of 3.5 persons per family. On the other hand, single male/father families (11 | 4.3%) represent the smallest median family size with 3.00 persons per family.
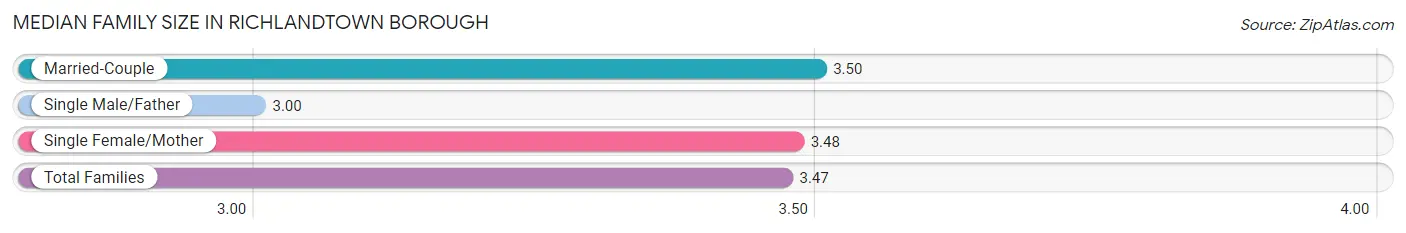
| Family Type | # Families | Family Size |
| Married-Couple | 223 (86.8%) | 3.50 |
| Single Male/Father | 11 (4.3%) | 3.00 |
| Single Female/Mother | 23 (8.9%) | 3.48 |
| Total Families | 257 (100.0%) | 3.47 |
Median Household Size in Richlandtown borough
The median household size in Richlandtown borough is 2.56 persons per household, with single female/mother households (23 | 5.4%) accounting for the largest median household size of 3.78 persons per household. non-family households (171 | 40.0%) represent the smallest median household size with 1.15 persons per household.
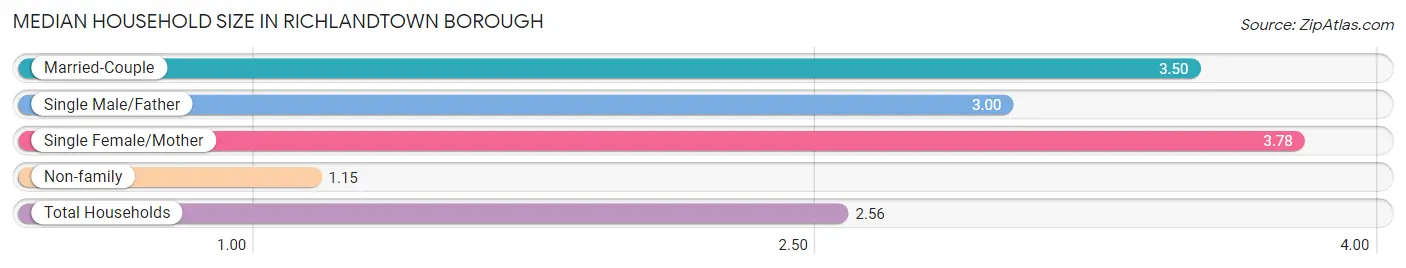
| Household Type | # Households | Household Size |
| Married-Couple | 223 (52.1%) | 3.50 |
| Single Male/Father | 11 (2.6%) | 3.00 |
| Single Female/Mother | 23 (5.4%) | 3.78 |
| Non-family | 171 (40.0%) | 1.15 |
| Total Households | 428 (100.0%) | 2.56 |
Household Size by Marriage Status in Richlandtown borough
Out of a total of 428 households in Richlandtown borough, 257 (60.1%) are family households, while 171 (40.0%) are nonfamily households. The most numerous type of family households are 4-person households, comprising 80, and the most common type of nonfamily households are 1-person households, comprising 141.
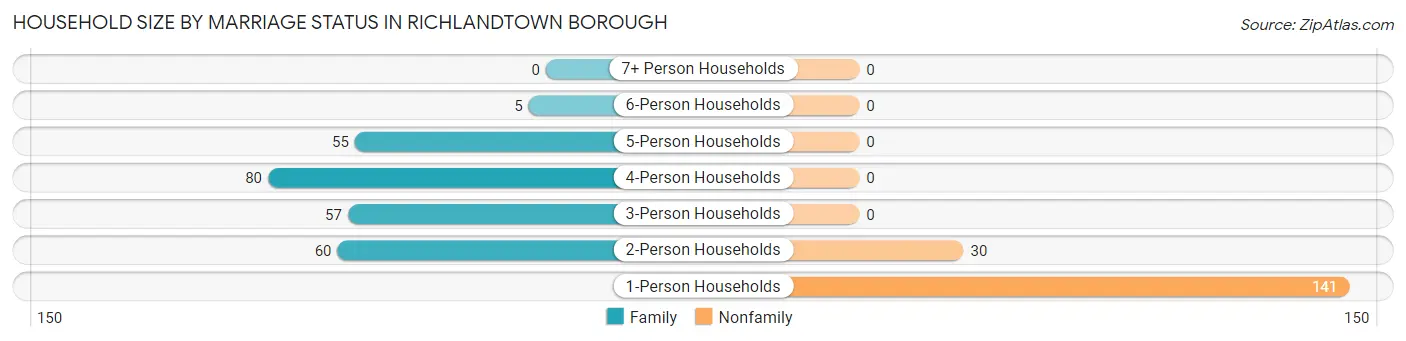
| Household Size | Family Households | Nonfamily Households |
| 1-Person Households | - | 141 (32.9%) |
| 2-Person Households | 60 (14.0%) | 30 (7.0%) |
| 3-Person Households | 57 (13.3%) | 0 (0.0%) |
| 4-Person Households | 80 (18.7%) | 0 (0.0%) |
| 5-Person Households | 55 (12.9%) | 0 (0.0%) |
| 6-Person Households | 5 (1.2%) | 0 (0.0%) |
| 7+ Person Households | 0 (0.0%) | 0 (0.0%) |
| Total | 257 (60.1%) | 171 (40.0%) |
Female Fertility in Richlandtown borough
Fertility by Age in Richlandtown borough
Average fertility rate in Richlandtown borough is 62.0 births per 1,000 women. Women in the age bracket of 20 to 34 years have the highest fertility rate with 135.0 births per 1,000 women. Women in the age bracket of 20 to 34 years acount for 71.4% of all women with births.
| Age Bracket | Women with Births | Births / 1,000 Women |
| 15 to 19 years | 0 (0.0%) | 0.0 |
| 20 to 34 years | 10 (71.4%) | 135.0 |
| 35 to 50 years | 4 (28.6%) | 30.0 |
| Total | 14 (100.0%) | 62.0 |
Fertility by Age by Marriage Status in Richlandtown borough
| Age Bracket | Married | Unmarried |
| 15 to 19 years | 0 (0.0%) | 0 (0.0%) |
| 20 to 34 years | 10 (100.0%) | 0 (0.0%) |
| 35 to 50 years | 4 (100.0%) | 0 (0.0%) |
| Total | 14 (100.0%) | 0 (0.0%) |
Fertility by Education in Richlandtown borough
| Educational Attainment | Women with Births | Births / 1,000 Women |
| Less than High School | 0 (0.0%) | 0.0 |
| High School Diploma | 0 (0.0%) | 0.0 |
| College or Associate's Degree | 5 (35.7%) | 96.0 |
| Bachelor's Degree | 5 (35.7%) | 89.0 |
| Graduate Degree | 4 (28.6%) | 267.0 |
| Total | 14 (100.0%) | 62.0 |
Fertility by Education by Marriage Status in Richlandtown borough
| Educational Attainment | Married | Unmarried |
| Less than High School | 0 (0.0%) | 0 (0.0%) |
| High School Diploma | 0 (0.0%) | 0 (0.0%) |
| College or Associate's Degree | 5 (100.0%) | 0 (0.0%) |
| Bachelor's Degree | 5 (100.0%) | 0 (0.0%) |
| Graduate Degree | 4 (100.0%) | 0 (0.0%) |
| Total | 14 (100.0%) | 0 (0.0%) |
Employment Characteristics in Richlandtown borough
Employment by Class of Employer in Richlandtown borough
Among the 612 employed individuals in Richlandtown borough, private company employees (443 | 72.4%), not-for-profit organizations (69 | 11.3%), and self-employed (incorporated) (54 | 8.8%) make up the most common classes of employment.
| Employer Class | # Employees | % Employees |
| Private Company Employees | 443 | 72.4% |
| Self-Employed (Incorporated) | 54 | 8.8% |
| Self-Employed (Not Incorporated) | 25 | 4.1% |
| Not-for-profit Organizations | 69 | 11.3% |
| Local Government Employees | 16 | 2.6% |
| State Government Employees | 5 | 0.8% |
| Federal Government Employees | 0 | 0.0% |
| Unpaid Family Workers | 0 | 0.0% |
| Total | 612 | 100.0% |
Employment Status by Age in Richlandtown borough
According to the labor force statistics for Richlandtown borough, out of the total population over 16 years of age (950), 68.2% or 648 individuals are in the labor force, with 5.1% or 33 of them unemployed. The age group with the highest labor force participation rate is 25 to 29 years, with 100.0% or 84 individuals in the labor force. Within the labor force, the 75 years and over age range has the highest percentage of unemployed individuals, with 76.9% or 10 of them being unemployed.
| Age Bracket | In Labor Force | Unemployed |
| 16 to 19 Years | 33 (75.0%) | 0 (0.0%) |
| 20 to 24 Years | 44 (89.8%) | 4 (9.1%) |
| 25 to 29 Years | 84 (100.0%) | 0 (0.0%) |
| 30 to 34 Years | 103 (88.0%) | 0 (0.0%) |
| 35 to 44 Years | 112 (91.1%) | 15 (13.4%) |
| 45 to 54 Years | 176 (100.0%) | 0 (0.0%) |
| 55 to 59 Years | 53 (84.1%) | 4 (7.5%) |
| 60 to 64 Years | 20 (64.5%) | 0 (0.0%) |
| 65 to 74 Years | 10 (15.2%) | 0 (0.0%) |
| 75 Years and over | 13 (6.6%) | 10 (76.9%) |
| Total | 648 (68.2%) | 33 (5.1%) |
Employment Status by Educational Attainment in Richlandtown borough
According to labor force statistics for Richlandtown borough, 92.3% of individuals (548) out of the total population between 25 and 64 years of age (594) are in the labor force, with 3.5% or 19 of them being unemployed. The group with the highest labor force participation rate are those with the educational attainment of bachelor's degree or higher, with 96.8% or 181 individuals in the labor force. Within the labor force, individuals with college / associate degree education have the highest percentage of unemployment, with 11.5% or 15 of them being unemployed.
| Educational Attainment | In Labor Force | Unemployed |
| Less than High School | 0 (0.0%) | 0 (0.0%) |
| High School Diploma | 236 (93.3%) | 4 (1.7%) |
| College / Associate Degree | 131 (89.7%) | 17 (11.5%) |
| Bachelor's Degree or higher | 181 (96.8%) | 0 (0.0%) |
| Total | 548 (92.3%) | 21 (3.5%) |
Employment Occupations by Sex in Richlandtown borough
Management, Business, Science and Arts Occupations
The most common Management, Business, Science and Arts occupations in Richlandtown borough are Community & Social Service (69 | 11.2%), Management (58 | 9.4%), Education Instruction & Library (54 | 8.8%), Computers, Engineering & Science (41 | 6.7%), and Computers & Mathematics (27 | 4.4%).
Management, Business, Science and Arts Occupations by Sex
Within the Management, Business, Science and Arts occupations in Richlandtown borough, the most male-oriented occupations are Computers & Mathematics (100.0%), Management (77.6%), and Computers, Engineering & Science (65.8%), while the most female-oriented occupations are Business & Financial (100.0%), Architecture & Engineering (100.0%), and Education, Arts & Media (100.0%).
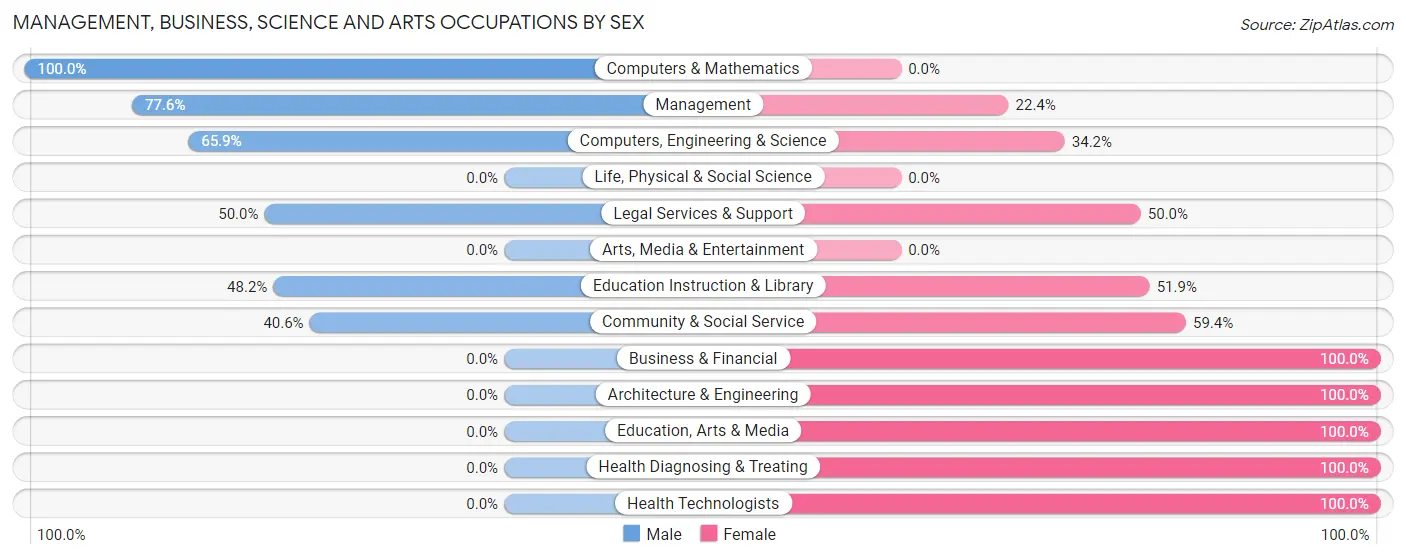
| Occupation | Male | Female |
| Management | 45 (77.6%) | 13 (22.4%) |
| Business & Financial | 0 (0.0%) | 13 (100.0%) |
| Computers, Engineering & Science | 27 (65.8%) | 14 (34.2%) |
| Computers & Mathematics | 27 (100.0%) | 0 (0.0%) |
| Architecture & Engineering | 0 (0.0%) | 14 (100.0%) |
| Life, Physical & Social Science | 0 (0.0%) | 0 (0.0%) |
| Community & Social Service | 28 (40.6%) | 41 (59.4%) |
| Education, Arts & Media | 0 (0.0%) | 11 (100.0%) |
| Legal Services & Support | 2 (50.0%) | 2 (50.0%) |
| Education Instruction & Library | 26 (48.1%) | 28 (51.8%) |
| Arts, Media & Entertainment | 0 (0.0%) | 0 (0.0%) |
| Health Diagnosing & Treating | 0 (0.0%) | 24 (100.0%) |
| Health Technologists | 0 (0.0%) | 12 (100.0%) |
| Total (Category) | 100 (48.8%) | 105 (51.2%) |
| Total (Overall) | 347 (56.4%) | 268 (43.6%) |
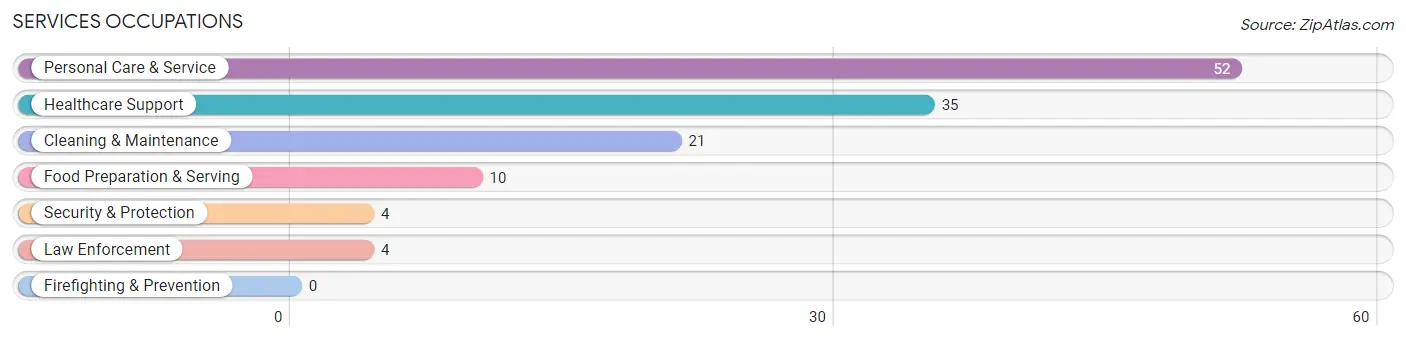
Services Occupations
The most common Services occupations in Richlandtown borough are Personal Care & Service (52 | 8.5%), Healthcare Support (35 | 5.7%), Cleaning & Maintenance (21 | 3.4%), Food Preparation & Serving (10 | 1.6%), and Security & Protection (4 | 0.6%).
Services Occupations by Sex
Within the Services occupations in Richlandtown borough, the most male-oriented occupations are Security & Protection (100.0%), Law Enforcement (100.0%), and Cleaning & Maintenance (52.4%), while the most female-oriented occupations are Healthcare Support (100.0%), Food Preparation & Serving (80.0%), and Personal Care & Service (78.8%).
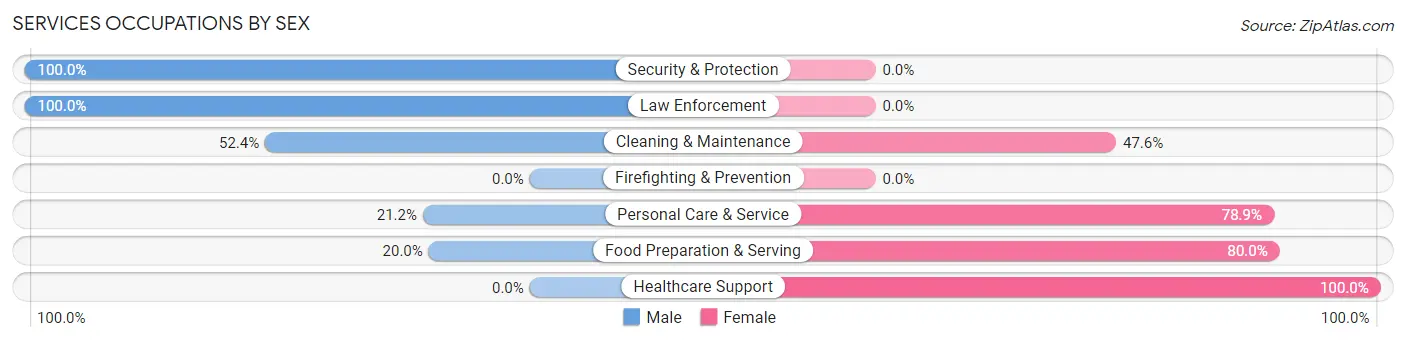
| Occupation | Male | Female |
| Healthcare Support | 0 (0.0%) | 35 (100.0%) |
| Security & Protection | 4 (100.0%) | 0 (0.0%) |
| Firefighting & Prevention | 0 (0.0%) | 0 (0.0%) |
| Law Enforcement | 4 (100.0%) | 0 (0.0%) |
| Food Preparation & Serving | 2 (20.0%) | 8 (80.0%) |
| Cleaning & Maintenance | 11 (52.4%) | 10 (47.6%) |
| Personal Care & Service | 11 (21.1%) | 41 (78.8%) |
| Total (Category) | 28 (23.0%) | 94 (77.0%) |
| Total (Overall) | 347 (56.4%) | 268 (43.6%) |
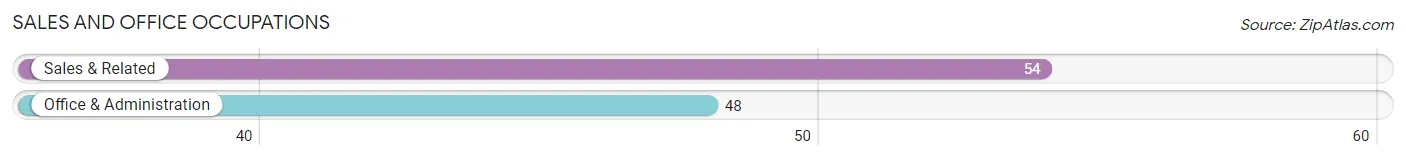
Sales and Office Occupations
The most common Sales and Office occupations in Richlandtown borough are Sales & Related (54 | 8.8%), and Office & Administration (48 | 7.8%).
Sales and Office Occupations by Sex
| Occupation | Male | Female |
| Sales & Related | 42 (77.8%) | 12 (22.2%) |
| Office & Administration | 5 (10.4%) | 43 (89.6%) |
| Total (Category) | 47 (46.1%) | 55 (53.9%) |
| Total (Overall) | 347 (56.4%) | 268 (43.6%) |
Natural Resources, Construction and Maintenance Occupations
The most common Natural Resources, Construction and Maintenance occupations in Richlandtown borough are Construction & Extraction (41 | 6.7%), and Installation, Maintenance & Repair (39 | 6.3%).
Natural Resources, Construction and Maintenance Occupations by Sex
| Occupation | Male | Female |
| Farming, Fishing & Forestry | 0 (0.0%) | 0 (0.0%) |
| Construction & Extraction | 41 (100.0%) | 0 (0.0%) |
| Installation, Maintenance & Repair | 39 (100.0%) | 0 (0.0%) |
| Total (Category) | 80 (100.0%) | 0 (0.0%) |
| Total (Overall) | 347 (56.4%) | 268 (43.6%) |
Production, Transportation and Moving Occupations
The most common Production, Transportation and Moving occupations in Richlandtown borough are Production (58 | 9.4%), Material Moving (28 | 4.5%), and Transportation (20 | 3.3%).
Production, Transportation and Moving Occupations by Sex
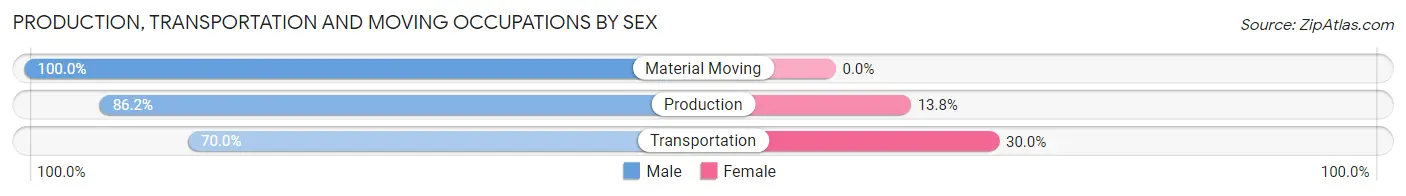
| Occupation | Male | Female |
| Production | 50 (86.2%) | 8 (13.8%) |
| Transportation | 14 (70.0%) | 6 (30.0%) |
| Material Moving | 28 (100.0%) | 0 (0.0%) |
| Total (Category) | 92 (86.8%) | 14 (13.2%) |
| Total (Overall) | 347 (56.4%) | 268 (43.6%) |
Employment Industries by Sex in Richlandtown borough
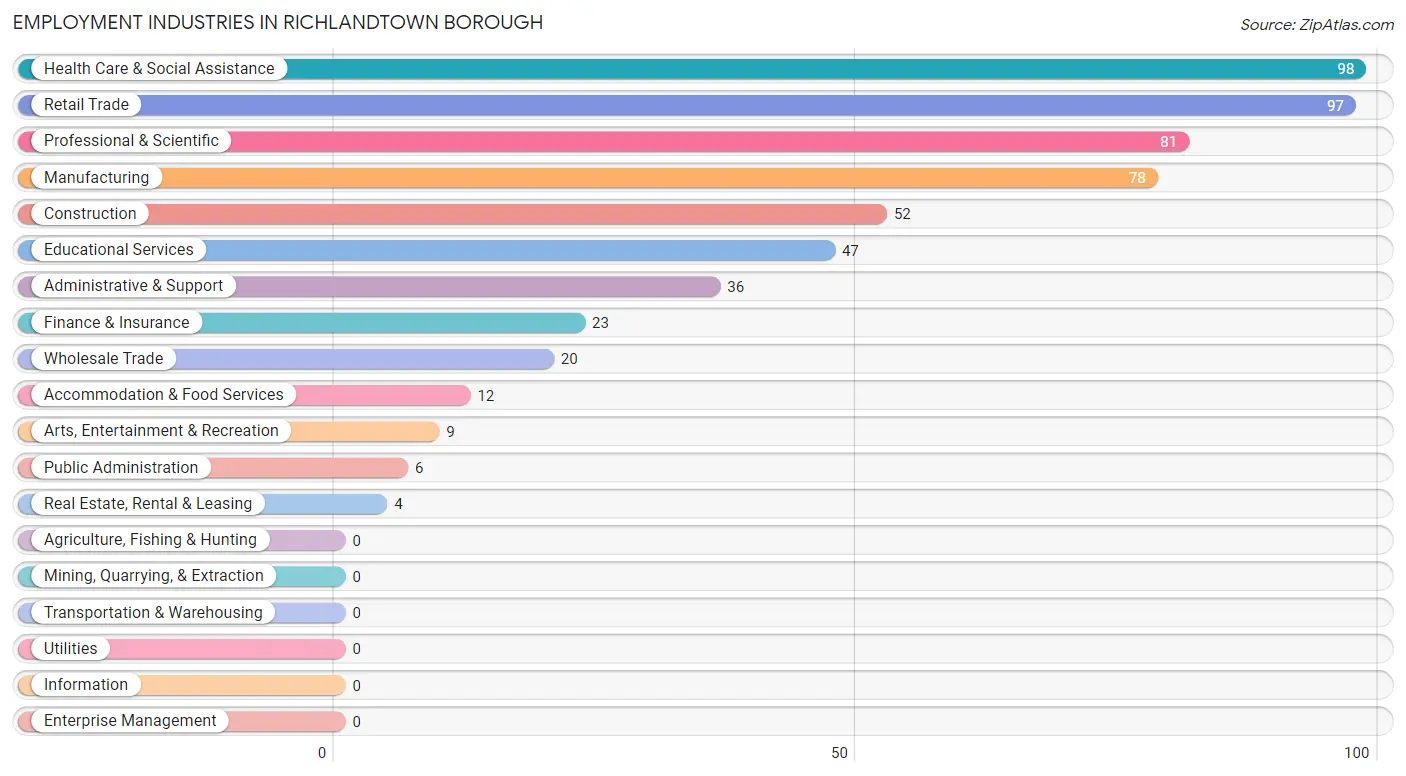
Employment Industries in Richlandtown borough
The major employment industries in Richlandtown borough include Health Care & Social Assistance (98 | 15.9%), Retail Trade (97 | 15.8%), Professional & Scientific (81 | 13.2%), Manufacturing (78 | 12.7%), and Construction (52 | 8.5%).
Employment Industries by Sex in Richlandtown borough
The Richlandtown borough industries that see more men than women are Arts, Entertainment & Recreation (100.0%), Public Administration (100.0%), and Construction (94.2%), whereas the industries that tend to have a higher number of women are Real Estate, Rental & Leasing (100.0%), Health Care & Social Assistance (100.0%), and Accommodation & Food Services (83.3%).
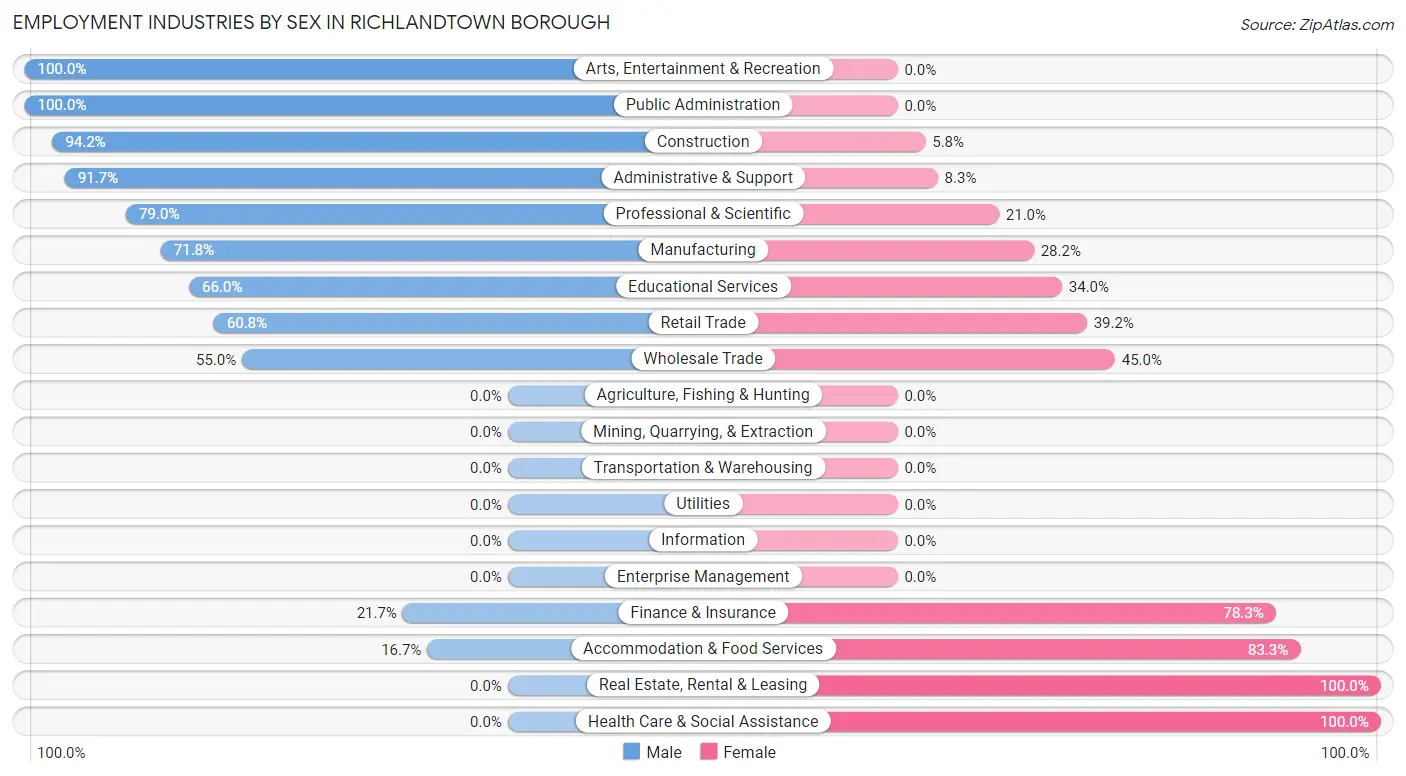
| Industry | Male | Female |
| Agriculture, Fishing & Hunting | 0 (0.0%) | 0 (0.0%) |
| Mining, Quarrying, & Extraction | 0 (0.0%) | 0 (0.0%) |
| Construction | 49 (94.2%) | 3 (5.8%) |
| Manufacturing | 56 (71.8%) | 22 (28.2%) |
| Wholesale Trade | 11 (55.0%) | 9 (45.0%) |
| Retail Trade | 59 (60.8%) | 38 (39.2%) |
| Transportation & Warehousing | 0 (0.0%) | 0 (0.0%) |
| Utilities | 0 (0.0%) | 0 (0.0%) |
| Information | 0 (0.0%) | 0 (0.0%) |
| Finance & Insurance | 5 (21.7%) | 18 (78.3%) |
| Real Estate, Rental & Leasing | 0 (0.0%) | 4 (100.0%) |
| Professional & Scientific | 64 (79.0%) | 17 (21.0%) |
| Enterprise Management | 0 (0.0%) | 0 (0.0%) |
| Administrative & Support | 33 (91.7%) | 3 (8.3%) |
| Educational Services | 31 (66.0%) | 16 (34.0%) |
| Health Care & Social Assistance | 0 (0.0%) | 98 (100.0%) |
| Arts, Entertainment & Recreation | 9 (100.0%) | 0 (0.0%) |
| Accommodation & Food Services | 2 (16.7%) | 10 (83.3%) |
| Public Administration | 6 (100.0%) | 0 (0.0%) |
| Total | 347 (56.4%) | 268 (43.6%) |
Education in Richlandtown borough
School Enrollment in Richlandtown borough
The most common levels of schooling among the 260 students in Richlandtown borough are middle school (93 | 35.8%), elementary school (67 | 25.8%), and high school (35 | 13.5%).
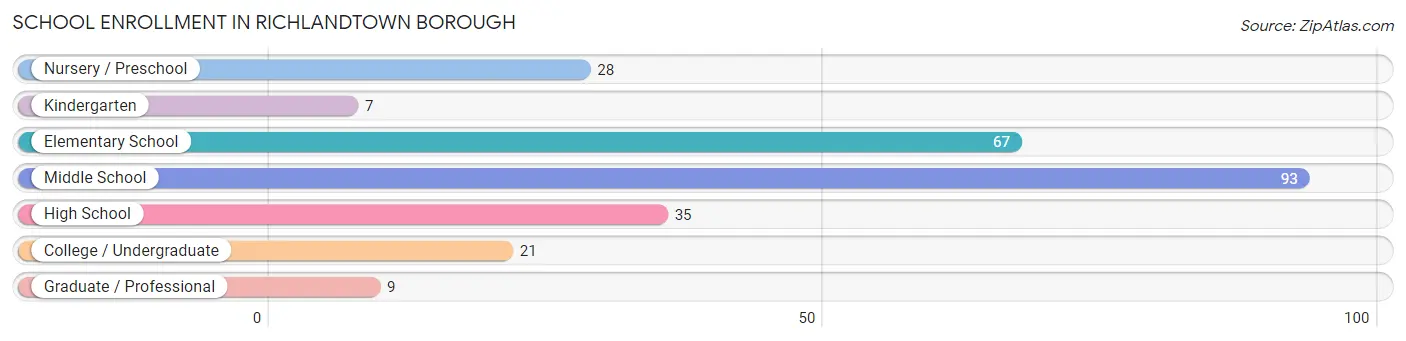
| School Level | # Students | % Students |
| Nursery / Preschool | 28 | 10.8% |
| Kindergarten | 7 | 2.7% |
| Elementary School | 67 | 25.8% |
| Middle School | 93 | 35.8% |
| High School | 35 | 13.5% |
| College / Undergraduate | 21 | 8.1% |
| Graduate / Professional | 9 | 3.5% |
| Total | 260 | 100.0% |
School Enrollment by Age by Funding Source in Richlandtown borough
Out of a total of 260 students who are enrolled in schools in Richlandtown borough, 45 (17.3%) attend a private institution, while the remaining 215 (82.7%) are enrolled in public schools. The age group of 15 to 17 year olds has the highest likelihood of being enrolled in private schools, with 22 (62.9% in the age bracket) enrolled. Conversely, the age group of 10 to 14 year olds has the lowest likelihood of being enrolled in a private school, with 93 (94.9% in the age bracket) attending a public institution.
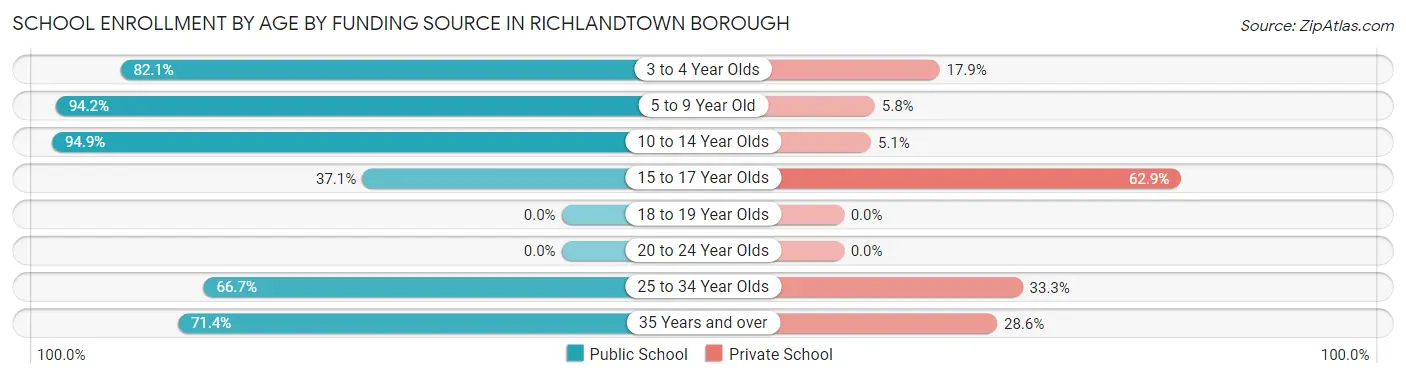
| Age Bracket | Public School | Private School |
| 3 to 4 Year Olds | 23 (82.1%) | 5 (17.9%) |
| 5 to 9 Year Old | 65 (94.2%) | 4 (5.8%) |
| 10 to 14 Year Olds | 93 (94.9%) | 5 (5.1%) |
| 15 to 17 Year Olds | 13 (37.1%) | 22 (62.9%) |
| 18 to 19 Year Olds | 0 (0.0%) | 0 (0.0%) |
| 20 to 24 Year Olds | 0 (0.0%) | 0 (0.0%) |
| 25 to 34 Year Olds | 6 (66.7%) | 3 (33.3%) |
| 35 Years and over | 15 (71.4%) | 6 (28.6%) |
| Total | 215 (82.7%) | 45 (17.3%) |
Educational Attainment by Field of Study in Richlandtown borough
Liberal arts & history (55 | 20.4%), education (54 | 20.1%), social sciences (28 | 10.4%), bio, nature & agricultural (24 | 8.9%), and business (22 | 8.2%) are the most common fields of study among 269 individuals in Richlandtown borough who have obtained a bachelor's degree or higher.
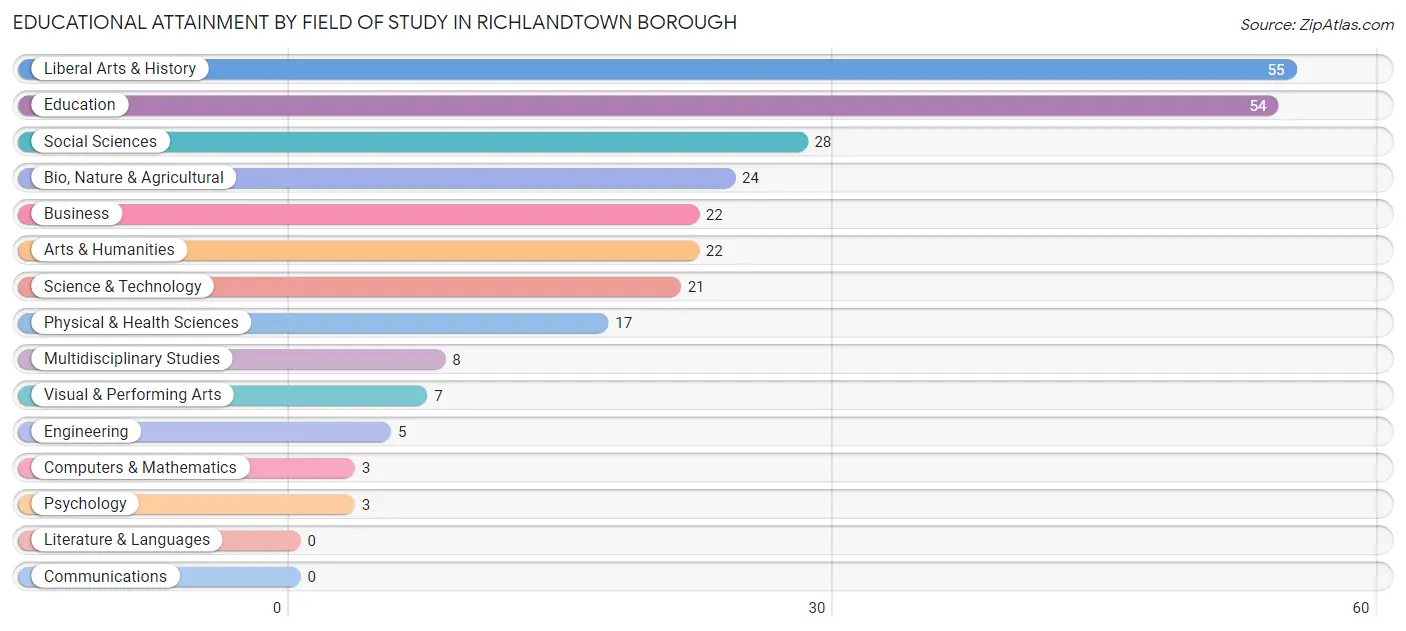
| Field of Study | # Graduates | % Graduates |
| Computers & Mathematics | 3 | 1.1% |
| Bio, Nature & Agricultural | 24 | 8.9% |
| Physical & Health Sciences | 17 | 6.3% |
| Psychology | 3 | 1.1% |
| Social Sciences | 28 | 10.4% |
| Engineering | 5 | 1.9% |
| Multidisciplinary Studies | 8 | 3.0% |
| Science & Technology | 21 | 7.8% |
| Business | 22 | 8.2% |
| Education | 54 | 20.1% |
| Literature & Languages | 0 | 0.0% |
| Liberal Arts & History | 55 | 20.4% |
| Visual & Performing Arts | 7 | 2.6% |
| Communications | 0 | 0.0% |
| Arts & Humanities | 22 | 8.2% |
| Total | 269 | 100.0% |
Transportation & Commute in Richlandtown borough
Vehicle Availability by Sex in Richlandtown borough
The most prevalent vehicle ownership categories in Richlandtown borough are males with 2 vehicles (120, accounting for 34.6%) and females with 2 vehicles (118, making up 45.3%).
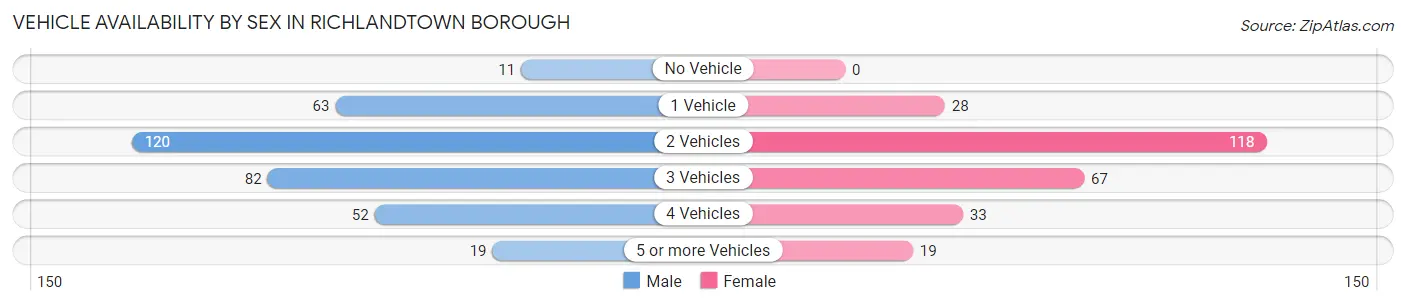
| Vehicles Available | Male | Female |
| No Vehicle | 11 (3.2%) | 0 (0.0%) |
| 1 Vehicle | 63 (18.2%) | 28 (10.6%) |
| 2 Vehicles | 120 (34.6%) | 118 (44.5%) |
| 3 Vehicles | 82 (23.6%) | 67 (25.3%) |
| 4 Vehicles | 52 (15.0%) | 33 (12.4%) |
| 5 or more Vehicles | 19 (5.5%) | 19 (7.2%) |
| Total | 347 (100.0%) | 265 (100.0%) |
Commute Time in Richlandtown borough
The most frequently occuring commute durations in Richlandtown borough are 10 to 14 minutes (109 commuters, 19.9%), 45 to 59 minutes (76 commuters, 13.8%), and 20 to 24 minutes (65 commuters, 11.8%).
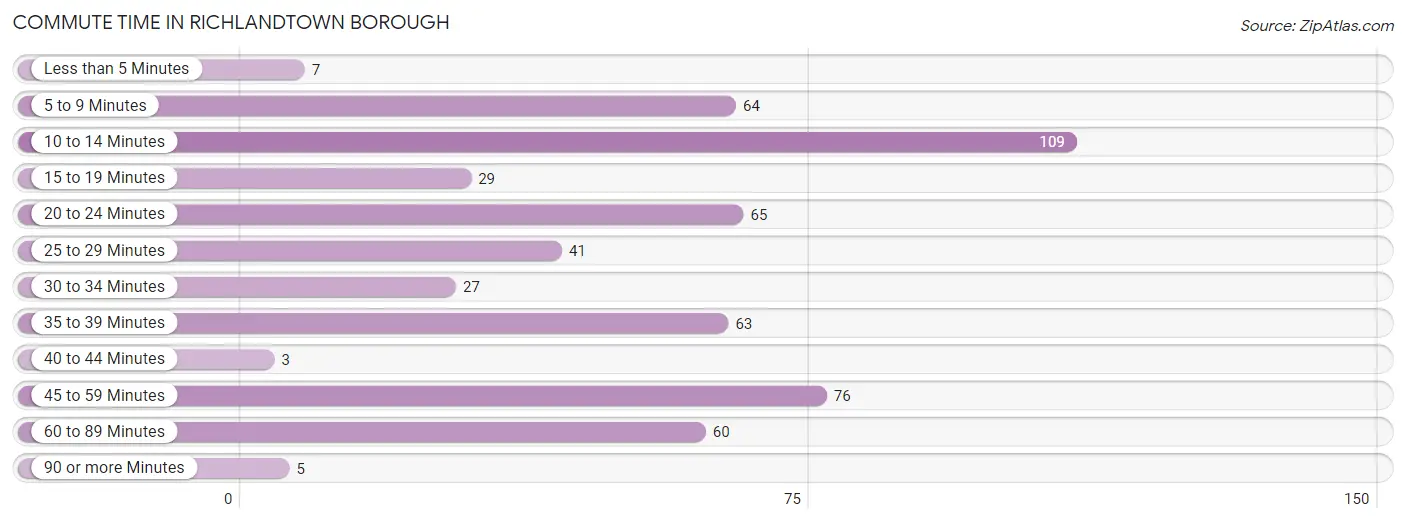
| Commute Time | # Commuters | % Commuters |
| Less than 5 Minutes | 7 | 1.3% |
| 5 to 9 Minutes | 64 | 11.7% |
| 10 to 14 Minutes | 109 | 19.9% |
| 15 to 19 Minutes | 29 | 5.3% |
| 20 to 24 Minutes | 65 | 11.8% |
| 25 to 29 Minutes | 41 | 7.5% |
| 30 to 34 Minutes | 27 | 4.9% |
| 35 to 39 Minutes | 63 | 11.5% |
| 40 to 44 Minutes | 3 | 0.5% |
| 45 to 59 Minutes | 76 | 13.8% |
| 60 to 89 Minutes | 60 | 10.9% |
| 90 or more Minutes | 5 | 0.9% |
Commute Time by Sex in Richlandtown borough
The most common commute times in Richlandtown borough are 10 to 14 minutes (76 commuters, 24.3%) for males and 20 to 24 minutes (61 commuters, 25.9%) for females.
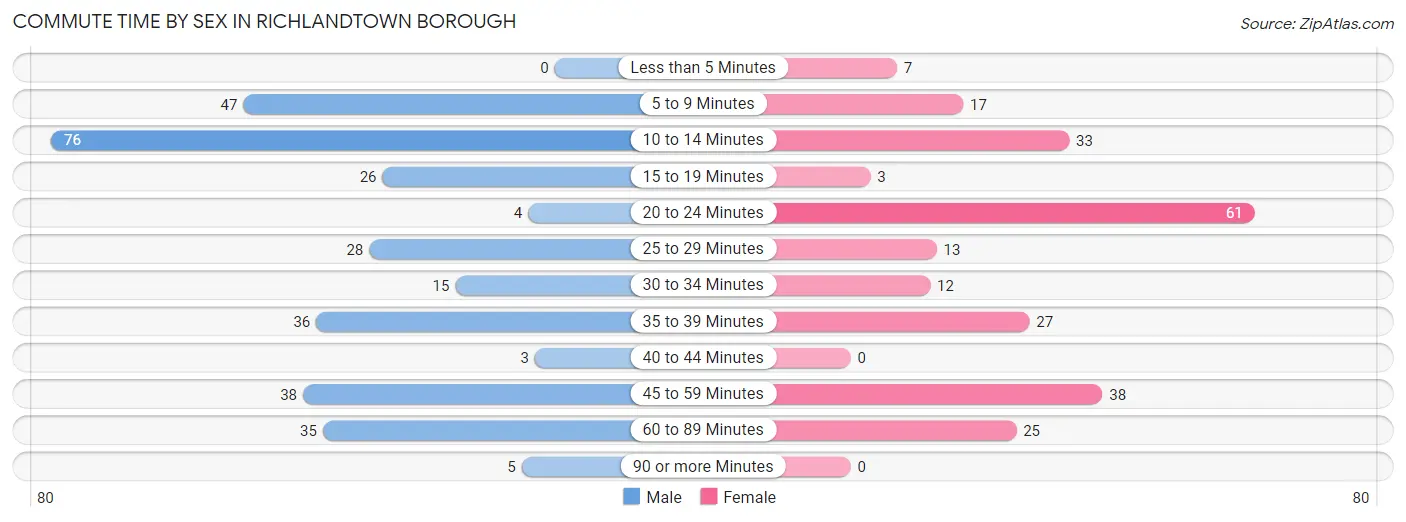
| Commute Time | Male | Female |
| Less than 5 Minutes | 0 (0.0%) | 7 (3.0%) |
| 5 to 9 Minutes | 47 (15.0%) | 17 (7.2%) |
| 10 to 14 Minutes | 76 (24.3%) | 33 (14.0%) |
| 15 to 19 Minutes | 26 (8.3%) | 3 (1.3%) |
| 20 to 24 Minutes | 4 (1.3%) | 61 (25.9%) |
| 25 to 29 Minutes | 28 (8.9%) | 13 (5.5%) |
| 30 to 34 Minutes | 15 (4.8%) | 12 (5.1%) |
| 35 to 39 Minutes | 36 (11.5%) | 27 (11.4%) |
| 40 to 44 Minutes | 3 (1.0%) | 0 (0.0%) |
| 45 to 59 Minutes | 38 (12.1%) | 38 (16.1%) |
| 60 to 89 Minutes | 35 (11.2%) | 25 (10.6%) |
| 90 or more Minutes | 5 (1.6%) | 0 (0.0%) |
Time of Departure to Work by Sex in Richlandtown borough
The most frequent times of departure to work in Richlandtown borough are 6:00 AM to 6:29 AM (66, 21.1%) for males and 8:00 AM to 8:29 AM (41, 17.4%) for females.
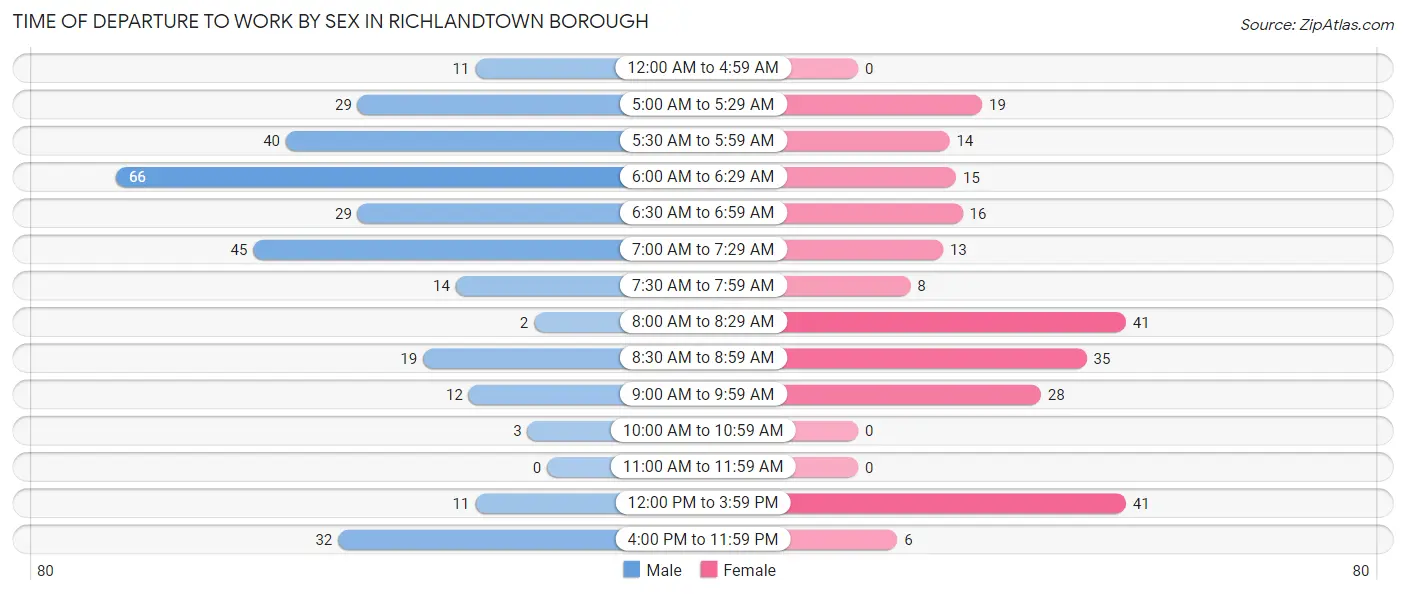
| Time of Departure | Male | Female |
| 12:00 AM to 4:59 AM | 11 (3.5%) | 0 (0.0%) |
| 5:00 AM to 5:29 AM | 29 (9.3%) | 19 (8.1%) |
| 5:30 AM to 5:59 AM | 40 (12.8%) | 14 (5.9%) |
| 6:00 AM to 6:29 AM | 66 (21.1%) | 15 (6.4%) |
| 6:30 AM to 6:59 AM | 29 (9.3%) | 16 (6.8%) |
| 7:00 AM to 7:29 AM | 45 (14.4%) | 13 (5.5%) |
| 7:30 AM to 7:59 AM | 14 (4.5%) | 8 (3.4%) |
| 8:00 AM to 8:29 AM | 2 (0.6%) | 41 (17.4%) |
| 8:30 AM to 8:59 AM | 19 (6.1%) | 35 (14.8%) |
| 9:00 AM to 9:59 AM | 12 (3.8%) | 28 (11.9%) |
| 10:00 AM to 10:59 AM | 3 (1.0%) | 0 (0.0%) |
| 11:00 AM to 11:59 AM | 0 (0.0%) | 0 (0.0%) |
| 12:00 PM to 3:59 PM | 11 (3.5%) | 41 (17.4%) |
| 4:00 PM to 11:59 PM | 32 (10.2%) | 6 (2.5%) |
| Total | 313 (100.0%) | 236 (100.0%) |
Housing Occupancy in Richlandtown borough
Occupancy by Ownership in Richlandtown borough
Of the total 428 dwellings in Richlandtown borough, owner-occupied units account for 334 (78.0%), while renter-occupied units make up 94 (22.0%).
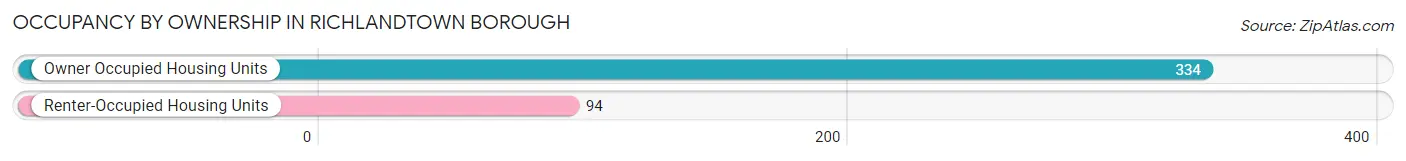
| Occupancy | # Housing Units | % Housing Units |
| Owner Occupied Housing Units | 334 | 78.0% |
| Renter-Occupied Housing Units | 94 | 22.0% |
| Total Occupied Housing Units | 428 | 100.0% |
Occupancy by Household Size in Richlandtown borough
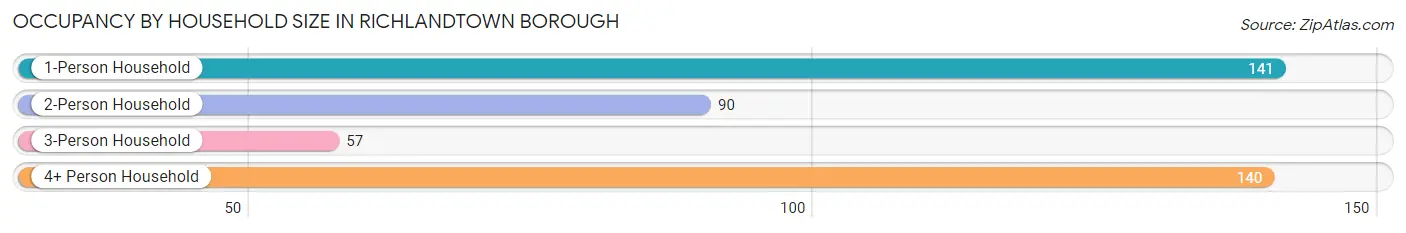
| Household Size | # Housing Units | % Housing Units |
| 1-Person Household | 141 | 32.9% |
| 2-Person Household | 90 | 21.0% |
| 3-Person Household | 57 | 13.3% |
| 4+ Person Household | 140 | 32.7% |
| Total Housing Units | 428 | 100.0% |
Occupancy by Ownership by Household Size in Richlandtown borough
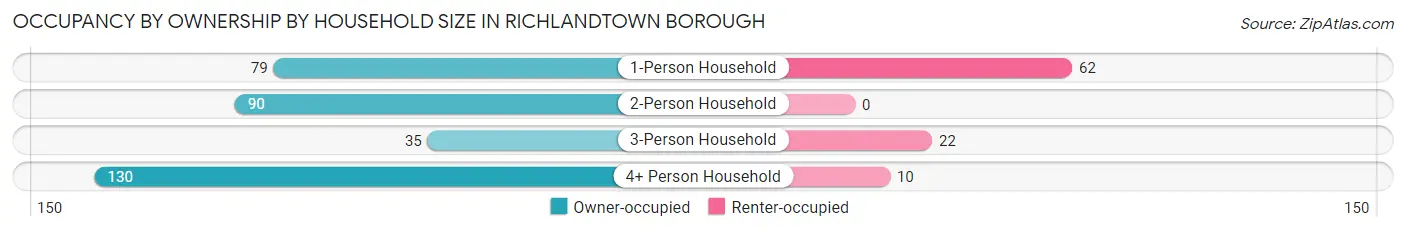
| Household Size | Owner-occupied | Renter-occupied |
| 1-Person Household | 79 (56.0%) | 62 (44.0%) |
| 2-Person Household | 90 (100.0%) | 0 (0.0%) |
| 3-Person Household | 35 (61.4%) | 22 (38.6%) |
| 4+ Person Household | 130 (92.9%) | 10 (7.1%) |
| Total Housing Units | 334 (78.0%) | 94 (22.0%) |
Occupancy by Educational Attainment in Richlandtown borough
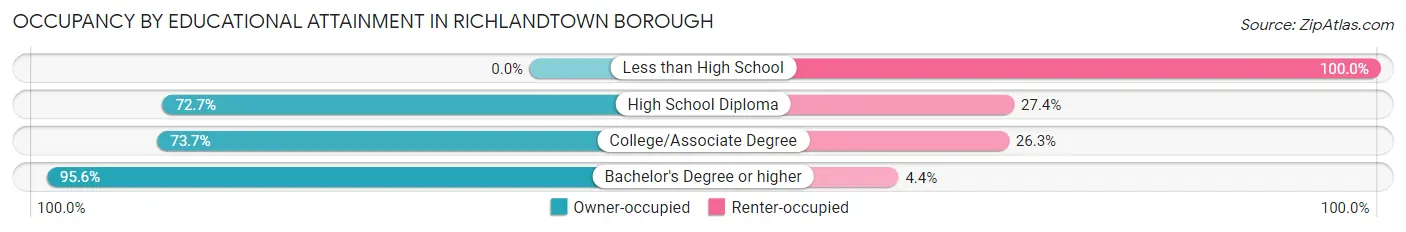
| Household Size | Owner-occupied | Renter-occupied |
| Less than High School | 0 (0.0%) | 5 (100.0%) |
| High School Diploma | 170 (72.7%) | 64 (27.4%) |
| College/Associate Degree | 56 (73.7%) | 20 (26.3%) |
| Bachelor's Degree or higher | 108 (95.6%) | 5 (4.4%) |
Occupancy by Age of Householder in Richlandtown borough
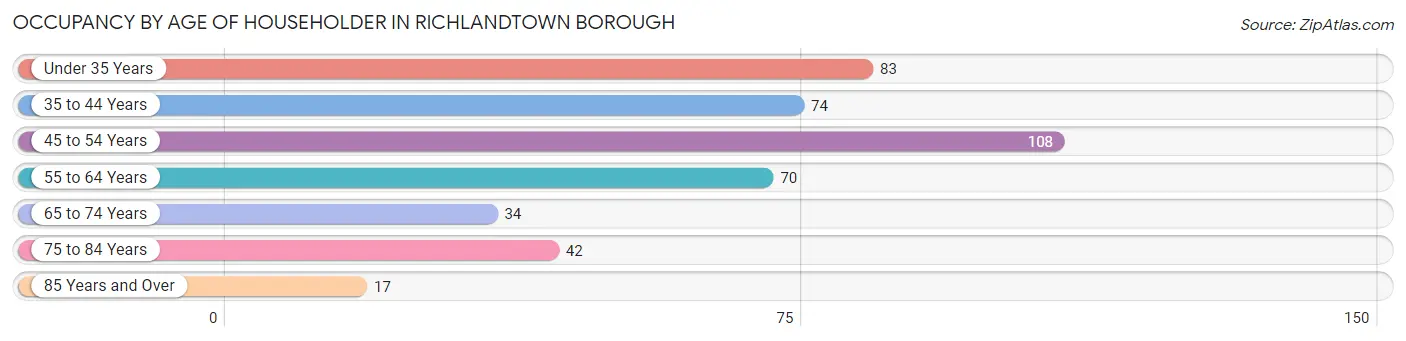
| Age Bracket | # Households | % Households |
| Under 35 Years | 83 | 19.4% |
| 35 to 44 Years | 74 | 17.3% |
| 45 to 54 Years | 108 | 25.2% |
| 55 to 64 Years | 70 | 16.4% |
| 65 to 74 Years | 34 | 7.9% |
| 75 to 84 Years | 42 | 9.8% |
| 85 Years and Over | 17 | 4.0% |
| Total | 428 | 100.0% |
Housing Finances in Richlandtown borough
Median Income by Occupancy in Richlandtown borough
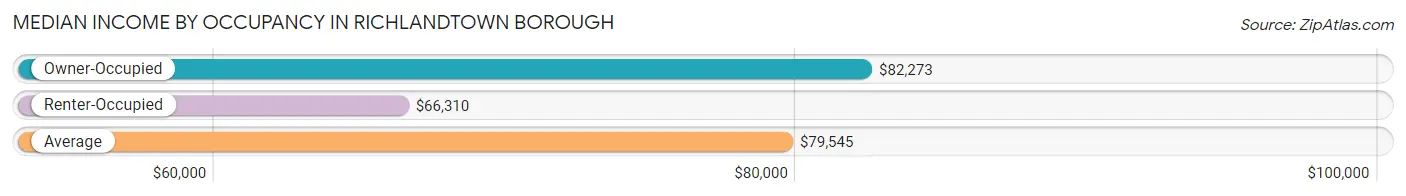
| Occupancy Type | # Households | Median Income |
| Owner-Occupied | 334 (78.0%) | $82,273 |
| Renter-Occupied | 94 (22.0%) | $66,310 |
| Average | 428 (100.0%) | $79,545 |
Occupancy by Householder Income Bracket in Richlandtown borough
| Income Bracket | Owner-occupied | Renter-occupied |
| Less than $5,000 | 7 (2.1%) | 0 (0.0%) |
| $5,000 to $9,999 | 7 (2.1%) | 0 (0.0%) |
| $10,000 to $14,999 | 7 (2.1%) | 0 (0.0%) |
| $15,000 to $19,999 | 0 (0.0%) | 7 (7.4%) |
| $20,000 to $24,999 | 3 (0.9%) | 7 (7.4%) |
| $25,000 to $34,999 | 10 (3.0%) | 15 (16.0%) |
| $35,000 to $49,999 | 19 (5.7%) | 0 (0.0%) |
| $50,000 to $74,999 | 95 (28.4%) | 28 (29.8%) |
| $75,000 to $99,999 | 40 (12.0%) | 35 (37.2%) |
| $100,000 to $149,999 | 79 (23.6%) | 2 (2.1%) |
| $150,000 or more | 67 (20.1%) | 0 (0.0%) |
| Total | 334 (100.0%) | 94 (100.0%) |
Monthly Housing Cost Tiers in Richlandtown borough
| Monthly Cost | Owner-occupied | Renter-occupied |
| Less than $300 | 11 (3.3%) | 14 (14.9%) |
| $300 to $499 | 22 (6.6%) | 0 (0.0%) |
| $500 to $799 | 74 (22.2%) | 9 (9.6%) |
| $800 to $999 | 10 (3.0%) | 14 (14.9%) |
| $1,000 to $1,499 | 68 (20.4%) | 15 (16.0%) |
| $1,500 to $1,999 | 92 (27.5%) | 33 (35.1%) |
| $2,000 to $2,499 | 30 (9.0%) | 0 (0.0%) |
| $2,500 to $2,999 | 27 (8.1%) | 9 (9.6%) |
| $3,000 or more | 0 (0.0%) | 0 (0.0%) |
| Total | 334 (100.0%) | 94 (100.0%) |
Physical Housing Characteristics in Richlandtown borough
Housing Structures in Richlandtown borough
| Structure Type | # Housing Units | % Housing Units |
| Single Unit, Detached | 159 | 37.1% |
| Single Unit, Attached | 203 | 47.4% |
| 2 Unit Apartments | 34 | 7.9% |
| 3 or 4 Unit Apartments | 7 | 1.6% |
| 5 to 9 Unit Apartments | 9 | 2.1% |
| 10 or more Apartments | 16 | 3.7% |
| Mobile Home / Other | 0 | 0.0% |
| Total | 428 | 100.0% |
Housing Structures by Occupancy in Richlandtown borough
| Structure Type | Owner-occupied | Renter-occupied |
| Single Unit, Detached | 159 (100.0%) | 0 (0.0%) |
| Single Unit, Attached | 175 (86.2%) | 28 (13.8%) |
| 2 Unit Apartments | 0 (0.0%) | 34 (100.0%) |
| 3 or 4 Unit Apartments | 0 (0.0%) | 7 (100.0%) |
| 5 to 9 Unit Apartments | 0 (0.0%) | 9 (100.0%) |
| 10 or more Apartments | 0 (0.0%) | 16 (100.0%) |
| Mobile Home / Other | 0 (0.0%) | 0 (0.0%) |
| Total | 334 (78.0%) | 94 (22.0%) |
Housing Structures by Number of Rooms in Richlandtown borough
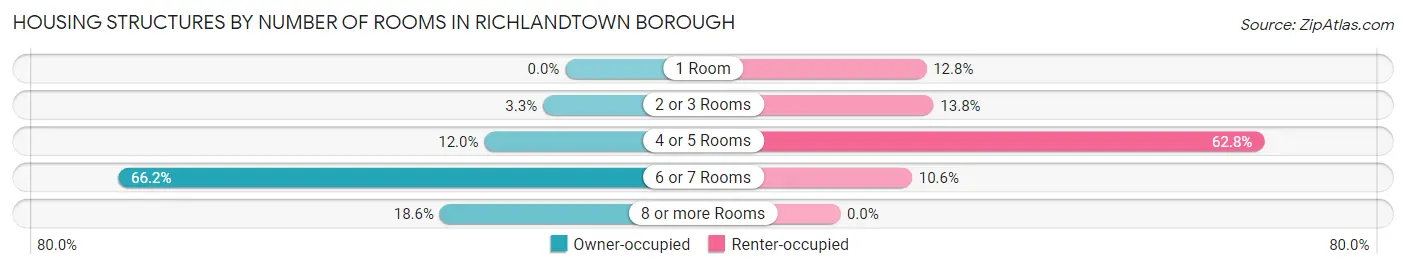
| Number of Rooms | Owner-occupied | Renter-occupied |
| 1 Room | 0 (0.0%) | 12 (12.8%) |
| 2 or 3 Rooms | 11 (3.3%) | 13 (13.8%) |
| 4 or 5 Rooms | 40 (12.0%) | 59 (62.8%) |
| 6 or 7 Rooms | 221 (66.2%) | 10 (10.6%) |
| 8 or more Rooms | 62 (18.6%) | 0 (0.0%) |
| Total | 334 (100.0%) | 94 (100.0%) |
Housing Structure by Heating Type in Richlandtown borough
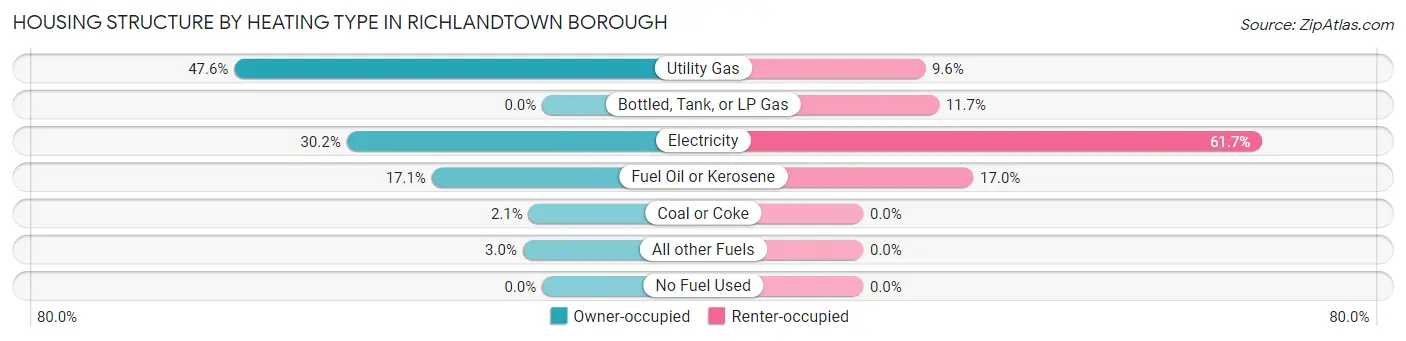
| Heating Type | Owner-occupied | Renter-occupied |
| Utility Gas | 159 (47.6%) | 9 (9.6%) |
| Bottled, Tank, or LP Gas | 0 (0.0%) | 11 (11.7%) |
| Electricity | 101 (30.2%) | 58 (61.7%) |
| Fuel Oil or Kerosene | 57 (17.1%) | 16 (17.0%) |
| Coal or Coke | 7 (2.1%) | 0 (0.0%) |
| All other Fuels | 10 (3.0%) | 0 (0.0%) |
| No Fuel Used | 0 (0.0%) | 0 (0.0%) |
| Total | 334 (100.0%) | 94 (100.0%) |
Household Vehicle Usage in Richlandtown borough
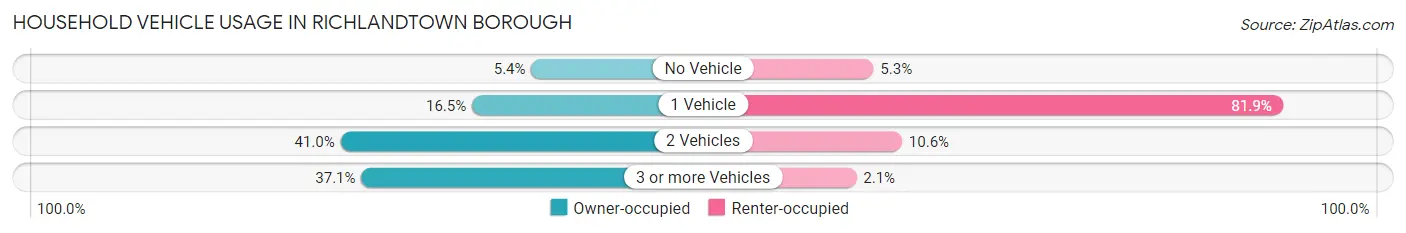
| Vehicles per Household | Owner-occupied | Renter-occupied |
| No Vehicle | 18 (5.4%) | 5 (5.3%) |
| 1 Vehicle | 55 (16.5%) | 77 (81.9%) |
| 2 Vehicles | 137 (41.0%) | 10 (10.6%) |
| 3 or more Vehicles | 124 (37.1%) | 2 (2.1%) |
| Total | 334 (100.0%) | 94 (100.0%) |
Real Estate & Mortgages in Richlandtown borough
Real Estate and Mortgage Overview in Richlandtown borough
| Characteristic | Without Mortgage | With Mortgage |
| Housing Units | 108 | 226 |
| Median Property Value | $280,800 | $263,100 |
| Median Household Income | $66,750 | $56 |
| Monthly Housing Costs | $641 | $0 |
| Real Estate Taxes | $4,025 | $3 |
Property Value by Mortgage Status in Richlandtown borough
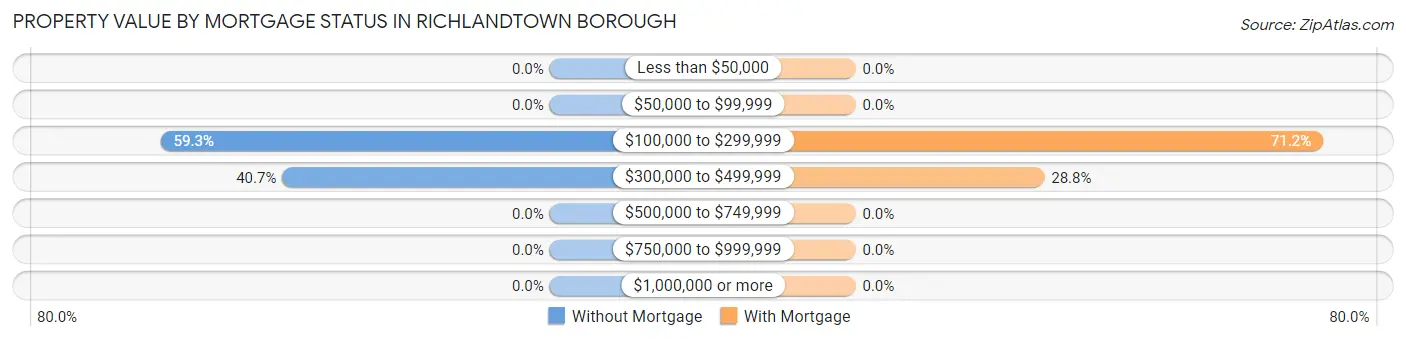
| Property Value | Without Mortgage | With Mortgage |
| Less than $50,000 | 0 (0.0%) | 0 (0.0%) |
| $50,000 to $99,999 | 0 (0.0%) | 0 (0.0%) |
| $100,000 to $299,999 | 64 (59.3%) | 161 (71.2%) |
| $300,000 to $499,999 | 44 (40.7%) | 65 (28.8%) |
| $500,000 to $749,999 | 0 (0.0%) | 0 (0.0%) |
| $750,000 to $999,999 | 0 (0.0%) | 0 (0.0%) |
| $1,000,000 or more | 0 (0.0%) | 0 (0.0%) |
| Total | 108 (100.0%) | 226 (100.0%) |
Household Income by Mortgage Status in Richlandtown borough
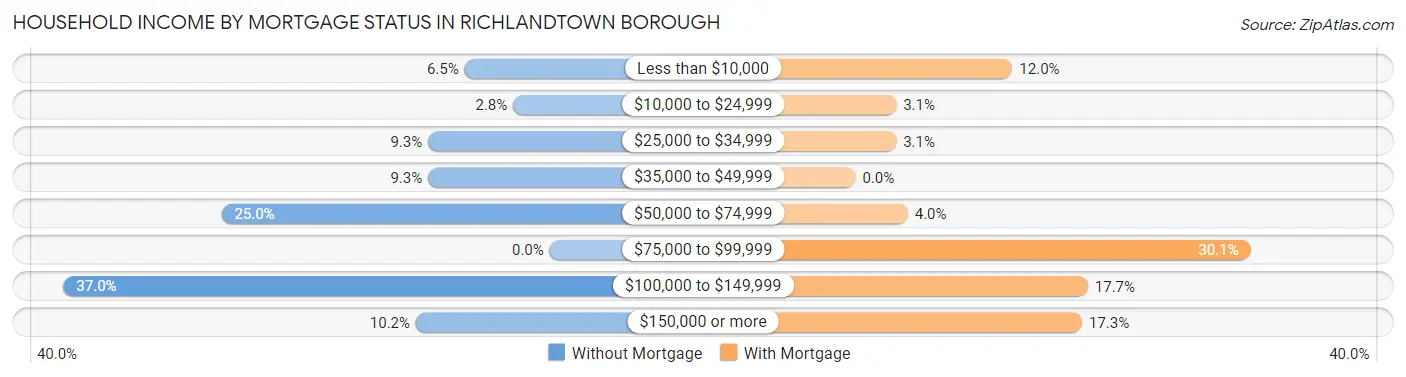
| Household Income | Without Mortgage | With Mortgage |
| Less than $10,000 | 7 (6.5%) | 27 (11.9%) |
| $10,000 to $24,999 | 3 (2.8%) | 7 (3.1%) |
| $25,000 to $34,999 | 10 (9.3%) | 7 (3.1%) |
| $35,000 to $49,999 | 10 (9.3%) | 0 (0.0%) |
| $50,000 to $74,999 | 27 (25.0%) | 9 (4.0%) |
| $75,000 to $99,999 | 0 (0.0%) | 68 (30.1%) |
| $100,000 to $149,999 | 40 (37.0%) | 40 (17.7%) |
| $150,000 or more | 11 (10.2%) | 39 (17.3%) |
| Total | 108 (100.0%) | 226 (100.0%) |
Property Value to Household Income Ratio in Richlandtown borough
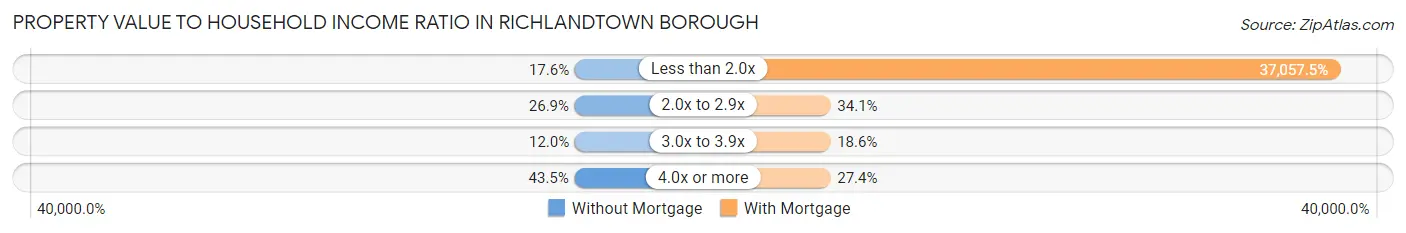
| Value-to-Income Ratio | Without Mortgage | With Mortgage |
| Less than 2.0x | 19 (17.6%) | 83,750 (37,057.5%) |
| 2.0x to 2.9x | 29 (26.9%) | 77 (34.1%) |
| 3.0x to 3.9x | 13 (12.0%) | 42 (18.6%) |
| 4.0x or more | 47 (43.5%) | 62 (27.4%) |
| Total | 108 (100.0%) | 226 (100.0%) |
Real Estate Taxes by Mortgage Status in Richlandtown borough
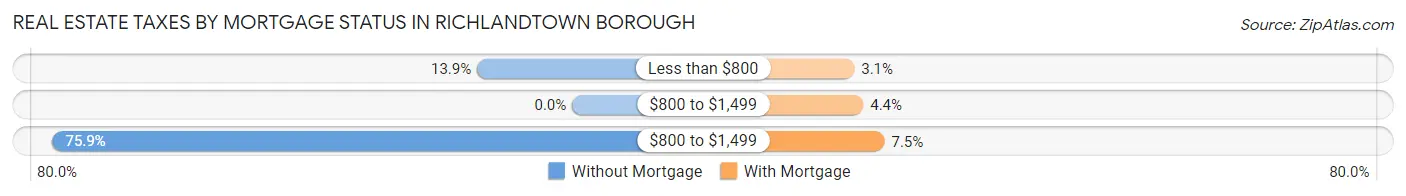
| Property Taxes | Without Mortgage | With Mortgage |
| Less than $800 | 15 (13.9%) | 7 (3.1%) |
| $800 to $1,499 | 0 (0.0%) | 10 (4.4%) |
| $800 to $1,499 | 82 (75.9%) | 17 (7.5%) |
| Total | 108 (100.0%) | 226 (100.0%) |
Health & Disability in Richlandtown borough
Health Insurance Coverage by Age in Richlandtown borough
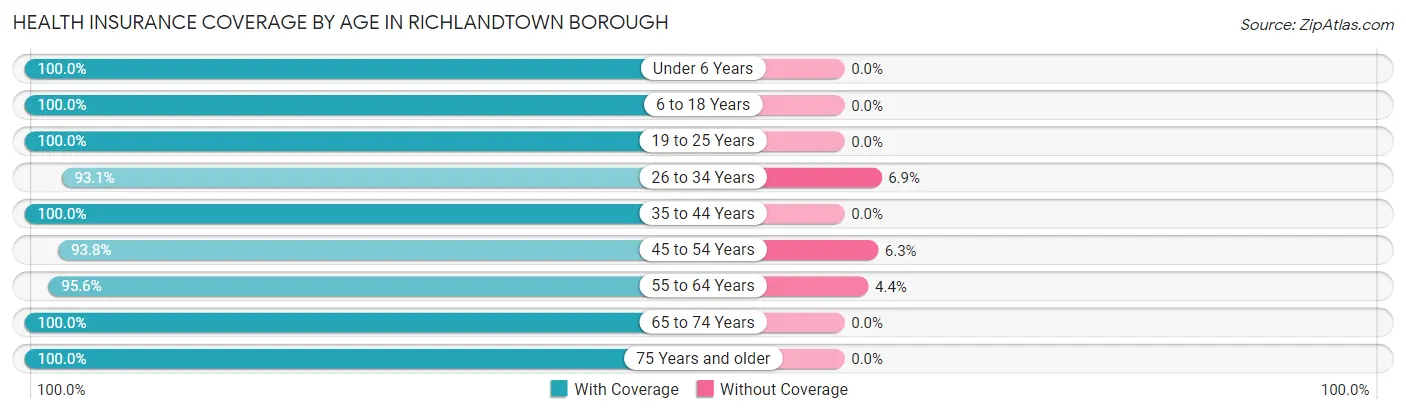
| Age Bracket | With Coverage | Without Coverage |
| Under 6 Years | 103 (100.0%) | 0 (0.0%) |
| 6 to 18 Years | 195 (100.0%) | 0 (0.0%) |
| 19 to 25 Years | 123 (100.0%) | 0 (0.0%) |
| 26 to 34 Years | 149 (93.1%) | 11 (6.9%) |
| 35 to 44 Years | 123 (100.0%) | 0 (0.0%) |
| 45 to 54 Years | 165 (93.8%) | 11 (6.2%) |
| 55 to 64 Years | 86 (95.6%) | 4 (4.4%) |
| 65 to 74 Years | 57 (100.0%) | 0 (0.0%) |
| 75 Years and older | 70 (100.0%) | 0 (0.0%) |
| Total | 1,071 (97.6%) | 26 (2.4%) |
Health Insurance Coverage by Citizenship Status in Richlandtown borough
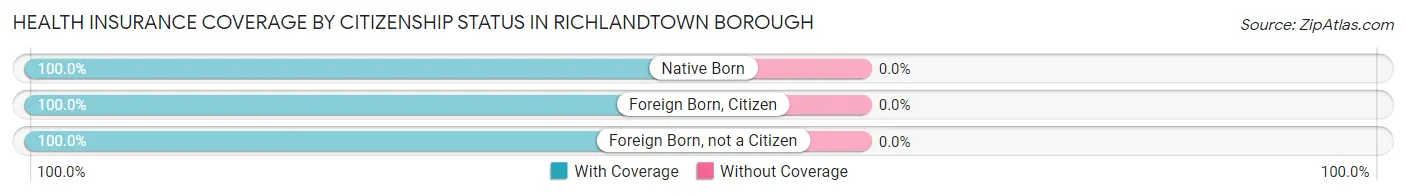
| Citizenship Status | With Coverage | Without Coverage |
| Native Born | 103 (100.0%) | 0 (0.0%) |
| Foreign Born, Citizen | 195 (100.0%) | 0 (0.0%) |
| Foreign Born, not a Citizen | 123 (100.0%) | 0 (0.0%) |
Health Insurance Coverage by Household Income in Richlandtown borough
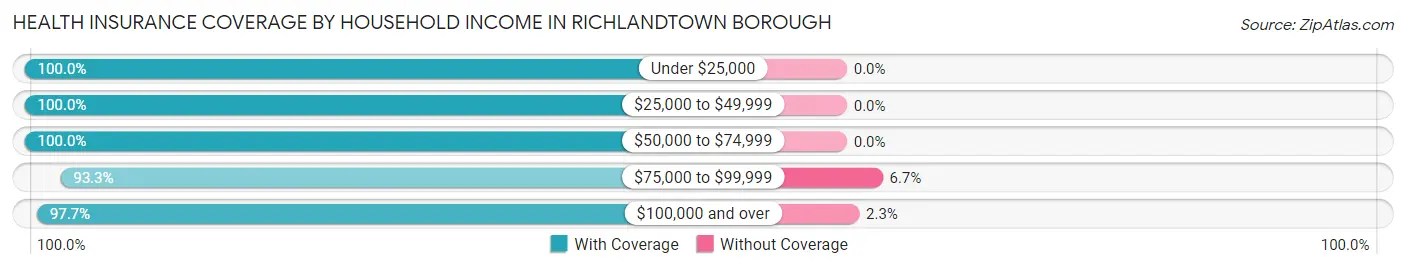
| Household Income | With Coverage | Without Coverage |
| Under $25,000 | 38 (100.0%) | 0 (0.0%) |
| $25,000 to $49,999 | 86 (100.0%) | 0 (0.0%) |
| $50,000 to $74,999 | 270 (100.0%) | 0 (0.0%) |
| $75,000 to $99,999 | 209 (93.3%) | 15 (6.7%) |
| $100,000 and over | 468 (97.7%) | 11 (2.3%) |
Public vs Private Health Insurance Coverage by Age in Richlandtown borough
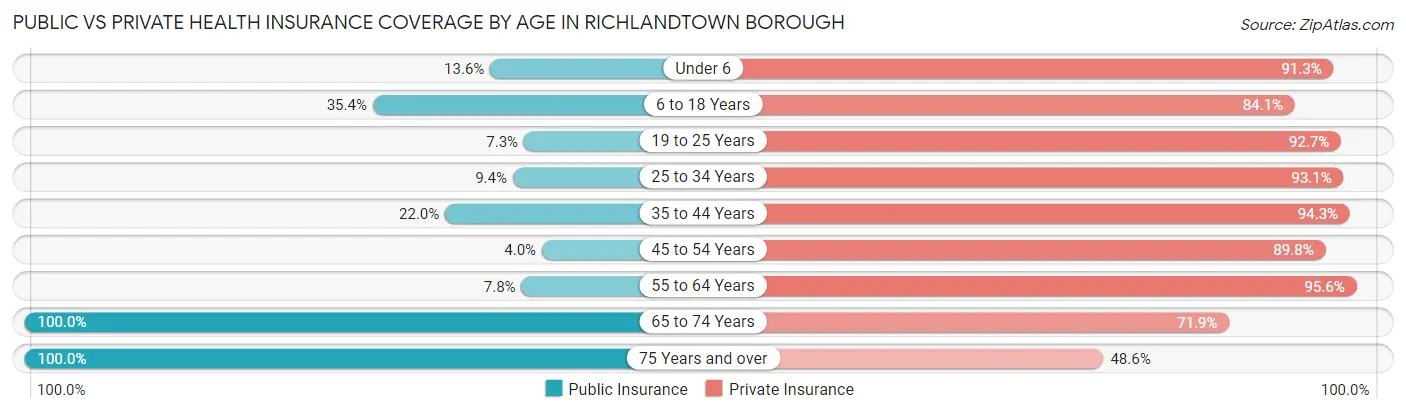
| Age Bracket | Public Insurance | Private Insurance |
| Under 6 | 14 (13.6%) | 94 (91.3%) |
| 6 to 18 Years | 69 (35.4%) | 164 (84.1%) |
| 19 to 25 Years | 9 (7.3%) | 114 (92.7%) |
| 25 to 34 Years | 15 (9.4%) | 149 (93.1%) |
| 35 to 44 Years | 27 (22.0%) | 116 (94.3%) |
| 45 to 54 Years | 7 (4.0%) | 158 (89.8%) |
| 55 to 64 Years | 7 (7.8%) | 86 (95.6%) |
| 65 to 74 Years | 57 (100.0%) | 41 (71.9%) |
| 75 Years and over | 70 (100.0%) | 34 (48.6%) |
| Total | 275 (25.1%) | 956 (87.2%) |
Disability Status by Sex by Age in Richlandtown borough
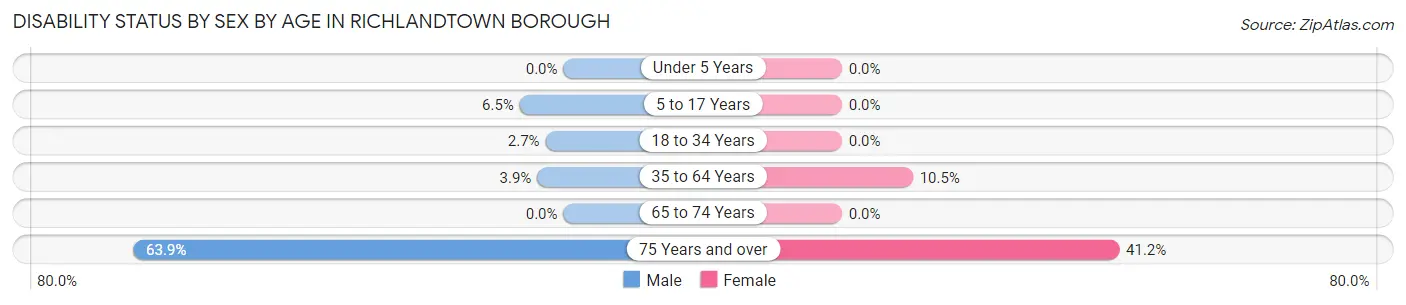
| Age Bracket | Male | Female |
| Under 5 Years | 0 (0.0%) | 0 (0.0%) |
| 5 to 17 Years | 5 (6.5%) | 0 (0.0%) |
| 18 to 34 Years | 5 (2.7%) | 0 (0.0%) |
| 35 to 64 Years | 7 (3.9%) | 22 (10.5%) |
| 65 to 74 Years | 0 (0.0%) | 0 (0.0%) |
| 75 Years and over | 23 (63.9%) | 14 (41.2%) |
Disability Class by Sex by Age in Richlandtown borough
Disability Class: Hearing Difficulty
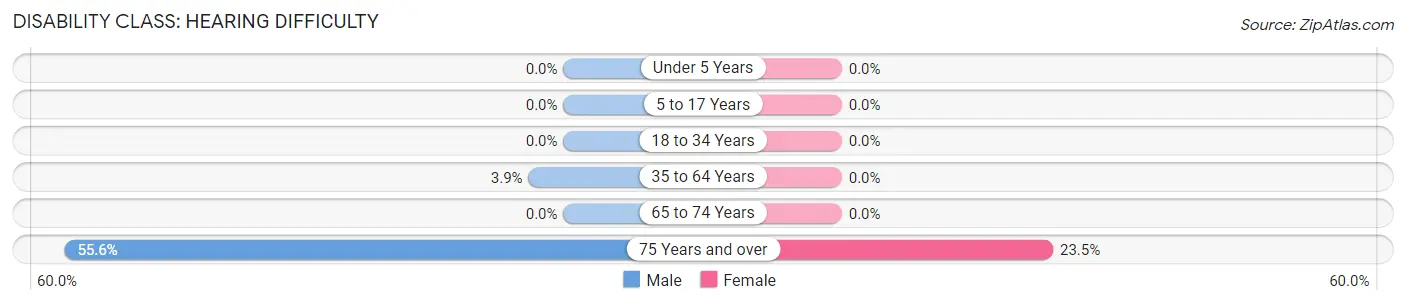
| Age Bracket | Male | Female |
| Under 5 Years | 0 (0.0%) | 0 (0.0%) |
| 5 to 17 Years | 0 (0.0%) | 0 (0.0%) |
| 18 to 34 Years | 0 (0.0%) | 0 (0.0%) |
| 35 to 64 Years | 7 (3.9%) | 0 (0.0%) |
| 65 to 74 Years | 0 (0.0%) | 0 (0.0%) |
| 75 Years and over | 20 (55.6%) | 8 (23.5%) |
Disability Class: Vision Difficulty
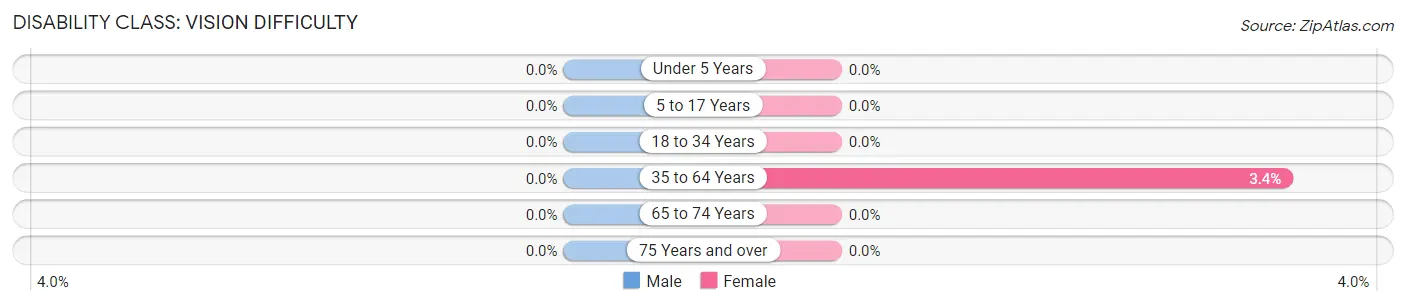
| Age Bracket | Male | Female |
| Under 5 Years | 0 (0.0%) | 0 (0.0%) |
| 5 to 17 Years | 0 (0.0%) | 0 (0.0%) |
| 18 to 34 Years | 0 (0.0%) | 0 (0.0%) |
| 35 to 64 Years | 0 (0.0%) | 7 (3.4%) |
| 65 to 74 Years | 0 (0.0%) | 0 (0.0%) |
| 75 Years and over | 0 (0.0%) | 0 (0.0%) |
Disability Class: Cognitive Difficulty
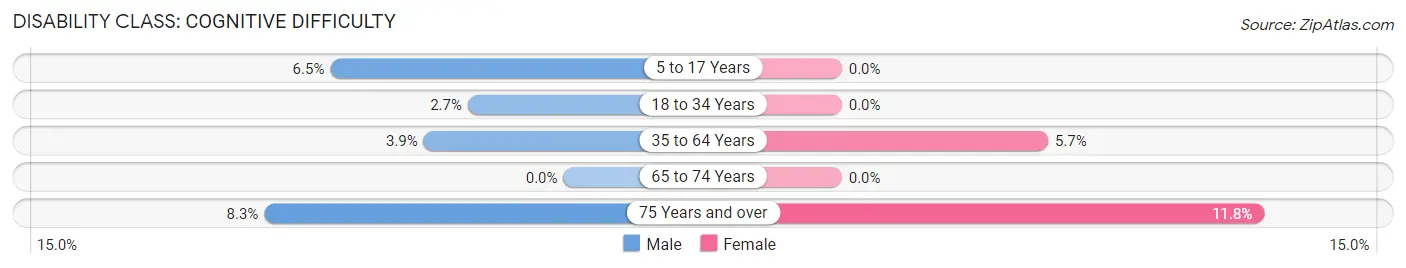
| Age Bracket | Male | Female |
| 5 to 17 Years | 5 (6.5%) | 0 (0.0%) |
| 18 to 34 Years | 5 (2.7%) | 0 (0.0%) |
| 35 to 64 Years | 7 (3.9%) | 12 (5.7%) |
| 65 to 74 Years | 0 (0.0%) | 0 (0.0%) |
| 75 Years and over | 3 (8.3%) | 4 (11.8%) |
Disability Class: Ambulatory Difficulty
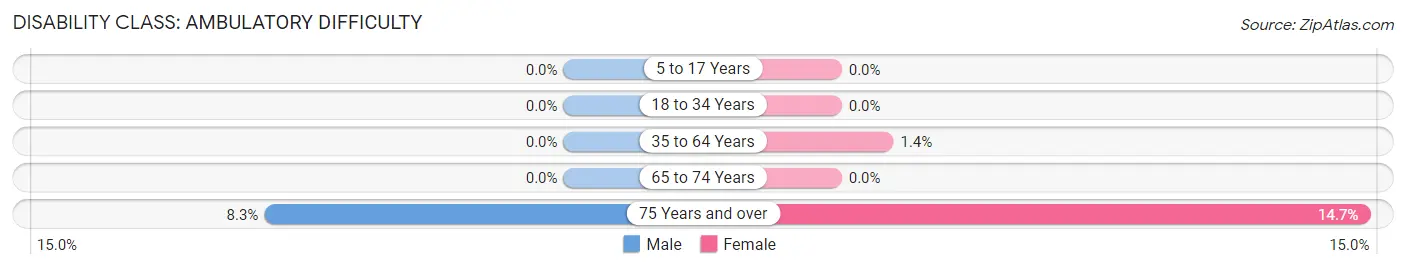
| Age Bracket | Male | Female |
| 5 to 17 Years | 0 (0.0%) | 0 (0.0%) |
| 18 to 34 Years | 0 (0.0%) | 0 (0.0%) |
| 35 to 64 Years | 0 (0.0%) | 3 (1.4%) |
| 65 to 74 Years | 0 (0.0%) | 0 (0.0%) |
| 75 Years and over | 3 (8.3%) | 5 (14.7%) |
Disability Class: Self-Care Difficulty
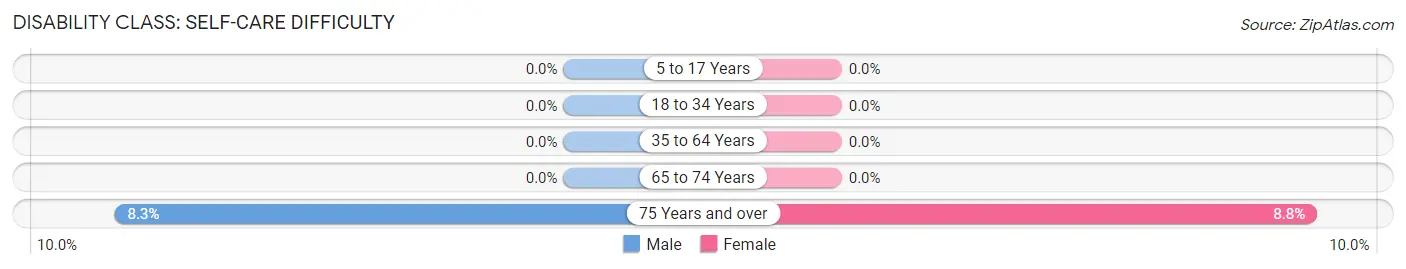
| Age Bracket | Male | Female |
| 5 to 17 Years | 0 (0.0%) | 0 (0.0%) |
| 18 to 34 Years | 0 (0.0%) | 0 (0.0%) |
| 35 to 64 Years | 0 (0.0%) | 0 (0.0%) |
| 65 to 74 Years | 0 (0.0%) | 0 (0.0%) |
| 75 Years and over | 3 (8.3%) | 3 (8.8%) |
Technology Access in Richlandtown borough
Computing Device Access in Richlandtown borough
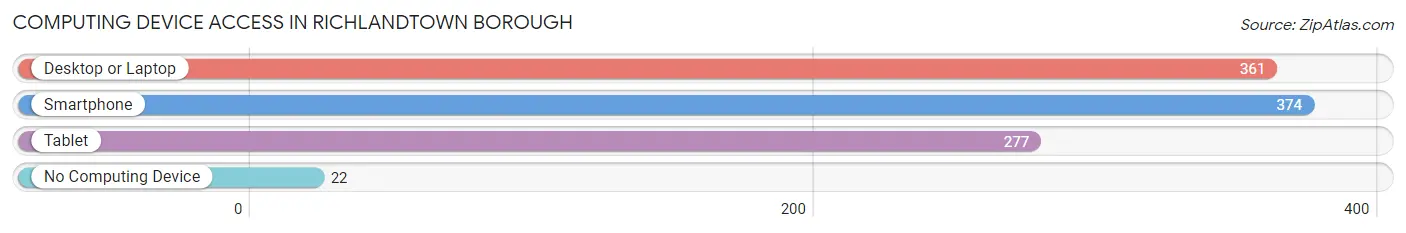
| Device Type | # Households | % Households |
| Desktop or Laptop | 361 | 84.4% |
| Smartphone | 374 | 87.4% |
| Tablet | 277 | 64.7% |
| No Computing Device | 22 | 5.1% |
| Total | 428 | 100.0% |
Internet Access in Richlandtown borough
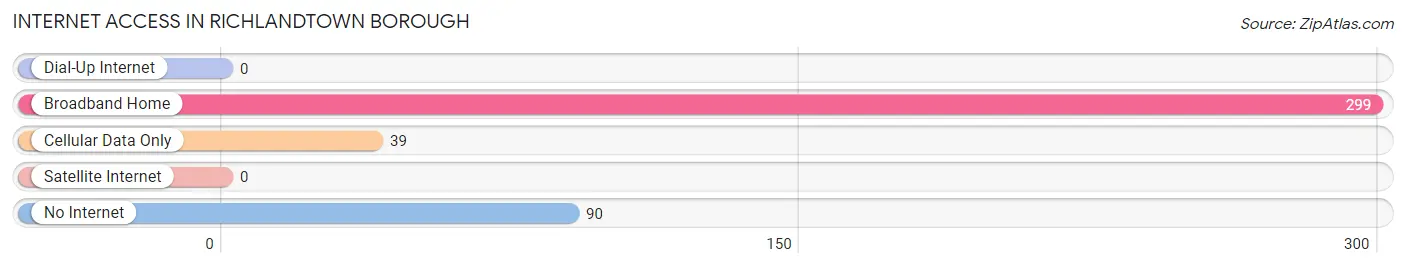
| Internet Type | # Households | % Households |
| Dial-Up Internet | 0 | 0.0% |
| Broadband Home | 299 | 69.9% |
| Cellular Data Only | 39 | 9.1% |
| Satellite Internet | 0 | 0.0% |
| No Internet | 90 | 21.0% |
| Total | 428 | 100.0% |
Richlandtown borough Summary
Richlandtown Borough is a small borough located in Bucks County, Pennsylvania. It is situated in the heart of the Lehigh Valley, just north of Quakertown and south of Allentown. The borough is home to a population of approximately 1,400 people, and is part of the Quakertown Area School District.
History
Richlandtown Borough was founded in 1845 by a group of German settlers. The settlers named the borough after the rich soil in the area, which was ideal for farming. The borough was officially incorporated in 1872.
In the late 19th century, Richlandtown was a thriving agricultural community. The borough was home to several farms, as well as a number of small businesses. The borough also had a post office, a hotel, a blacksmith shop, and a general store.
In the early 20th century, Richlandtown began to experience a period of growth and development. The borough was home to several factories, including a silk mill, a paper mill, and a brickyard. The borough also had a number of stores, including a grocery store, a hardware store, and a drug store.
Geography
Richlandtown Borough is located in the Lehigh Valley region of Pennsylvania. The borough is situated in the northern part of Bucks County, just north of Quakertown and south of Allentown. The borough is bordered by Richland Township to the north, Milford Township to the east, and Springfield Township to the south.
The borough covers an area of 0.8 square miles, and is home to a population of approximately 1,400 people. The borough is located at an elevation of 441 feet above sea level.
Economy
Richlandtown Borough is a primarily residential community. The borough is home to a number of small businesses, including a grocery store, a hardware store, and a drug store. The borough also has a number of restaurants, including a pizza shop and a Chinese restaurant.
The borough is home to a number of manufacturing companies, including a paper mill, a silk mill, and a brickyard. The borough also has a number of farms, including a dairy farm and a vegetable farm.
Demographics
As of the 2010 census, Richlandtown Borough had a population of 1,400 people. The racial makeup of the borough was 95.6% White, 1.4% African American, 0.6% Asian, 0.4% Native American, and 2.0% from other races.
The median household income in Richlandtown Borough was $50,000, and the median family income was $60,000. The per capita income in the borough was $25,000. Approximately 8.0% of the population was below the poverty line.
Common Questions
What is Per Capita Income in Richlandtown borough?
Per Capita income in Richlandtown borough is $34,509.
What is the Median Family Income in Richlandtown borough?
Median Family Income in Richlandtown borough is $89,028.
What is the Median Household income in Richlandtown borough?
Median Household Income in Richlandtown borough is $79,545.
What is Income or Wage Gap in Richlandtown borough?
Income or Wage Gap in Richlandtown borough is 16.4%.
Women in Richlandtown borough earn 83.6 cents for every dollar earned by a man.
What is Inequality or Gini Index in Richlandtown borough?
Inequality or Gini Index in Richlandtown borough is 0.35.
What is the Total Population of Richlandtown borough?
Total Population of Richlandtown borough is 1,237.
What is the Total Male Population of Richlandtown borough?
Total Male Population of Richlandtown borough is 596.
What is the Total Female Population of Richlandtown borough?
Total Female Population of Richlandtown borough is 641.
What is the Ratio of Males per 100 Females in Richlandtown borough?
There are 92.98 Males per 100 Females in Richlandtown borough.
What is the Ratio of Females per 100 Males in Richlandtown borough?
There are 107.55 Females per 100 Males in Richlandtown borough.
What is the Median Population Age in Richlandtown borough?
Median Population Age in Richlandtown borough is 36.4 Years.
What is the Average Family Size in Richlandtown borough
Average Family Size in Richlandtown borough is 3.5 People.
What is the Average Household Size in Richlandtown borough
Average Household Size in Richlandtown borough is 2.6 People.
How Large is the Labor Force in Richlandtown borough?
There are 648 People in the Labor Forcein in Richlandtown borough.
What is the Percentage of People in the Labor Force in Richlandtown borough?
68.2% of People are in the Labor Force in Richlandtown borough.
What is the Unemployment Rate in Richlandtown borough?
Unemployment Rate in Richlandtown borough is 5.1%.