Belfast, PA Map & Demographics
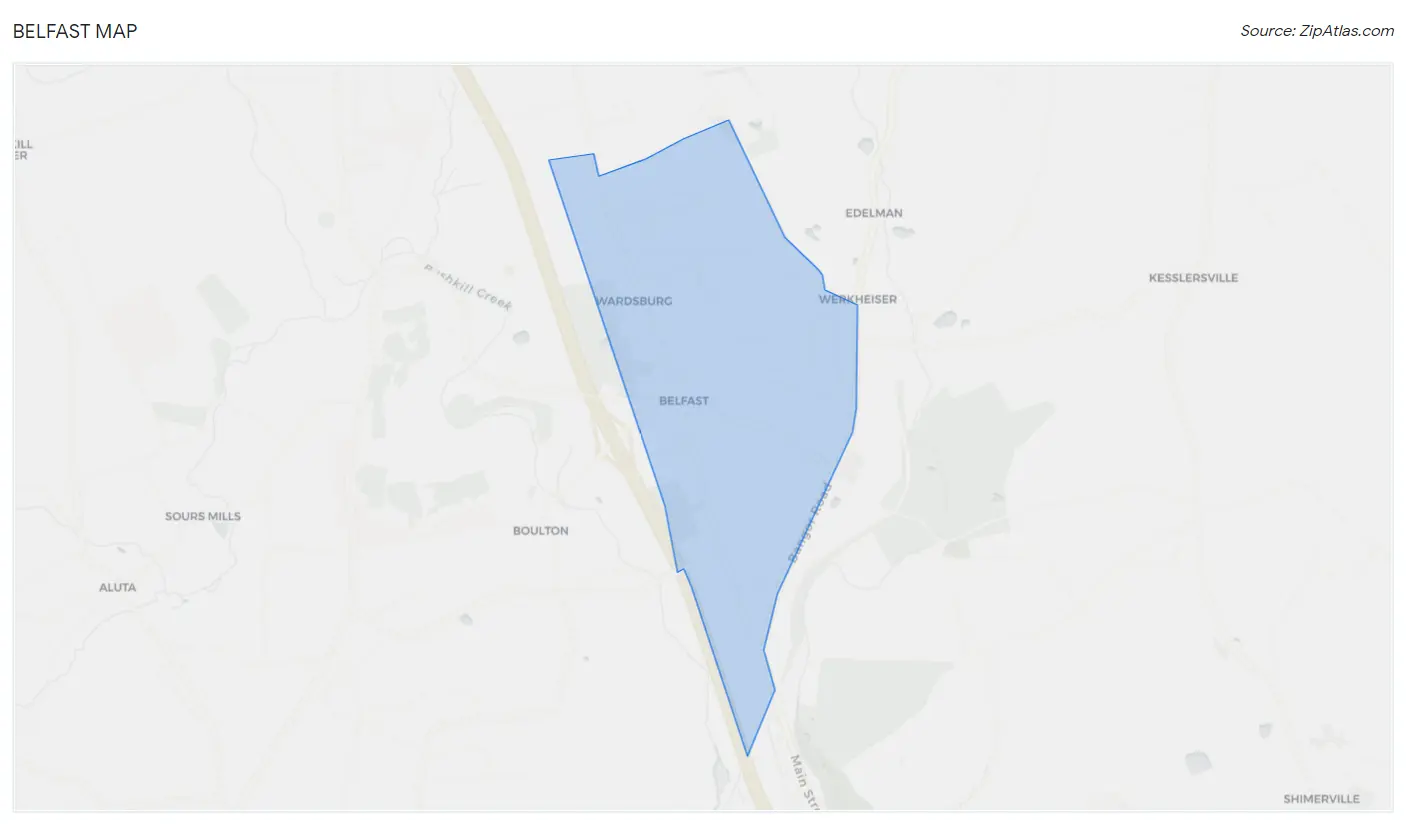
Belfast Map
Belfast Overview
$33,493
PER CAPITA INCOME
$99,667
AVG FAMILY INCOME
$90,101
AVG HOUSEHOLD INCOME
22.2%
WAGE / INCOME GAP [ % ]
77.8¢/ $1
WAGE / INCOME GAP [ $ ]
0.32
INEQUALITY / GINI INDEX
1,237
TOTAL POPULATION
596
MALE POPULATION
641
FEMALE POPULATION
92.98
MALES / 100 FEMALES
107.55
FEMALES / 100 MALES
43.3
MEDIAN AGE
3.2
AVG FAMILY SIZE
2.7
AVG HOUSEHOLD SIZE
686
LABOR FORCE [ PEOPLE ]
69.9%
PERCENT IN LABOR FORCE
3.5%
UNEMPLOYMENT RATE
Income in Belfast
Income Overview in Belfast
Per Capita Income in Belfast is $33,493, while median incomes of families and households are $99,667 and $90,101 respectively.
| Characteristic | Number | Measure |
| Per Capita Income | 1,237 | $33,493 |
| Median Family Income | 354 | $99,667 |
| Mean Family Income | 354 | $102,432 |
| Median Household Income | 451 | $90,101 |
| Mean Household Income | 451 | $89,088 |
| Income Deficit | 354 | $0 |
| Wage / Income Gap (%) | 1,237 | 22.20% |
| Wage / Income Gap ($) | 1,237 | 77.80¢ per $1 |
| Gini / Inequality Index | 1,237 | 0.32 |
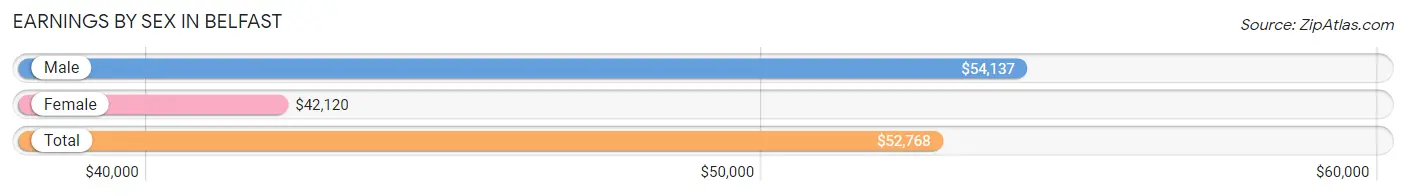
Earnings by Sex in Belfast
Average Earnings in Belfast are $52,768, $54,137 for men and $42,120 for women, a difference of 22.2%.
| Sex | Number | Average Earnings |
| Male | 315 (46.7%) | $54,137 |
| Female | 360 (53.3%) | $42,120 |
| Total | 675 (100.0%) | $52,768 |
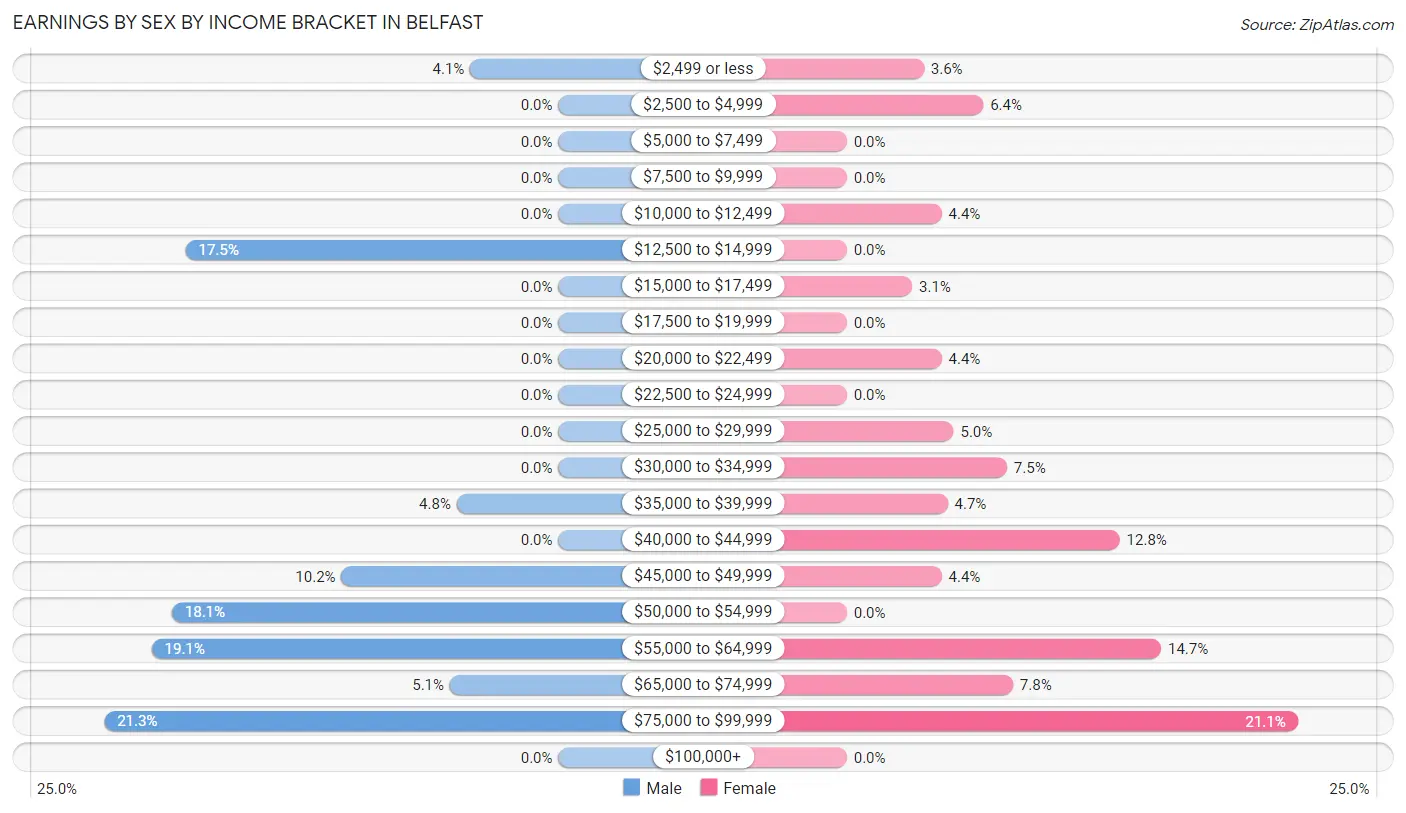
Earnings by Sex by Income Bracket in Belfast
The most common earnings brackets in Belfast are $75,000 to $99,999 for men (67 | 21.3%) and $75,000 to $99,999 for women (76 | 21.1%).
| Income | Male | Female |
| $2,499 or less | 13 (4.1%) | 13 (3.6%) |
| $2,500 to $4,999 | 0 (0.0%) | 23 (6.4%) |
| $5,000 to $7,499 | 0 (0.0%) | 0 (0.0%) |
| $7,500 to $9,999 | 0 (0.0%) | 0 (0.0%) |
| $10,000 to $12,499 | 0 (0.0%) | 16 (4.4%) |
| $12,500 to $14,999 | 55 (17.5%) | 0 (0.0%) |
| $15,000 to $17,499 | 0 (0.0%) | 11 (3.1%) |
| $17,500 to $19,999 | 0 (0.0%) | 0 (0.0%) |
| $20,000 to $22,499 | 0 (0.0%) | 16 (4.4%) |
| $22,500 to $24,999 | 0 (0.0%) | 0 (0.0%) |
| $25,000 to $29,999 | 0 (0.0%) | 18 (5.0%) |
| $30,000 to $34,999 | 0 (0.0%) | 27 (7.5%) |
| $35,000 to $39,999 | 15 (4.8%) | 17 (4.7%) |
| $40,000 to $44,999 | 0 (0.0%) | 46 (12.8%) |
| $45,000 to $49,999 | 32 (10.2%) | 16 (4.4%) |
| $50,000 to $54,999 | 57 (18.1%) | 0 (0.0%) |
| $55,000 to $64,999 | 60 (19.1%) | 53 (14.7%) |
| $65,000 to $74,999 | 16 (5.1%) | 28 (7.8%) |
| $75,000 to $99,999 | 67 (21.3%) | 76 (21.1%) |
| $100,000+ | 0 (0.0%) | 0 (0.0%) |
| Total | 315 (100.0%) | 360 (100.0%) |
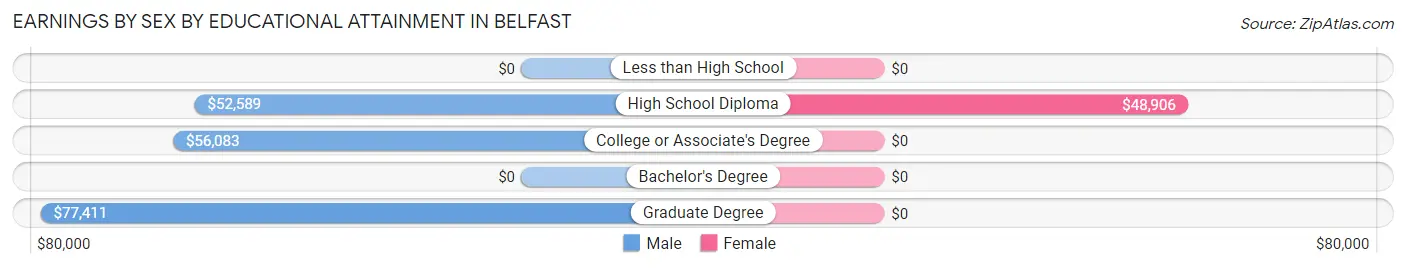
Earnings by Sex by Educational Attainment in Belfast
Average earnings in Belfast are $54,524 for men and $48,203 for women, a difference of 11.6%. Men with an educational attainment of graduate degree enjoy the highest average annual earnings of $77,411, while those with high school diploma education earn the least with $52,589. Women with an educational attainment of high school diploma earn the most with the average annual earnings of $48,906, while those with high school diploma education have the smallest earnings of $48,906.
| Educational Attainment | Male Income | Female Income |
| Less than High School | - | - |
| High School Diploma | $52,589 | $48,906 |
| College or Associate's Degree | $56,083 | $0 |
| Bachelor's Degree | - | - |
| Graduate Degree | $77,411 | $0 |
| Total | $54,524 | $48,203 |
Family Income in Belfast
Family Income Brackets in Belfast
According to the Belfast family income data, there are 107 families falling into the $100,000 to $149,999 income range, which is the most common income bracket and makes up 30.2% of all families.
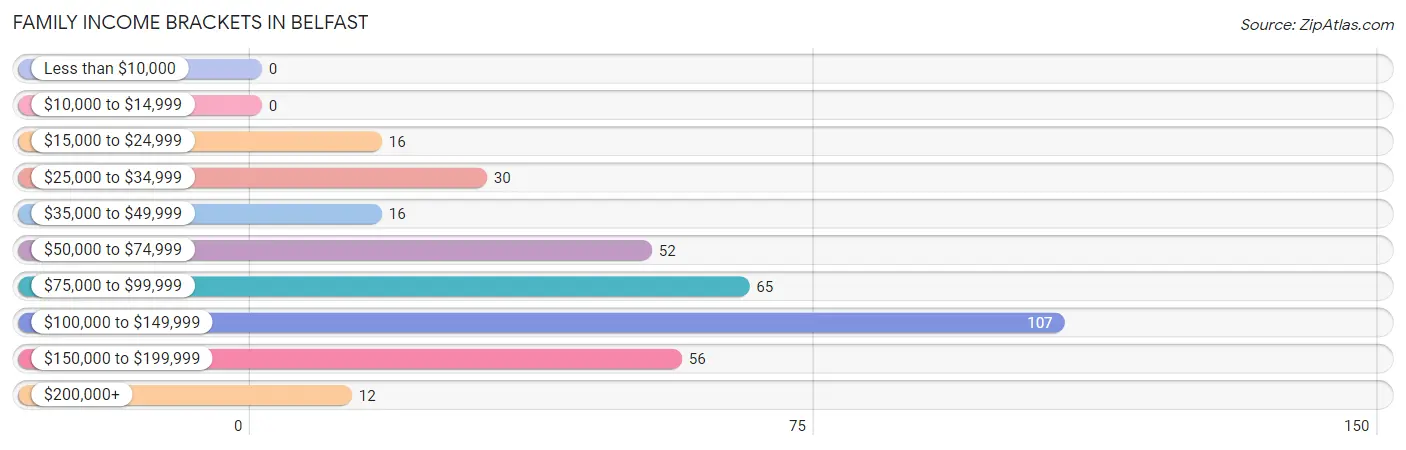
| Income Bracket | # Families | % Families |
| Less than $10,000 | 0 | 0.0% |
| $10,000 to $14,999 | 0 | 0.0% |
| $15,000 to $24,999 | 16 | 4.5% |
| $25,000 to $34,999 | 30 | 8.5% |
| $35,000 to $49,999 | 16 | 4.5% |
| $50,000 to $74,999 | 52 | 14.7% |
| $75,000 to $99,999 | 65 | 18.4% |
| $100,000 to $149,999 | 107 | 30.2% |
| $150,000 to $199,999 | 56 | 15.8% |
| $200,000+ | 12 | 3.4% |
Family Income by Famaliy Size in Belfast
4-person families (72 | 20.3%) account for the highest median family income in Belfast with $150,781 per family, while 2-person families (132 | 37.3%) have the highest median income of $57,812 per family member.
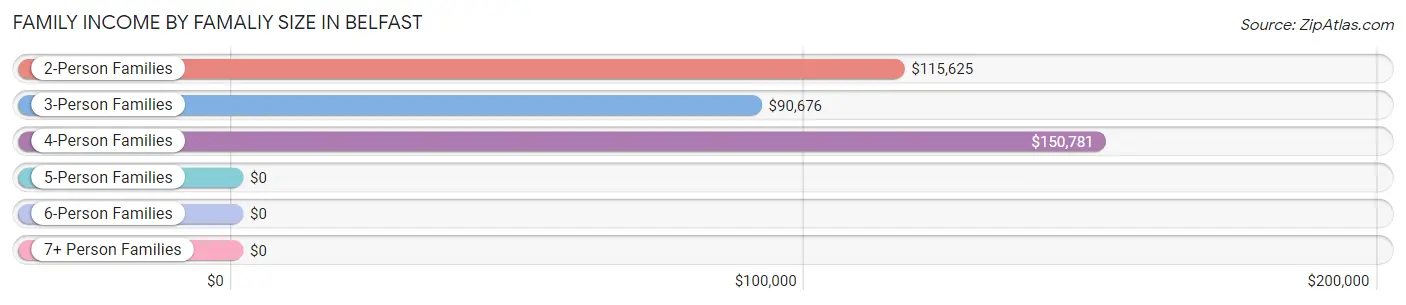
| Income Bracket | # Families | Median Income |
| 2-Person Families | 132 (37.3%) | $115,625 |
| 3-Person Families | 116 (32.8%) | $90,676 |
| 4-Person Families | 72 (20.3%) | $150,781 |
| 5-Person Families | 34 (9.6%) | $0 |
| 6-Person Families | 0 (0.0%) | $0 |
| 7+ Person Families | 0 (0.0%) | $0 |
| Total | 354 (100.0%) | $99,667 |
Family Income by Number of Earners in Belfast
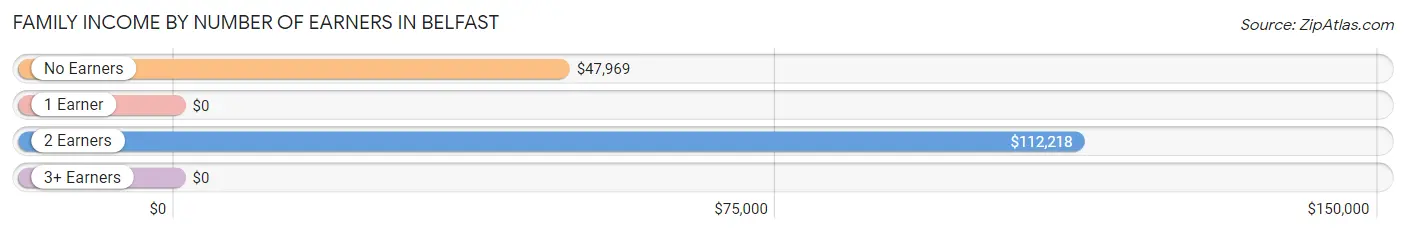
| Number of Earners | # Families | Median Income |
| No Earners | 44 (12.4%) | $47,969 |
| 1 Earner | 27 (7.6%) | $0 |
| 2 Earners | 271 (76.5%) | $112,218 |
| 3+ Earners | 12 (3.4%) | $0 |
| Total | 354 (100.0%) | $99,667 |
Household Income in Belfast
Household Income Brackets in Belfast
With 107 households falling in the category, the $100,000 to $149,999 income range is the most frequent in Belfast, accounting for 23.7% of all households.
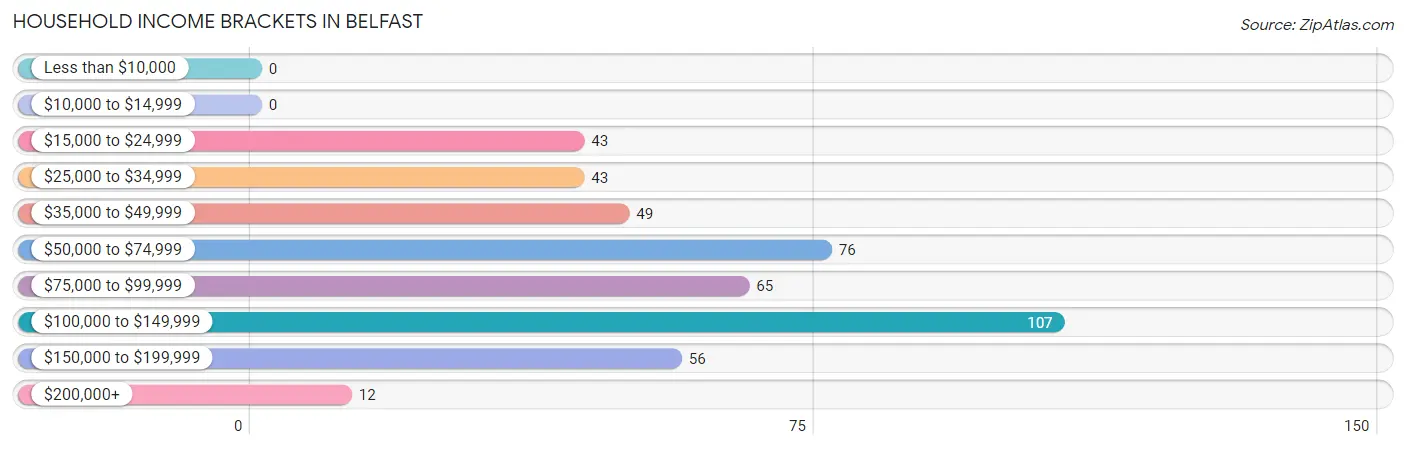
| Income Bracket | # Households | % Households |
| Less than $10,000 | 0 | 0.0% |
| $10,000 to $14,999 | 0 | 0.0% |
| $15,000 to $24,999 | 43 | 9.5% |
| $25,000 to $34,999 | 43 | 9.5% |
| $35,000 to $49,999 | 49 | 10.9% |
| $50,000 to $74,999 | 76 | 16.9% |
| $75,000 to $99,999 | 65 | 14.4% |
| $100,000 to $149,999 | 107 | 23.7% |
| $150,000 to $199,999 | 56 | 12.4% |
| $200,000+ | 12 | 2.7% |
Household Income by Householder Age in Belfast
The median household income in Belfast is $90,101, with the highest median household income of $150,781 found in the 25 to 44 years age bracket for the primary householder. A total of 126 households (27.9%) fall into this category.
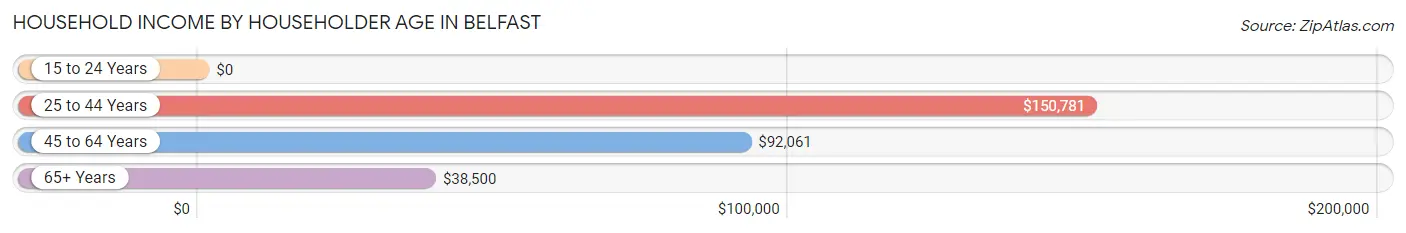
| Income Bracket | # Households | Median Income |
| 15 to 24 Years | 0 (0.0%) | $0 |
| 25 to 44 Years | 126 (27.9%) | $150,781 |
| 45 to 64 Years | 195 (43.2%) | $92,061 |
| 65+ Years | 130 (28.8%) | $38,500 |
| Total | 451 (100.0%) | $90,101 |
Poverty in Belfast
Income Below Poverty by Sex and Age in Belfast
With 2.4% poverty level for males and 8.3% for females among the residents of Belfast, under 5 year old males and under 5 year old females are the most vulnerable to poverty, with 14 males (45.2%) and 13 females (23.2%) in their respective age groups living below the poverty level.
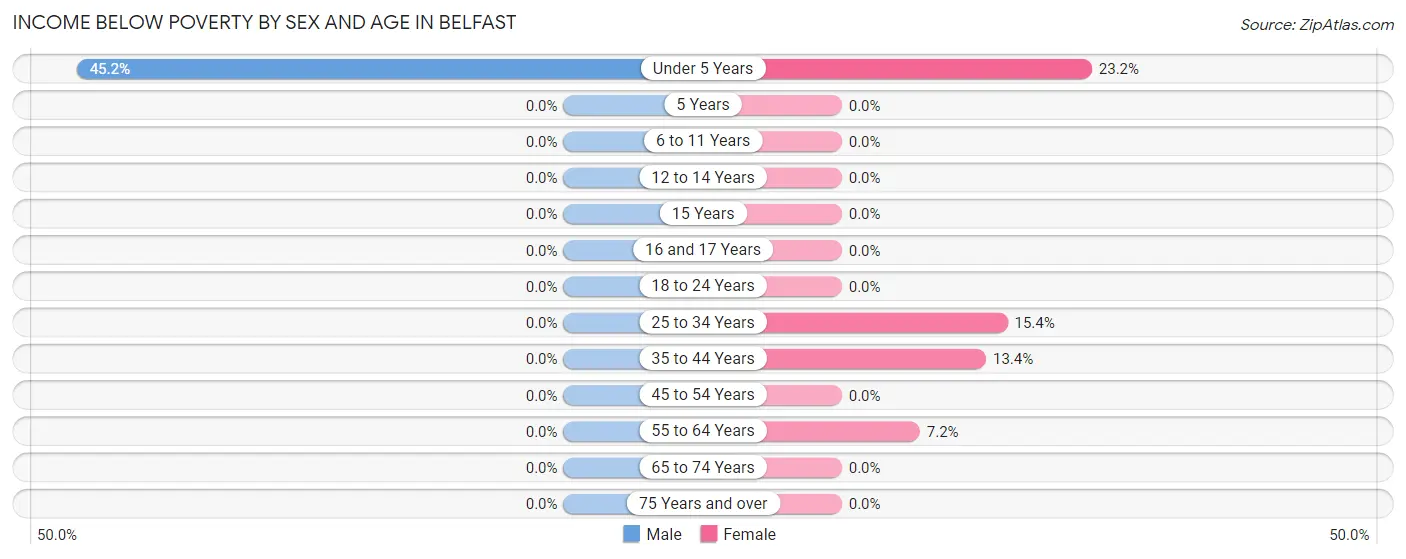
| Age Bracket | Male | Female |
| Under 5 Years | 14 (45.2%) | 13 (23.2%) |
| 5 Years | 0 (0.0%) | 0 (0.0%) |
| 6 to 11 Years | 0 (0.0%) | 0 (0.0%) |
| 12 to 14 Years | 0 (0.0%) | 0 (0.0%) |
| 15 Years | 0 (0.0%) | 0 (0.0%) |
| 16 and 17 Years | 0 (0.0%) | 0 (0.0%) |
| 18 to 24 Years | 0 (0.0%) | 0 (0.0%) |
| 25 to 34 Years | 0 (0.0%) | 14 (15.4%) |
| 35 to 44 Years | 0 (0.0%) | 15 (13.4%) |
| 45 to 54 Years | 0 (0.0%) | 0 (0.0%) |
| 55 to 64 Years | 0 (0.0%) | 11 (7.2%) |
| 65 to 74 Years | 0 (0.0%) | 0 (0.0%) |
| 75 Years and over | 0 (0.0%) | 0 (0.0%) |
| Total | 14 (2.4%) | 53 (8.3%) |
Income Above Poverty by Sex and Age in Belfast
According to the poverty statistics in Belfast, males aged 5 years and females aged 5 years are the age groups that are most secure financially, with 100.0% of males and 100.0% of females in these age groups living above the poverty line.
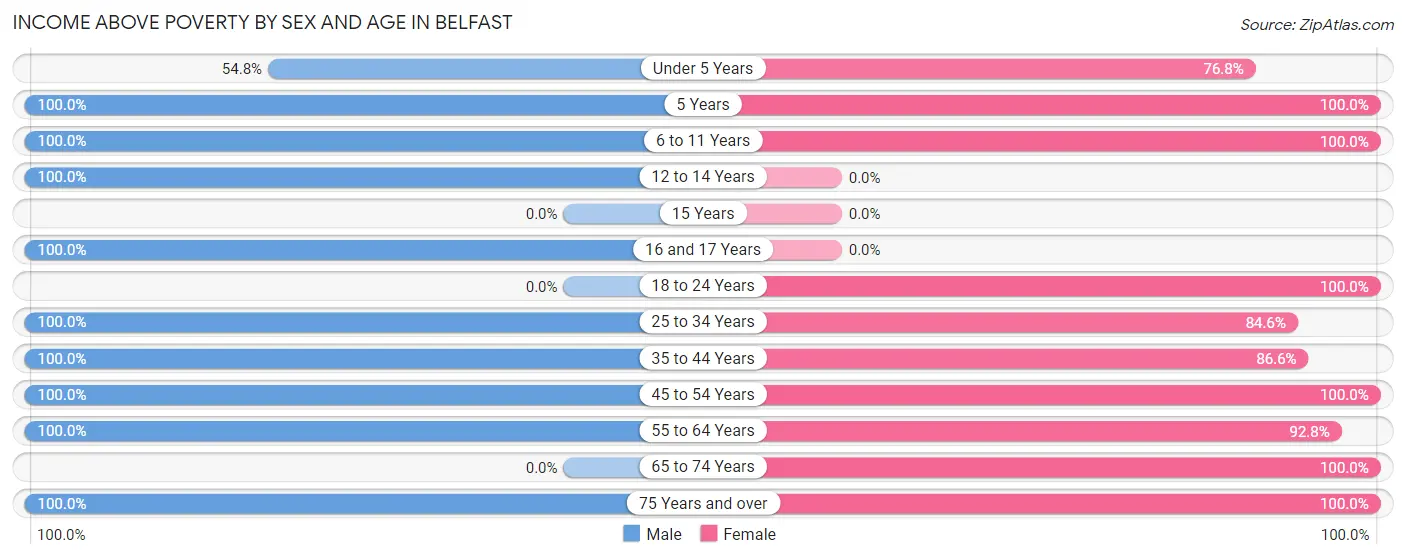
| Age Bracket | Male | Female |
| Under 5 Years | 17 (54.8%) | 43 (76.8%) |
| 5 Years | 12 (100.0%) | 9 (100.0%) |
| 6 to 11 Years | 91 (100.0%) | 30 (100.0%) |
| 12 to 14 Years | 26 (100.0%) | 0 (0.0%) |
| 15 Years | 0 (0.0%) | 0 (0.0%) |
| 16 and 17 Years | 13 (100.0%) | 0 (0.0%) |
| 18 to 24 Years | 0 (0.0%) | 23 (100.0%) |
| 25 to 34 Years | 21 (100.0%) | 77 (84.6%) |
| 35 to 44 Years | 161 (100.0%) | 97 (86.6%) |
| 45 to 54 Years | 11 (100.0%) | 16 (100.0%) |
| 55 to 64 Years | 174 (100.0%) | 141 (92.8%) |
| 65 to 74 Years | 0 (0.0%) | 63 (100.0%) |
| 75 Years and over | 56 (100.0%) | 89 (100.0%) |
| Total | 582 (97.7%) | 588 (91.7%) |
Income Below Poverty Among Married-Couple Families in Belfast
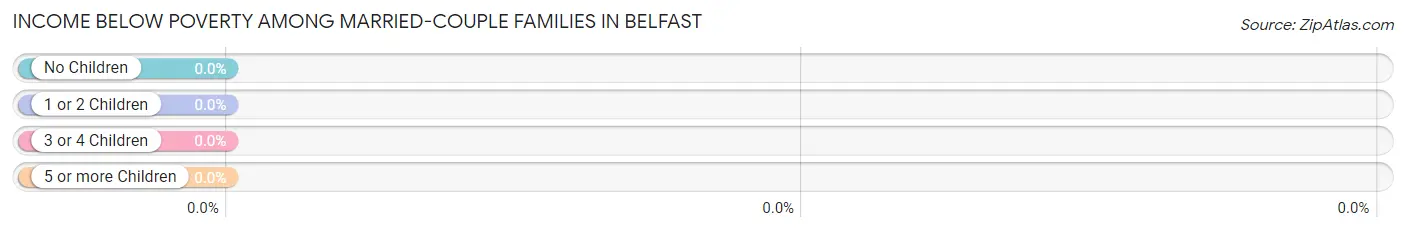
| Children | Above Poverty | Below Poverty |
| No Children | 184 (100.0%) | 0 (0.0%) |
| 1 or 2 Children | 100 (100.0%) | 0 (0.0%) |
| 3 or 4 Children | 11 (100.0%) | 0 (0.0%) |
| 5 or more Children | 0 (0.0%) | 0 (0.0%) |
| Total | 295 (100.0%) | 0 (0.0%) |
Income Below Poverty Among Single-Parent Households in Belfast
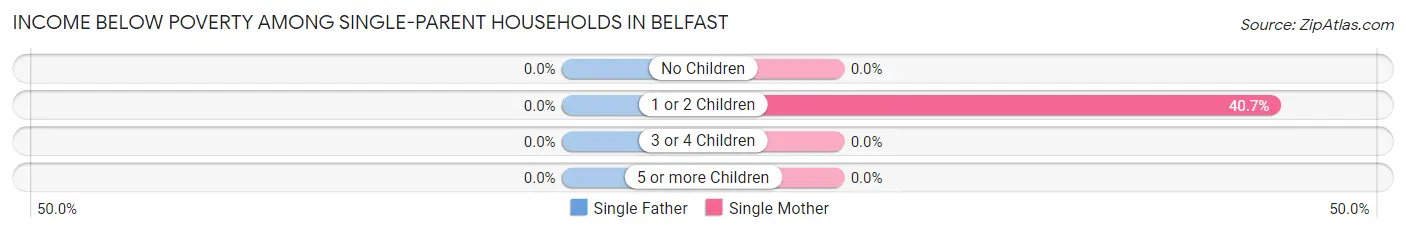
| Children | Single Father | Single Mother |
| No Children | 0 (0.0%) | 0 (0.0%) |
| 1 or 2 Children | 0 (0.0%) | 11 (40.7%) |
| 3 or 4 Children | 0 (0.0%) | 0 (0.0%) |
| 5 or more Children | 0 (0.0%) | 0 (0.0%) |
| Total | 0 (0.0%) | 11 (18.6%) |
Income Below Poverty Among Married-Couple vs Single-Parent Households in Belfast
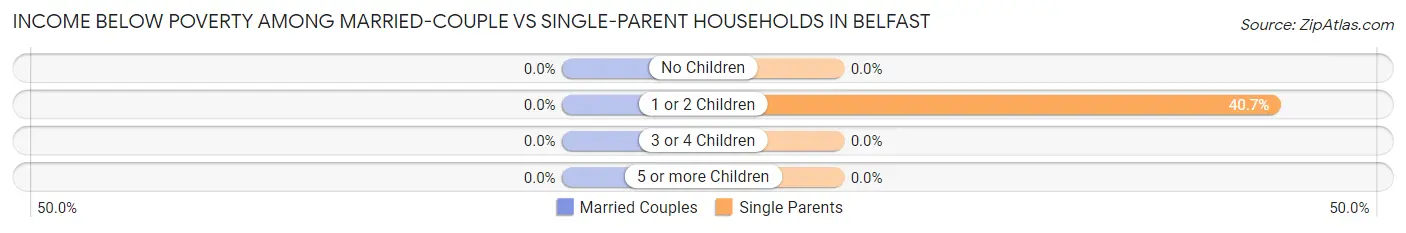
| Children | Married-Couple Families | Single-Parent Households |
| No Children | 0 (0.0%) | 0 (0.0%) |
| 1 or 2 Children | 0 (0.0%) | 11 (40.7%) |
| 3 or 4 Children | 0 (0.0%) | 0 (0.0%) |
| 5 or more Children | 0 (0.0%) | 0 (0.0%) |
| Total | 0 (0.0%) | 11 (18.6%) |
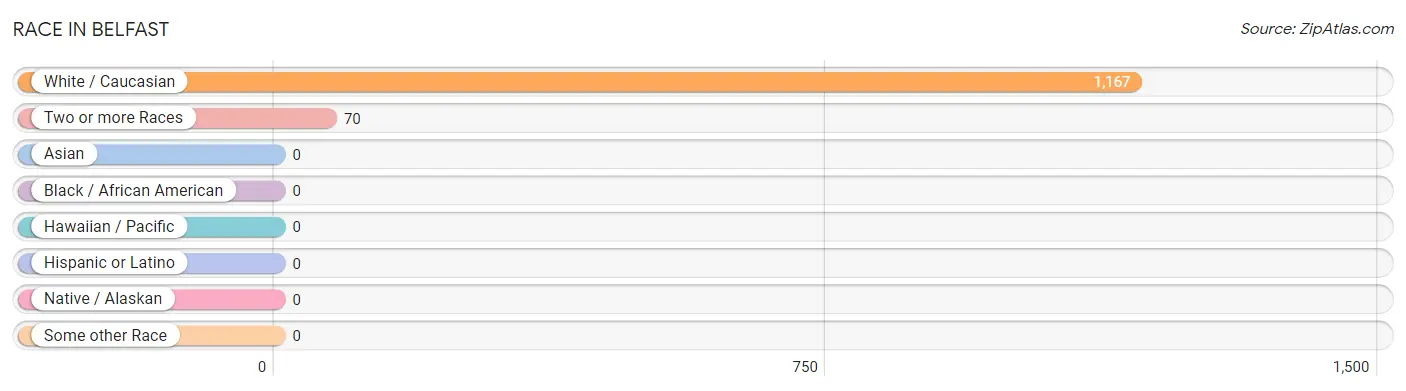
Race in Belfast
The most populous races in Belfast are White / Caucasian (1,167 | 94.3%), and Two or more Races (70 | 5.7%).
| Race | # Population | % Population |
| Asian | 0 | 0.0% |
| Black / African American | 0 | 0.0% |
| Hawaiian / Pacific | 0 | 0.0% |
| Hispanic or Latino | 0 | 0.0% |
| Native / Alaskan | 0 | 0.0% |
| White / Caucasian | 1,167 | 94.3% |
| Two or more Races | 70 | 5.7% |
| Some other Race | 0 | 0.0% |
| Total | 1,237 | 100.0% |
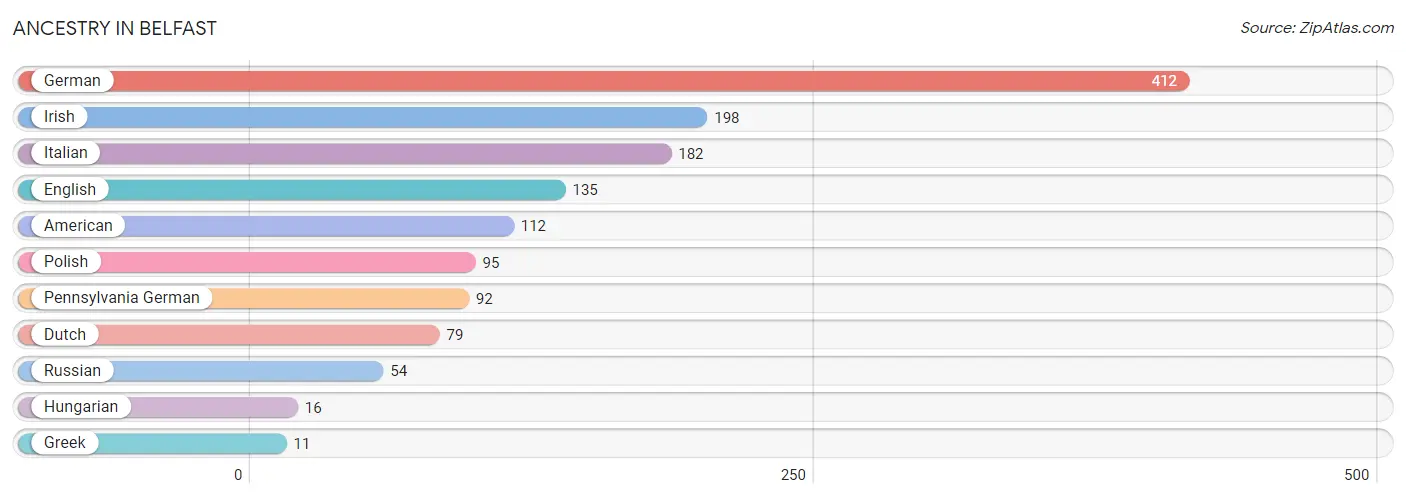
Ancestry in Belfast
The most populous ancestries reported in Belfast are German (412 | 33.3%), Irish (198 | 16.0%), Italian (182 | 14.7%), English (135 | 10.9%), and American (112 | 9.0%), together accounting for 84.0% of all Belfast residents.
| Ancestry | # Population | % Population |
| American | 112 | 9.0% |
| Dutch | 79 | 6.4% |
| English | 135 | 10.9% |
| German | 412 | 33.3% |
| Greek | 11 | 0.9% |
| Hungarian | 16 | 1.3% |
| Irish | 198 | 16.0% |
| Italian | 182 | 14.7% |
| Pennsylvania German | 92 | 7.4% |
| Polish | 95 | 7.7% |
| Russian | 54 | 4.4% | View All 11 Rows |
Immigrants in Belfast
The most numerous immigrant groups reported in Belfast came from Eastern Europe (16 | 1.3%), Europe (16 | 1.3%), and Russia (16 | 1.3%), together accounting for 3.9% of all Belfast residents.
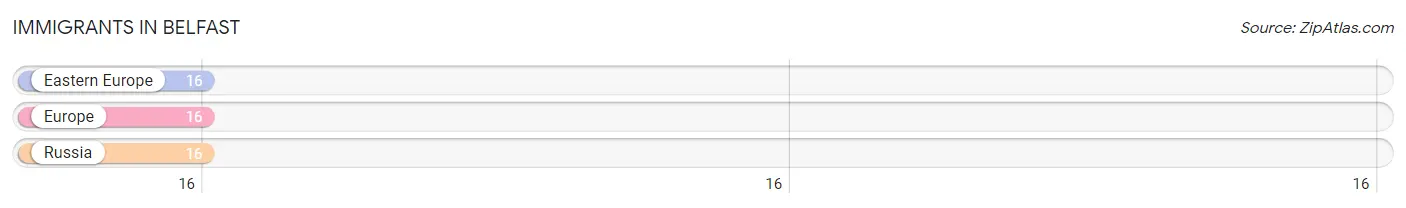
| Immigration Origin | # Population | % Population |
| Eastern Europe | 16 | 1.3% |
| Europe | 16 | 1.3% |
| Russia | 16 | 1.3% | View All 3 Rows |
Sex and Age in Belfast
Sex and Age in Belfast
The most populous age groups in Belfast are 35 to 39 Years (104 | 17.4%) for men and 60 to 64 Years (92 | 14.3%) for women.
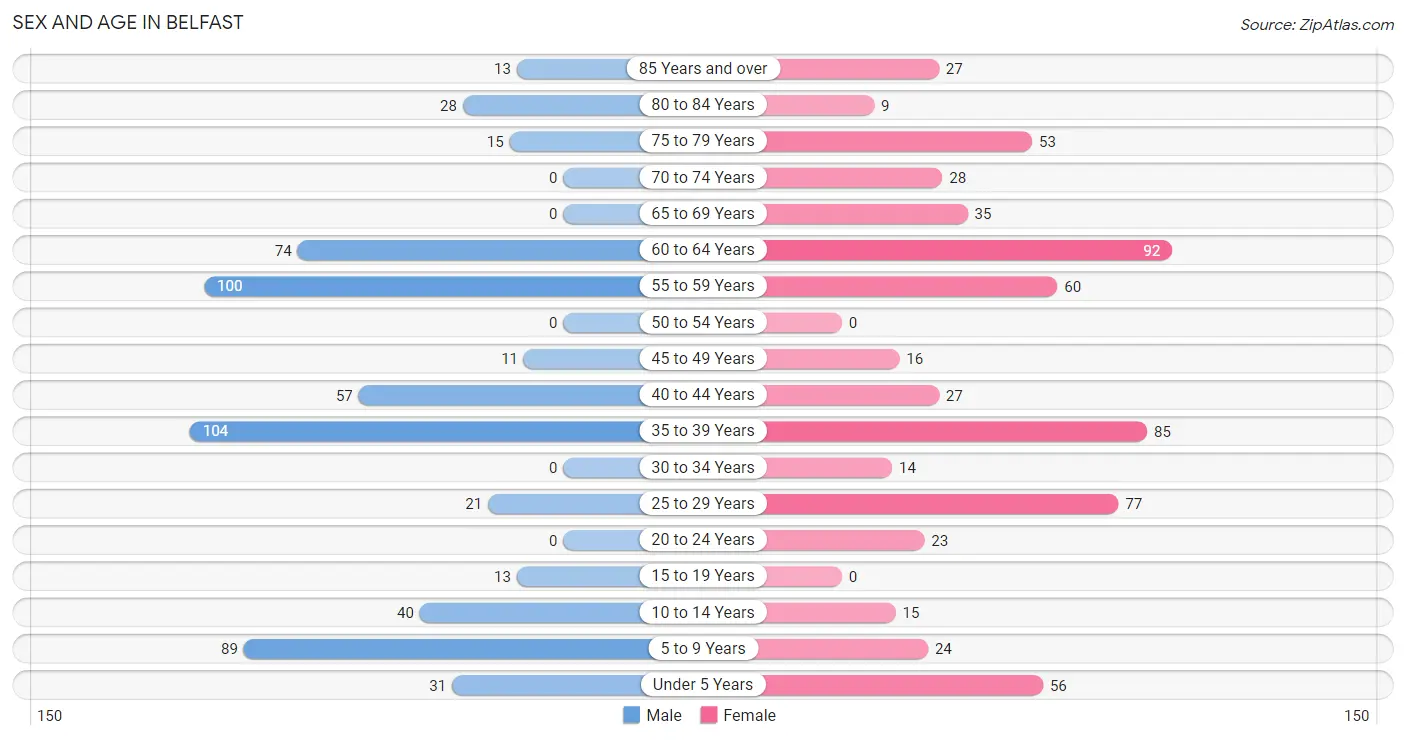
| Age Bracket | Male | Female |
| Under 5 Years | 31 (5.2%) | 56 (8.7%) |
| 5 to 9 Years | 89 (14.9%) | 24 (3.7%) |
| 10 to 14 Years | 40 (6.7%) | 15 (2.3%) |
| 15 to 19 Years | 13 (2.2%) | 0 (0.0%) |
| 20 to 24 Years | 0 (0.0%) | 23 (3.6%) |
| 25 to 29 Years | 21 (3.5%) | 77 (12.0%) |
| 30 to 34 Years | 0 (0.0%) | 14 (2.2%) |
| 35 to 39 Years | 104 (17.4%) | 85 (13.3%) |
| 40 to 44 Years | 57 (9.6%) | 27 (4.2%) |
| 45 to 49 Years | 11 (1.8%) | 16 (2.5%) |
| 50 to 54 Years | 0 (0.0%) | 0 (0.0%) |
| 55 to 59 Years | 100 (16.8%) | 60 (9.4%) |
| 60 to 64 Years | 74 (12.4%) | 92 (14.3%) |
| 65 to 69 Years | 0 (0.0%) | 35 (5.5%) |
| 70 to 74 Years | 0 (0.0%) | 28 (4.4%) |
| 75 to 79 Years | 15 (2.5%) | 53 (8.3%) |
| 80 to 84 Years | 28 (4.7%) | 9 (1.4%) |
| 85 Years and over | 13 (2.2%) | 27 (4.2%) |
| Total | 596 (100.0%) | 641 (100.0%) |
Families and Households in Belfast
Median Family Size in Belfast
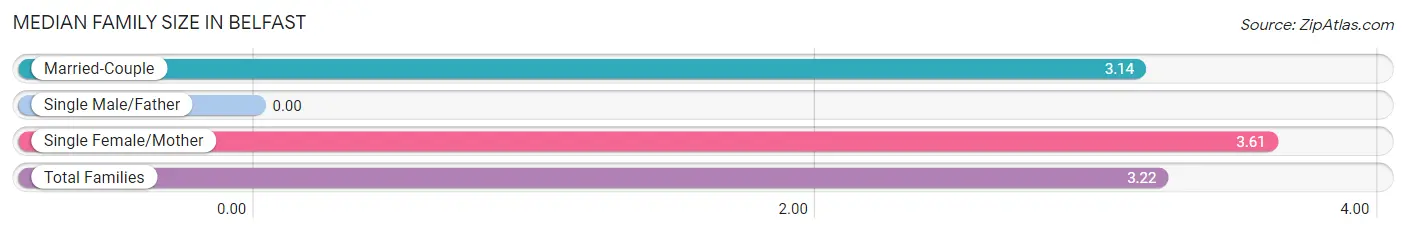
| Family Type | # Families | Family Size |
| Married-Couple | 295 (83.3%) | 3.14 |
| Single Male/Father | 0 (0.0%) | - |
| Single Female/Mother | 59 (16.7%) | 3.61 |
| Total Families | 354 (100.0%) | 3.22 |
Median Household Size in Belfast
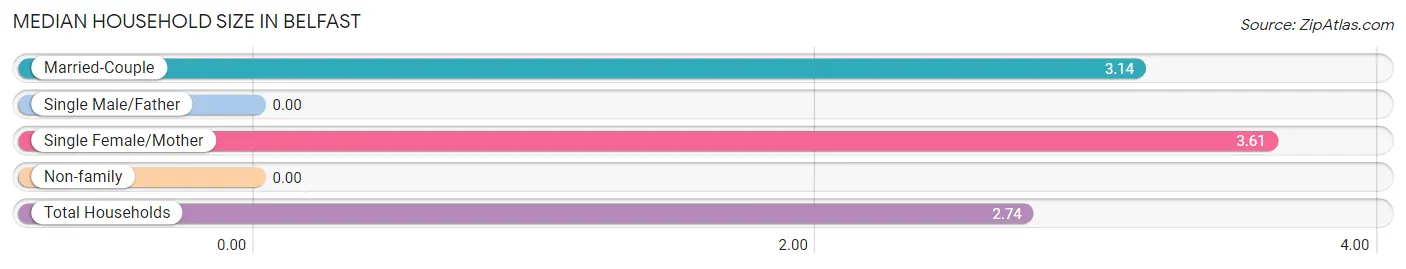
| Household Type | # Households | Household Size |
| Married-Couple | 295 (65.4%) | 3.14 |
| Single Male/Father | 0 (0.0%) | - |
| Single Female/Mother | 59 (13.1%) | 3.61 |
| Non-family | 97 (21.5%) | - |
| Total Households | 451 (100.0%) | 2.74 |
Household Size by Marriage Status in Belfast
Out of a total of 451 households in Belfast, 354 (78.5%) are family households, while 97 (21.5%) are nonfamily households. The most numerous type of family households are 2-person households, comprising 132, and the most common type of nonfamily households are 1-person households, comprising 97.
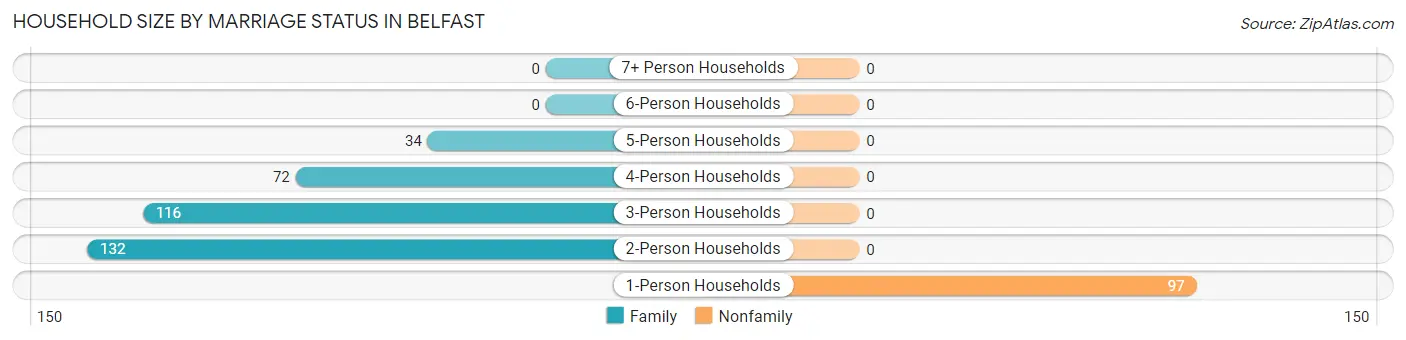
| Household Size | Family Households | Nonfamily Households |
| 1-Person Households | - | 97 (21.5%) |
| 2-Person Households | 132 (29.3%) | 0 (0.0%) |
| 3-Person Households | 116 (25.7%) | 0 (0.0%) |
| 4-Person Households | 72 (16.0%) | 0 (0.0%) |
| 5-Person Households | 34 (7.5%) | 0 (0.0%) |
| 6-Person Households | 0 (0.0%) | 0 (0.0%) |
| 7+ Person Households | 0 (0.0%) | 0 (0.0%) |
| Total | 354 (78.5%) | 97 (21.5%) |
Female Fertility in Belfast
Fertility by Age in Belfast
| Age Bracket | Women with Births | Births / 1,000 Women |
| 15 to 19 years | 0 (0.0%) | 0.0 |
| 20 to 34 years | 0 (0.0%) | 0.0 |
| 35 to 50 years | 0 (0.0%) | 0.0 |
| Total | 0 (0.0%) | 0.0 |
Fertility by Age by Marriage Status in Belfast
| Age Bracket | Married | Unmarried |
| 15 to 19 years | 0 (0.0%) | 0 (0.0%) |
| 20 to 34 years | 0 (0.0%) | 0 (0.0%) |
| 35 to 50 years | 0 (0.0%) | 0 (0.0%) |
| Total | 0 (0.0%) | 0 (0.0%) |
Fertility by Education in Belfast
| Educational Attainment | Women with Births | Births / 1,000 Women |
| Less than High School | 0 (0.0%) | 0.0 |
| High School Diploma | 0 (0.0%) | 0.0 |
| College or Associate's Degree | 0 (0.0%) | 0.0 |
| Bachelor's Degree | 0 (0.0%) | 0.0 |
| Graduate Degree | 0 (0.0%) | 0.0 |
| Total | 0 (0.0%) | 0.0 |
Fertility by Education by Marriage Status in Belfast
| Educational Attainment | Married | Unmarried |
| Less than High School | 0 (0.0%) | 0 (0.0%) |
| High School Diploma | 0 (0.0%) | 0 (0.0%) |
| College or Associate's Degree | 0 (0.0%) | 0 (0.0%) |
| Bachelor's Degree | 0 (0.0%) | 0 (0.0%) |
| Graduate Degree | 0 (0.0%) | 0 (0.0%) |
| Total | 0 (0.0%) | 0 (0.0%) |
Employment Characteristics in Belfast
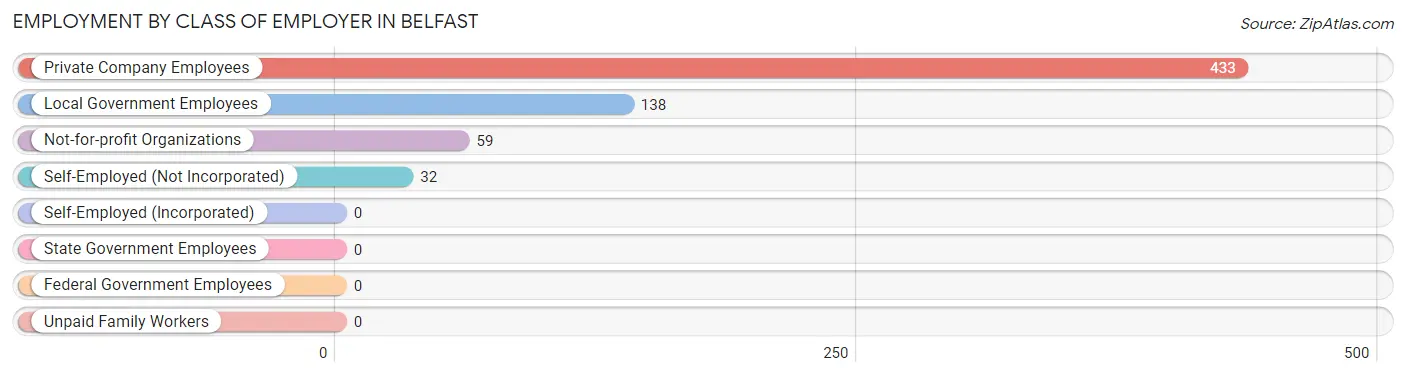
Employment by Class of Employer in Belfast
Among the 662 employed individuals in Belfast, private company employees (433 | 65.4%), local government employees (138 | 20.8%), and not-for-profit organizations (59 | 8.9%) make up the most common classes of employment.
| Employer Class | # Employees | % Employees |
| Private Company Employees | 433 | 65.4% |
| Self-Employed (Incorporated) | 0 | 0.0% |
| Self-Employed (Not Incorporated) | 32 | 4.8% |
| Not-for-profit Organizations | 59 | 8.9% |
| Local Government Employees | 138 | 20.8% |
| State Government Employees | 0 | 0.0% |
| Federal Government Employees | 0 | 0.0% |
| Unpaid Family Workers | 0 | 0.0% |
| Total | 662 | 100.0% |
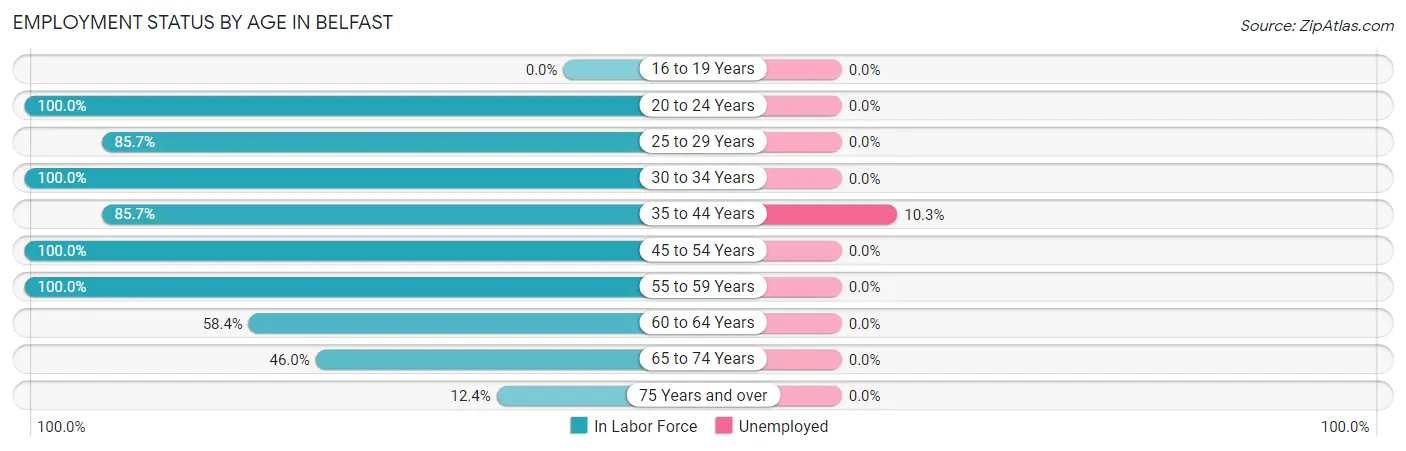
Employment Status by Age in Belfast
According to the labor force statistics for Belfast, out of the total population over 16 years of age (982), 69.9% or 686 individuals are in the labor force, with 3.5% or 24 of them unemployed. The age group with the highest labor force participation rate is 20 to 24 years, with 100.0% or 23 individuals in the labor force. Within the labor force, the 35 to 44 years age range has the highest percentage of unemployed individuals, with 10.3% or 24 of them being unemployed.
| Age Bracket | In Labor Force | Unemployed |
| 16 to 19 Years | 0 (0.0%) | 0 (0.0%) |
| 20 to 24 Years | 23 (100.0%) | 0 (0.0%) |
| 25 to 29 Years | 84 (85.7%) | 0 (0.0%) |
| 30 to 34 Years | 14 (100.0%) | 0 (0.0%) |
| 35 to 44 Years | 234 (85.7%) | 24 (10.3%) |
| 45 to 54 Years | 27 (100.0%) | 0 (0.0%) |
| 55 to 59 Years | 160 (100.0%) | 0 (0.0%) |
| 60 to 64 Years | 97 (58.4%) | 0 (0.0%) |
| 65 to 74 Years | 29 (46.0%) | 0 (0.0%) |
| 75 Years and over | 18 (12.4%) | 0 (0.0%) |
| Total | 686 (69.9%) | 24 (3.5%) |
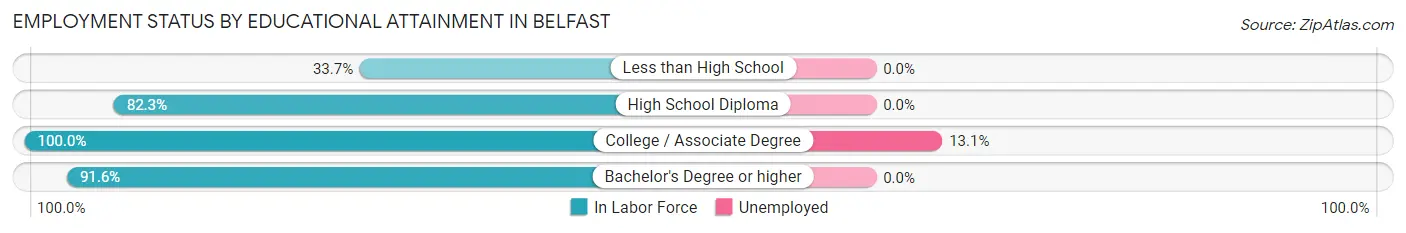
Employment Status by Educational Attainment in Belfast
According to labor force statistics for Belfast, 83.5% of individuals (616) out of the total population between 25 and 64 years of age (738) are in the labor force, with 3.9% or 24 of them being unemployed. The group with the highest labor force participation rate are those with the educational attainment of college / associate degree, with 100.0% or 183 individuals in the labor force. Within the labor force, individuals with college / associate degree education have the highest percentage of unemployment, with 13.1% or 24 of them being unemployed.
| Educational Attainment | In Labor Force | Unemployed |
| Less than High School | 28 (33.7%) | 0 (0.0%) |
| High School Diploma | 241 (82.3%) | 0 (0.0%) |
| College / Associate Degree | 183 (100.0%) | 24 (13.1%) |
| Bachelor's Degree or higher | 164 (91.6%) | 0 (0.0%) |
| Total | 616 (83.5%) | 29 (3.9%) |
Employment Occupations by Sex in Belfast
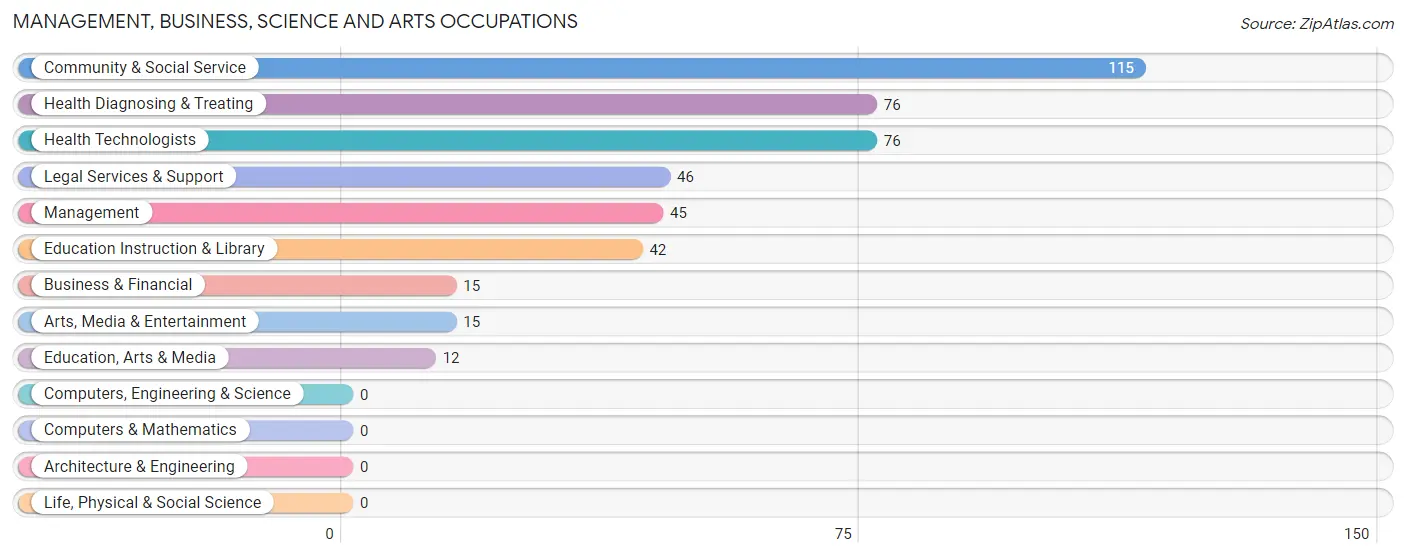
Management, Business, Science and Arts Occupations
The most common Management, Business, Science and Arts occupations in Belfast are Community & Social Service (115 | 17.4%), Health Diagnosing & Treating (76 | 11.5%), Health Technologists (76 | 11.5%), Legal Services & Support (46 | 7.0%), and Management (45 | 6.8%).
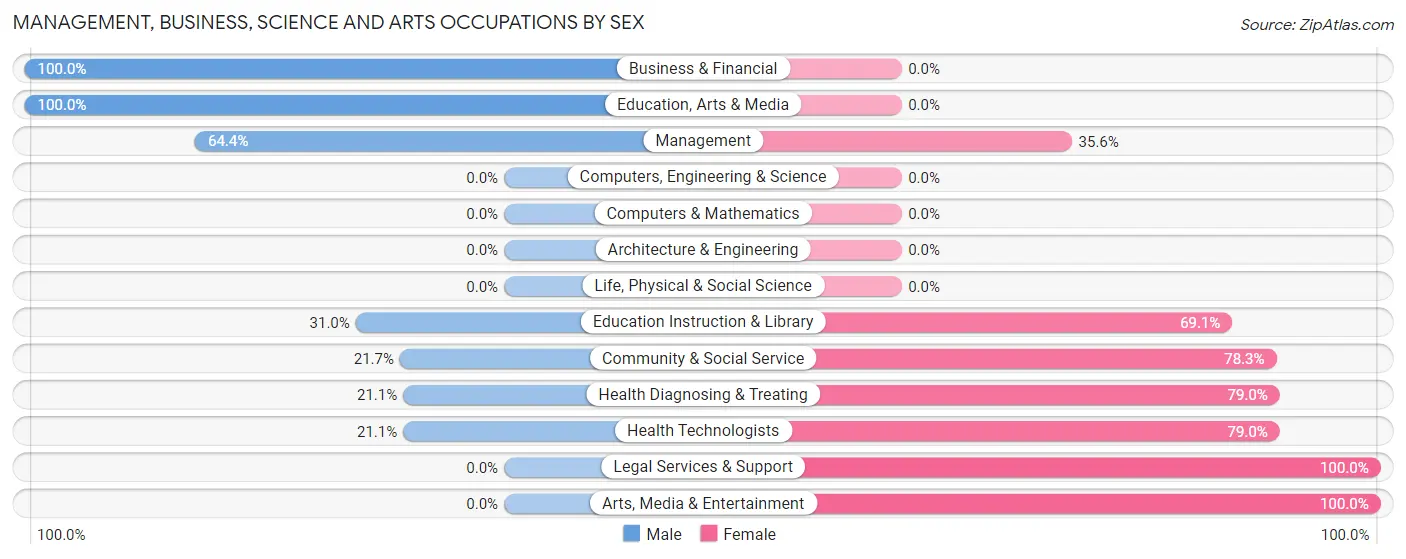
Management, Business, Science and Arts Occupations by Sex
Within the Management, Business, Science and Arts occupations in Belfast, the most male-oriented occupations are Business & Financial (100.0%), Education, Arts & Media (100.0%), and Management (64.4%), while the most female-oriented occupations are Legal Services & Support (100.0%), Arts, Media & Entertainment (100.0%), and Health Diagnosing & Treating (78.9%).
| Occupation | Male | Female |
| Management | 29 (64.4%) | 16 (35.6%) |
| Business & Financial | 15 (100.0%) | 0 (0.0%) |
| Computers, Engineering & Science | 0 (0.0%) | 0 (0.0%) |
| Computers & Mathematics | 0 (0.0%) | 0 (0.0%) |
| Architecture & Engineering | 0 (0.0%) | 0 (0.0%) |
| Life, Physical & Social Science | 0 (0.0%) | 0 (0.0%) |
| Community & Social Service | 25 (21.7%) | 90 (78.3%) |
| Education, Arts & Media | 12 (100.0%) | 0 (0.0%) |
| Legal Services & Support | 0 (0.0%) | 46 (100.0%) |
| Education Instruction & Library | 13 (30.9%) | 29 (69.1%) |
| Arts, Media & Entertainment | 0 (0.0%) | 15 (100.0%) |
| Health Diagnosing & Treating | 16 (21.0%) | 60 (78.9%) |
| Health Technologists | 16 (21.0%) | 60 (78.9%) |
| Total (Category) | 85 (33.9%) | 166 (66.1%) |
| Total (Overall) | 302 (45.6%) | 360 (54.4%) |
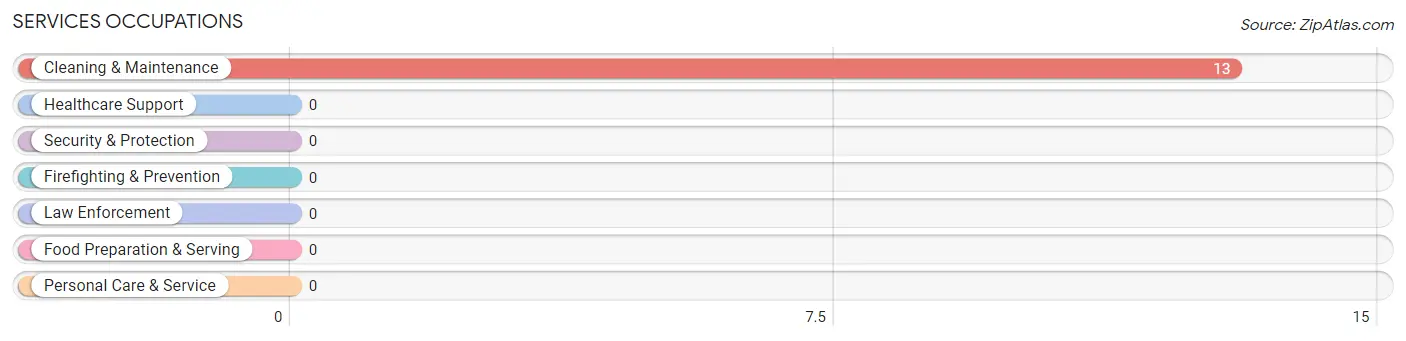
Services Occupations
The most common Services occupations in Belfast are , and Cleaning & Maintenance (13 | 2.0%).
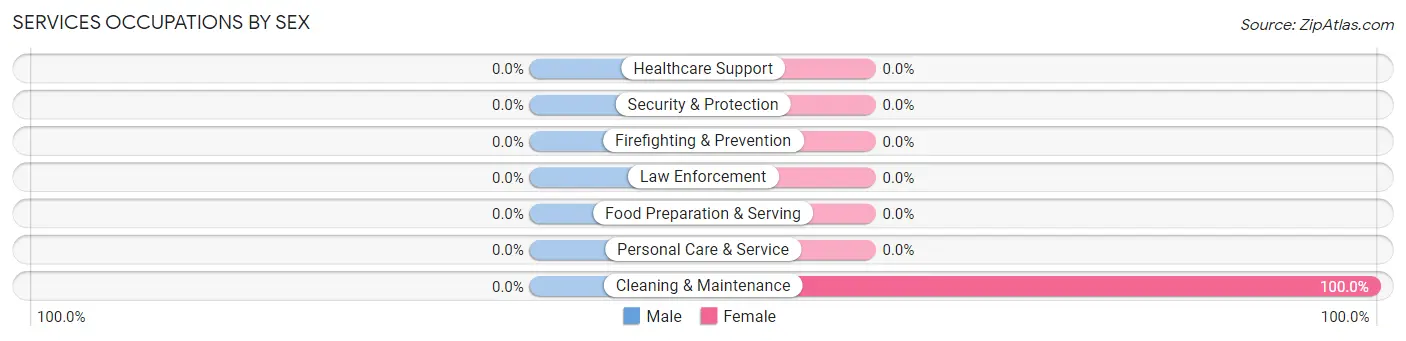
Services Occupations by Sex
| Occupation | Male | Female |
| Healthcare Support | 0 (0.0%) | 0 (0.0%) |
| Security & Protection | 0 (0.0%) | 0 (0.0%) |
| Firefighting & Prevention | 0 (0.0%) | 0 (0.0%) |
| Law Enforcement | 0 (0.0%) | 0 (0.0%) |
| Food Preparation & Serving | 0 (0.0%) | 0 (0.0%) |
| Cleaning & Maintenance | 0 (0.0%) | 13 (100.0%) |
| Personal Care & Service | 0 (0.0%) | 0 (0.0%) |
| Total (Category) | 0 (0.0%) | 13 (100.0%) |
| Total (Overall) | 302 (45.6%) | 360 (54.4%) |
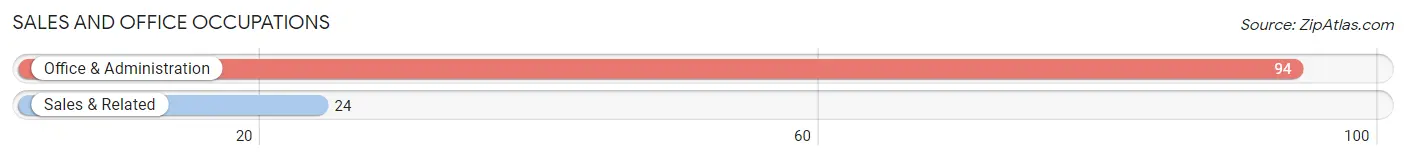
Sales and Office Occupations
The most common Sales and Office occupations in Belfast are Office & Administration (94 | 14.2%), and Sales & Related (24 | 3.6%).
Sales and Office Occupations by Sex
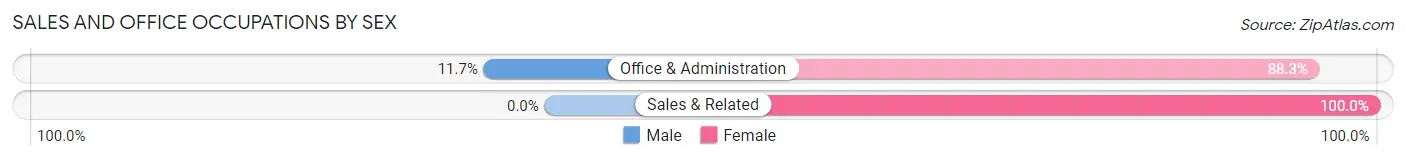
| Occupation | Male | Female |
| Sales & Related | 0 (0.0%) | 24 (100.0%) |
| Office & Administration | 11 (11.7%) | 83 (88.3%) |
| Total (Category) | 11 (9.3%) | 107 (90.7%) |
| Total (Overall) | 302 (45.6%) | 360 (54.4%) |
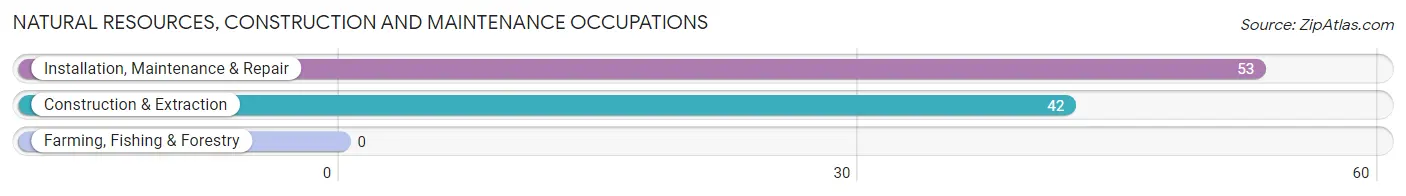
Natural Resources, Construction and Maintenance Occupations
The most common Natural Resources, Construction and Maintenance occupations in Belfast are Installation, Maintenance & Repair (53 | 8.0%), and Construction & Extraction (42 | 6.3%).
Natural Resources, Construction and Maintenance Occupations by Sex
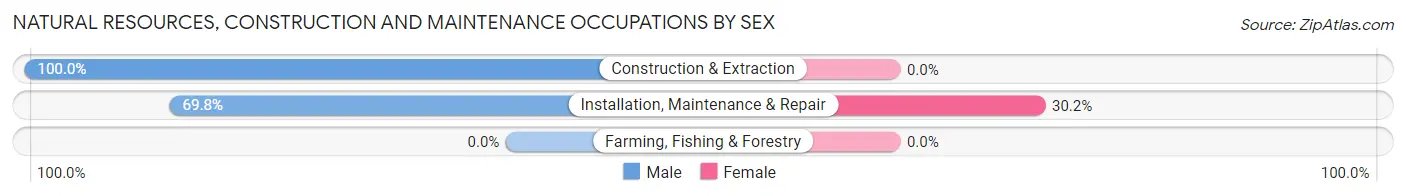
| Occupation | Male | Female |
| Farming, Fishing & Forestry | 0 (0.0%) | 0 (0.0%) |
| Construction & Extraction | 42 (100.0%) | 0 (0.0%) |
| Installation, Maintenance & Repair | 37 (69.8%) | 16 (30.2%) |
| Total (Category) | 79 (83.2%) | 16 (16.8%) |
| Total (Overall) | 302 (45.6%) | 360 (54.4%) |
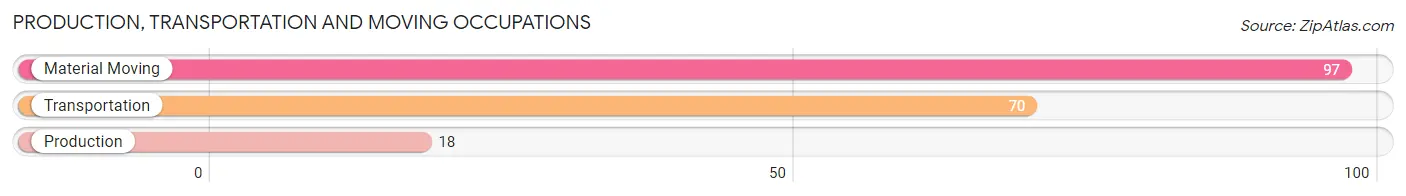
Production, Transportation and Moving Occupations
The most common Production, Transportation and Moving occupations in Belfast are Material Moving (97 | 14.6%), Transportation (70 | 10.6%), and Production (18 | 2.7%).
Production, Transportation and Moving Occupations by Sex
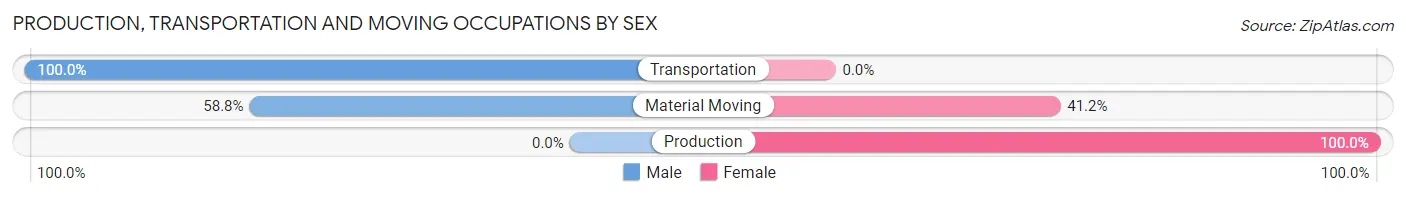
| Occupation | Male | Female |
| Production | 0 (0.0%) | 18 (100.0%) |
| Transportation | 70 (100.0%) | 0 (0.0%) |
| Material Moving | 57 (58.8%) | 40 (41.2%) |
| Total (Category) | 127 (68.6%) | 58 (31.4%) |
| Total (Overall) | 302 (45.6%) | 360 (54.4%) |
Employment Industries by Sex in Belfast
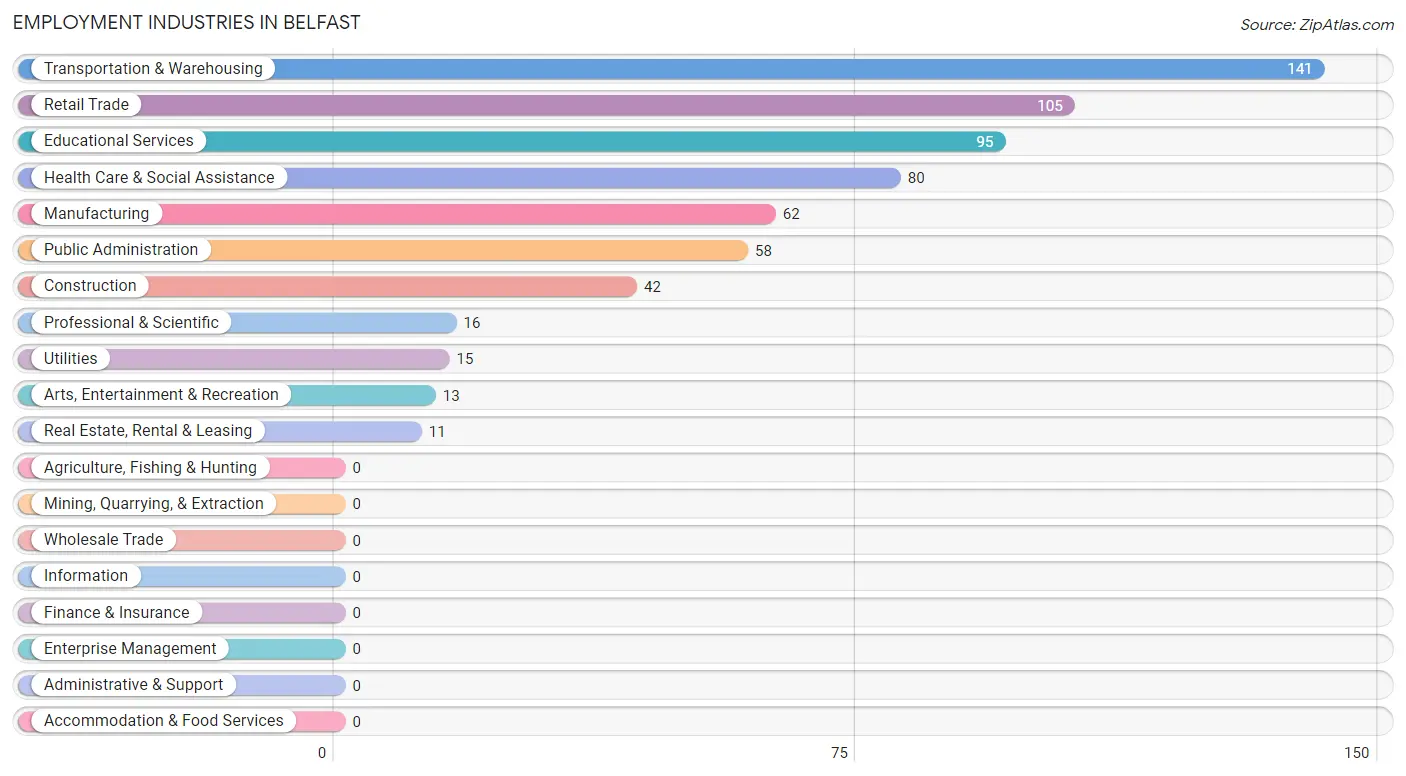
Employment Industries in Belfast
The major employment industries in Belfast include Transportation & Warehousing (141 | 21.3%), Retail Trade (105 | 15.9%), Educational Services (95 | 14.3%), Health Care & Social Assistance (80 | 12.1%), and Manufacturing (62 | 9.4%).
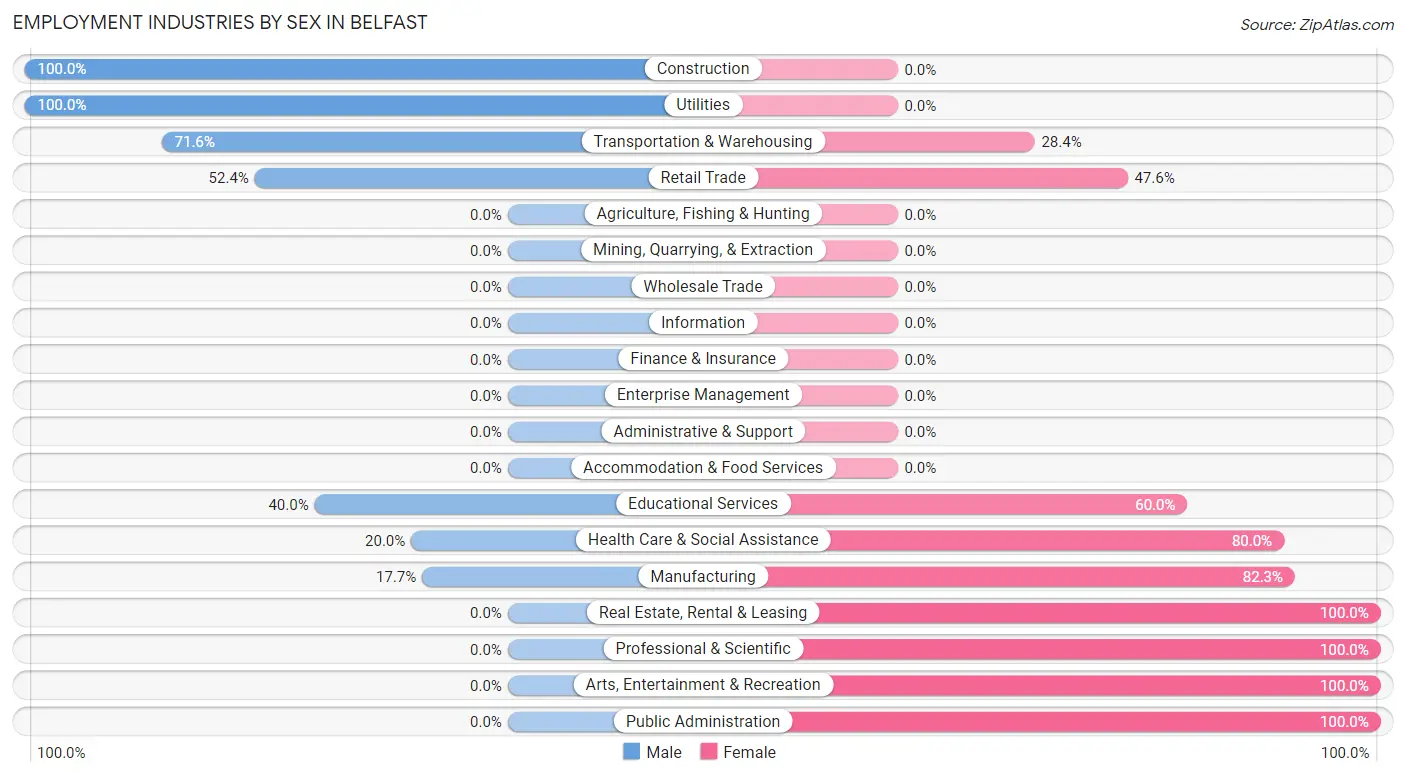
Employment Industries by Sex in Belfast
The Belfast industries that see more men than women are Construction (100.0%), Utilities (100.0%), and Transportation & Warehousing (71.6%), whereas the industries that tend to have a higher number of women are Real Estate, Rental & Leasing (100.0%), Professional & Scientific (100.0%), and Arts, Entertainment & Recreation (100.0%).
| Industry | Male | Female |
| Agriculture, Fishing & Hunting | 0 (0.0%) | 0 (0.0%) |
| Mining, Quarrying, & Extraction | 0 (0.0%) | 0 (0.0%) |
| Construction | 42 (100.0%) | 0 (0.0%) |
| Manufacturing | 11 (17.7%) | 51 (82.3%) |
| Wholesale Trade | 0 (0.0%) | 0 (0.0%) |
| Retail Trade | 55 (52.4%) | 50 (47.6%) |
| Transportation & Warehousing | 101 (71.6%) | 40 (28.4%) |
| Utilities | 15 (100.0%) | 0 (0.0%) |
| Information | 0 (0.0%) | 0 (0.0%) |
| Finance & Insurance | 0 (0.0%) | 0 (0.0%) |
| Real Estate, Rental & Leasing | 0 (0.0%) | 11 (100.0%) |
| Professional & Scientific | 0 (0.0%) | 16 (100.0%) |
| Enterprise Management | 0 (0.0%) | 0 (0.0%) |
| Administrative & Support | 0 (0.0%) | 0 (0.0%) |
| Educational Services | 38 (40.0%) | 57 (60.0%) |
| Health Care & Social Assistance | 16 (20.0%) | 64 (80.0%) |
| Arts, Entertainment & Recreation | 0 (0.0%) | 13 (100.0%) |
| Accommodation & Food Services | 0 (0.0%) | 0 (0.0%) |
| Public Administration | 0 (0.0%) | 58 (100.0%) |
| Total | 302 (45.6%) | 360 (54.4%) |
Education in Belfast
School Enrollment in Belfast
The most common levels of schooling among the 247 students in Belfast are elementary school (93 | 37.7%), nursery / preschool (52 | 21.0%), and middle school (28 | 11.3%).
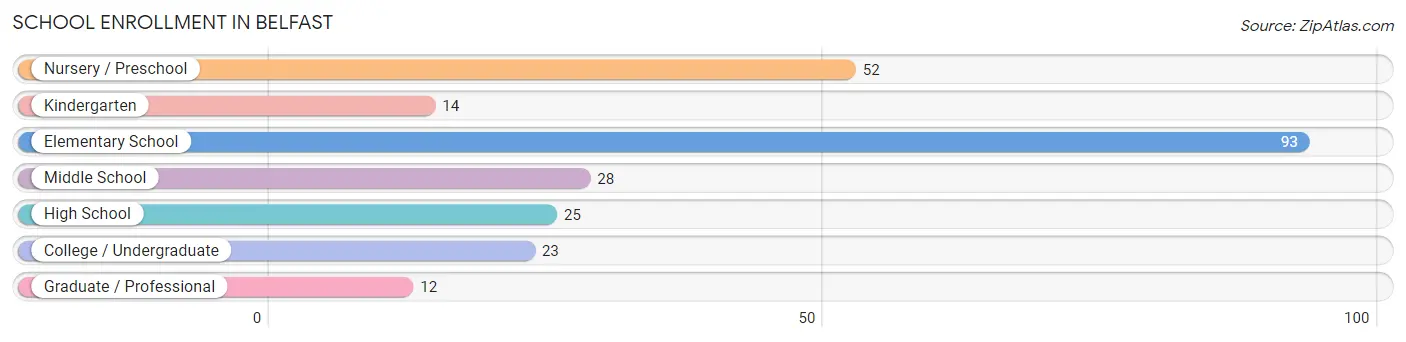
| School Level | # Students | % Students |
| Nursery / Preschool | 52 | 21.0% |
| Kindergarten | 14 | 5.7% |
| Elementary School | 93 | 37.7% |
| Middle School | 28 | 11.3% |
| High School | 25 | 10.1% |
| College / Undergraduate | 23 | 9.3% |
| Graduate / Professional | 12 | 4.9% |
| Total | 247 | 100.0% |
School Enrollment by Age by Funding Source in Belfast
Out of a total of 247 students who are enrolled in schools in Belfast, 31 (12.6%) attend a private institution, while the remaining 216 (87.4%) are enrolled in public schools. The age group of 35 years and over has the highest likelihood of being enrolled in private schools, with 12 (100.0% in the age bracket) enrolled. Conversely, the age group of 3 to 4 year olds has the lowest likelihood of being enrolled in a private school, with 31 (100.0% in the age bracket) attending a public institution.
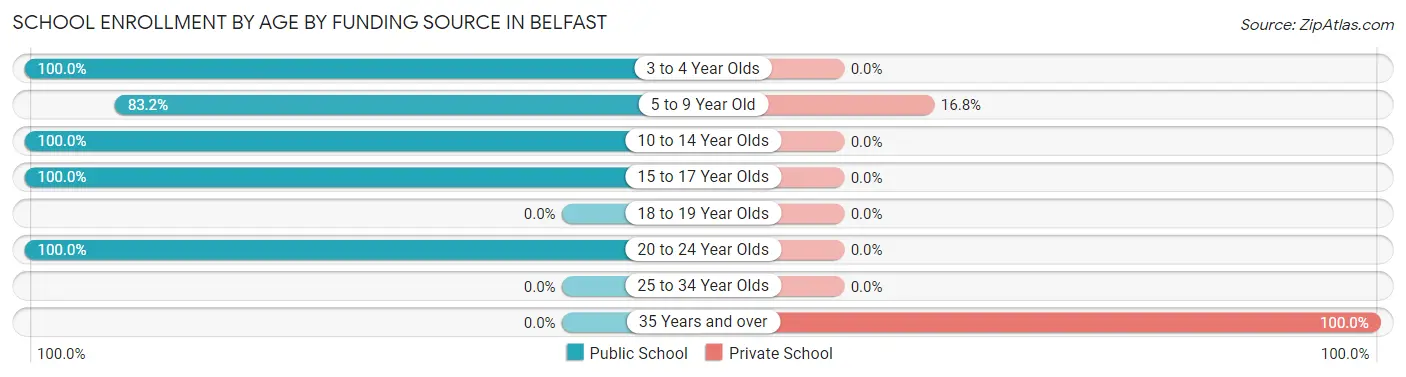
| Age Bracket | Public School | Private School |
| 3 to 4 Year Olds | 31 (100.0%) | 0 (0.0%) |
| 5 to 9 Year Old | 94 (83.2%) | 19 (16.8%) |
| 10 to 14 Year Olds | 55 (100.0%) | 0 (0.0%) |
| 15 to 17 Year Olds | 13 (100.0%) | 0 (0.0%) |
| 18 to 19 Year Olds | 0 (0.0%) | 0 (0.0%) |
| 20 to 24 Year Olds | 23 (100.0%) | 0 (0.0%) |
| 25 to 34 Year Olds | 0 (0.0%) | 0 (0.0%) |
| 35 Years and over | 0 (0.0%) | 12 (100.0%) |
| Total | 216 (87.4%) | 31 (12.6%) |
Educational Attainment by Field of Study in Belfast
Liberal arts & history (46 | 23.7%), education (42 | 21.6%), business (26 | 13.4%), social sciences (16 | 8.3%), and physical & health sciences (15 | 7.7%) are the most common fields of study among 194 individuals in Belfast who have obtained a bachelor's degree or higher.
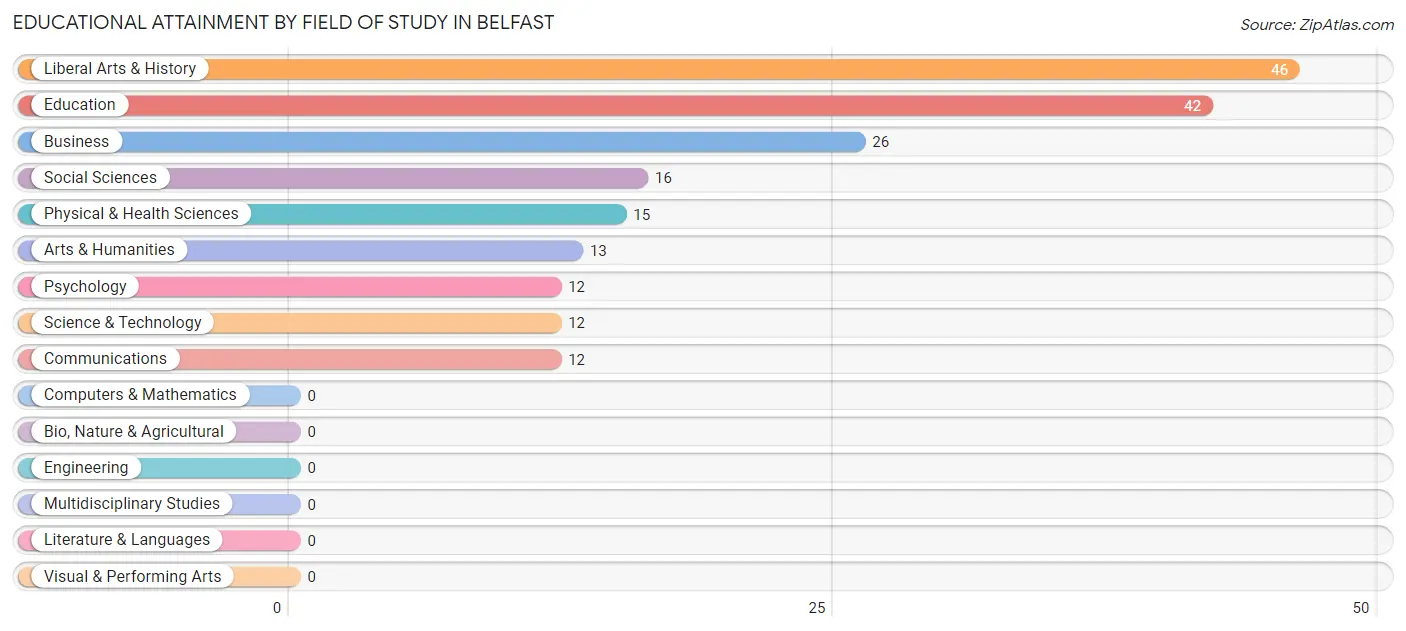
| Field of Study | # Graduates | % Graduates |
| Computers & Mathematics | 0 | 0.0% |
| Bio, Nature & Agricultural | 0 | 0.0% |
| Physical & Health Sciences | 15 | 7.7% |
| Psychology | 12 | 6.2% |
| Social Sciences | 16 | 8.3% |
| Engineering | 0 | 0.0% |
| Multidisciplinary Studies | 0 | 0.0% |
| Science & Technology | 12 | 6.2% |
| Business | 26 | 13.4% |
| Education | 42 | 21.6% |
| Literature & Languages | 0 | 0.0% |
| Liberal Arts & History | 46 | 23.7% |
| Visual & Performing Arts | 0 | 0.0% |
| Communications | 12 | 6.2% |
| Arts & Humanities | 13 | 6.7% |
| Total | 194 | 100.0% |
Transportation & Commute in Belfast
Vehicle Availability by Sex in Belfast
The most prevalent vehicle ownership categories in Belfast are males with 2 vehicles (127, accounting for 42.0%) and females with 2 vehicles (105, making up 35.3%).
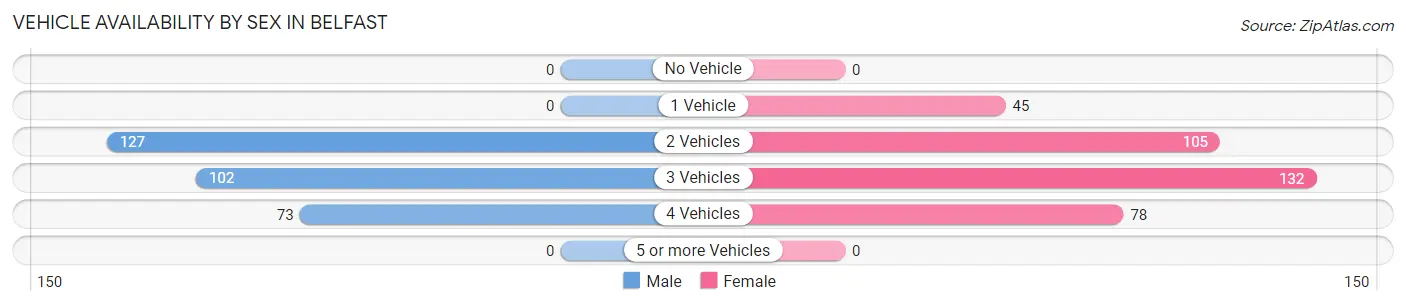
| Vehicles Available | Male | Female |
| No Vehicle | 0 (0.0%) | 0 (0.0%) |
| 1 Vehicle | 0 (0.0%) | 45 (12.5%) |
| 2 Vehicles | 127 (42.0%) | 105 (29.2%) |
| 3 Vehicles | 102 (33.8%) | 132 (36.7%) |
| 4 Vehicles | 73 (24.2%) | 78 (21.7%) |
| 5 or more Vehicles | 0 (0.0%) | 0 (0.0%) |
| Total | 302 (100.0%) | 360 (100.0%) |
Commute Time in Belfast
The most frequently occuring commute durations in Belfast are 15 to 19 minutes (123 commuters, 18.6%), 10 to 14 minutes (99 commuters, 14.9%), and 45 to 59 minutes (90 commuters, 13.6%).
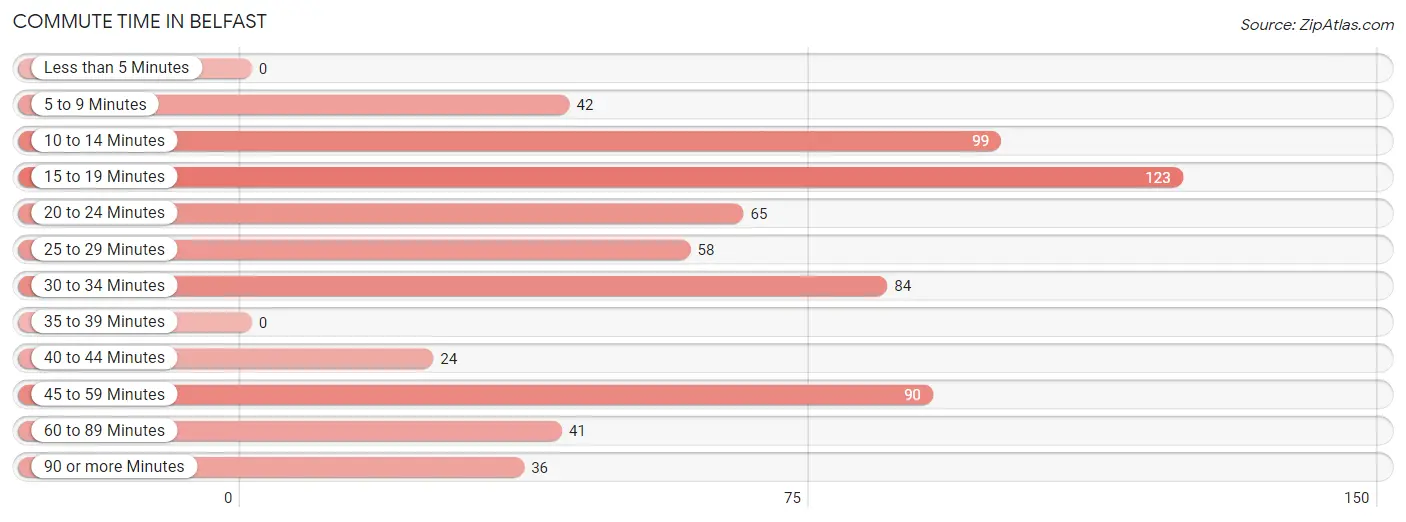
| Commute Time | # Commuters | % Commuters |
| Less than 5 Minutes | 0 | 0.0% |
| 5 to 9 Minutes | 42 | 6.3% |
| 10 to 14 Minutes | 99 | 14.9% |
| 15 to 19 Minutes | 123 | 18.6% |
| 20 to 24 Minutes | 65 | 9.8% |
| 25 to 29 Minutes | 58 | 8.8% |
| 30 to 34 Minutes | 84 | 12.7% |
| 35 to 39 Minutes | 0 | 0.0% |
| 40 to 44 Minutes | 24 | 3.6% |
| 45 to 59 Minutes | 90 | 13.6% |
| 60 to 89 Minutes | 41 | 6.2% |
| 90 or more Minutes | 36 | 5.4% |
Commute Time by Sex in Belfast
The most common commute times in Belfast are 45 to 59 minutes (73 commuters, 24.2%) for males and 15 to 19 minutes (96 commuters, 26.7%) for females.
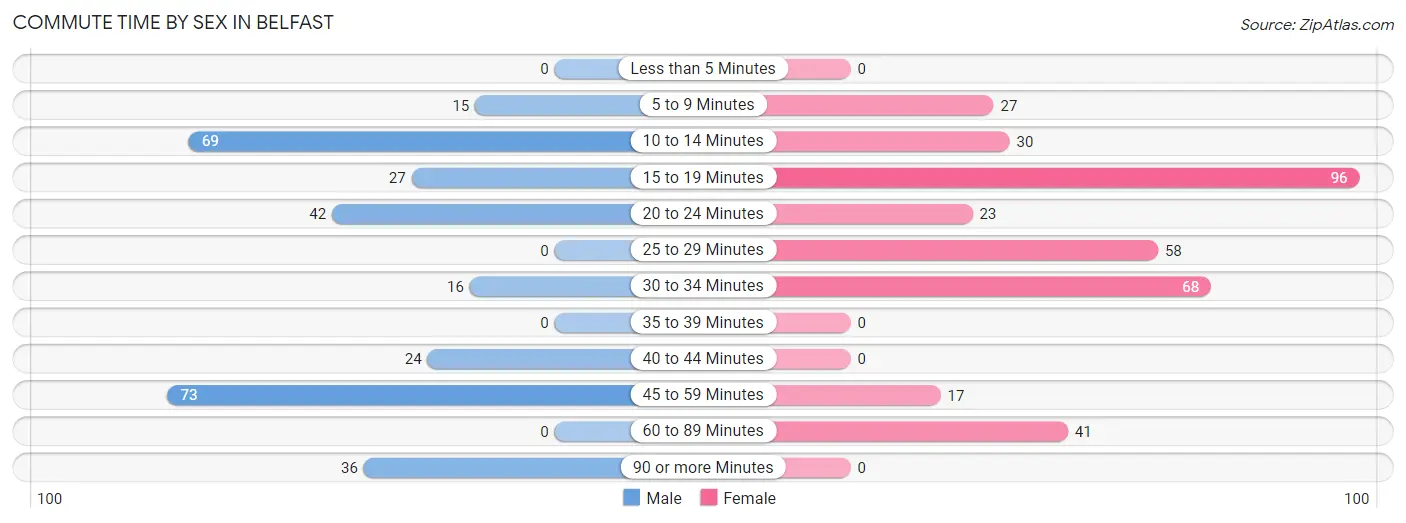
| Commute Time | Male | Female |
| Less than 5 Minutes | 0 (0.0%) | 0 (0.0%) |
| 5 to 9 Minutes | 15 (5.0%) | 27 (7.5%) |
| 10 to 14 Minutes | 69 (22.9%) | 30 (8.3%) |
| 15 to 19 Minutes | 27 (8.9%) | 96 (26.7%) |
| 20 to 24 Minutes | 42 (13.9%) | 23 (6.4%) |
| 25 to 29 Minutes | 0 (0.0%) | 58 (16.1%) |
| 30 to 34 Minutes | 16 (5.3%) | 68 (18.9%) |
| 35 to 39 Minutes | 0 (0.0%) | 0 (0.0%) |
| 40 to 44 Minutes | 24 (8.0%) | 0 (0.0%) |
| 45 to 59 Minutes | 73 (24.2%) | 17 (4.7%) |
| 60 to 89 Minutes | 0 (0.0%) | 41 (11.4%) |
| 90 or more Minutes | 36 (11.9%) | 0 (0.0%) |
Time of Departure to Work by Sex in Belfast
The most frequent times of departure to work in Belfast are 7:00 AM to 7:29 AM (81, 26.8%) for males and 8:30 AM to 8:59 AM (83, 23.1%) for females.
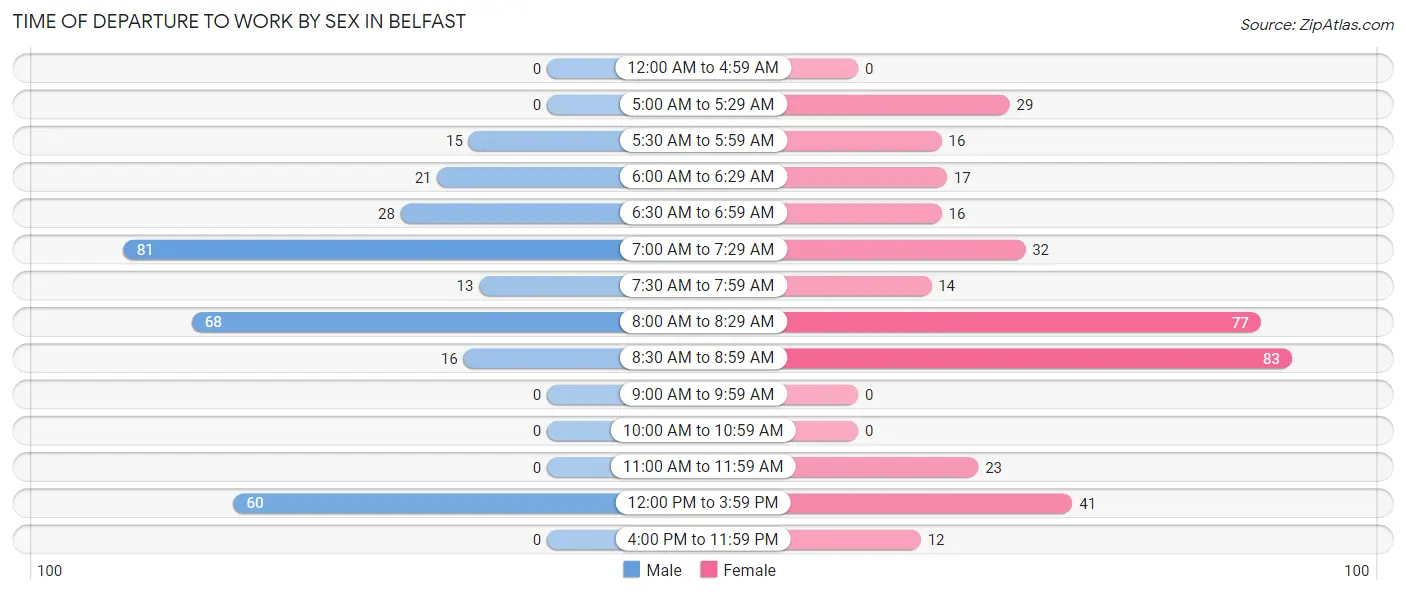
| Time of Departure | Male | Female |
| 12:00 AM to 4:59 AM | 0 (0.0%) | 0 (0.0%) |
| 5:00 AM to 5:29 AM | 0 (0.0%) | 29 (8.1%) |
| 5:30 AM to 5:59 AM | 15 (5.0%) | 16 (4.4%) |
| 6:00 AM to 6:29 AM | 21 (7.0%) | 17 (4.7%) |
| 6:30 AM to 6:59 AM | 28 (9.3%) | 16 (4.4%) |
| 7:00 AM to 7:29 AM | 81 (26.8%) | 32 (8.9%) |
| 7:30 AM to 7:59 AM | 13 (4.3%) | 14 (3.9%) |
| 8:00 AM to 8:29 AM | 68 (22.5%) | 77 (21.4%) |
| 8:30 AM to 8:59 AM | 16 (5.3%) | 83 (23.1%) |
| 9:00 AM to 9:59 AM | 0 (0.0%) | 0 (0.0%) |
| 10:00 AM to 10:59 AM | 0 (0.0%) | 0 (0.0%) |
| 11:00 AM to 11:59 AM | 0 (0.0%) | 23 (6.4%) |
| 12:00 PM to 3:59 PM | 60 (19.9%) | 41 (11.4%) |
| 4:00 PM to 11:59 PM | 0 (0.0%) | 12 (3.3%) |
| Total | 302 (100.0%) | 360 (100.0%) |
Housing Occupancy in Belfast
Occupancy by Ownership in Belfast
Of the total 451 dwellings in Belfast, owner-occupied units account for 435 (96.5%), while renter-occupied units make up 16 (3.5%).
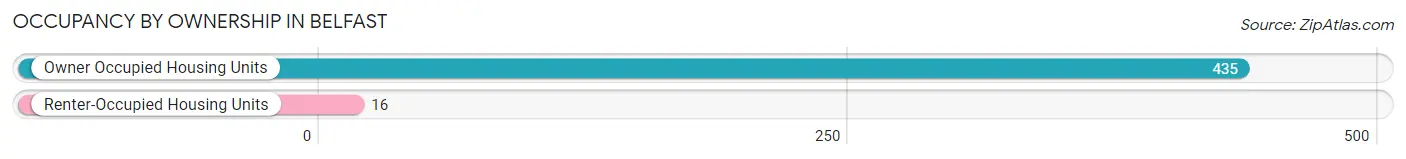
| Occupancy | # Housing Units | % Housing Units |
| Owner Occupied Housing Units | 435 | 96.5% |
| Renter-Occupied Housing Units | 16 | 3.5% |
| Total Occupied Housing Units | 451 | 100.0% |
Occupancy by Household Size in Belfast
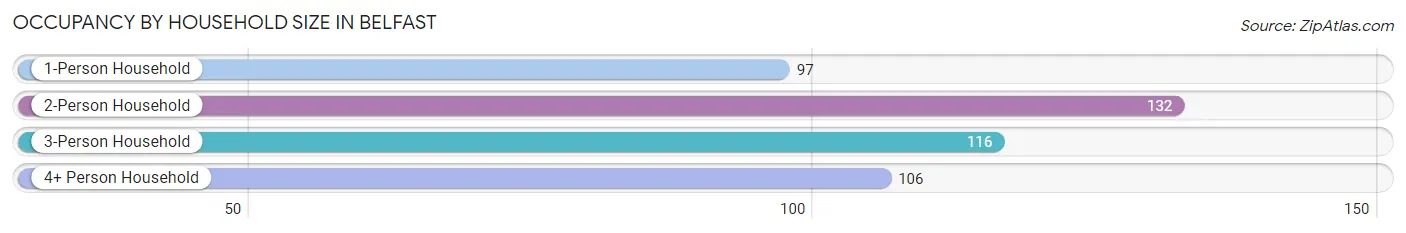
| Household Size | # Housing Units | % Housing Units |
| 1-Person Household | 97 | 21.5% |
| 2-Person Household | 132 | 29.3% |
| 3-Person Household | 116 | 25.7% |
| 4+ Person Household | 106 | 23.5% |
| Total Housing Units | 451 | 100.0% |
Occupancy by Ownership by Household Size in Belfast
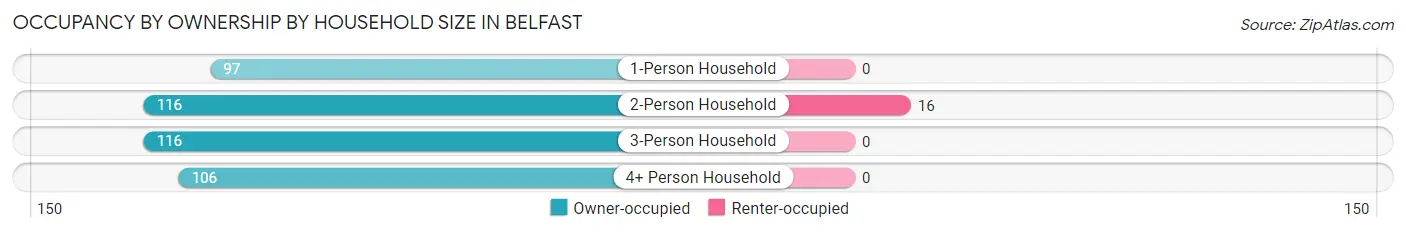
| Household Size | Owner-occupied | Renter-occupied |
| 1-Person Household | 97 (100.0%) | 0 (0.0%) |
| 2-Person Household | 116 (87.9%) | 16 (12.1%) |
| 3-Person Household | 116 (100.0%) | 0 (0.0%) |
| 4+ Person Household | 106 (100.0%) | 0 (0.0%) |
| Total Housing Units | 435 (96.5%) | 16 (3.5%) |
Occupancy by Educational Attainment in Belfast
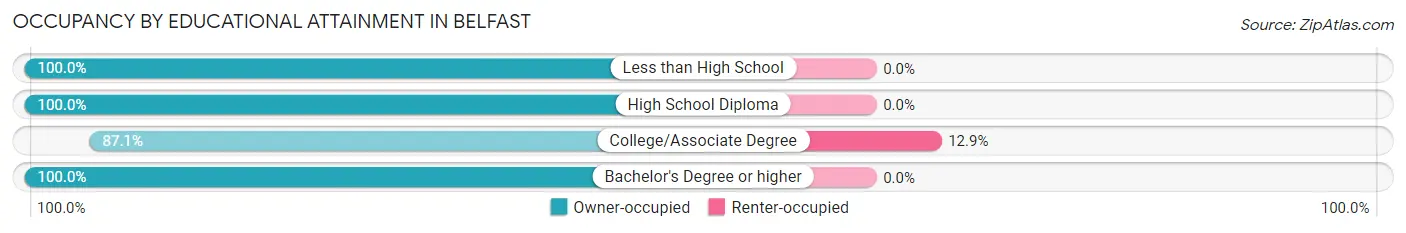
| Household Size | Owner-occupied | Renter-occupied |
| Less than High School | 15 (100.0%) | 0 (0.0%) |
| High School Diploma | 233 (100.0%) | 0 (0.0%) |
| College/Associate Degree | 108 (87.1%) | 16 (12.9%) |
| Bachelor's Degree or higher | 79 (100.0%) | 0 (0.0%) |
Occupancy by Age of Householder in Belfast
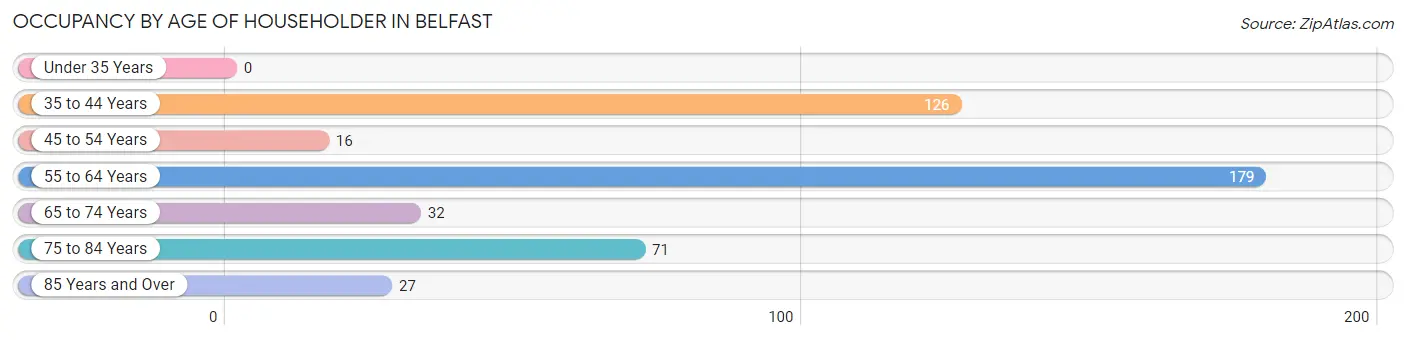
| Age Bracket | # Households | % Households |
| Under 35 Years | 0 | 0.0% |
| 35 to 44 Years | 126 | 27.9% |
| 45 to 54 Years | 16 | 3.5% |
| 55 to 64 Years | 179 | 39.7% |
| 65 to 74 Years | 32 | 7.1% |
| 75 to 84 Years | 71 | 15.7% |
| 85 Years and Over | 27 | 6.0% |
| Total | 451 | 100.0% |
Housing Finances in Belfast
Median Income by Occupancy in Belfast
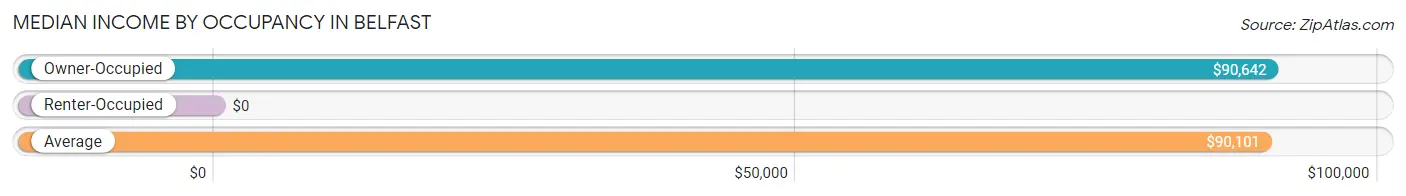
| Occupancy Type | # Households | Median Income |
| Owner-Occupied | 435 (96.5%) | $90,642 |
| Renter-Occupied | 16 (3.5%) | $0 |
| Average | 451 (100.0%) | $90,101 |
Occupancy by Householder Income Bracket in Belfast
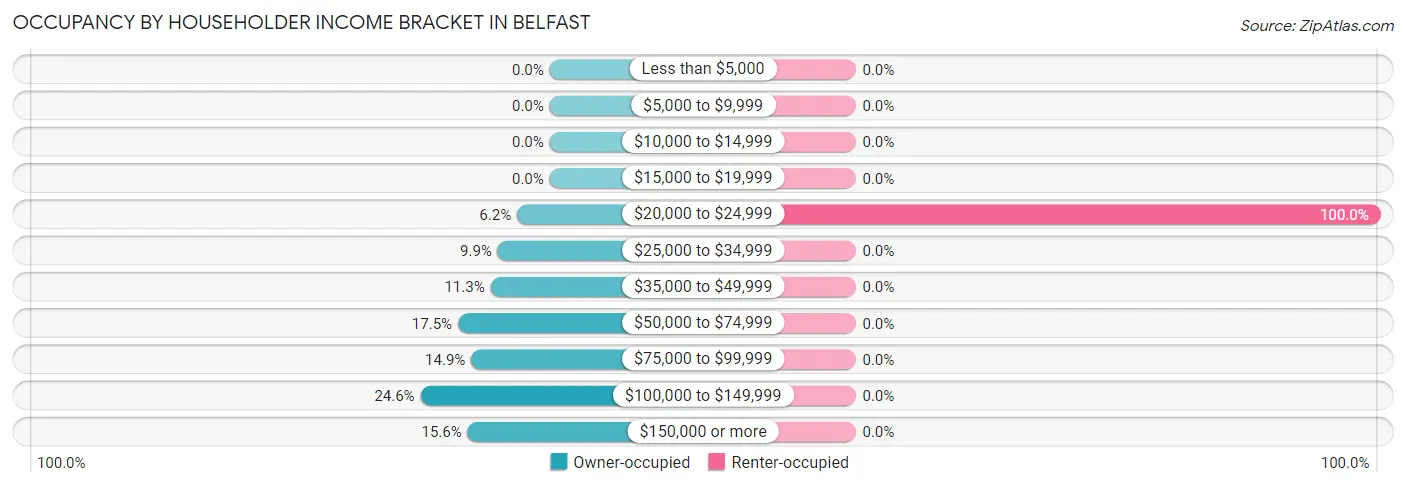
| Income Bracket | Owner-occupied | Renter-occupied |
| Less than $5,000 | 0 (0.0%) | 0 (0.0%) |
| $5,000 to $9,999 | 0 (0.0%) | 0 (0.0%) |
| $10,000 to $14,999 | 0 (0.0%) | 0 (0.0%) |
| $15,000 to $19,999 | 0 (0.0%) | 0 (0.0%) |
| $20,000 to $24,999 | 27 (6.2%) | 16 (100.0%) |
| $25,000 to $34,999 | 43 (9.9%) | 0 (0.0%) |
| $35,000 to $49,999 | 49 (11.3%) | 0 (0.0%) |
| $50,000 to $74,999 | 76 (17.5%) | 0 (0.0%) |
| $75,000 to $99,999 | 65 (14.9%) | 0 (0.0%) |
| $100,000 to $149,999 | 107 (24.6%) | 0 (0.0%) |
| $150,000 or more | 68 (15.6%) | 0 (0.0%) |
| Total | 435 (100.0%) | 16 (100.0%) |
Monthly Housing Cost Tiers in Belfast
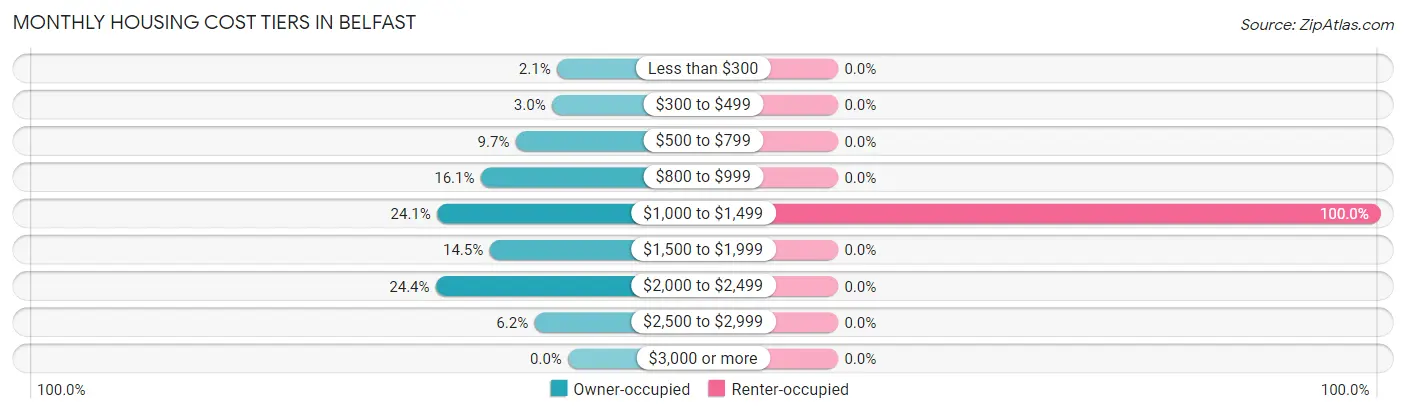
| Monthly Cost | Owner-occupied | Renter-occupied |
| Less than $300 | 9 (2.1%) | 0 (0.0%) |
| $300 to $499 | 13 (3.0%) | 0 (0.0%) |
| $500 to $799 | 42 (9.7%) | 0 (0.0%) |
| $800 to $999 | 70 (16.1%) | 0 (0.0%) |
| $1,000 to $1,499 | 105 (24.1%) | 16 (100.0%) |
| $1,500 to $1,999 | 63 (14.5%) | 0 (0.0%) |
| $2,000 to $2,499 | 106 (24.4%) | 0 (0.0%) |
| $2,500 to $2,999 | 27 (6.2%) | 0 (0.0%) |
| $3,000 or more | 0 (0.0%) | 0 (0.0%) |
| Total | 435 (100.0%) | 16 (100.0%) |
Physical Housing Characteristics in Belfast
Housing Structures in Belfast
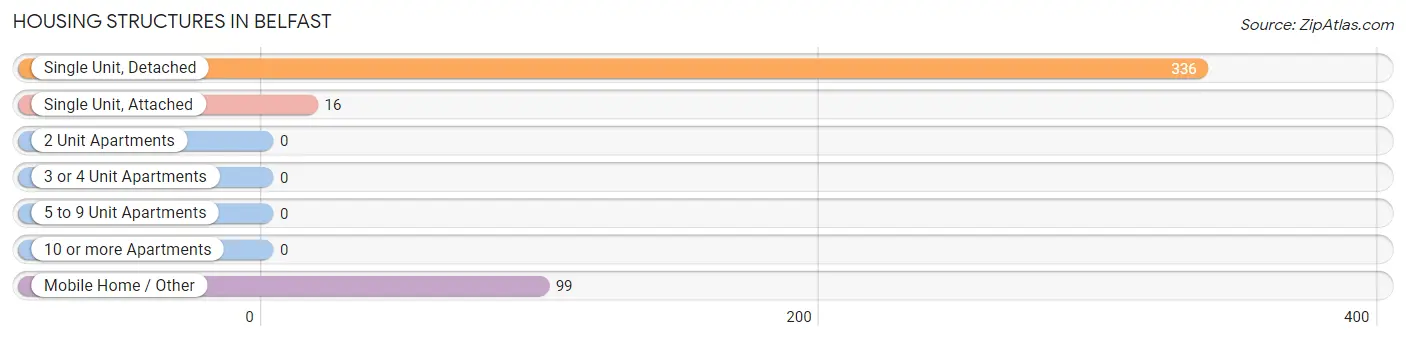
| Structure Type | # Housing Units | % Housing Units |
| Single Unit, Detached | 336 | 74.5% |
| Single Unit, Attached | 16 | 3.5% |
| 2 Unit Apartments | 0 | 0.0% |
| 3 or 4 Unit Apartments | 0 | 0.0% |
| 5 to 9 Unit Apartments | 0 | 0.0% |
| 10 or more Apartments | 0 | 0.0% |
| Mobile Home / Other | 99 | 22.0% |
| Total | 451 | 100.0% |
Housing Structures by Occupancy in Belfast
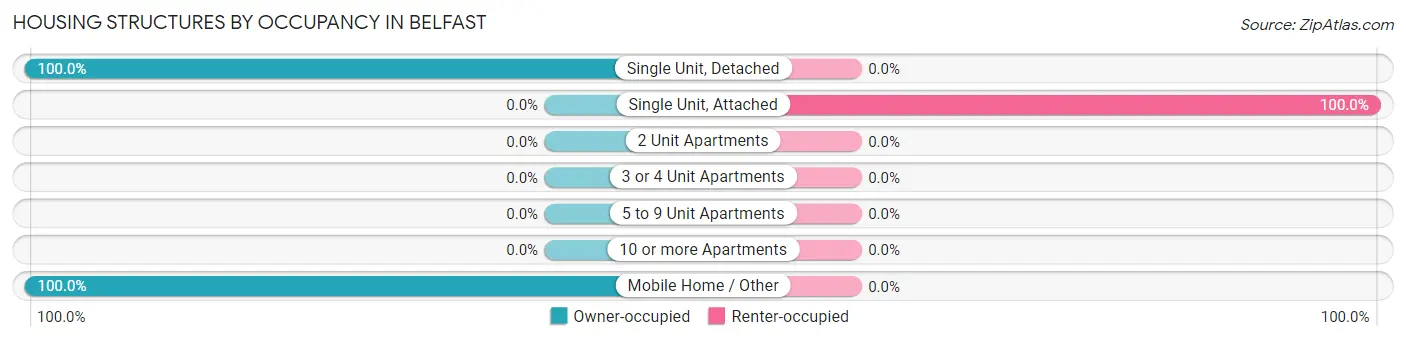
| Structure Type | Owner-occupied | Renter-occupied |
| Single Unit, Detached | 336 (100.0%) | 0 (0.0%) |
| Single Unit, Attached | 0 (0.0%) | 16 (100.0%) |
| 2 Unit Apartments | 0 (0.0%) | 0 (0.0%) |
| 3 or 4 Unit Apartments | 0 (0.0%) | 0 (0.0%) |
| 5 to 9 Unit Apartments | 0 (0.0%) | 0 (0.0%) |
| 10 or more Apartments | 0 (0.0%) | 0 (0.0%) |
| Mobile Home / Other | 99 (100.0%) | 0 (0.0%) |
| Total | 435 (96.5%) | 16 (3.5%) |
Housing Structures by Number of Rooms in Belfast
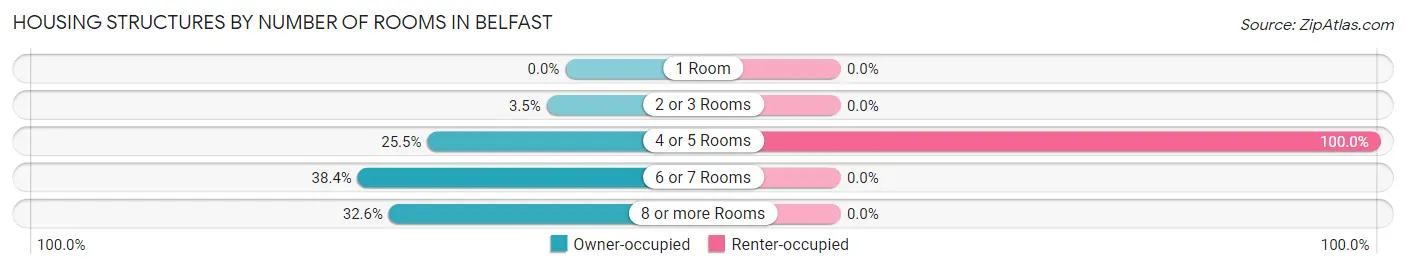
| Number of Rooms | Owner-occupied | Renter-occupied |
| 1 Room | 0 (0.0%) | 0 (0.0%) |
| 2 or 3 Rooms | 15 (3.5%) | 0 (0.0%) |
| 4 or 5 Rooms | 111 (25.5%) | 16 (100.0%) |
| 6 or 7 Rooms | 167 (38.4%) | 0 (0.0%) |
| 8 or more Rooms | 142 (32.6%) | 0 (0.0%) |
| Total | 435 (100.0%) | 16 (100.0%) |
Housing Structure by Heating Type in Belfast
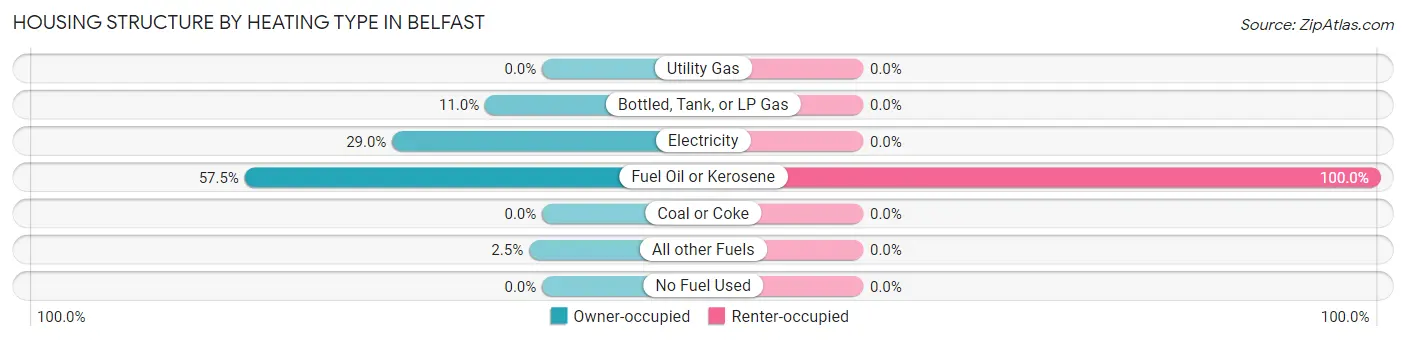
| Heating Type | Owner-occupied | Renter-occupied |
| Utility Gas | 0 (0.0%) | 0 (0.0%) |
| Bottled, Tank, or LP Gas | 48 (11.0%) | 0 (0.0%) |
| Electricity | 126 (29.0%) | 0 (0.0%) |
| Fuel Oil or Kerosene | 250 (57.5%) | 16 (100.0%) |
| Coal or Coke | 0 (0.0%) | 0 (0.0%) |
| All other Fuels | 11 (2.5%) | 0 (0.0%) |
| No Fuel Used | 0 (0.0%) | 0 (0.0%) |
| Total | 435 (100.0%) | 16 (100.0%) |
Household Vehicle Usage in Belfast
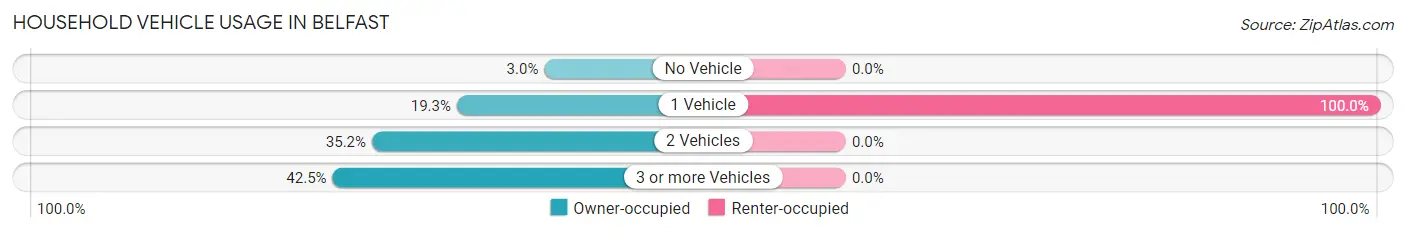
| Vehicles per Household | Owner-occupied | Renter-occupied |
| No Vehicle | 13 (3.0%) | 0 (0.0%) |
| 1 Vehicle | 84 (19.3%) | 16 (100.0%) |
| 2 Vehicles | 153 (35.2%) | 0 (0.0%) |
| 3 or more Vehicles | 185 (42.5%) | 0 (0.0%) |
| Total | 435 (100.0%) | 16 (100.0%) |
Real Estate & Mortgages in Belfast
Real Estate and Mortgage Overview in Belfast
| Characteristic | Without Mortgage | With Mortgage |
| Housing Units | 138 | 297 |
| Median Property Value | $184,600 | $232,300 |
| Median Household Income | $63,021 | $68 |
| Monthly Housing Costs | $838 | $0 |
| Real Estate Taxes | - | - |
Property Value by Mortgage Status in Belfast
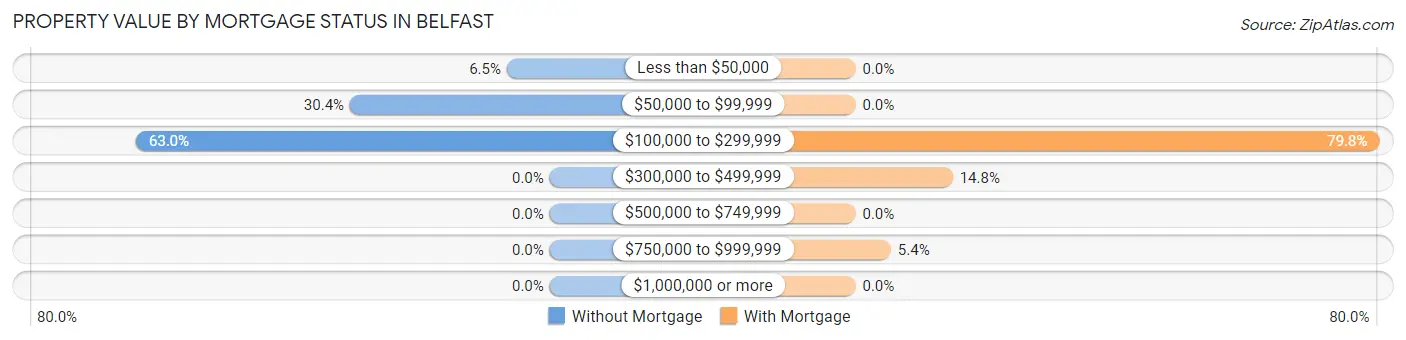
| Property Value | Without Mortgage | With Mortgage |
| Less than $50,000 | 9 (6.5%) | 0 (0.0%) |
| $50,000 to $99,999 | 42 (30.4%) | 0 (0.0%) |
| $100,000 to $299,999 | 87 (63.0%) | 237 (79.8%) |
| $300,000 to $499,999 | 0 (0.0%) | 44 (14.8%) |
| $500,000 to $749,999 | 0 (0.0%) | 0 (0.0%) |
| $750,000 to $999,999 | 0 (0.0%) | 16 (5.4%) |
| $1,000,000 or more | 0 (0.0%) | 0 (0.0%) |
| Total | 138 (100.0%) | 297 (100.0%) |
Household Income by Mortgage Status in Belfast
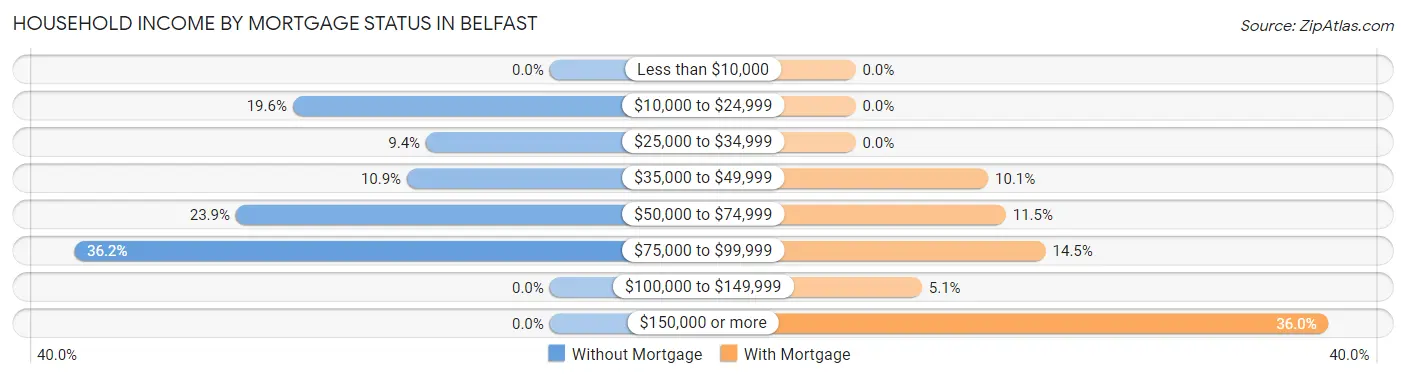
| Household Income | Without Mortgage | With Mortgage |
| Less than $10,000 | 0 (0.0%) | 0 (0.0%) |
| $10,000 to $24,999 | 27 (19.6%) | 0 (0.0%) |
| $25,000 to $34,999 | 13 (9.4%) | 0 (0.0%) |
| $35,000 to $49,999 | 15 (10.9%) | 30 (10.1%) |
| $50,000 to $74,999 | 33 (23.9%) | 34 (11.5%) |
| $75,000 to $99,999 | 50 (36.2%) | 43 (14.5%) |
| $100,000 to $149,999 | 0 (0.0%) | 15 (5.1%) |
| $150,000 or more | 0 (0.0%) | 107 (36.0%) |
| Total | 138 (100.0%) | 297 (100.0%) |
Property Value to Household Income Ratio in Belfast
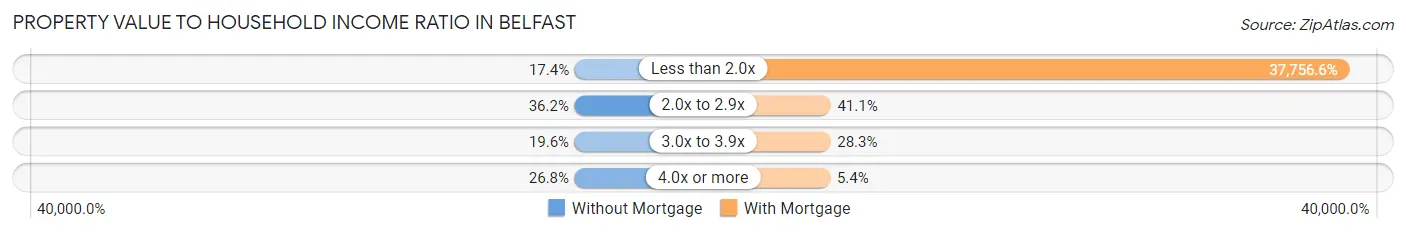
| Value-to-Income Ratio | Without Mortgage | With Mortgage |
| Less than 2.0x | 24 (17.4%) | 112,137 (37,756.6%) |
| 2.0x to 2.9x | 50 (36.2%) | 122 (41.1%) |
| 3.0x to 3.9x | 27 (19.6%) | 84 (28.3%) |
| 4.0x or more | 37 (26.8%) | 16 (5.4%) |
| Total | 138 (100.0%) | 297 (100.0%) |
Real Estate Taxes by Mortgage Status in Belfast
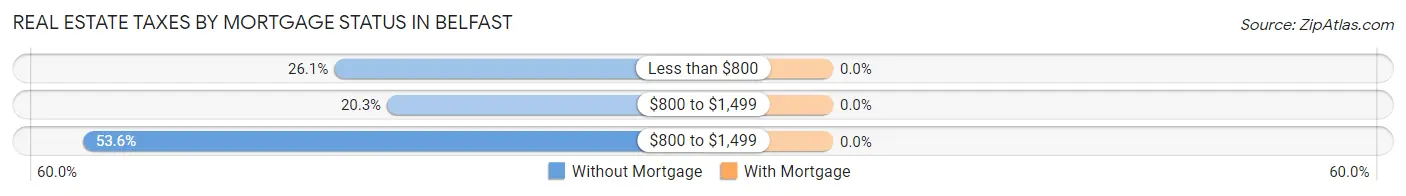
| Property Taxes | Without Mortgage | With Mortgage |
| Less than $800 | 36 (26.1%) | 0 (0.0%) |
| $800 to $1,499 | 28 (20.3%) | 0 (0.0%) |
| $800 to $1,499 | 74 (53.6%) | 0 (0.0%) |
| Total | 138 (100.0%) | 297 (100.0%) |
Health & Disability in Belfast
Health Insurance Coverage by Age in Belfast
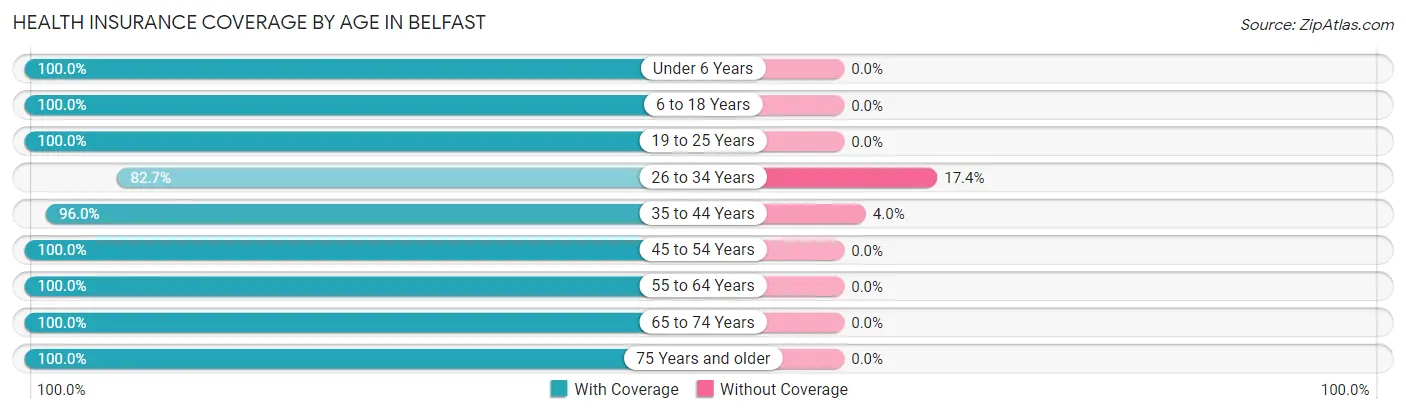
| Age Bracket | With Coverage | Without Coverage |
| Under 6 Years | 108 (100.0%) | 0 (0.0%) |
| 6 to 18 Years | 160 (100.0%) | 0 (0.0%) |
| 19 to 25 Years | 37 (100.0%) | 0 (0.0%) |
| 26 to 34 Years | 81 (82.7%) | 17 (17.3%) |
| 35 to 44 Years | 262 (96.0%) | 11 (4.0%) |
| 45 to 54 Years | 27 (100.0%) | 0 (0.0%) |
| 55 to 64 Years | 326 (100.0%) | 0 (0.0%) |
| 65 to 74 Years | 63 (100.0%) | 0 (0.0%) |
| 75 Years and older | 145 (100.0%) | 0 (0.0%) |
| Total | 1,209 (97.7%) | 28 (2.3%) |
Health Insurance Coverage by Citizenship Status in Belfast
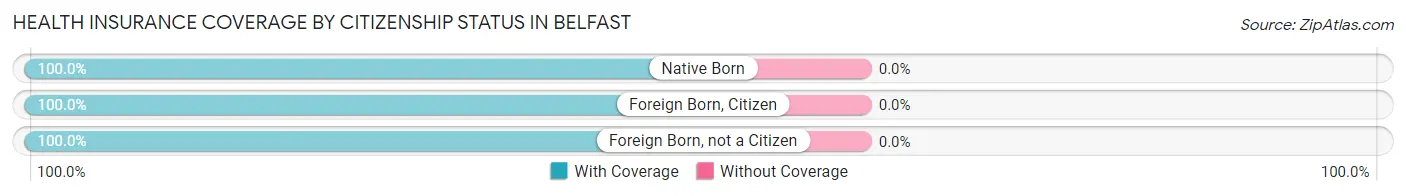
| Citizenship Status | With Coverage | Without Coverage |
| Native Born | 108 (100.0%) | 0 (0.0%) |
| Foreign Born, Citizen | 160 (100.0%) | 0 (0.0%) |
| Foreign Born, not a Citizen | 37 (100.0%) | 0 (0.0%) |
Health Insurance Coverage by Household Income in Belfast
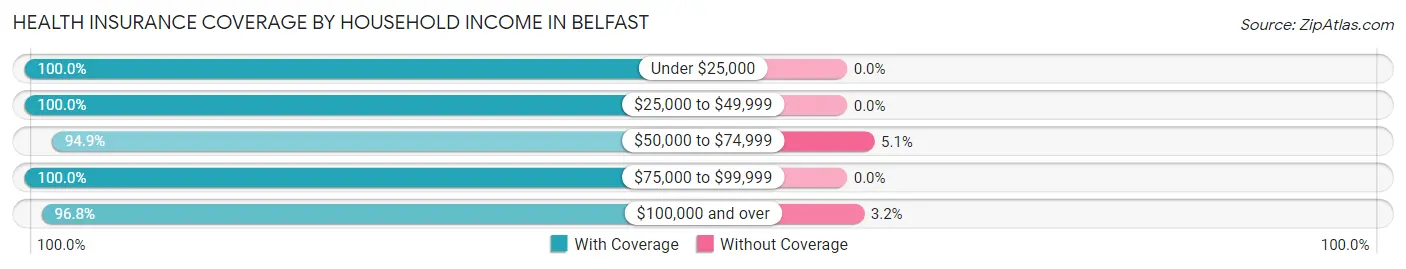
| Household Income | With Coverage | Without Coverage |
| Under $25,000 | 58 (100.0%) | 0 (0.0%) |
| $25,000 to $49,999 | 211 (100.0%) | 0 (0.0%) |
| $50,000 to $74,999 | 204 (94.9%) | 11 (5.1%) |
| $75,000 to $99,999 | 222 (100.0%) | 0 (0.0%) |
| $100,000 and over | 514 (96.8%) | 17 (3.2%) |
Public vs Private Health Insurance Coverage by Age in Belfast
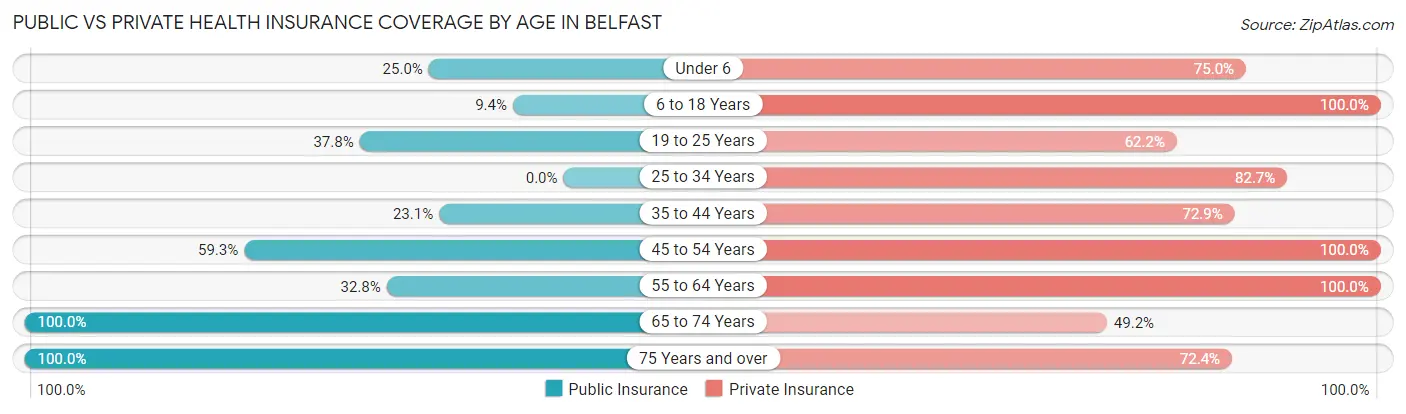
| Age Bracket | Public Insurance | Private Insurance |
| Under 6 | 27 (25.0%) | 81 (75.0%) |
| 6 to 18 Years | 15 (9.4%) | 160 (100.0%) |
| 19 to 25 Years | 14 (37.8%) | 23 (62.2%) |
| 25 to 34 Years | 0 (0.0%) | 81 (82.7%) |
| 35 to 44 Years | 63 (23.1%) | 199 (72.9%) |
| 45 to 54 Years | 16 (59.3%) | 27 (100.0%) |
| 55 to 64 Years | 107 (32.8%) | 326 (100.0%) |
| 65 to 74 Years | 63 (100.0%) | 31 (49.2%) |
| 75 Years and over | 145 (100.0%) | 105 (72.4%) |
| Total | 450 (36.4%) | 1,033 (83.5%) |
Disability Status by Sex by Age in Belfast
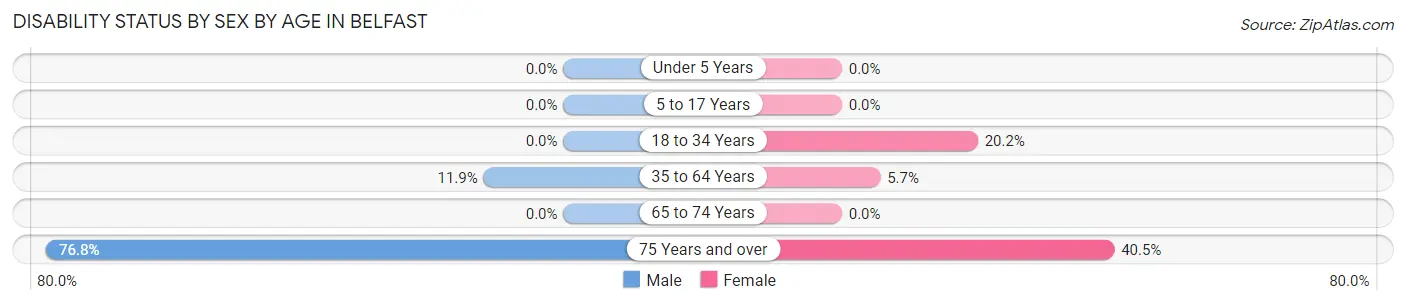
| Age Bracket | Male | Female |
| Under 5 Years | 0 (0.0%) | 0 (0.0%) |
| 5 to 17 Years | 0 (0.0%) | 0 (0.0%) |
| 18 to 34 Years | 0 (0.0%) | 23 (20.2%) |
| 35 to 64 Years | 41 (11.8%) | 16 (5.7%) |
| 65 to 74 Years | 0 (0.0%) | 0 (0.0%) |
| 75 Years and over | 43 (76.8%) | 36 (40.5%) |
Disability Class by Sex by Age in Belfast
Disability Class: Hearing Difficulty
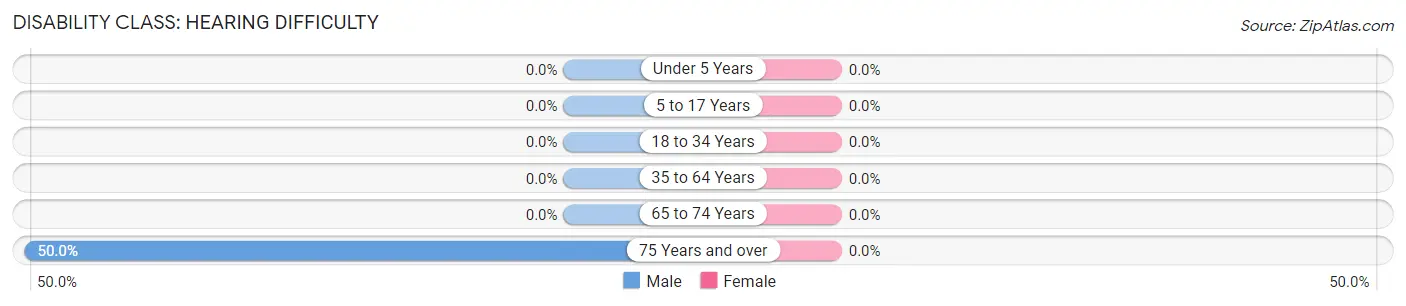
| Age Bracket | Male | Female |
| Under 5 Years | 0 (0.0%) | 0 (0.0%) |
| 5 to 17 Years | 0 (0.0%) | 0 (0.0%) |
| 18 to 34 Years | 0 (0.0%) | 0 (0.0%) |
| 35 to 64 Years | 0 (0.0%) | 0 (0.0%) |
| 65 to 74 Years | 0 (0.0%) | 0 (0.0%) |
| 75 Years and over | 28 (50.0%) | 0 (0.0%) |
Disability Class: Vision Difficulty
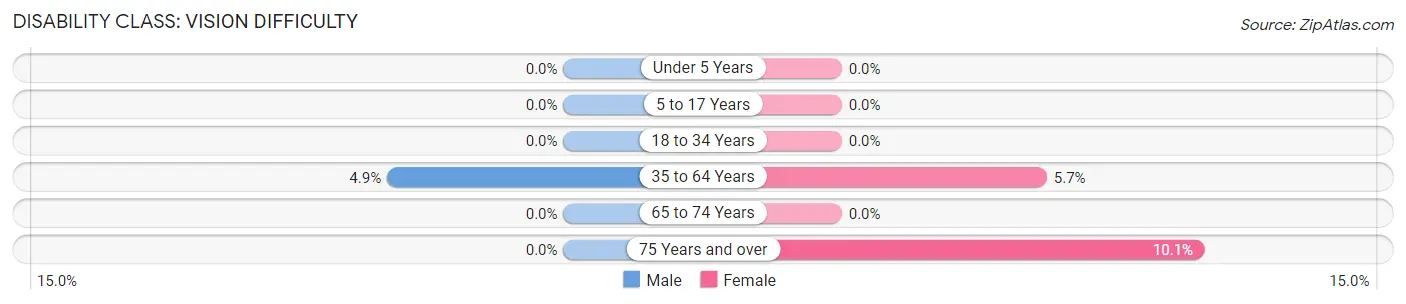
| Age Bracket | Male | Female |
| Under 5 Years | 0 (0.0%) | 0 (0.0%) |
| 5 to 17 Years | 0 (0.0%) | 0 (0.0%) |
| 18 to 34 Years | 0 (0.0%) | 0 (0.0%) |
| 35 to 64 Years | 17 (4.9%) | 16 (5.7%) |
| 65 to 74 Years | 0 (0.0%) | 0 (0.0%) |
| 75 Years and over | 0 (0.0%) | 9 (10.1%) |
Disability Class: Cognitive Difficulty
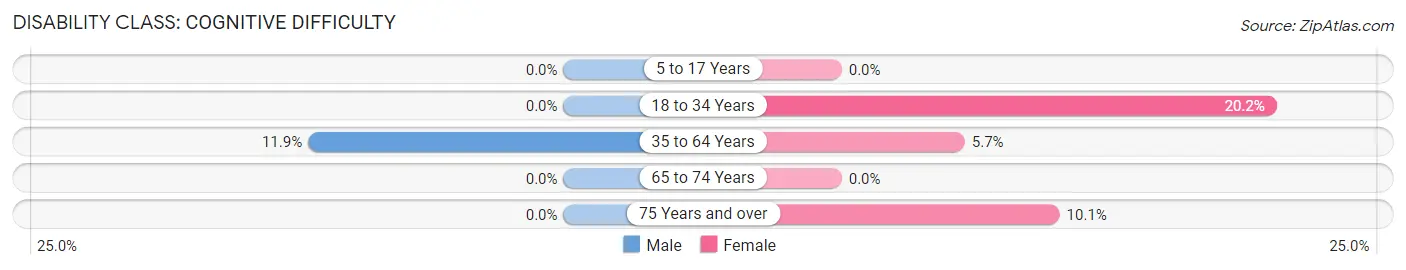
| Age Bracket | Male | Female |
| 5 to 17 Years | 0 (0.0%) | 0 (0.0%) |
| 18 to 34 Years | 0 (0.0%) | 23 (20.2%) |
| 35 to 64 Years | 41 (11.8%) | 16 (5.7%) |
| 65 to 74 Years | 0 (0.0%) | 0 (0.0%) |
| 75 Years and over | 0 (0.0%) | 9 (10.1%) |
Disability Class: Ambulatory Difficulty
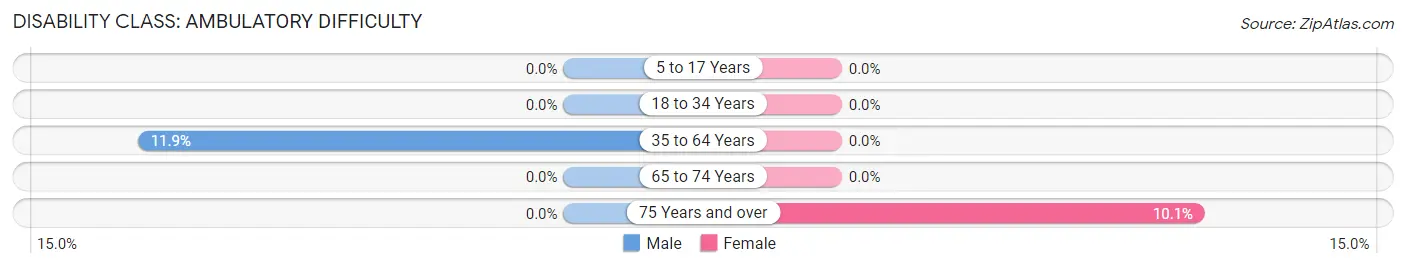
| Age Bracket | Male | Female |
| 5 to 17 Years | 0 (0.0%) | 0 (0.0%) |
| 18 to 34 Years | 0 (0.0%) | 0 (0.0%) |
| 35 to 64 Years | 41 (11.8%) | 0 (0.0%) |
| 65 to 74 Years | 0 (0.0%) | 0 (0.0%) |
| 75 Years and over | 0 (0.0%) | 9 (10.1%) |
Disability Class: Self-Care Difficulty
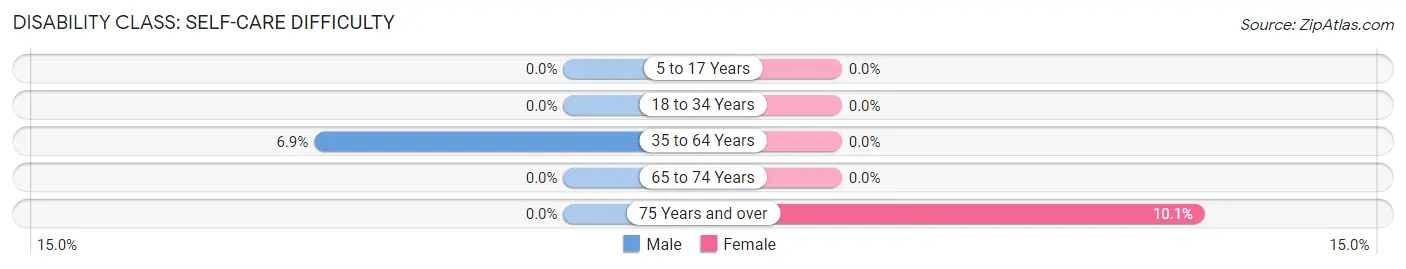
| Age Bracket | Male | Female |
| 5 to 17 Years | 0 (0.0%) | 0 (0.0%) |
| 18 to 34 Years | 0 (0.0%) | 0 (0.0%) |
| 35 to 64 Years | 24 (6.9%) | 0 (0.0%) |
| 65 to 74 Years | 0 (0.0%) | 0 (0.0%) |
| 75 Years and over | 0 (0.0%) | 9 (10.1%) |
Technology Access in Belfast
Computing Device Access in Belfast
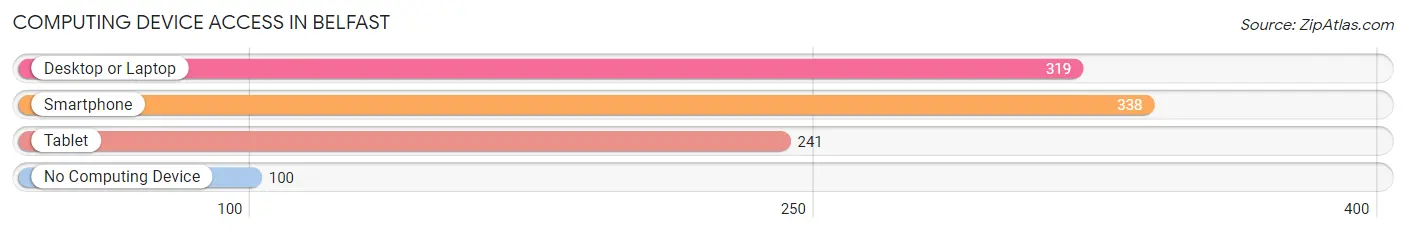
| Device Type | # Households | % Households |
| Desktop or Laptop | 319 | 70.7% |
| Smartphone | 338 | 74.9% |
| Tablet | 241 | 53.4% |
| No Computing Device | 100 | 22.2% |
| Total | 451 | 100.0% |
Internet Access in Belfast
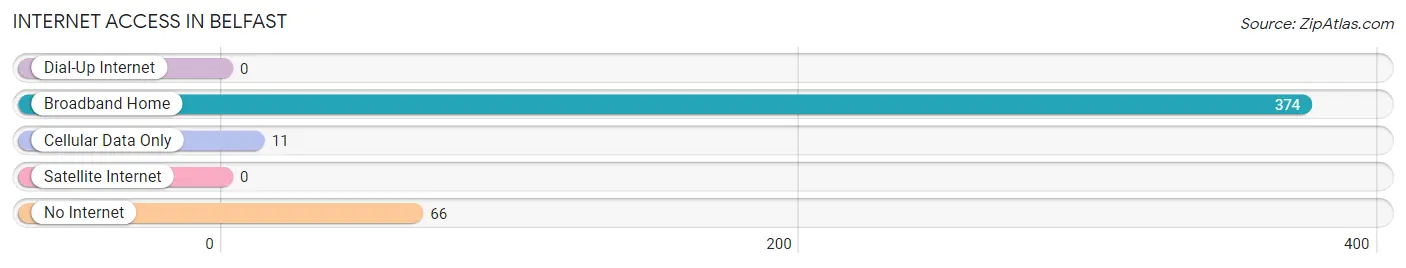
| Internet Type | # Households | % Households |
| Dial-Up Internet | 0 | 0.0% |
| Broadband Home | 374 | 82.9% |
| Cellular Data Only | 11 | 2.4% |
| Satellite Internet | 0 | 0.0% |
| No Internet | 66 | 14.6% |
| Total | 451 | 100.0% |
Belfast Summary
Belfast is a small borough located in the northern part of Pennsylvania in the United States. It is situated in the northwest corner of Northampton County, and is part of the Lehigh Valley region. The borough is located approximately 10 miles north of Easton, Pennsylvania, and is bordered by the townships of Plainfield, Moore, and Lower Mount Bethel. Belfast is a rural community with a population of 1,845 as of the 2010 census.
History
The area that is now Belfast was originally inhabited by the Lenape Native Americans. The first European settlers arrived in the area in the late 1700s, and the town was officially founded in 1810. The town was named after Belfast, Ireland, and was originally part of Plainfield Township. In 1845, the town was incorporated as a borough.
In the late 1800s, Belfast was a thriving agricultural community. The town was known for its production of potatoes, corn, and other crops. The town also had several mills, including a grist mill, a saw mill, and a woolen mill.
In the early 1900s, the town began to decline as the agricultural industry shifted away from the area. The mills closed, and the population began to decline. In the 1950s, the town began to experience a resurgence as new businesses moved into the area.
Geography
Belfast is located in the northern part of Pennsylvania in the United States. It is situated in the northwest corner of Northampton County, and is part of the Lehigh Valley region. The borough is located approximately 10 miles north of Easton, Pennsylvania, and is bordered by the townships of Plainfield, Moore, and Lower Mount Bethel.
The borough has a total area of 0.8 square miles, all of which is land. The terrain is mostly flat, with some rolling hills. The town is located in the Delaware River watershed.
Economy
Belfast is a rural community with a population of 1,845 as of the 2010 census. The town has a small but diverse economy. The town is home to several small businesses, including a grocery store, a hardware store, a pharmacy, and a few restaurants. The town also has a few manufacturing companies, including a plastics manufacturer and a metal fabrication company.
The town is also home to several farms, which produce a variety of crops, including corn, potatoes, and hay. The town also has a few wineries, which produce a variety of wines.
Demographics
As of the 2010 census, the population of Belfast was 1,845. The racial makeup of the town was 95.3% White, 1.2% African American, 0.2% Native American, 0.7% Asian, 0.1% Pacific Islander, 0.7% from other races, and 1.9% from two or more races. Hispanic or Latino of any race were 2.2% of the population.
The median household income in Belfast was $45,938, and the median family income was $51,250. The per capita income was $20,945. About 8.3% of families and 10.2% of the population were below the poverty line, including 14.2% of those under age 18 and 5.2% of those age 65 or over.
Common Questions
What is Per Capita Income in Belfast?
Per Capita income in Belfast is $33,493.
What is the Median Family Income in Belfast?
Median Family Income in Belfast is $99,667.
What is the Median Household income in Belfast?
Median Household Income in Belfast is $90,101.
What is Income or Wage Gap in Belfast?
Income or Wage Gap in Belfast is 22.2%.
Women in Belfast earn 77.8 cents for every dollar earned by a man.
What is Inequality or Gini Index in Belfast?
Inequality or Gini Index in Belfast is 0.32.
What is the Total Population of Belfast?
Total Population of Belfast is 1,237.
What is the Total Male Population of Belfast?
Total Male Population of Belfast is 596.
What is the Total Female Population of Belfast?
Total Female Population of Belfast is 641.
What is the Ratio of Males per 100 Females in Belfast?
There are 92.98 Males per 100 Females in Belfast.
What is the Ratio of Females per 100 Males in Belfast?
There are 107.55 Females per 100 Males in Belfast.
What is the Median Population Age in Belfast?
Median Population Age in Belfast is 43.3 Years.
What is the Average Family Size in Belfast
Average Family Size in Belfast is 3.2 People.
What is the Average Household Size in Belfast
Average Household Size in Belfast is 2.7 People.
How Large is the Labor Force in Belfast?
There are 686 People in the Labor Forcein in Belfast.
What is the Percentage of People in the Labor Force in Belfast?
69.9% of People are in the Labor Force in Belfast.
What is the Unemployment Rate in Belfast?
Unemployment Rate in Belfast is 3.5%.