Cranesville borough, PA Map & Demographics
Cranesville borough Overview
$32,319
PER CAPITA INCOME
$106,500
AVG FAMILY INCOME
$75,000
AVG HOUSEHOLD INCOME
52.9%
WAGE / INCOME GAP [ % ]
47.1¢/ $1
WAGE / INCOME GAP [ $ ]
$12,792
FAMILY INCOME DEFICIT
0.48
INEQUALITY / GINI INDEX
800
TOTAL POPULATION
443
MALE POPULATION
357
FEMALE POPULATION
124.09
MALES / 100 FEMALES
80.59
FEMALES / 100 MALES
32.6
MEDIAN AGE
3.7
AVG FAMILY SIZE
3.2
AVG HOUSEHOLD SIZE
356
LABOR FORCE [ PEOPLE ]
56.9%
PERCENT IN LABOR FORCE
Income in Cranesville borough
Income Overview in Cranesville borough
Per Capita Income in Cranesville borough is $32,319, while median incomes of families and households are $106,500 and $75,000 respectively.
| Characteristic | Number | Measure |
| Per Capita Income | 800 | $32,319 |
| Median Family Income | 196 | $106,500 |
| Mean Family Income | 196 | $148,696 |
| Median Household Income | 246 | $75,000 |
| Mean Household Income | 246 | $126,496 |
| Income Deficit | 196 | $12,792 |
| Wage / Income Gap (%) | 800 | 52.93% |
| Wage / Income Gap ($) | 800 | 47.07¢ per $1 |
| Gini / Inequality Index | 800 | 0.48 |
Earnings by Sex in Cranesville borough
Average Earnings in Cranesville borough are $30,645, $36,016 for men and $16,953 for women, a difference of 52.9%.
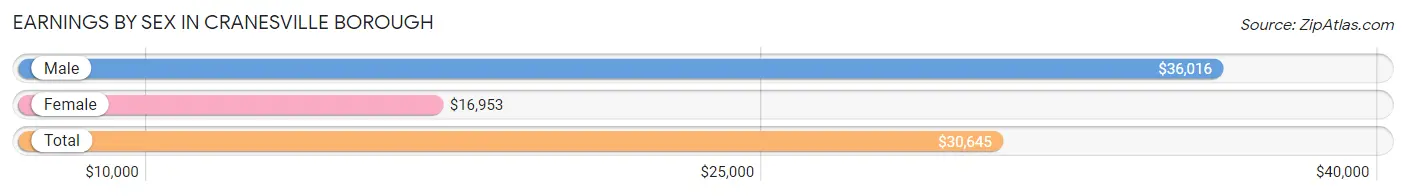
| Sex | Number | Average Earnings |
| Male | 245 (62.2%) | $36,016 |
| Female | 149 (37.8%) | $16,953 |
| Total | 394 (100.0%) | $30,645 |
Earnings by Sex by Income Bracket in Cranesville borough
The most common earnings brackets in Cranesville borough are $100,000+ for men (39 | 15.9%) and $7,500 to $9,999 for women (20 | 13.4%).
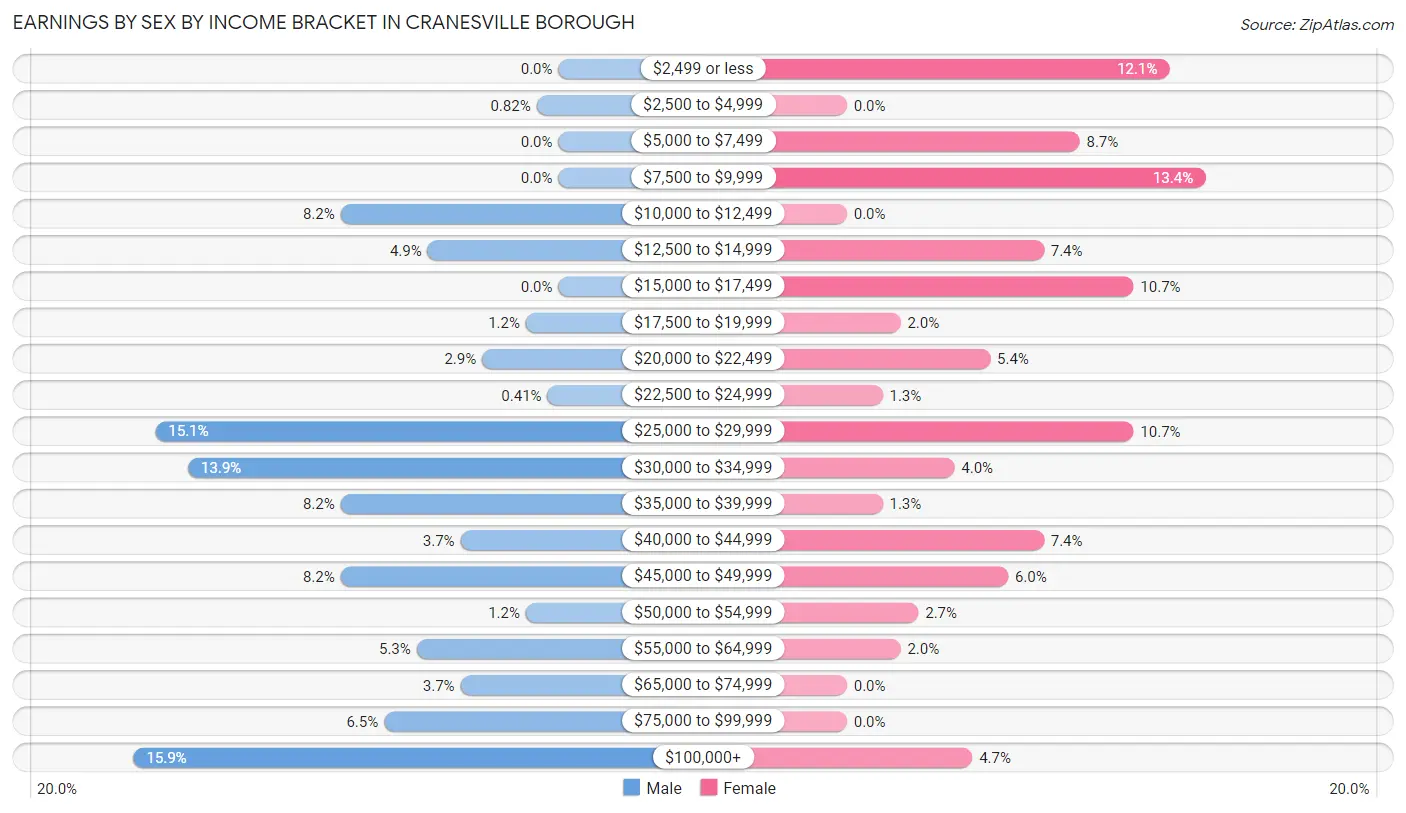
| Income | Male | Female |
| $2,499 or less | 0 (0.0%) | 18 (12.1%) |
| $2,500 to $4,999 | 2 (0.8%) | 0 (0.0%) |
| $5,000 to $7,499 | 0 (0.0%) | 13 (8.7%) |
| $7,500 to $9,999 | 0 (0.0%) | 20 (13.4%) |
| $10,000 to $12,499 | 20 (8.2%) | 0 (0.0%) |
| $12,500 to $14,999 | 12 (4.9%) | 11 (7.4%) |
| $15,000 to $17,499 | 0 (0.0%) | 16 (10.7%) |
| $17,500 to $19,999 | 3 (1.2%) | 3 (2.0%) |
| $20,000 to $22,499 | 7 (2.9%) | 8 (5.4%) |
| $22,500 to $24,999 | 1 (0.4%) | 2 (1.3%) |
| $25,000 to $29,999 | 37 (15.1%) | 16 (10.7%) |
| $30,000 to $34,999 | 34 (13.9%) | 6 (4.0%) |
| $35,000 to $39,999 | 20 (8.2%) | 2 (1.3%) |
| $40,000 to $44,999 | 9 (3.7%) | 11 (7.4%) |
| $45,000 to $49,999 | 20 (8.2%) | 9 (6.0%) |
| $50,000 to $54,999 | 3 (1.2%) | 4 (2.7%) |
| $55,000 to $64,999 | 13 (5.3%) | 3 (2.0%) |
| $65,000 to $74,999 | 9 (3.7%) | 0 (0.0%) |
| $75,000 to $99,999 | 16 (6.5%) | 0 (0.0%) |
| $100,000+ | 39 (15.9%) | 7 (4.7%) |
| Total | 245 (100.0%) | 149 (100.0%) |
Earnings by Sex by Educational Attainment in Cranesville borough
Average earnings in Cranesville borough are $54,167 for men and $22,031 for women, a difference of 59.3%. Men with an educational attainment of bachelor's degree enjoy the highest average annual earnings of $250,001, while those with high school diploma education earn the least with $46,500. Women with an educational attainment of graduate degree earn the most with the average annual earnings of $53,750, while those with high school diploma education have the smallest earnings of $15,972.
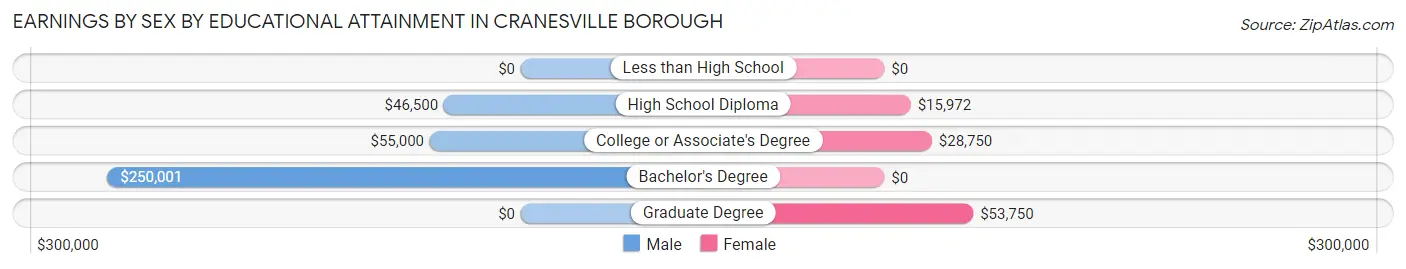
| Educational Attainment | Male Income | Female Income |
| Less than High School | - | - |
| High School Diploma | $46,500 | $15,972 |
| College or Associate's Degree | $55,000 | $28,750 |
| Bachelor's Degree | $250,001 | $0 |
| Graduate Degree | - | - |
| Total | $54,167 | $22,031 |
Family Income in Cranesville borough
Family Income Brackets in Cranesville borough
According to the Cranesville borough family income data, there are 54 families falling into the $50,000 to $74,999 income range, which is the most common income bracket and makes up 27.6% of all families.
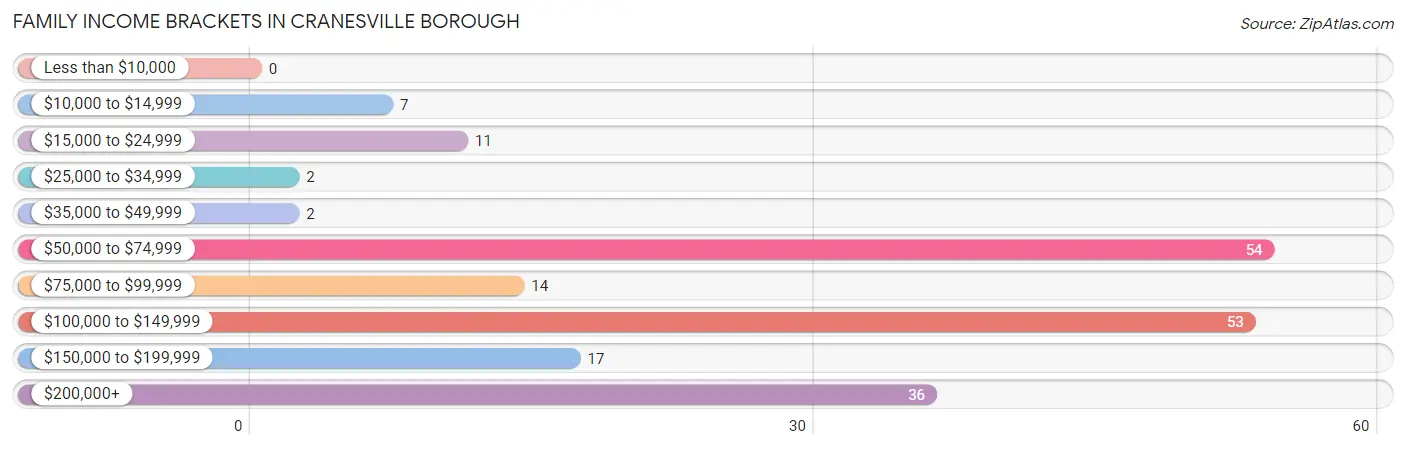
| Income Bracket | # Families | % Families |
| Less than $10,000 | 0 | 0.0% |
| $10,000 to $14,999 | 7 | 3.6% |
| $15,000 to $24,999 | 11 | 5.6% |
| $25,000 to $34,999 | 2 | 1.0% |
| $35,000 to $49,999 | 2 | 1.0% |
| $50,000 to $74,999 | 54 | 27.6% |
| $75,000 to $99,999 | 14 | 7.1% |
| $100,000 to $149,999 | 53 | 27.0% |
| $150,000 to $199,999 | 17 | 8.7% |
| $200,000+ | 36 | 18.4% |
Family Income by Famaliy Size in Cranesville borough
4-person families (30 | 15.3%) account for the highest median family income in Cranesville borough with $123,750 per family, while 2-person families (62 | 31.6%) have the highest median income of $33,125 per family member.
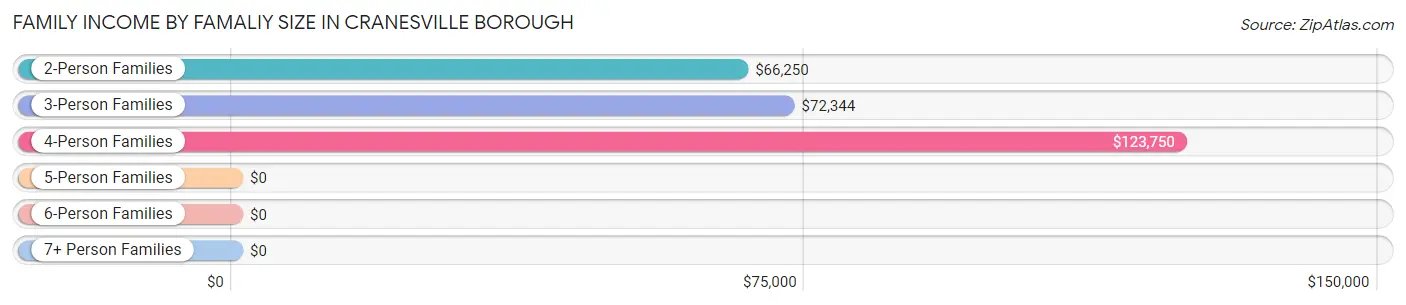
| Income Bracket | # Families | Median Income |
| 2-Person Families | 62 (31.6%) | $66,250 |
| 3-Person Families | 60 (30.6%) | $72,344 |
| 4-Person Families | 30 (15.3%) | $123,750 |
| 5-Person Families | 0 (0.0%) | $0 |
| 6-Person Families | 0 (0.0%) | $0 |
| 7+ Person Families | 44 (22.5%) | $0 |
| Total | 196 (100.0%) | $106,500 |
Family Income by Number of Earners in Cranesville borough
The median family income in Cranesville borough is $106,500, with families comprising 3+ earners (49) having the highest median family income of $250,001, while families with no earners (18) have the lowest median family income of $52,500, accounting for 25.0% and 9.2% of families, respectively.
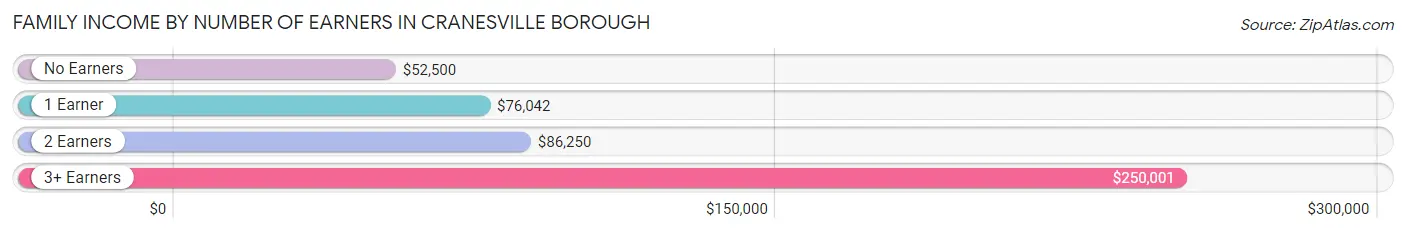
| Number of Earners | # Families | Median Income |
| No Earners | 18 (9.2%) | $52,500 |
| 1 Earner | 39 (19.9%) | $76,042 |
| 2 Earners | 90 (45.9%) | $86,250 |
| 3+ Earners | 49 (25.0%) | $250,001 |
| Total | 196 (100.0%) | $106,500 |
Household Income in Cranesville borough
Household Income Brackets in Cranesville borough
With 56 households falling in the category, the $50,000 to $74,999 income range is the most frequent in Cranesville borough, accounting for 22.8% of all households. In contrast, only 2 households (0.8%) fall into the less than $10,000 income bracket, making it the least populous group.
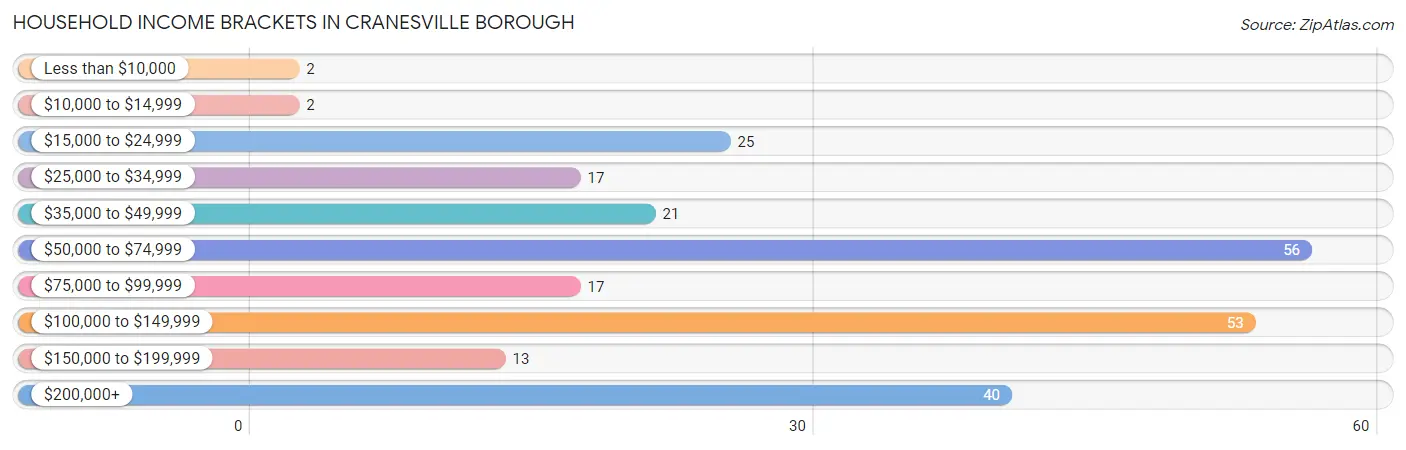
| Income Bracket | # Households | % Households |
| Less than $10,000 | 2 | 0.8% |
| $10,000 to $14,999 | 2 | 0.8% |
| $15,000 to $24,999 | 25 | 10.2% |
| $25,000 to $34,999 | 17 | 6.9% |
| $35,000 to $49,999 | 21 | 8.5% |
| $50,000 to $74,999 | 56 | 22.8% |
| $75,000 to $99,999 | 17 | 6.9% |
| $100,000 to $149,999 | 53 | 21.5% |
| $150,000 to $199,999 | 13 | 5.3% |
| $200,000+ | 40 | 16.3% |
Household Income by Householder Age in Cranesville borough
The median household income in Cranesville borough is $75,000, with the highest median household income of $106,000 found in the 25 to 44 years age bracket for the primary householder. A total of 56 households (22.8%) fall into this category. Meanwhile, the 15 to 24 years age bracket for the primary householder has the lowest median household income of $0, with 7 households (2.9%) in this group.
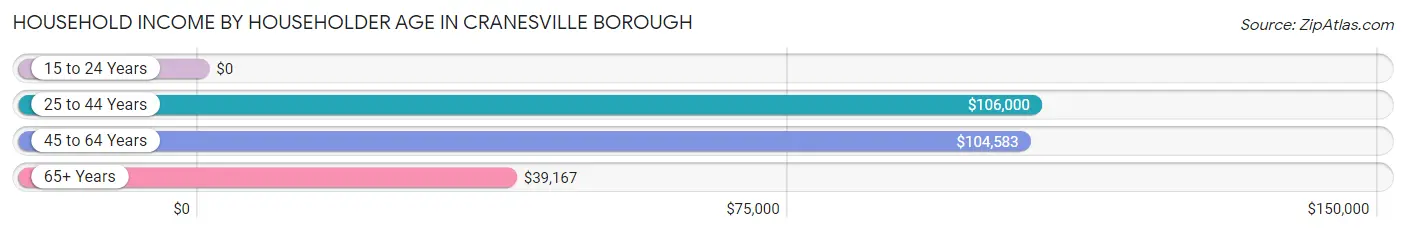
| Income Bracket | # Households | Median Income |
| 15 to 24 Years | 7 (2.9%) | $0 |
| 25 to 44 Years | 56 (22.8%) | $106,000 |
| 45 to 64 Years | 139 (56.5%) | $104,583 |
| 65+ Years | 44 (17.9%) | $39,167 |
| Total | 246 (100.0%) | $75,000 |
Poverty in Cranesville borough
Income Below Poverty by Sex and Age in Cranesville borough
With 2.9% poverty level for males and 14.8% for females among the residents of Cranesville borough, 15 year old males and under 5 year old females are the most vulnerable to poverty, with 2 males (33.3%) and 10 females (66.7%) in their respective age groups living below the poverty level.
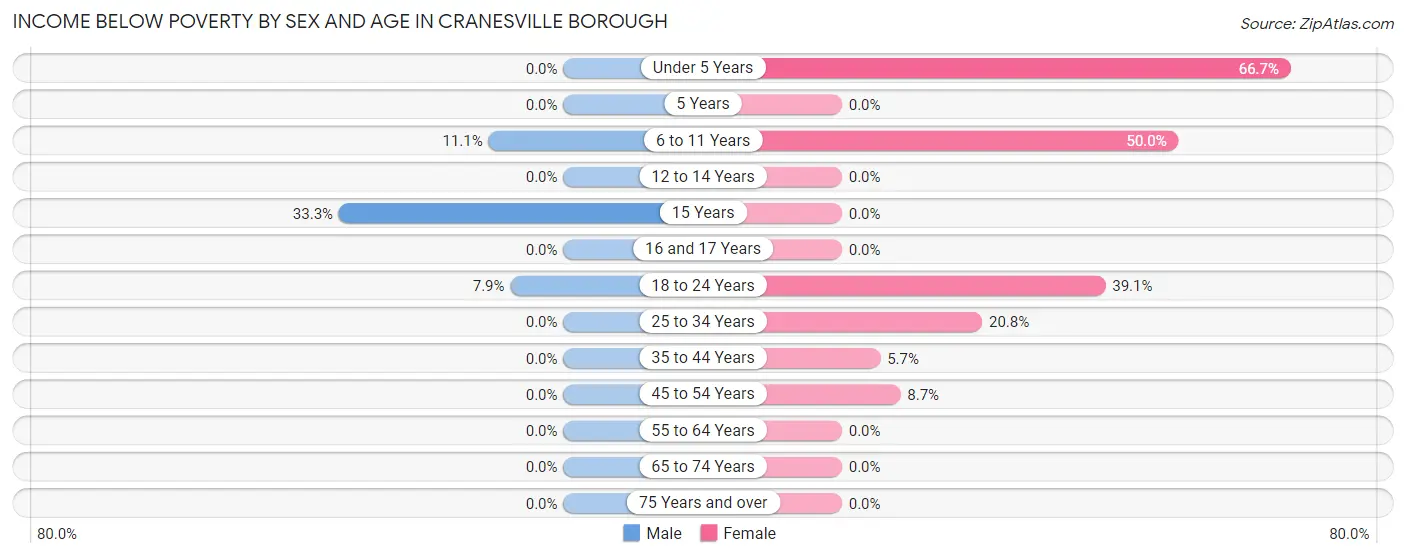
| Age Bracket | Male | Female |
| Under 5 Years | 0 (0.0%) | 10 (66.7%) |
| 5 Years | 0 (0.0%) | 0 (0.0%) |
| 6 to 11 Years | 4 (11.1%) | 10 (50.0%) |
| 12 to 14 Years | 0 (0.0%) | 0 (0.0%) |
| 15 Years | 2 (33.3%) | 0 (0.0%) |
| 16 and 17 Years | 0 (0.0%) | 0 (0.0%) |
| 18 to 24 Years | 7 (7.9%) | 18 (39.1%) |
| 25 to 34 Years | 0 (0.0%) | 5 (20.8%) |
| 35 to 44 Years | 0 (0.0%) | 2 (5.7%) |
| 45 to 54 Years | 0 (0.0%) | 8 (8.7%) |
| 55 to 64 Years | 0 (0.0%) | 0 (0.0%) |
| 65 to 74 Years | 0 (0.0%) | 0 (0.0%) |
| 75 Years and over | 0 (0.0%) | 0 (0.0%) |
| Total | 13 (2.9%) | 53 (14.8%) |
Income Above Poverty by Sex and Age in Cranesville borough
According to the poverty statistics in Cranesville borough, males aged under 5 years and females aged 12 to 14 years are the age groups that are most secure financially, with 100.0% of males and 100.0% of females in these age groups living above the poverty line.
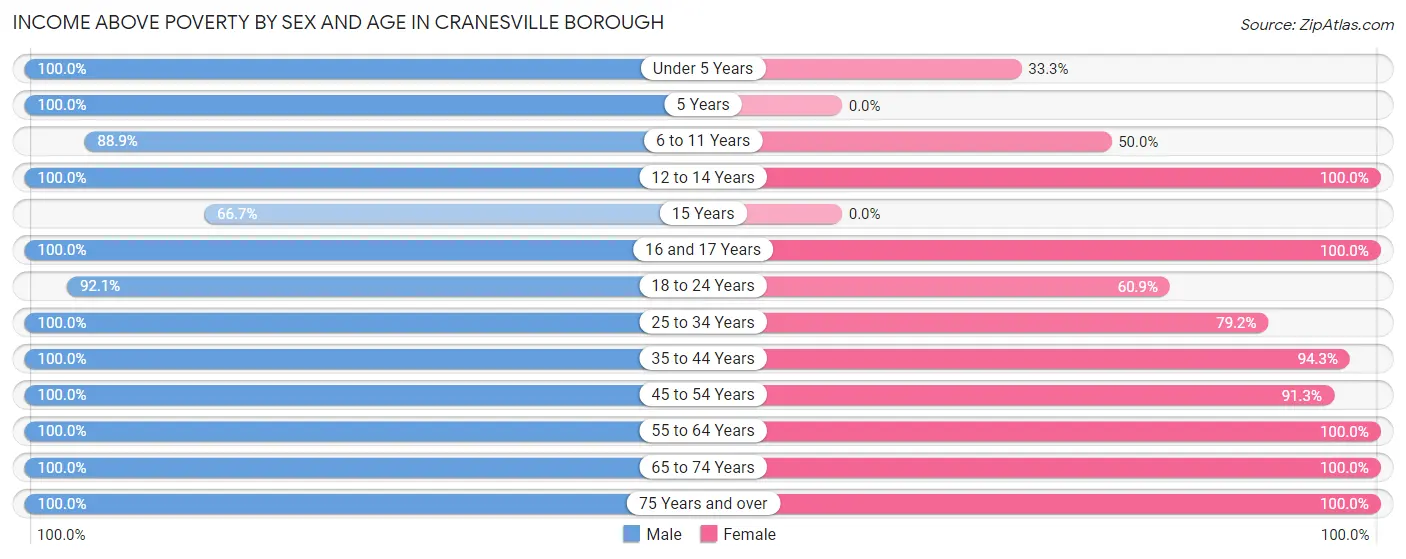
| Age Bracket | Male | Female |
| Under 5 Years | 35 (100.0%) | 5 (33.3%) |
| 5 Years | 5 (100.0%) | 0 (0.0%) |
| 6 to 11 Years | 32 (88.9%) | 10 (50.0%) |
| 12 to 14 Years | 50 (100.0%) | 7 (100.0%) |
| 15 Years | 4 (66.7%) | 0 (0.0%) |
| 16 and 17 Years | 9 (100.0%) | 34 (100.0%) |
| 18 to 24 Years | 82 (92.1%) | 28 (60.9%) |
| 25 to 34 Years | 37 (100.0%) | 19 (79.2%) |
| 35 to 44 Years | 31 (100.0%) | 33 (94.3%) |
| 45 to 54 Years | 61 (100.0%) | 84 (91.3%) |
| 55 to 64 Years | 59 (100.0%) | 53 (100.0%) |
| 65 to 74 Years | 14 (100.0%) | 9 (100.0%) |
| 75 Years and over | 11 (100.0%) | 22 (100.0%) |
| Total | 430 (97.1%) | 304 (85.2%) |
Income Below Poverty Among Married-Couple Families in Cranesville borough
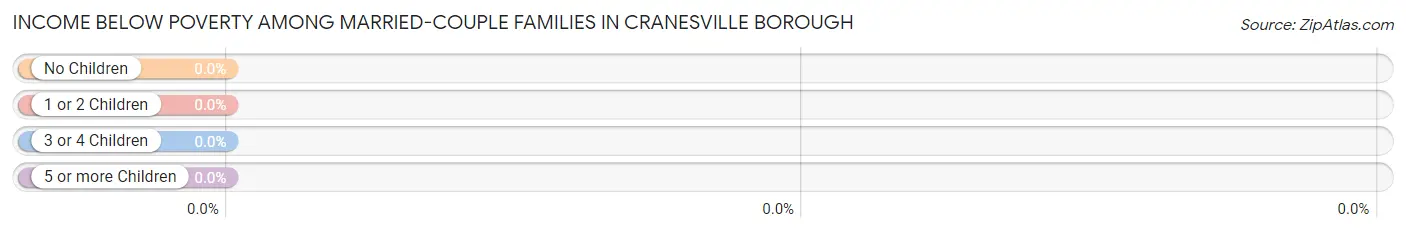
| Children | Above Poverty | Below Poverty |
| No Children | 89 (100.0%) | 0 (0.0%) |
| 1 or 2 Children | 49 (100.0%) | 0 (0.0%) |
| 3 or 4 Children | 36 (100.0%) | 0 (0.0%) |
| 5 or more Children | 0 (0.0%) | 0 (0.0%) |
| Total | 174 (100.0%) | 0 (0.0%) |
Income Below Poverty Among Single-Parent Households in Cranesville borough
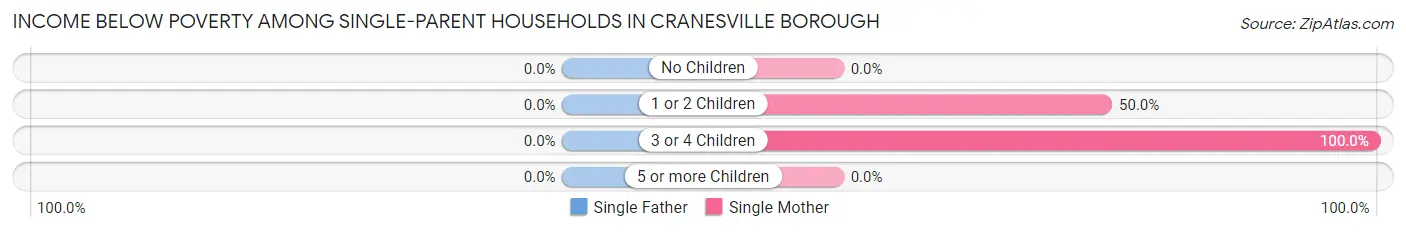
| Children | Single Father | Single Mother |
| No Children | 0 (0.0%) | 0 (0.0%) |
| 1 or 2 Children | 0 (0.0%) | 7 (50.0%) |
| 3 or 4 Children | 0 (0.0%) | 5 (100.0%) |
| 5 or more Children | 0 (0.0%) | 0 (0.0%) |
| Total | 0 (0.0%) | 12 (63.2%) |
Income Below Poverty Among Married-Couple vs Single-Parent Households in Cranesville borough
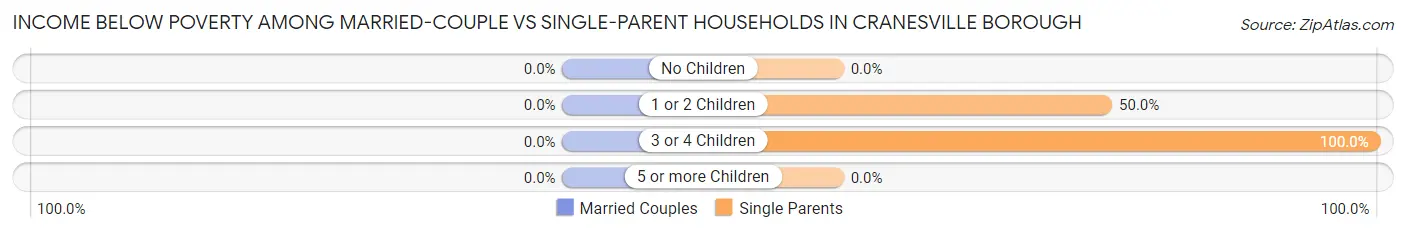
| Children | Married-Couple Families | Single-Parent Households |
| No Children | 0 (0.0%) | 0 (0.0%) |
| 1 or 2 Children | 0 (0.0%) | 7 (50.0%) |
| 3 or 4 Children | 0 (0.0%) | 5 (100.0%) |
| 5 or more Children | 0 (0.0%) | 0 (0.0%) |
| Total | 0 (0.0%) | 12 (54.5%) |
Race in Cranesville borough
The most populous races in Cranesville borough are White / Caucasian (762 | 95.3%), Black / African American (31 | 3.9%), and Hispanic or Latino (5 | 0.6%).
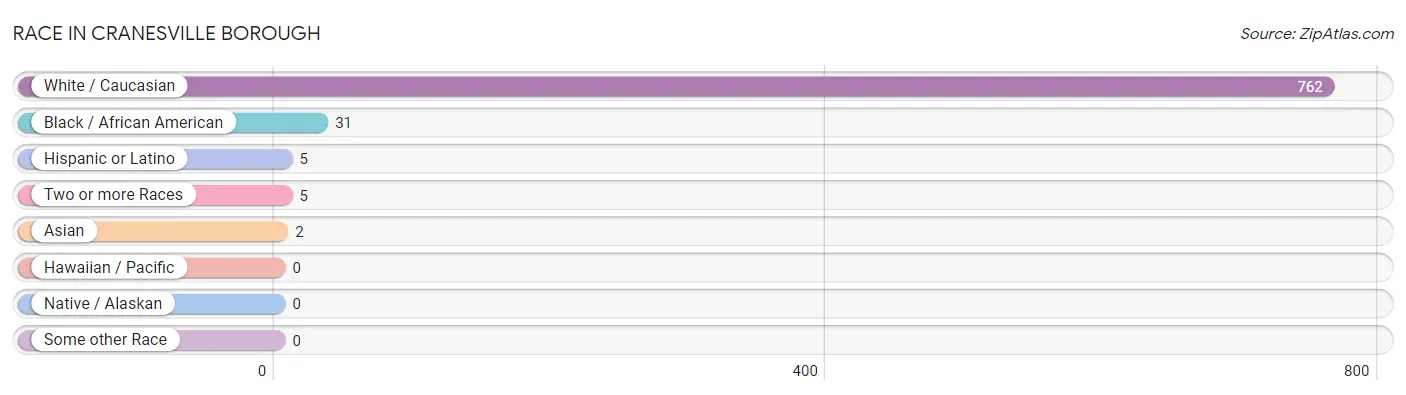
| Race | # Population | % Population |
| Asian | 2 | 0.3% |
| Black / African American | 31 | 3.9% |
| Hawaiian / Pacific | 0 | 0.0% |
| Hispanic or Latino | 5 | 0.6% |
| Native / Alaskan | 0 | 0.0% |
| White / Caucasian | 762 | 95.3% |
| Two or more Races | 5 | 0.6% |
| Some other Race | 0 | 0.0% |
| Total | 800 | 100.0% |
Ancestry in Cranesville borough
The most populous ancestries reported in Cranesville borough are German (376 | 47.0%), Irish (139 | 17.4%), Polish (58 | 7.2%), English (57 | 7.1%), and Slovak (41 | 5.1%), together accounting for 83.9% of all Cranesville borough residents.
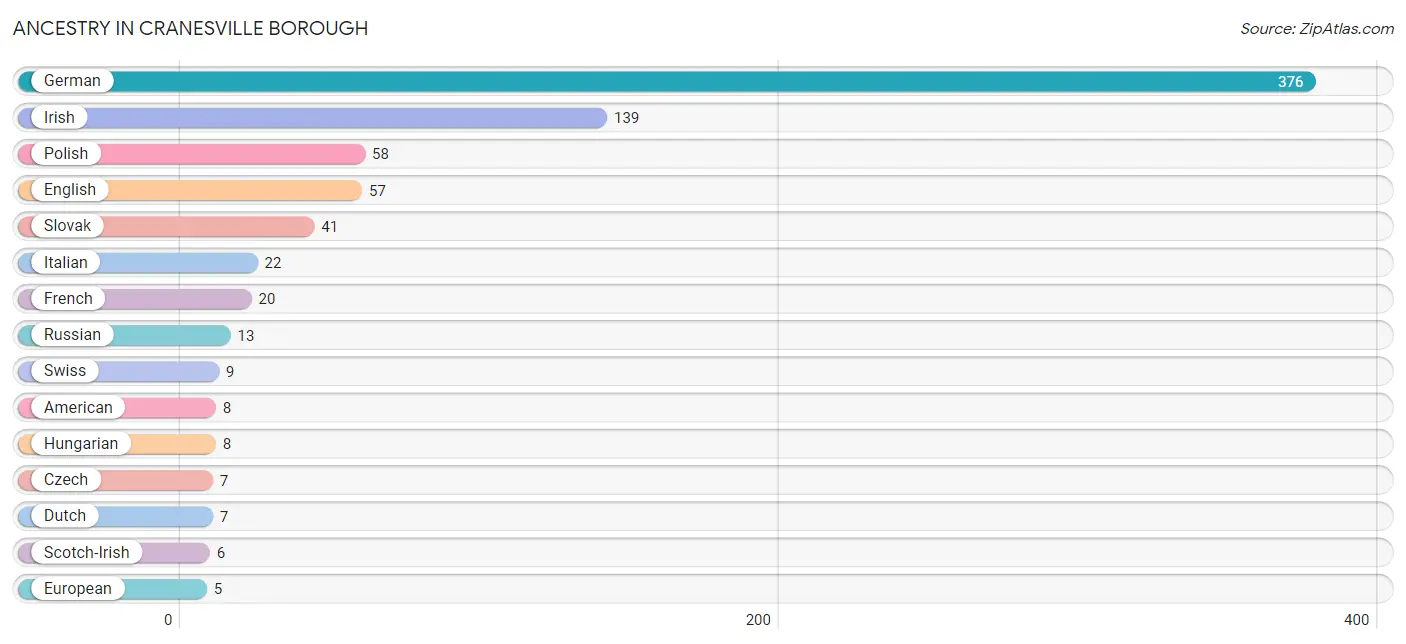
| Ancestry | # Population | % Population |
| American | 8 | 1.0% |
| Austrian | 2 | 0.3% |
| Czech | 7 | 0.9% |
| Dutch | 7 | 0.9% |
| English | 57 | 7.1% |
| European | 5 | 0.6% |
| French | 20 | 2.5% |
| German | 376 | 47.0% |
| Hungarian | 8 | 1.0% |
| Indian (Asian) | 2 | 0.3% |
| Irish | 139 | 17.4% |
| Italian | 22 | 2.8% |
| Mexican | 5 | 0.6% |
| Norwegian | 3 | 0.4% |
| Pennsylvania German | 3 | 0.4% |
| Polish | 58 | 7.2% |
| Russian | 13 | 1.6% |
| Scotch-Irish | 6 | 0.7% |
| Scottish | 2 | 0.3% |
| Slovak | 41 | 5.1% |
| Swiss | 9 | 1.1% | View All 21 Rows |
Immigrants in Cranesville borough
The most numerous immigrant groups reported in Cranesville borough came from Central America (5 | 0.6%), Latin America (5 | 0.6%), Mexico (5 | 0.6%), Asia (2 | 0.3%), and China (2 | 0.3%), together accounting for 2.4% of all Cranesville borough residents.
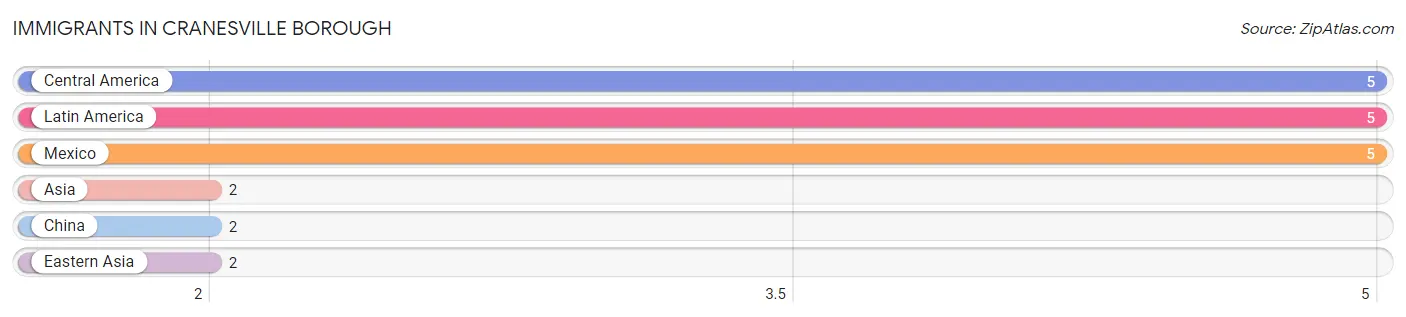
| Immigration Origin | # Population | % Population |
| Asia | 2 | 0.3% |
| Central America | 5 | 0.6% |
| China | 2 | 0.3% |
| Eastern Asia | 2 | 0.3% |
| Latin America | 5 | 0.6% |
| Mexico | 5 | 0.6% | View All 6 Rows |
Sex and Age in Cranesville borough
Sex and Age in Cranesville borough
The most populous age groups in Cranesville borough are 20 to 24 Years (89 | 20.1%) for men and 45 to 49 Years (75 | 21.0%) for women.
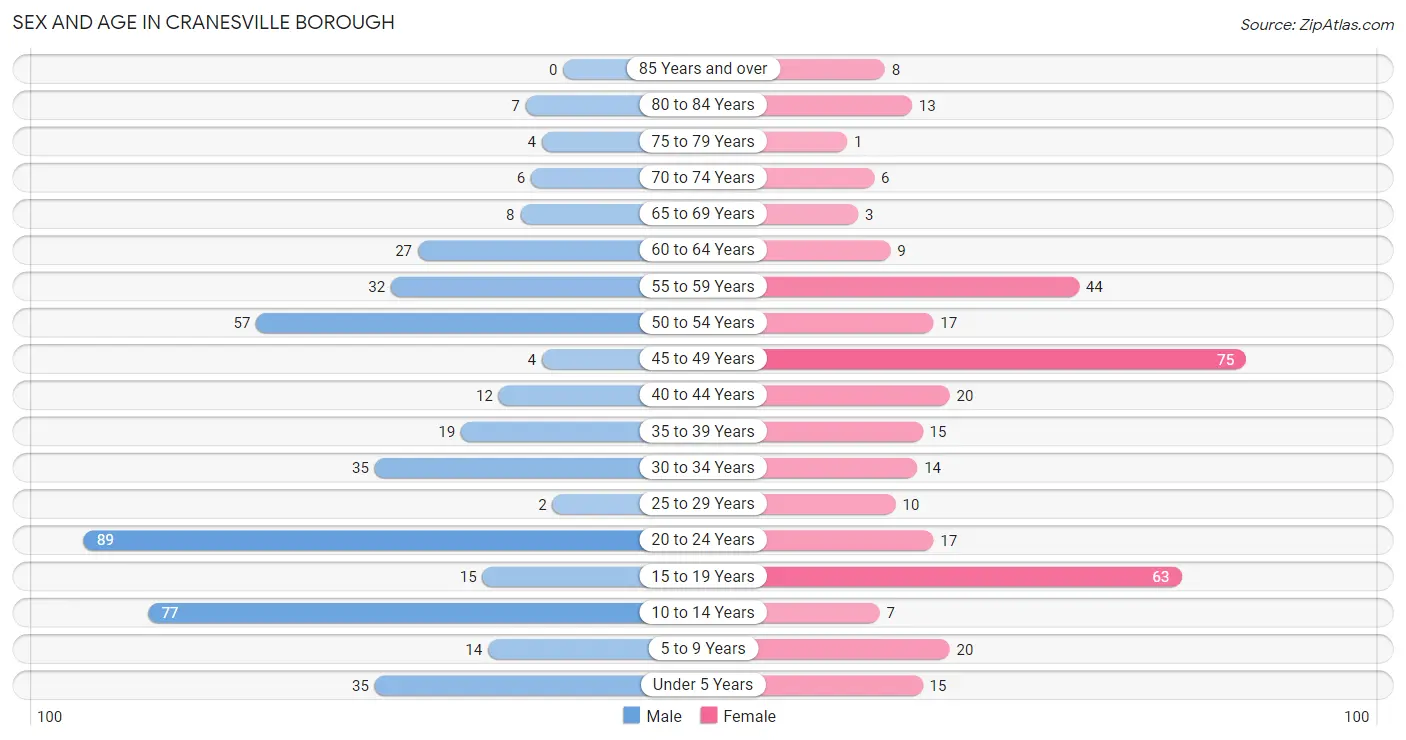
| Age Bracket | Male | Female |
| Under 5 Years | 35 (7.9%) | 15 (4.2%) |
| 5 to 9 Years | 14 (3.2%) | 20 (5.6%) |
| 10 to 14 Years | 77 (17.4%) | 7 (2.0%) |
| 15 to 19 Years | 15 (3.4%) | 63 (17.6%) |
| 20 to 24 Years | 89 (20.1%) | 17 (4.8%) |
| 25 to 29 Years | 2 (0.4%) | 10 (2.8%) |
| 30 to 34 Years | 35 (7.9%) | 14 (3.9%) |
| 35 to 39 Years | 19 (4.3%) | 15 (4.2%) |
| 40 to 44 Years | 12 (2.7%) | 20 (5.6%) |
| 45 to 49 Years | 4 (0.9%) | 75 (21.0%) |
| 50 to 54 Years | 57 (12.9%) | 17 (4.8%) |
| 55 to 59 Years | 32 (7.2%) | 44 (12.3%) |
| 60 to 64 Years | 27 (6.1%) | 9 (2.5%) |
| 65 to 69 Years | 8 (1.8%) | 3 (0.8%) |
| 70 to 74 Years | 6 (1.3%) | 6 (1.7%) |
| 75 to 79 Years | 4 (0.9%) | 1 (0.3%) |
| 80 to 84 Years | 7 (1.6%) | 13 (3.6%) |
| 85 Years and over | 0 (0.0%) | 8 (2.2%) |
| Total | 443 (100.0%) | 357 (100.0%) |
Families and Households in Cranesville borough
Median Family Size in Cranesville borough
The median family size in Cranesville borough is 3.66 persons per family, with single female/mother families (19 | 9.7%) accounting for the largest median family size of 4.21 persons per family. On the other hand, single male/father families (3 | 1.5%) represent the smallest median family size with 2.00 persons per family.
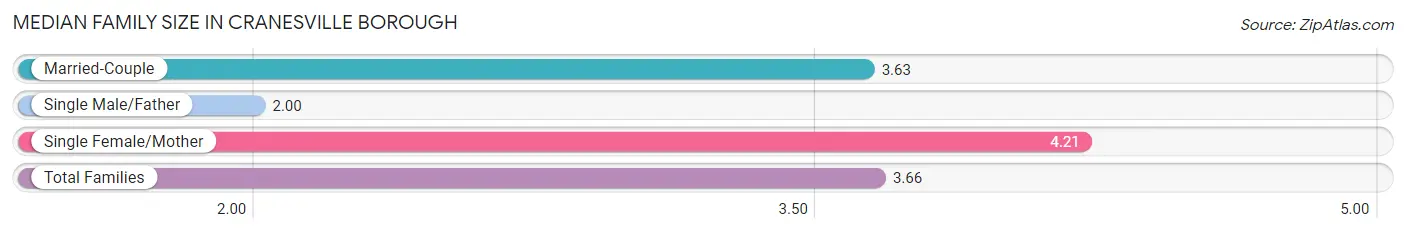
| Family Type | # Families | Family Size |
| Married-Couple | 174 (88.8%) | 3.63 |
| Single Male/Father | 3 (1.5%) | 2.00 |
| Single Female/Mother | 19 (9.7%) | 4.21 |
| Total Families | 196 (100.0%) | 3.66 |
Median Household Size in Cranesville borough
The median household size in Cranesville borough is 3.25 persons per household, with single female/mother households (19 | 7.7%) accounting for the largest median household size of 4.68 persons per household. non-family households (50 | 20.3%) represent the smallest median household size with 1.26 persons per household.
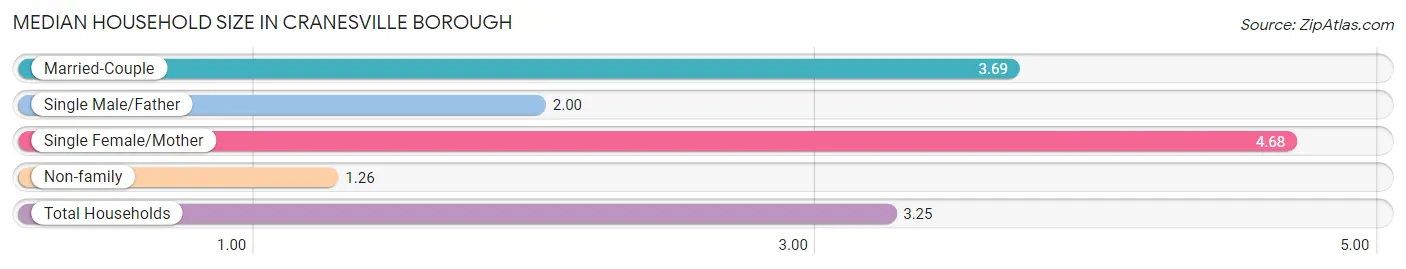
| Household Type | # Households | Household Size |
| Married-Couple | 174 (70.7%) | 3.69 |
| Single Male/Father | 3 (1.2%) | 2.00 |
| Single Female/Mother | 19 (7.7%) | 4.68 |
| Non-family | 50 (20.3%) | 1.26 |
| Total Households | 246 (100.0%) | 3.25 |
Household Size by Marriage Status in Cranesville borough
Out of a total of 246 households in Cranesville borough, 196 (79.7%) are family households, while 50 (20.3%) are nonfamily households. The most numerous type of family households are 2-person households, comprising 62, and the most common type of nonfamily households are 1-person households, comprising 35.
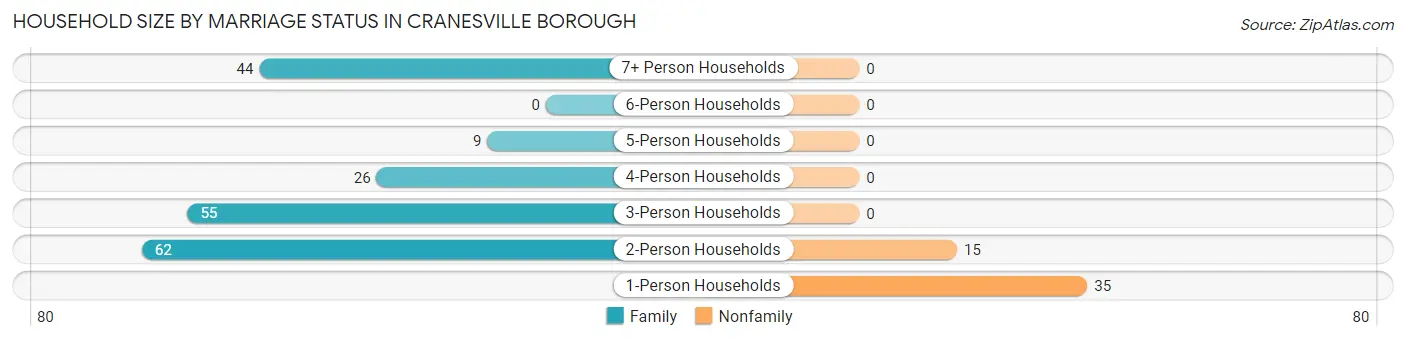
| Household Size | Family Households | Nonfamily Households |
| 1-Person Households | - | 35 (14.2%) |
| 2-Person Households | 62 (25.2%) | 15 (6.1%) |
| 3-Person Households | 55 (22.4%) | 0 (0.0%) |
| 4-Person Households | 26 (10.6%) | 0 (0.0%) |
| 5-Person Households | 9 (3.7%) | 0 (0.0%) |
| 6-Person Households | 0 (0.0%) | 0 (0.0%) |
| 7+ Person Households | 44 (17.9%) | 0 (0.0%) |
| Total | 196 (79.7%) | 50 (20.3%) |
Female Fertility in Cranesville borough
Fertility by Age in Cranesville borough
Average fertility rate in Cranesville borough is 33.0 births per 1,000 women. Women in the age bracket of 20 to 34 years have the highest fertility rate with 171.0 births per 1,000 women. Women in the age bracket of 20 to 34 years acount for 100.0% of all women with births.
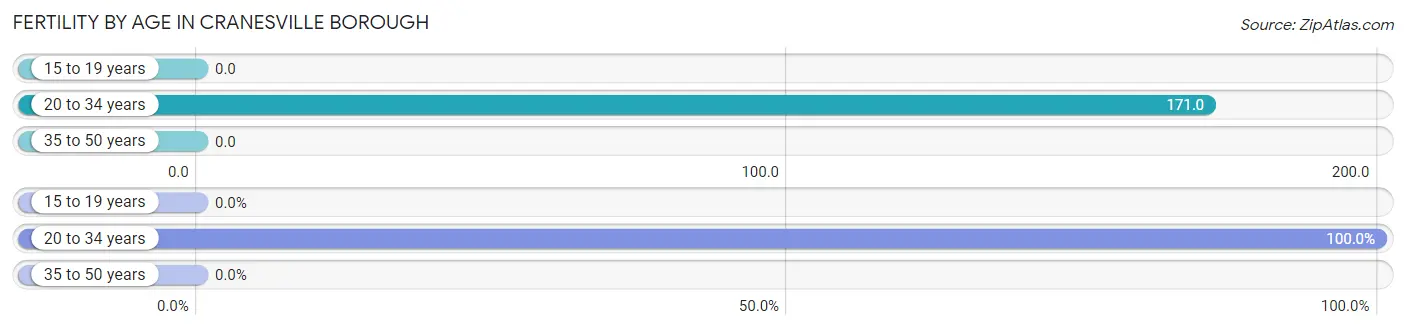
| Age Bracket | Women with Births | Births / 1,000 Women |
| 15 to 19 years | 0 (0.0%) | 0.0 |
| 20 to 34 years | 7 (100.0%) | 171.0 |
| 35 to 50 years | 0 (0.0%) | 0.0 |
| Total | 7 (100.0%) | 33.0 |
Fertility by Age by Marriage Status in Cranesville borough
28.6% of women with births (7) in Cranesville borough are married. The highest percentage of unmarried women with births falls into 20 to 34 years age bracket with 71.4% of them unmarried at the time of birth, while the lowest percentage of unmarried women with births belong to 20 to 34 years age bracket with 71.4% of them unmarried.
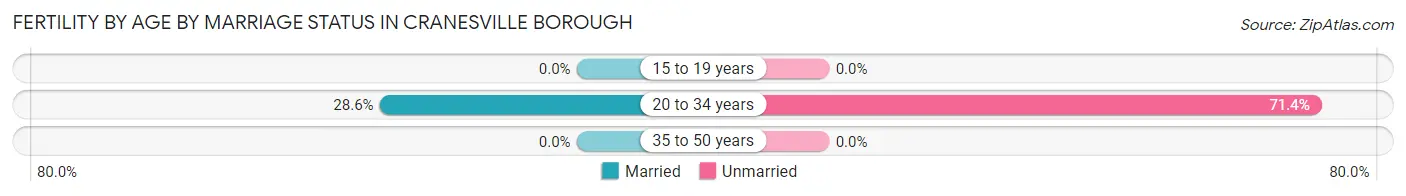
| Age Bracket | Married | Unmarried |
| 15 to 19 years | 0 (0.0%) | 0 (0.0%) |
| 20 to 34 years | 2 (28.6%) | 5 (71.4%) |
| 35 to 50 years | 0 (0.0%) | 0 (0.0%) |
| Total | 2 (28.6%) | 5 (71.4%) |
Fertility by Education in Cranesville borough
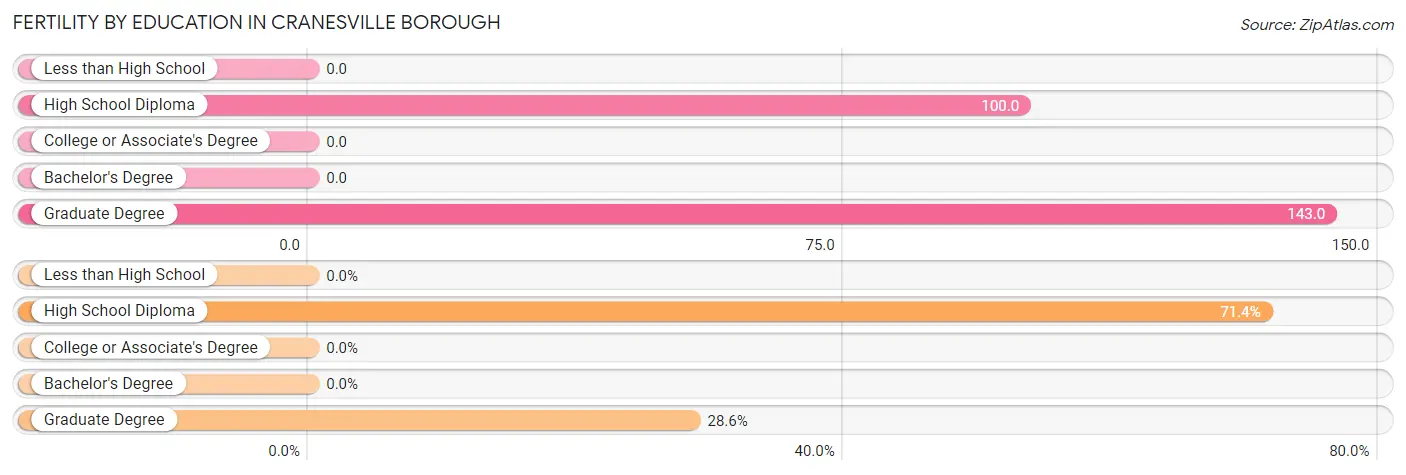
| Educational Attainment | Women with Births | Births / 1,000 Women |
| Less than High School | 0 (0.0%) | 0.0 |
| High School Diploma | 5 (71.4%) | 100.0 |
| College or Associate's Degree | 0 (0.0%) | 0.0 |
| Bachelor's Degree | 0 (0.0%) | 0.0 |
| Graduate Degree | 2 (28.6%) | 143.0 |
| Total | 7 (100.0%) | 33.0 |
Fertility by Education by Marriage Status in Cranesville borough
71.4% of women with births in Cranesville borough are unmarried. Women with the educational attainment of graduate degree are most likely to be married with 100.0% of them married at childbirth, while women with the educational attainment of high school diploma are least likely to be married with 100.0% of them unmarried at childbirth.
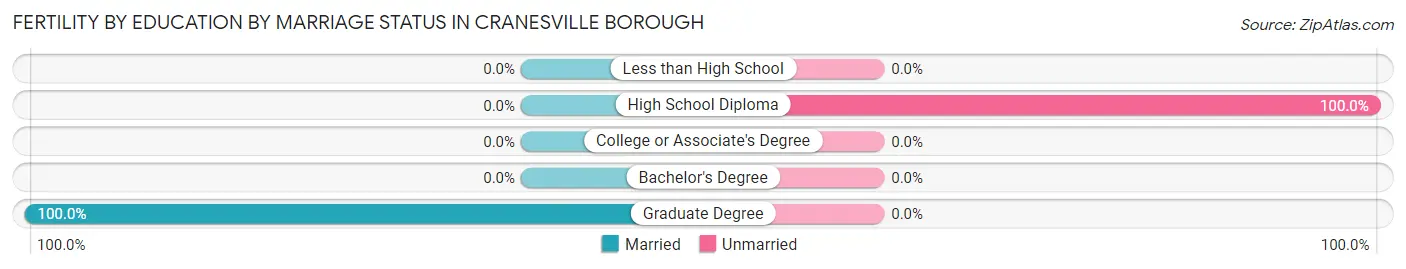
| Educational Attainment | Married | Unmarried |
| Less than High School | 0 (0.0%) | 0 (0.0%) |
| High School Diploma | 0 (0.0%) | 5 (100.0%) |
| College or Associate's Degree | 0 (0.0%) | 0 (0.0%) |
| Bachelor's Degree | 0 (0.0%) | 0 (0.0%) |
| Graduate Degree | 2 (100.0%) | 0 (0.0%) |
| Total | 2 (28.6%) | 5 (71.4%) |
Employment Characteristics in Cranesville borough
Employment by Class of Employer in Cranesville borough
Among the 347 employed individuals in Cranesville borough, private company employees (213 | 61.4%), state government employees (46 | 13.3%), and not-for-profit organizations (40 | 11.5%) make up the most common classes of employment.
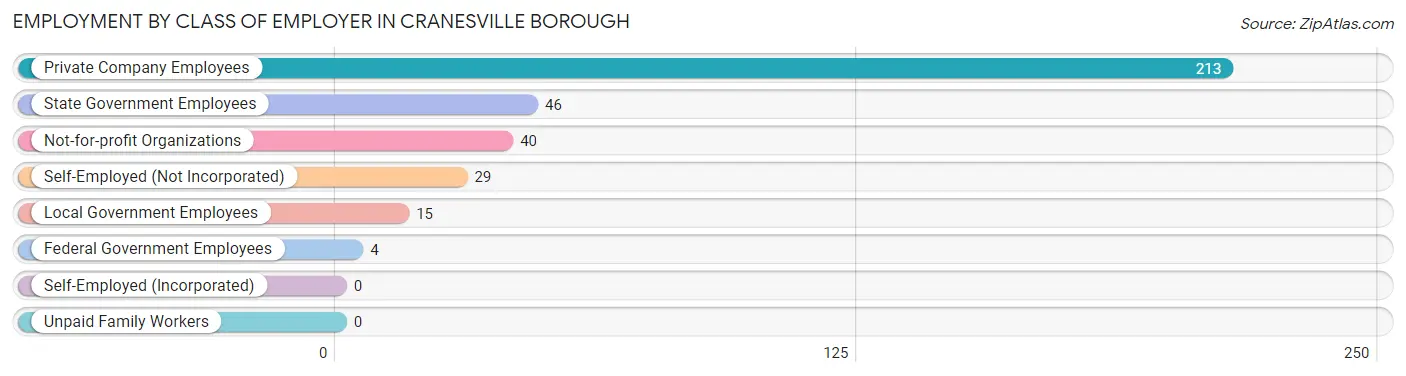
| Employer Class | # Employees | % Employees |
| Private Company Employees | 213 | 61.4% |
| Self-Employed (Incorporated) | 0 | 0.0% |
| Self-Employed (Not Incorporated) | 29 | 8.4% |
| Not-for-profit Organizations | 40 | 11.5% |
| Local Government Employees | 15 | 4.3% |
| State Government Employees | 46 | 13.3% |
| Federal Government Employees | 4 | 1.1% |
| Unpaid Family Workers | 0 | 0.0% |
| Total | 347 | 100.0% |
Employment Status by Age in Cranesville borough
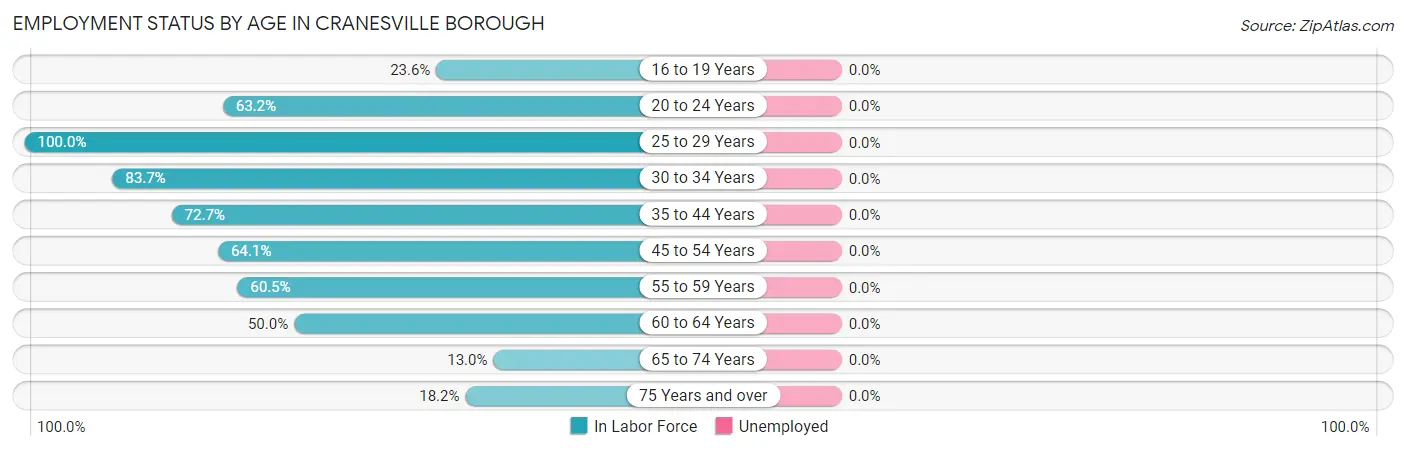
| Age Bracket | In Labor Force | Unemployed |
| 16 to 19 Years | 17 (23.6%) | 0 (0.0%) |
| 20 to 24 Years | 67 (63.2%) | 0 (0.0%) |
| 25 to 29 Years | 12 (100.0%) | 0 (0.0%) |
| 30 to 34 Years | 41 (83.7%) | 0 (0.0%) |
| 35 to 44 Years | 48 (72.7%) | 0 (0.0%) |
| 45 to 54 Years | 98 (64.1%) | 0 (0.0%) |
| 55 to 59 Years | 46 (60.5%) | 0 (0.0%) |
| 60 to 64 Years | 18 (50.0%) | 0 (0.0%) |
| 65 to 74 Years | 3 (13.0%) | 0 (0.0%) |
| 75 Years and over | 6 (18.2%) | 0 (0.0%) |
| Total | 356 (56.9%) | 0 (0.0%) |
Employment Status by Educational Attainment in Cranesville borough
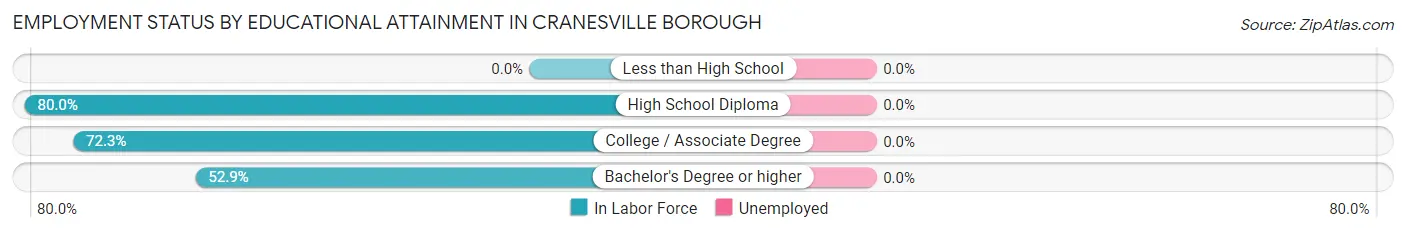
| Educational Attainment | In Labor Force | Unemployed |
| Less than High School | 0 (0.0%) | 0 (0.0%) |
| High School Diploma | 152 (80.0%) | 0 (0.0%) |
| College / Associate Degree | 47 (72.3%) | 0 (0.0%) |
| Bachelor's Degree or higher | 64 (52.9%) | 0 (0.0%) |
| Total | 263 (67.1%) | 0 (0.0%) |
Employment Occupations by Sex in Cranesville borough
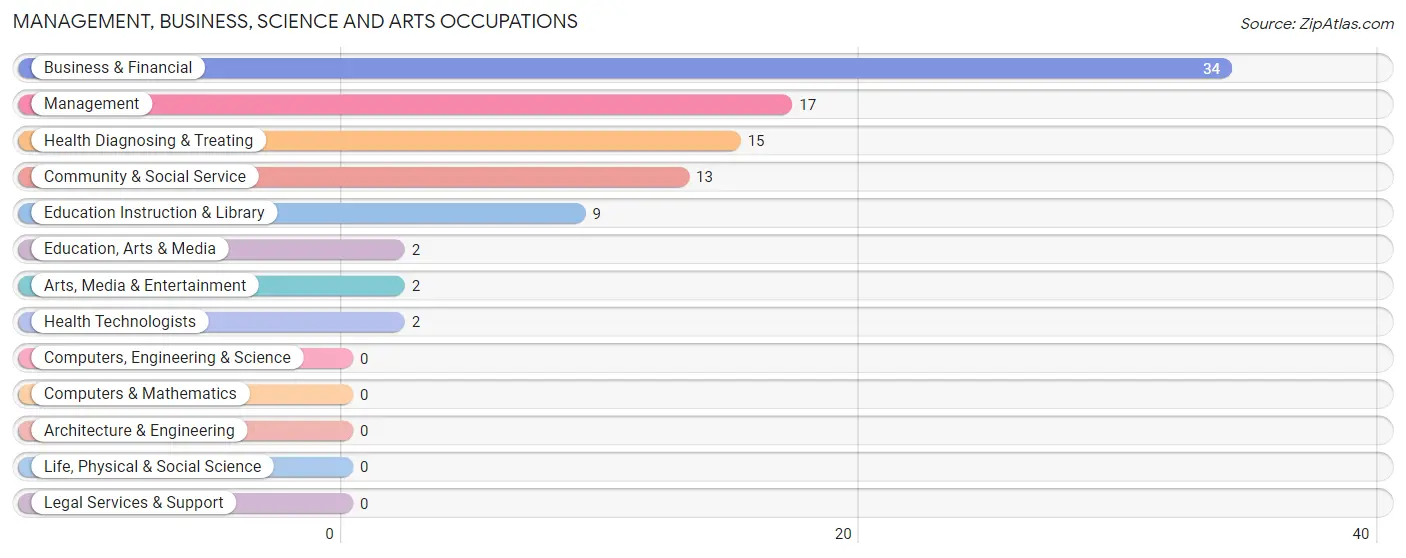
Management, Business, Science and Arts Occupations
The most common Management, Business, Science and Arts occupations in Cranesville borough are Business & Financial (34 | 9.6%), Management (17 | 4.8%), Health Diagnosing & Treating (15 | 4.2%), Community & Social Service (13 | 3.6%), and Education Instruction & Library (9 | 2.5%).
Management, Business, Science and Arts Occupations by Sex
Within the Management, Business, Science and Arts occupations in Cranesville borough, the most male-oriented occupations are Arts, Media & Entertainment (100.0%), Management (76.5%), and Business & Financial (73.5%), while the most female-oriented occupations are Education, Arts & Media (100.0%), Health Technologists (100.0%), and Health Diagnosing & Treating (86.7%).
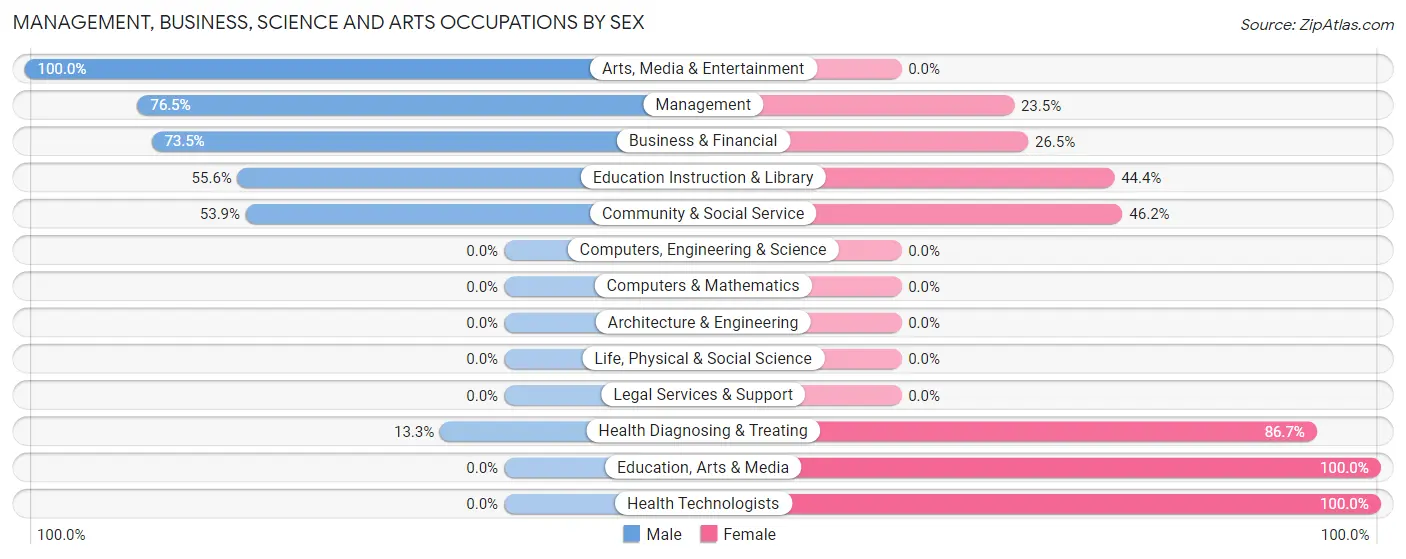
| Occupation | Male | Female |
| Management | 13 (76.5%) | 4 (23.5%) |
| Business & Financial | 25 (73.5%) | 9 (26.5%) |
| Computers, Engineering & Science | 0 (0.0%) | 0 (0.0%) |
| Computers & Mathematics | 0 (0.0%) | 0 (0.0%) |
| Architecture & Engineering | 0 (0.0%) | 0 (0.0%) |
| Life, Physical & Social Science | 0 (0.0%) | 0 (0.0%) |
| Community & Social Service | 7 (53.8%) | 6 (46.2%) |
| Education, Arts & Media | 0 (0.0%) | 2 (100.0%) |
| Legal Services & Support | 0 (0.0%) | 0 (0.0%) |
| Education Instruction & Library | 5 (55.6%) | 4 (44.4%) |
| Arts, Media & Entertainment | 2 (100.0%) | 0 (0.0%) |
| Health Diagnosing & Treating | 2 (13.3%) | 13 (86.7%) |
| Health Technologists | 0 (0.0%) | 2 (100.0%) |
| Total (Category) | 47 (59.5%) | 32 (40.5%) |
| Total (Overall) | 211 (59.3%) | 145 (40.7%) |
Services Occupations
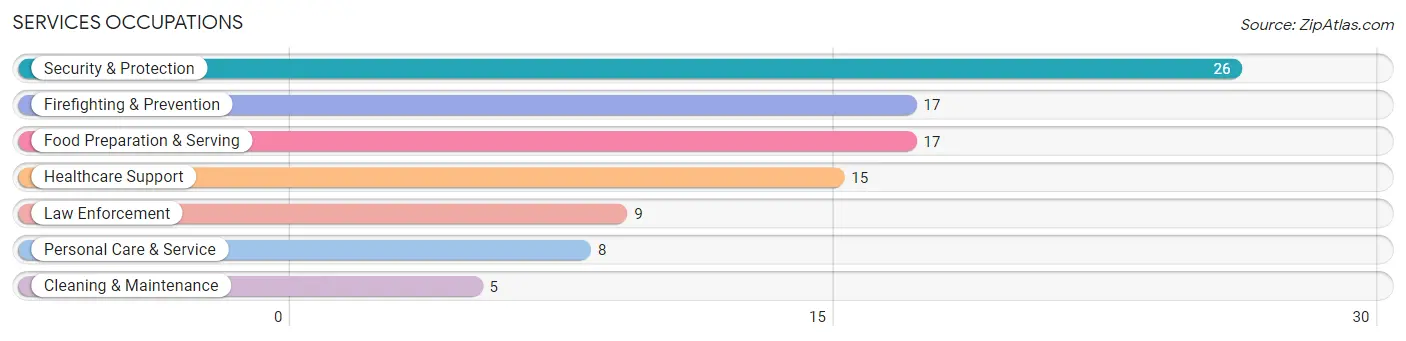
The most common Services occupations in Cranesville borough are Security & Protection (26 | 7.3%), Firefighting & Prevention (17 | 4.8%), Food Preparation & Serving (17 | 4.8%), Healthcare Support (15 | 4.2%), and Law Enforcement (9 | 2.5%).
Services Occupations by Sex
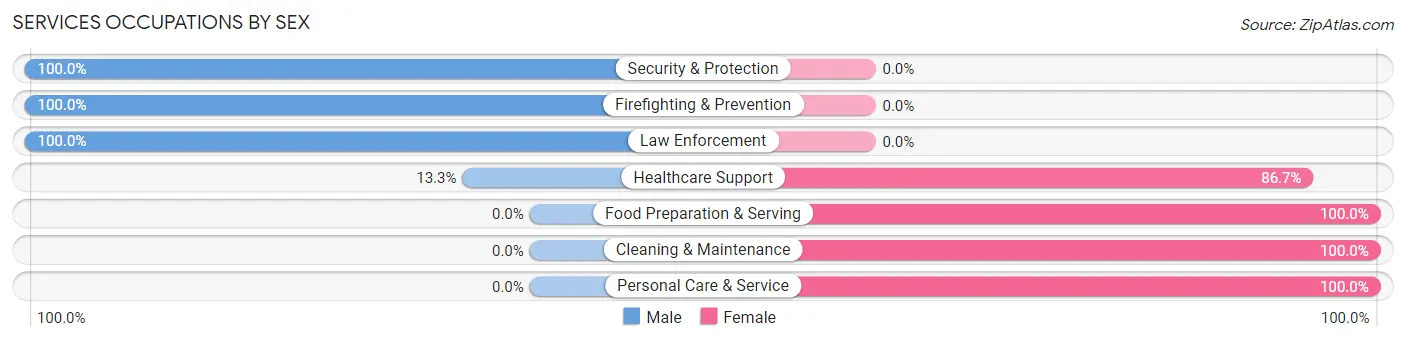
Within the Services occupations in Cranesville borough, the most male-oriented occupations are Security & Protection (100.0%), Firefighting & Prevention (100.0%), and Law Enforcement (100.0%), while the most female-oriented occupations are Food Preparation & Serving (100.0%), Cleaning & Maintenance (100.0%), and Personal Care & Service (100.0%).
| Occupation | Male | Female |
| Healthcare Support | 2 (13.3%) | 13 (86.7%) |
| Security & Protection | 26 (100.0%) | 0 (0.0%) |
| Firefighting & Prevention | 17 (100.0%) | 0 (0.0%) |
| Law Enforcement | 9 (100.0%) | 0 (0.0%) |
| Food Preparation & Serving | 0 (0.0%) | 17 (100.0%) |
| Cleaning & Maintenance | 0 (0.0%) | 5 (100.0%) |
| Personal Care & Service | 0 (0.0%) | 8 (100.0%) |
| Total (Category) | 28 (39.4%) | 43 (60.6%) |
| Total (Overall) | 211 (59.3%) | 145 (40.7%) |
Sales and Office Occupations
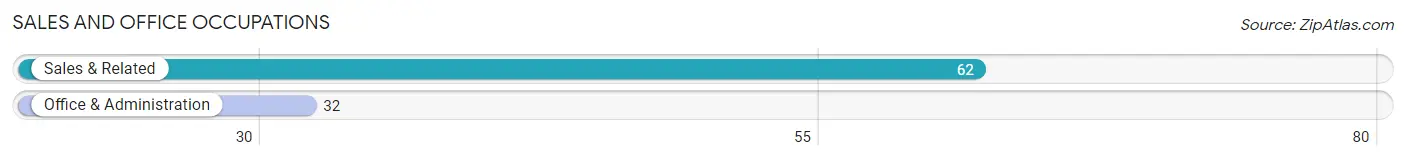
The most common Sales and Office occupations in Cranesville borough are Sales & Related (62 | 17.4%), and Office & Administration (32 | 9.0%).
Sales and Office Occupations by Sex
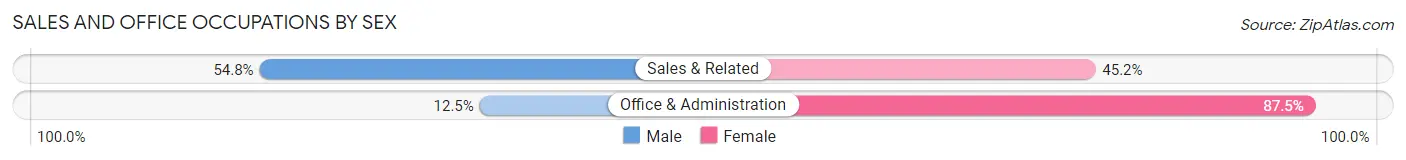
| Occupation | Male | Female |
| Sales & Related | 34 (54.8%) | 28 (45.2%) |
| Office & Administration | 4 (12.5%) | 28 (87.5%) |
| Total (Category) | 38 (40.4%) | 56 (59.6%) |
| Total (Overall) | 211 (59.3%) | 145 (40.7%) |
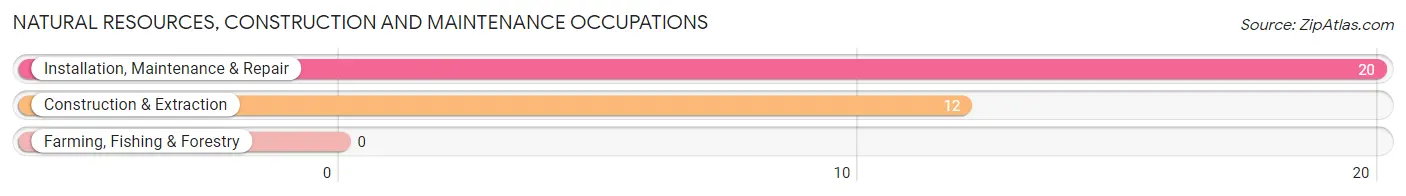
Natural Resources, Construction and Maintenance Occupations
The most common Natural Resources, Construction and Maintenance occupations in Cranesville borough are Installation, Maintenance & Repair (20 | 5.6%), and Construction & Extraction (12 | 3.4%).
Natural Resources, Construction and Maintenance Occupations by Sex
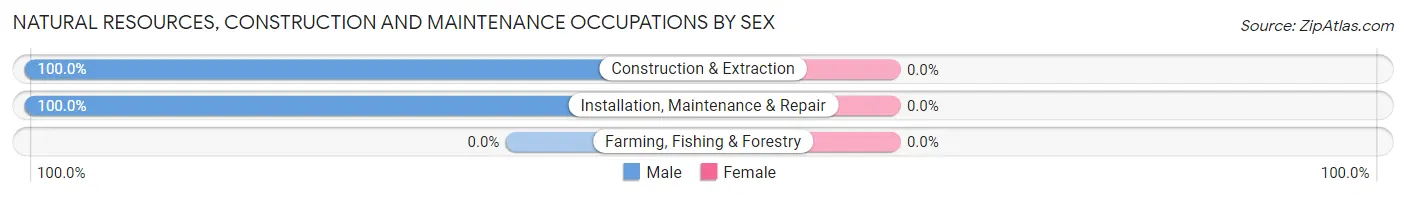
| Occupation | Male | Female |
| Farming, Fishing & Forestry | 0 (0.0%) | 0 (0.0%) |
| Construction & Extraction | 12 (100.0%) | 0 (0.0%) |
| Installation, Maintenance & Repair | 20 (100.0%) | 0 (0.0%) |
| Total (Category) | 32 (100.0%) | 0 (0.0%) |
| Total (Overall) | 211 (59.3%) | 145 (40.7%) |
Production, Transportation and Moving Occupations
The most common Production, Transportation and Moving occupations in Cranesville borough are Production (44 | 12.4%), Transportation (29 | 8.2%), and Material Moving (7 | 2.0%).
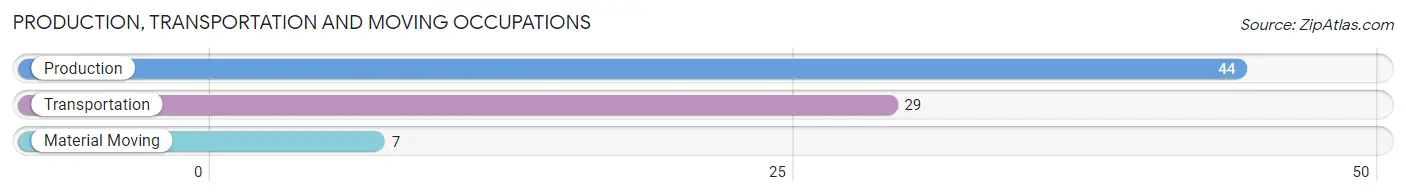
Production, Transportation and Moving Occupations by Sex
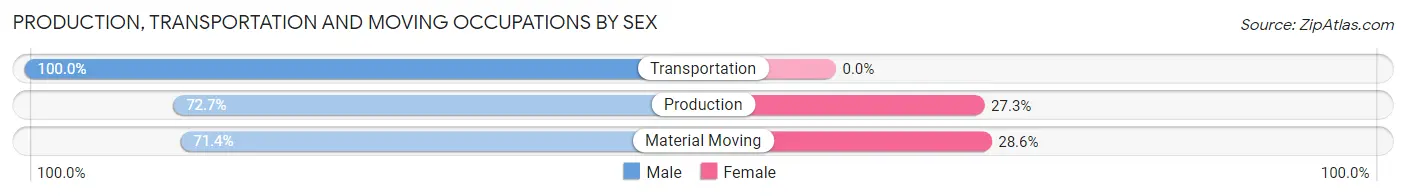
| Occupation | Male | Female |
| Production | 32 (72.7%) | 12 (27.3%) |
| Transportation | 29 (100.0%) | 0 (0.0%) |
| Material Moving | 5 (71.4%) | 2 (28.6%) |
| Total (Category) | 66 (82.5%) | 14 (17.5%) |
| Total (Overall) | 211 (59.3%) | 145 (40.7%) |
Employment Industries by Sex in Cranesville borough
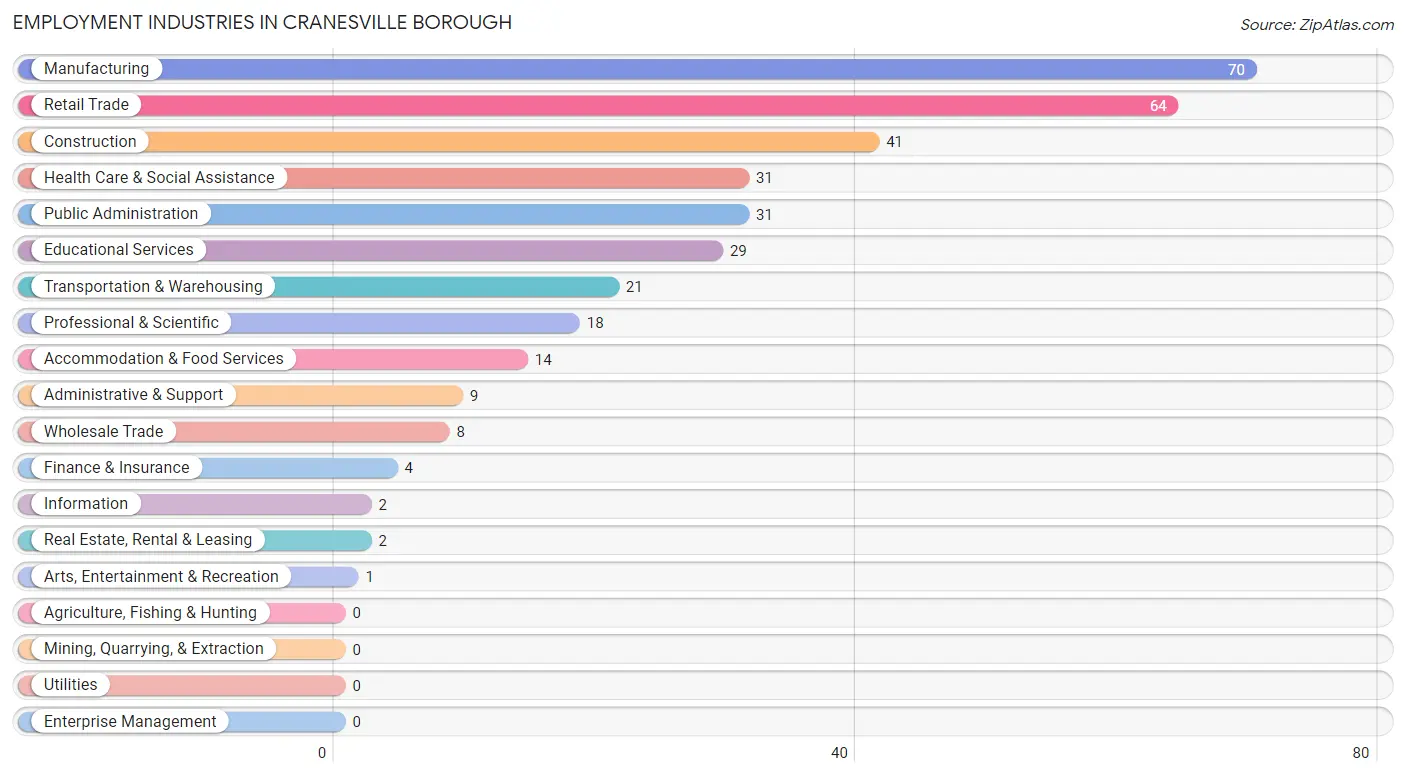
Employment Industries in Cranesville borough
The major employment industries in Cranesville borough include Manufacturing (70 | 19.7%), Retail Trade (64 | 18.0%), Construction (41 | 11.5%), Health Care & Social Assistance (31 | 8.7%), and Public Administration (31 | 8.7%).
Employment Industries by Sex in Cranesville borough
The Cranesville borough industries that see more men than women are Construction (100.0%), Wholesale Trade (100.0%), and Real Estate, Rental & Leasing (100.0%), whereas the industries that tend to have a higher number of women are Information (100.0%), Finance & Insurance (100.0%), and Accommodation & Food Services (100.0%).
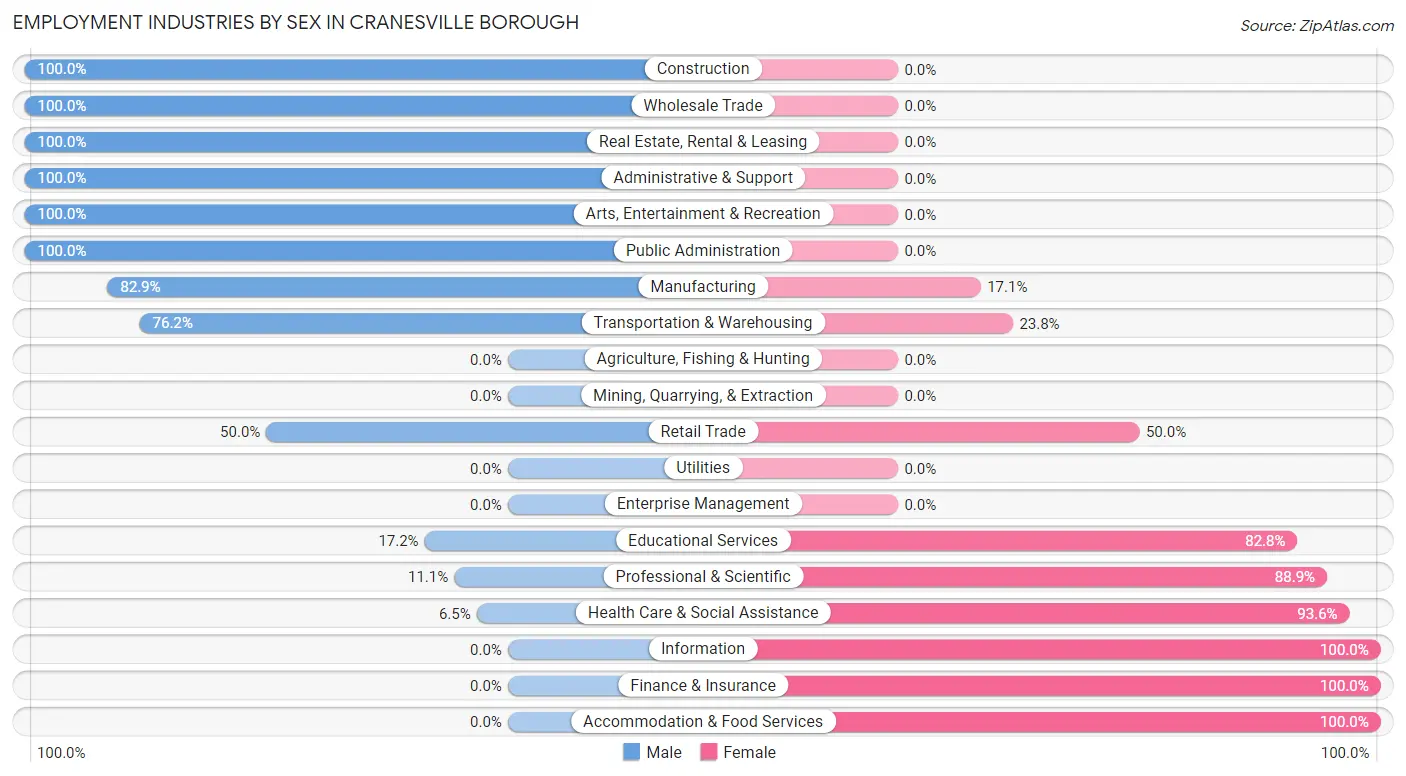
| Industry | Male | Female |
| Agriculture, Fishing & Hunting | 0 (0.0%) | 0 (0.0%) |
| Mining, Quarrying, & Extraction | 0 (0.0%) | 0 (0.0%) |
| Construction | 41 (100.0%) | 0 (0.0%) |
| Manufacturing | 58 (82.9%) | 12 (17.1%) |
| Wholesale Trade | 8 (100.0%) | 0 (0.0%) |
| Retail Trade | 32 (50.0%) | 32 (50.0%) |
| Transportation & Warehousing | 16 (76.2%) | 5 (23.8%) |
| Utilities | 0 (0.0%) | 0 (0.0%) |
| Information | 0 (0.0%) | 2 (100.0%) |
| Finance & Insurance | 0 (0.0%) | 4 (100.0%) |
| Real Estate, Rental & Leasing | 2 (100.0%) | 0 (0.0%) |
| Professional & Scientific | 2 (11.1%) | 16 (88.9%) |
| Enterprise Management | 0 (0.0%) | 0 (0.0%) |
| Administrative & Support | 9 (100.0%) | 0 (0.0%) |
| Educational Services | 5 (17.2%) | 24 (82.8%) |
| Health Care & Social Assistance | 2 (6.5%) | 29 (93.5%) |
| Arts, Entertainment & Recreation | 1 (100.0%) | 0 (0.0%) |
| Accommodation & Food Services | 0 (0.0%) | 14 (100.0%) |
| Public Administration | 31 (100.0%) | 0 (0.0%) |
| Total | 211 (59.3%) | 145 (40.7%) |
Education in Cranesville borough
School Enrollment in Cranesville borough
The most common levels of schooling among the 259 students in Cranesville borough are college / undergraduate (72 | 27.8%), high school (67 | 25.9%), and middle school (54 | 20.8%).
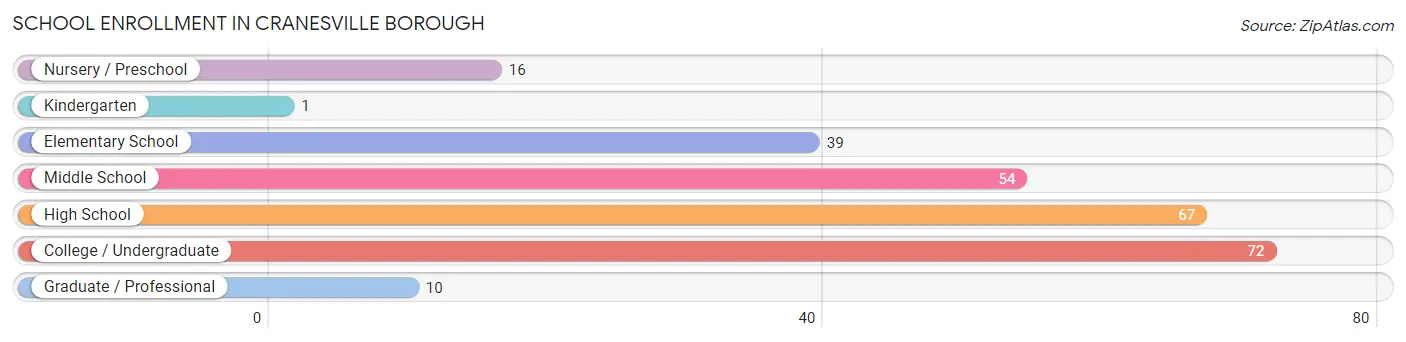
| School Level | # Students | % Students |
| Nursery / Preschool | 16 | 6.2% |
| Kindergarten | 1 | 0.4% |
| Elementary School | 39 | 15.1% |
| Middle School | 54 | 20.8% |
| High School | 67 | 25.9% |
| College / Undergraduate | 72 | 27.8% |
| Graduate / Professional | 10 | 3.9% |
| Total | 259 | 100.0% |
School Enrollment by Age by Funding Source in Cranesville borough
Out of a total of 259 students who are enrolled in schools in Cranesville borough, 34 (13.1%) attend a private institution, while the remaining 225 (86.9%) are enrolled in public schools. The age group of 20 to 24 year olds has the highest likelihood of being enrolled in private schools, with 20 (33.9% in the age bracket) enrolled. Conversely, the age group of 3 to 4 year olds has the lowest likelihood of being enrolled in a private school, with 2 (100.0% in the age bracket) attending a public institution.
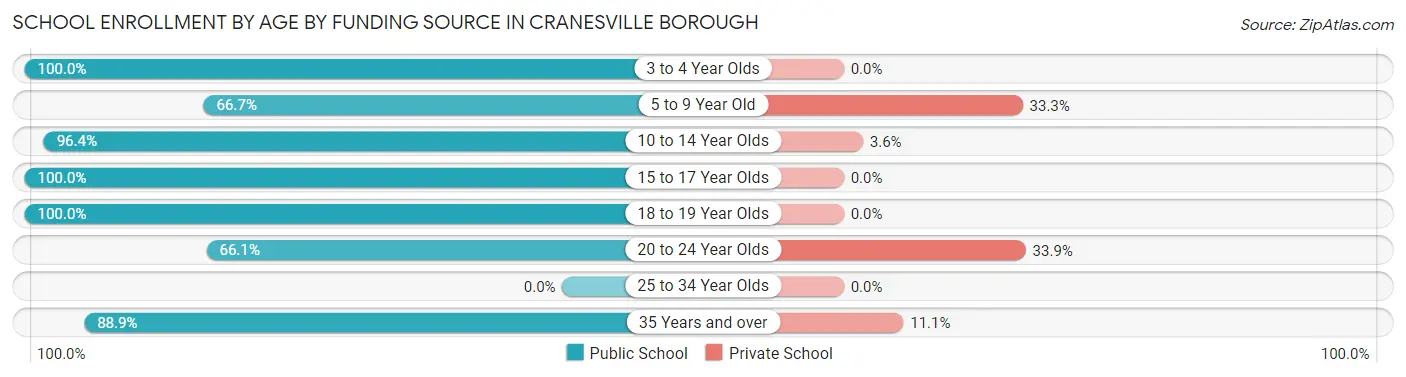
| Age Bracket | Public School | Private School |
| 3 to 4 Year Olds | 2 (100.0%) | 0 (0.0%) |
| 5 to 9 Year Old | 18 (66.7%) | 9 (33.3%) |
| 10 to 14 Year Olds | 81 (96.4%) | 3 (3.6%) |
| 15 to 17 Year Olds | 49 (100.0%) | 0 (0.0%) |
| 18 to 19 Year Olds | 20 (100.0%) | 0 (0.0%) |
| 20 to 24 Year Olds | 39 (66.1%) | 20 (33.9%) |
| 25 to 34 Year Olds | 0 (0.0%) | 0 (0.0%) |
| 35 Years and over | 16 (88.9%) | 2 (11.1%) |
| Total | 225 (86.9%) | 34 (13.1%) |
Educational Attainment by Field of Study in Cranesville borough
Liberal arts & history (47 | 33.8%), business (39 | 28.1%), education (14 | 10.1%), social sciences (9 | 6.5%), and visual & performing arts (8 | 5.8%) are the most common fields of study among 139 individuals in Cranesville borough who have obtained a bachelor's degree or higher.
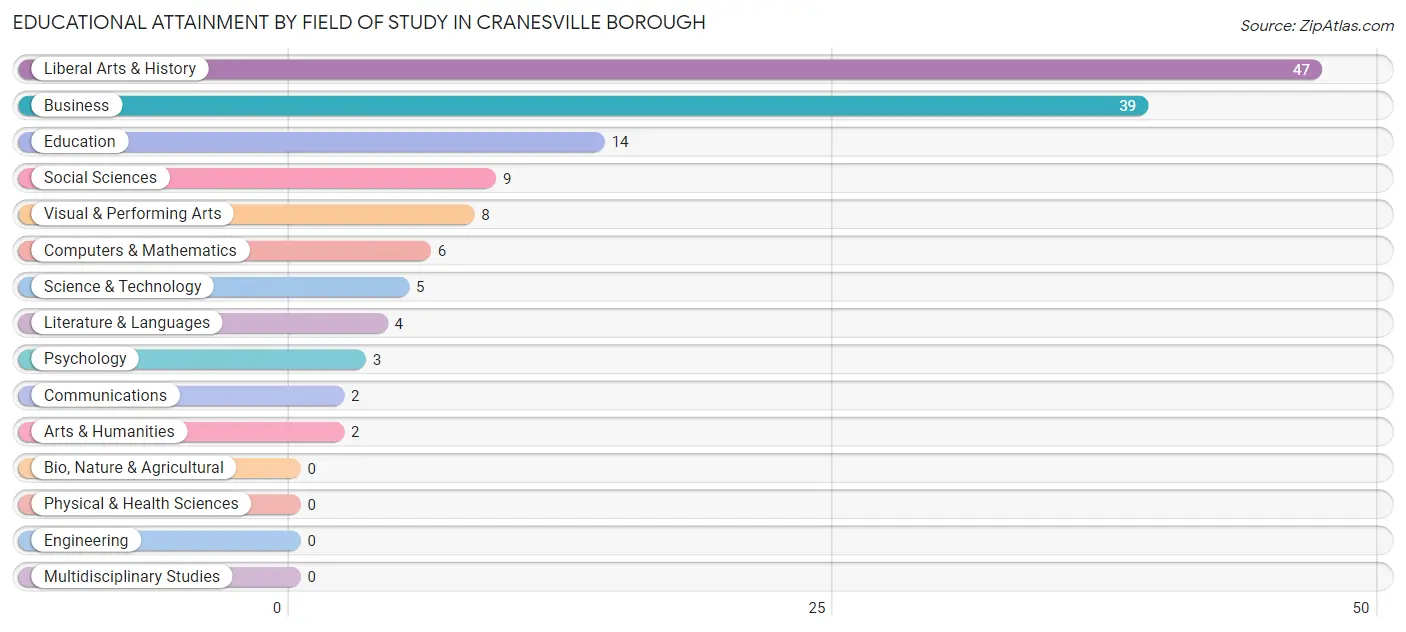
| Field of Study | # Graduates | % Graduates |
| Computers & Mathematics | 6 | 4.3% |
| Bio, Nature & Agricultural | 0 | 0.0% |
| Physical & Health Sciences | 0 | 0.0% |
| Psychology | 3 | 2.2% |
| Social Sciences | 9 | 6.5% |
| Engineering | 0 | 0.0% |
| Multidisciplinary Studies | 0 | 0.0% |
| Science & Technology | 5 | 3.6% |
| Business | 39 | 28.1% |
| Education | 14 | 10.1% |
| Literature & Languages | 4 | 2.9% |
| Liberal Arts & History | 47 | 33.8% |
| Visual & Performing Arts | 8 | 5.8% |
| Communications | 2 | 1.4% |
| Arts & Humanities | 2 | 1.4% |
| Total | 139 | 100.0% |
Transportation & Commute in Cranesville borough
Vehicle Availability by Sex in Cranesville borough
The most prevalent vehicle ownership categories in Cranesville borough are males with 1 vehicle (75, accounting for 35.5%) and females with 1 vehicle (18, making up 55.1%).
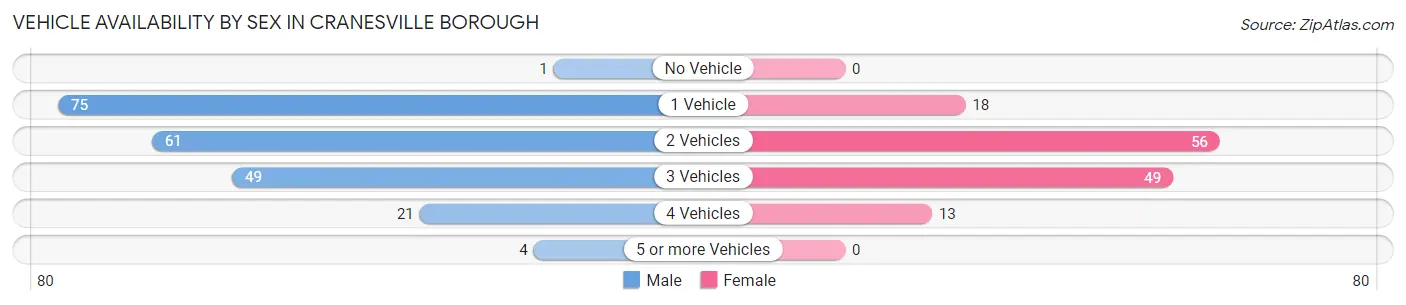
| Vehicles Available | Male | Female |
| No Vehicle | 1 (0.5%) | 0 (0.0%) |
| 1 Vehicle | 75 (35.5%) | 18 (13.2%) |
| 2 Vehicles | 61 (28.9%) | 56 (41.2%) |
| 3 Vehicles | 49 (23.2%) | 49 (36.0%) |
| 4 Vehicles | 21 (10.0%) | 13 (9.6%) |
| 5 or more Vehicles | 4 (1.9%) | 0 (0.0%) |
| Total | 211 (100.0%) | 136 (100.0%) |
Commute Time in Cranesville borough
The most frequently occuring commute durations in Cranesville borough are 25 to 29 minutes (64 commuters, 19.2%), 20 to 24 minutes (62 commuters, 18.6%), and 30 to 34 minutes (61 commuters, 18.3%).
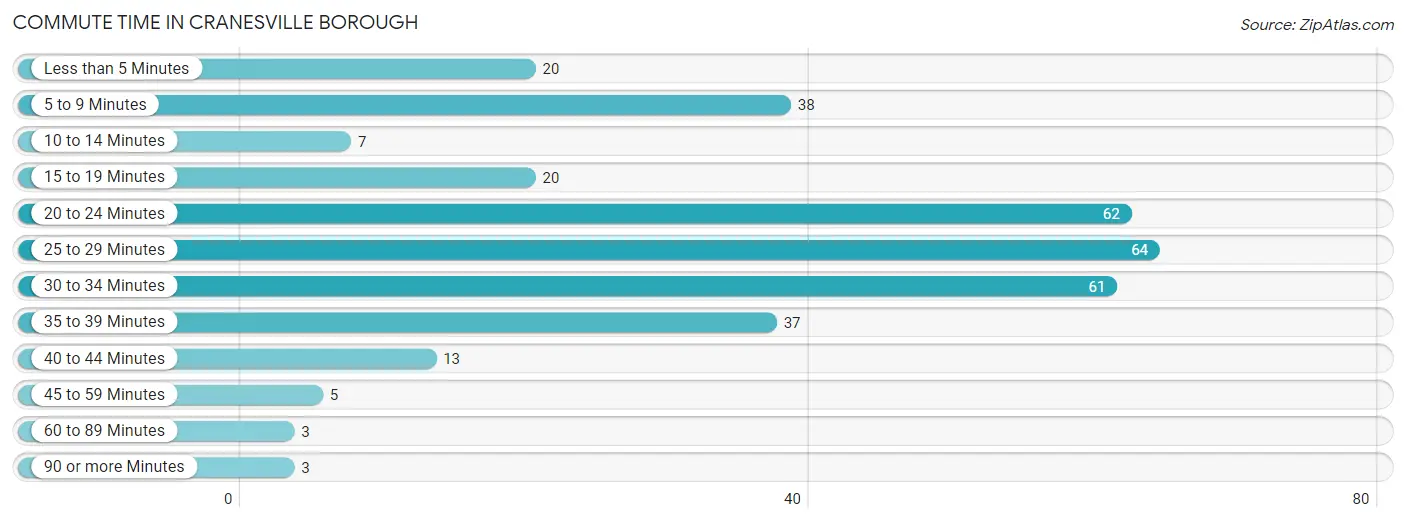
| Commute Time | # Commuters | % Commuters |
| Less than 5 Minutes | 20 | 6.0% |
| 5 to 9 Minutes | 38 | 11.4% |
| 10 to 14 Minutes | 7 | 2.1% |
| 15 to 19 Minutes | 20 | 6.0% |
| 20 to 24 Minutes | 62 | 18.6% |
| 25 to 29 Minutes | 64 | 19.2% |
| 30 to 34 Minutes | 61 | 18.3% |
| 35 to 39 Minutes | 37 | 11.1% |
| 40 to 44 Minutes | 13 | 3.9% |
| 45 to 59 Minutes | 5 | 1.5% |
| 60 to 89 Minutes | 3 | 0.9% |
| 90 or more Minutes | 3 | 0.9% |
Commute Time by Sex in Cranesville borough
The most common commute times in Cranesville borough are 25 to 29 minutes (60 commuters, 28.4%) for males and 35 to 39 minutes (26 commuters, 21.3%) for females.
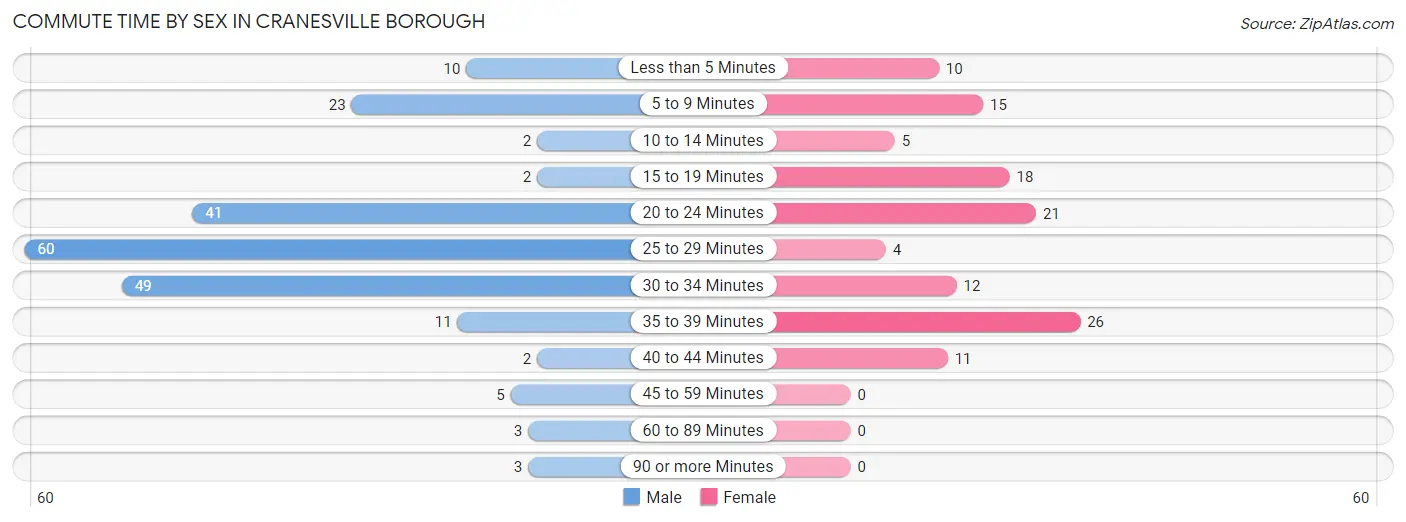
| Commute Time | Male | Female |
| Less than 5 Minutes | 10 (4.7%) | 10 (8.2%) |
| 5 to 9 Minutes | 23 (10.9%) | 15 (12.3%) |
| 10 to 14 Minutes | 2 (0.9%) | 5 (4.1%) |
| 15 to 19 Minutes | 2 (0.9%) | 18 (14.7%) |
| 20 to 24 Minutes | 41 (19.4%) | 21 (17.2%) |
| 25 to 29 Minutes | 60 (28.4%) | 4 (3.3%) |
| 30 to 34 Minutes | 49 (23.2%) | 12 (9.8%) |
| 35 to 39 Minutes | 11 (5.2%) | 26 (21.3%) |
| 40 to 44 Minutes | 2 (0.9%) | 11 (9.0%) |
| 45 to 59 Minutes | 5 (2.4%) | 0 (0.0%) |
| 60 to 89 Minutes | 3 (1.4%) | 0 (0.0%) |
| 90 or more Minutes | 3 (1.4%) | 0 (0.0%) |
Time of Departure to Work by Sex in Cranesville borough
The most frequent times of departure to work in Cranesville borough are 6:00 AM to 6:29 AM (81, 38.4%) for males and 6:30 AM to 6:59 AM (29, 23.8%) for females.
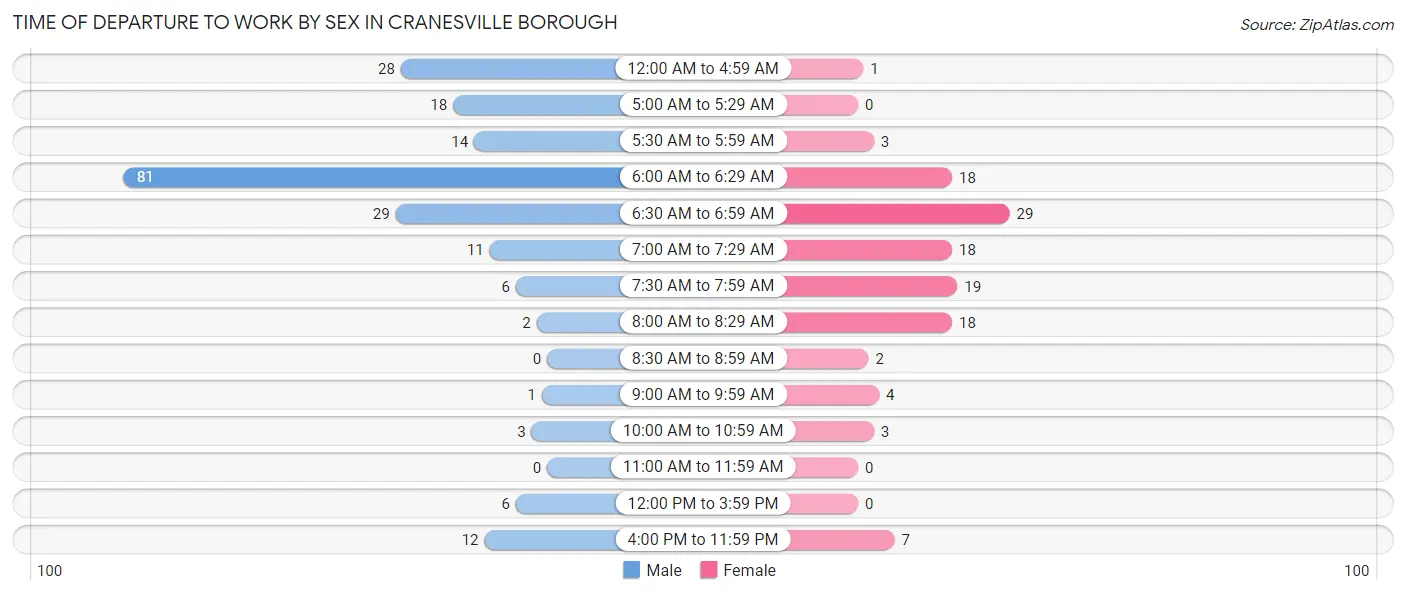
| Time of Departure | Male | Female |
| 12:00 AM to 4:59 AM | 28 (13.3%) | 1 (0.8%) |
| 5:00 AM to 5:29 AM | 18 (8.5%) | 0 (0.0%) |
| 5:30 AM to 5:59 AM | 14 (6.6%) | 3 (2.5%) |
| 6:00 AM to 6:29 AM | 81 (38.4%) | 18 (14.7%) |
| 6:30 AM to 6:59 AM | 29 (13.7%) | 29 (23.8%) |
| 7:00 AM to 7:29 AM | 11 (5.2%) | 18 (14.7%) |
| 7:30 AM to 7:59 AM | 6 (2.8%) | 19 (15.6%) |
| 8:00 AM to 8:29 AM | 2 (0.9%) | 18 (14.7%) |
| 8:30 AM to 8:59 AM | 0 (0.0%) | 2 (1.6%) |
| 9:00 AM to 9:59 AM | 1 (0.5%) | 4 (3.3%) |
| 10:00 AM to 10:59 AM | 3 (1.4%) | 3 (2.5%) |
| 11:00 AM to 11:59 AM | 0 (0.0%) | 0 (0.0%) |
| 12:00 PM to 3:59 PM | 6 (2.8%) | 0 (0.0%) |
| 4:00 PM to 11:59 PM | 12 (5.7%) | 7 (5.7%) |
| Total | 211 (100.0%) | 122 (100.0%) |
Housing Occupancy in Cranesville borough
Occupancy by Ownership in Cranesville borough
Of the total 246 dwellings in Cranesville borough, owner-occupied units account for 206 (83.7%), while renter-occupied units make up 40 (16.3%).
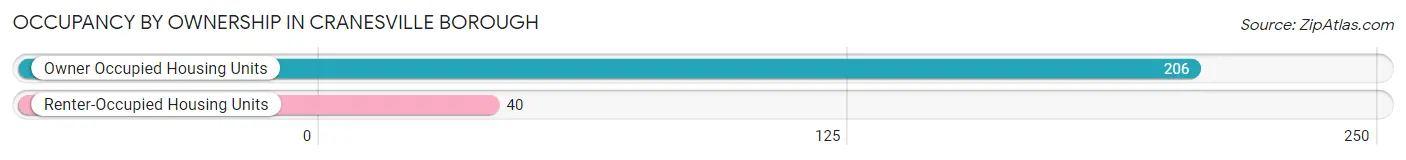
| Occupancy | # Housing Units | % Housing Units |
| Owner Occupied Housing Units | 206 | 83.7% |
| Renter-Occupied Housing Units | 40 | 16.3% |
| Total Occupied Housing Units | 246 | 100.0% |
Occupancy by Household Size in Cranesville borough
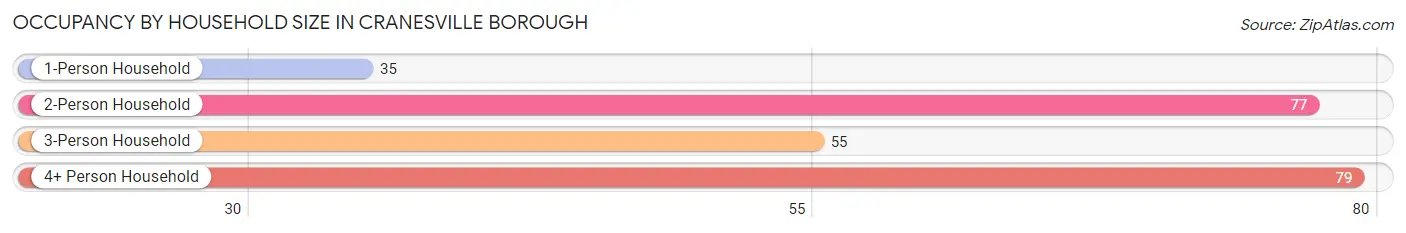
| Household Size | # Housing Units | % Housing Units |
| 1-Person Household | 35 | 14.2% |
| 2-Person Household | 77 | 31.3% |
| 3-Person Household | 55 | 22.4% |
| 4+ Person Household | 79 | 32.1% |
| Total Housing Units | 246 | 100.0% |
Occupancy by Ownership by Household Size in Cranesville borough
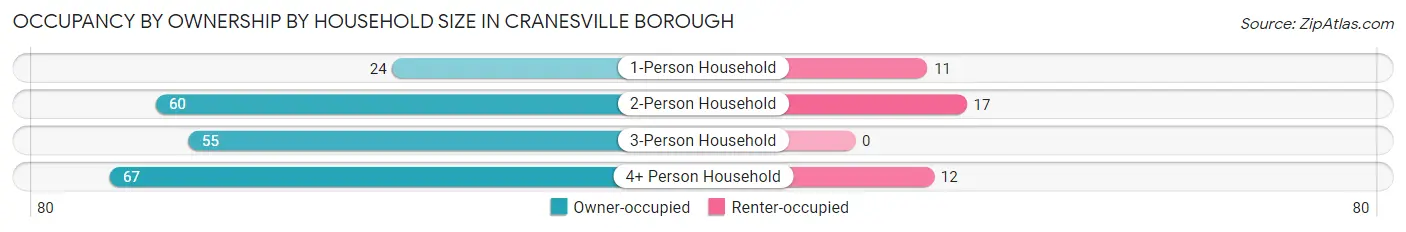
| Household Size | Owner-occupied | Renter-occupied |
| 1-Person Household | 24 (68.6%) | 11 (31.4%) |
| 2-Person Household | 60 (77.9%) | 17 (22.1%) |
| 3-Person Household | 55 (100.0%) | 0 (0.0%) |
| 4+ Person Household | 67 (84.8%) | 12 (15.2%) |
| Total Housing Units | 206 (83.7%) | 40 (16.3%) |
Occupancy by Educational Attainment in Cranesville borough
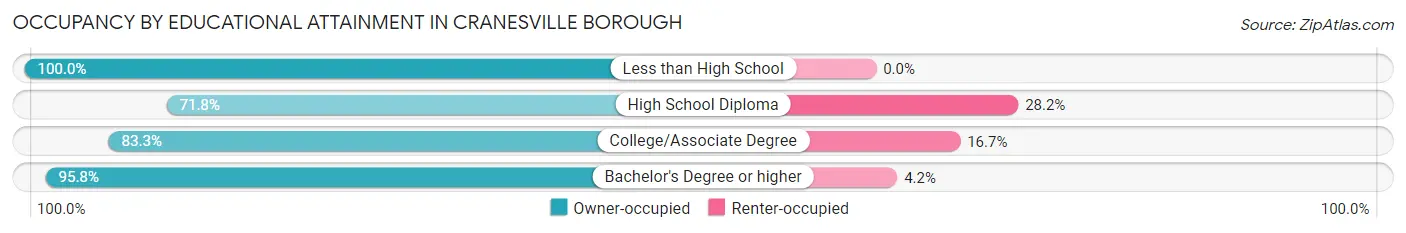
| Household Size | Owner-occupied | Renter-occupied |
| Less than High School | 5 (100.0%) | 0 (0.0%) |
| High School Diploma | 74 (71.8%) | 29 (28.2%) |
| College/Associate Degree | 35 (83.3%) | 7 (16.7%) |
| Bachelor's Degree or higher | 92 (95.8%) | 4 (4.2%) |
Occupancy by Age of Householder in Cranesville borough
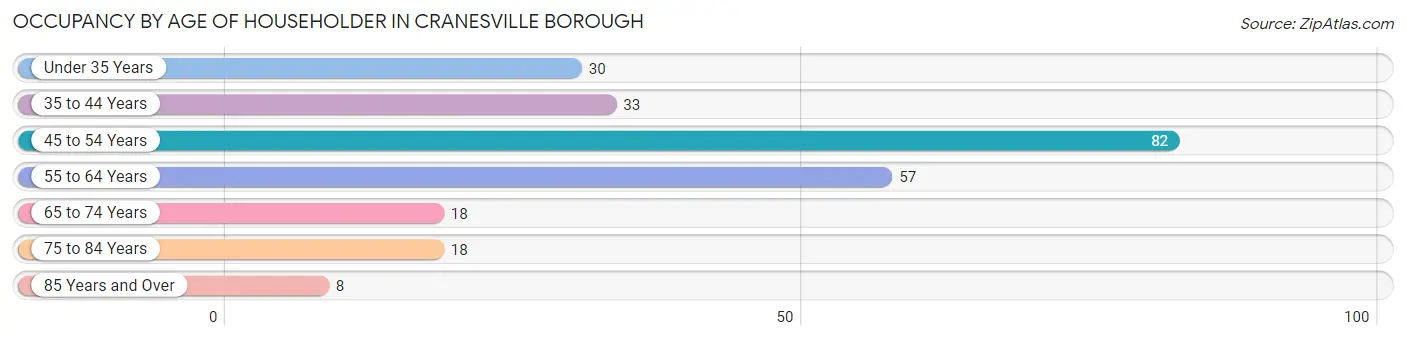
| Age Bracket | # Households | % Households |
| Under 35 Years | 30 | 12.2% |
| 35 to 44 Years | 33 | 13.4% |
| 45 to 54 Years | 82 | 33.3% |
| 55 to 64 Years | 57 | 23.2% |
| 65 to 74 Years | 18 | 7.3% |
| 75 to 84 Years | 18 | 7.3% |
| 85 Years and Over | 8 | 3.3% |
| Total | 246 | 100.0% |
Housing Finances in Cranesville borough
Median Income by Occupancy in Cranesville borough
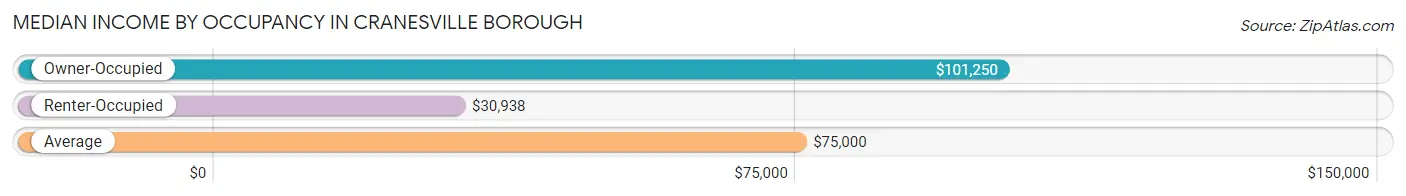
| Occupancy Type | # Households | Median Income |
| Owner-Occupied | 206 (83.7%) | $101,250 |
| Renter-Occupied | 40 (16.3%) | $30,938 |
| Average | 246 (100.0%) | $75,000 |
Occupancy by Householder Income Bracket in Cranesville borough
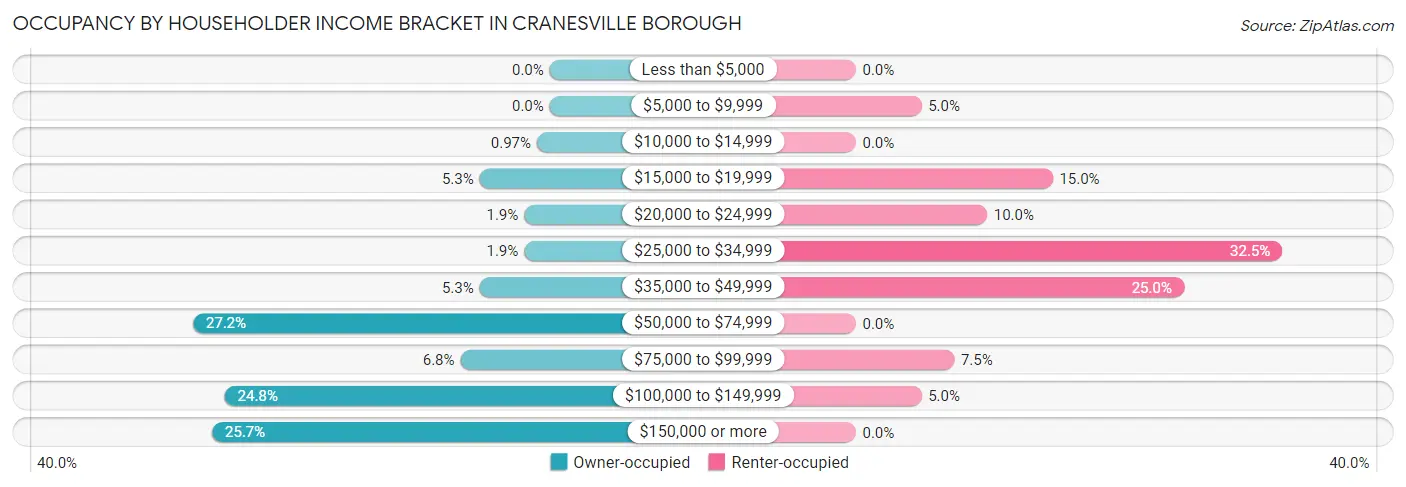
| Income Bracket | Owner-occupied | Renter-occupied |
| Less than $5,000 | 0 (0.0%) | 0 (0.0%) |
| $5,000 to $9,999 | 0 (0.0%) | 2 (5.0%) |
| $10,000 to $14,999 | 2 (1.0%) | 0 (0.0%) |
| $15,000 to $19,999 | 11 (5.3%) | 6 (15.0%) |
| $20,000 to $24,999 | 4 (1.9%) | 4 (10.0%) |
| $25,000 to $34,999 | 4 (1.9%) | 13 (32.5%) |
| $35,000 to $49,999 | 11 (5.3%) | 10 (25.0%) |
| $50,000 to $74,999 | 56 (27.2%) | 0 (0.0%) |
| $75,000 to $99,999 | 14 (6.8%) | 3 (7.5%) |
| $100,000 to $149,999 | 51 (24.8%) | 2 (5.0%) |
| $150,000 or more | 53 (25.7%) | 0 (0.0%) |
| Total | 206 (100.0%) | 40 (100.0%) |
Monthly Housing Cost Tiers in Cranesville borough
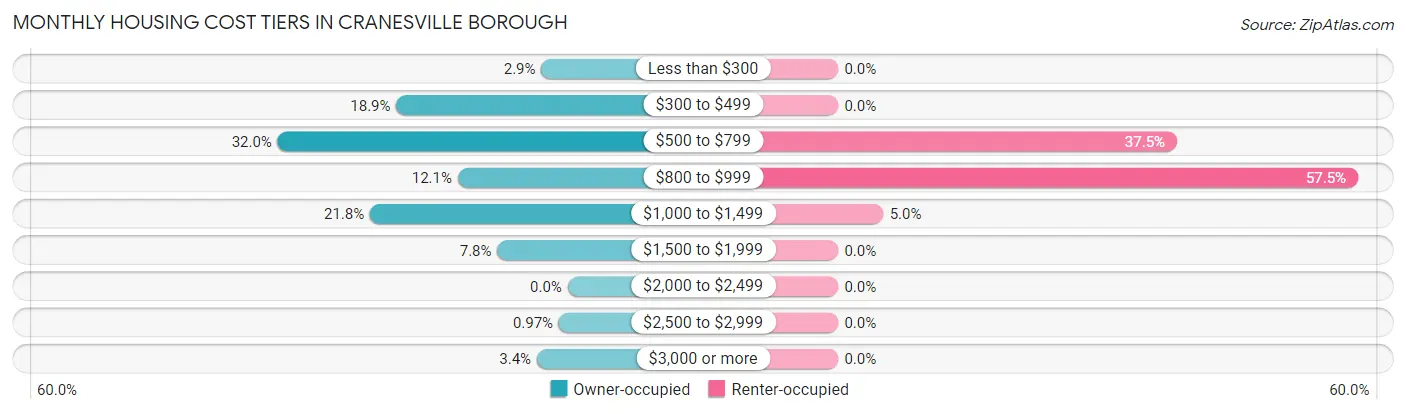
| Monthly Cost | Owner-occupied | Renter-occupied |
| Less than $300 | 6 (2.9%) | 0 (0.0%) |
| $300 to $499 | 39 (18.9%) | 0 (0.0%) |
| $500 to $799 | 66 (32.0%) | 15 (37.5%) |
| $800 to $999 | 25 (12.1%) | 23 (57.5%) |
| $1,000 to $1,499 | 45 (21.8%) | 2 (5.0%) |
| $1,500 to $1,999 | 16 (7.8%) | 0 (0.0%) |
| $2,000 to $2,499 | 0 (0.0%) | 0 (0.0%) |
| $2,500 to $2,999 | 2 (1.0%) | 0 (0.0%) |
| $3,000 or more | 7 (3.4%) | 0 (0.0%) |
| Total | 206 (100.0%) | 40 (100.0%) |
Physical Housing Characteristics in Cranesville borough
Housing Structures in Cranesville borough
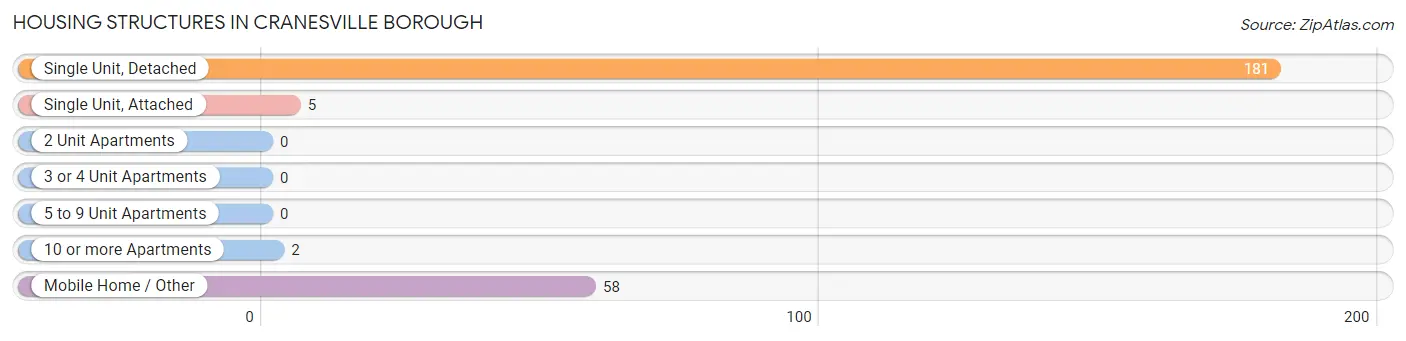
| Structure Type | # Housing Units | % Housing Units |
| Single Unit, Detached | 181 | 73.6% |
| Single Unit, Attached | 5 | 2.0% |
| 2 Unit Apartments | 0 | 0.0% |
| 3 or 4 Unit Apartments | 0 | 0.0% |
| 5 to 9 Unit Apartments | 0 | 0.0% |
| 10 or more Apartments | 2 | 0.8% |
| Mobile Home / Other | 58 | 23.6% |
| Total | 246 | 100.0% |
Housing Structures by Occupancy in Cranesville borough
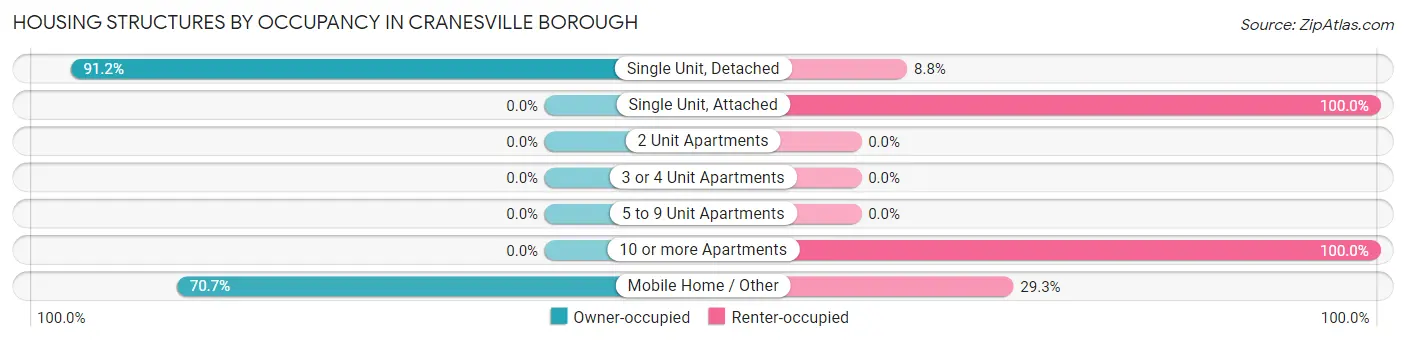
| Structure Type | Owner-occupied | Renter-occupied |
| Single Unit, Detached | 165 (91.2%) | 16 (8.8%) |
| Single Unit, Attached | 0 (0.0%) | 5 (100.0%) |
| 2 Unit Apartments | 0 (0.0%) | 0 (0.0%) |
| 3 or 4 Unit Apartments | 0 (0.0%) | 0 (0.0%) |
| 5 to 9 Unit Apartments | 0 (0.0%) | 0 (0.0%) |
| 10 or more Apartments | 0 (0.0%) | 2 (100.0%) |
| Mobile Home / Other | 41 (70.7%) | 17 (29.3%) |
| Total | 206 (83.7%) | 40 (16.3%) |
Housing Structures by Number of Rooms in Cranesville borough
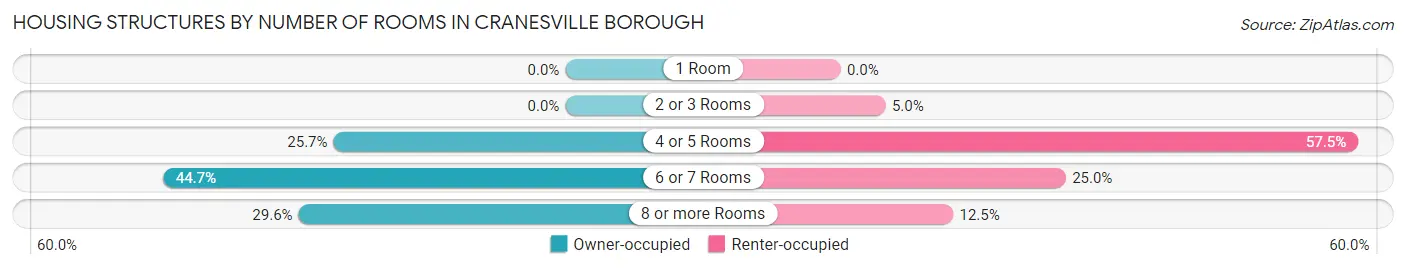
| Number of Rooms | Owner-occupied | Renter-occupied |
| 1 Room | 0 (0.0%) | 0 (0.0%) |
| 2 or 3 Rooms | 0 (0.0%) | 2 (5.0%) |
| 4 or 5 Rooms | 53 (25.7%) | 23 (57.5%) |
| 6 or 7 Rooms | 92 (44.7%) | 10 (25.0%) |
| 8 or more Rooms | 61 (29.6%) | 5 (12.5%) |
| Total | 206 (100.0%) | 40 (100.0%) |
Housing Structure by Heating Type in Cranesville borough
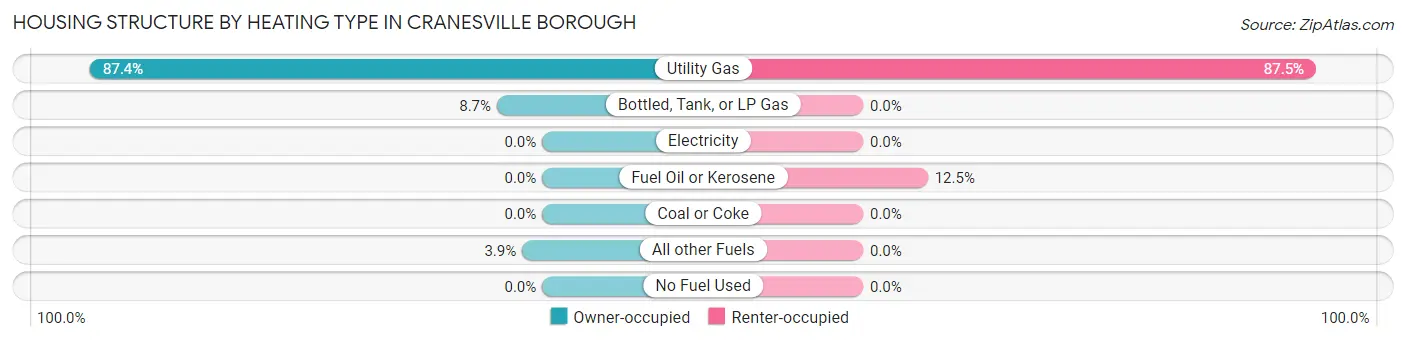
| Heating Type | Owner-occupied | Renter-occupied |
| Utility Gas | 180 (87.4%) | 35 (87.5%) |
| Bottled, Tank, or LP Gas | 18 (8.7%) | 0 (0.0%) |
| Electricity | 0 (0.0%) | 0 (0.0%) |
| Fuel Oil or Kerosene | 0 (0.0%) | 5 (12.5%) |
| Coal or Coke | 0 (0.0%) | 0 (0.0%) |
| All other Fuels | 8 (3.9%) | 0 (0.0%) |
| No Fuel Used | 0 (0.0%) | 0 (0.0%) |
| Total | 206 (100.0%) | 40 (100.0%) |
Household Vehicle Usage in Cranesville borough
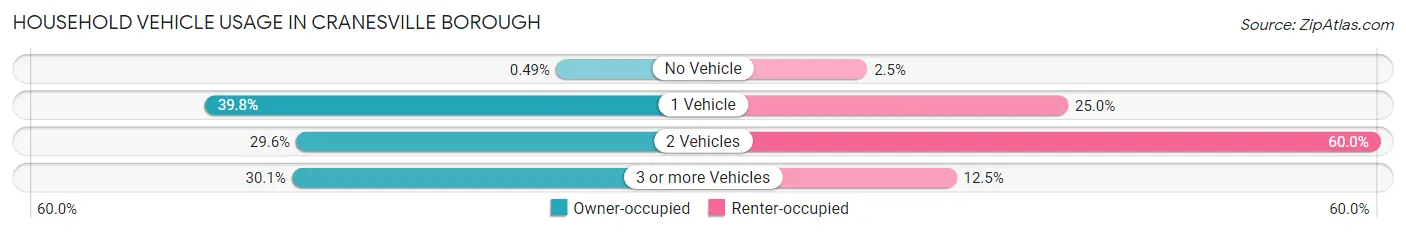
| Vehicles per Household | Owner-occupied | Renter-occupied |
| No Vehicle | 1 (0.5%) | 1 (2.5%) |
| 1 Vehicle | 82 (39.8%) | 10 (25.0%) |
| 2 Vehicles | 61 (29.6%) | 24 (60.0%) |
| 3 or more Vehicles | 62 (30.1%) | 5 (12.5%) |
| Total | 206 (100.0%) | 40 (100.0%) |
Real Estate & Mortgages in Cranesville borough
Real Estate and Mortgage Overview in Cranesville borough
| Characteristic | Without Mortgage | With Mortgage |
| Housing Units | 78 | 128 |
| Median Property Value | $125,000 | $103,400 |
| Median Household Income | $75,000 | $44 |
| Monthly Housing Costs | $485 | $7 |
| Real Estate Taxes | $1,219 | $0 |
Property Value by Mortgage Status in Cranesville borough
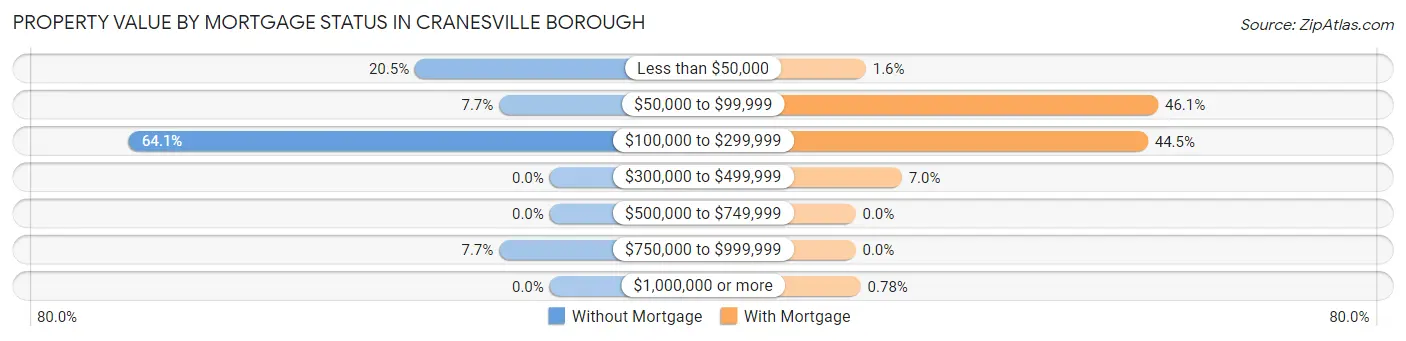
| Property Value | Without Mortgage | With Mortgage |
| Less than $50,000 | 16 (20.5%) | 2 (1.6%) |
| $50,000 to $99,999 | 6 (7.7%) | 59 (46.1%) |
| $100,000 to $299,999 | 50 (64.1%) | 57 (44.5%) |
| $300,000 to $499,999 | 0 (0.0%) | 9 (7.0%) |
| $500,000 to $749,999 | 0 (0.0%) | 0 (0.0%) |
| $750,000 to $999,999 | 6 (7.7%) | 0 (0.0%) |
| $1,000,000 or more | 0 (0.0%) | 1 (0.8%) |
| Total | 78 (100.0%) | 128 (100.0%) |
Household Income by Mortgage Status in Cranesville borough
| Household Income | Without Mortgage | With Mortgage |
| Less than $10,000 | 0 (0.0%) | 0 (0.0%) |
| $10,000 to $24,999 | 11 (14.1%) | 0 (0.0%) |
| $25,000 to $34,999 | 4 (5.1%) | 6 (4.7%) |
| $35,000 to $49,999 | 11 (14.1%) | 0 (0.0%) |
| $50,000 to $74,999 | 13 (16.7%) | 0 (0.0%) |
| $75,000 to $99,999 | 8 (10.3%) | 43 (33.6%) |
| $100,000 to $149,999 | 22 (28.2%) | 6 (4.7%) |
| $150,000 or more | 9 (11.5%) | 29 (22.7%) |
| Total | 78 (100.0%) | 128 (100.0%) |
Property Value to Household Income Ratio in Cranesville borough
| Value-to-Income Ratio | Without Mortgage | With Mortgage |
| Less than 2.0x | 51 (65.4%) | 125,000 (97,656.2%) |
| 2.0x to 2.9x | 11 (14.1%) | 95 (74.2%) |
| 3.0x to 3.9x | 7 (9.0%) | 20 (15.6%) |
| 4.0x or more | 9 (11.5%) | 10 (7.8%) |
| Total | 78 (100.0%) | 128 (100.0%) |
Real Estate Taxes by Mortgage Status in Cranesville borough
| Property Taxes | Without Mortgage | With Mortgage |
| Less than $800 | 24 (30.8%) | 0 (0.0%) |
| $800 to $1,499 | 18 (23.1%) | 2 (1.6%) |
| $800 to $1,499 | 24 (30.8%) | 85 (66.4%) |
| Total | 78 (100.0%) | 128 (100.0%) |
Health & Disability in Cranesville borough
Health Insurance Coverage by Age in Cranesville borough
| Age Bracket | With Coverage | Without Coverage |
| Under 6 Years | 55 (100.0%) | 0 (0.0%) |
| 6 to 18 Years | 164 (96.5%) | 6 (3.5%) |
| 19 to 25 Years | 120 (94.5%) | 7 (5.5%) |
| 26 to 34 Years | 58 (95.1%) | 3 (4.9%) |
| 35 to 44 Years | 58 (87.9%) | 8 (12.1%) |
| 45 to 54 Years | 140 (91.5%) | 13 (8.5%) |
| 55 to 64 Years | 109 (97.3%) | 3 (2.7%) |
| 65 to 74 Years | 23 (100.0%) | 0 (0.0%) |
| 75 Years and older | 33 (100.0%) | 0 (0.0%) |
| Total | 760 (95.0%) | 40 (5.0%) |
Health Insurance Coverage by Citizenship Status in Cranesville borough
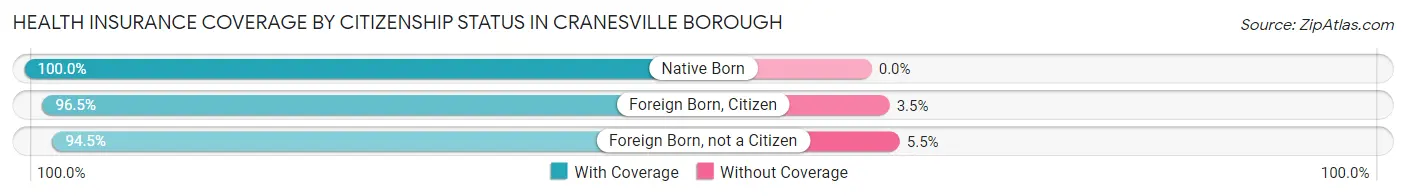
| Citizenship Status | With Coverage | Without Coverage |
| Native Born | 55 (100.0%) | 0 (0.0%) |
| Foreign Born, Citizen | 164 (96.5%) | 6 (3.5%) |
| Foreign Born, not a Citizen | 120 (94.5%) | 7 (5.5%) |
Health Insurance Coverage by Household Income in Cranesville borough
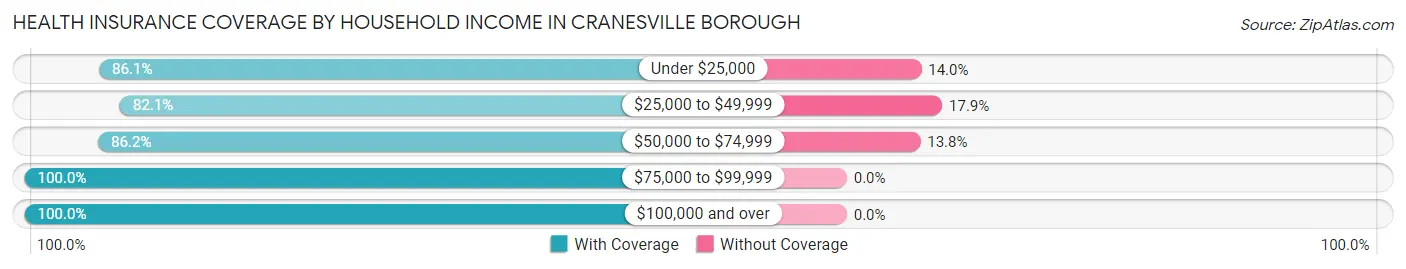
| Household Income | With Coverage | Without Coverage |
| Under $25,000 | 37 (86.1%) | 6 (14.0%) |
| $25,000 to $49,999 | 69 (82.1%) | 15 (17.9%) |
| $50,000 to $74,999 | 119 (86.2%) | 19 (13.8%) |
| $75,000 to $99,999 | 42 (100.0%) | 0 (0.0%) |
| $100,000 and over | 493 (100.0%) | 0 (0.0%) |
Public vs Private Health Insurance Coverage by Age in Cranesville borough
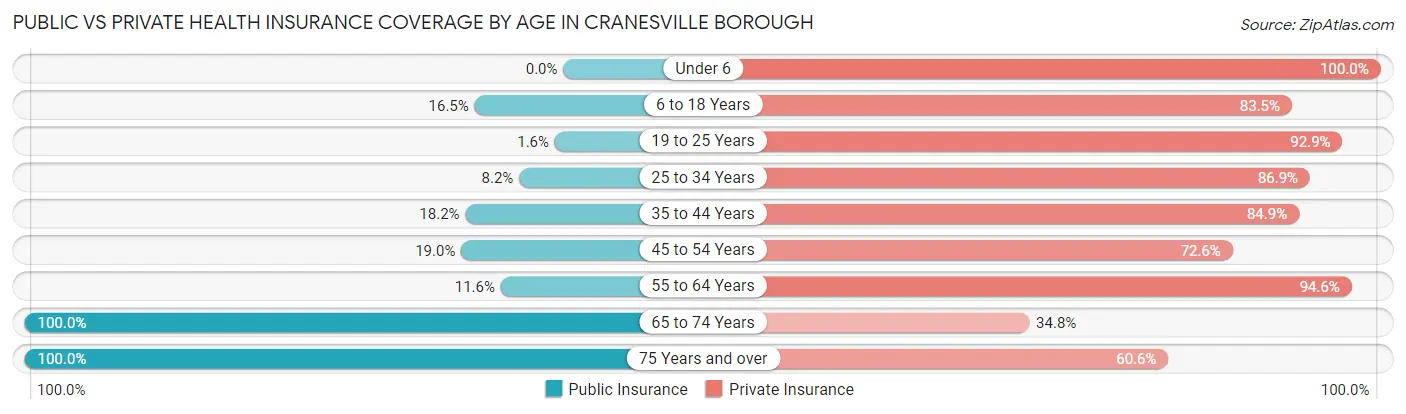
| Age Bracket | Public Insurance | Private Insurance |
| Under 6 | 0 (0.0%) | 55 (100.0%) |
| 6 to 18 Years | 28 (16.5%) | 142 (83.5%) |
| 19 to 25 Years | 2 (1.6%) | 118 (92.9%) |
| 25 to 34 Years | 5 (8.2%) | 53 (86.9%) |
| 35 to 44 Years | 12 (18.2%) | 56 (84.9%) |
| 45 to 54 Years | 29 (19.0%) | 111 (72.6%) |
| 55 to 64 Years | 13 (11.6%) | 106 (94.6%) |
| 65 to 74 Years | 23 (100.0%) | 8 (34.8%) |
| 75 Years and over | 33 (100.0%) | 20 (60.6%) |
| Total | 145 (18.1%) | 669 (83.6%) |
Disability Status by Sex by Age in Cranesville borough
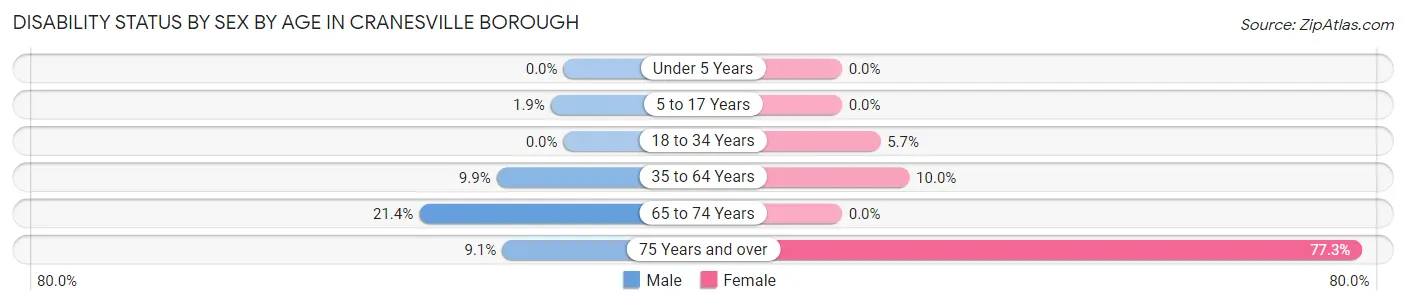
| Age Bracket | Male | Female |
| Under 5 Years | 0 (0.0%) | 0 (0.0%) |
| 5 to 17 Years | 2 (1.9%) | 0 (0.0%) |
| 18 to 34 Years | 0 (0.0%) | 4 (5.7%) |
| 35 to 64 Years | 15 (9.9%) | 18 (10.0%) |
| 65 to 74 Years | 3 (21.4%) | 0 (0.0%) |
| 75 Years and over | 1 (9.1%) | 17 (77.3%) |
Disability Class by Sex by Age in Cranesville borough
Disability Class: Hearing Difficulty
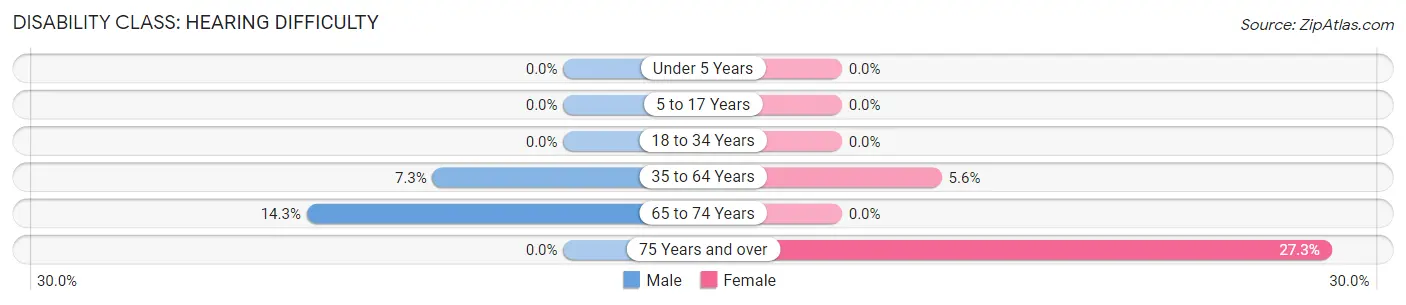
| Age Bracket | Male | Female |
| Under 5 Years | 0 (0.0%) | 0 (0.0%) |
| 5 to 17 Years | 0 (0.0%) | 0 (0.0%) |
| 18 to 34 Years | 0 (0.0%) | 0 (0.0%) |
| 35 to 64 Years | 11 (7.3%) | 10 (5.6%) |
| 65 to 74 Years | 2 (14.3%) | 0 (0.0%) |
| 75 Years and over | 0 (0.0%) | 6 (27.3%) |
Disability Class: Vision Difficulty
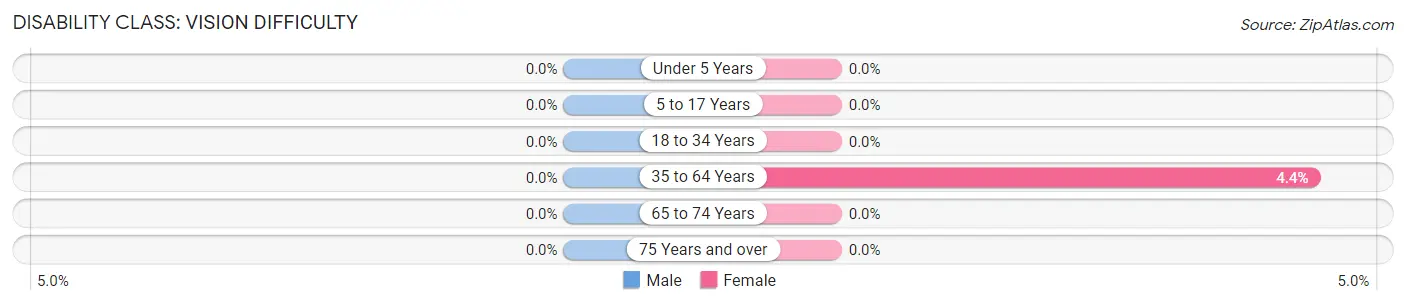
| Age Bracket | Male | Female |
| Under 5 Years | 0 (0.0%) | 0 (0.0%) |
| 5 to 17 Years | 0 (0.0%) | 0 (0.0%) |
| 18 to 34 Years | 0 (0.0%) | 0 (0.0%) |
| 35 to 64 Years | 0 (0.0%) | 8 (4.4%) |
| 65 to 74 Years | 0 (0.0%) | 0 (0.0%) |
| 75 Years and over | 0 (0.0%) | 0 (0.0%) |
Disability Class: Cognitive Difficulty
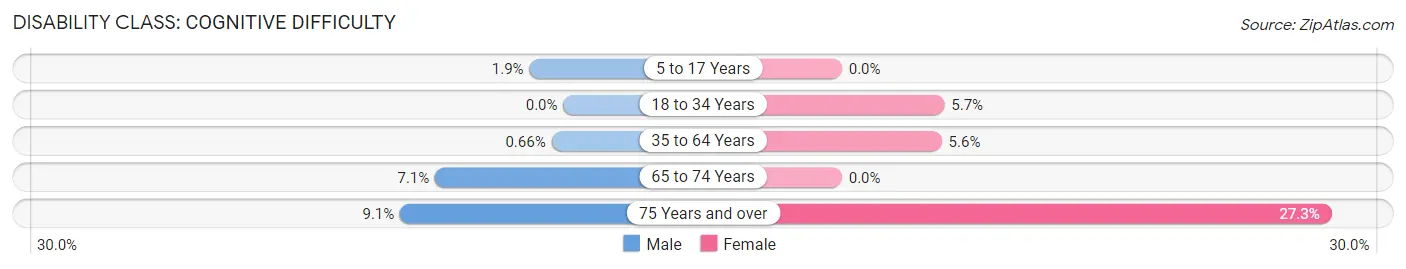
| Age Bracket | Male | Female |
| 5 to 17 Years | 2 (1.9%) | 0 (0.0%) |
| 18 to 34 Years | 0 (0.0%) | 4 (5.7%) |
| 35 to 64 Years | 1 (0.7%) | 10 (5.6%) |
| 65 to 74 Years | 1 (7.1%) | 0 (0.0%) |
| 75 Years and over | 1 (9.1%) | 6 (27.3%) |
Disability Class: Ambulatory Difficulty
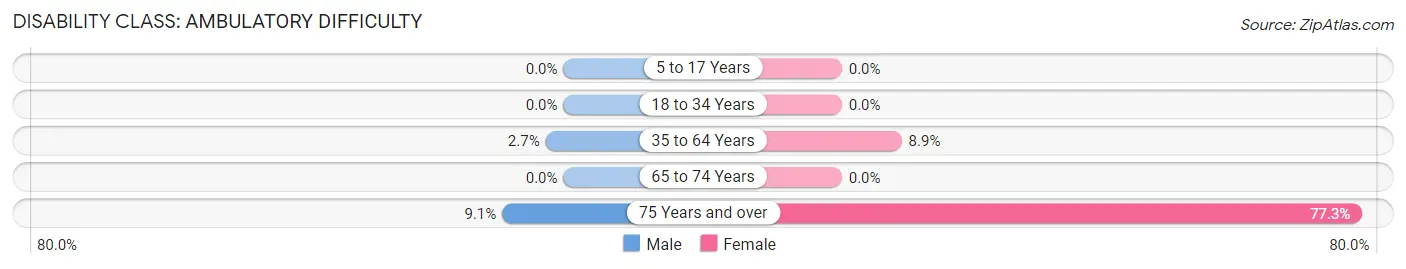
| Age Bracket | Male | Female |
| 5 to 17 Years | 0 (0.0%) | 0 (0.0%) |
| 18 to 34 Years | 0 (0.0%) | 0 (0.0%) |
| 35 to 64 Years | 4 (2.6%) | 16 (8.9%) |
| 65 to 74 Years | 0 (0.0%) | 0 (0.0%) |
| 75 Years and over | 1 (9.1%) | 17 (77.3%) |
Disability Class: Self-Care Difficulty
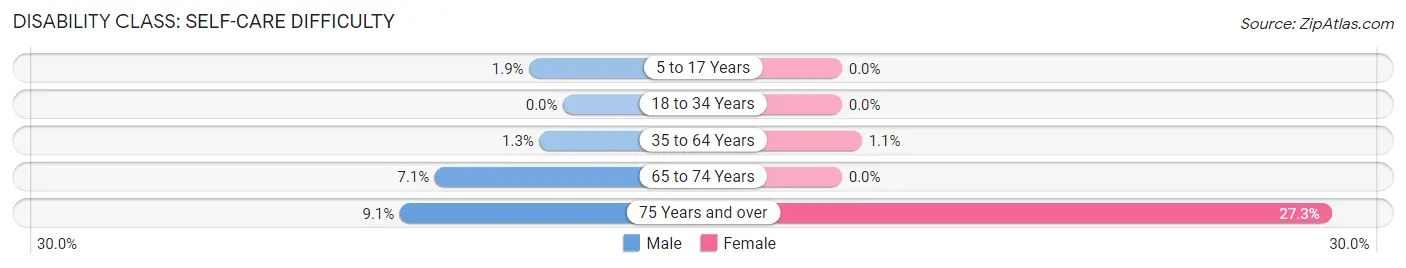
| Age Bracket | Male | Female |
| 5 to 17 Years | 2 (1.9%) | 0 (0.0%) |
| 18 to 34 Years | 0 (0.0%) | 0 (0.0%) |
| 35 to 64 Years | 2 (1.3%) | 2 (1.1%) |
| 65 to 74 Years | 1 (7.1%) | 0 (0.0%) |
| 75 Years and over | 1 (9.1%) | 6 (27.3%) |
Technology Access in Cranesville borough
Computing Device Access in Cranesville borough
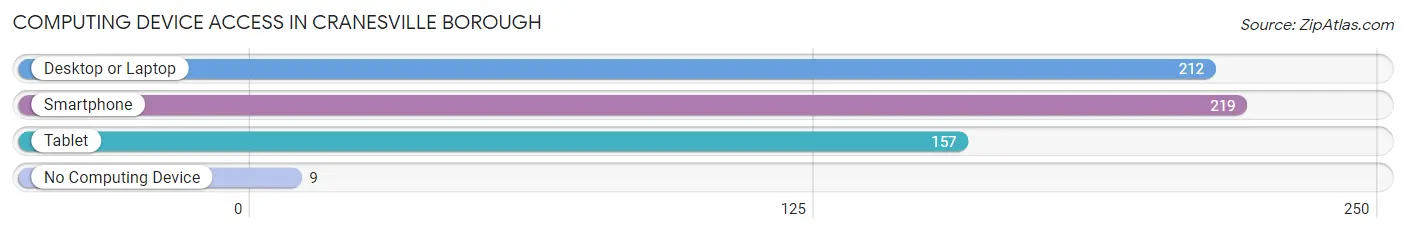
| Device Type | # Households | % Households |
| Desktop or Laptop | 212 | 86.2% |
| Smartphone | 219 | 89.0% |
| Tablet | 157 | 63.8% |
| No Computing Device | 9 | 3.7% |
| Total | 246 | 100.0% |
Internet Access in Cranesville borough
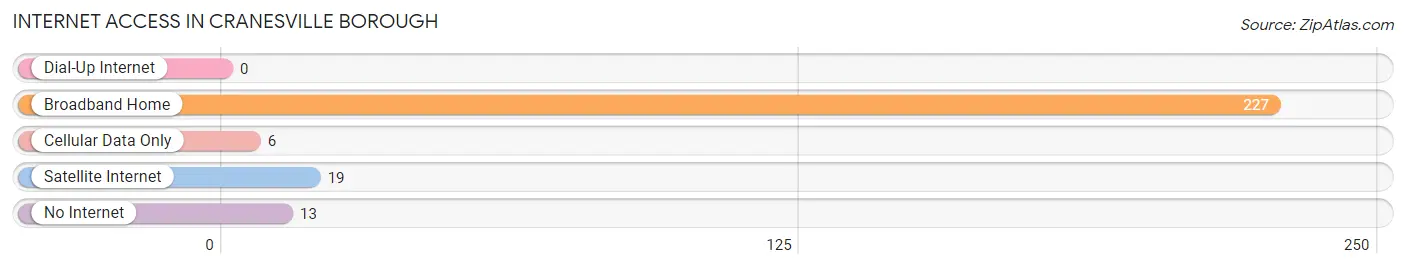
| Internet Type | # Households | % Households |
| Dial-Up Internet | 0 | 0.0% |
| Broadband Home | 227 | 92.3% |
| Cellular Data Only | 6 | 2.4% |
| Satellite Internet | 19 | 7.7% |
| No Internet | 13 | 5.3% |
| Total | 246 | 100.0% |
Cranesville borough Summary
Cranesville Borough is a small borough located in Erie County, Pennsylvania. It is situated in the northwest corner of the county, just south of the city of Erie. The borough was incorporated in 1876 and has a population of approximately 1,000 people.
History
Cranesville Borough was first settled in the early 1800s by a group of German immigrants. The area was originally known as “Cranesville” after the cranberry bogs that were found in the area. The first post office was established in 1876 and the borough was officially incorporated in 1876.
The borough was primarily an agricultural community until the late 19th century when the railroad was built through the area. This allowed for the development of industry and commerce in the area. The borough was home to several factories, including a paper mill, a brickyard, and a sawmill.
Geography
Cranesville Borough is located in the northwest corner of Erie County, Pennsylvania. It is situated on the eastern shore of Lake Erie, just south of the city of Erie. The borough is bordered by the townships of Amity, Concord, and Girard. The borough covers an area of 1.2 square miles and has a population of approximately 1,000 people.
The terrain of the borough is mostly flat, with some rolling hills in the northern part of the borough. The borough is located in a humid continental climate zone, with cold winters and warm summers. The average annual temperature is around 50 degrees Fahrenheit.
Economy
Cranesville Borough’s economy is primarily based on manufacturing and services. The borough is home to several factories, including a paper mill, a brickyard, and a sawmill. The borough also has several retail stores, restaurants, and other businesses.
The borough is also home to several educational institutions, including a public school district and a community college. The borough is also home to a number of parks and recreational facilities, including a public pool, a golf course, and a skate park.
Demographics
As of the 2010 census, the population of Cranesville Borough was 1,000 people. The racial makeup of the borough was 97.2% White, 0.7% African American, 0.3% Native American, 0.3% Asian, and 1.5% from other races. The median household income was $37,500 and the median family income was $45,000.
The borough is home to a number of religious institutions, including several churches and a synagogue. The borough is also home to a number of civic organizations, including a volunteer fire department and a community center.
Conclusion
Cranesville Borough is a small borough located in Erie County, Pennsylvania. It is situated in the northwest corner of the county, just south of the city of Erie. The borough was incorporated in 1876 and has a population of approximately 1,000 people. The borough’s economy is primarily based on manufacturing and services. The borough is also home to several educational institutions, parks, and recreational facilities. The racial makeup of the borough is 97.2% White, 0.7% African American, 0.3% Native American, 0.3% Asian, and 1.5% from other races. The median household income was $37,500 and the median family income was $45,000.
Common Questions
What is Per Capita Income in Cranesville borough?
Per Capita income in Cranesville borough is $32,319.
What is the Median Family Income in Cranesville borough?
Median Family Income in Cranesville borough is $106,500.
What is the Median Household income in Cranesville borough?
Median Household Income in Cranesville borough is $75,000.
What is Income or Wage Gap in Cranesville borough?
Income or Wage Gap in Cranesville borough is 52.9%.
Women in Cranesville borough earn 47.1 cents for every dollar earned by a man.
What is Family Income Deficit in Cranesville borough?
Family Income Deficit in Cranesville borough is $12,792.
Families that are below poverty line in Cranesville borough earn $12,792 less on average than the poverty threshold level.
What is Inequality or Gini Index in Cranesville borough?
Inequality or Gini Index in Cranesville borough is 0.48.
What is the Total Population of Cranesville borough?
Total Population of Cranesville borough is 800.
What is the Total Male Population of Cranesville borough?
Total Male Population of Cranesville borough is 443.
What is the Total Female Population of Cranesville borough?
Total Female Population of Cranesville borough is 357.
What is the Ratio of Males per 100 Females in Cranesville borough?
There are 124.09 Males per 100 Females in Cranesville borough.
What is the Ratio of Females per 100 Males in Cranesville borough?
There are 80.59 Females per 100 Males in Cranesville borough.
What is the Median Population Age in Cranesville borough?
Median Population Age in Cranesville borough is 32.6 Years.
What is the Average Family Size in Cranesville borough
Average Family Size in Cranesville borough is 3.7 People.
What is the Average Household Size in Cranesville borough
Average Household Size in Cranesville borough is 3.2 People.
How Large is the Labor Force in Cranesville borough?
There are 356 People in the Labor Forcein in Cranesville borough.
What is the Percentage of People in the Labor Force in Cranesville borough?
56.9% of People are in the Labor Force in Cranesville borough.