Bairdford, PA Map & Demographics
Bairdford Map
Bairdford Overview
$37,157
PER CAPITA INCOME
$114,632
AVG FAMILY INCOME
33.4%
WAGE / INCOME GAP [ % ]
66.6¢/ $1
WAGE / INCOME GAP [ $ ]
0.45
INEQUALITY / GINI INDEX
653
TOTAL POPULATION
341
MALE POPULATION
312
FEMALE POPULATION
109.29
MALES / 100 FEMALES
91.50
FEMALES / 100 MALES
51.4
MEDIAN AGE
2.8
AVG FAMILY SIZE
2.5
AVG HOUSEHOLD SIZE
356
LABOR FORCE [ PEOPLE ]
66.9%
PERCENT IN LABOR FORCE
Bairdford Zip Codes
Bairdford Area Codes
Income in Bairdford
Income Overview in Bairdford
| Characteristic | Number | Measure |
| Per Capita Income | 653 | $37,157 |
| Median Family Income | 195 | $114,632 |
| Mean Family Income | 195 | $115,872 |
| Median Household Income | 256 | $0 |
| Mean Household Income | 256 | $95,671 |
| Income Deficit | 195 | $0 |
| Wage / Income Gap (%) | 653 | 33.36% |
| Wage / Income Gap ($) | 653 | 66.64¢ per $1 |
| Gini / Inequality Index | 653 | 0.45 |
Earnings by Sex in Bairdford
Average Earnings in Bairdford are $43,456, $62,353 for men and $41,550 for women, a difference of 33.4%.
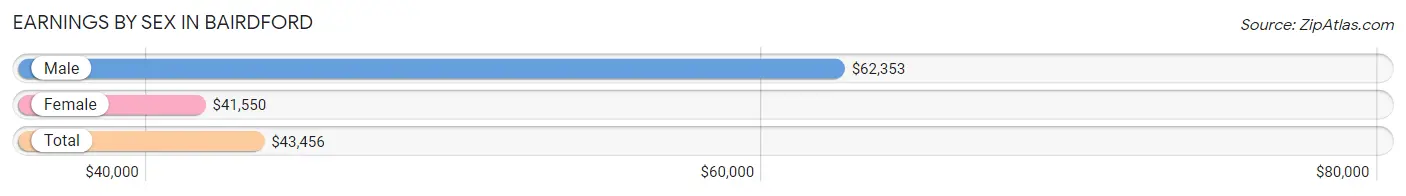
| Sex | Number | Average Earnings |
| Male | 158 (42.4%) | $62,353 |
| Female | 215 (57.6%) | $41,550 |
| Total | 373 (100.0%) | $43,456 |
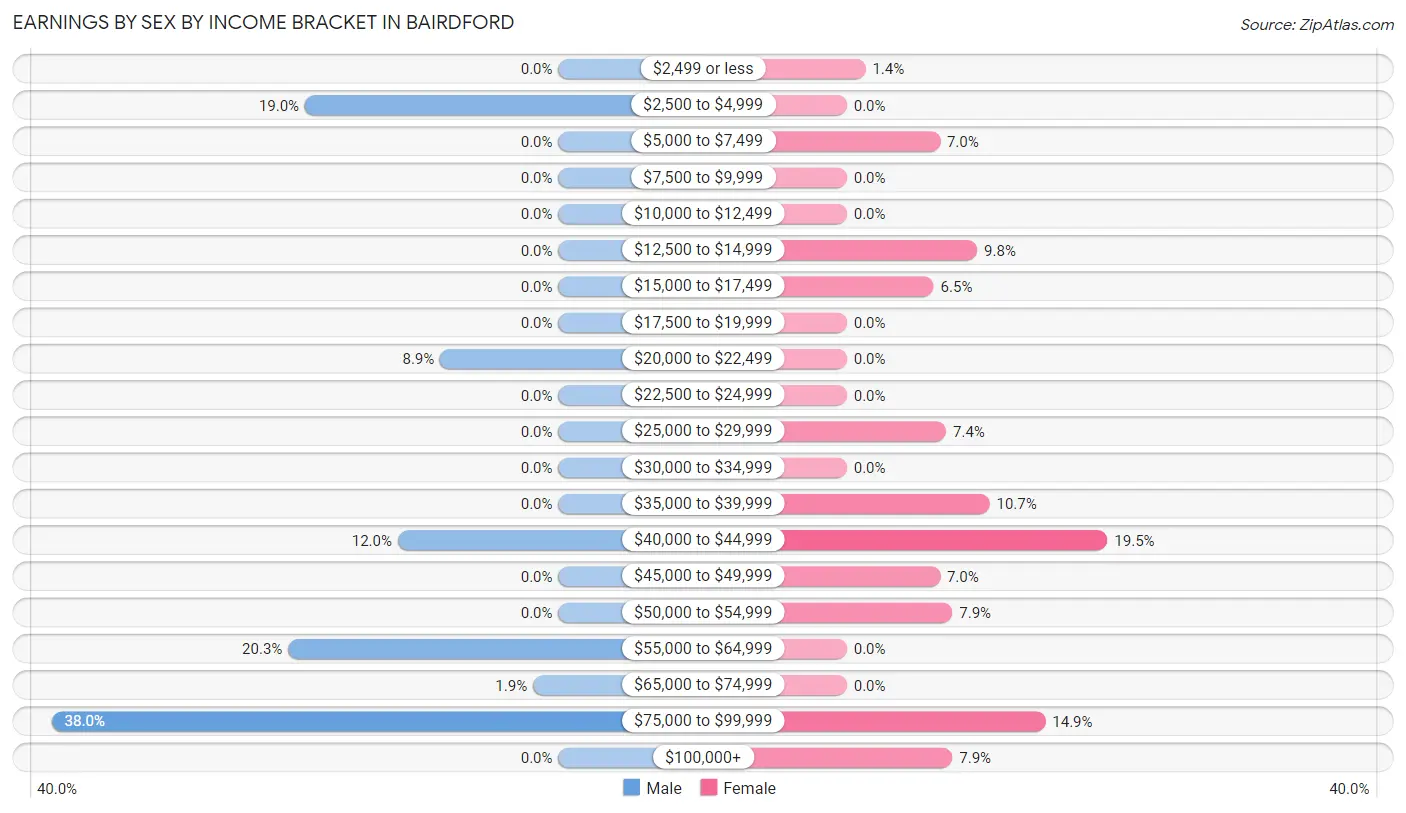
Earnings by Sex by Income Bracket in Bairdford
The most common earnings brackets in Bairdford are $75,000 to $99,999 for men (60 | 38.0%) and $40,000 to $44,999 for women (42 | 19.5%).
| Income | Male | Female |
| $2,499 or less | 0 (0.0%) | 3 (1.4%) |
| $2,500 to $4,999 | 30 (19.0%) | 0 (0.0%) |
| $5,000 to $7,499 | 0 (0.0%) | 15 (7.0%) |
| $7,500 to $9,999 | 0 (0.0%) | 0 (0.0%) |
| $10,000 to $12,499 | 0 (0.0%) | 0 (0.0%) |
| $12,500 to $14,999 | 0 (0.0%) | 21 (9.8%) |
| $15,000 to $17,499 | 0 (0.0%) | 14 (6.5%) |
| $17,500 to $19,999 | 0 (0.0%) | 0 (0.0%) |
| $20,000 to $22,499 | 14 (8.9%) | 0 (0.0%) |
| $22,500 to $24,999 | 0 (0.0%) | 0 (0.0%) |
| $25,000 to $29,999 | 0 (0.0%) | 16 (7.4%) |
| $30,000 to $34,999 | 0 (0.0%) | 0 (0.0%) |
| $35,000 to $39,999 | 0 (0.0%) | 23 (10.7%) |
| $40,000 to $44,999 | 19 (12.0%) | 42 (19.5%) |
| $45,000 to $49,999 | 0 (0.0%) | 15 (7.0%) |
| $50,000 to $54,999 | 0 (0.0%) | 17 (7.9%) |
| $55,000 to $64,999 | 32 (20.3%) | 0 (0.0%) |
| $65,000 to $74,999 | 3 (1.9%) | 0 (0.0%) |
| $75,000 to $99,999 | 60 (38.0%) | 32 (14.9%) |
| $100,000+ | 0 (0.0%) | 17 (7.9%) |
| Total | 158 (100.0%) | 215 (100.0%) |
Earnings by Sex by Educational Attainment in Bairdford
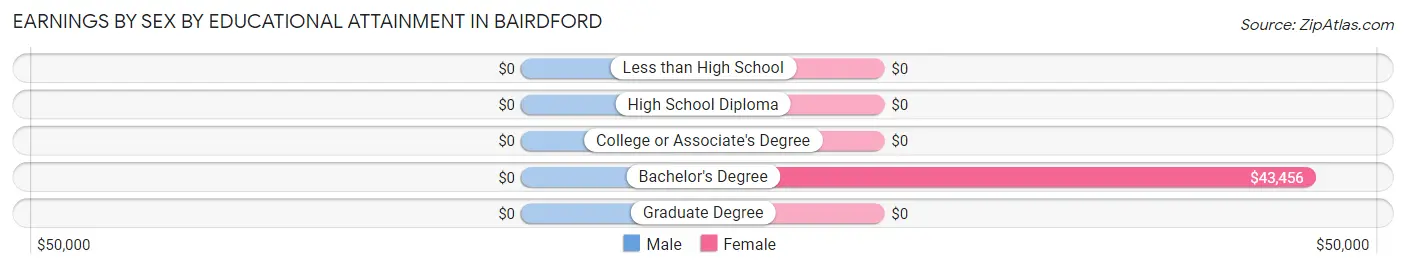
| Educational Attainment | Male Income | Female Income |
| Less than High School | - | - |
| High School Diploma | - | - |
| College or Associate's Degree | - | - |
| Bachelor's Degree | - | - |
| Graduate Degree | - | - |
| Total | $64,667 | $43,456 |
Family Income in Bairdford
Family Income Brackets in Bairdford
According to the Bairdford family income data, there are 85 families falling into the $100,000 to $149,999 income range, which is the most common income bracket and makes up 43.6% of all families.
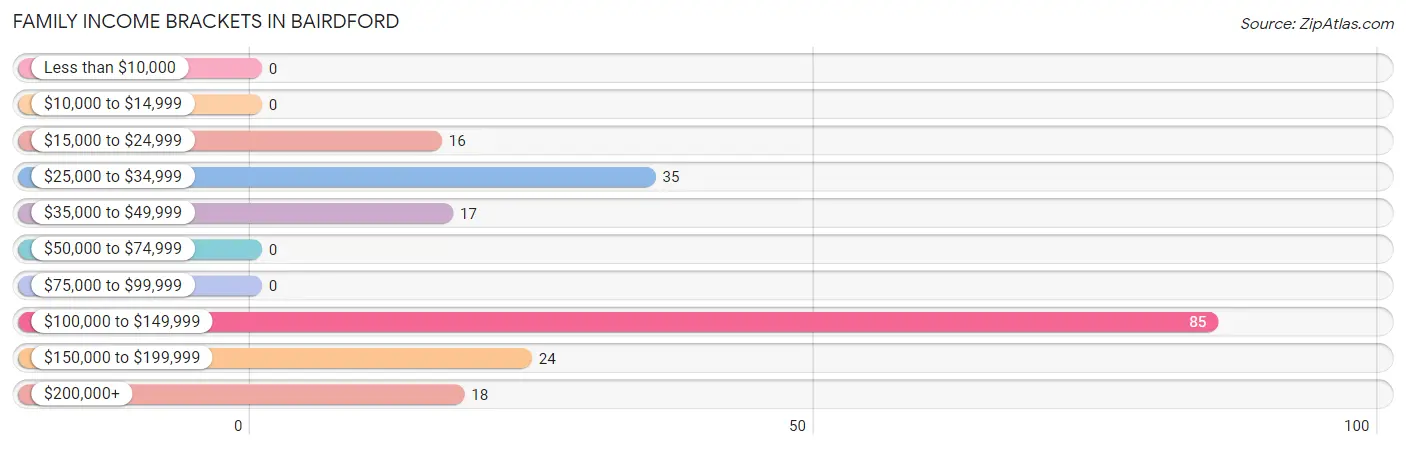
| Income Bracket | # Families | % Families |
| Less than $10,000 | 0 | 0.0% |
| $10,000 to $14,999 | 0 | 0.0% |
| $15,000 to $24,999 | 16 | 8.2% |
| $25,000 to $34,999 | 35 | 17.9% |
| $35,000 to $49,999 | 17 | 8.7% |
| $50,000 to $74,999 | 0 | 0.0% |
| $75,000 to $99,999 | 0 | 0.0% |
| $100,000 to $149,999 | 85 | 43.6% |
| $150,000 to $199,999 | 24 | 12.3% |
| $200,000+ | 18 | 9.2% |
Family Income by Famaliy Size in Bairdford
3-person families (51 | 26.2%) account for the highest median family income in Bairdford with $155,938 per family, while 3-person families (51 | 26.2%) have the highest median income of $51,979 per family member.
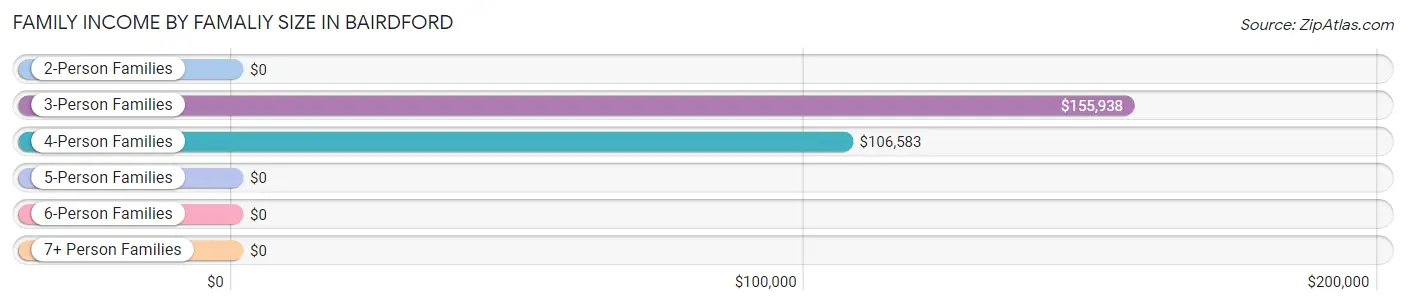
| Income Bracket | # Families | Median Income |
| 2-Person Families | 93 (47.7%) | $0 |
| 3-Person Families | 51 (26.2%) | $155,938 |
| 4-Person Families | 51 (26.2%) | $106,583 |
| 5-Person Families | 0 (0.0%) | $0 |
| 6-Person Families | 0 (0.0%) | $0 |
| 7+ Person Families | 0 (0.0%) | $0 |
| Total | 195 (100.0%) | $114,632 |
Family Income by Number of Earners in Bairdford
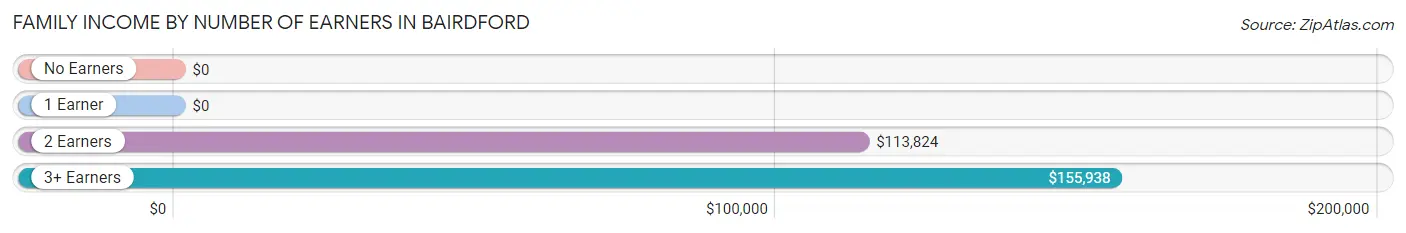
| Number of Earners | # Families | Median Income |
| No Earners | 35 (17.9%) | $0 |
| 1 Earner | 29 (14.9%) | $0 |
| 2 Earners | 80 (41.0%) | $113,824 |
| 3+ Earners | 51 (26.2%) | $155,938 |
| Total | 195 (100.0%) | $114,632 |
Household Income in Bairdford
Household Income Brackets in Bairdford
With 85 households falling in the category, the $100,000 to $149,999 income range is the most frequent in Bairdford, accounting for 33.2% of all households.
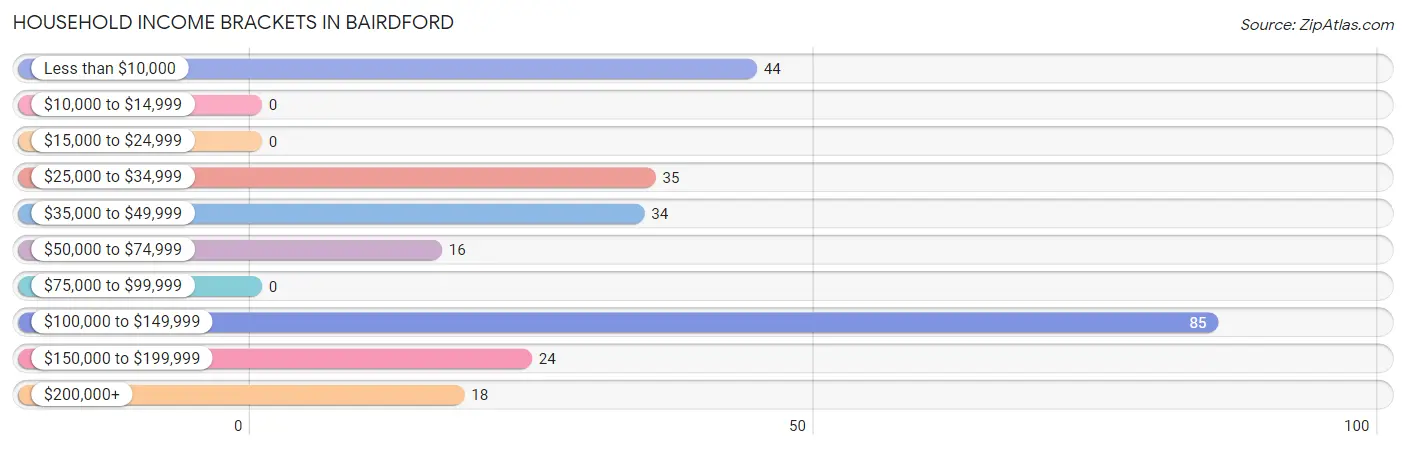
| Income Bracket | # Households | % Households |
| Less than $10,000 | 44 | 17.2% |
| $10,000 to $14,999 | 0 | 0.0% |
| $15,000 to $24,999 | 0 | 0.0% |
| $25,000 to $34,999 | 35 | 13.7% |
| $35,000 to $49,999 | 34 | 13.3% |
| $50,000 to $74,999 | 16 | 6.3% |
| $75,000 to $99,999 | 0 | 0.0% |
| $100,000 to $149,999 | 85 | 33.2% |
| $150,000 to $199,999 | 24 | 9.4% |
| $200,000+ | 18 | 7.0% |
Household Income by Householder Age in Bairdford
The median household income in Bairdford is $0, with the highest median household income of $131,063 found in the 25 to 44 years age bracket for the primary householder. A total of 47 households (18.4%) fall into this category.
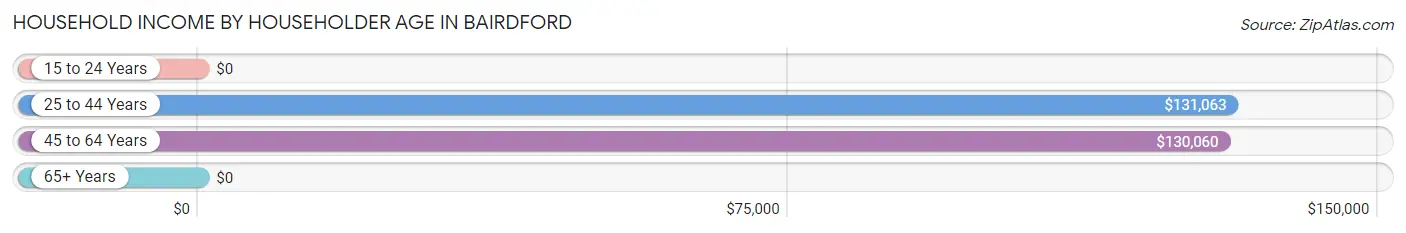
| Income Bracket | # Households | Median Income |
| 15 to 24 Years | 0 (0.0%) | $0 |
| 25 to 44 Years | 47 (18.4%) | $131,063 |
| 45 to 64 Years | 101 (39.5%) | $130,060 |
| 65+ Years | 108 (42.2%) | $0 |
| Total | 256 (100.0%) | $0 |
Poverty in Bairdford
Income Below Poverty by Sex and Age in Bairdford
With 14.1% poverty level for males and 23.4% for females among the residents of Bairdford, 15 year old males and 18 to 24 year old females are the most vulnerable to poverty, with 15 males (100.0%) and 29 females (90.6%) in their respective age groups living below the poverty level.
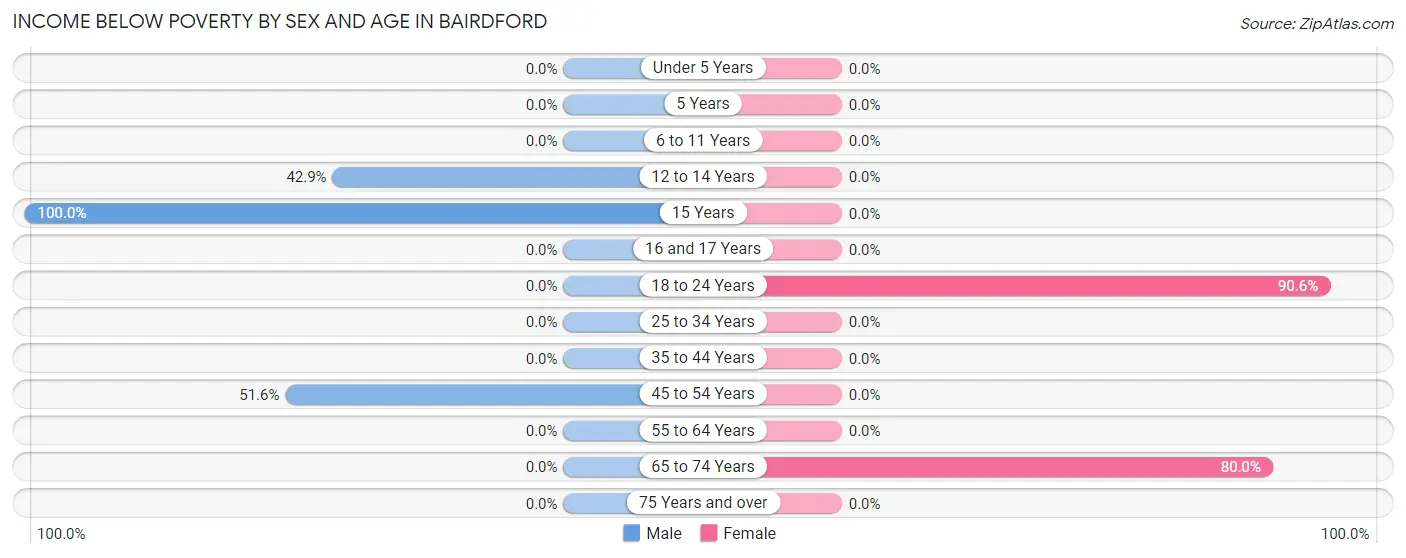
| Age Bracket | Male | Female |
| Under 5 Years | 0 (0.0%) | 0 (0.0%) |
| 5 Years | 0 (0.0%) | 0 (0.0%) |
| 6 to 11 Years | 0 (0.0%) | 0 (0.0%) |
| 12 to 14 Years | 15 (42.9%) | 0 (0.0%) |
| 15 Years | 15 (100.0%) | 0 (0.0%) |
| 16 and 17 Years | 0 (0.0%) | 0 (0.0%) |
| 18 to 24 Years | 0 (0.0%) | 29 (90.6%) |
| 25 to 34 Years | 0 (0.0%) | 0 (0.0%) |
| 35 to 44 Years | 0 (0.0%) | 0 (0.0%) |
| 45 to 54 Years | 16 (51.6%) | 0 (0.0%) |
| 55 to 64 Years | 0 (0.0%) | 0 (0.0%) |
| 65 to 74 Years | 0 (0.0%) | 44 (80.0%) |
| 75 Years and over | 0 (0.0%) | 0 (0.0%) |
| Total | 46 (14.1%) | 73 (23.4%) |
Income Above Poverty by Sex and Age in Bairdford
According to the poverty statistics in Bairdford, males aged under 5 years and females aged under 5 years are the age groups that are most secure financially, with 100.0% of males and 100.0% of females in these age groups living above the poverty line.
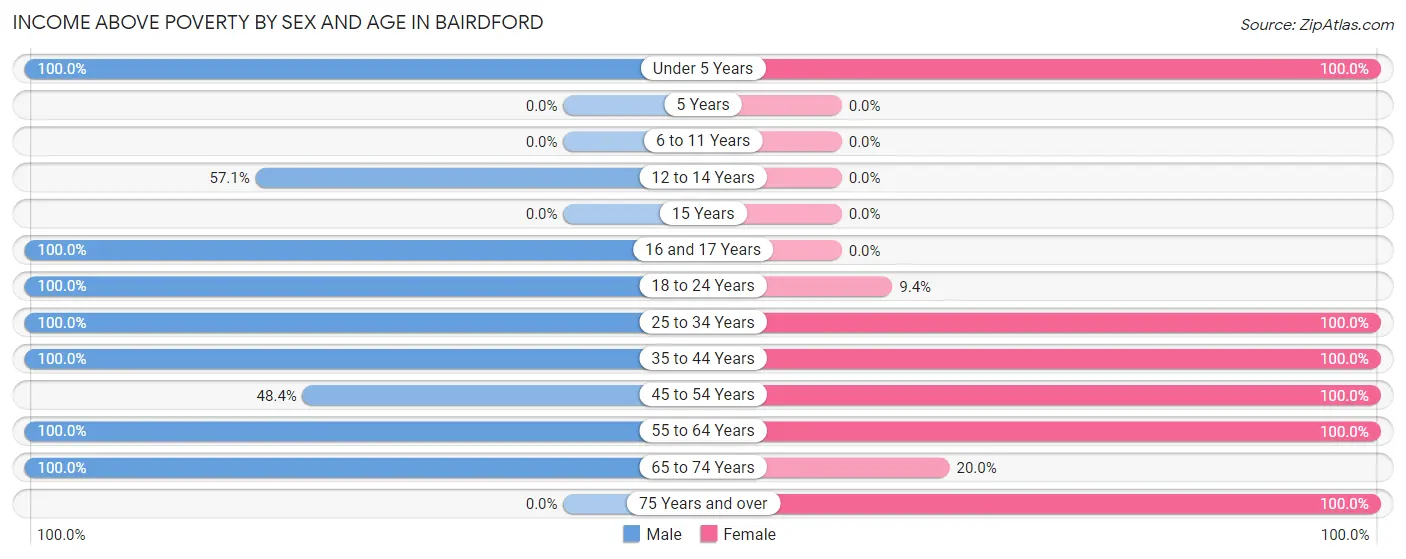
| Age Bracket | Male | Female |
| Under 5 Years | 37 (100.0%) | 19 (100.0%) |
| 5 Years | 0 (0.0%) | 0 (0.0%) |
| 6 to 11 Years | 0 (0.0%) | 0 (0.0%) |
| 12 to 14 Years | 20 (57.1%) | 0 (0.0%) |
| 15 Years | 0 (0.0%) | 0 (0.0%) |
| 16 and 17 Years | 14 (100.0%) | 0 (0.0%) |
| 18 to 24 Years | 14 (100.0%) | 3 (9.4%) |
| 25 to 34 Years | 15 (100.0%) | 20 (100.0%) |
| 35 to 44 Years | 31 (100.0%) | 44 (100.0%) |
| 45 to 54 Years | 15 (48.4%) | 46 (100.0%) |
| 55 to 64 Years | 70 (100.0%) | 37 (100.0%) |
| 65 to 74 Years | 64 (100.0%) | 11 (20.0%) |
| 75 Years and over | 0 (0.0%) | 59 (100.0%) |
| Total | 280 (85.9%) | 239 (76.6%) |
Income Below Poverty Among Married-Couple Families in Bairdford
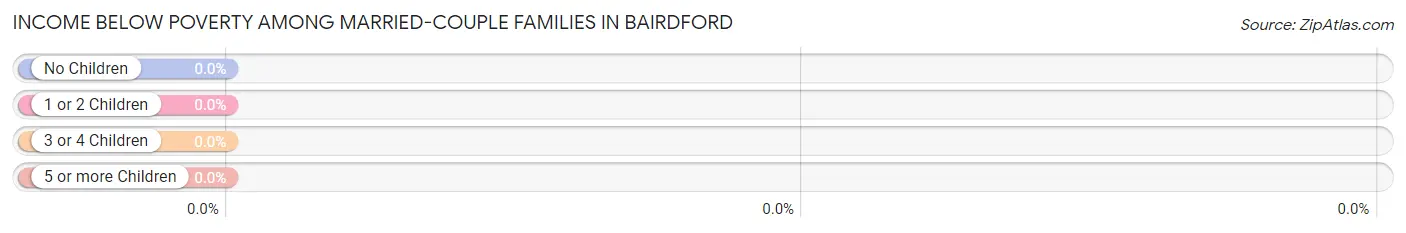
| Children | Above Poverty | Below Poverty |
| No Children | 129 (100.0%) | 0 (0.0%) |
| 1 or 2 Children | 50 (100.0%) | 0 (0.0%) |
| 3 or 4 Children | 0 (0.0%) | 0 (0.0%) |
| 5 or more Children | 0 (0.0%) | 0 (0.0%) |
| Total | 179 (100.0%) | 0 (0.0%) |
Income Below Poverty Among Single-Parent Households in Bairdford
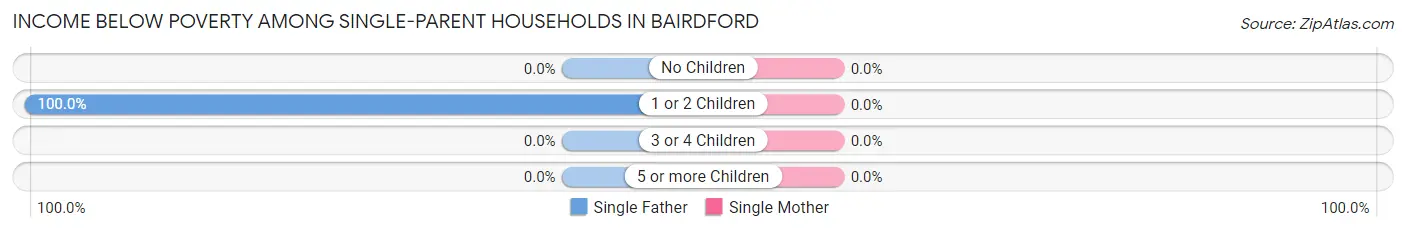
| Children | Single Father | Single Mother |
| No Children | 0 (0.0%) | 0 (0.0%) |
| 1 or 2 Children | 16 (100.0%) | 0 (0.0%) |
| 3 or 4 Children | 0 (0.0%) | 0 (0.0%) |
| 5 or more Children | 0 (0.0%) | 0 (0.0%) |
| Total | 16 (100.0%) | 0 (0.0%) |
Income Below Poverty Among Married-Couple vs Single-Parent Households in Bairdford
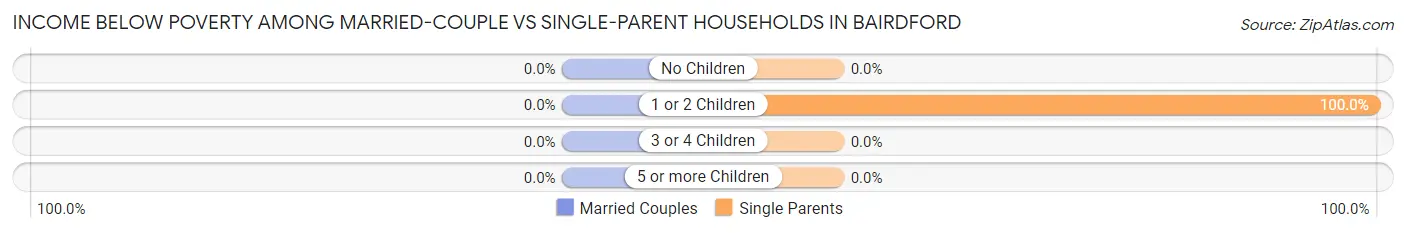
| Children | Married-Couple Families | Single-Parent Households |
| No Children | 0 (0.0%) | 0 (0.0%) |
| 1 or 2 Children | 0 (0.0%) | 16 (100.0%) |
| 3 or 4 Children | 0 (0.0%) | 0 (0.0%) |
| 5 or more Children | 0 (0.0%) | 0 (0.0%) |
| Total | 0 (0.0%) | 16 (100.0%) |
Race in Bairdford
The most populous races in Bairdford are White / Caucasian (599 | 91.7%), and Two or more Races (54 | 8.3%).
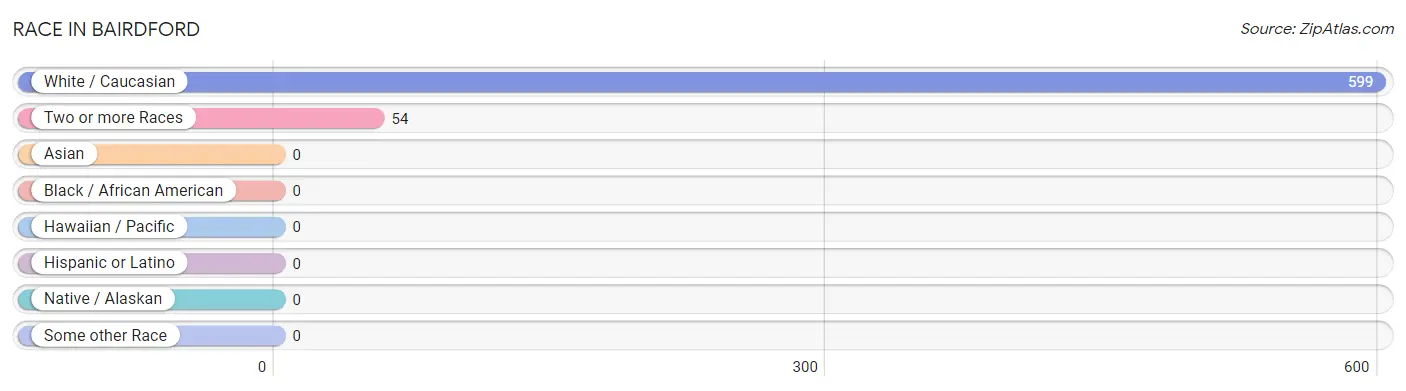
| Race | # Population | % Population |
| Asian | 0 | 0.0% |
| Black / African American | 0 | 0.0% |
| Hawaiian / Pacific | 0 | 0.0% |
| Hispanic or Latino | 0 | 0.0% |
| Native / Alaskan | 0 | 0.0% |
| White / Caucasian | 599 | 91.7% |
| Two or more Races | 54 | 8.3% |
| Some other Race | 0 | 0.0% |
| Total | 653 | 100.0% |
Ancestry in Bairdford
The most populous ancestries reported in Bairdford are German (169 | 25.9%), Irish (147 | 22.5%), Italian (140 | 21.4%), French (57 | 8.7%), and Scotch-Irish (41 | 6.3%), together accounting for 84.8% of all Bairdford residents.
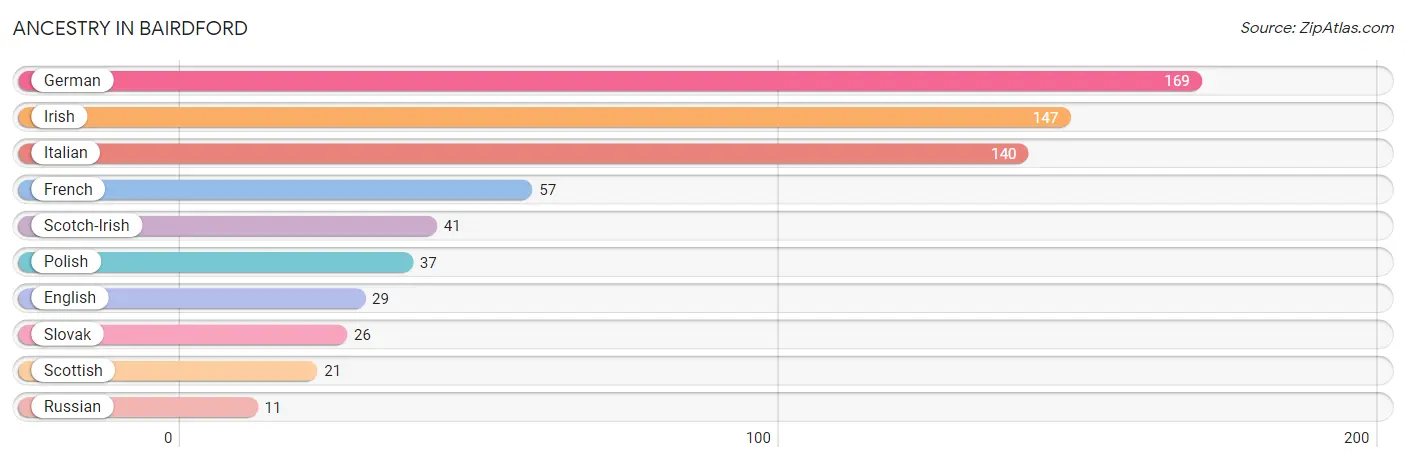
| Ancestry | # Population | % Population |
| English | 29 | 4.4% |
| French | 57 | 8.7% |
| German | 169 | 25.9% |
| Irish | 147 | 22.5% |
| Italian | 140 | 21.4% |
| Polish | 37 | 5.7% |
| Russian | 11 | 1.7% |
| Scotch-Irish | 41 | 6.3% |
| Scottish | 21 | 3.2% |
| Slovak | 26 | 4.0% | View All 10 Rows |
Immigrants in Bairdford

| Immigration Origin | # Population | % Population | View All 0 Rows |
Sex and Age in Bairdford
Sex and Age in Bairdford
The most populous age groups in Bairdford are 55 to 59 Years (70 | 20.5%) for men and 75 to 79 Years (59 | 18.9%) for women.
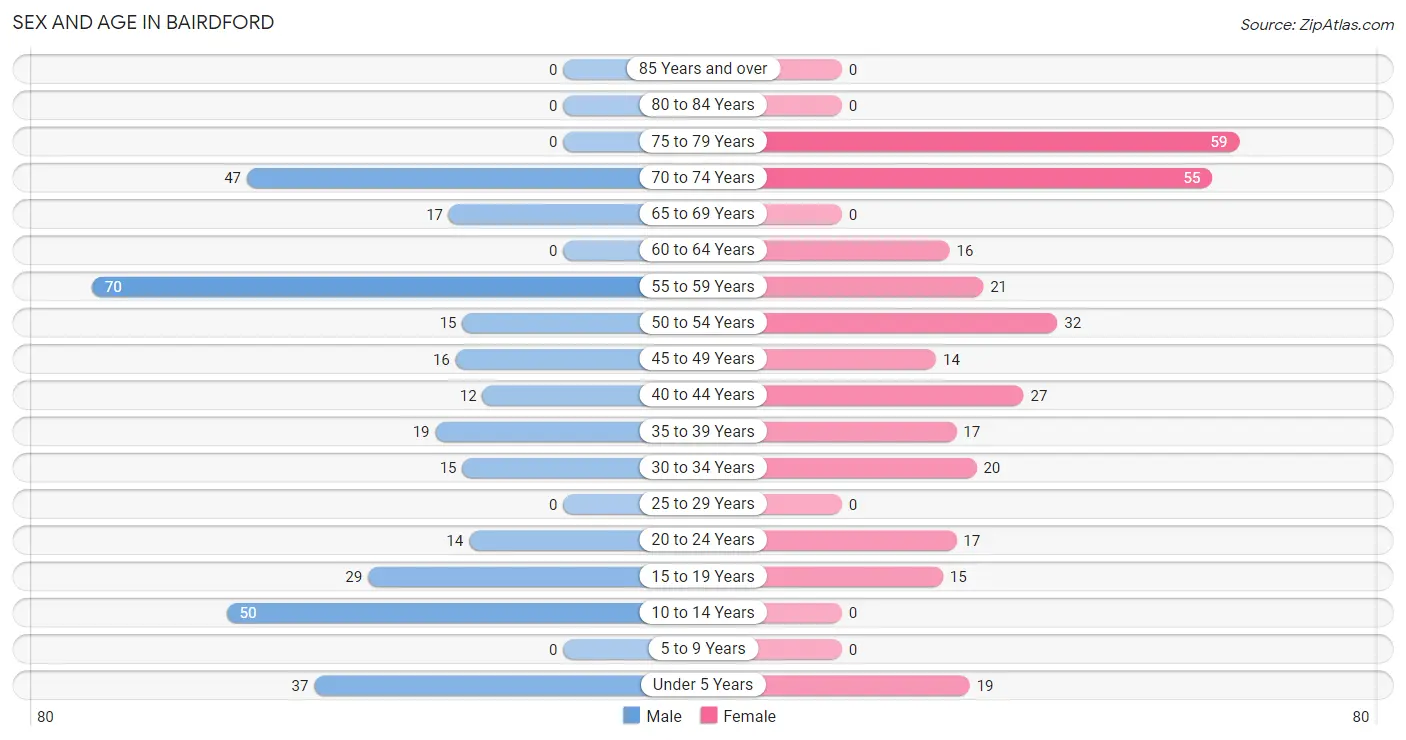
| Age Bracket | Male | Female |
| Under 5 Years | 37 (10.8%) | 19 (6.1%) |
| 5 to 9 Years | 0 (0.0%) | 0 (0.0%) |
| 10 to 14 Years | 50 (14.7%) | 0 (0.0%) |
| 15 to 19 Years | 29 (8.5%) | 15 (4.8%) |
| 20 to 24 Years | 14 (4.1%) | 17 (5.4%) |
| 25 to 29 Years | 0 (0.0%) | 0 (0.0%) |
| 30 to 34 Years | 15 (4.4%) | 20 (6.4%) |
| 35 to 39 Years | 19 (5.6%) | 17 (5.4%) |
| 40 to 44 Years | 12 (3.5%) | 27 (8.6%) |
| 45 to 49 Years | 16 (4.7%) | 14 (4.5%) |
| 50 to 54 Years | 15 (4.4%) | 32 (10.3%) |
| 55 to 59 Years | 70 (20.5%) | 21 (6.7%) |
| 60 to 64 Years | 0 (0.0%) | 16 (5.1%) |
| 65 to 69 Years | 17 (5.0%) | 0 (0.0%) |
| 70 to 74 Years | 47 (13.8%) | 55 (17.6%) |
| 75 to 79 Years | 0 (0.0%) | 59 (18.9%) |
| 80 to 84 Years | 0 (0.0%) | 0 (0.0%) |
| 85 Years and over | 0 (0.0%) | 0 (0.0%) |
| Total | 341 (100.0%) | 312 (100.0%) |
Families and Households in Bairdford
Median Family Size in Bairdford
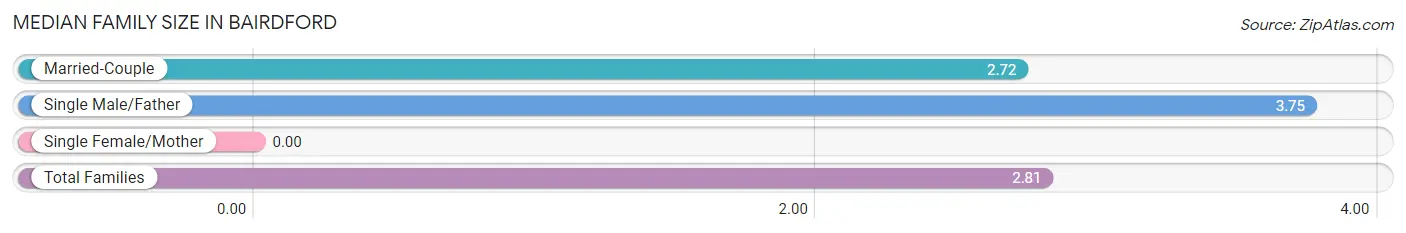
| Family Type | # Families | Family Size |
| Married-Couple | 179 (91.8%) | 2.72 |
| Single Male/Father | 16 (8.2%) | 3.75 |
| Single Female/Mother | 0 (0.0%) | - |
| Total Families | 195 (100.0%) | 2.81 |
Median Household Size in Bairdford
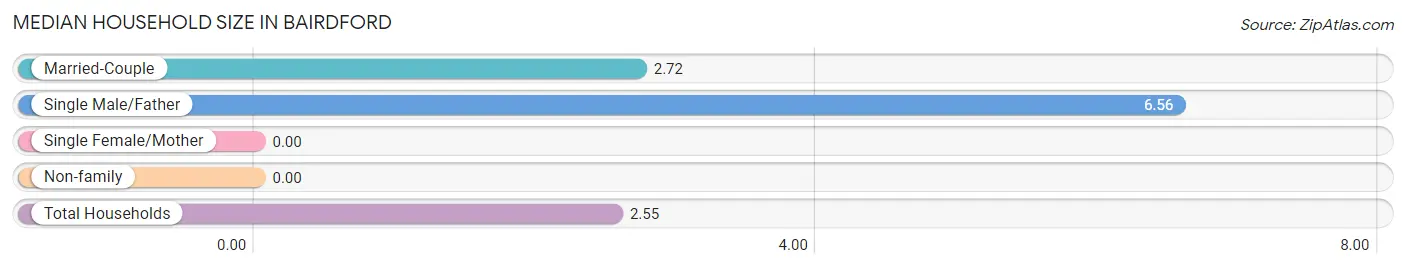
| Household Type | # Households | Household Size |
| Married-Couple | 179 (69.9%) | 2.72 |
| Single Male/Father | 16 (6.2%) | 6.56 |
| Single Female/Mother | 0 (0.0%) | - |
| Non-family | 61 (23.8%) | - |
| Total Households | 256 (100.0%) | 2.55 |
Household Size by Marriage Status in Bairdford
Out of a total of 256 households in Bairdford, 195 (76.2%) are family households, while 61 (23.8%) are nonfamily households. The most numerous type of family households are 2-person households, comprising 93, and the most common type of nonfamily households are 1-person households, comprising 61.
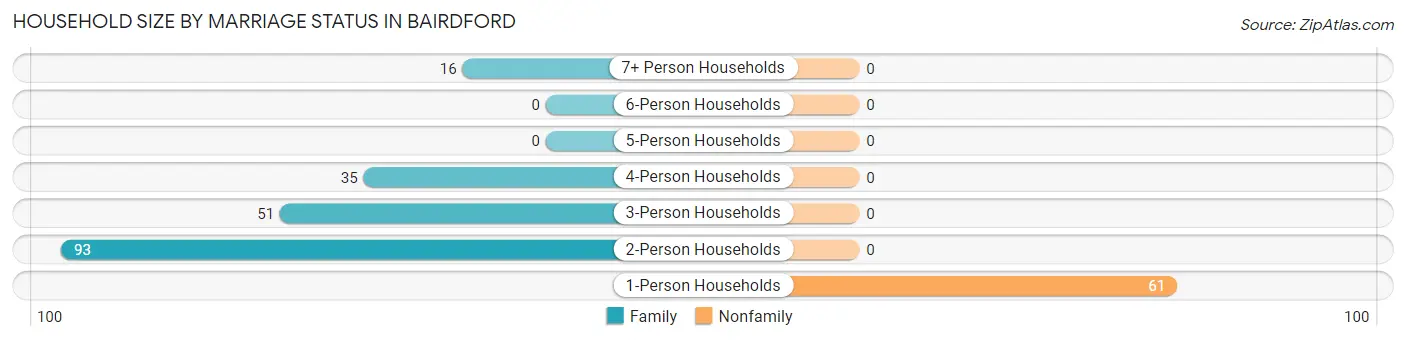
| Household Size | Family Households | Nonfamily Households |
| 1-Person Households | - | 61 (23.8%) |
| 2-Person Households | 93 (36.3%) | 0 (0.0%) |
| 3-Person Households | 51 (19.9%) | 0 (0.0%) |
| 4-Person Households | 35 (13.7%) | 0 (0.0%) |
| 5-Person Households | 0 (0.0%) | 0 (0.0%) |
| 6-Person Households | 0 (0.0%) | 0 (0.0%) |
| 7+ Person Households | 16 (6.2%) | 0 (0.0%) |
| Total | 195 (76.2%) | 61 (23.8%) |
Female Fertility in Bairdford
Fertility by Age in Bairdford
Average fertility rate in Bairdford is 155.0 births per 1,000 women. Women in the age bracket of 35 to 50 years have the highest fertility rate with 293.0 births per 1,000 women. Women in the age bracket of 35 to 50 years acount for 100.0% of all women with births.
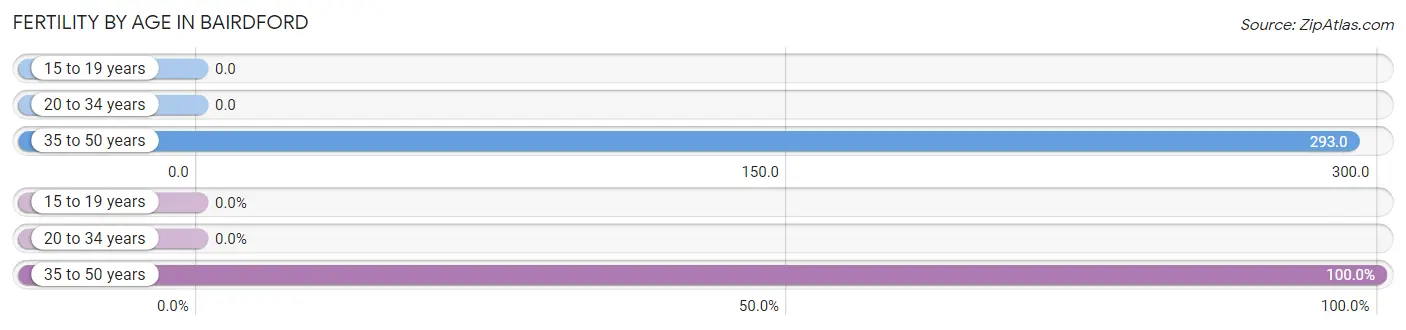
| Age Bracket | Women with Births | Births / 1,000 Women |
| 15 to 19 years | 0 (0.0%) | 0.0 |
| 20 to 34 years | 0 (0.0%) | 0.0 |
| 35 to 50 years | 17 (100.0%) | 293.0 |
| Total | 17 (100.0%) | 155.0 |
Fertility by Age by Marriage Status in Bairdford
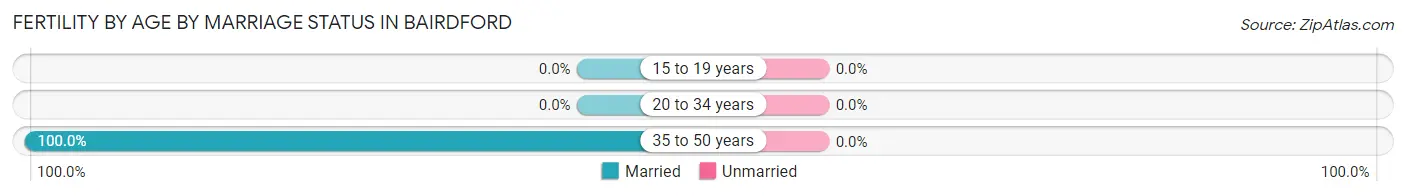
| Age Bracket | Married | Unmarried |
| 15 to 19 years | 0 (0.0%) | 0 (0.0%) |
| 20 to 34 years | 0 (0.0%) | 0 (0.0%) |
| 35 to 50 years | 17 (100.0%) | 0 (0.0%) |
| Total | 17 (100.0%) | 0 (0.0%) |
Fertility by Education in Bairdford
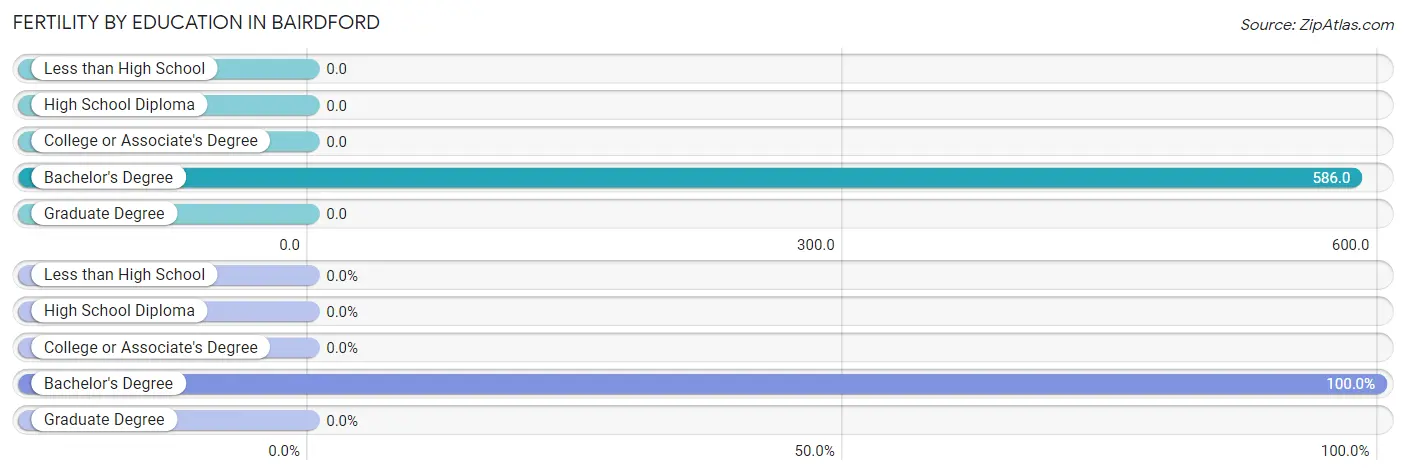
| Educational Attainment | Women with Births | Births / 1,000 Women |
| Less than High School | 0 (0.0%) | 0.0 |
| High School Diploma | 0 (0.0%) | 0.0 |
| College or Associate's Degree | 0 (0.0%) | 0.0 |
| Bachelor's Degree | 17 (100.0%) | 586.0 |
| Graduate Degree | 0 (0.0%) | 0.0 |
| Total | 17 (100.0%) | 155.0 |
Fertility by Education by Marriage Status in Bairdford
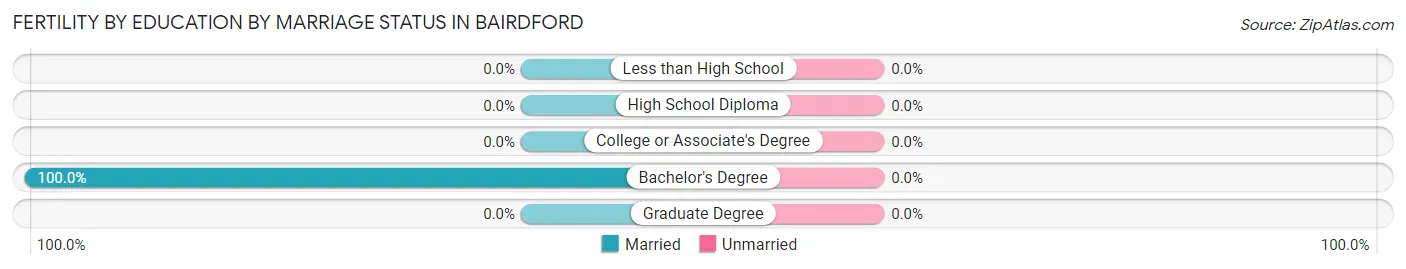
| Educational Attainment | Married | Unmarried |
| Less than High School | 0 (0.0%) | 0 (0.0%) |
| High School Diploma | 0 (0.0%) | 0 (0.0%) |
| College or Associate's Degree | 0 (0.0%) | 0 (0.0%) |
| Bachelor's Degree | 17 (100.0%) | 0 (0.0%) |
| Graduate Degree | 0 (0.0%) | 0 (0.0%) |
| Total | 17 (100.0%) | 0 (0.0%) |
Employment Characteristics in Bairdford
Employment by Class of Employer in Bairdford
Among the 356 employed individuals in Bairdford, private company employees (270 | 75.8%), not-for-profit organizations (29 | 8.2%), and self-employed (not incorporated) (28 | 7.9%) make up the most common classes of employment.
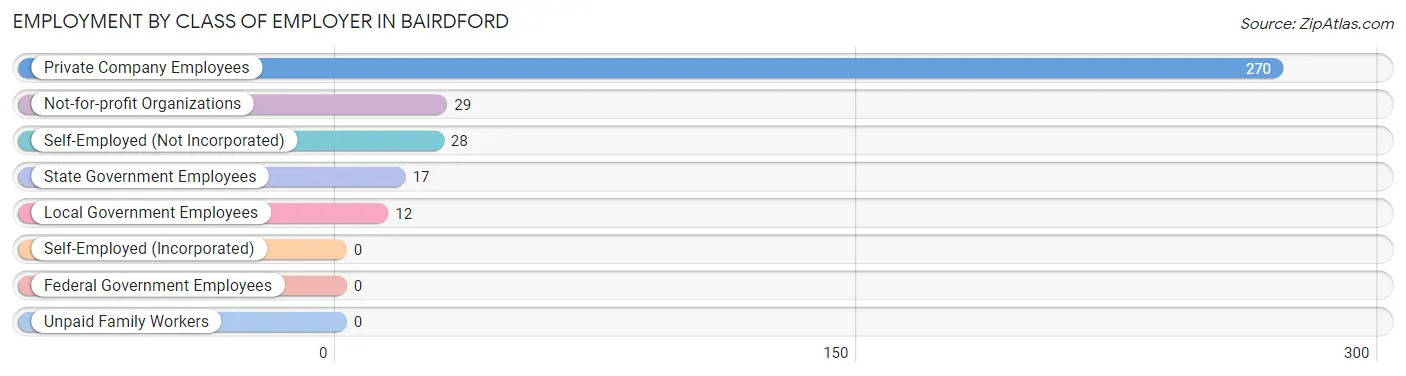
| Employer Class | # Employees | % Employees |
| Private Company Employees | 270 | 75.8% |
| Self-Employed (Incorporated) | 0 | 0.0% |
| Self-Employed (Not Incorporated) | 28 | 7.9% |
| Not-for-profit Organizations | 29 | 8.2% |
| Local Government Employees | 12 | 3.4% |
| State Government Employees | 17 | 4.8% |
| Federal Government Employees | 0 | 0.0% |
| Unpaid Family Workers | 0 | 0.0% |
| Total | 356 | 100.0% |
Employment Status by Age in Bairdford
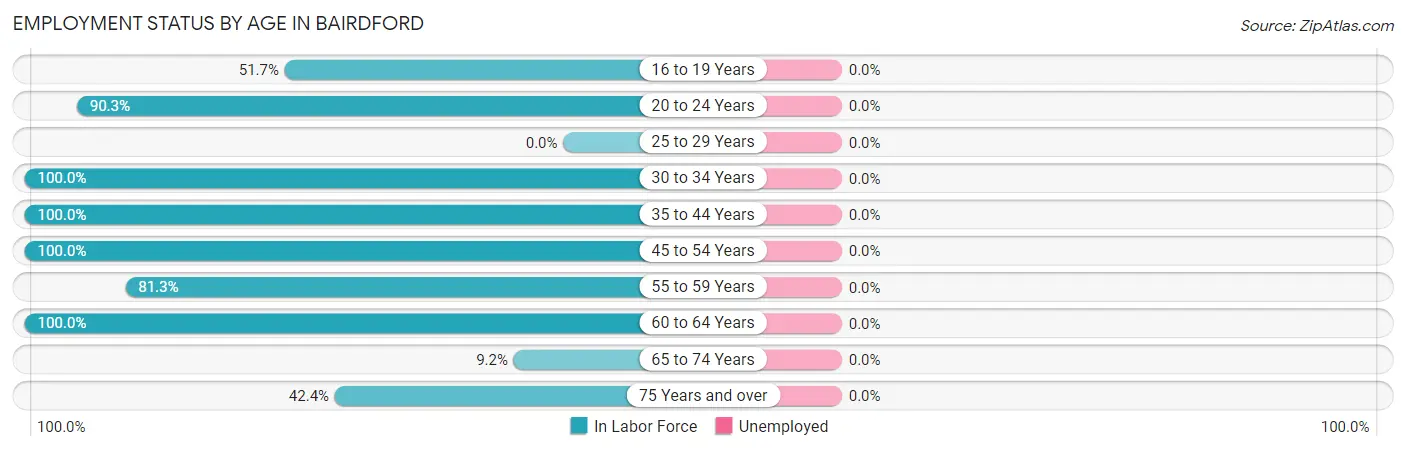
| Age Bracket | In Labor Force | Unemployed |
| 16 to 19 Years | 15 (51.7%) | 0 (0.0%) |
| 20 to 24 Years | 28 (90.3%) | 0 (0.0%) |
| 25 to 29 Years | 0 (0.0%) | 0 (0.0%) |
| 30 to 34 Years | 35 (100.0%) | 0 (0.0%) |
| 35 to 44 Years | 75 (100.0%) | 0 (0.0%) |
| 45 to 54 Years | 77 (100.0%) | 0 (0.0%) |
| 55 to 59 Years | 74 (81.3%) | 0 (0.0%) |
| 60 to 64 Years | 16 (100.0%) | 0 (0.0%) |
| 65 to 74 Years | 11 (9.2%) | 0 (0.0%) |
| 75 Years and over | 25 (42.4%) | 0 (0.0%) |
| Total | 356 (66.9%) | 0 (0.0%) |
Employment Status by Educational Attainment in Bairdford
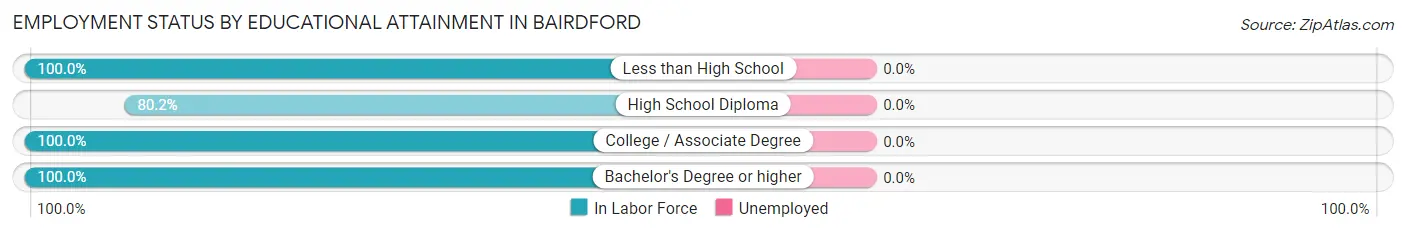
| Educational Attainment | In Labor Force | Unemployed |
| Less than High School | 21 (100.0%) | 0 (0.0%) |
| High School Diploma | 69 (80.2%) | 0 (0.0%) |
| College / Associate Degree | 109 (100.0%) | 0 (0.0%) |
| Bachelor's Degree or higher | 78 (100.0%) | 0 (0.0%) |
| Total | 277 (94.2%) | 0 (0.0%) |
Employment Occupations by Sex in Bairdford
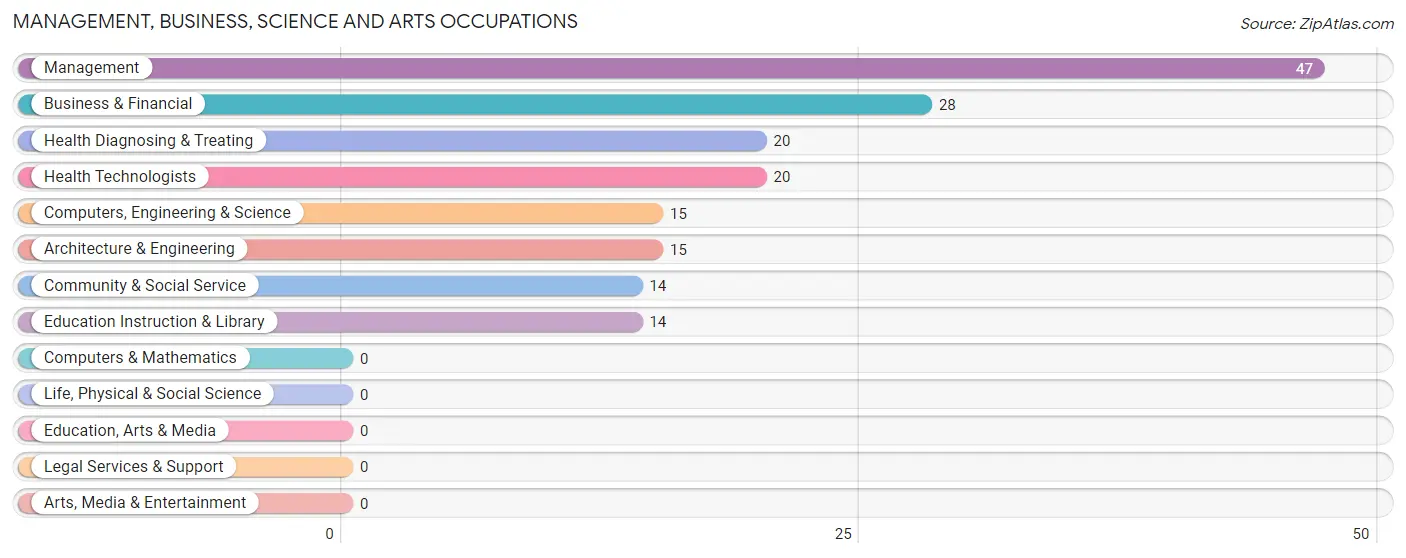
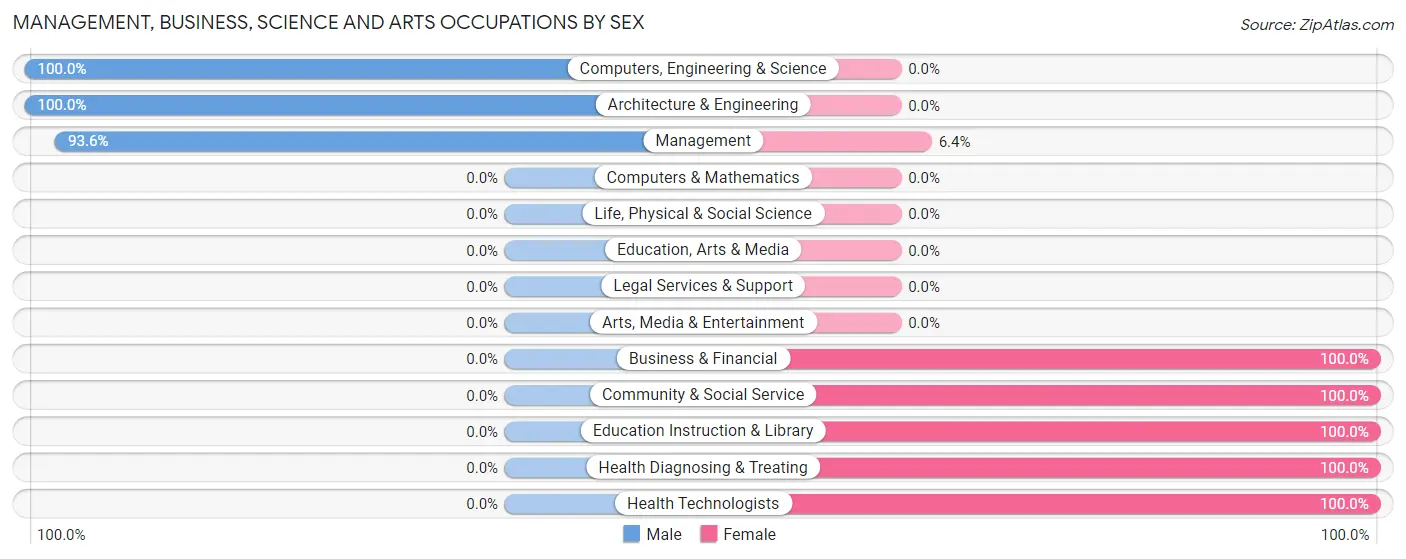
Management, Business, Science and Arts Occupations
The most common Management, Business, Science and Arts occupations in Bairdford are Management (47 | 13.2%), Business & Financial (28 | 7.9%), Health Diagnosing & Treating (20 | 5.6%), Health Technologists (20 | 5.6%), and Computers, Engineering & Science (15 | 4.2%).
Management, Business, Science and Arts Occupations by Sex
Within the Management, Business, Science and Arts occupations in Bairdford, the most male-oriented occupations are Computers, Engineering & Science (100.0%), Architecture & Engineering (100.0%), and Management (93.6%), while the most female-oriented occupations are Business & Financial (100.0%), Community & Social Service (100.0%), and Education Instruction & Library (100.0%).
| Occupation | Male | Female |
| Management | 44 (93.6%) | 3 (6.4%) |
| Business & Financial | 0 (0.0%) | 28 (100.0%) |
| Computers, Engineering & Science | 15 (100.0%) | 0 (0.0%) |
| Computers & Mathematics | 0 (0.0%) | 0 (0.0%) |
| Architecture & Engineering | 15 (100.0%) | 0 (0.0%) |
| Life, Physical & Social Science | 0 (0.0%) | 0 (0.0%) |
| Community & Social Service | 0 (0.0%) | 14 (100.0%) |
| Education, Arts & Media | 0 (0.0%) | 0 (0.0%) |
| Legal Services & Support | 0 (0.0%) | 0 (0.0%) |
| Education Instruction & Library | 0 (0.0%) | 14 (100.0%) |
| Arts, Media & Entertainment | 0 (0.0%) | 0 (0.0%) |
| Health Diagnosing & Treating | 0 (0.0%) | 20 (100.0%) |
| Health Technologists | 0 (0.0%) | 20 (100.0%) |
| Total (Category) | 59 (47.6%) | 65 (52.4%) |
| Total (Overall) | 144 (40.5%) | 212 (59.6%) |
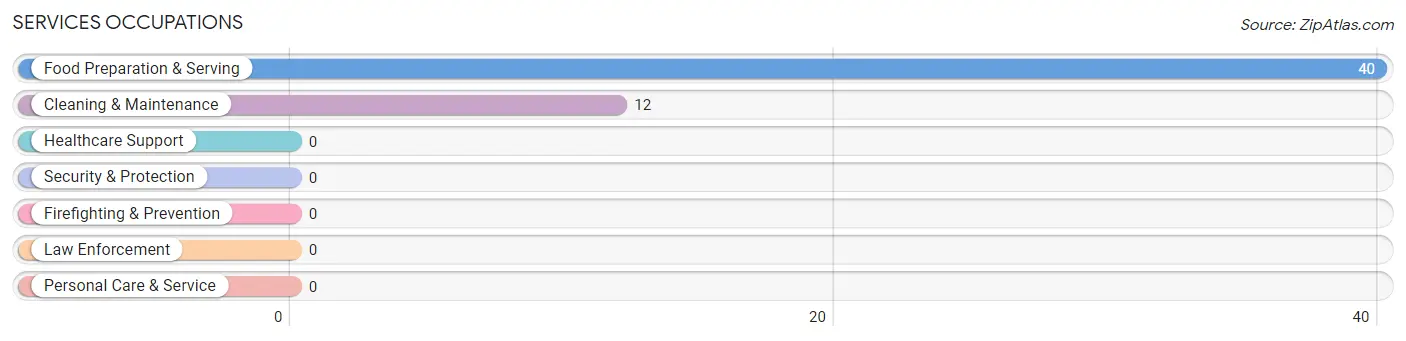
Services Occupations
The most common Services occupations in Bairdford are Food Preparation & Serving (40 | 11.2%), and Cleaning & Maintenance (12 | 3.4%).
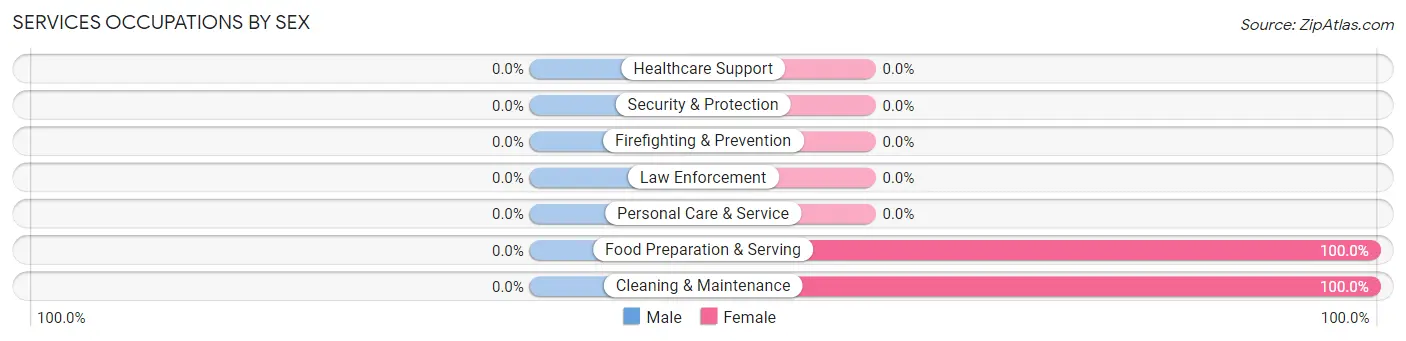
Services Occupations by Sex
| Occupation | Male | Female |
| Healthcare Support | 0 (0.0%) | 0 (0.0%) |
| Security & Protection | 0 (0.0%) | 0 (0.0%) |
| Firefighting & Prevention | 0 (0.0%) | 0 (0.0%) |
| Law Enforcement | 0 (0.0%) | 0 (0.0%) |
| Food Preparation & Serving | 0 (0.0%) | 40 (100.0%) |
| Cleaning & Maintenance | 0 (0.0%) | 12 (100.0%) |
| Personal Care & Service | 0 (0.0%) | 0 (0.0%) |
| Total (Category) | 0 (0.0%) | 52 (100.0%) |
| Total (Overall) | 144 (40.5%) | 212 (59.6%) |
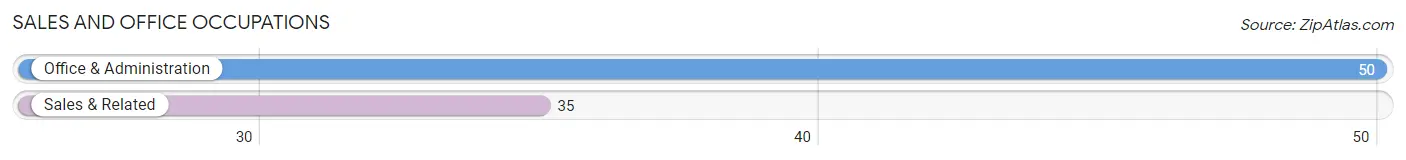
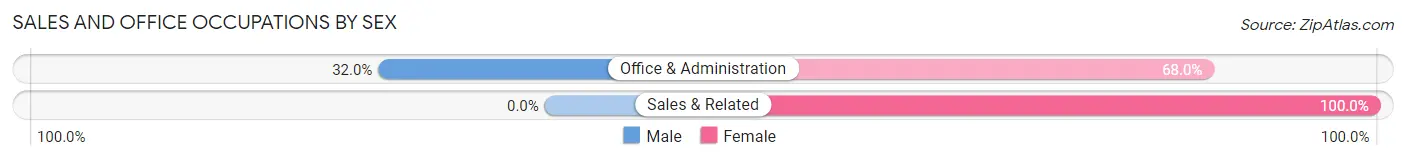
Sales and Office Occupations
The most common Sales and Office occupations in Bairdford are Office & Administration (50 | 14.0%), and Sales & Related (35 | 9.8%).
Sales and Office Occupations by Sex
| Occupation | Male | Female |
| Sales & Related | 0 (0.0%) | 35 (100.0%) |
| Office & Administration | 16 (32.0%) | 34 (68.0%) |
| Total (Category) | 16 (18.8%) | 69 (81.2%) |
| Total (Overall) | 144 (40.5%) | 212 (59.6%) |
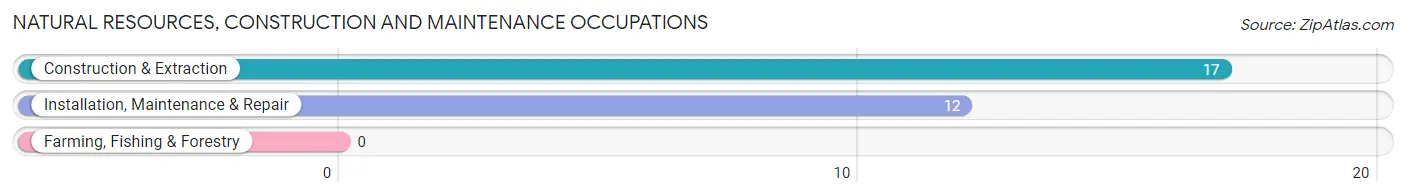
Natural Resources, Construction and Maintenance Occupations
The most common Natural Resources, Construction and Maintenance occupations in Bairdford are Construction & Extraction (17 | 4.8%), and Installation, Maintenance & Repair (12 | 3.4%).
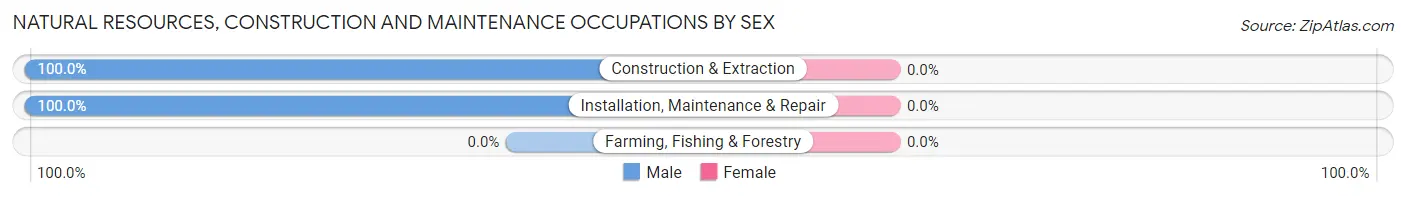
Natural Resources, Construction and Maintenance Occupations by Sex
| Occupation | Male | Female |
| Farming, Fishing & Forestry | 0 (0.0%) | 0 (0.0%) |
| Construction & Extraction | 17 (100.0%) | 0 (0.0%) |
| Installation, Maintenance & Repair | 12 (100.0%) | 0 (0.0%) |
| Total (Category) | 29 (100.0%) | 0 (0.0%) |
| Total (Overall) | 144 (40.5%) | 212 (59.6%) |
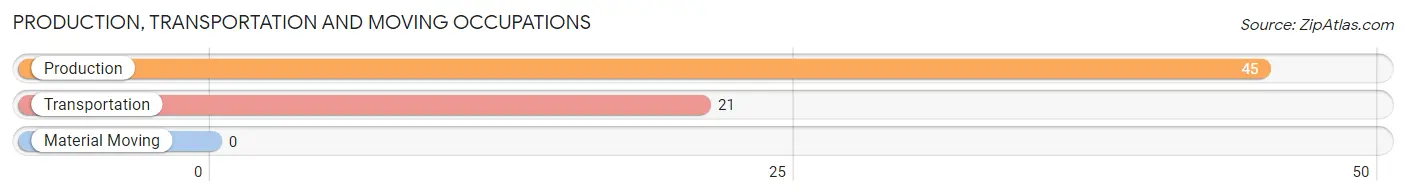
Production, Transportation and Moving Occupations
The most common Production, Transportation and Moving occupations in Bairdford are Production (45 | 12.6%), and Transportation (21 | 5.9%).
Production, Transportation and Moving Occupations by Sex
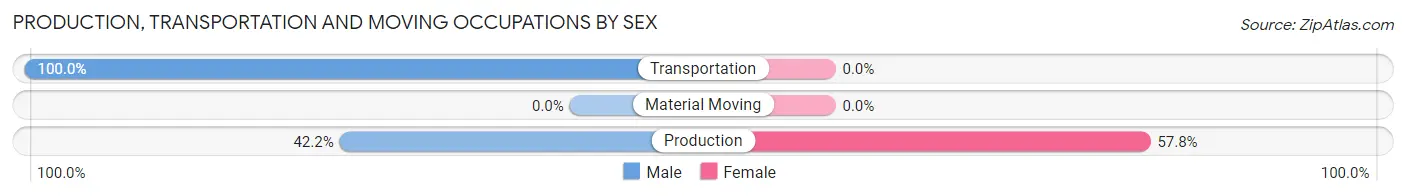
| Occupation | Male | Female |
| Production | 19 (42.2%) | 26 (57.8%) |
| Transportation | 21 (100.0%) | 0 (0.0%) |
| Material Moving | 0 (0.0%) | 0 (0.0%) |
| Total (Category) | 40 (60.6%) | 26 (39.4%) |
| Total (Overall) | 144 (40.5%) | 212 (59.6%) |
Employment Industries by Sex in Bairdford
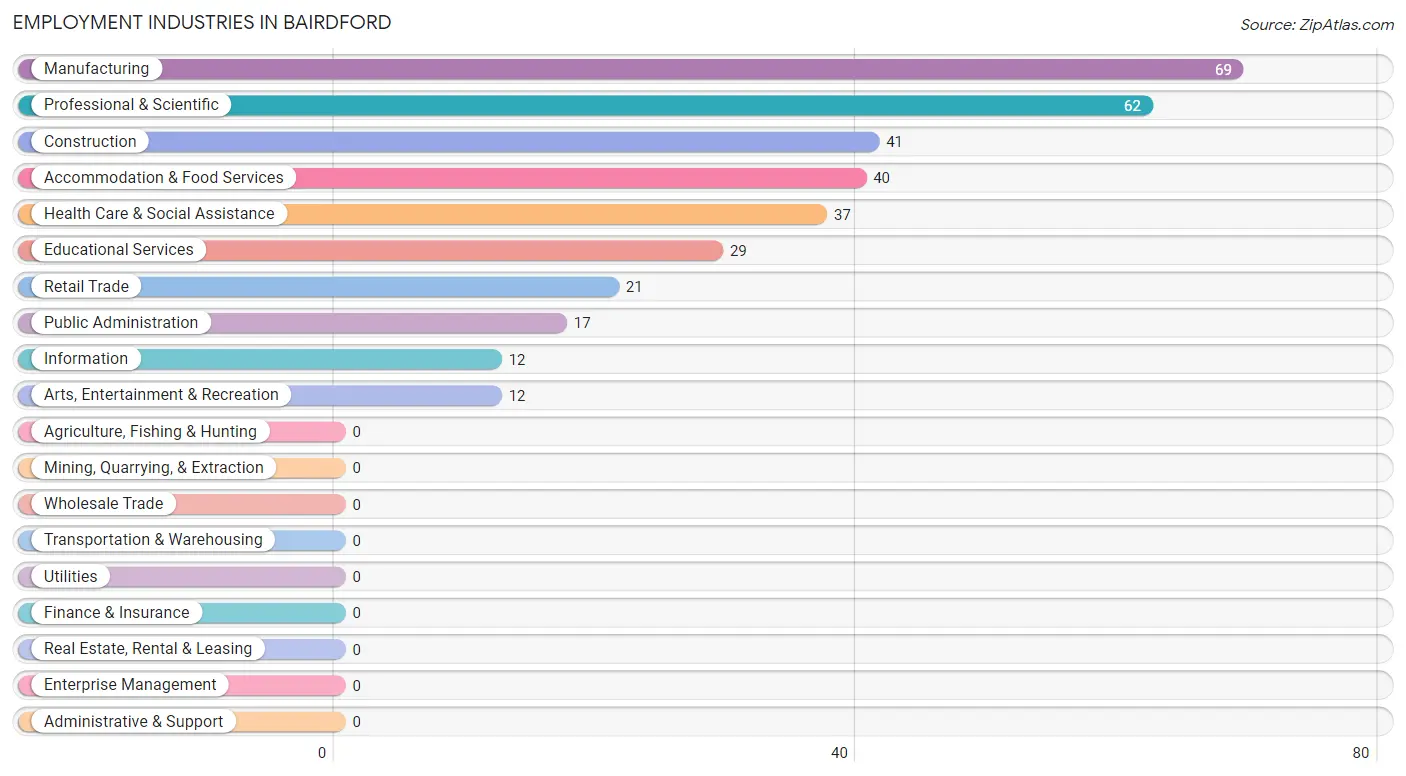
Employment Industries in Bairdford
The major employment industries in Bairdford include Manufacturing (69 | 19.4%), Professional & Scientific (62 | 17.4%), Construction (41 | 11.5%), Accommodation & Food Services (40 | 11.2%), and Health Care & Social Assistance (37 | 10.4%).
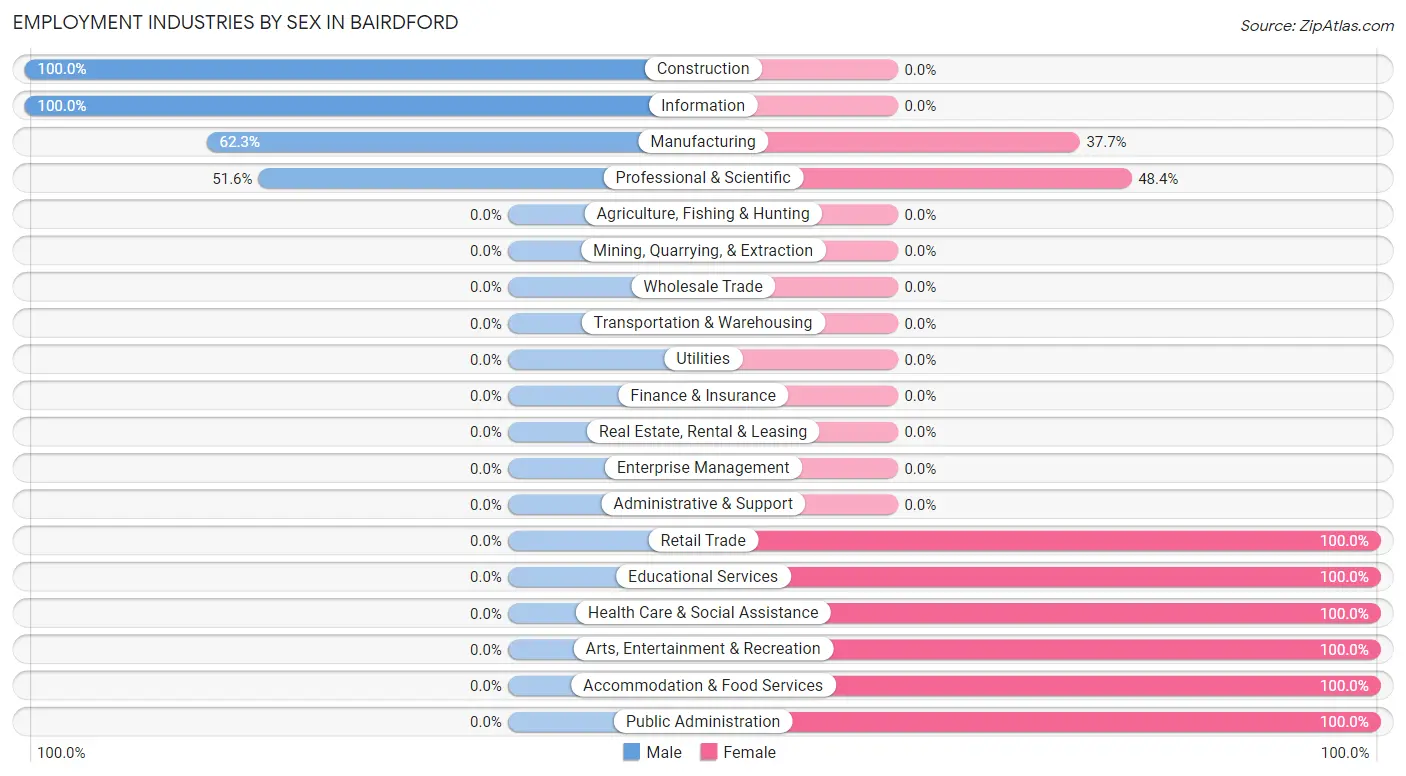
Employment Industries by Sex in Bairdford
The Bairdford industries that see more men than women are Construction (100.0%), Information (100.0%), and Manufacturing (62.3%), whereas the industries that tend to have a higher number of women are Retail Trade (100.0%), Educational Services (100.0%), and Health Care & Social Assistance (100.0%).
| Industry | Male | Female |
| Agriculture, Fishing & Hunting | 0 (0.0%) | 0 (0.0%) |
| Mining, Quarrying, & Extraction | 0 (0.0%) | 0 (0.0%) |
| Construction | 41 (100.0%) | 0 (0.0%) |
| Manufacturing | 43 (62.3%) | 26 (37.7%) |
| Wholesale Trade | 0 (0.0%) | 0 (0.0%) |
| Retail Trade | 0 (0.0%) | 21 (100.0%) |
| Transportation & Warehousing | 0 (0.0%) | 0 (0.0%) |
| Utilities | 0 (0.0%) | 0 (0.0%) |
| Information | 12 (100.0%) | 0 (0.0%) |
| Finance & Insurance | 0 (0.0%) | 0 (0.0%) |
| Real Estate, Rental & Leasing | 0 (0.0%) | 0 (0.0%) |
| Professional & Scientific | 32 (51.6%) | 30 (48.4%) |
| Enterprise Management | 0 (0.0%) | 0 (0.0%) |
| Administrative & Support | 0 (0.0%) | 0 (0.0%) |
| Educational Services | 0 (0.0%) | 29 (100.0%) |
| Health Care & Social Assistance | 0 (0.0%) | 37 (100.0%) |
| Arts, Entertainment & Recreation | 0 (0.0%) | 12 (100.0%) |
| Accommodation & Food Services | 0 (0.0%) | 40 (100.0%) |
| Public Administration | 0 (0.0%) | 17 (100.0%) |
| Total | 144 (40.5%) | 212 (59.6%) |
Education in Bairdford
School Enrollment in Bairdford
The most common levels of schooling among the 127 students in Bairdford are middle school (50 | 39.4%), high school (44 | 34.6%), and nursery / preschool (19 | 15.0%).
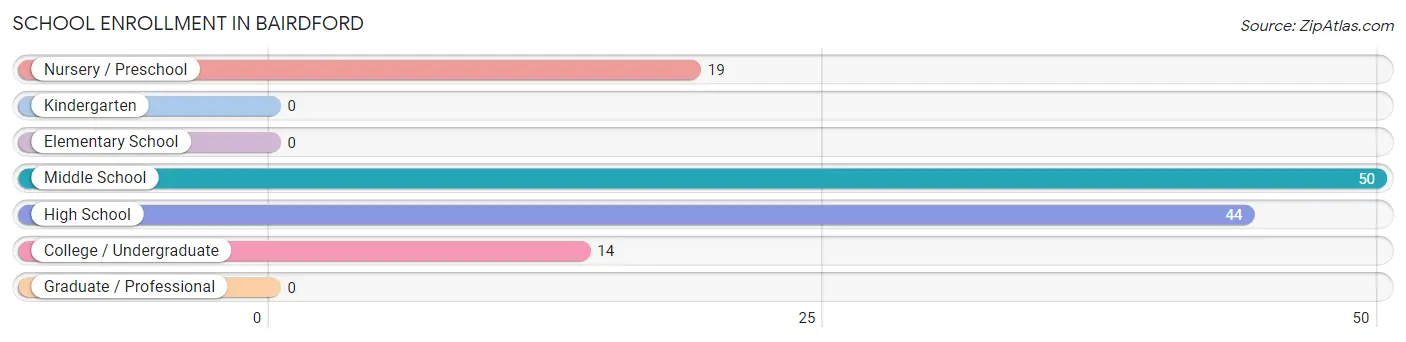
| School Level | # Students | % Students |
| Nursery / Preschool | 19 | 15.0% |
| Kindergarten | 0 | 0.0% |
| Elementary School | 0 | 0.0% |
| Middle School | 50 | 39.4% |
| High School | 44 | 34.6% |
| College / Undergraduate | 14 | 11.0% |
| Graduate / Professional | 0 | 0.0% |
| Total | 127 | 100.0% |
School Enrollment by Age by Funding Source in Bairdford
Out of a total of 127 students who are enrolled in schools in Bairdford, 14 (11.0%) attend a private institution, while the remaining 113 (89.0%) are enrolled in public schools. The age group of 15 to 17 year olds has the highest likelihood of being enrolled in private schools, with 14 (48.3% in the age bracket) enrolled. Conversely, the age group of 3 to 4 year olds has the lowest likelihood of being enrolled in a private school, with 19 (100.0% in the age bracket) attending a public institution.
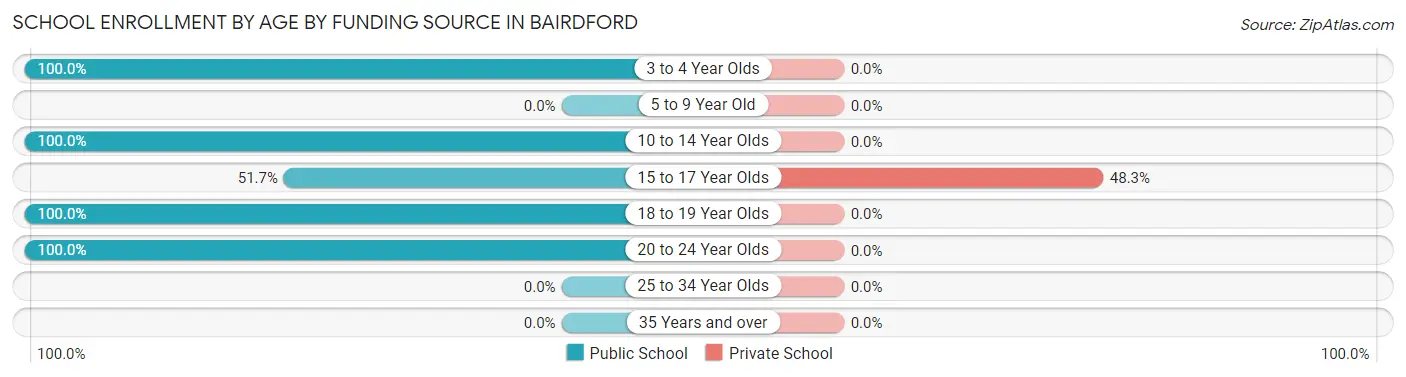
| Age Bracket | Public School | Private School |
| 3 to 4 Year Olds | 19 (100.0%) | 0 (0.0%) |
| 5 to 9 Year Old | 0 (0.0%) | 0 (0.0%) |
| 10 to 14 Year Olds | 50 (100.0%) | 0 (0.0%) |
| 15 to 17 Year Olds | 15 (51.7%) | 14 (48.3%) |
| 18 to 19 Year Olds | 15 (100.0%) | 0 (0.0%) |
| 20 to 24 Year Olds | 14 (100.0%) | 0 (0.0%) |
| 25 to 34 Year Olds | 0 (0.0%) | 0 (0.0%) |
| 35 Years and over | 0 (0.0%) | 0 (0.0%) |
| Total | 113 (89.0%) | 14 (11.0%) |
Educational Attainment by Field of Study in Bairdford
Social sciences (17 | 21.8%), business (16 | 20.5%), engineering (15 | 19.2%), liberal arts & history (15 | 19.2%), and visual & performing arts (12 | 15.4%) are the most common fields of study among 78 individuals in Bairdford who have obtained a bachelor's degree or higher.
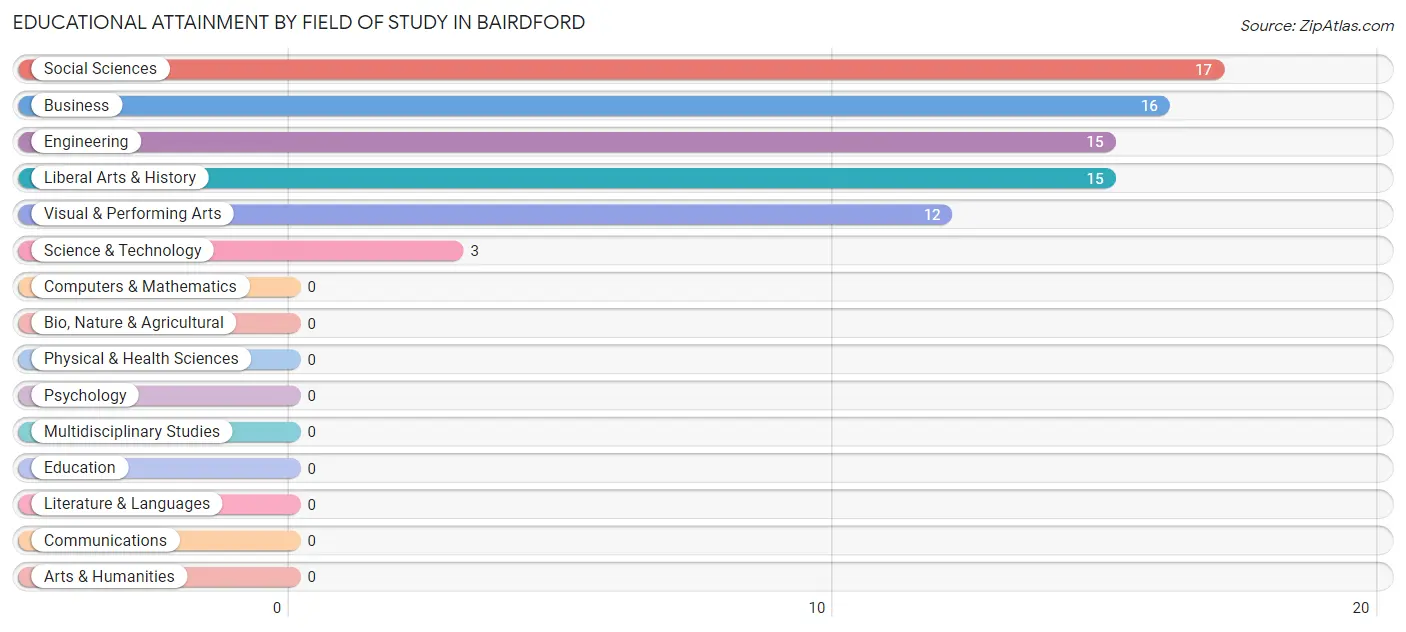
| Field of Study | # Graduates | % Graduates |
| Computers & Mathematics | 0 | 0.0% |
| Bio, Nature & Agricultural | 0 | 0.0% |
| Physical & Health Sciences | 0 | 0.0% |
| Psychology | 0 | 0.0% |
| Social Sciences | 17 | 21.8% |
| Engineering | 15 | 19.2% |
| Multidisciplinary Studies | 0 | 0.0% |
| Science & Technology | 3 | 3.8% |
| Business | 16 | 20.5% |
| Education | 0 | 0.0% |
| Literature & Languages | 0 | 0.0% |
| Liberal Arts & History | 15 | 19.2% |
| Visual & Performing Arts | 12 | 15.4% |
| Communications | 0 | 0.0% |
| Arts & Humanities | 0 | 0.0% |
| Total | 78 | 100.0% |
Transportation & Commute in Bairdford
Vehicle Availability by Sex in Bairdford
The most prevalent vehicle ownership categories in Bairdford are males with 2 vehicles (74, accounting for 51.4%) and females with 2 vehicles (88, making up 34.9%).
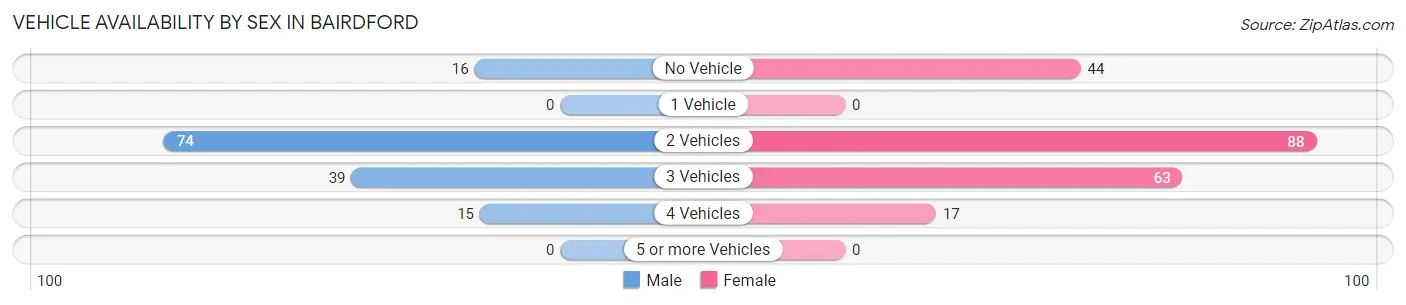
| Vehicles Available | Male | Female |
| No Vehicle | 16 (11.1%) | 44 (20.7%) |
| 1 Vehicle | 0 (0.0%) | 0 (0.0%) |
| 2 Vehicles | 74 (51.4%) | 88 (41.5%) |
| 3 Vehicles | 39 (27.1%) | 63 (29.7%) |
| 4 Vehicles | 15 (10.4%) | 17 (8.0%) |
| 5 or more Vehicles | 0 (0.0%) | 0 (0.0%) |
| Total | 144 (100.0%) | 212 (100.0%) |
Commute Time in Bairdford
The most frequently occuring commute durations in Bairdford are 25 to 29 minutes (96 commuters, 29.7%), 20 to 24 minutes (89 commuters, 27.6%), and 10 to 14 minutes (30 commuters, 9.3%).
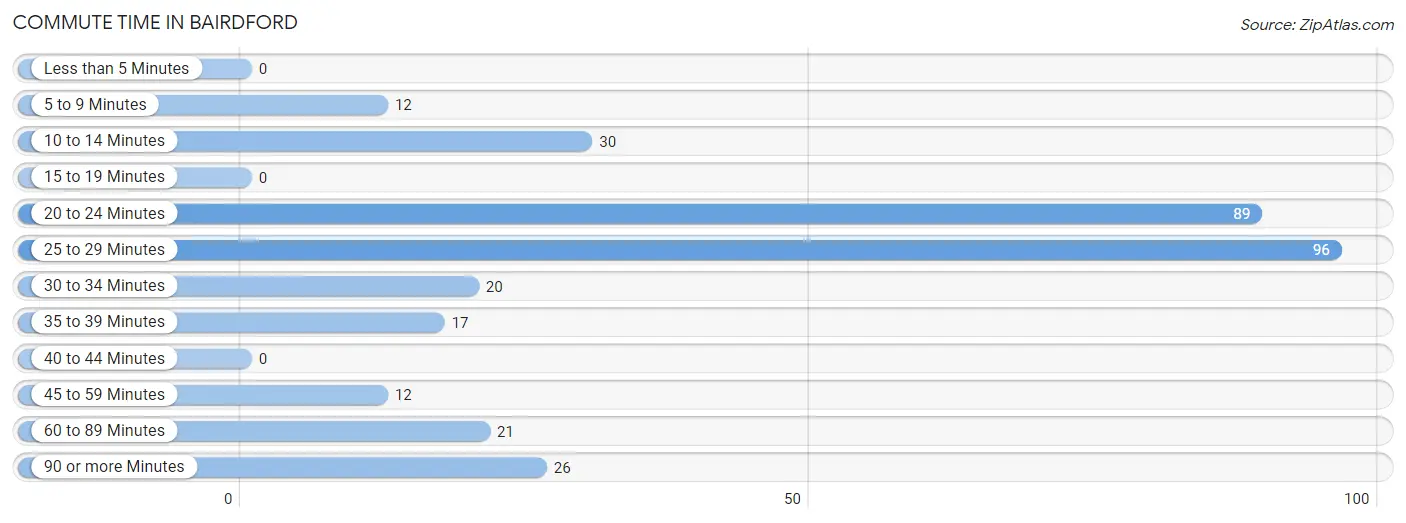
| Commute Time | # Commuters | % Commuters |
| Less than 5 Minutes | 0 | 0.0% |
| 5 to 9 Minutes | 12 | 3.7% |
| 10 to 14 Minutes | 30 | 9.3% |
| 15 to 19 Minutes | 0 | 0.0% |
| 20 to 24 Minutes | 89 | 27.6% |
| 25 to 29 Minutes | 96 | 29.7% |
| 30 to 34 Minutes | 20 | 6.2% |
| 35 to 39 Minutes | 17 | 5.3% |
| 40 to 44 Minutes | 0 | 0.0% |
| 45 to 59 Minutes | 12 | 3.7% |
| 60 to 89 Minutes | 21 | 6.5% |
| 90 or more Minutes | 26 | 8.1% |
Commute Time by Sex in Bairdford
The most common commute times in Bairdford are 25 to 29 minutes (56 commuters, 44.1%) for males and 20 to 24 minutes (62 commuters, 31.6%) for females.
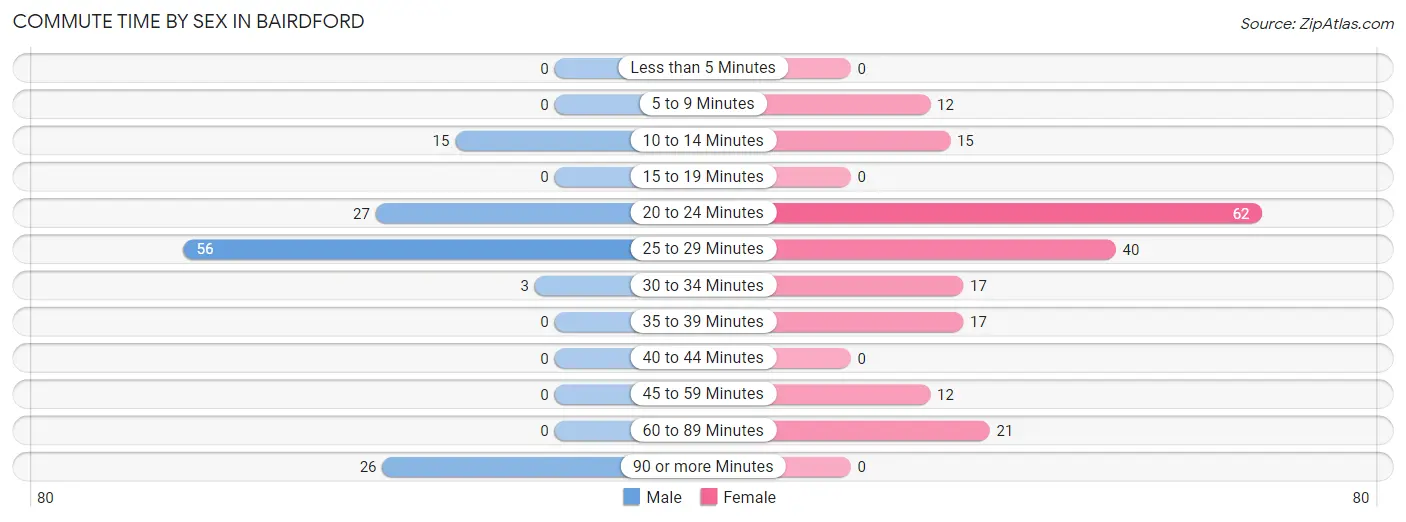
| Commute Time | Male | Female |
| Less than 5 Minutes | 0 (0.0%) | 0 (0.0%) |
| 5 to 9 Minutes | 0 (0.0%) | 12 (6.1%) |
| 10 to 14 Minutes | 15 (11.8%) | 15 (7.6%) |
| 15 to 19 Minutes | 0 (0.0%) | 0 (0.0%) |
| 20 to 24 Minutes | 27 (21.3%) | 62 (31.6%) |
| 25 to 29 Minutes | 56 (44.1%) | 40 (20.4%) |
| 30 to 34 Minutes | 3 (2.4%) | 17 (8.7%) |
| 35 to 39 Minutes | 0 (0.0%) | 17 (8.7%) |
| 40 to 44 Minutes | 0 (0.0%) | 0 (0.0%) |
| 45 to 59 Minutes | 0 (0.0%) | 12 (6.1%) |
| 60 to 89 Minutes | 0 (0.0%) | 21 (10.7%) |
| 90 or more Minutes | 26 (20.5%) | 0 (0.0%) |
Time of Departure to Work by Sex in Bairdford
The most frequent times of departure to work in Bairdford are 6:00 AM to 6:29 AM (36, 28.3%) for males and 8:00 AM to 8:29 AM (45, 23.0%) for females.
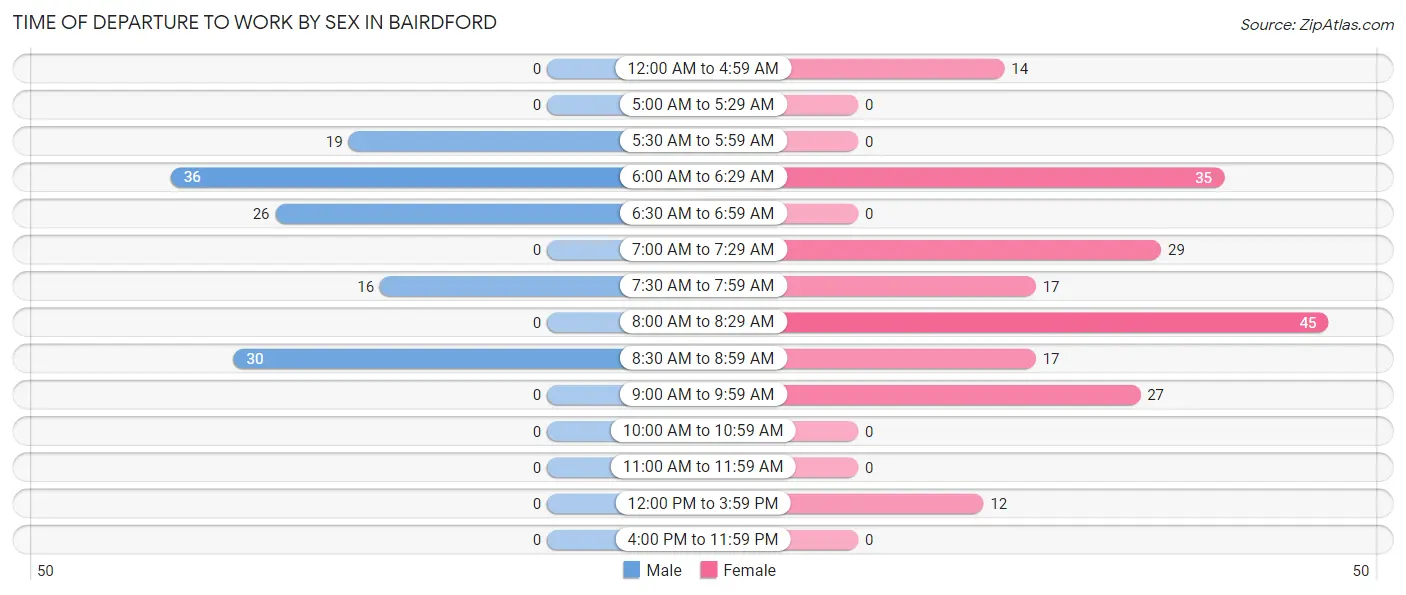
| Time of Departure | Male | Female |
| 12:00 AM to 4:59 AM | 0 (0.0%) | 14 (7.1%) |
| 5:00 AM to 5:29 AM | 0 (0.0%) | 0 (0.0%) |
| 5:30 AM to 5:59 AM | 19 (15.0%) | 0 (0.0%) |
| 6:00 AM to 6:29 AM | 36 (28.3%) | 35 (17.9%) |
| 6:30 AM to 6:59 AM | 26 (20.5%) | 0 (0.0%) |
| 7:00 AM to 7:29 AM | 0 (0.0%) | 29 (14.8%) |
| 7:30 AM to 7:59 AM | 16 (12.6%) | 17 (8.7%) |
| 8:00 AM to 8:29 AM | 0 (0.0%) | 45 (23.0%) |
| 8:30 AM to 8:59 AM | 30 (23.6%) | 17 (8.7%) |
| 9:00 AM to 9:59 AM | 0 (0.0%) | 27 (13.8%) |
| 10:00 AM to 10:59 AM | 0 (0.0%) | 0 (0.0%) |
| 11:00 AM to 11:59 AM | 0 (0.0%) | 0 (0.0%) |
| 12:00 PM to 3:59 PM | 0 (0.0%) | 12 (6.1%) |
| 4:00 PM to 11:59 PM | 0 (0.0%) | 0 (0.0%) |
| Total | 127 (100.0%) | 196 (100.0%) |
Housing Occupancy in Bairdford
Occupancy by Ownership in Bairdford
Of the total 256 dwellings in Bairdford, owner-occupied units account for 220 (85.9%), while renter-occupied units make up 36 (14.1%).
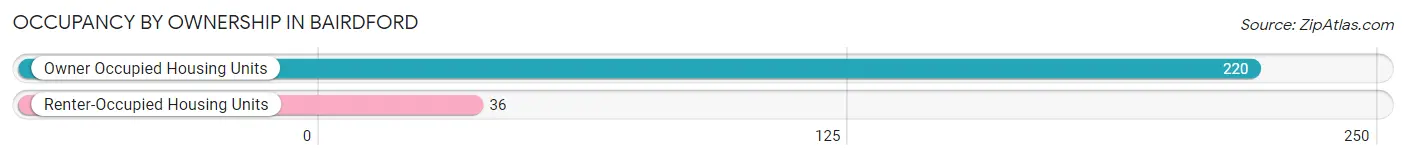
| Occupancy | # Housing Units | % Housing Units |
| Owner Occupied Housing Units | 220 | 85.9% |
| Renter-Occupied Housing Units | 36 | 14.1% |
| Total Occupied Housing Units | 256 | 100.0% |
Occupancy by Household Size in Bairdford
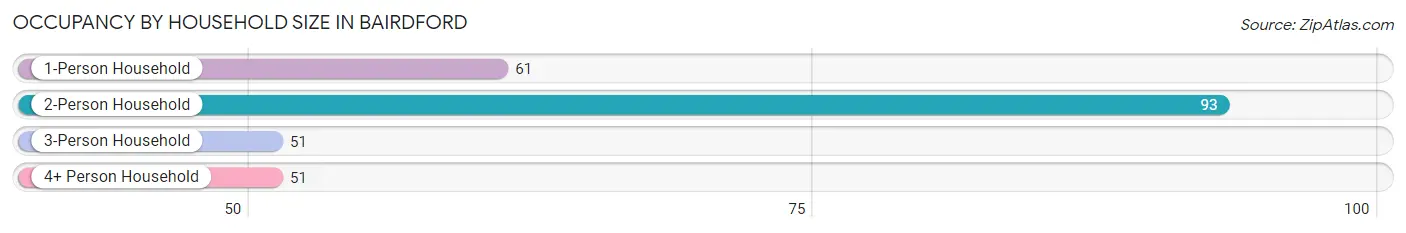
| Household Size | # Housing Units | % Housing Units |
| 1-Person Household | 61 | 23.8% |
| 2-Person Household | 93 | 36.3% |
| 3-Person Household | 51 | 19.9% |
| 4+ Person Household | 51 | 19.9% |
| Total Housing Units | 256 | 100.0% |
Occupancy by Ownership by Household Size in Bairdford
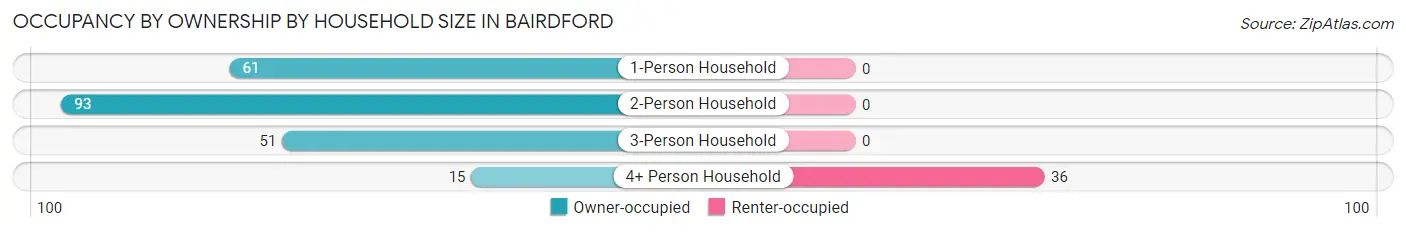
| Household Size | Owner-occupied | Renter-occupied |
| 1-Person Household | 61 (100.0%) | 0 (0.0%) |
| 2-Person Household | 93 (100.0%) | 0 (0.0%) |
| 3-Person Household | 51 (100.0%) | 0 (0.0%) |
| 4+ Person Household | 15 (29.4%) | 36 (70.6%) |
| Total Housing Units | 220 (85.9%) | 36 (14.1%) |
Occupancy by Educational Attainment in Bairdford
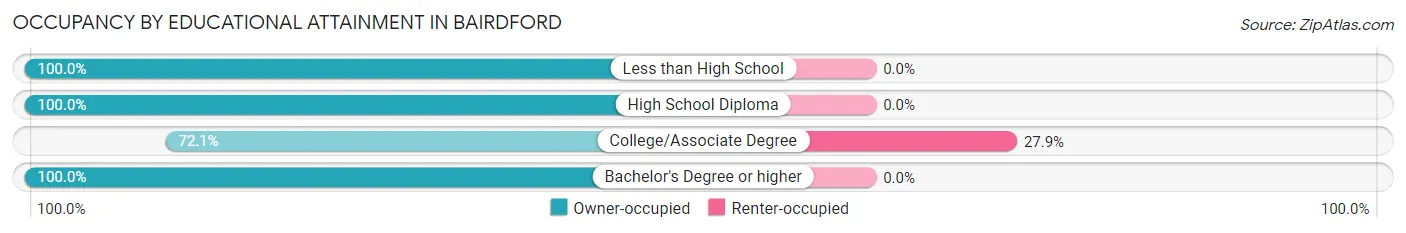
| Household Size | Owner-occupied | Renter-occupied |
| Less than High School | 21 (100.0%) | 0 (0.0%) |
| High School Diploma | 73 (100.0%) | 0 (0.0%) |
| College/Associate Degree | 93 (72.1%) | 36 (27.9%) |
| Bachelor's Degree or higher | 33 (100.0%) | 0 (0.0%) |
Occupancy by Age of Householder in Bairdford
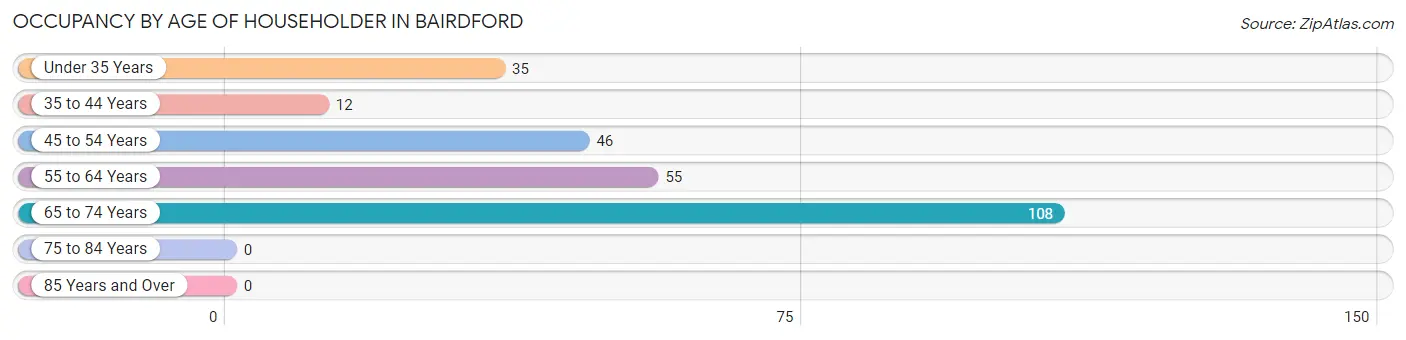
| Age Bracket | # Households | % Households |
| Under 35 Years | 35 | 13.7% |
| 35 to 44 Years | 12 | 4.7% |
| 45 to 54 Years | 46 | 18.0% |
| 55 to 64 Years | 55 | 21.5% |
| 65 to 74 Years | 108 | 42.2% |
| 75 to 84 Years | 0 | 0.0% |
| 85 Years and Over | 0 | 0.0% |
| Total | 256 | 100.0% |
Housing Finances in Bairdford
Median Income by Occupancy in Bairdford
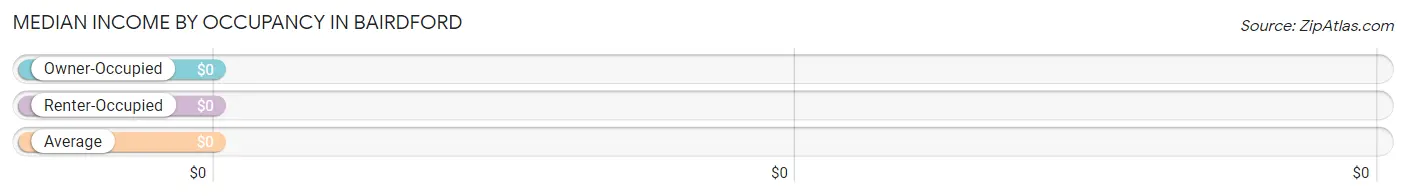
| Occupancy Type | # Households | Median Income |
| Owner-Occupied | 220 (85.9%) | $0 |
| Renter-Occupied | 36 (14.1%) | $0 |
| Average | 256 (100.0%) | $0 |
Occupancy by Householder Income Bracket in Bairdford
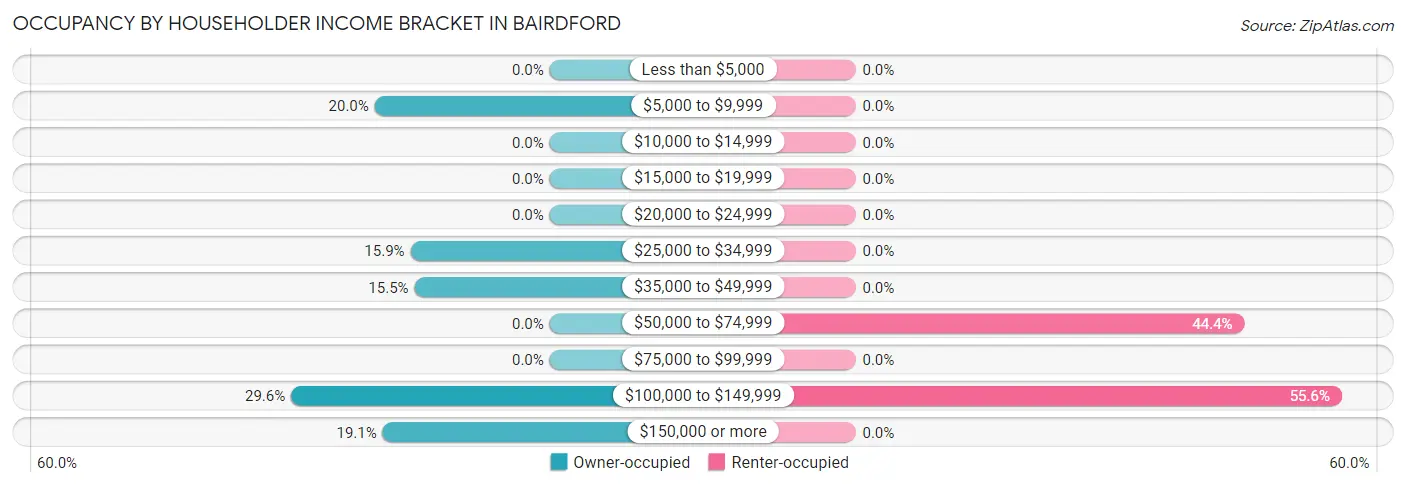
| Income Bracket | Owner-occupied | Renter-occupied |
| Less than $5,000 | 0 (0.0%) | 0 (0.0%) |
| $5,000 to $9,999 | 44 (20.0%) | 0 (0.0%) |
| $10,000 to $14,999 | 0 (0.0%) | 0 (0.0%) |
| $15,000 to $19,999 | 0 (0.0%) | 0 (0.0%) |
| $20,000 to $24,999 | 0 (0.0%) | 0 (0.0%) |
| $25,000 to $34,999 | 35 (15.9%) | 0 (0.0%) |
| $35,000 to $49,999 | 34 (15.4%) | 0 (0.0%) |
| $50,000 to $74,999 | 0 (0.0%) | 16 (44.4%) |
| $75,000 to $99,999 | 0 (0.0%) | 0 (0.0%) |
| $100,000 to $149,999 | 65 (29.5%) | 20 (55.6%) |
| $150,000 or more | 42 (19.1%) | 0 (0.0%) |
| Total | 220 (100.0%) | 36 (100.0%) |
Monthly Housing Cost Tiers in Bairdford
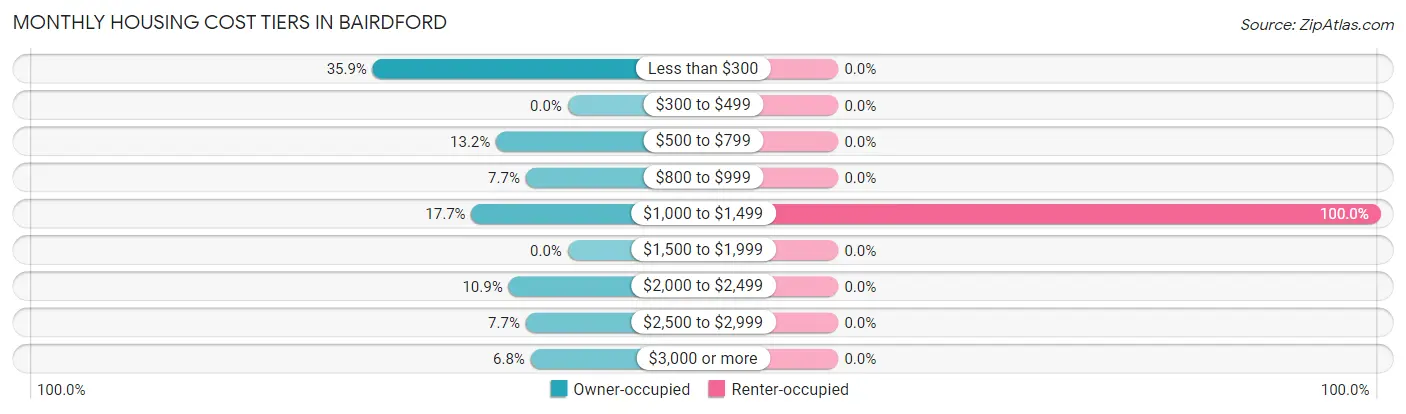
| Monthly Cost | Owner-occupied | Renter-occupied |
| Less than $300 | 79 (35.9%) | 0 (0.0%) |
| $300 to $499 | 0 (0.0%) | 0 (0.0%) |
| $500 to $799 | 29 (13.2%) | 0 (0.0%) |
| $800 to $999 | 17 (7.7%) | 0 (0.0%) |
| $1,000 to $1,499 | 39 (17.7%) | 36 (100.0%) |
| $1,500 to $1,999 | 0 (0.0%) | 0 (0.0%) |
| $2,000 to $2,499 | 24 (10.9%) | 0 (0.0%) |
| $2,500 to $2,999 | 17 (7.7%) | 0 (0.0%) |
| $3,000 or more | 15 (6.8%) | 0 (0.0%) |
| Total | 220 (100.0%) | 36 (100.0%) |
Physical Housing Characteristics in Bairdford
Housing Structures in Bairdford
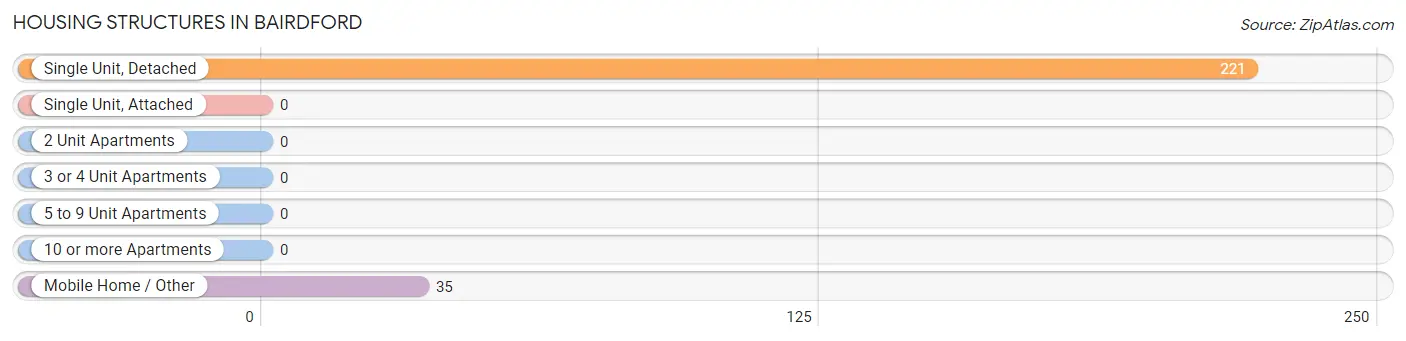
| Structure Type | # Housing Units | % Housing Units |
| Single Unit, Detached | 221 | 86.3% |
| Single Unit, Attached | 0 | 0.0% |
| 2 Unit Apartments | 0 | 0.0% |
| 3 or 4 Unit Apartments | 0 | 0.0% |
| 5 to 9 Unit Apartments | 0 | 0.0% |
| 10 or more Apartments | 0 | 0.0% |
| Mobile Home / Other | 35 | 13.7% |
| Total | 256 | 100.0% |
Housing Structures by Occupancy in Bairdford
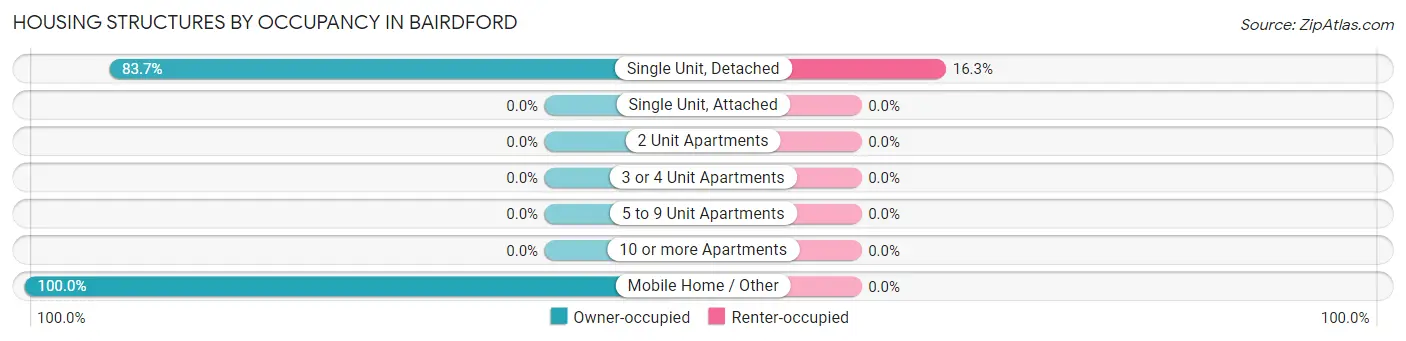
| Structure Type | Owner-occupied | Renter-occupied |
| Single Unit, Detached | 185 (83.7%) | 36 (16.3%) |
| Single Unit, Attached | 0 (0.0%) | 0 (0.0%) |
| 2 Unit Apartments | 0 (0.0%) | 0 (0.0%) |
| 3 or 4 Unit Apartments | 0 (0.0%) | 0 (0.0%) |
| 5 to 9 Unit Apartments | 0 (0.0%) | 0 (0.0%) |
| 10 or more Apartments | 0 (0.0%) | 0 (0.0%) |
| Mobile Home / Other | 35 (100.0%) | 0 (0.0%) |
| Total | 220 (85.9%) | 36 (14.1%) |
Housing Structures by Number of Rooms in Bairdford
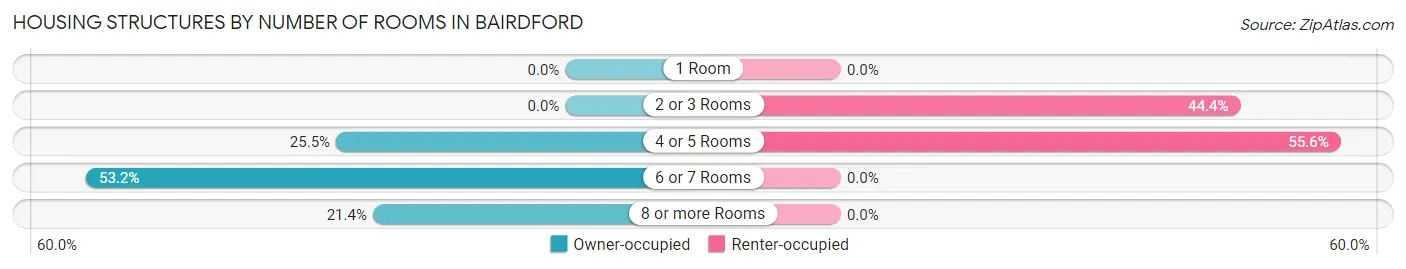
| Number of Rooms | Owner-occupied | Renter-occupied |
| 1 Room | 0 (0.0%) | 0 (0.0%) |
| 2 or 3 Rooms | 0 (0.0%) | 16 (44.4%) |
| 4 or 5 Rooms | 56 (25.5%) | 20 (55.6%) |
| 6 or 7 Rooms | 117 (53.2%) | 0 (0.0%) |
| 8 or more Rooms | 47 (21.4%) | 0 (0.0%) |
| Total | 220 (100.0%) | 36 (100.0%) |
Housing Structure by Heating Type in Bairdford
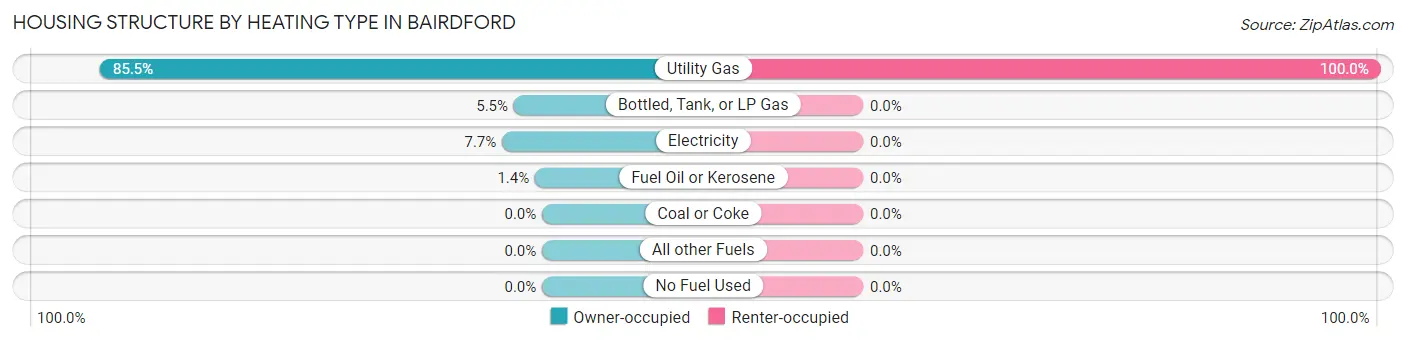
| Heating Type | Owner-occupied | Renter-occupied |
| Utility Gas | 188 (85.5%) | 36 (100.0%) |
| Bottled, Tank, or LP Gas | 12 (5.4%) | 0 (0.0%) |
| Electricity | 17 (7.7%) | 0 (0.0%) |
| Fuel Oil or Kerosene | 3 (1.4%) | 0 (0.0%) |
| Coal or Coke | 0 (0.0%) | 0 (0.0%) |
| All other Fuels | 0 (0.0%) | 0 (0.0%) |
| No Fuel Used | 0 (0.0%) | 0 (0.0%) |
| Total | 220 (100.0%) | 36 (100.0%) |
Household Vehicle Usage in Bairdford
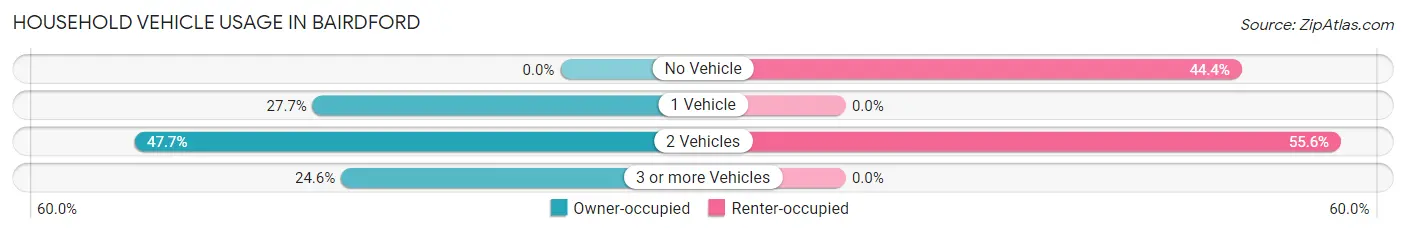
| Vehicles per Household | Owner-occupied | Renter-occupied |
| No Vehicle | 0 (0.0%) | 16 (44.4%) |
| 1 Vehicle | 61 (27.7%) | 0 (0.0%) |
| 2 Vehicles | 105 (47.7%) | 20 (55.6%) |
| 3 or more Vehicles | 54 (24.5%) | 0 (0.0%) |
| Total | 220 (100.0%) | 36 (100.0%) |
Real Estate & Mortgages in Bairdford
Real Estate and Mortgage Overview in Bairdford
| Characteristic | Without Mortgage | With Mortgage |
| Housing Units | 128 | 92 |
| Median Property Value | $86,600 | $0 |
| Median Household Income | $33,929 | $39 |
| Monthly Housing Costs | - | - |
| Real Estate Taxes | $2,464 | $0 |
Property Value by Mortgage Status in Bairdford
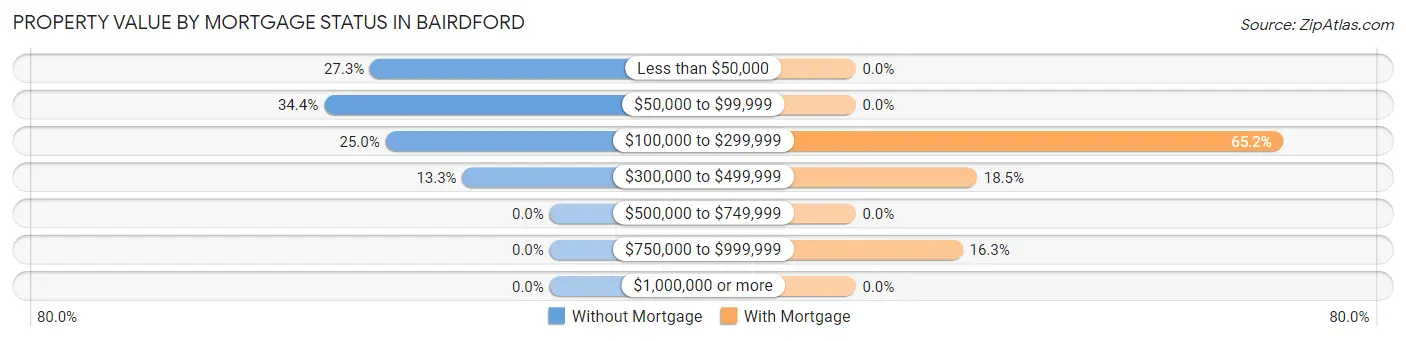
| Property Value | Without Mortgage | With Mortgage |
| Less than $50,000 | 35 (27.3%) | 0 (0.0%) |
| $50,000 to $99,999 | 44 (34.4%) | 0 (0.0%) |
| $100,000 to $299,999 | 32 (25.0%) | 60 (65.2%) |
| $300,000 to $499,999 | 17 (13.3%) | 17 (18.5%) |
| $500,000 to $749,999 | 0 (0.0%) | 0 (0.0%) |
| $750,000 to $999,999 | 0 (0.0%) | 15 (16.3%) |
| $1,000,000 or more | 0 (0.0%) | 0 (0.0%) |
| Total | 128 (100.0%) | 92 (100.0%) |
Household Income by Mortgage Status in Bairdford
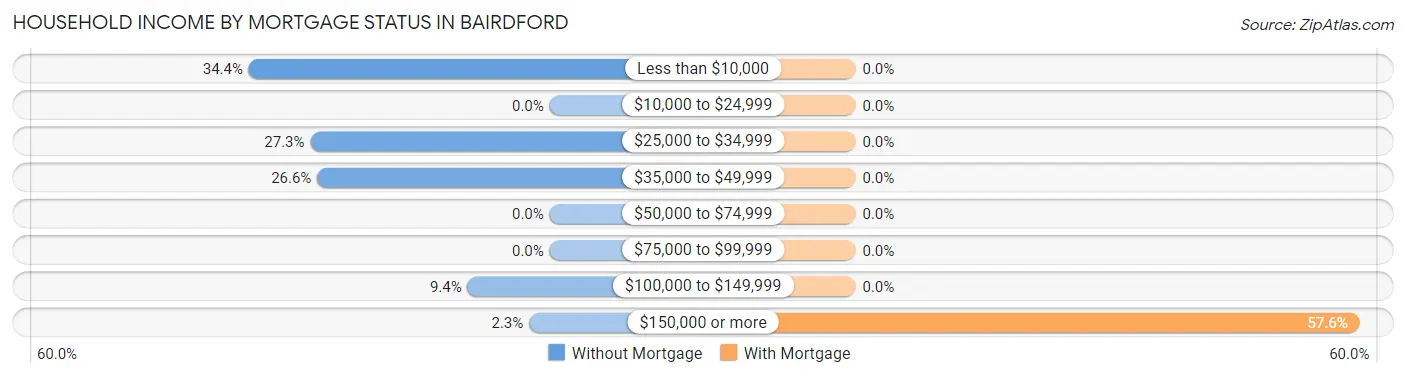
| Household Income | Without Mortgage | With Mortgage |
| Less than $10,000 | 44 (34.4%) | 0 (0.0%) |
| $10,000 to $24,999 | 0 (0.0%) | 0 (0.0%) |
| $25,000 to $34,999 | 35 (27.3%) | 0 (0.0%) |
| $35,000 to $49,999 | 34 (26.6%) | 0 (0.0%) |
| $50,000 to $74,999 | 0 (0.0%) | 0 (0.0%) |
| $75,000 to $99,999 | 0 (0.0%) | 0 (0.0%) |
| $100,000 to $149,999 | 12 (9.4%) | 0 (0.0%) |
| $150,000 or more | 3 (2.3%) | 53 (57.6%) |
| Total | 128 (100.0%) | 92 (100.0%) |
Property Value to Household Income Ratio in Bairdford
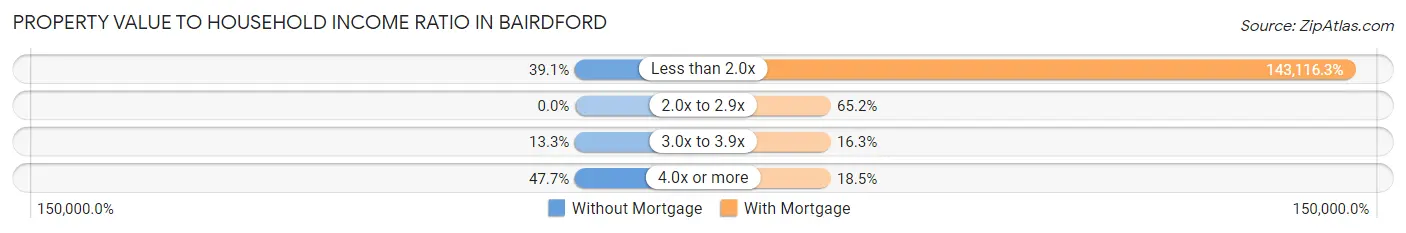
| Value-to-Income Ratio | Without Mortgage | With Mortgage |
| Less than 2.0x | 50 (39.1%) | 131,667 (143,116.3%) |
| 2.0x to 2.9x | 0 (0.0%) | 60 (65.2%) |
| 3.0x to 3.9x | 17 (13.3%) | 15 (16.3%) |
| 4.0x or more | 61 (47.7%) | 17 (18.5%) |
| Total | 128 (100.0%) | 92 (100.0%) |
Real Estate Taxes by Mortgage Status in Bairdford
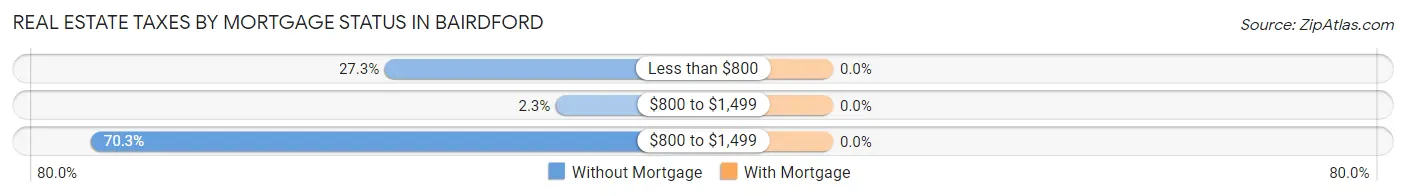
| Property Taxes | Without Mortgage | With Mortgage |
| Less than $800 | 35 (27.3%) | 0 (0.0%) |
| $800 to $1,499 | 3 (2.3%) | 0 (0.0%) |
| $800 to $1,499 | 90 (70.3%) | 0 (0.0%) |
| Total | 128 (100.0%) | 92 (100.0%) |
Health & Disability in Bairdford
Health Insurance Coverage by Age in Bairdford
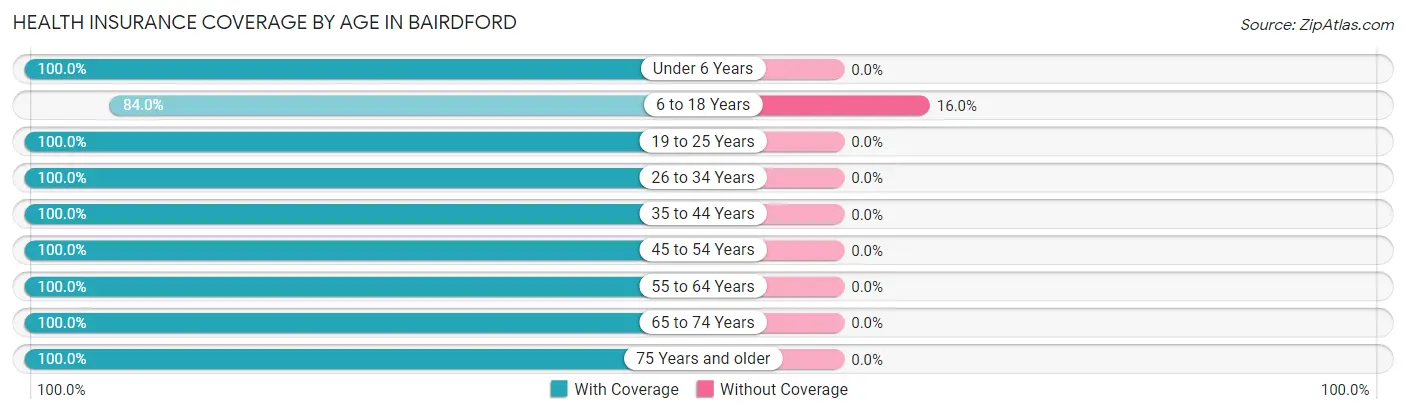
| Age Bracket | With Coverage | Without Coverage |
| Under 6 Years | 56 (100.0%) | 0 (0.0%) |
| 6 to 18 Years | 79 (84.0%) | 15 (16.0%) |
| 19 to 25 Years | 31 (100.0%) | 0 (0.0%) |
| 26 to 34 Years | 35 (100.0%) | 0 (0.0%) |
| 35 to 44 Years | 75 (100.0%) | 0 (0.0%) |
| 45 to 54 Years | 77 (100.0%) | 0 (0.0%) |
| 55 to 64 Years | 107 (100.0%) | 0 (0.0%) |
| 65 to 74 Years | 119 (100.0%) | 0 (0.0%) |
| 75 Years and older | 59 (100.0%) | 0 (0.0%) |
| Total | 638 (97.7%) | 15 (2.3%) |
Health Insurance Coverage by Citizenship Status in Bairdford
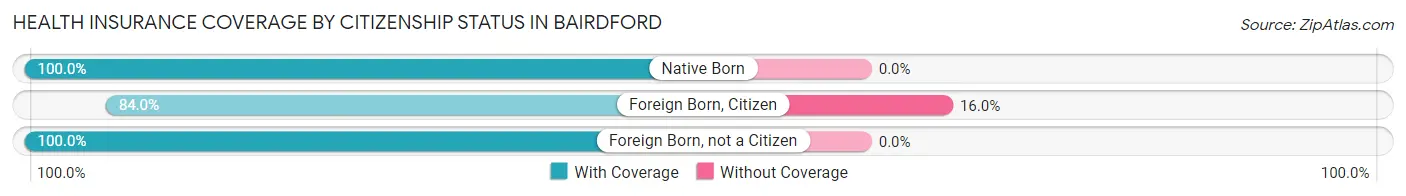
| Citizenship Status | With Coverage | Without Coverage |
| Native Born | 56 (100.0%) | 0 (0.0%) |
| Foreign Born, Citizen | 79 (84.0%) | 15 (16.0%) |
| Foreign Born, not a Citizen | 31 (100.0%) | 0 (0.0%) |
Health Insurance Coverage by Household Income in Bairdford
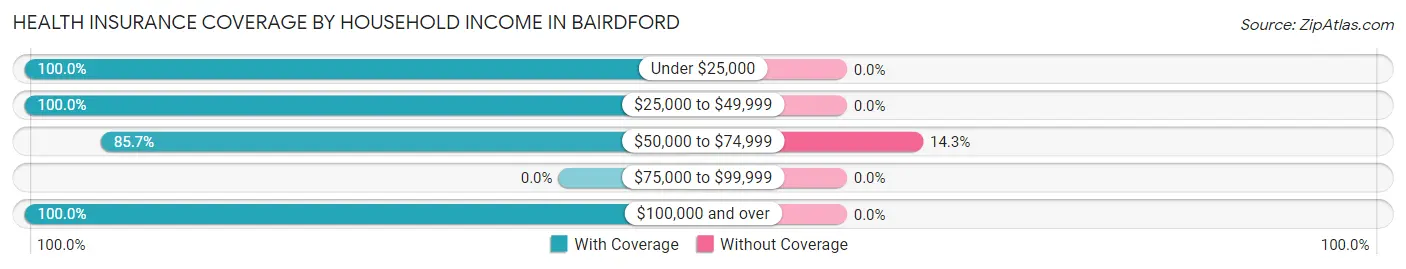
| Household Income | With Coverage | Without Coverage |
| Under $25,000 | 44 (100.0%) | 0 (0.0%) |
| $25,000 to $49,999 | 119 (100.0%) | 0 (0.0%) |
| $50,000 to $74,999 | 90 (85.7%) | 15 (14.3%) |
| $75,000 to $99,999 | 0 (0.0%) | 0 (0.0%) |
| $100,000 and over | 385 (100.0%) | 0 (0.0%) |
Public vs Private Health Insurance Coverage by Age in Bairdford
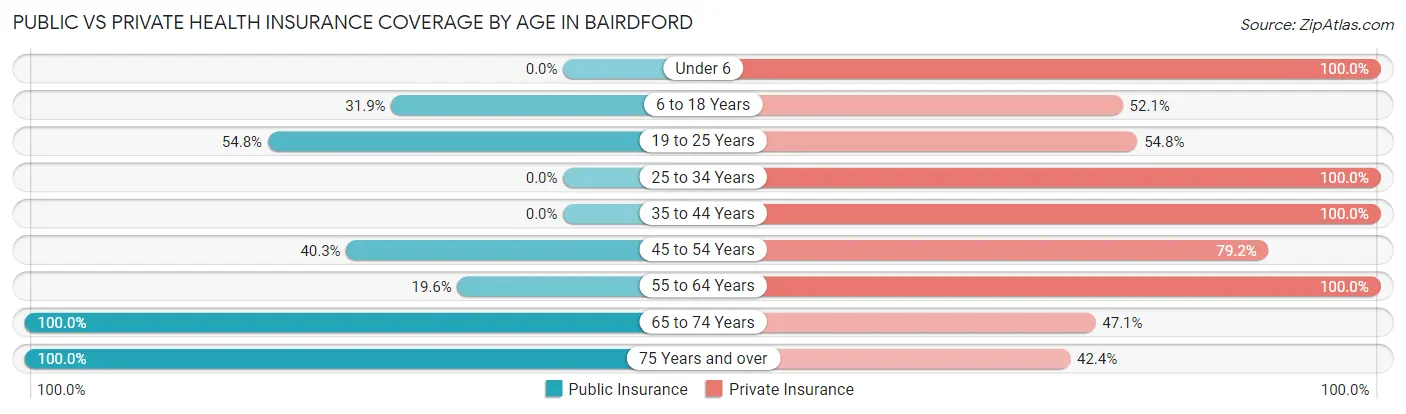
| Age Bracket | Public Insurance | Private Insurance |
| Under 6 | 0 (0.0%) | 56 (100.0%) |
| 6 to 18 Years | 30 (31.9%) | 49 (52.1%) |
| 19 to 25 Years | 17 (54.8%) | 17 (54.8%) |
| 25 to 34 Years | 0 (0.0%) | 35 (100.0%) |
| 35 to 44 Years | 0 (0.0%) | 75 (100.0%) |
| 45 to 54 Years | 31 (40.3%) | 61 (79.2%) |
| 55 to 64 Years | 21 (19.6%) | 107 (100.0%) |
| 65 to 74 Years | 119 (100.0%) | 56 (47.1%) |
| 75 Years and over | 59 (100.0%) | 25 (42.4%) |
| Total | 277 (42.4%) | 481 (73.7%) |
Disability Status by Sex by Age in Bairdford
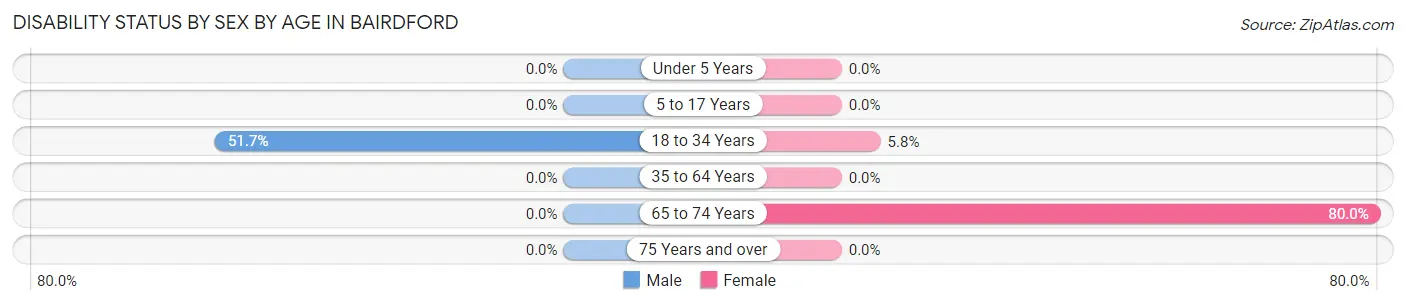
| Age Bracket | Male | Female |
| Under 5 Years | 0 (0.0%) | 0 (0.0%) |
| 5 to 17 Years | 0 (0.0%) | 0 (0.0%) |
| 18 to 34 Years | 15 (51.7%) | 3 (5.8%) |
| 35 to 64 Years | 0 (0.0%) | 0 (0.0%) |
| 65 to 74 Years | 0 (0.0%) | 44 (80.0%) |
| 75 Years and over | 0 (0.0%) | 0 (0.0%) |
Disability Class by Sex by Age in Bairdford
Disability Class: Hearing Difficulty
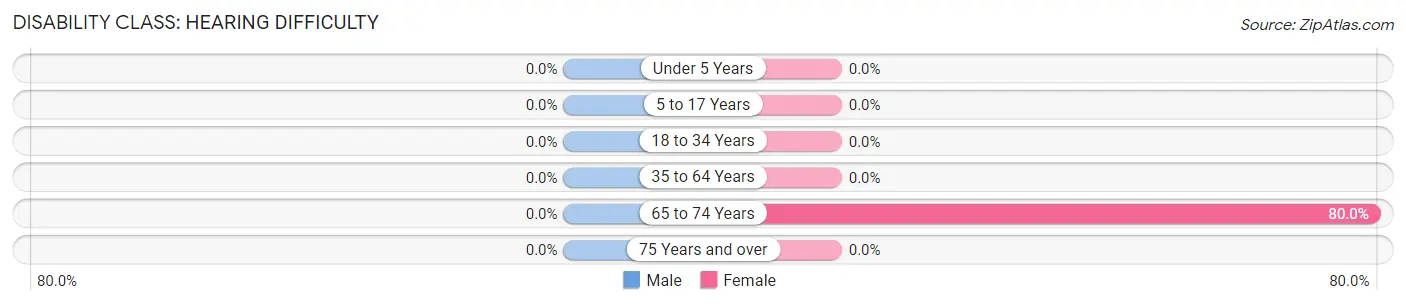
| Age Bracket | Male | Female |
| Under 5 Years | 0 (0.0%) | 0 (0.0%) |
| 5 to 17 Years | 0 (0.0%) | 0 (0.0%) |
| 18 to 34 Years | 0 (0.0%) | 0 (0.0%) |
| 35 to 64 Years | 0 (0.0%) | 0 (0.0%) |
| 65 to 74 Years | 0 (0.0%) | 44 (80.0%) |
| 75 Years and over | 0 (0.0%) | 0 (0.0%) |
Disability Class: Vision Difficulty
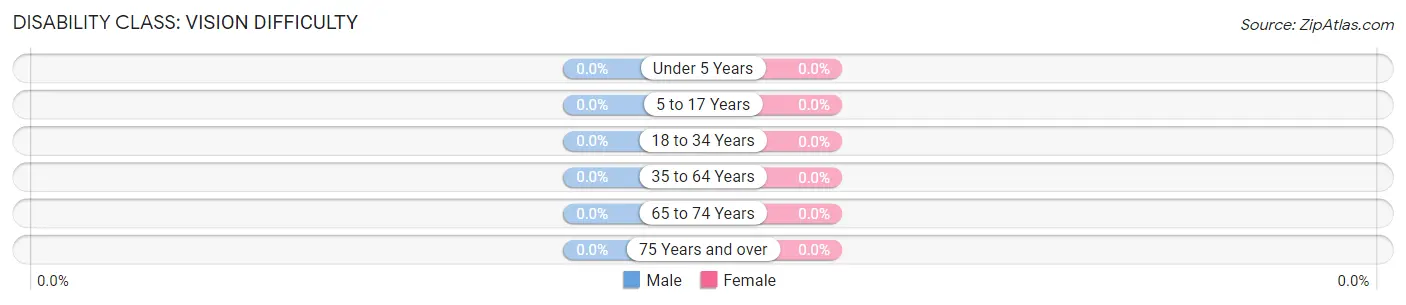
| Age Bracket | Male | Female |
| Under 5 Years | 0 (0.0%) | 0 (0.0%) |
| 5 to 17 Years | 0 (0.0%) | 0 (0.0%) |
| 18 to 34 Years | 0 (0.0%) | 0 (0.0%) |
| 35 to 64 Years | 0 (0.0%) | 0 (0.0%) |
| 65 to 74 Years | 0 (0.0%) | 0 (0.0%) |
| 75 Years and over | 0 (0.0%) | 0 (0.0%) |
Disability Class: Cognitive Difficulty
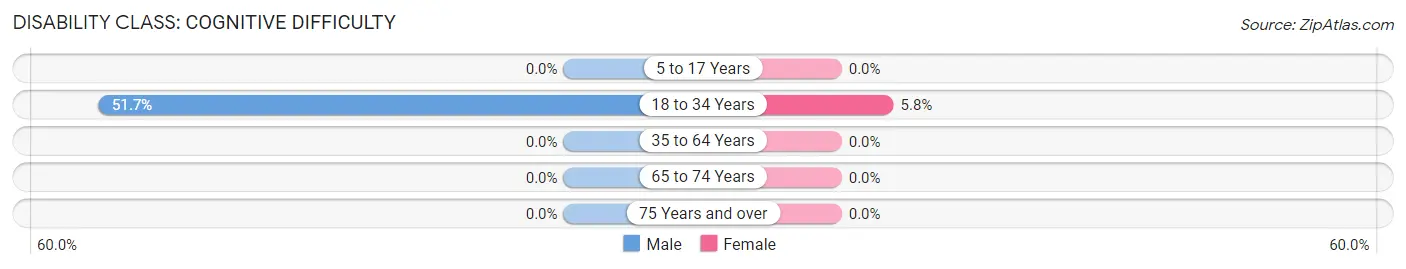
| Age Bracket | Male | Female |
| 5 to 17 Years | 0 (0.0%) | 0 (0.0%) |
| 18 to 34 Years | 15 (51.7%) | 3 (5.8%) |
| 35 to 64 Years | 0 (0.0%) | 0 (0.0%) |
| 65 to 74 Years | 0 (0.0%) | 0 (0.0%) |
| 75 Years and over | 0 (0.0%) | 0 (0.0%) |
Disability Class: Ambulatory Difficulty
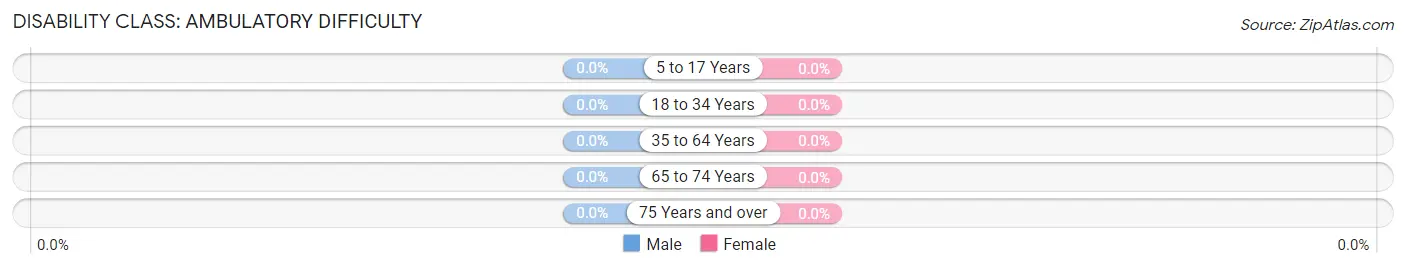
| Age Bracket | Male | Female |
| 5 to 17 Years | 0 (0.0%) | 0 (0.0%) |
| 18 to 34 Years | 0 (0.0%) | 0 (0.0%) |
| 35 to 64 Years | 0 (0.0%) | 0 (0.0%) |
| 65 to 74 Years | 0 (0.0%) | 0 (0.0%) |
| 75 Years and over | 0 (0.0%) | 0 (0.0%) |
Disability Class: Self-Care Difficulty
| Age Bracket | Male | Female |
| 5 to 17 Years | 0 (0.0%) | 0 (0.0%) |
| 18 to 34 Years | 0 (0.0%) | 0 (0.0%) |
| 35 to 64 Years | 0 (0.0%) | 0 (0.0%) |
| 65 to 74 Years | 0 (0.0%) | 0 (0.0%) |
| 75 Years and over | 0 (0.0%) | 0 (0.0%) |
Technology Access in Bairdford
Computing Device Access in Bairdford
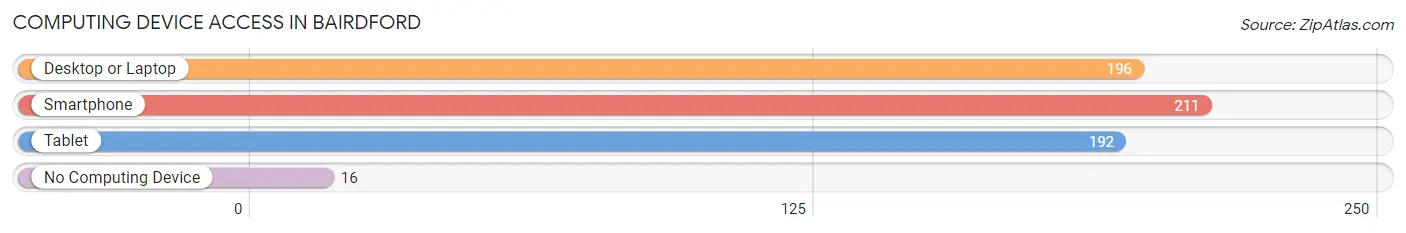
| Device Type | # Households | % Households |
| Desktop or Laptop | 196 | 76.6% |
| Smartphone | 211 | 82.4% |
| Tablet | 192 | 75.0% |
| No Computing Device | 16 | 6.2% |
| Total | 256 | 100.0% |
Internet Access in Bairdford
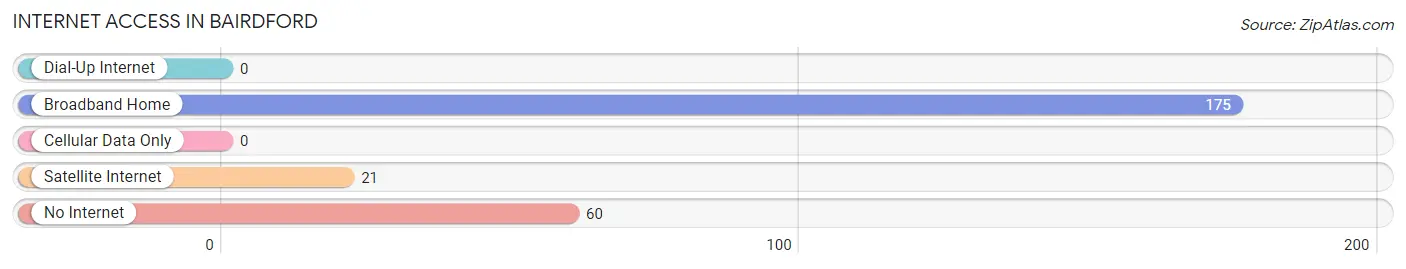
| Internet Type | # Households | % Households |
| Dial-Up Internet | 0 | 0.0% |
| Broadband Home | 175 | 68.4% |
| Cellular Data Only | 0 | 0.0% |
| Satellite Internet | 21 | 8.2% |
| No Internet | 60 | 23.4% |
| Total | 256 | 100.0% |
Bairdford Summary
Bairdford is a small borough located in Allegheny County, Pennsylvania. It is situated in the southwestern part of the state, about 20 miles northwest of Pittsburgh. The population of Bairdford was 1,845 at the 2010 census.
History
Bairdford was founded in 1876 by William Baird, a local farmer. He named the town after himself and it was incorporated as a borough in 1887. The town was originally a farming community, but it soon developed into a small industrial center. The first industry in Bairdford was a sawmill, which was built in 1877. This was followed by a brickyard, a grist mill, and a tannery.
In the early 1900s, Bairdford was home to several coal mines, which provided employment for many of the town’s residents. The coal industry declined in the mid-1900s, and the town’s economy shifted to a more service-oriented one.
Geography
Bairdford is located in southwestern Pennsylvania, about 20 miles northwest of Pittsburgh. It is situated in the Allegheny Plateau region of the state, and is surrounded by rolling hills and forests. The borough is located on the banks of the Allegheny River, and is bordered by the towns of Oakdale, McDonald, and South Fayette.
The climate in Bairdford is humid continental, with hot summers and cold winters. The average annual temperature is around 50 degrees Fahrenheit, and the average annual precipitation is around 40 inches.
Economy
Bairdford’s economy is largely based on services and retail. The town is home to several small businesses, including restaurants, shops, and professional services. The town also has a few manufacturing companies, including a plastics factory and a metal fabrication plant.
The town is also home to a few small farms, which produce a variety of crops, including corn, soybeans, and hay.
Demographics
As of the 2010 census, the population of Bairdford was 1,845. The racial makeup of the town was 97.3% White, 0.9% African American, 0.2% Native American, 0.3% Asian, and 1.3% from other races. The median household income was $45,938, and the median family income was $51,938.
The town is served by the South Fayette School District. The town has one elementary school, one middle school, and one high school.
Conclusion
Bairdford is a small borough located in southwestern Pennsylvania. It was founded in 1876 and was originally a farming community. The town’s economy is largely based on services and retail, and it is home to several small businesses. The population of Bairdford was 1,845 at the 2010 census, and the median household income was $45,938. The town is served by the South Fayette School District and has one elementary school, one middle school, and one high school.
Common Questions
What is Per Capita Income in Bairdford?
Per Capita income in Bairdford is $37,157.
What is the Median Family Income in Bairdford?
Median Family Income in Bairdford is $114,632.
What is Income or Wage Gap in Bairdford?
Income or Wage Gap in Bairdford is 33.4%.
Women in Bairdford earn 66.6 cents for every dollar earned by a man.
What is Inequality or Gini Index in Bairdford?
Inequality or Gini Index in Bairdford is 0.45.
What is the Total Population of Bairdford?
Total Population of Bairdford is 653.
What is the Total Male Population of Bairdford?
Total Male Population of Bairdford is 341.
What is the Total Female Population of Bairdford?
Total Female Population of Bairdford is 312.
What is the Ratio of Males per 100 Females in Bairdford?
There are 109.29 Males per 100 Females in Bairdford.
What is the Ratio of Females per 100 Males in Bairdford?
There are 91.50 Females per 100 Males in Bairdford.
What is the Median Population Age in Bairdford?
Median Population Age in Bairdford is 51.4 Years.
What is the Average Family Size in Bairdford
Average Family Size in Bairdford is 2.8 People.
What is the Average Household Size in Bairdford
Average Household Size in Bairdford is 2.5 People.
How Large is the Labor Force in Bairdford?
There are 356 People in the Labor Forcein in Bairdford.
What is the Percentage of People in the Labor Force in Bairdford?
66.9% of People are in the Labor Force in Bairdford.