Zip Codes with the Highest Percentage of Population with a Degree in Liberal Arts and History in Scranton, PA
RELATED REPORTS & OPTIONS
Liberal Arts and History
Scranton
Compare Zip Codes
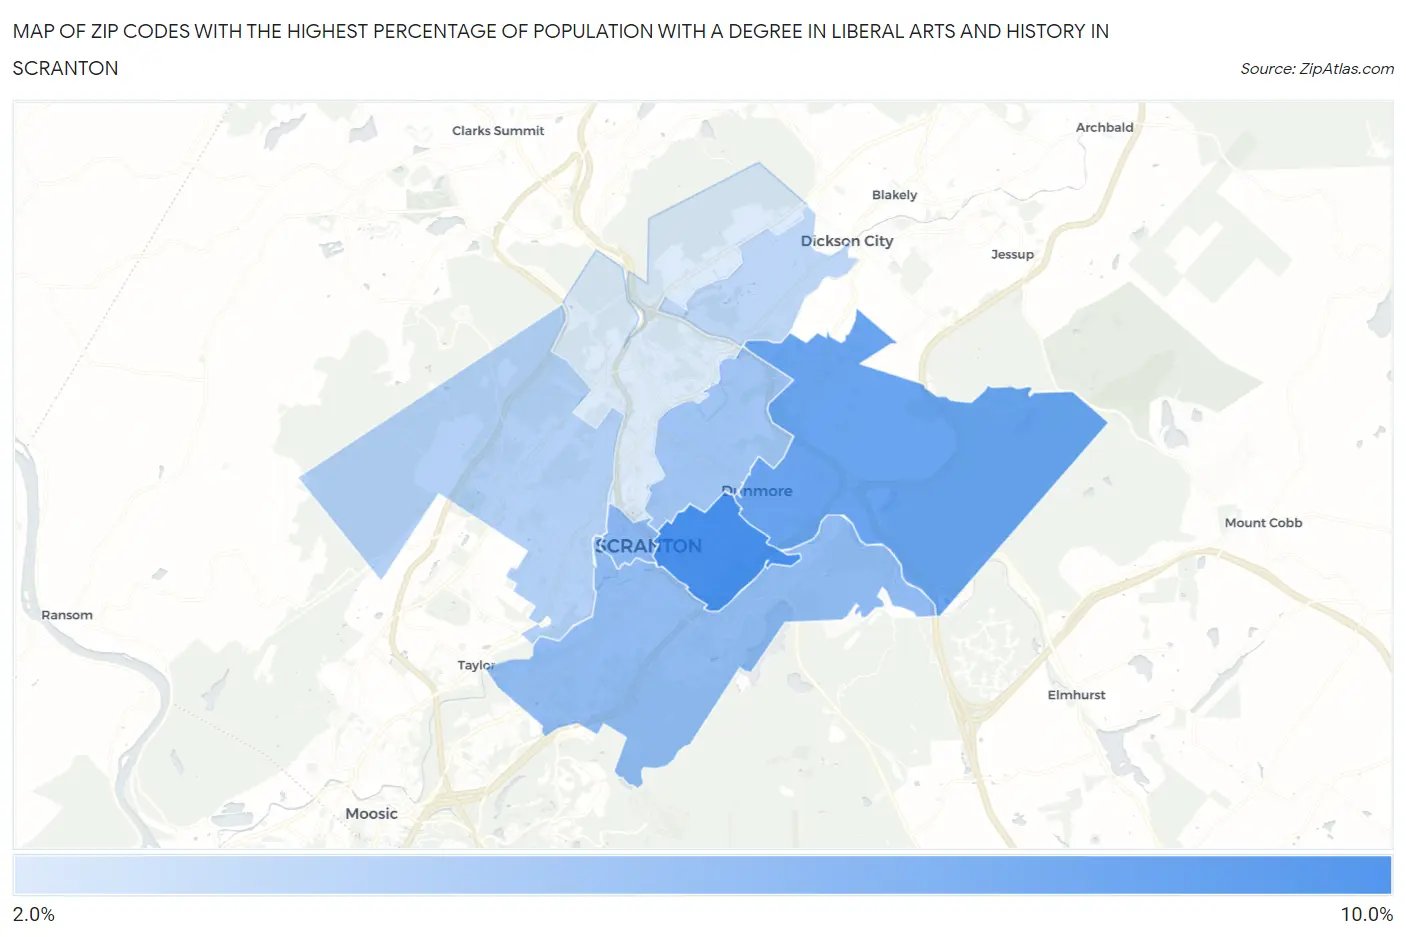
Map of Zip Codes with the Highest Percentage of Population with a Degree in Liberal Arts and History in Scranton
3.0%
8.6%
Zip Codes with the Highest Percentage of Population with a Degree in Liberal Arts and History in Scranton, PA
| Zip Code | % Graduates | vs State | vs National | |
| 1. | 18510 | 8.6% | 4.6%(+3.98)#210 | 4.9%(+3.72)#4,247 |
| 2. | 18512 | 7.2% | 4.6%(+2.63)#293 | 4.9%(+2.37)#5,985 |
| 3. | 18503 | 6.0% | 4.6%(+1.39)#423 | 4.9%(+1.13)#8,512 |
| 4. | 18505 | 5.8% | 4.6%(+1.21)#449 | 4.9%(+0.944)#8,999 |
| 5. | 18509 | 5.2% | 4.6%(+0.567)#533 | 4.9%(+0.304)#10,795 |
| 6. | 18504 | 4.5% | 4.6%(-0.110)#651 | 4.9%(-0.373)#12,975 |
| 7. | 18519 | 4.1% | 4.6%(-0.506)#727 | 4.9%(-0.769)#14,388 |
| 8. | 18508 | 3.0% | 4.6%(-1.66)#931 | 4.9%(-1.92)#18,516 |
1
Common Questions
What are the Top 5 Zip Codes with the Highest Percentage of Population with a Degree in Liberal Arts and History in Scranton, PA?
Top 5 Zip Codes with the Highest Percentage of Population with a Degree in Liberal Arts and History in Scranton, PA are:
What zip code has the Highest Percentage of Population with a Degree in Liberal Arts and History in Scranton, PA?
18510 has the Highest Percentage of Population with a Degree in Liberal Arts and History in Scranton, PA with 8.6%.
What is the Percentage of Population with a Degree in Liberal Arts and History in Scranton, PA?
Percentage of Population with a Degree in Liberal Arts and History in Scranton is 6.0%.
What is the Percentage of Population with a Degree in Liberal Arts and History in Pennsylvania?
Percentage of Population with a Degree in Liberal Arts and History in Pennsylvania is 4.6%.
What is the Percentage of Population with a Degree in Liberal Arts and History in the United States?
Percentage of Population with a Degree in Liberal Arts and History in the United States is 4.9%.