Zip Codes with the Highest Percentage of Population with a Degree in Liberal Arts and History in Easton, PA
RELATED REPORTS & OPTIONS
Liberal Arts and History
Easton
Compare Zip Codes
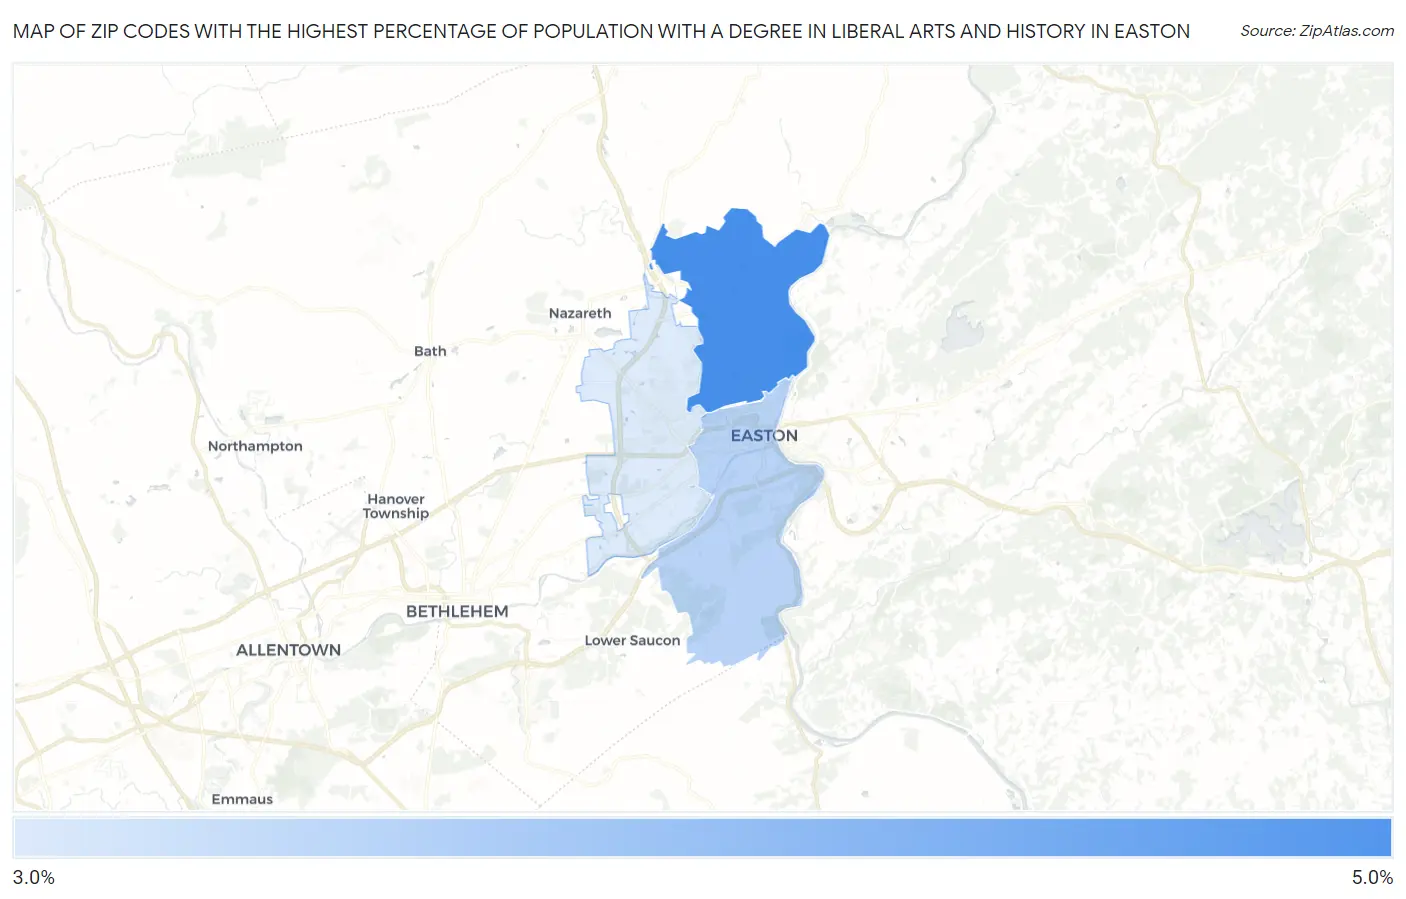
Map of Zip Codes with the Highest Percentage of Population with a Degree in Liberal Arts and History in Easton
3.1%
4.9%
Zip Codes with the Highest Percentage of Population with a Degree in Liberal Arts and History in Easton, PA
| Zip Code | % Graduates | vs State | vs National | |
| 1. | 18040 | 4.9% | 4.6%(+0.287)#585 | 4.9%(+0.024)#11,650 |
| 2. | 18042 | 3.5% | 4.6%(-1.09)#824 | 4.9%(-1.35)#16,518 |
| 3. | 18045 | 3.1% | 4.6%(-1.52)#903 | 4.9%(-1.78)#18,019 |
1
Common Questions
What are the Top Zip Codes with the Highest Percentage of Population with a Degree in Liberal Arts and History in Easton, PA?
Top Zip Codes with the Highest Percentage of Population with a Degree in Liberal Arts and History in Easton, PA are:
What zip code has the Highest Percentage of Population with a Degree in Liberal Arts and History in Easton, PA?
18040 has the Highest Percentage of Population with a Degree in Liberal Arts and History in Easton, PA with 4.9%.
What is the Percentage of Population with a Degree in Liberal Arts and History in Easton, PA?
Percentage of Population with a Degree in Liberal Arts and History in Easton is 4.4%.
What is the Percentage of Population with a Degree in Liberal Arts and History in Pennsylvania?
Percentage of Population with a Degree in Liberal Arts and History in Pennsylvania is 4.6%.
What is the Percentage of Population with a Degree in Liberal Arts and History in the United States?
Percentage of Population with a Degree in Liberal Arts and History in the United States is 4.9%.