St Vincent College, PA Map & Demographics
St Vincent College Map
St Vincent College Overview
$7,628
PER CAPITA INCOME
46.3%
WAGE / INCOME GAP [ % ]
53.7¢/ $1
WAGE / INCOME GAP [ $ ]
1,435
TOTAL POPULATION
789
MALE POPULATION
646
FEMALE POPULATION
122.14
MALES / 100 FEMALES
81.88
FEMALES / 100 MALES
20.2
MEDIAN AGE
621
LABOR FORCE [ PEOPLE ]
43.3%
PERCENT IN LABOR FORCE
14.2%
UNEMPLOYMENT RATE
Income in St Vincent College
Income Overview in St Vincent College
| Characteristic | Number | Measure |
| Per Capita Income | 1,435 | $7,628 |
| Median Family Income | 0 | $0 |
| Mean Family Income | 0 | $0 |
| Median Household Income | 0 | $0 |
| Mean Household Income | 0 | $0 |
| Income Deficit | 0 | $0 |
| Wage / Income Gap (%) | 1,435 | 46.30% |
| Wage / Income Gap ($) | 1,435 | 53.70¢ per $1 |
| Gini / Inequality Index | 1,435 | 0.00 |
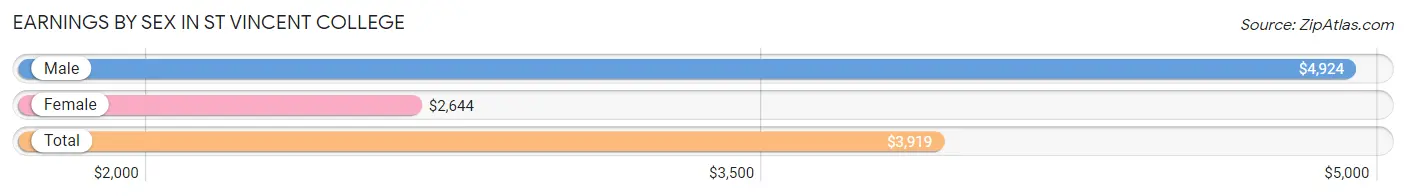
Earnings by Sex in St Vincent College
Average Earnings in St Vincent College are $3,919, $4,924 for men and $2,644 for women, a difference of 46.3%.
| Sex | Number | Average Earnings |
| Male | 628 (55.4%) | $4,924 |
| Female | 506 (44.6%) | $2,644 |
| Total | 1,134 (100.0%) | $3,919 |
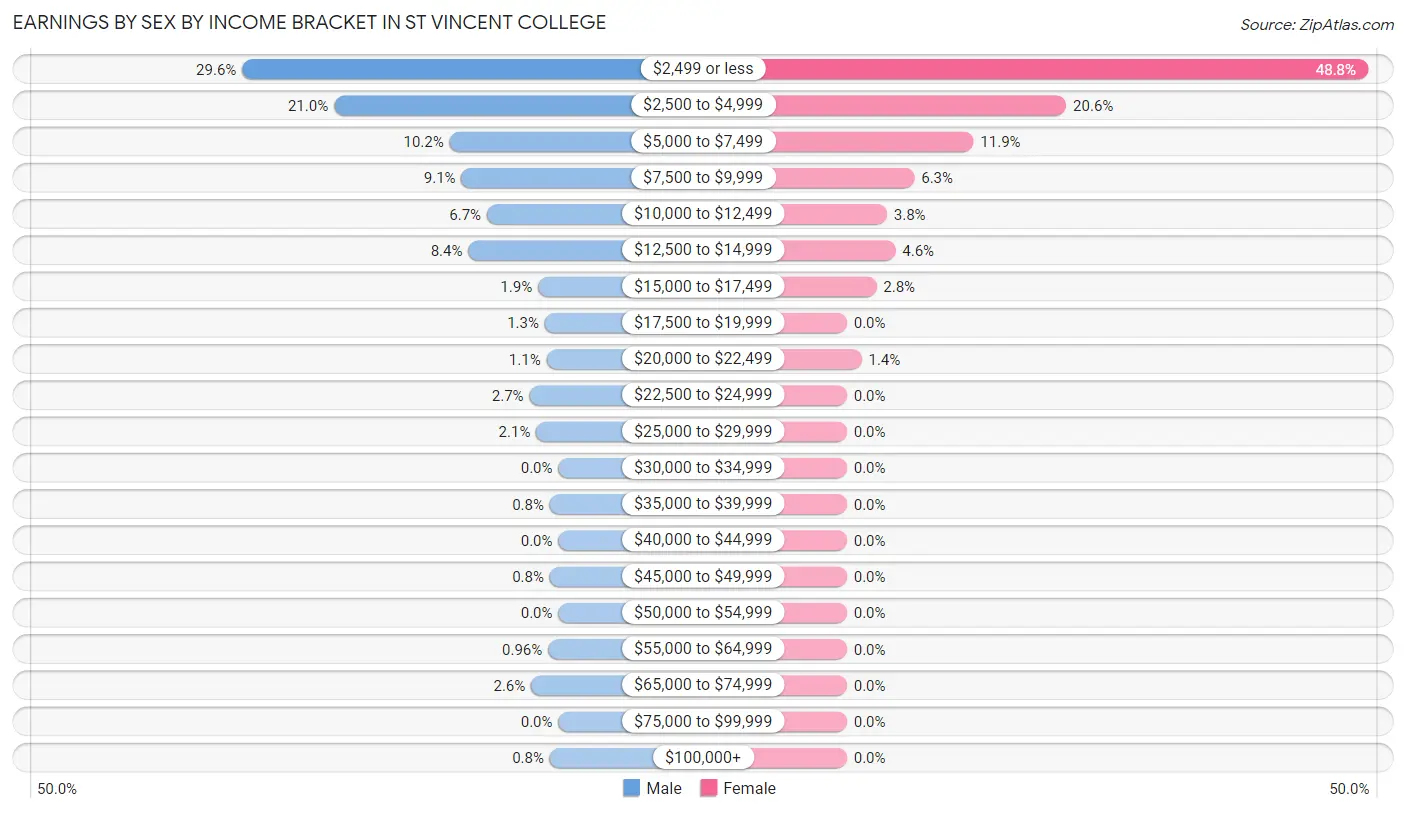
Earnings by Sex by Income Bracket in St Vincent College
The most common earnings brackets in St Vincent College are $2,499 or less for men (186 | 29.6%) and $2,499 or less for women (247 | 48.8%).
| Income | Male | Female |
| $2,499 or less | 186 (29.6%) | 247 (48.8%) |
| $2,500 to $4,999 | 132 (21.0%) | 104 (20.5%) |
| $5,000 to $7,499 | 64 (10.2%) | 60 (11.9%) |
| $7,500 to $9,999 | 57 (9.1%) | 32 (6.3%) |
| $10,000 to $12,499 | 42 (6.7%) | 19 (3.7%) |
| $12,500 to $14,999 | 53 (8.4%) | 23 (4.5%) |
| $15,000 to $17,499 | 12 (1.9%) | 14 (2.8%) |
| $17,500 to $19,999 | 8 (1.3%) | 0 (0.0%) |
| $20,000 to $22,499 | 7 (1.1%) | 7 (1.4%) |
| $22,500 to $24,999 | 17 (2.7%) | 0 (0.0%) |
| $25,000 to $29,999 | 13 (2.1%) | 0 (0.0%) |
| $30,000 to $34,999 | 0 (0.0%) | 0 (0.0%) |
| $35,000 to $39,999 | 5 (0.8%) | 0 (0.0%) |
| $40,000 to $44,999 | 0 (0.0%) | 0 (0.0%) |
| $45,000 to $49,999 | 5 (0.8%) | 0 (0.0%) |
| $50,000 to $54,999 | 0 (0.0%) | 0 (0.0%) |
| $55,000 to $64,999 | 6 (1.0%) | 0 (0.0%) |
| $65,000 to $74,999 | 16 (2.5%) | 0 (0.0%) |
| $75,000 to $99,999 | 0 (0.0%) | 0 (0.0%) |
| $100,000+ | 5 (0.8%) | 0 (0.0%) |
| Total | 628 (100.0%) | 506 (100.0%) |
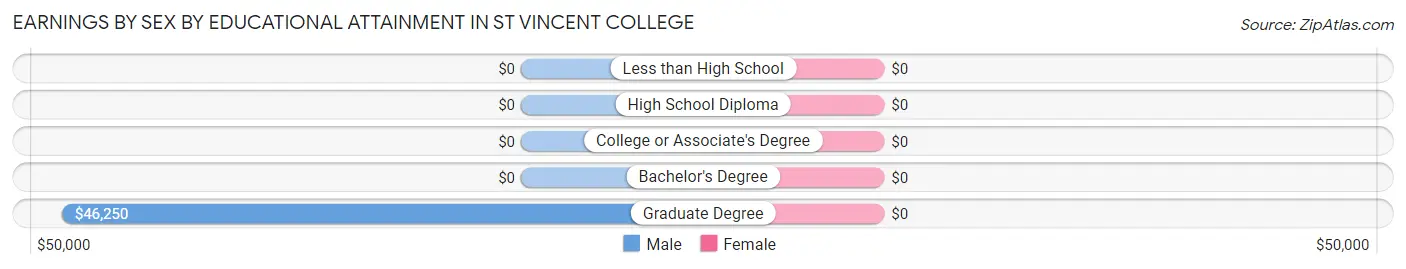
Earnings by Sex by Educational Attainment in St Vincent College
| Educational Attainment | Male Income | Female Income |
| Less than High School | - | - |
| High School Diploma | - | - |
| College or Associate's Degree | - | - |
| Bachelor's Degree | - | - |
| Graduate Degree | $46,250 | $0 |
| Total | $27,292 | $0 |
Family Income in St Vincent College
Family Income Brackets in St Vincent College
| Income Bracket | # Families | % Families |
| Less than $10,000 | 0 | 0.0% |
| $10,000 to $14,999 | 0 | 0.0% |
| $15,000 to $24,999 | 0 | 0.0% |
| $25,000 to $34,999 | 0 | 0.0% |
| $35,000 to $49,999 | 0 | 0.0% |
| $50,000 to $74,999 | 0 | 0.0% |
| $75,000 to $99,999 | 0 | 0.0% |
| $100,000 to $149,999 | 0 | 0.0% |
| $150,000 to $199,999 | 0 | 0.0% |
| $200,000+ | 0 | 0.0% |
Family Income by Famaliy Size in St Vincent College
| Income Bracket | # Families | Median Income |
| 2-Person Families | 0 (0.0%) | $0 |
| 3-Person Families | 0 (0.0%) | $0 |
| 4-Person Families | 0 (0.0%) | $0 |
| 5-Person Families | 0 (0.0%) | $0 |
| 6-Person Families | 0 (0.0%) | $0 |
| 7+ Person Families | 0 (0.0%) | $0 |
| Total | 0 (0.0%) | $0 |
Family Income by Number of Earners in St Vincent College
| Number of Earners | # Families | Median Income |
| No Earners | 0 (0.0%) | $0 |
| 1 Earner | 0 (0.0%) | $0 |
| 2 Earners | 0 (0.0%) | $0 |
| 3+ Earners | 0 (0.0%) | $0 |
| Total | 0 (0.0%) | $0 |
Household Income in St Vincent College
Household Income Brackets in St Vincent College
| Income Bracket | # Households | % Households |
| Less than $10,000 | 0 | 0.0% |
| $10,000 to $14,999 | 0 | 0.0% |
| $15,000 to $24,999 | 0 | 0.0% |
| $25,000 to $34,999 | 0 | 0.0% |
| $35,000 to $49,999 | 0 | 0.0% |
| $50,000 to $74,999 | 0 | 0.0% |
| $75,000 to $99,999 | 0 | 0.0% |
| $100,000 to $149,999 | 0 | 0.0% |
| $150,000 to $199,999 | 0 | 0.0% |
| $200,000+ | 0 | 0.0% |
Household Income by Householder Age in St Vincent College
| Income Bracket | # Households | Median Income |
| 15 to 24 Years | 0 (0.0%) | $0 |
| 25 to 44 Years | 0 (0.0%) | $0 |
| 45 to 64 Years | 0 (0.0%) | $0 |
| 65+ Years | 0 (0.0%) | $0 |
| Total | 0 (0.0%) | $0 |
Poverty in St Vincent College
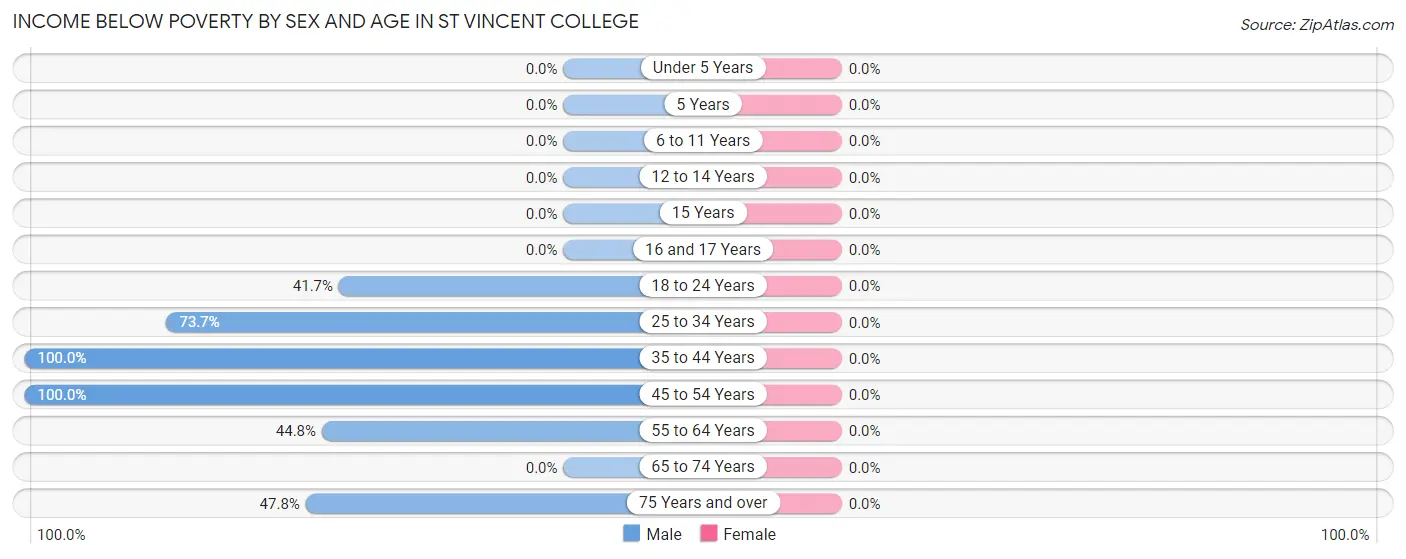
Income Below Poverty by Sex and Age in St Vincent College
| Age Bracket | Male | Female |
| Under 5 Years | 0 (0.0%) | 0 (0.0%) |
| 5 Years | 0 (0.0%) | 0 (0.0%) |
| 6 to 11 Years | 0 (0.0%) | 0 (0.0%) |
| 12 to 14 Years | 0 (0.0%) | 0 (0.0%) |
| 15 Years | 0 (0.0%) | 0 (0.0%) |
| 16 and 17 Years | 0 (0.0%) | 0 (0.0%) |
| 18 to 24 Years | 5 (41.7%) | 0 (0.0%) |
| 25 to 34 Years | 14 (73.7%) | 0 (0.0%) |
| 35 to 44 Years | 13 (100.0%) | 0 (0.0%) |
| 45 to 54 Years | 1 (100.0%) | 0 (0.0%) |
| 55 to 64 Years | 13 (44.8%) | 0 (0.0%) |
| 65 to 74 Years | 0 (0.0%) | 0 (0.0%) |
| 75 Years and over | 11 (47.8%) | 0 (0.0%) |
| Total | 57 (44.9%) | 0 (0.0%) |
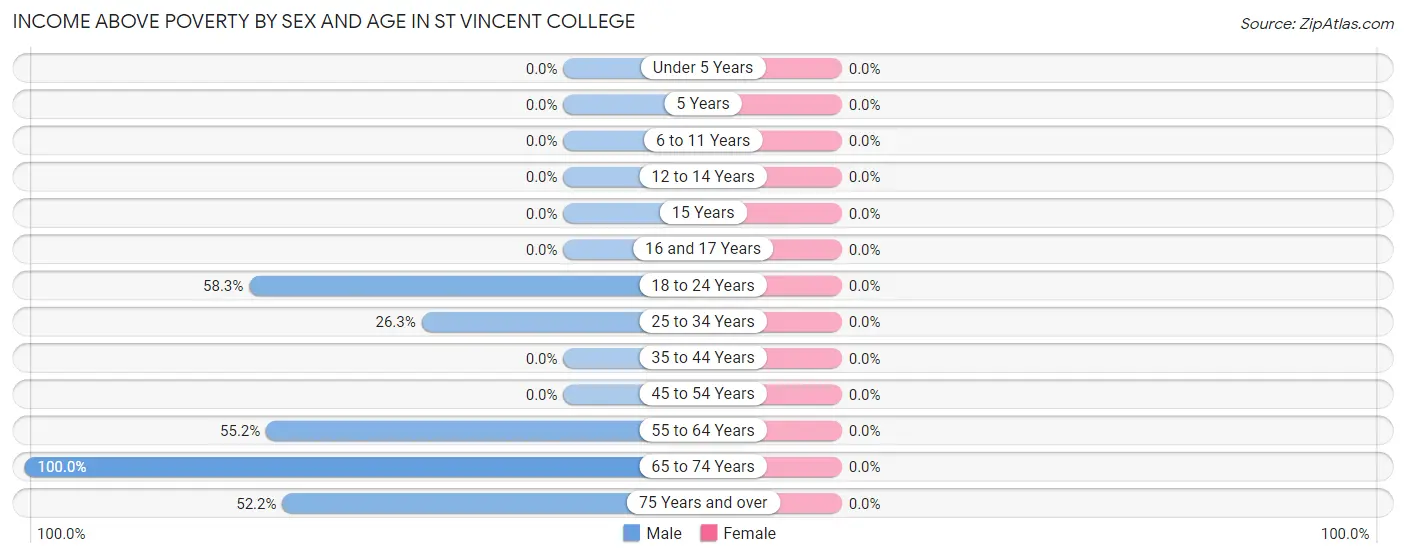
Income Above Poverty by Sex and Age in St Vincent College
| Age Bracket | Male | Female |
| Under 5 Years | 0 (0.0%) | 0 (0.0%) |
| 5 Years | 0 (0.0%) | 0 (0.0%) |
| 6 to 11 Years | 0 (0.0%) | 0 (0.0%) |
| 12 to 14 Years | 0 (0.0%) | 0 (0.0%) |
| 15 Years | 0 (0.0%) | 0 (0.0%) |
| 16 and 17 Years | 0 (0.0%) | 0 (0.0%) |
| 18 to 24 Years | 7 (58.3%) | 0 (0.0%) |
| 25 to 34 Years | 5 (26.3%) | 0 (0.0%) |
| 35 to 44 Years | 0 (0.0%) | 0 (0.0%) |
| 45 to 54 Years | 0 (0.0%) | 0 (0.0%) |
| 55 to 64 Years | 16 (55.2%) | 0 (0.0%) |
| 65 to 74 Years | 30 (100.0%) | 0 (0.0%) |
| 75 Years and over | 12 (52.2%) | 0 (0.0%) |
| Total | 70 (55.1%) | 0 (0.0%) |
Income Below Poverty Among Married-Couple Families in St Vincent College
| Children | Above Poverty | Below Poverty |
| No Children | 0 (0.0%) | 0 (0.0%) |
| 1 or 2 Children | 0 (0.0%) | 0 (0.0%) |
| 3 or 4 Children | 0 (0.0%) | 0 (0.0%) |
| 5 or more Children | 0 (0.0%) | 0 (0.0%) |
| Total | 0 (0.0%) | 0 (0.0%) |
Income Below Poverty Among Single-Parent Households in St Vincent College
| Children | Single Father | Single Mother |
| No Children | 0 (0.0%) | 0 (0.0%) |
| 1 or 2 Children | 0 (0.0%) | 0 (0.0%) |
| 3 or 4 Children | 0 (0.0%) | 0 (0.0%) |
| 5 or more Children | 0 (0.0%) | 0 (0.0%) |
| Total | 0 (0.0%) | 0 (0.0%) |
Income Below Poverty Among Married-Couple vs Single-Parent Households in St Vincent College
| Children | Married-Couple Families | Single-Parent Households |
| No Children | 0 (0.0%) | 0 (0.0%) |
| 1 or 2 Children | 0 (0.0%) | 0 (0.0%) |
| 3 or 4 Children | 0 (0.0%) | 0 (0.0%) |
| 5 or more Children | 0 (0.0%) | 0 (0.0%) |
| Total | 0 (0.0%) | 0 (0.0%) |
Race in St Vincent College
The most populous races in St Vincent College are White / Caucasian (1,292 | 90.0%), Black / African American (88 | 6.1%), and Hispanic or Latino (45 | 3.1%).
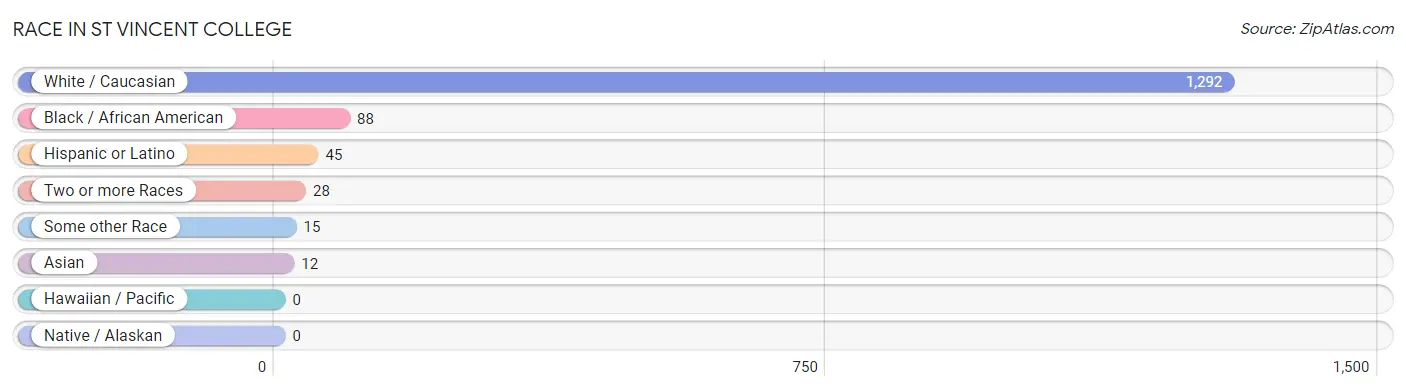
| Race | # Population | % Population |
| Asian | 12 | 0.8% |
| Black / African American | 88 | 6.1% |
| Hawaiian / Pacific | 0 | 0.0% |
| Hispanic or Latino | 45 | 3.1% |
| Native / Alaskan | 0 | 0.0% |
| White / Caucasian | 1,292 | 90.0% |
| Two or more Races | 28 | 1.9% |
| Some other Race | 15 | 1.1% |
| Total | 1,435 | 100.0% |
Ancestry in St Vincent College
The most populous ancestries reported in St Vincent College are Italian (227 | 15.8%), German (221 | 15.4%), Irish (204 | 14.2%), Slovak (57 | 4.0%), and European (52 | 3.6%), together accounting for 53.0% of all St Vincent College residents.
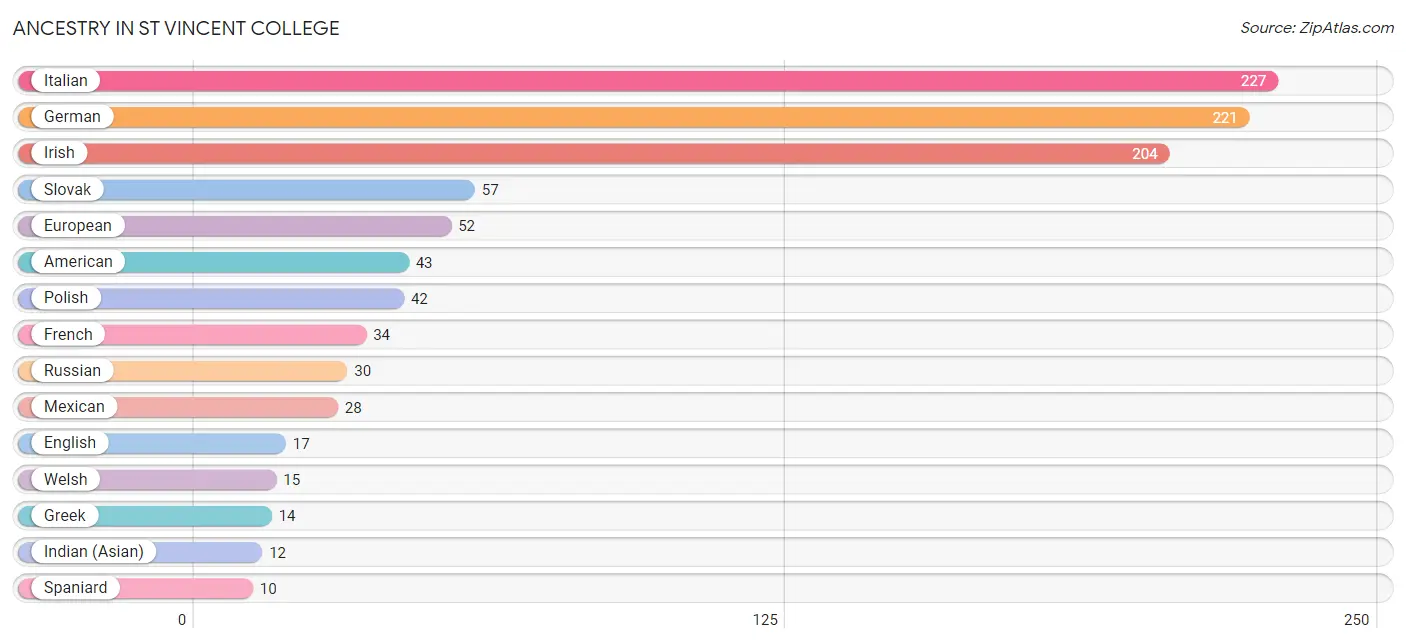
| Ancestry | # Population | % Population |
| American | 43 | 3.0% |
| Arab | 5 | 0.4% |
| Delaware | 5 | 0.4% |
| Dominican | 7 | 0.5% |
| Dutch | 6 | 0.4% |
| Eastern European | 9 | 0.6% |
| English | 17 | 1.2% |
| European | 52 | 3.6% |
| French | 34 | 2.4% |
| German | 221 | 15.4% |
| Greek | 14 | 1.0% |
| Indian (Asian) | 12 | 0.8% |
| Irish | 204 | 14.2% |
| Italian | 227 | 15.8% |
| Lebanese | 5 | 0.4% |
| Mexican | 28 | 1.9% |
| Norwegian | 5 | 0.4% |
| Polish | 42 | 2.9% |
| Russian | 30 | 2.1% |
| Scandinavian | 5 | 0.4% |
| Scotch-Irish | 5 | 0.4% |
| Slovak | 57 | 4.0% |
| Spaniard | 10 | 0.7% |
| Welsh | 15 | 1.1% | View All 24 Rows |
Immigrants in St Vincent College
The most numerous immigrant groups reported in St Vincent College came from Europe (16 | 1.1%), Brazil (13 | 0.9%), Latin America (13 | 0.9%), South America (13 | 0.9%), and Eastern Europe (10 | 0.7%), together accounting for 4.5% of all St Vincent College residents.
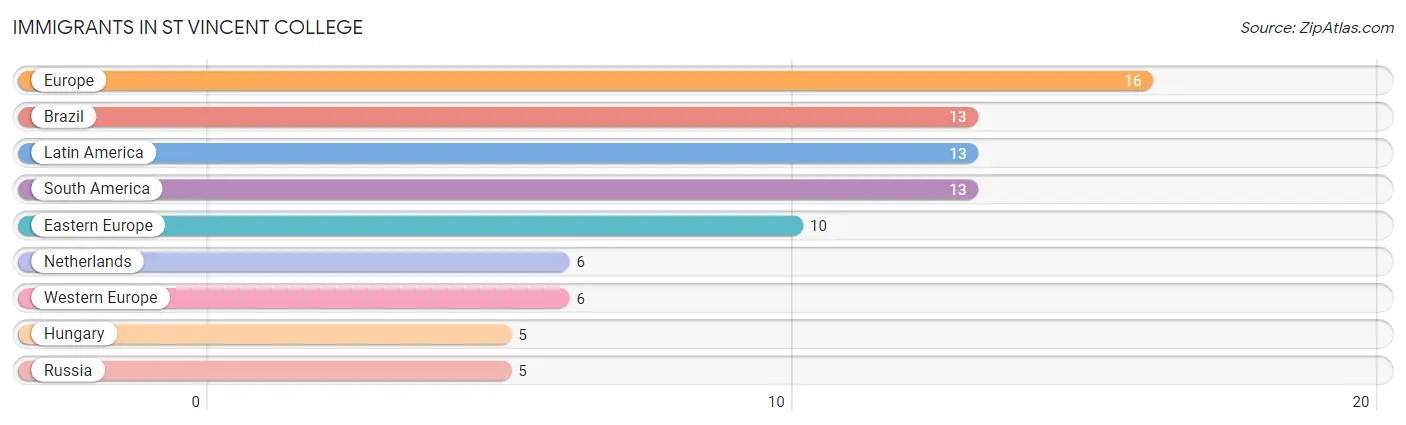
| Immigration Origin | # Population | % Population |
| Brazil | 13 | 0.9% |
| Eastern Europe | 10 | 0.7% |
| Europe | 16 | 1.1% |
| Hungary | 5 | 0.4% |
| Latin America | 13 | 0.9% |
| Netherlands | 6 | 0.4% |
| Russia | 5 | 0.4% |
| South America | 13 | 0.9% |
| Western Europe | 6 | 0.4% | View All 9 Rows |
Sex and Age in St Vincent College
Sex and Age in St Vincent College
The most populous age groups in St Vincent College are 20 to 24 Years (356 | 45.1%) for men and 15 to 19 Years (347 | 53.7%) for women.
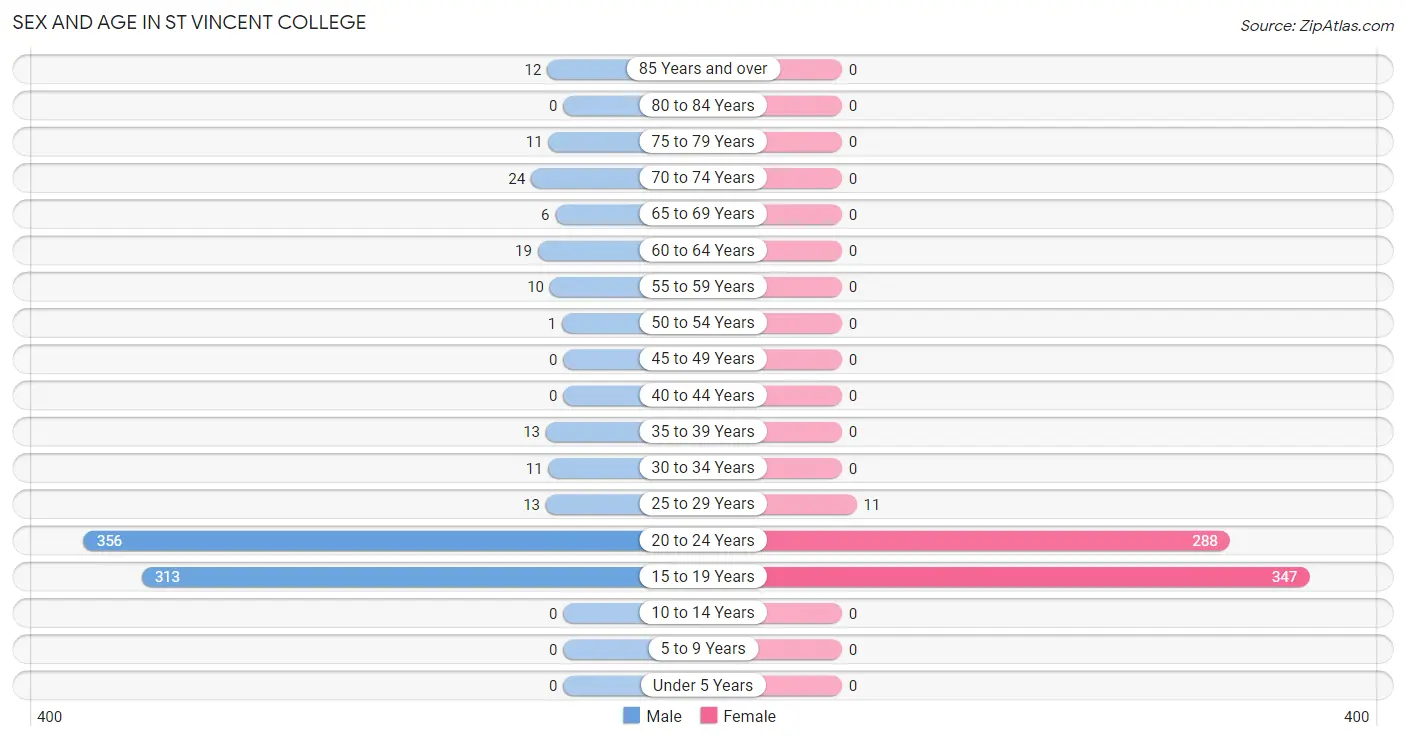
| Age Bracket | Male | Female |
| Under 5 Years | 0 (0.0%) | 0 (0.0%) |
| 5 to 9 Years | 0 (0.0%) | 0 (0.0%) |
| 10 to 14 Years | 0 (0.0%) | 0 (0.0%) |
| 15 to 19 Years | 313 (39.7%) | 347 (53.7%) |
| 20 to 24 Years | 356 (45.1%) | 288 (44.6%) |
| 25 to 29 Years | 13 (1.7%) | 11 (1.7%) |
| 30 to 34 Years | 11 (1.4%) | 0 (0.0%) |
| 35 to 39 Years | 13 (1.7%) | 0 (0.0%) |
| 40 to 44 Years | 0 (0.0%) | 0 (0.0%) |
| 45 to 49 Years | 0 (0.0%) | 0 (0.0%) |
| 50 to 54 Years | 1 (0.1%) | 0 (0.0%) |
| 55 to 59 Years | 10 (1.3%) | 0 (0.0%) |
| 60 to 64 Years | 19 (2.4%) | 0 (0.0%) |
| 65 to 69 Years | 6 (0.8%) | 0 (0.0%) |
| 70 to 74 Years | 24 (3.0%) | 0 (0.0%) |
| 75 to 79 Years | 11 (1.4%) | 0 (0.0%) |
| 80 to 84 Years | 0 (0.0%) | 0 (0.0%) |
| 85 Years and over | 12 (1.5%) | 0 (0.0%) |
| Total | 789 (100.0%) | 646 (100.0%) |
Families and Households in St Vincent College
Median Family Size in St Vincent College
| Family Type | # Families | Family Size |
| Married-Couple | 0 (0.0%) | - |
| Single Male/Father | 0 (0.0%) | - |
| Single Female/Mother | 0 (0.0%) | - |
| Total Families | 0 (0.0%) | - |
Median Household Size in St Vincent College
| Household Type | # Households | Household Size |
| Married-Couple | 0 (0.0%) | - |
| Single Male/Father | 0 (0.0%) | - |
| Single Female/Mother | 0 (0.0%) | - |
| Non-family | 0 (0.0%) | - |
| Total Households | 0 (0.0%) | - |
Household Size by Marriage Status in St Vincent College
| Household Size | Family Households | Nonfamily Households |
| 1-Person Households | - | 0 (0.0%) |
| 2-Person Households | 0 (0.0%) | 0 (0.0%) |
| 3-Person Households | 0 (0.0%) | 0 (0.0%) |
| 4-Person Households | 0 (0.0%) | 0 (0.0%) |
| 5-Person Households | 0 (0.0%) | 0 (0.0%) |
| 6-Person Households | 0 (0.0%) | 0 (0.0%) |
| 7+ Person Households | 0 (0.0%) | 0 (0.0%) |
| Total | 0 (0.0%) | 0 (0.0%) |
Female Fertility in St Vincent College
Fertility by Age in St Vincent College
Average fertility rate in St Vincent College is 12.0 births per 1,000 women. Women in the age bracket of 15 to 19 years have the highest fertility rate with 23.0 births per 1,000 women. Women in the age bracket of 15 to 19 years acount for 100.0% of all women with births.
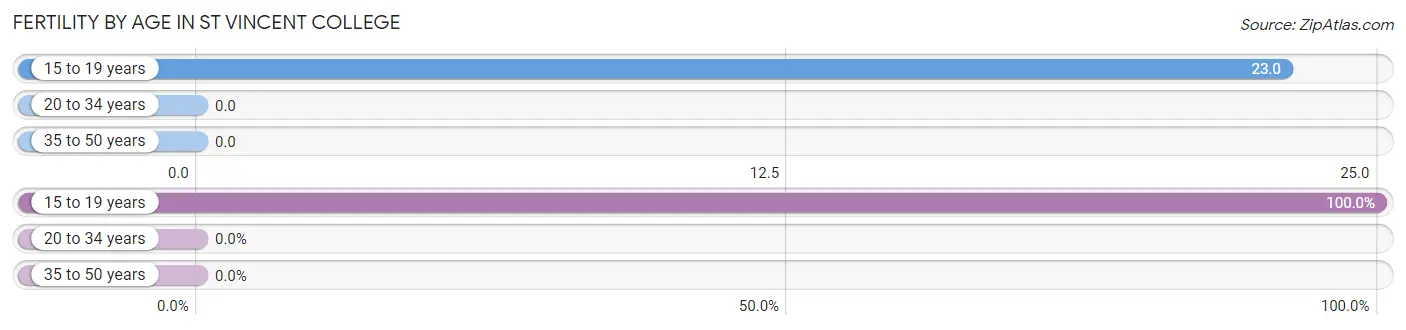
| Age Bracket | Women with Births | Births / 1,000 Women |
| 15 to 19 years | 8 (100.0%) | 23.0 |
| 20 to 34 years | 0 (0.0%) | 0.0 |
| 35 to 50 years | 0 (0.0%) | 0.0 |
| Total | 8 (100.0%) | 12.0 |
Fertility by Age by Marriage Status in St Vincent College
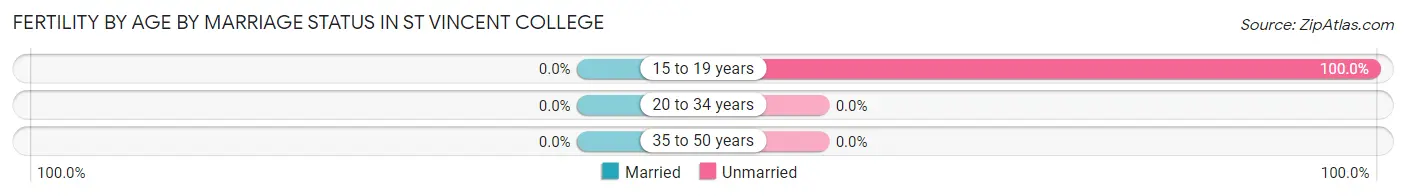
| Age Bracket | Married | Unmarried |
| 15 to 19 years | 0 (0.0%) | 8 (100.0%) |
| 20 to 34 years | 0 (0.0%) | 0 (0.0%) |
| 35 to 50 years | 0 (0.0%) | 0 (0.0%) |
| Total | 0 (0.0%) | 8 (100.0%) |
Fertility by Education in St Vincent College
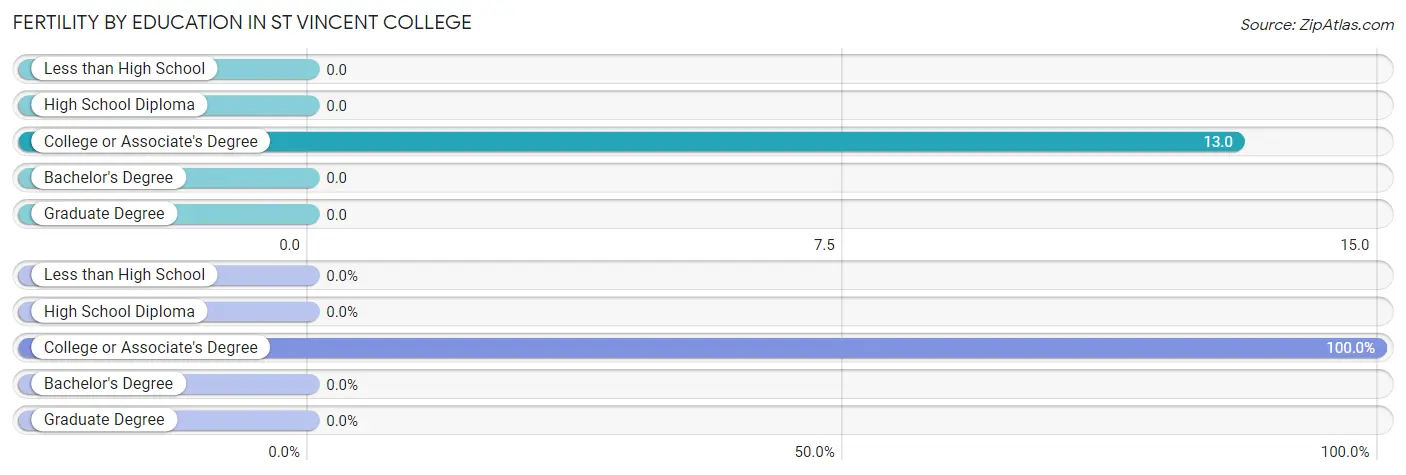
| Educational Attainment | Women with Births | Births / 1,000 Women |
| Less than High School | 0 (0.0%) | 0.0 |
| High School Diploma | 0 (0.0%) | 0.0 |
| College or Associate's Degree | 8 (100.0%) | 13.0 |
| Bachelor's Degree | 0 (0.0%) | 0.0 |
| Graduate Degree | 0 (0.0%) | 0.0 |
| Total | 8 (100.0%) | 12.0 |
Fertility by Education by Marriage Status in St Vincent College
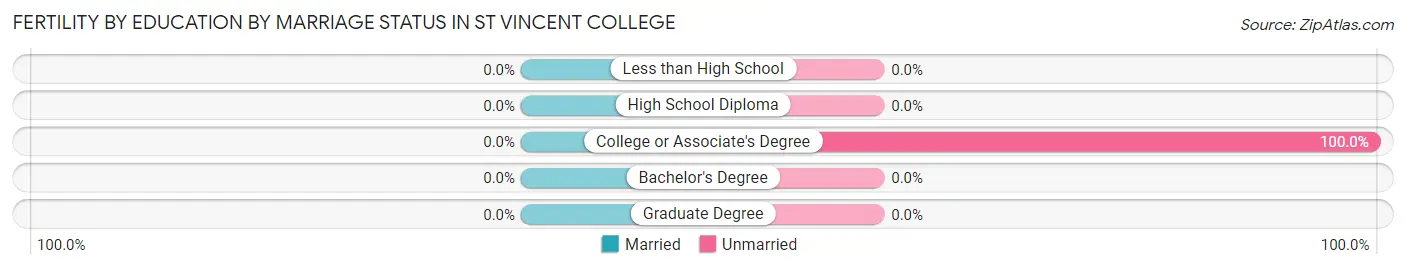
| Educational Attainment | Married | Unmarried |
| Less than High School | 0 (0.0%) | 0 (0.0%) |
| High School Diploma | 0 (0.0%) | 0 (0.0%) |
| College or Associate's Degree | 0 (0.0%) | 8 (100.0%) |
| Bachelor's Degree | 0 (0.0%) | 0 (0.0%) |
| Graduate Degree | 0 (0.0%) | 0 (0.0%) |
| Total | 0 (0.0%) | 8 (100.0%) |
Employment Characteristics in St Vincent College
Employment by Class of Employer in St Vincent College
Among the 506 employed individuals in St Vincent College, private company employees (290 | 57.3%), not-for-profit organizations (178 | 35.2%), and state government employees (32 | 6.3%) make up the most common classes of employment.
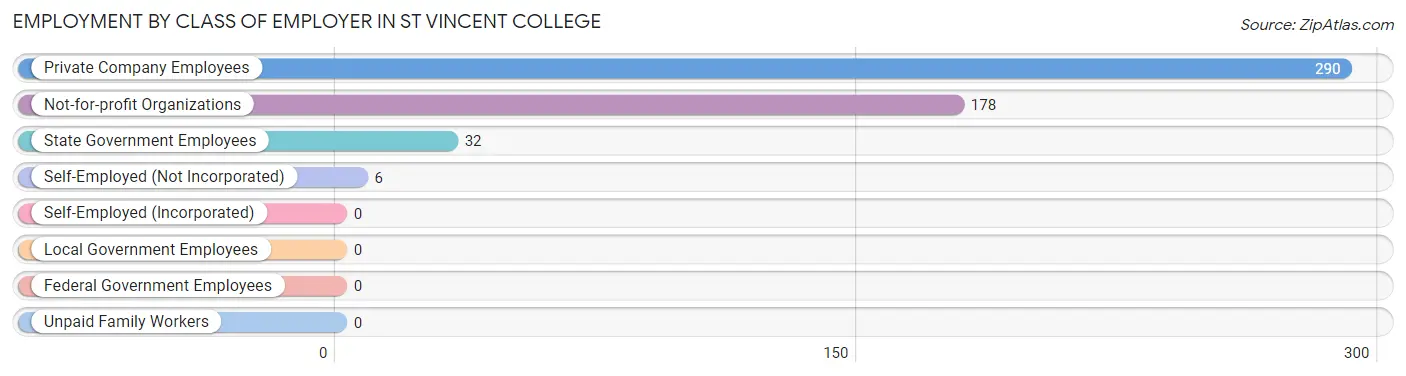
| Employer Class | # Employees | % Employees |
| Private Company Employees | 290 | 57.3% |
| Self-Employed (Incorporated) | 0 | 0.0% |
| Self-Employed (Not Incorporated) | 6 | 1.2% |
| Not-for-profit Organizations | 178 | 35.2% |
| Local Government Employees | 0 | 0.0% |
| State Government Employees | 32 | 6.3% |
| Federal Government Employees | 0 | 0.0% |
| Unpaid Family Workers | 0 | 0.0% |
| Total | 506 | 100.0% |
Employment Status by Age in St Vincent College
According to the labor force statistics for St Vincent College, out of the total population over 16 years of age (1,435), 43.3% or 621 individuals are in the labor force, with 14.2% or 88 of them unemployed. The age group with the highest labor force participation rate is 25 to 29 years, with 100.0% or 24 individuals in the labor force. Within the labor force, the 16 to 19 years age range has the highest percentage of unemployed individuals, with 25.7% or 59 of them being unemployed.
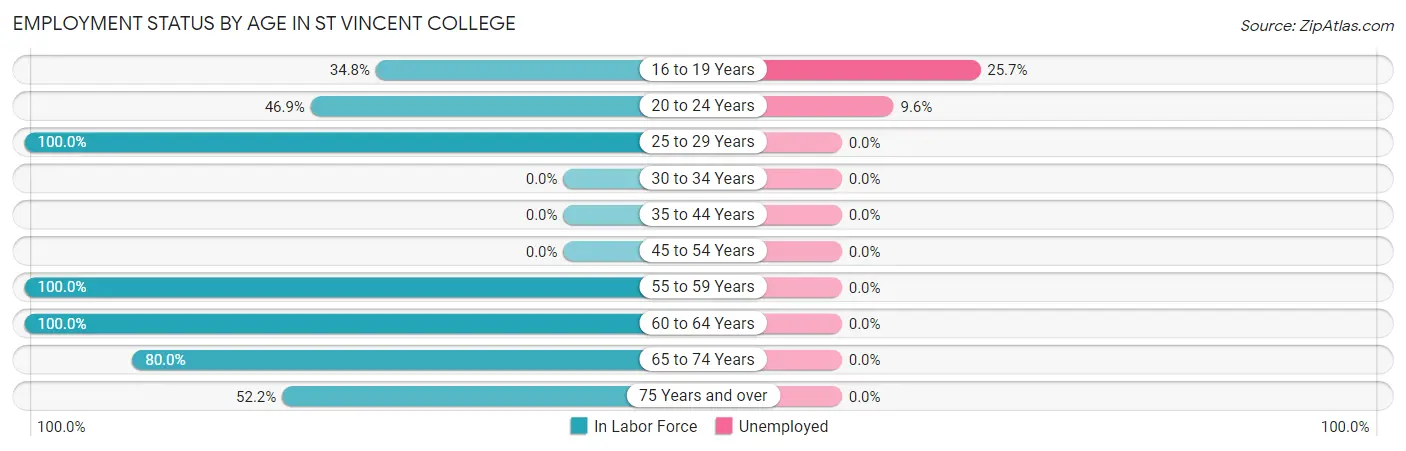
| Age Bracket | In Labor Force | Unemployed |
| 16 to 19 Years | 230 (34.8%) | 59 (25.7%) |
| 20 to 24 Years | 302 (46.9%) | 29 (9.6%) |
| 25 to 29 Years | 24 (100.0%) | 0 (0.0%) |
| 30 to 34 Years | 0 (0.0%) | 0 (0.0%) |
| 35 to 44 Years | 0 (0.0%) | 0 (0.0%) |
| 45 to 54 Years | 0 (0.0%) | 0 (0.0%) |
| 55 to 59 Years | 10 (100.0%) | 0 (0.0%) |
| 60 to 64 Years | 19 (100.0%) | 0 (0.0%) |
| 65 to 74 Years | 24 (80.0%) | 0 (0.0%) |
| 75 Years and over | 12 (52.2%) | 0 (0.0%) |
| Total | 621 (43.3%) | 88 (14.2%) |
Employment Status by Educational Attainment in St Vincent College
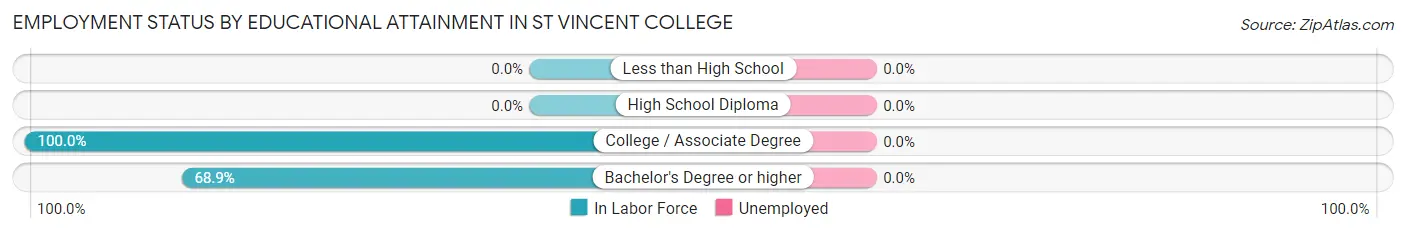
| Educational Attainment | In Labor Force | Unemployed |
| Less than High School | 0 (0.0%) | 0 (0.0%) |
| High School Diploma | 0 (0.0%) | 0 (0.0%) |
| College / Associate Degree | 11 (100.0%) | 0 (0.0%) |
| Bachelor's Degree or higher | 42 (68.9%) | 0 (0.0%) |
| Total | 53 (67.9%) | 0 (0.0%) |
Employment Occupations by Sex in St Vincent College
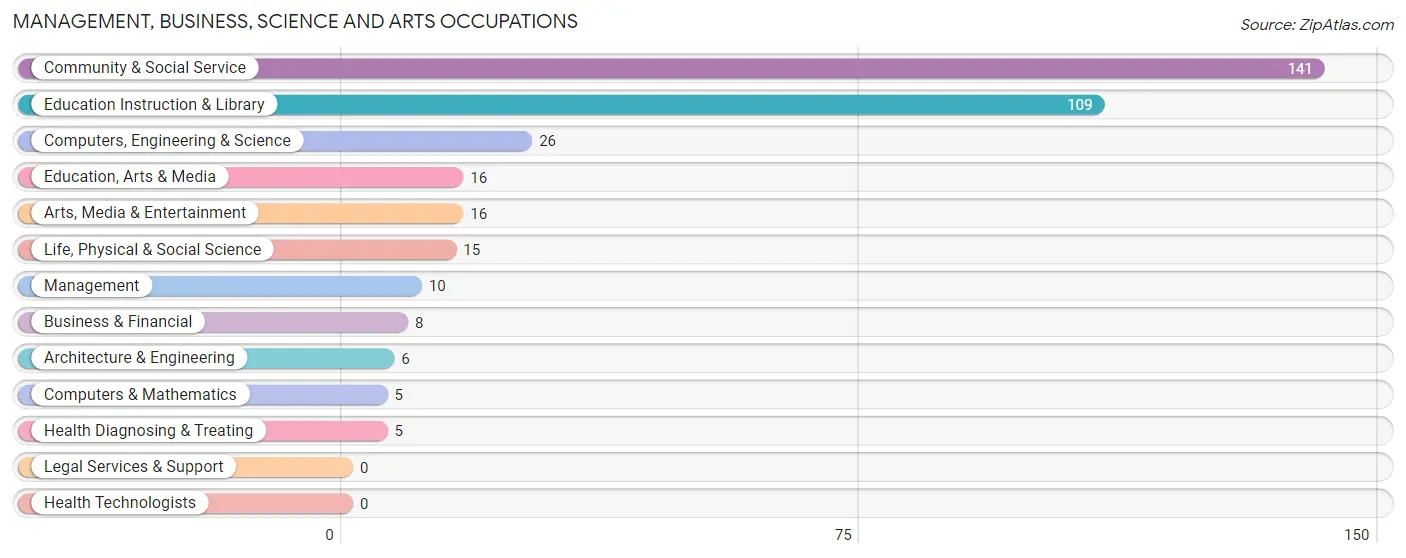
Management, Business, Science and Arts Occupations
The most common Management, Business, Science and Arts occupations in St Vincent College are Community & Social Service (141 | 26.5%), Education Instruction & Library (109 | 20.4%), Computers, Engineering & Science (26 | 4.9%), Education, Arts & Media (16 | 3.0%), and Arts, Media & Entertainment (16 | 3.0%).
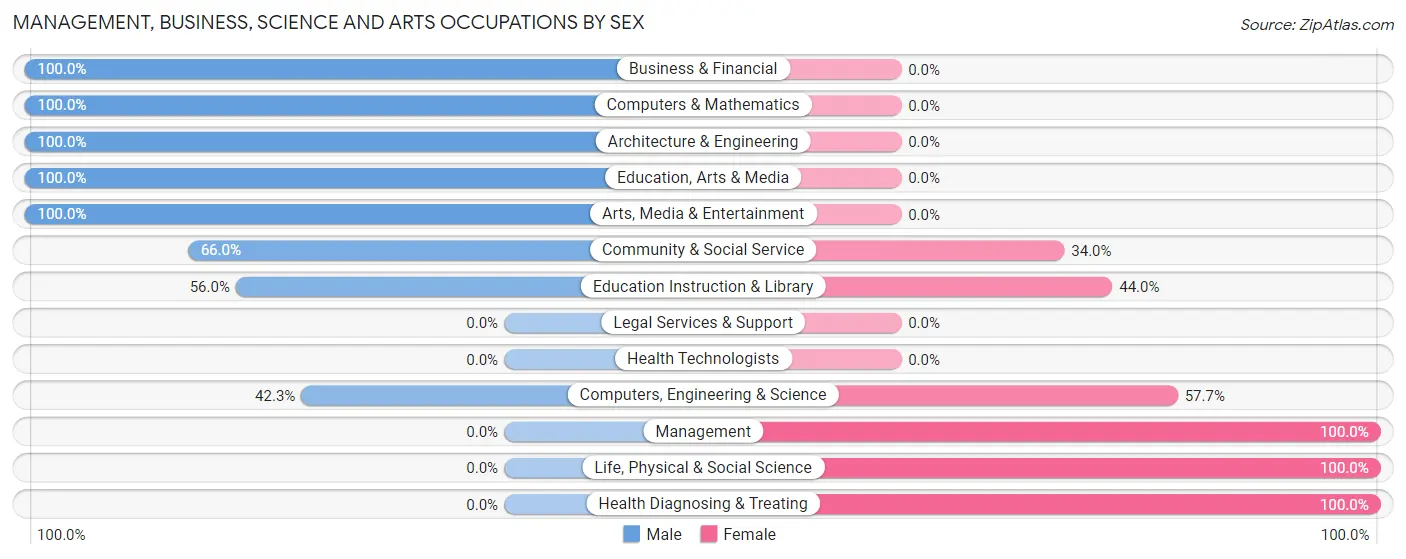
Management, Business, Science and Arts Occupations by Sex
Within the Management, Business, Science and Arts occupations in St Vincent College, the most male-oriented occupations are Business & Financial (100.0%), Computers & Mathematics (100.0%), and Architecture & Engineering (100.0%), while the most female-oriented occupations are Management (100.0%), Life, Physical & Social Science (100.0%), and Health Diagnosing & Treating (100.0%).
| Occupation | Male | Female |
| Management | 0 (0.0%) | 10 (100.0%) |
| Business & Financial | 8 (100.0%) | 0 (0.0%) |
| Computers, Engineering & Science | 11 (42.3%) | 15 (57.7%) |
| Computers & Mathematics | 5 (100.0%) | 0 (0.0%) |
| Architecture & Engineering | 6 (100.0%) | 0 (0.0%) |
| Life, Physical & Social Science | 0 (0.0%) | 15 (100.0%) |
| Community & Social Service | 93 (66.0%) | 48 (34.0%) |
| Education, Arts & Media | 16 (100.0%) | 0 (0.0%) |
| Legal Services & Support | 0 (0.0%) | 0 (0.0%) |
| Education Instruction & Library | 61 (56.0%) | 48 (44.0%) |
| Arts, Media & Entertainment | 16 (100.0%) | 0 (0.0%) |
| Health Diagnosing & Treating | 0 (0.0%) | 5 (100.0%) |
| Health Technologists | 0 (0.0%) | 0 (0.0%) |
| Total (Category) | 112 (59.0%) | 78 (41.0%) |
| Total (Overall) | 343 (64.3%) | 190 (35.6%) |
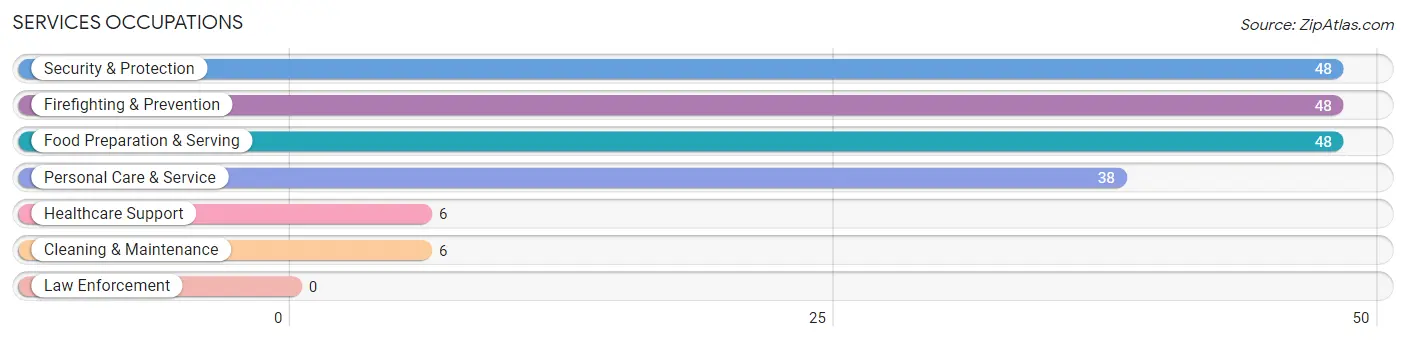
Services Occupations
The most common Services occupations in St Vincent College are Security & Protection (48 | 9.0%), Firefighting & Prevention (48 | 9.0%), Food Preparation & Serving (48 | 9.0%), Personal Care & Service (38 | 7.1%), and Healthcare Support (6 | 1.1%).
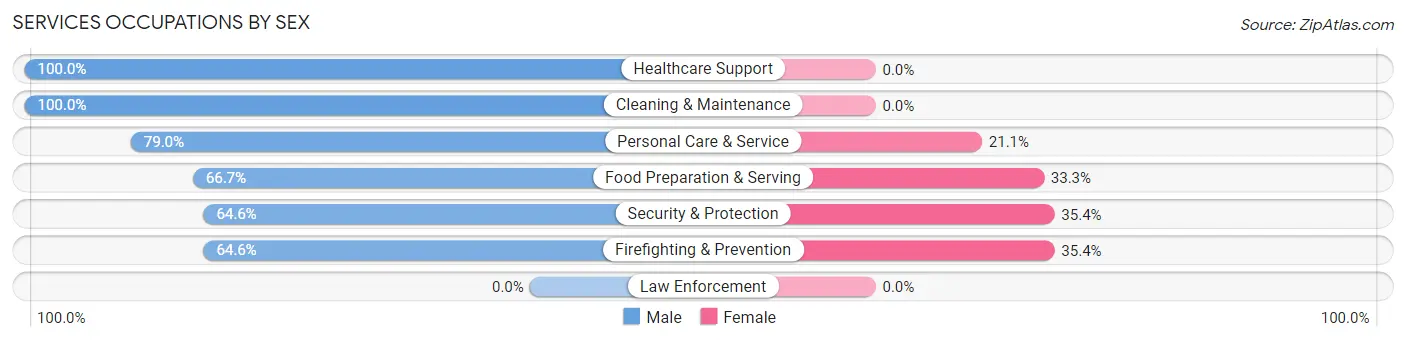
Services Occupations by Sex
Within the Services occupations in St Vincent College, the most male-oriented occupations are Healthcare Support (100.0%), Cleaning & Maintenance (100.0%), and Personal Care & Service (78.9%), while the most female-oriented occupations are Security & Protection (35.4%), Firefighting & Prevention (35.4%), and Food Preparation & Serving (33.3%).
| Occupation | Male | Female |
| Healthcare Support | 6 (100.0%) | 0 (0.0%) |
| Security & Protection | 31 (64.6%) | 17 (35.4%) |
| Firefighting & Prevention | 31 (64.6%) | 17 (35.4%) |
| Law Enforcement | 0 (0.0%) | 0 (0.0%) |
| Food Preparation & Serving | 32 (66.7%) | 16 (33.3%) |
| Cleaning & Maintenance | 6 (100.0%) | 0 (0.0%) |
| Personal Care & Service | 30 (78.9%) | 8 (21.0%) |
| Total (Category) | 105 (71.9%) | 41 (28.1%) |
| Total (Overall) | 343 (64.3%) | 190 (35.6%) |
Sales and Office Occupations
The most common Sales and Office occupations in St Vincent College are Sales & Related (67 | 12.6%), and Office & Administration (51 | 9.6%).

Sales and Office Occupations by Sex
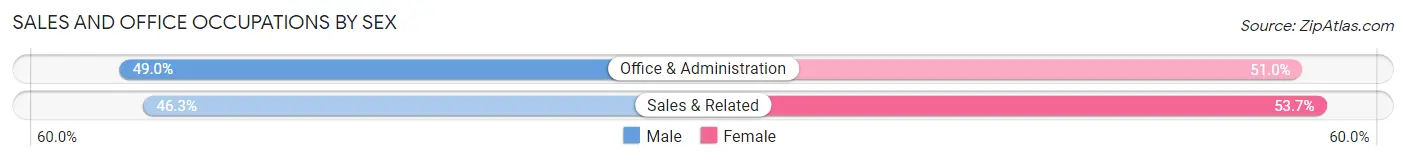
| Occupation | Male | Female |
| Sales & Related | 31 (46.3%) | 36 (53.7%) |
| Office & Administration | 25 (49.0%) | 26 (51.0%) |
| Total (Category) | 56 (47.5%) | 62 (52.5%) |
| Total (Overall) | 343 (64.3%) | 190 (35.6%) |
Natural Resources, Construction and Maintenance Occupations
The most common Natural Resources, Construction and Maintenance occupations in St Vincent College are , and Installation, Maintenance & Repair (20 | 3.7%).
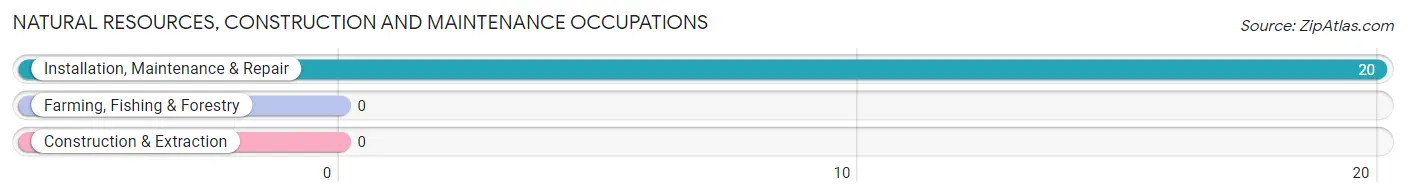
Natural Resources, Construction and Maintenance Occupations by Sex

| Occupation | Male | Female |
| Farming, Fishing & Forestry | 0 (0.0%) | 0 (0.0%) |
| Construction & Extraction | 0 (0.0%) | 0 (0.0%) |
| Installation, Maintenance & Repair | 20 (100.0%) | 0 (0.0%) |
| Total (Category) | 20 (100.0%) | 0 (0.0%) |
| Total (Overall) | 343 (64.3%) | 190 (35.6%) |
Production, Transportation and Moving Occupations
The most common Production, Transportation and Moving occupations in St Vincent College are Production (26 | 4.9%), Material Moving (18 | 3.4%), and Transportation (15 | 2.8%).
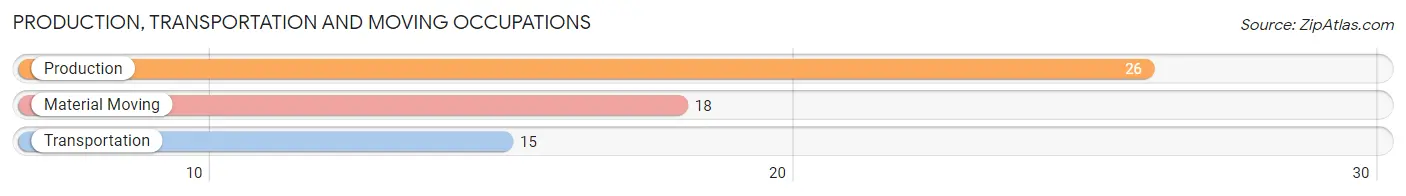
Production, Transportation and Moving Occupations by Sex
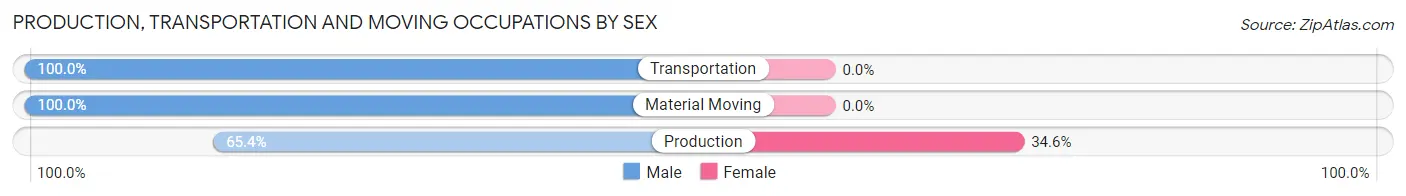
| Occupation | Male | Female |
| Production | 17 (65.4%) | 9 (34.6%) |
| Transportation | 15 (100.0%) | 0 (0.0%) |
| Material Moving | 18 (100.0%) | 0 (0.0%) |
| Total (Category) | 50 (84.8%) | 9 (15.2%) |
| Total (Overall) | 343 (64.3%) | 190 (35.6%) |
Employment Industries by Sex in St Vincent College
Employment Industries in St Vincent College
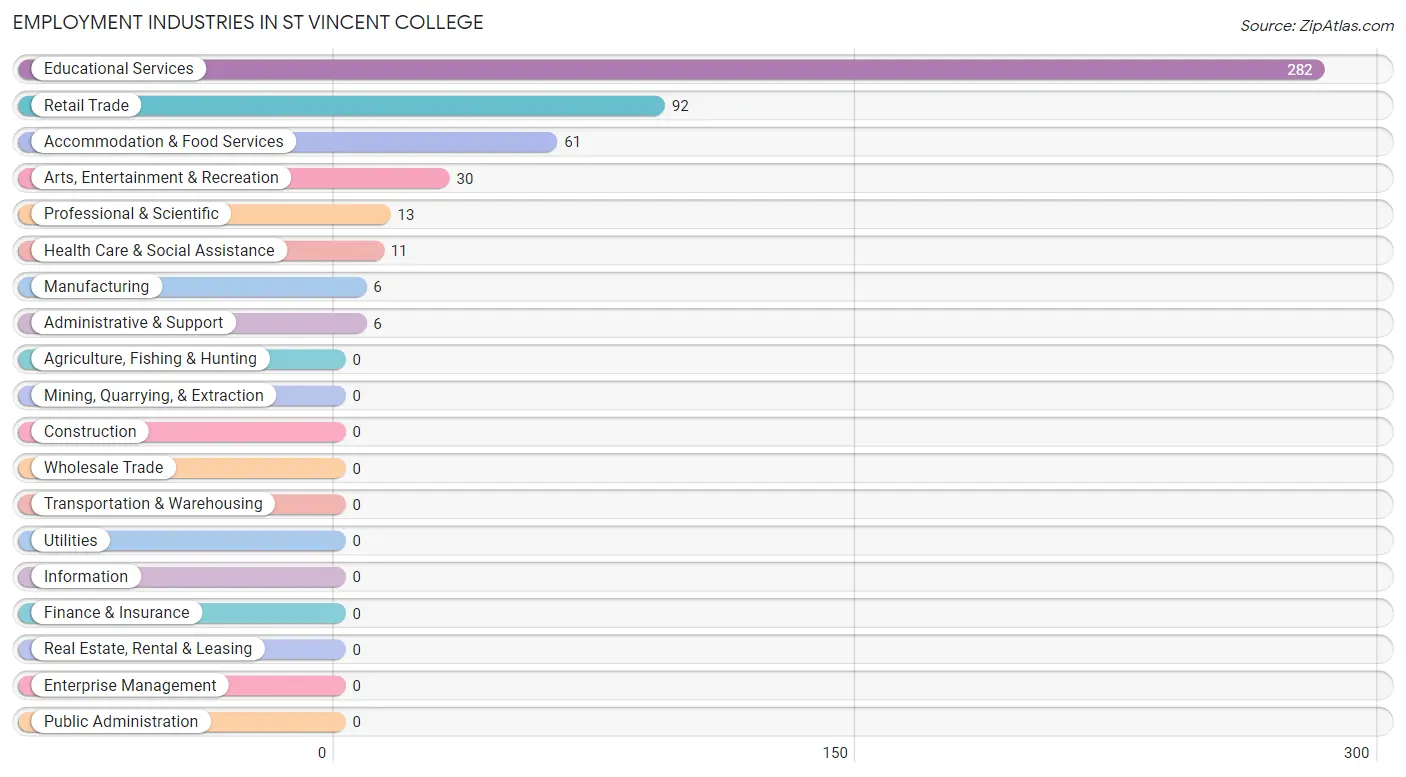
The major employment industries in St Vincent College include Educational Services (282 | 52.9%), Retail Trade (92 | 17.3%), Accommodation & Food Services (61 | 11.4%), Arts, Entertainment & Recreation (30 | 5.6%), and Professional & Scientific (13 | 2.4%).
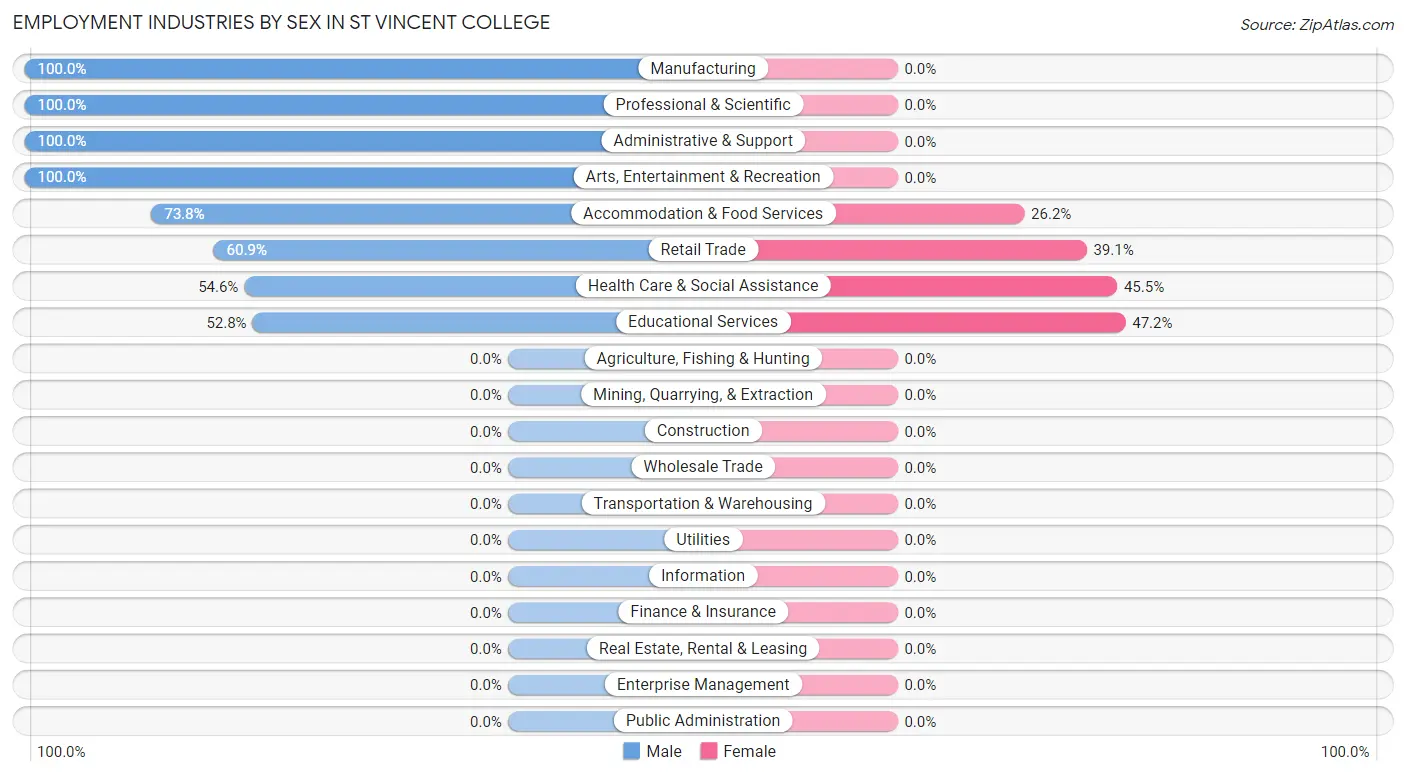
Employment Industries by Sex in St Vincent College
The St Vincent College industries that see more men than women are Manufacturing (100.0%), Professional & Scientific (100.0%), and Administrative & Support (100.0%), whereas the industries that tend to have a higher number of women are Educational Services (47.2%), Health Care & Social Assistance (45.5%), and Retail Trade (39.1%).
| Industry | Male | Female |
| Agriculture, Fishing & Hunting | 0 (0.0%) | 0 (0.0%) |
| Mining, Quarrying, & Extraction | 0 (0.0%) | 0 (0.0%) |
| Construction | 0 (0.0%) | 0 (0.0%) |
| Manufacturing | 6 (100.0%) | 0 (0.0%) |
| Wholesale Trade | 0 (0.0%) | 0 (0.0%) |
| Retail Trade | 56 (60.9%) | 36 (39.1%) |
| Transportation & Warehousing | 0 (0.0%) | 0 (0.0%) |
| Utilities | 0 (0.0%) | 0 (0.0%) |
| Information | 0 (0.0%) | 0 (0.0%) |
| Finance & Insurance | 0 (0.0%) | 0 (0.0%) |
| Real Estate, Rental & Leasing | 0 (0.0%) | 0 (0.0%) |
| Professional & Scientific | 13 (100.0%) | 0 (0.0%) |
| Enterprise Management | 0 (0.0%) | 0 (0.0%) |
| Administrative & Support | 6 (100.0%) | 0 (0.0%) |
| Educational Services | 149 (52.8%) | 133 (47.2%) |
| Health Care & Social Assistance | 6 (54.5%) | 5 (45.5%) |
| Arts, Entertainment & Recreation | 30 (100.0%) | 0 (0.0%) |
| Accommodation & Food Services | 45 (73.8%) | 16 (26.2%) |
| Public Administration | 0 (0.0%) | 0 (0.0%) |
| Total | 343 (64.3%) | 190 (35.6%) |
Education in St Vincent College
School Enrollment in St Vincent College
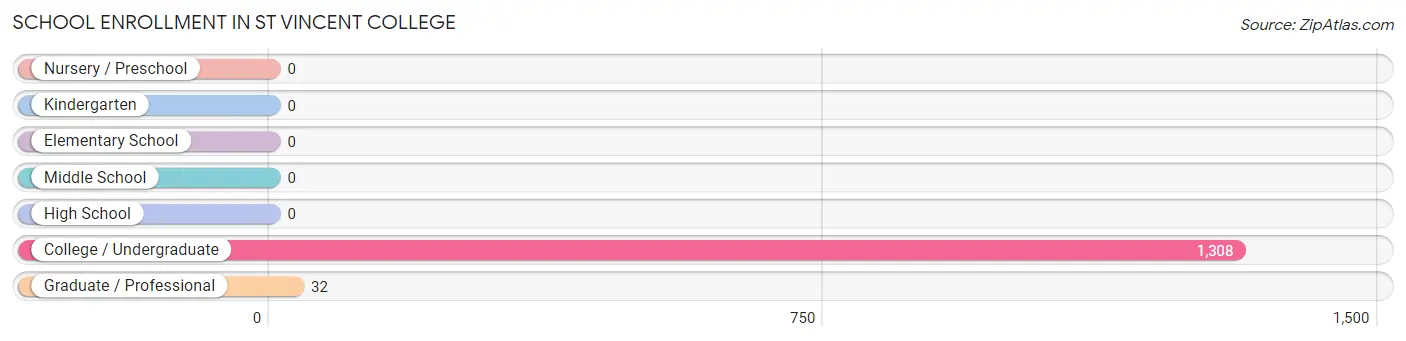
The most common levels of schooling among the 1,340 students in St Vincent College are college / undergraduate (1,308 | 97.6%), and graduate / professional (32 | 2.4%).
| School Level | # Students | % Students |
| Nursery / Preschool | 0 | 0.0% |
| Kindergarten | 0 | 0.0% |
| Elementary School | 0 | 0.0% |
| Middle School | 0 | 0.0% |
| High School | 0 | 0.0% |
| College / Undergraduate | 1,308 | 97.6% |
| Graduate / Professional | 32 | 2.4% |
| Total | 1,340 | 100.0% |
School Enrollment by Age by Funding Source in St Vincent College
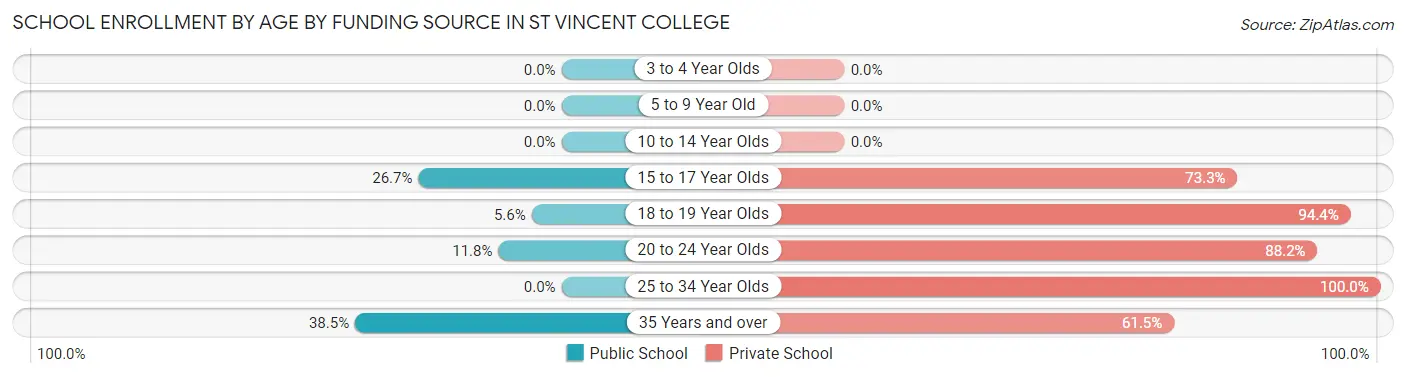
Out of a total of 1,340 students who are enrolled in schools in St Vincent College, 1,219 (91.0%) attend a private institution, while the remaining 121 (9.0%) are enrolled in public schools. The age group of 25 to 34 year olds has the highest likelihood of being enrolled in private schools, with 30 (100.0% in the age bracket) enrolled. Conversely, the age group of 35 years and over has the lowest likelihood of being enrolled in a private school, with 5 (38.5% in the age bracket) attending a public institution.
| Age Bracket | Public School | Private School |
| 3 to 4 Year Olds | 0 (0.0%) | 0 (0.0%) |
| 5 to 9 Year Old | 0 (0.0%) | 0 (0.0%) |
| 10 to 14 Year Olds | 0 (0.0%) | 0 (0.0%) |
| 15 to 17 Year Olds | 4 (26.7%) | 11 (73.3%) |
| 18 to 19 Year Olds | 36 (5.6%) | 609 (94.4%) |
| 20 to 24 Year Olds | 75 (11.8%) | 562 (88.2%) |
| 25 to 34 Year Olds | 0 (0.0%) | 30 (100.0%) |
| 35 Years and over | 5 (38.5%) | 8 (61.5%) |
| Total | 121 (9.0%) | 1,219 (91.0%) |
Educational Attainment by Field of Study in St Vincent College
Liberal arts & history (71 | 46.1%), social sciences (21 | 13.6%), literature & languages (13 | 8.4%), computers & mathematics (11 | 7.1%), and engineering (11 | 7.1%) are the most common fields of study among 154 individuals in St Vincent College who have obtained a bachelor's degree or higher.
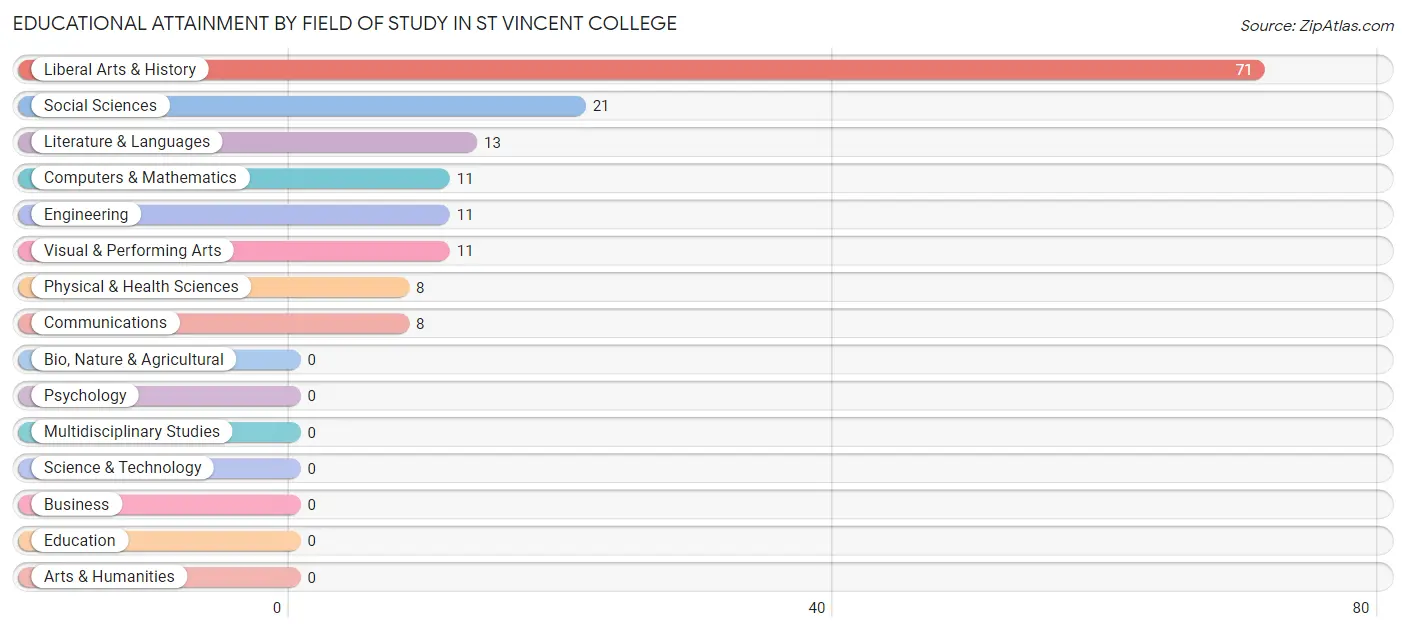
| Field of Study | # Graduates | % Graduates |
| Computers & Mathematics | 11 | 7.1% |
| Bio, Nature & Agricultural | 0 | 0.0% |
| Physical & Health Sciences | 8 | 5.2% |
| Psychology | 0 | 0.0% |
| Social Sciences | 21 | 13.6% |
| Engineering | 11 | 7.1% |
| Multidisciplinary Studies | 0 | 0.0% |
| Science & Technology | 0 | 0.0% |
| Business | 0 | 0.0% |
| Education | 0 | 0.0% |
| Literature & Languages | 13 | 8.4% |
| Liberal Arts & History | 71 | 46.1% |
| Visual & Performing Arts | 11 | 7.1% |
| Communications | 8 | 5.2% |
| Arts & Humanities | 0 | 0.0% |
| Total | 154 | 100.0% |
Transportation & Commute in St Vincent College
Vehicle Availability by Sex in St Vincent College
| Vehicles Available | Male | Female |
| No Vehicle | 0 (0.0%) | 0 (0.0%) |
| 1 Vehicle | 0 (0.0%) | 0 (0.0%) |
| 2 Vehicles | 0 (0.0%) | 0 (0.0%) |
| 3 Vehicles | 0 (0.0%) | 0 (0.0%) |
| 4 Vehicles | 0 (0.0%) | 0 (0.0%) |
| 5 or more Vehicles | 0 (0.0%) | 0 (0.0%) |
| Total | 0 (0.0%) | 0 (0.0%) |
Commute Time in St Vincent College
The most frequently occuring commute durations in St Vincent College are 5 to 9 minutes (155 commuters, 32.2%), 10 to 14 minutes (133 commuters, 27.6%), and less than 5 minutes (82 commuters, 17.0%).
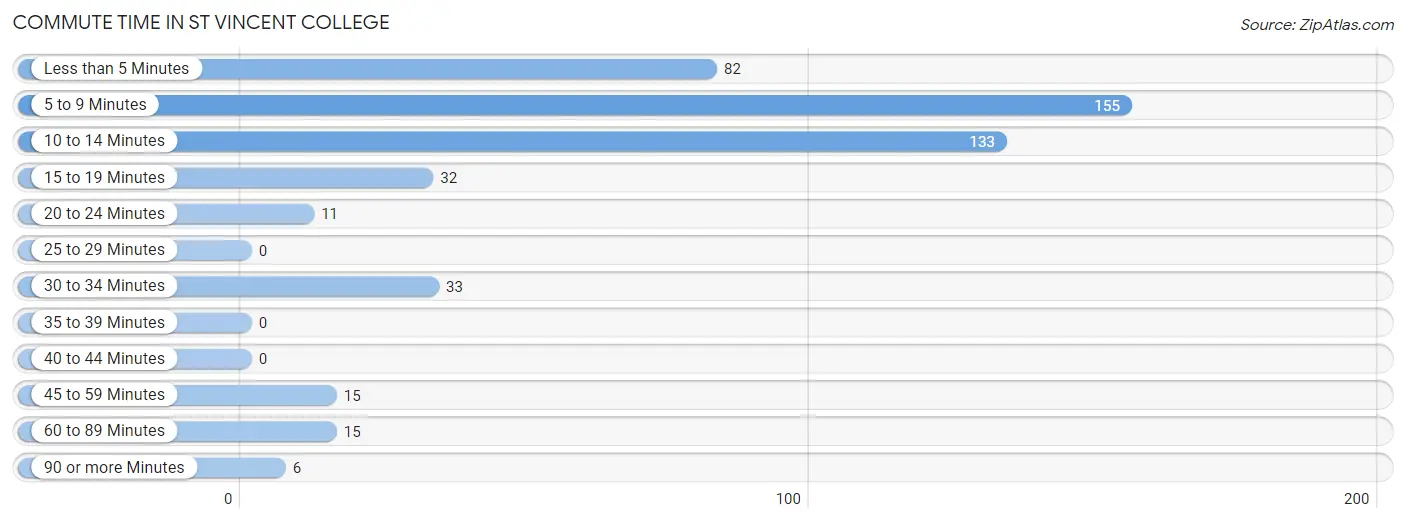
| Commute Time | # Commuters | % Commuters |
| Less than 5 Minutes | 82 | 17.0% |
| 5 to 9 Minutes | 155 | 32.2% |
| 10 to 14 Minutes | 133 | 27.6% |
| 15 to 19 Minutes | 32 | 6.6% |
| 20 to 24 Minutes | 11 | 2.3% |
| 25 to 29 Minutes | 0 | 0.0% |
| 30 to 34 Minutes | 33 | 6.9% |
| 35 to 39 Minutes | 0 | 0.0% |
| 40 to 44 Minutes | 0 | 0.0% |
| 45 to 59 Minutes | 15 | 3.1% |
| 60 to 89 Minutes | 15 | 3.1% |
| 90 or more Minutes | 6 | 1.2% |
Commute Time by Sex in St Vincent College
The most common commute times in St Vincent College are 10 to 14 minutes (70 commuters, 23.3%) for males and 5 to 9 minutes (90 commuters, 49.7%) for females.
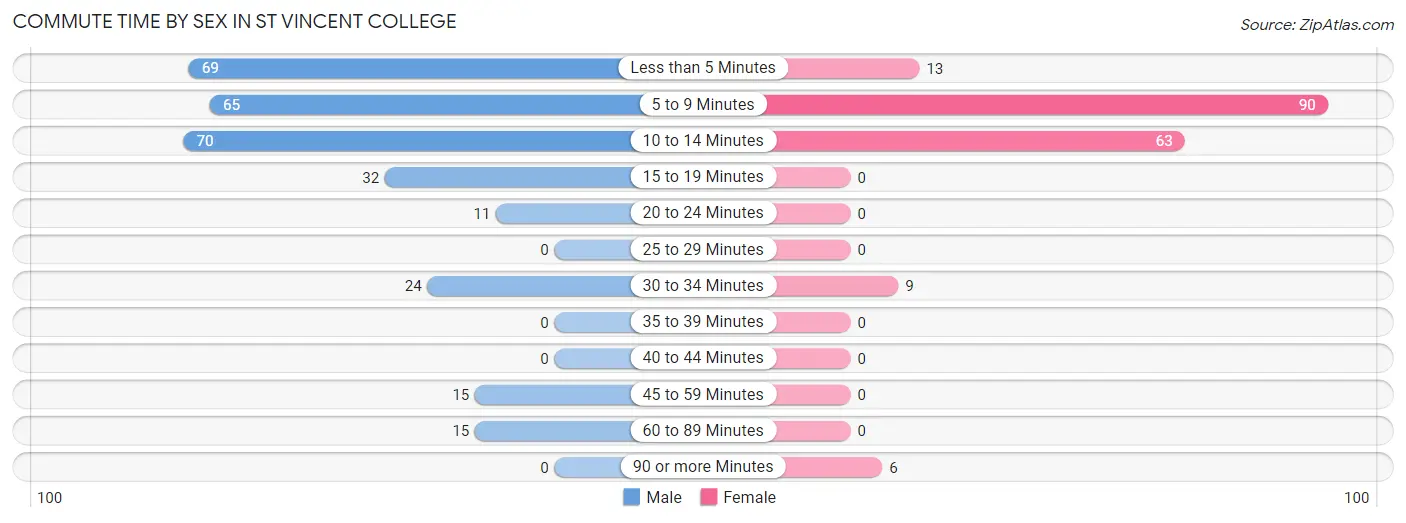
| Commute Time | Male | Female |
| Less than 5 Minutes | 69 (22.9%) | 13 (7.2%) |
| 5 to 9 Minutes | 65 (21.6%) | 90 (49.7%) |
| 10 to 14 Minutes | 70 (23.3%) | 63 (34.8%) |
| 15 to 19 Minutes | 32 (10.6%) | 0 (0.0%) |
| 20 to 24 Minutes | 11 (3.6%) | 0 (0.0%) |
| 25 to 29 Minutes | 0 (0.0%) | 0 (0.0%) |
| 30 to 34 Minutes | 24 (8.0%) | 9 (5.0%) |
| 35 to 39 Minutes | 0 (0.0%) | 0 (0.0%) |
| 40 to 44 Minutes | 0 (0.0%) | 0 (0.0%) |
| 45 to 59 Minutes | 15 (5.0%) | 0 (0.0%) |
| 60 to 89 Minutes | 15 (5.0%) | 0 (0.0%) |
| 90 or more Minutes | 0 (0.0%) | 6 (3.3%) |
Time of Departure to Work by Sex in St Vincent College
The most frequent times of departure to work in St Vincent College are 12:00 PM to 3:59 PM (65, 21.6%) for males and 12:00 PM to 3:59 PM (79, 43.6%) for females.
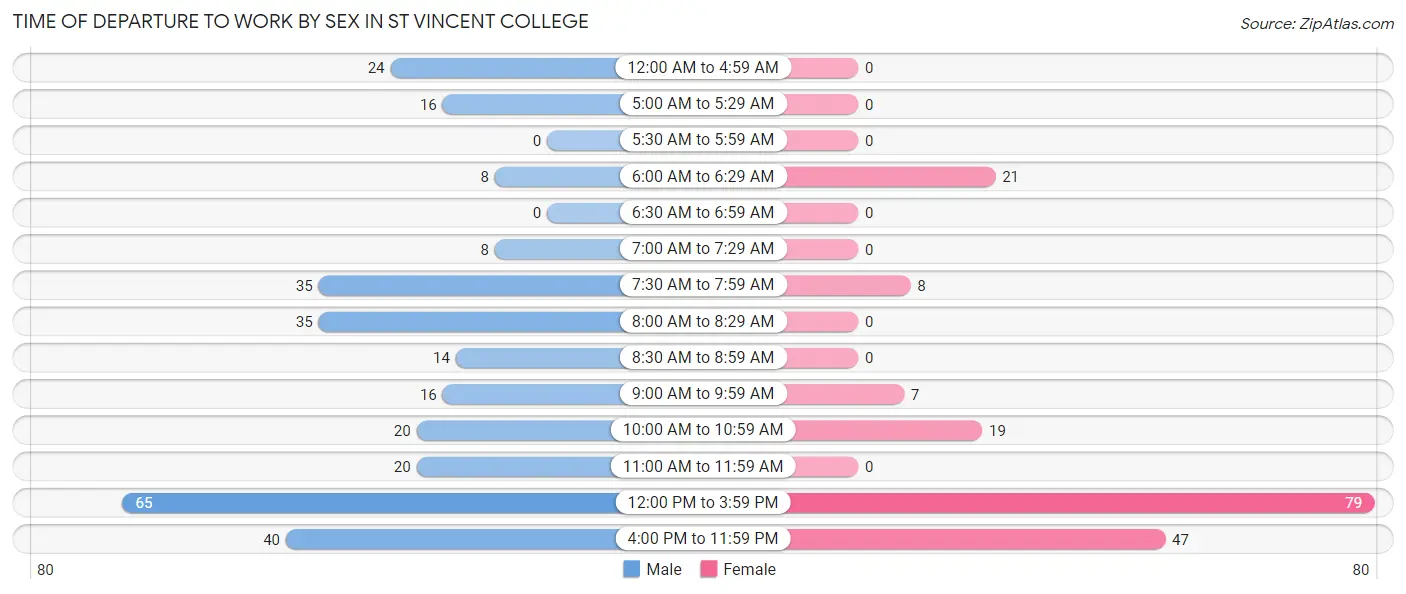
| Time of Departure | Male | Female |
| 12:00 AM to 4:59 AM | 24 (8.0%) | 0 (0.0%) |
| 5:00 AM to 5:29 AM | 16 (5.3%) | 0 (0.0%) |
| 5:30 AM to 5:59 AM | 0 (0.0%) | 0 (0.0%) |
| 6:00 AM to 6:29 AM | 8 (2.7%) | 21 (11.6%) |
| 6:30 AM to 6:59 AM | 0 (0.0%) | 0 (0.0%) |
| 7:00 AM to 7:29 AM | 8 (2.7%) | 0 (0.0%) |
| 7:30 AM to 7:59 AM | 35 (11.6%) | 8 (4.4%) |
| 8:00 AM to 8:29 AM | 35 (11.6%) | 0 (0.0%) |
| 8:30 AM to 8:59 AM | 14 (4.6%) | 0 (0.0%) |
| 9:00 AM to 9:59 AM | 16 (5.3%) | 7 (3.9%) |
| 10:00 AM to 10:59 AM | 20 (6.6%) | 19 (10.5%) |
| 11:00 AM to 11:59 AM | 20 (6.6%) | 0 (0.0%) |
| 12:00 PM to 3:59 PM | 65 (21.6%) | 79 (43.6%) |
| 4:00 PM to 11:59 PM | 40 (13.3%) | 47 (26.0%) |
| Total | 301 (100.0%) | 181 (100.0%) |
Housing Occupancy in St Vincent College
Occupancy by Ownership in St Vincent College
| Occupancy | # Housing Units | % Housing Units |
| Owner Occupied Housing Units | 0 | 0.0% |
| Renter-Occupied Housing Units | 0 | 0.0% |
| Total Occupied Housing Units | 0 | 0.0% |
Occupancy by Household Size in St Vincent College
| Household Size | # Housing Units | % Housing Units |
| 1-Person Household | 0 | 0.0% |
| 2-Person Household | 0 | 0.0% |
| 3-Person Household | 0 | 0.0% |
| 4+ Person Household | 0 | 0.0% |
| Total Housing Units | 0 | 0.0% |
Occupancy by Ownership by Household Size in St Vincent College
| Household Size | Owner-occupied | Renter-occupied |
| 1-Person Household | 0 (0.0%) | 0 (0.0%) |
| 2-Person Household | 0 (0.0%) | 0 (0.0%) |
| 3-Person Household | 0 (0.0%) | 0 (0.0%) |
| 4+ Person Household | 0 (0.0%) | 0 (0.0%) |
| Total Housing Units | 0 (0.0%) | 0 (0.0%) |
Occupancy by Educational Attainment in St Vincent College
| Household Size | Owner-occupied | Renter-occupied |
| Less than High School | 0 (0.0%) | 0 (0.0%) |
| High School Diploma | 0 (0.0%) | 0 (0.0%) |
| College/Associate Degree | 0 (0.0%) | 0 (0.0%) |
| Bachelor's Degree or higher | 0 (0.0%) | 0 (0.0%) |
Occupancy by Age of Householder in St Vincent College
| Age Bracket | # Households | % Households |
| Under 35 Years | 0 | 0.0% |
| 35 to 44 Years | 0 | 0.0% |
| 45 to 54 Years | 0 | 0.0% |
| 55 to 64 Years | 0 | 0.0% |
| 65 to 74 Years | 0 | 0.0% |
| 75 to 84 Years | 0 | 0.0% |
| 85 Years and Over | 0 | 0.0% |
| Total | 0 | 0.0% |
Housing Finances in St Vincent College
Median Income by Occupancy in St Vincent College
| Occupancy Type | # Households | Median Income |
| Owner-Occupied | 0 (0.0%) | $0 |
| Renter-Occupied | 0 (0.0%) | $0 |
| Average | 0 (0.0%) | $0 |
Occupancy by Householder Income Bracket in St Vincent College
| Income Bracket | Owner-occupied | Renter-occupied |
| Less than $5,000 | 0 (0.0%) | 0 (0.0%) |
| $5,000 to $9,999 | 0 (0.0%) | 0 (0.0%) |
| $10,000 to $14,999 | 0 (0.0%) | 0 (0.0%) |
| $15,000 to $19,999 | 0 (0.0%) | 0 (0.0%) |
| $20,000 to $24,999 | 0 (0.0%) | 0 (0.0%) |
| $25,000 to $34,999 | 0 (0.0%) | 0 (0.0%) |
| $35,000 to $49,999 | 0 (0.0%) | 0 (0.0%) |
| $50,000 to $74,999 | 0 (0.0%) | 0 (0.0%) |
| $75,000 to $99,999 | 0 (0.0%) | 0 (0.0%) |
| $100,000 to $149,999 | 0 (0.0%) | 0 (0.0%) |
| $150,000 or more | 0 (0.0%) | 0 (0.0%) |
| Total | 0 (0.0%) | 0 (0.0%) |
Monthly Housing Cost Tiers in St Vincent College
| Monthly Cost | Owner-occupied | Renter-occupied |
| Less than $300 | 0 (0.0%) | 0 (0.0%) |
| $300 to $499 | 0 (0.0%) | 0 (0.0%) |
| $500 to $799 | 0 (0.0%) | 0 (0.0%) |
| $800 to $999 | 0 (0.0%) | 0 (0.0%) |
| $1,000 to $1,499 | 0 (0.0%) | 0 (0.0%) |
| $1,500 to $1,999 | 0 (0.0%) | 0 (0.0%) |
| $2,000 to $2,499 | 0 (0.0%) | 0 (0.0%) |
| $2,500 to $2,999 | 0 (0.0%) | 0 (0.0%) |
| $3,000 or more | 0 (0.0%) | 0 (0.0%) |
| Total | 0 (0.0%) | 0 (0.0%) |
Physical Housing Characteristics in St Vincent College
Housing Structures in St Vincent College
| Structure Type | # Housing Units | % Housing Units |
| Single Unit, Detached | 0 | 0.0% |
| Single Unit, Attached | 0 | 0.0% |
| 2 Unit Apartments | 0 | 0.0% |
| 3 or 4 Unit Apartments | 0 | 0.0% |
| 5 to 9 Unit Apartments | 0 | 0.0% |
| 10 or more Apartments | 0 | 0.0% |
| Mobile Home / Other | 0 | 0.0% |
| Total | 0 | 0.0% |
Housing Structures by Occupancy in St Vincent College
| Structure Type | Owner-occupied | Renter-occupied |
| Single Unit, Detached | 0 (0.0%) | 0 (0.0%) |
| Single Unit, Attached | 0 (0.0%) | 0 (0.0%) |
| 2 Unit Apartments | 0 (0.0%) | 0 (0.0%) |
| 3 or 4 Unit Apartments | 0 (0.0%) | 0 (0.0%) |
| 5 to 9 Unit Apartments | 0 (0.0%) | 0 (0.0%) |
| 10 or more Apartments | 0 (0.0%) | 0 (0.0%) |
| Mobile Home / Other | 0 (0.0%) | 0 (0.0%) |
| Total | 0 (0.0%) | 0 (0.0%) |
Housing Structures by Number of Rooms in St Vincent College

| Number of Rooms | Owner-occupied | Renter-occupied |
| 1 Room | 0 (0.0%) | 0 (0.0%) |
| 2 or 3 Rooms | 0 (0.0%) | 0 (0.0%) |
| 4 or 5 Rooms | 0 (0.0%) | 0 (0.0%) |
| 6 or 7 Rooms | 0 (0.0%) | 0 (0.0%) |
| 8 or more Rooms | 0 (0.0%) | 0 (0.0%) |
| Total | 0 (0.0%) | 0 (0.0%) |
Housing Structure by Heating Type in St Vincent College
| Heating Type | Owner-occupied | Renter-occupied |
| Utility Gas | 0 (0.0%) | 0 (0.0%) |
| Bottled, Tank, or LP Gas | 0 (0.0%) | 0 (0.0%) |
| Electricity | 0 (0.0%) | 0 (0.0%) |
| Fuel Oil or Kerosene | 0 (0.0%) | 0 (0.0%) |
| Coal or Coke | 0 (0.0%) | 0 (0.0%) |
| All other Fuels | 0 (0.0%) | 0 (0.0%) |
| No Fuel Used | 0 (0.0%) | 0 (0.0%) |
| Total | 0 (0.0%) | 0 (0.0%) |
Household Vehicle Usage in St Vincent College
| Vehicles per Household | Owner-occupied | Renter-occupied |
| No Vehicle | 0 (0.0%) | 0 (0.0%) |
| 1 Vehicle | 0 (0.0%) | 0 (0.0%) |
| 2 Vehicles | 0 (0.0%) | 0 (0.0%) |
| 3 or more Vehicles | 0 (0.0%) | 0 (0.0%) |
| Total | 0 (0.0%) | 0 (0.0%) |
Real Estate & Mortgages in St Vincent College
Real Estate and Mortgage Overview in St Vincent College
| Characteristic | Without Mortgage | With Mortgage |
| Housing Units | 0 | 0 |
| Median Property Value | - | - |
| Median Household Income | - | - |
| Monthly Housing Costs | - | - |
| Real Estate Taxes | - | - |
Property Value by Mortgage Status in St Vincent College

| Property Value | Without Mortgage | With Mortgage |
| Less than $50,000 | 0 (0.0%) | 0 (0.0%) |
| $50,000 to $99,999 | 0 (0.0%) | 0 (0.0%) |
| $100,000 to $299,999 | 0 (0.0%) | 0 (0.0%) |
| $300,000 to $499,999 | 0 (0.0%) | 0 (0.0%) |
| $500,000 to $749,999 | 0 (0.0%) | 0 (0.0%) |
| $750,000 to $999,999 | 0 (0.0%) | 0 (0.0%) |
| $1,000,000 or more | 0 (0.0%) | 0 (0.0%) |
| Total | 0 (0.0%) | 0 (0.0%) |
Household Income by Mortgage Status in St Vincent College
| Household Income | Without Mortgage | With Mortgage |
| Less than $10,000 | 0 (0.0%) | 0 (0.0%) |
| $10,000 to $24,999 | 0 (0.0%) | 0 (0.0%) |
| $25,000 to $34,999 | 0 (0.0%) | 0 (0.0%) |
| $35,000 to $49,999 | 0 (0.0%) | 0 (0.0%) |
| $50,000 to $74,999 | 0 (0.0%) | 0 (0.0%) |
| $75,000 to $99,999 | 0 (0.0%) | 0 (0.0%) |
| $100,000 to $149,999 | 0 (0.0%) | 0 (0.0%) |
| $150,000 or more | 0 (0.0%) | 0 (0.0%) |
| Total | 0 (0.0%) | 0 (0.0%) |
Property Value to Household Income Ratio in St Vincent College
| Value-to-Income Ratio | Without Mortgage | With Mortgage |
| Less than 2.0x | 0 (0.0%) | 0 (0.0%) |
| 2.0x to 2.9x | 0 (0.0%) | 0 (0.0%) |
| 3.0x to 3.9x | 0 (0.0%) | 0 (0.0%) |
| 4.0x or more | 0 (0.0%) | 0 (0.0%) |
| Total | 0 (0.0%) | 0 (0.0%) |
Real Estate Taxes by Mortgage Status in St Vincent College

| Property Taxes | Without Mortgage | With Mortgage |
| Less than $800 | 0 (0.0%) | 0 (0.0%) |
| $800 to $1,499 | 0 (0.0%) | 0 (0.0%) |
| $800 to $1,499 | 0 (0.0%) | 0 (0.0%) |
| Total | 0 (0.0%) | 0 (0.0%) |
Health & Disability in St Vincent College
Health Insurance Coverage by Age in St Vincent College
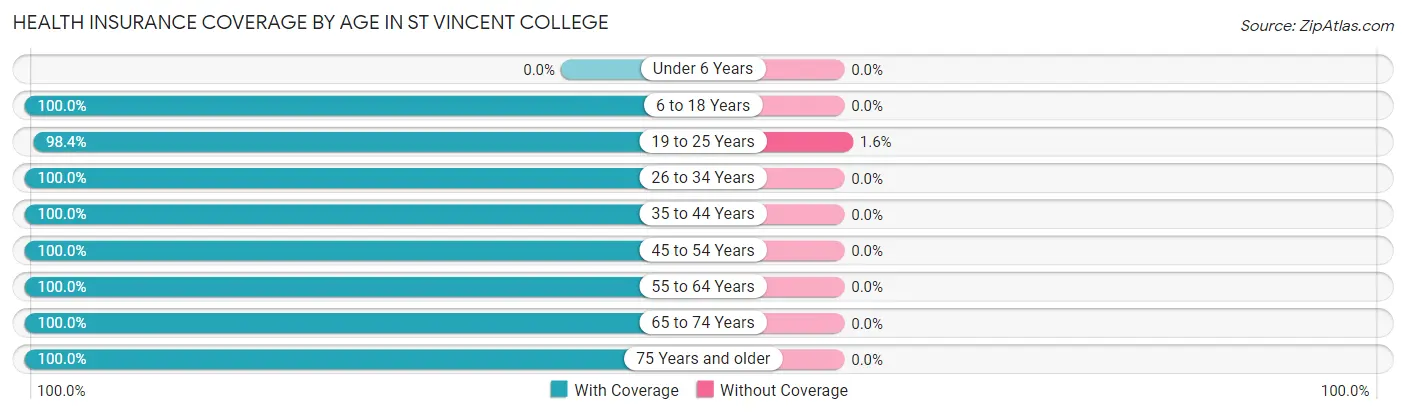
| Age Bracket | With Coverage | Without Coverage |
| Under 6 Years | 0 (0.0%) | 0 (0.0%) |
| 6 to 18 Years | 240 (100.0%) | 0 (0.0%) |
| 19 to 25 Years | 1,052 (98.4%) | 17 (1.6%) |
| 26 to 34 Years | 30 (100.0%) | 0 (0.0%) |
| 35 to 44 Years | 13 (100.0%) | 0 (0.0%) |
| 45 to 54 Years | 1 (100.0%) | 0 (0.0%) |
| 55 to 64 Years | 29 (100.0%) | 0 (0.0%) |
| 65 to 74 Years | 30 (100.0%) | 0 (0.0%) |
| 75 Years and older | 23 (100.0%) | 0 (0.0%) |
| Total | 1,418 (98.8%) | 17 (1.2%) |
Health Insurance Coverage by Citizenship Status in St Vincent College
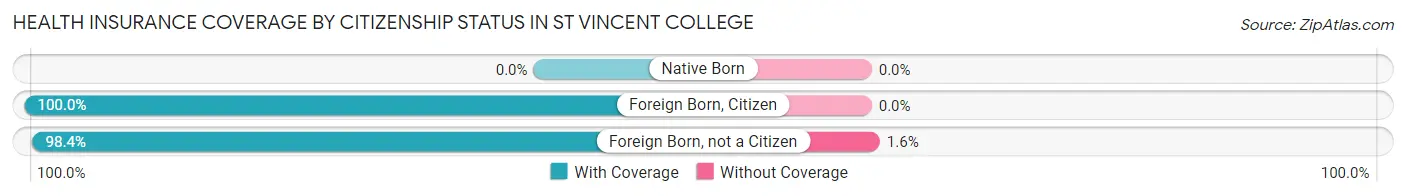
| Citizenship Status | With Coverage | Without Coverage |
| Native Born | 0 (0.0%) | 0 (0.0%) |
| Foreign Born, Citizen | 240 (100.0%) | 0 (0.0%) |
| Foreign Born, not a Citizen | 1,052 (98.4%) | 17 (1.6%) |
Health Insurance Coverage by Household Income in St Vincent College
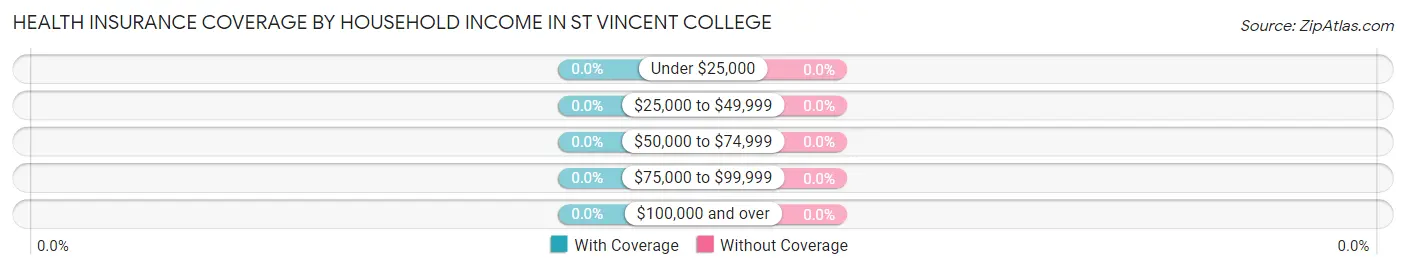
| Household Income | With Coverage | Without Coverage |
| Under $25,000 | 0 (0.0%) | 0 (0.0%) |
| $25,000 to $49,999 | 0 (0.0%) | 0 (0.0%) |
| $50,000 to $74,999 | 0 (0.0%) | 0 (0.0%) |
| $75,000 to $99,999 | 0 (0.0%) | 0 (0.0%) |
| $100,000 and over | 0 (0.0%) | 0 (0.0%) |
Public vs Private Health Insurance Coverage by Age in St Vincent College
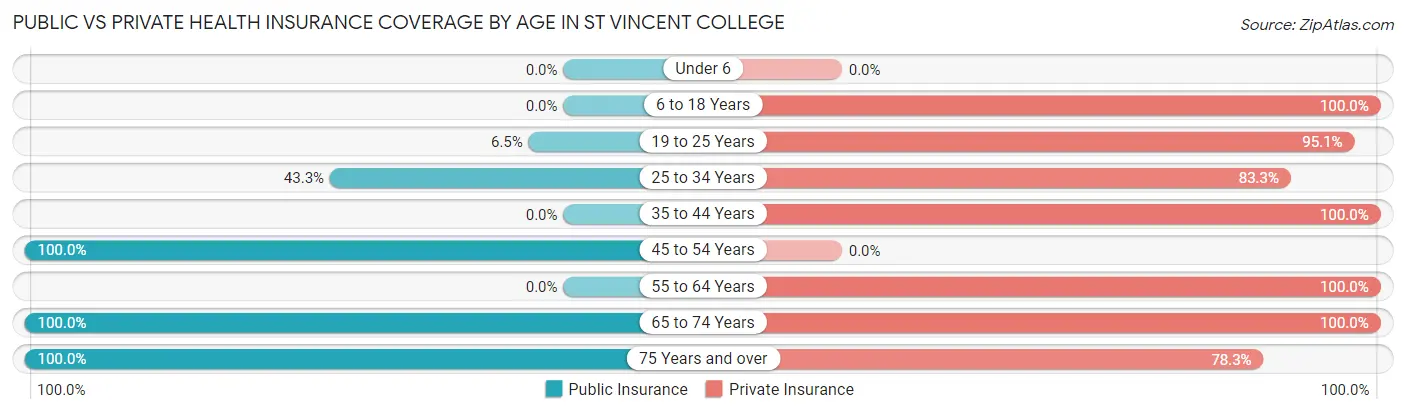
| Age Bracket | Public Insurance | Private Insurance |
| Under 6 | 0 (0.0%) | 0 (0.0%) |
| 6 to 18 Years | 0 (0.0%) | 240 (100.0%) |
| 19 to 25 Years | 69 (6.5%) | 1,017 (95.1%) |
| 25 to 34 Years | 13 (43.3%) | 25 (83.3%) |
| 35 to 44 Years | 0 (0.0%) | 13 (100.0%) |
| 45 to 54 Years | 1 (100.0%) | 0 (0.0%) |
| 55 to 64 Years | 0 (0.0%) | 29 (100.0%) |
| 65 to 74 Years | 30 (100.0%) | 30 (100.0%) |
| 75 Years and over | 23 (100.0%) | 18 (78.3%) |
| Total | 136 (9.5%) | 1,372 (95.6%) |
Disability Status by Sex by Age in St Vincent College
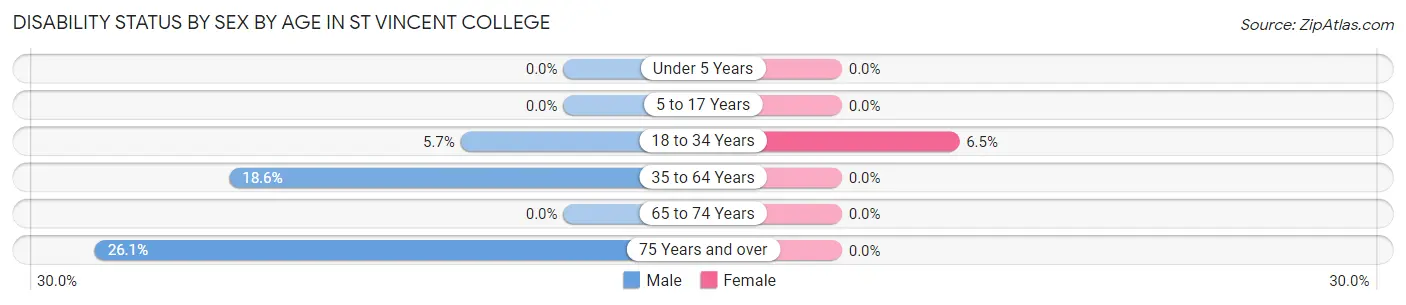
| Age Bracket | Male | Female |
| Under 5 Years | 0 (0.0%) | 0 (0.0%) |
| 5 to 17 Years | 0 (0.0%) | 0 (0.0%) |
| 18 to 34 Years | 39 (5.7%) | 42 (6.5%) |
| 35 to 64 Years | 8 (18.6%) | 0 (0.0%) |
| 65 to 74 Years | 0 (0.0%) | 0 (0.0%) |
| 75 Years and over | 6 (26.1%) | 0 (0.0%) |
Disability Class by Sex by Age in St Vincent College
Disability Class: Hearing Difficulty
| Age Bracket | Male | Female |
| Under 5 Years | 0 (0.0%) | 0 (0.0%) |
| 5 to 17 Years | 0 (0.0%) | 0 (0.0%) |
| 18 to 34 Years | 0 (0.0%) | 0 (0.0%) |
| 35 to 64 Years | 0 (0.0%) | 0 (0.0%) |
| 65 to 74 Years | 0 (0.0%) | 0 (0.0%) |
| 75 Years and over | 0 (0.0%) | 0 (0.0%) |
Disability Class: Vision Difficulty
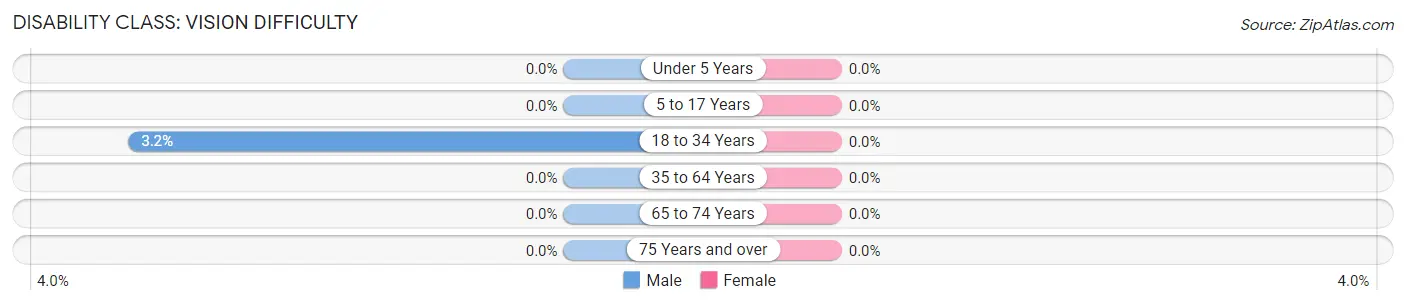
| Age Bracket | Male | Female |
| Under 5 Years | 0 (0.0%) | 0 (0.0%) |
| 5 to 17 Years | 0 (0.0%) | 0 (0.0%) |
| 18 to 34 Years | 22 (3.2%) | 0 (0.0%) |
| 35 to 64 Years | 0 (0.0%) | 0 (0.0%) |
| 65 to 74 Years | 0 (0.0%) | 0 (0.0%) |
| 75 Years and over | 0 (0.0%) | 0 (0.0%) |
Disability Class: Cognitive Difficulty
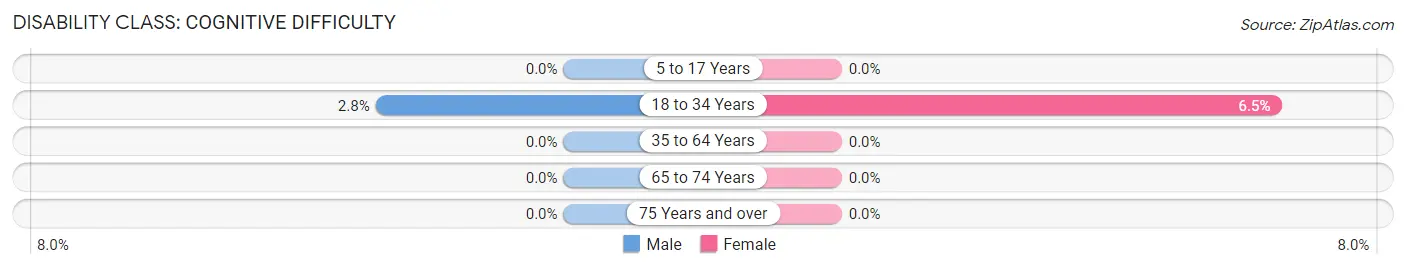
| Age Bracket | Male | Female |
| 5 to 17 Years | 0 (0.0%) | 0 (0.0%) |
| 18 to 34 Years | 19 (2.8%) | 42 (6.5%) |
| 35 to 64 Years | 0 (0.0%) | 0 (0.0%) |
| 65 to 74 Years | 0 (0.0%) | 0 (0.0%) |
| 75 Years and over | 0 (0.0%) | 0 (0.0%) |
Disability Class: Ambulatory Difficulty
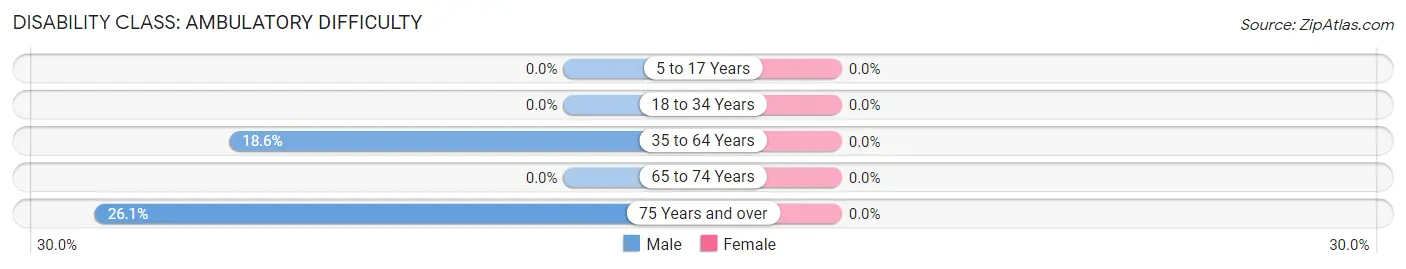
| Age Bracket | Male | Female |
| 5 to 17 Years | 0 (0.0%) | 0 (0.0%) |
| 18 to 34 Years | 0 (0.0%) | 0 (0.0%) |
| 35 to 64 Years | 8 (18.6%) | 0 (0.0%) |
| 65 to 74 Years | 0 (0.0%) | 0 (0.0%) |
| 75 Years and over | 6 (26.1%) | 0 (0.0%) |
Disability Class: Self-Care Difficulty
| Age Bracket | Male | Female |
| 5 to 17 Years | 0 (0.0%) | 0 (0.0%) |
| 18 to 34 Years | 0 (0.0%) | 0 (0.0%) |
| 35 to 64 Years | 0 (0.0%) | 0 (0.0%) |
| 65 to 74 Years | 0 (0.0%) | 0 (0.0%) |
| 75 Years and over | 0 (0.0%) | 0 (0.0%) |
Technology Access in St Vincent College
Computing Device Access in St Vincent College
| Device Type | # Households | % Households |
| Desktop or Laptop | 0 | 0.0% |
| Smartphone | 0 | 0.0% |
| Tablet | 0 | 0.0% |
| No Computing Device | 0 | 0.0% |
| Total | 0 | 0.0% |
Internet Access in St Vincent College
| Internet Type | # Households | % Households |
| Dial-Up Internet | 0 | 0.0% |
| Broadband Home | 0 | 0.0% |
| Cellular Data Only | 0 | 0.0% |
| Satellite Internet | 0 | 0.0% |
| No Internet | 0 | 0.0% |
| Total | 0 | 0.0% |
St Vincent College Summary
Vincent College is a private, four-year liberal arts college located in Latrobe, Pennsylvania. Founded in 1846 by the Benedictine monks of Saint Vincent Archabbey, the college is the oldest Benedictine college in the United States. The college is named after Saint Vincent de Paul, the patron saint of charity.
History
Saint Vincent College was founded in 1846 by Boniface Wimmer, a Benedictine monk from Bavaria. Wimmer was sent to the United States by his abbot to establish a Benedictine monastery and college. The college was originally located in Carrolltown, Pennsylvania, but was moved to its current location in Latrobe in 1855.
The college was originally established as a preparatory school for the Benedictine monks, but it soon began to offer classes to the public. In 1876, the college was granted a charter by the Commonwealth of Pennsylvania and began to offer college-level courses. In the early 20th century, the college began to expand its curriculum and began to offer degrees in a variety of disciplines.
Geography
Saint Vincent College is located in Latrobe, Pennsylvania, a small city in Westmoreland County. The college is situated on a hill overlooking the city and is surrounded by the rolling hills of the Laurel Highlands. The college is located approximately 40 miles east of Pittsburgh and is easily accessible by car or public transportation.
Economy
The economy of Latrobe is largely driven by Saint Vincent College. The college is the largest employer in the city and provides jobs for over 1,000 people. The college also provides a significant economic boost to the city through its students, who spend money in the local economy.
The college also has a significant impact on the local economy through its research and development activities. The college has a number of research centers and institutes that focus on a variety of topics, including health care, energy, and the environment.
Demographics
As of the 2010 census, the population of Latrobe was 8,338. The city is predominantly white, with a population that is 94.3% white and 5.7% other races. The median household income in the city is $37,945, and the median age is 41.
Saint Vincent College has a student population of approximately 2,000. The student body is predominantly white, with a population that is 87.3% white and 12.7% other races. The college also has a significant international student population, with students from over 40 countries.
Conclusion
Saint Vincent College is a private, four-year liberal arts college located in Latrobe, Pennsylvania. Founded in 1846 by the Benedictine monks of Saint Vincent Archabbey, the college is the oldest Benedictine college in the United States. The college is named after Saint Vincent de Paul, the patron saint of charity. The college has a significant impact on the local economy, providing jobs for over 1,000 people and contributing to the local economy through its students and research activities. The college has a student population of approximately 2,000, with a predominantly white student body and a significant international student population.
Common Questions
What is Per Capita Income in St Vincent College?
Per Capita income in St Vincent College is $7,628.
What is Income or Wage Gap in St Vincent College?
Income or Wage Gap in St Vincent College is 46.3%.
Women in St Vincent College earn 53.7 cents for every dollar earned by a man.
What is the Total Population of St Vincent College?
Total Population of St Vincent College is 1,435.
What is the Total Male Population of St Vincent College?
Total Male Population of St Vincent College is 789.
What is the Total Female Population of St Vincent College?
Total Female Population of St Vincent College is 646.
What is the Ratio of Males per 100 Females in St Vincent College?
There are 122.14 Males per 100 Females in St Vincent College.
What is the Ratio of Females per 100 Males in St Vincent College?
There are 81.88 Females per 100 Males in St Vincent College.
What is the Median Population Age in St Vincent College?
Median Population Age in St Vincent College is 20.2 Years.
How Large is the Labor Force in St Vincent College?
There are 621 People in the Labor Forcein in St Vincent College.
What is the Percentage of People in the Labor Force in St Vincent College?
43.3% of People are in the Labor Force in St Vincent College.
What is the Unemployment Rate in St Vincent College?
Unemployment Rate in St Vincent College is 14.2%.