Treasure Lake, PA Map & Demographics
Treasure Lake Map
Treasure Lake Overview
$51,802
PER CAPITA INCOME
$111,283
AVG FAMILY INCOME
$107,051
AVG HOUSEHOLD INCOME
19.8%
WAGE / INCOME GAP [ % ]
80.2¢/ $1
WAGE / INCOME GAP [ $ ]
0.40
INEQUALITY / GINI INDEX
4,890
TOTAL POPULATION
2,787
MALE POPULATION
2,103
FEMALE POPULATION
132.52
MALES / 100 FEMALES
75.46
FEMALES / 100 MALES
46.2
MEDIAN AGE
3.2
AVG FAMILY SIZE
2.9
AVG HOUSEHOLD SIZE
2,528
LABOR FORCE [ PEOPLE ]
61.2%
PERCENT IN LABOR FORCE
4.7%
UNEMPLOYMENT RATE
Income in Treasure Lake
Income Overview in Treasure Lake
Per Capita Income in Treasure Lake is $51,802, while median incomes of families and households are $111,283 and $107,051 respectively.
| Characteristic | Number | Measure |
| Per Capita Income | 4,890 | $51,802 |
| Median Family Income | 1,402 | $111,283 |
| Mean Family Income | 1,402 | $153,193 |
| Median Household Income | 1,701 | $107,051 |
| Mean Household Income | 1,701 | $138,712 |
| Income Deficit | 1,402 | $0 |
| Wage / Income Gap (%) | 4,890 | 19.80% |
| Wage / Income Gap ($) | 4,890 | 80.20¢ per $1 |
| Gini / Inequality Index | 4,890 | 0.40 |
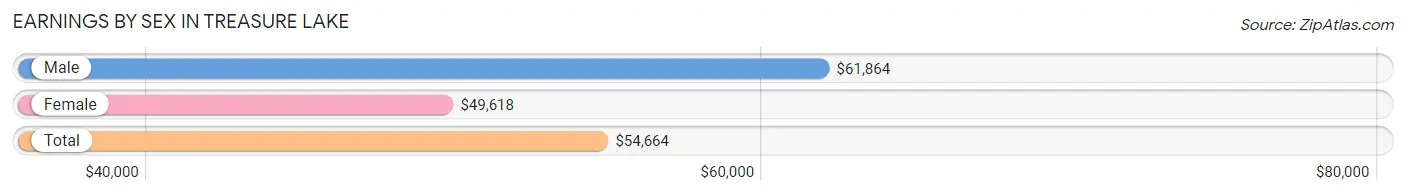
Earnings by Sex in Treasure Lake
Average Earnings in Treasure Lake are $54,664, $61,864 for men and $49,618 for women, a difference of 19.8%.
| Sex | Number | Average Earnings |
| Male | 1,756 (67.8%) | $61,864 |
| Female | 833 (32.2%) | $49,618 |
| Total | 2,589 (100.0%) | $54,664 |
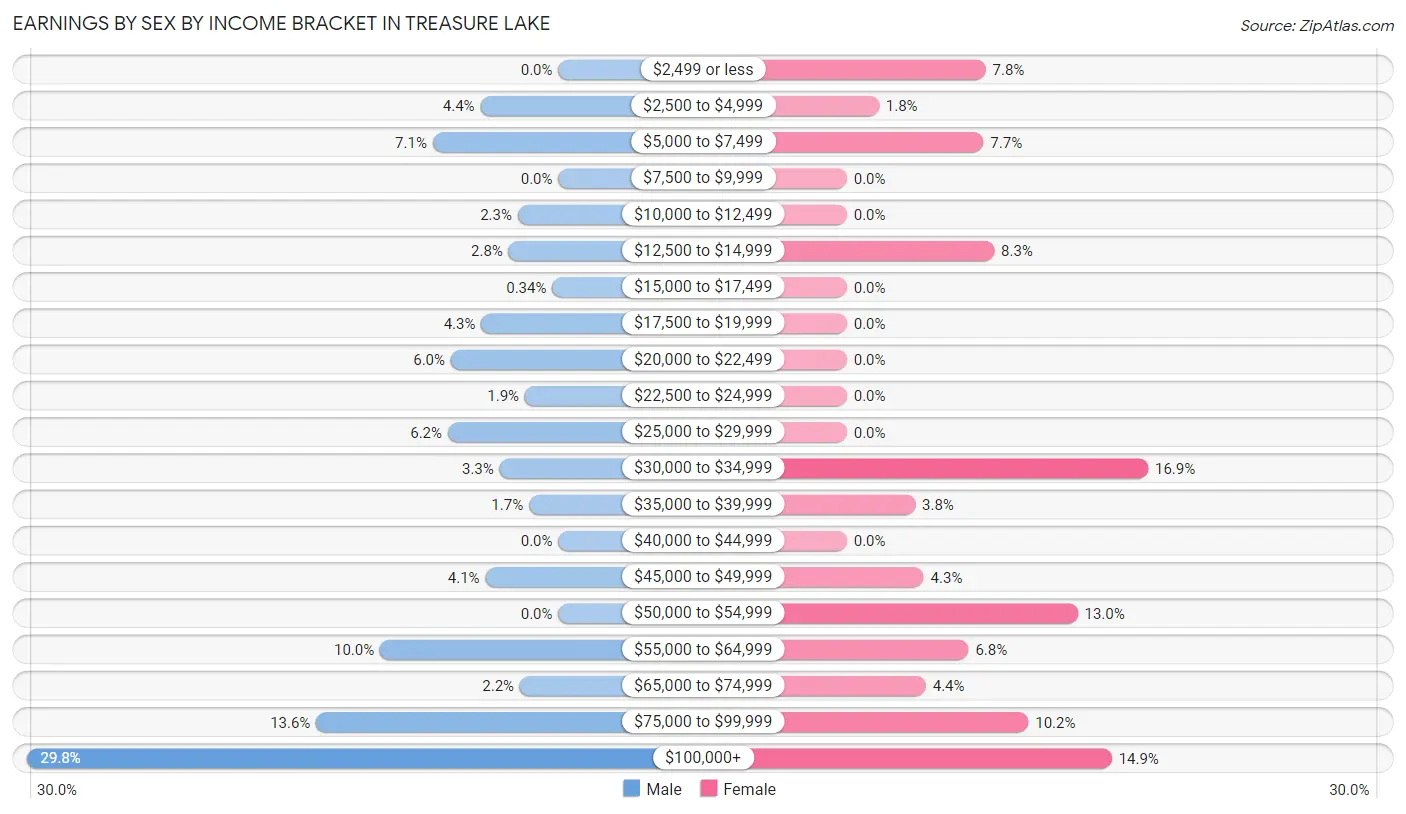
Earnings by Sex by Income Bracket in Treasure Lake
The most common earnings brackets in Treasure Lake are $100,000+ for men (524 | 29.8%) and $30,000 to $34,999 for women (141 | 16.9%).
| Income | Male | Female |
| $2,499 or less | 0 (0.0%) | 65 (7.8%) |
| $2,500 to $4,999 | 77 (4.4%) | 15 (1.8%) |
| $5,000 to $7,499 | 124 (7.1%) | 64 (7.7%) |
| $7,500 to $9,999 | 0 (0.0%) | 0 (0.0%) |
| $10,000 to $12,499 | 40 (2.3%) | 0 (0.0%) |
| $12,500 to $14,999 | 49 (2.8%) | 69 (8.3%) |
| $15,000 to $17,499 | 6 (0.3%) | 0 (0.0%) |
| $17,500 to $19,999 | 76 (4.3%) | 0 (0.0%) |
| $20,000 to $22,499 | 106 (6.0%) | 0 (0.0%) |
| $22,500 to $24,999 | 33 (1.9%) | 0 (0.0%) |
| $25,000 to $29,999 | 109 (6.2%) | 0 (0.0%) |
| $30,000 to $34,999 | 58 (3.3%) | 141 (16.9%) |
| $35,000 to $39,999 | 29 (1.7%) | 32 (3.8%) |
| $40,000 to $44,999 | 0 (0.0%) | 0 (0.0%) |
| $45,000 to $49,999 | 72 (4.1%) | 36 (4.3%) |
| $50,000 to $54,999 | 0 (0.0%) | 108 (13.0%) |
| $55,000 to $64,999 | 176 (10.0%) | 57 (6.8%) |
| $65,000 to $74,999 | 38 (2.2%) | 37 (4.4%) |
| $75,000 to $99,999 | 239 (13.6%) | 85 (10.2%) |
| $100,000+ | 524 (29.8%) | 124 (14.9%) |
| Total | 1,756 (100.0%) | 833 (100.0%) |
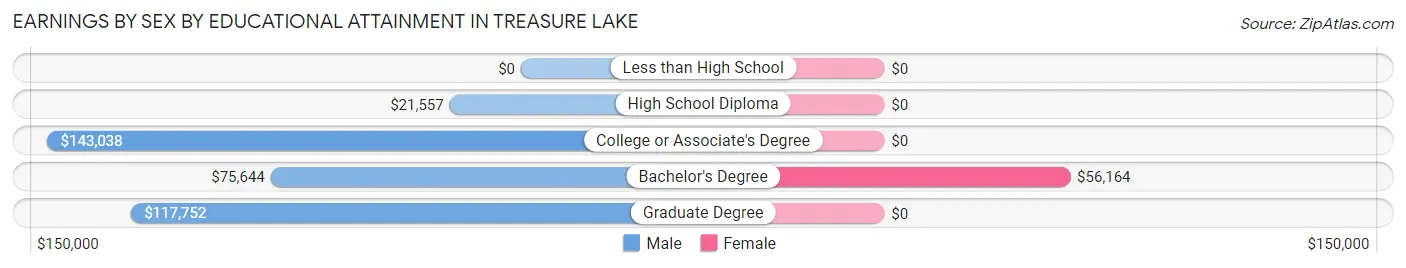
Earnings by Sex by Educational Attainment in Treasure Lake
Average earnings in Treasure Lake are $75,700 for men and $53,449 for women, a difference of 29.4%. Men with an educational attainment of college or associate's degree enjoy the highest average annual earnings of $143,038, while those with high school diploma education earn the least with $21,557. Women with an educational attainment of bachelor's degree earn the most with the average annual earnings of $56,164, while those with bachelor's degree education have the smallest earnings of $56,164.
| Educational Attainment | Male Income | Female Income |
| Less than High School | - | - |
| High School Diploma | $21,557 | $0 |
| College or Associate's Degree | $143,038 | $0 |
| Bachelor's Degree | $75,644 | $56,164 |
| Graduate Degree | $117,752 | $0 |
| Total | $75,700 | $53,449 |
Family Income in Treasure Lake
Family Income Brackets in Treasure Lake
According to the Treasure Lake family income data, there are 523 families falling into the $100,000 to $149,999 income range, which is the most common income bracket and makes up 37.3% of all families.
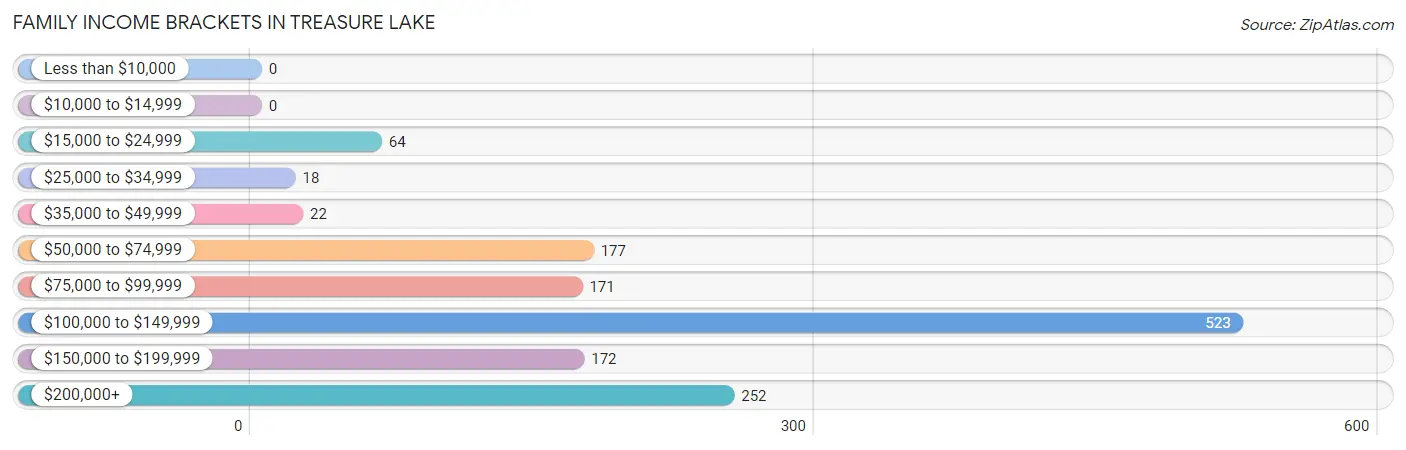
| Income Bracket | # Families | % Families |
| Less than $10,000 | 0 | 0.0% |
| $10,000 to $14,999 | 0 | 0.0% |
| $15,000 to $24,999 | 64 | 4.6% |
| $25,000 to $34,999 | 18 | 1.3% |
| $35,000 to $49,999 | 22 | 1.6% |
| $50,000 to $74,999 | 177 | 12.6% |
| $75,000 to $99,999 | 171 | 12.2% |
| $100,000 to $149,999 | 523 | 37.3% |
| $150,000 to $199,999 | 172 | 12.3% |
| $200,000+ | 252 | 18.0% |
Family Income by Famaliy Size in Treasure Lake
3-person families (394 | 28.1%) account for the highest median family income in Treasure Lake with $147,365 per family, while 2-person families (513 | 36.6%) have the highest median income of $49,194 per family member.
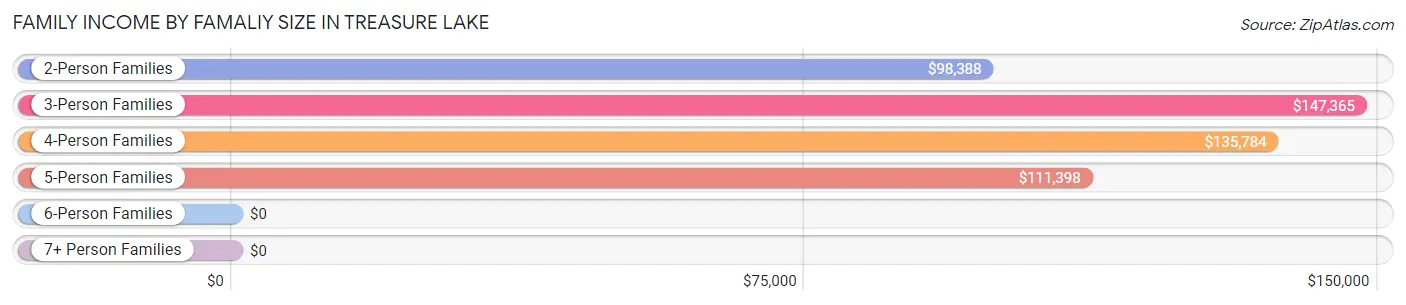
| Income Bracket | # Families | Median Income |
| 2-Person Families | 513 (36.6%) | $98,388 |
| 3-Person Families | 394 (28.1%) | $147,365 |
| 4-Person Families | 386 (27.5%) | $135,784 |
| 5-Person Families | 93 (6.6%) | $111,398 |
| 6-Person Families | 16 (1.1%) | $0 |
| 7+ Person Families | 0 (0.0%) | $0 |
| Total | 1,402 (100.0%) | $111,283 |
Family Income by Number of Earners in Treasure Lake
The median family income in Treasure Lake is $111,283, with families comprising 2 earners (505) having the highest median family income of $153,977, while families with no earners (363) have the lowest median family income of $96,438, accounting for 36.0% and 25.9% of families, respectively.
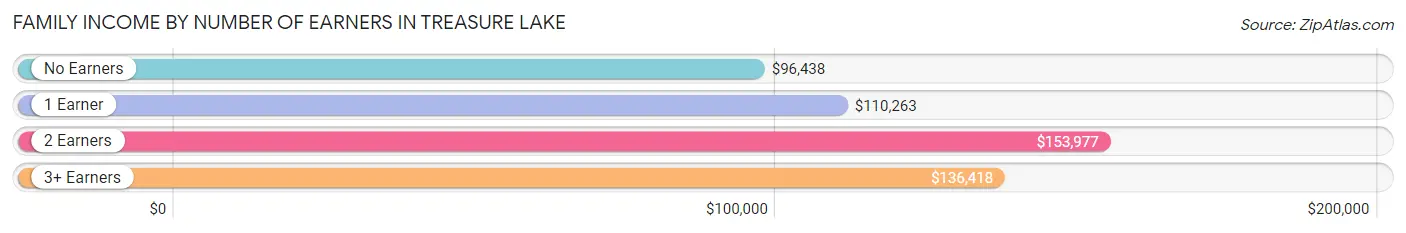
| Number of Earners | # Families | Median Income |
| No Earners | 363 (25.9%) | $96,438 |
| 1 Earner | 168 (12.0%) | $110,263 |
| 2 Earners | 505 (36.0%) | $153,977 |
| 3+ Earners | 366 (26.1%) | $136,418 |
| Total | 1,402 (100.0%) | $111,283 |
Household Income in Treasure Lake
Household Income Brackets in Treasure Lake
With 556 households falling in the category, the $100,000 to $149,999 income range is the most frequent in Treasure Lake, accounting for 32.7% of all households.
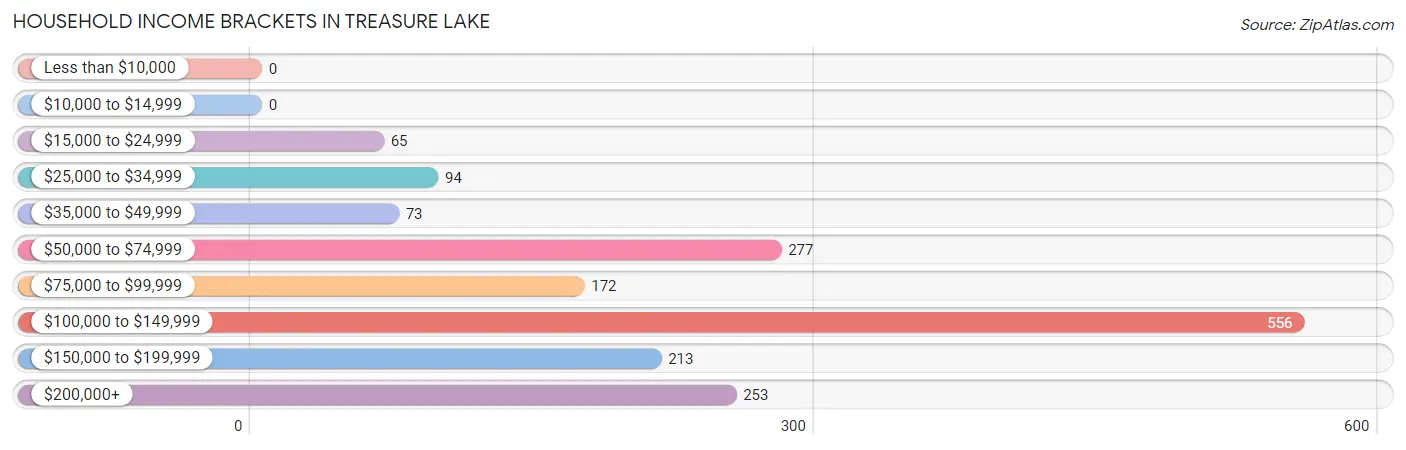
| Income Bracket | # Households | % Households |
| Less than $10,000 | 0 | 0.0% |
| $10,000 to $14,999 | 0 | 0.0% |
| $15,000 to $24,999 | 65 | 3.8% |
| $25,000 to $34,999 | 94 | 5.5% |
| $35,000 to $49,999 | 73 | 4.3% |
| $50,000 to $74,999 | 277 | 16.3% |
| $75,000 to $99,999 | 172 | 10.1% |
| $100,000 to $149,999 | 556 | 32.7% |
| $150,000 to $199,999 | 213 | 12.5% |
| $200,000+ | 253 | 14.9% |
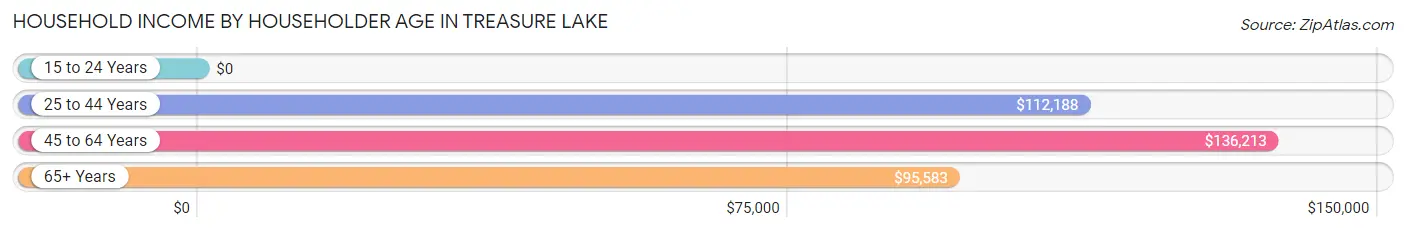
Household Income by Householder Age in Treasure Lake
The median household income in Treasure Lake is $107,051, with the highest median household income of $136,213 found in the 45 to 64 years age bracket for the primary householder. A total of 806 households (47.4%) fall into this category.
| Income Bracket | # Households | Median Income |
| 15 to 24 Years | 0 (0.0%) | $0 |
| 25 to 44 Years | 293 (17.2%) | $112,188 |
| 45 to 64 Years | 806 (47.4%) | $136,213 |
| 65+ Years | 602 (35.4%) | $95,583 |
| Total | 1,701 (100.0%) | $107,051 |
Poverty in Treasure Lake
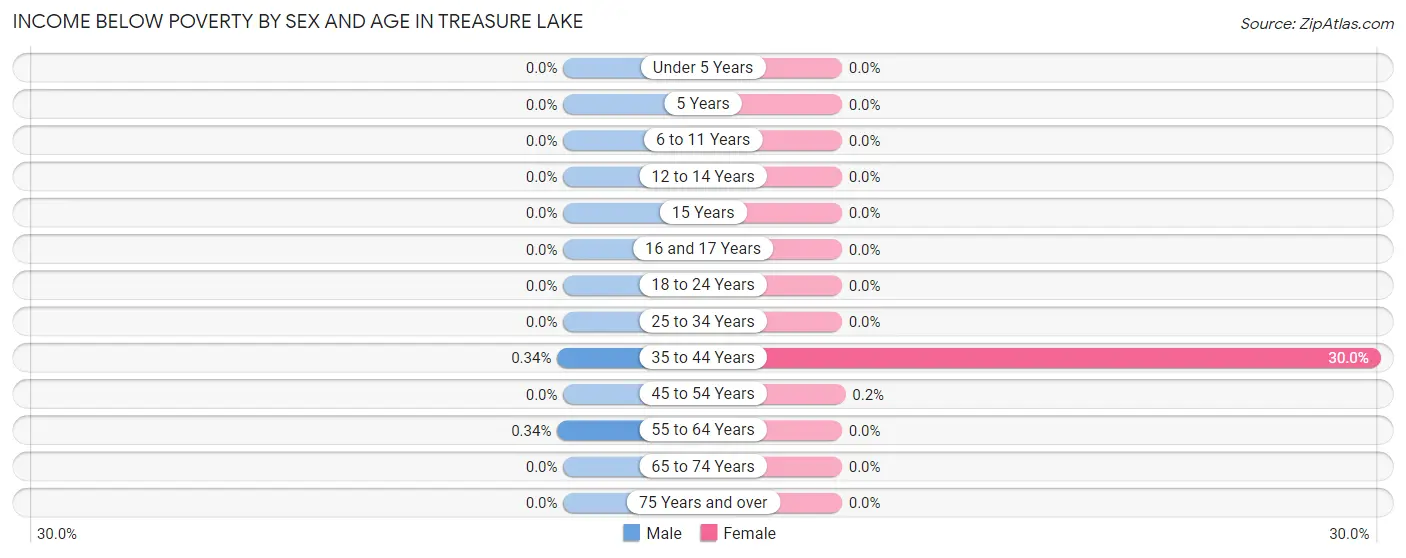
Income Below Poverty by Sex and Age in Treasure Lake
With 0.1% poverty level for males and 2.5% for females among the residents of Treasure Lake, 35 to 44 year old males and 35 to 44 year old females are the most vulnerable to poverty, with 1 males (0.3%) and 51 females (30.0%) in their respective age groups living below the poverty level.
| Age Bracket | Male | Female |
| Under 5 Years | 0 (0.0%) | 0 (0.0%) |
| 5 Years | 0 (0.0%) | 0 (0.0%) |
| 6 to 11 Years | 0 (0.0%) | 0 (0.0%) |
| 12 to 14 Years | 0 (0.0%) | 0 (0.0%) |
| 15 Years | 0 (0.0%) | 0 (0.0%) |
| 16 and 17 Years | 0 (0.0%) | 0 (0.0%) |
| 18 to 24 Years | 0 (0.0%) | 0 (0.0%) |
| 25 to 34 Years | 0 (0.0%) | 0 (0.0%) |
| 35 to 44 Years | 1 (0.3%) | 51 (30.0%) |
| 45 to 54 Years | 0 (0.0%) | 1 (0.2%) |
| 55 to 64 Years | 1 (0.3%) | 0 (0.0%) |
| 65 to 74 Years | 0 (0.0%) | 0 (0.0%) |
| 75 Years and over | 0 (0.0%) | 0 (0.0%) |
| Total | 2 (0.1%) | 52 (2.5%) |
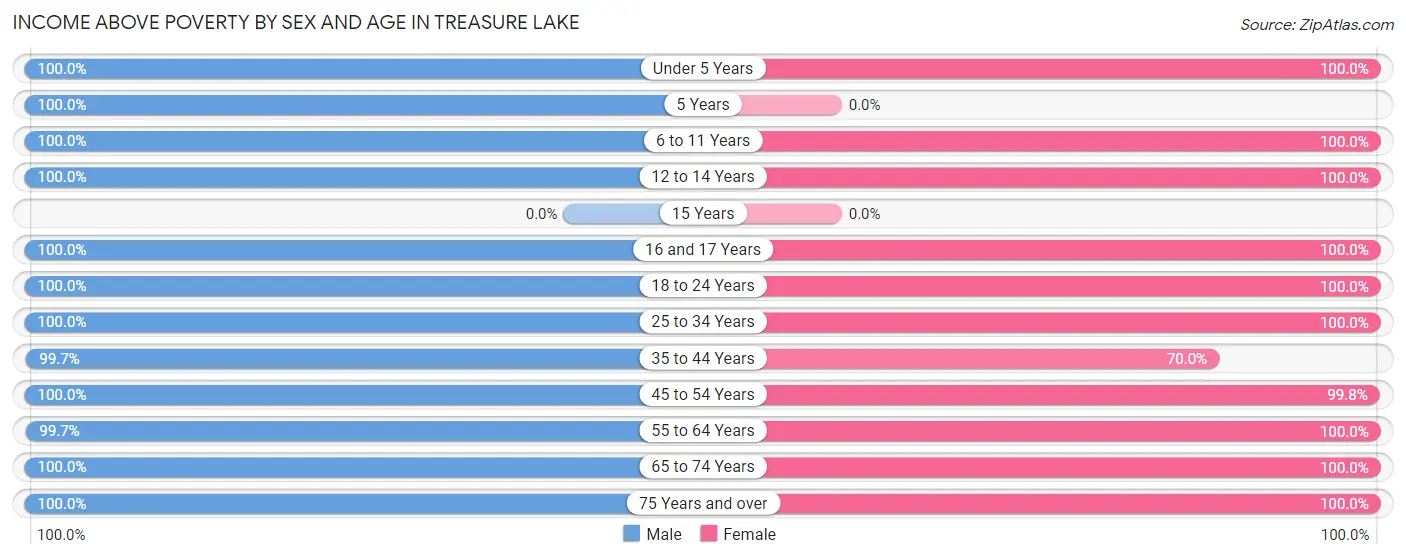
Income Above Poverty by Sex and Age in Treasure Lake
According to the poverty statistics in Treasure Lake, males aged under 5 years and females aged under 5 years are the age groups that are most secure financially, with 100.0% of males and 100.0% of females in these age groups living above the poverty line.
| Age Bracket | Male | Female |
| Under 5 Years | 181 (100.0%) | 142 (100.0%) |
| 5 Years | 15 (100.0%) | 0 (0.0%) |
| 6 to 11 Years | 137 (100.0%) | 179 (100.0%) |
| 12 to 14 Years | 84 (100.0%) | 21 (100.0%) |
| 15 Years | 0 (0.0%) | 0 (0.0%) |
| 16 and 17 Years | 40 (100.0%) | 91 (100.0%) |
| 18 to 24 Years | 345 (100.0%) | 101 (100.0%) |
| 25 to 34 Years | 406 (100.0%) | 197 (100.0%) |
| 35 to 44 Years | 297 (99.7%) | 119 (70.0%) |
| 45 to 54 Years | 433 (100.0%) | 487 (99.8%) |
| 55 to 64 Years | 290 (99.7%) | 243 (100.0%) |
| 65 to 74 Years | 319 (100.0%) | 351 (100.0%) |
| 75 Years and over | 238 (100.0%) | 120 (100.0%) |
| Total | 2,785 (99.9%) | 2,051 (97.5%) |
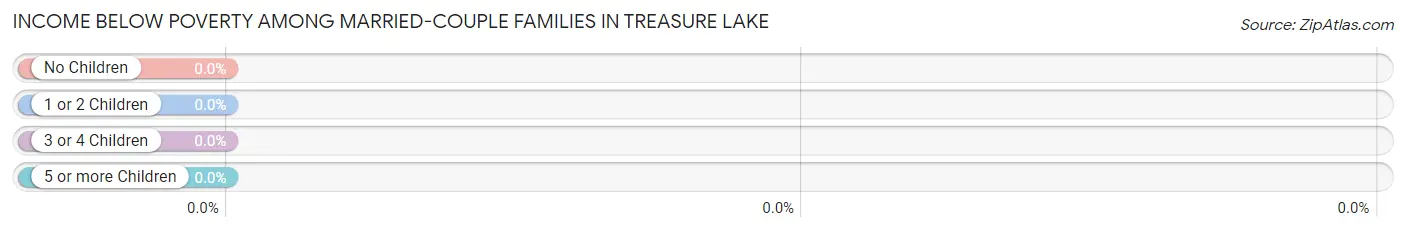
Income Below Poverty Among Married-Couple Families in Treasure Lake
| Children | Above Poverty | Below Poverty |
| No Children | 835 (100.0%) | 0 (0.0%) |
| 1 or 2 Children | 326 (100.0%) | 0 (0.0%) |
| 3 or 4 Children | 86 (100.0%) | 0 (0.0%) |
| 5 or more Children | 0 (0.0%) | 0 (0.0%) |
| Total | 1,247 (100.0%) | 0 (0.0%) |
Income Below Poverty Among Single-Parent Households in Treasure Lake
| Children | Single Father | Single Mother |
| No Children | 0 (0.0%) | 0 (0.0%) |
| 1 or 2 Children | 0 (0.0%) | 0 (0.0%) |
| 3 or 4 Children | 0 (0.0%) | 0 (0.0%) |
| 5 or more Children | 0 (0.0%) | 0 (0.0%) |
| Total | 0 (0.0%) | 0 (0.0%) |
Income Below Poverty Among Married-Couple vs Single-Parent Households in Treasure Lake
| Children | Married-Couple Families | Single-Parent Households |
| No Children | 0 (0.0%) | 0 (0.0%) |
| 1 or 2 Children | 0 (0.0%) | 0 (0.0%) |
| 3 or 4 Children | 0 (0.0%) | 0 (0.0%) |
| 5 or more Children | 0 (0.0%) | 0 (0.0%) |
| Total | 0 (0.0%) | 0 (0.0%) |
Race in Treasure Lake
The most populous races in Treasure Lake are White / Caucasian (4,595 | 94.0%), Hispanic or Latino (261 | 5.3%), and Two or more Races (261 | 5.3%).
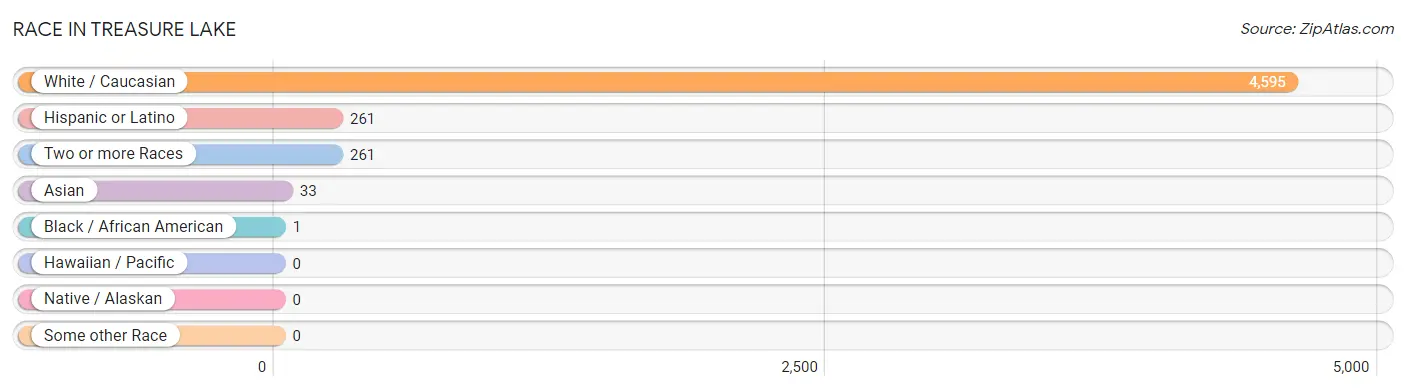
| Race | # Population | % Population |
| Asian | 33 | 0.7% |
| Black / African American | 1 | 0.0% |
| Hawaiian / Pacific | 0 | 0.0% |
| Hispanic or Latino | 261 | 5.3% |
| Native / Alaskan | 0 | 0.0% |
| White / Caucasian | 4,595 | 94.0% |
| Two or more Races | 261 | 5.3% |
| Some other Race | 0 | 0.0% |
| Total | 4,890 | 100.0% |
Ancestry in Treasure Lake
The most populous ancestries reported in Treasure Lake are German (915 | 18.7%), Irish (594 | 12.1%), English (568 | 11.6%), Polish (551 | 11.3%), and American (313 | 6.4%), together accounting for 60.1% of all Treasure Lake residents.
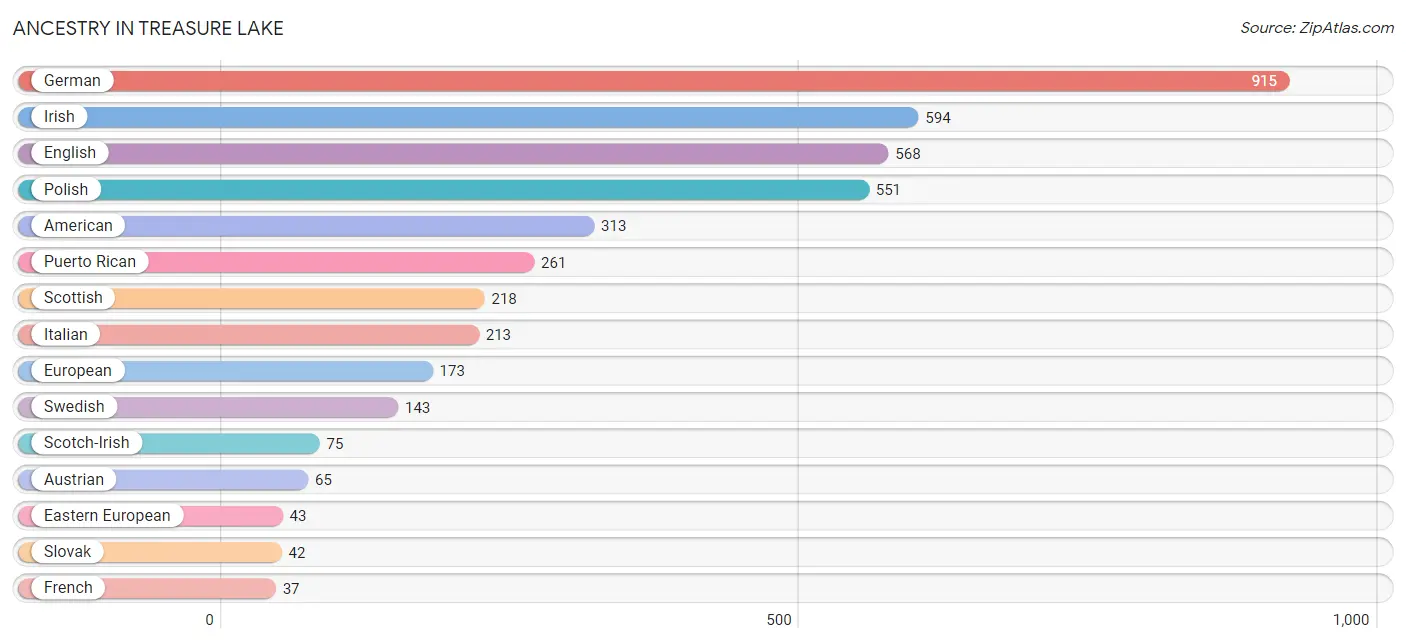
| Ancestry | # Population | % Population |
| African | 1 | 0.0% |
| American | 313 | 6.4% |
| Austrian | 65 | 1.3% |
| Eastern European | 43 | 0.9% |
| English | 568 | 11.6% |
| European | 173 | 3.5% |
| French | 37 | 0.8% |
| German | 915 | 18.7% |
| Greek | 26 | 0.5% |
| Hungarian | 14 | 0.3% |
| Indian (Asian) | 33 | 0.7% |
| Irish | 594 | 12.1% |
| Italian | 213 | 4.4% |
| Norwegian | 7 | 0.1% |
| Polish | 551 | 11.3% |
| Puerto Rican | 261 | 5.3% |
| Scotch-Irish | 75 | 1.5% |
| Scottish | 218 | 4.5% |
| Slovak | 42 | 0.9% |
| Subsaharan African | 1 | 0.0% |
| Swedish | 143 | 2.9% |
| Ukrainian | 34 | 0.7% | View All 22 Rows |
Immigrants in Treasure Lake
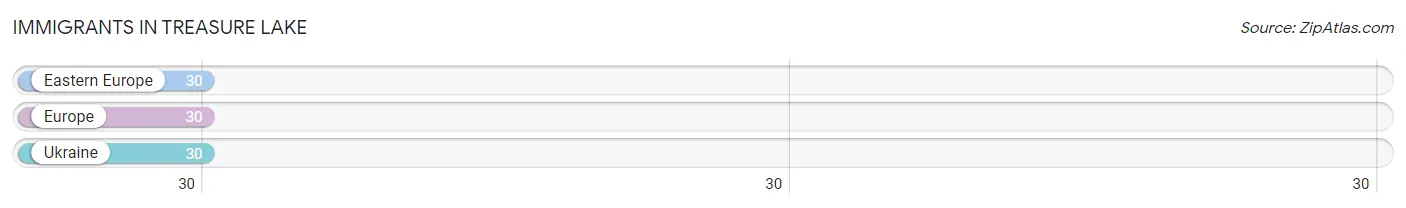
The most numerous immigrant groups reported in Treasure Lake came from Eastern Europe (30 | 0.6%), Europe (30 | 0.6%), and Ukraine (30 | 0.6%), together accounting for 1.8% of all Treasure Lake residents.
| Immigration Origin | # Population | % Population |
| Eastern Europe | 30 | 0.6% |
| Europe | 30 | 0.6% |
| Ukraine | 30 | 0.6% | View All 3 Rows |
Sex and Age in Treasure Lake
Sex and Age in Treasure Lake
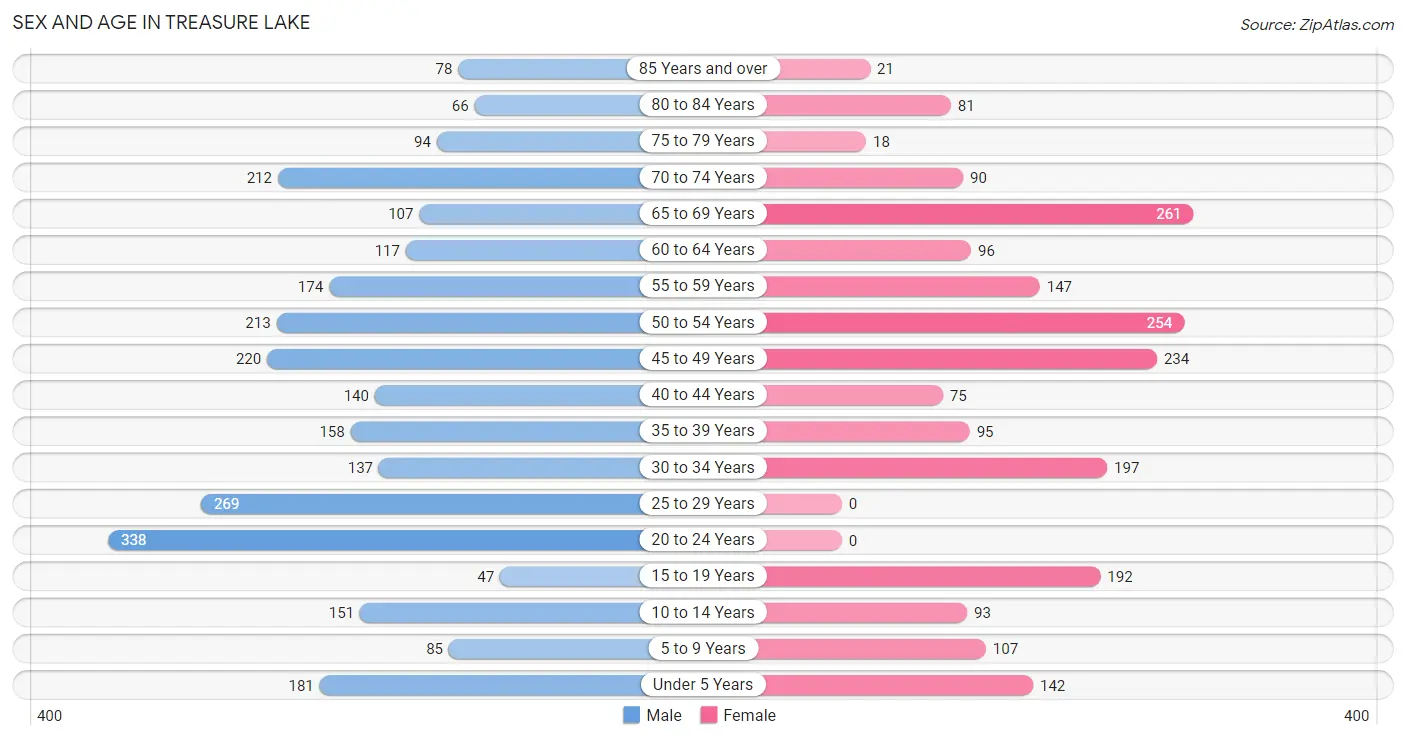
The most populous age groups in Treasure Lake are 20 to 24 Years (338 | 12.1%) for men and 65 to 69 Years (261 | 12.4%) for women.
| Age Bracket | Male | Female |
| Under 5 Years | 181 (6.5%) | 142 (6.8%) |
| 5 to 9 Years | 85 (3.0%) | 107 (5.1%) |
| 10 to 14 Years | 151 (5.4%) | 93 (4.4%) |
| 15 to 19 Years | 47 (1.7%) | 192 (9.1%) |
| 20 to 24 Years | 338 (12.1%) | 0 (0.0%) |
| 25 to 29 Years | 269 (9.7%) | 0 (0.0%) |
| 30 to 34 Years | 137 (4.9%) | 197 (9.4%) |
| 35 to 39 Years | 158 (5.7%) | 95 (4.5%) |
| 40 to 44 Years | 140 (5.0%) | 75 (3.6%) |
| 45 to 49 Years | 220 (7.9%) | 234 (11.1%) |
| 50 to 54 Years | 213 (7.6%) | 254 (12.1%) |
| 55 to 59 Years | 174 (6.2%) | 147 (7.0%) |
| 60 to 64 Years | 117 (4.2%) | 96 (4.6%) |
| 65 to 69 Years | 107 (3.8%) | 261 (12.4%) |
| 70 to 74 Years | 212 (7.6%) | 90 (4.3%) |
| 75 to 79 Years | 94 (3.4%) | 18 (0.9%) |
| 80 to 84 Years | 66 (2.4%) | 81 (3.8%) |
| 85 Years and over | 78 (2.8%) | 21 (1.0%) |
| Total | 2,787 (100.0%) | 2,103 (100.0%) |
Families and Households in Treasure Lake
Median Family Size in Treasure Lake
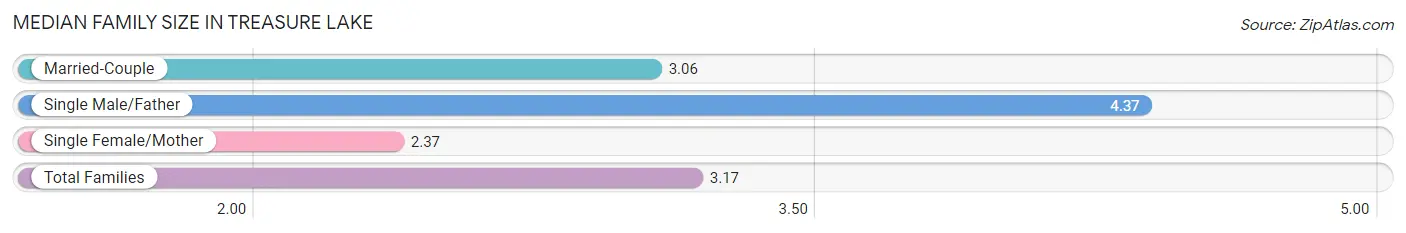
The median family size in Treasure Lake is 3.17 persons per family, with single male/father families (128 | 9.1%) accounting for the largest median family size of 4.37 persons per family. On the other hand, single female/mother families (27 | 1.9%) represent the smallest median family size with 2.37 persons per family.
| Family Type | # Families | Family Size |
| Married-Couple | 1,247 (88.9%) | 3.06 |
| Single Male/Father | 128 (9.1%) | 4.37 |
| Single Female/Mother | 27 (1.9%) | 2.37 |
| Total Families | 1,402 (100.0%) | 3.17 |
Median Household Size in Treasure Lake
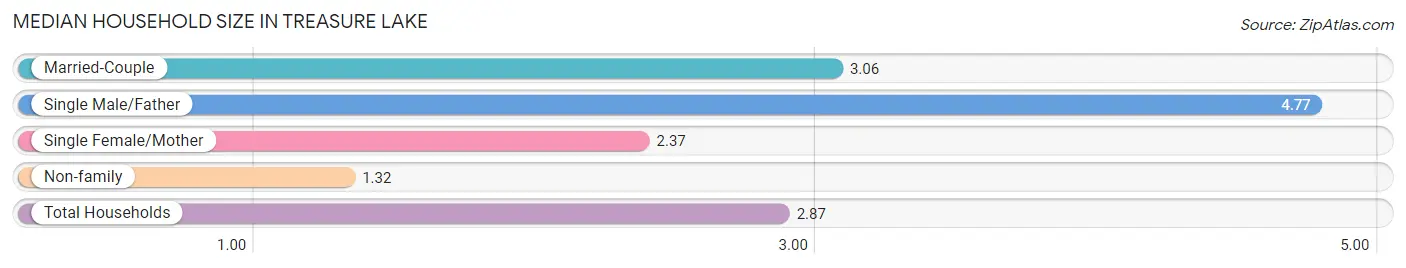
The median household size in Treasure Lake is 2.87 persons per household, with single male/father households (128 | 7.5%) accounting for the largest median household size of 4.77 persons per household. non-family households (299 | 17.6%) represent the smallest median household size with 1.32 persons per household.
| Household Type | # Households | Household Size |
| Married-Couple | 1,247 (73.3%) | 3.06 |
| Single Male/Father | 128 (7.5%) | 4.77 |
| Single Female/Mother | 27 (1.6%) | 2.37 |
| Non-family | 299 (17.6%) | 1.32 |
| Total Households | 1,701 (100.0%) | 2.87 |
Household Size by Marriage Status in Treasure Lake
Out of a total of 1,701 households in Treasure Lake, 1,402 (82.4%) are family households, while 299 (17.6%) are nonfamily households. The most numerous type of family households are 2-person households, comprising 513, and the most common type of nonfamily households are 1-person households, comprising 260.
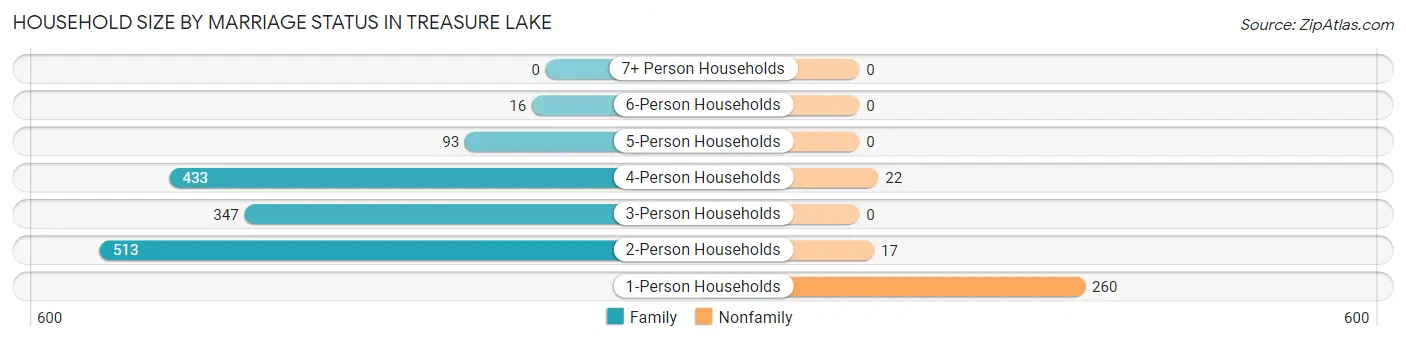
| Household Size | Family Households | Nonfamily Households |
| 1-Person Households | - | 260 (15.3%) |
| 2-Person Households | 513 (30.2%) | 17 (1.0%) |
| 3-Person Households | 347 (20.4%) | 0 (0.0%) |
| 4-Person Households | 433 (25.5%) | 22 (1.3%) |
| 5-Person Households | 93 (5.5%) | 0 (0.0%) |
| 6-Person Households | 16 (0.9%) | 0 (0.0%) |
| 7+ Person Households | 0 (0.0%) | 0 (0.0%) |
| Total | 1,402 (82.4%) | 299 (17.6%) |
Female Fertility in Treasure Lake
Fertility by Age in Treasure Lake
Average fertility rate in Treasure Lake is 187.0 births per 1,000 women. Women in the age bracket of 20 to 34 years have the highest fertility rate with 680.0 births per 1,000 women. Women in the age bracket of 20 to 34 years acount for 84.8% of all women with births.
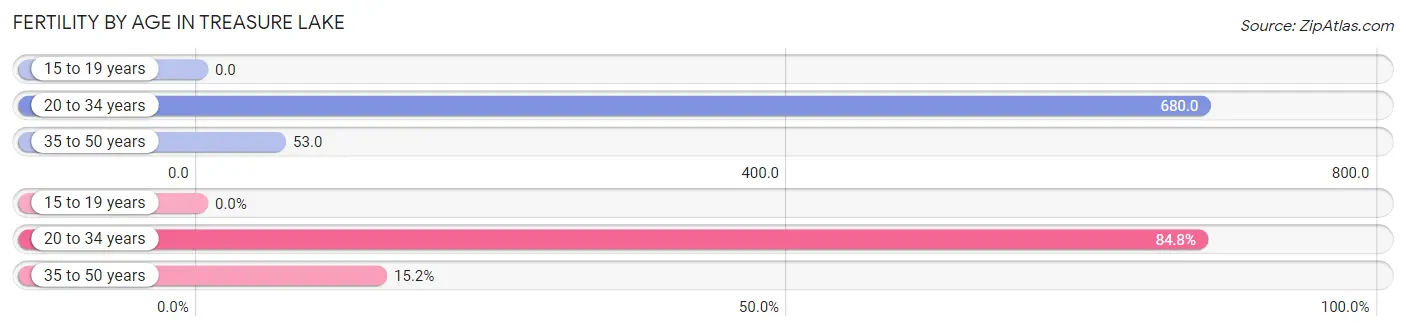
| Age Bracket | Women with Births | Births / 1,000 Women |
| 15 to 19 years | 0 (0.0%) | 0.0 |
| 20 to 34 years | 134 (84.8%) | 680.0 |
| 35 to 50 years | 24 (15.2%) | 53.0 |
| Total | 158 (100.0%) | 187.0 |
Fertility by Age by Marriage Status in Treasure Lake
67.1% of women with births (158) in Treasure Lake are married. The highest percentage of unmarried women with births falls into 20 to 34 years age bracket with 38.8% of them unmarried at the time of birth, while the lowest percentage of unmarried women with births belong to 35 to 50 years age bracket with 0.0% of them unmarried.
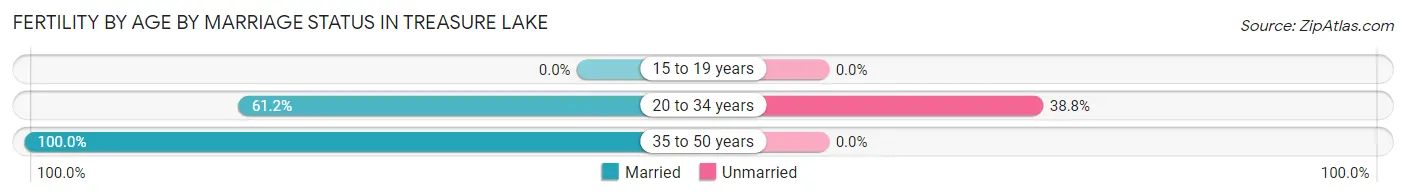
| Age Bracket | Married | Unmarried |
| 15 to 19 years | 0 (0.0%) | 0 (0.0%) |
| 20 to 34 years | 82 (61.2%) | 52 (38.8%) |
| 35 to 50 years | 24 (100.0%) | 0 (0.0%) |
| Total | 106 (67.1%) | 52 (32.9%) |
Fertility by Education in Treasure Lake
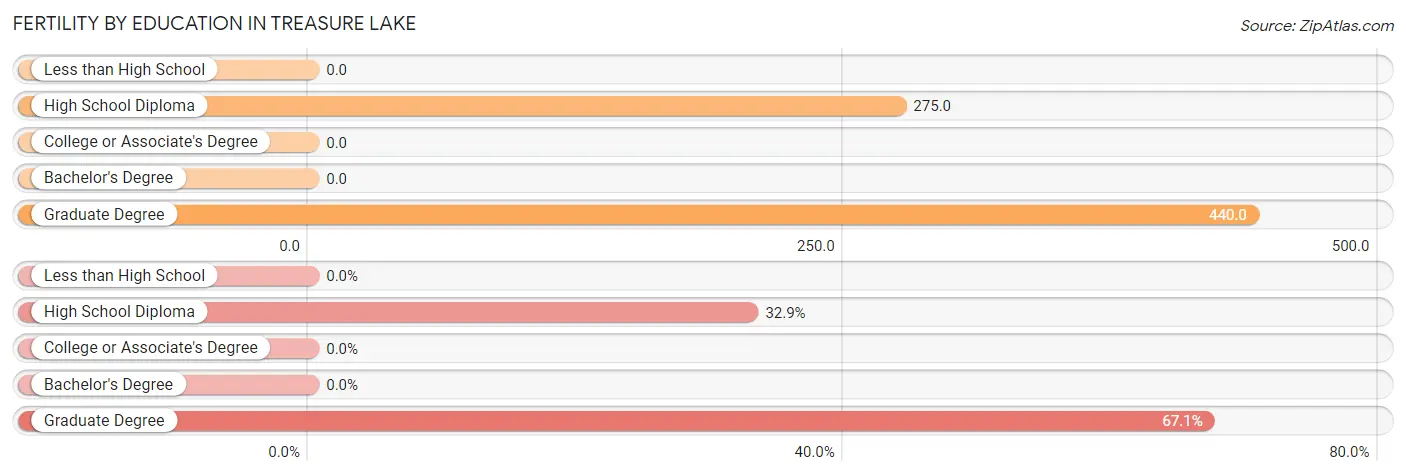
| Educational Attainment | Women with Births | Births / 1,000 Women |
| Less than High School | 0 (0.0%) | 0.0 |
| High School Diploma | 52 (32.9%) | 275.0 |
| College or Associate's Degree | 0 (0.0%) | 0.0 |
| Bachelor's Degree | 0 (0.0%) | 0.0 |
| Graduate Degree | 106 (67.1%) | 440.0 |
| Total | 158 (100.0%) | 187.0 |
Fertility by Education by Marriage Status in Treasure Lake
32.9% of women with births in Treasure Lake are unmarried. Women with the educational attainment of graduate degree are most likely to be married with 100.0% of them married at childbirth, while women with the educational attainment of high school diploma are least likely to be married with 100.0% of them unmarried at childbirth.
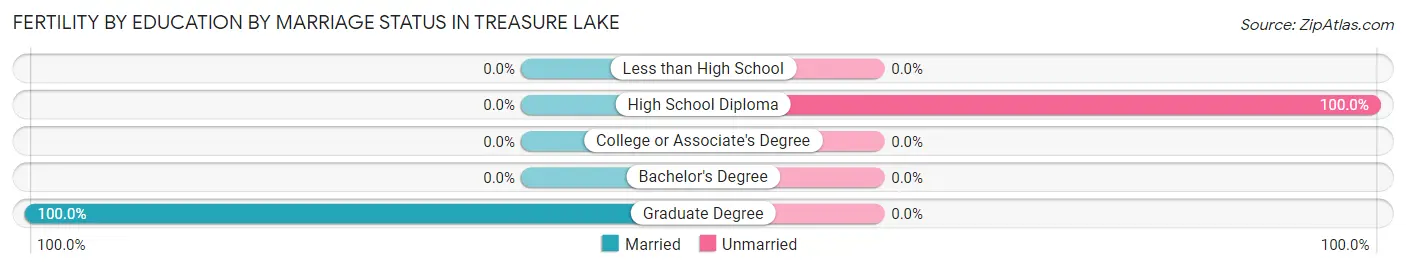
| Educational Attainment | Married | Unmarried |
| Less than High School | 0 (0.0%) | 0 (0.0%) |
| High School Diploma | 0 (0.0%) | 52 (100.0%) |
| College or Associate's Degree | 0 (0.0%) | 0 (0.0%) |
| Bachelor's Degree | 0 (0.0%) | 0 (0.0%) |
| Graduate Degree | 106 (100.0%) | 0 (0.0%) |
| Total | 106 (67.1%) | 52 (32.9%) |
Employment Characteristics in Treasure Lake
Employment by Class of Employer in Treasure Lake
Among the 2,375 employed individuals in Treasure Lake, private company employees (1,100 | 46.3%), not-for-profit organizations (770 | 32.4%), and state government employees (141 | 5.9%) make up the most common classes of employment.
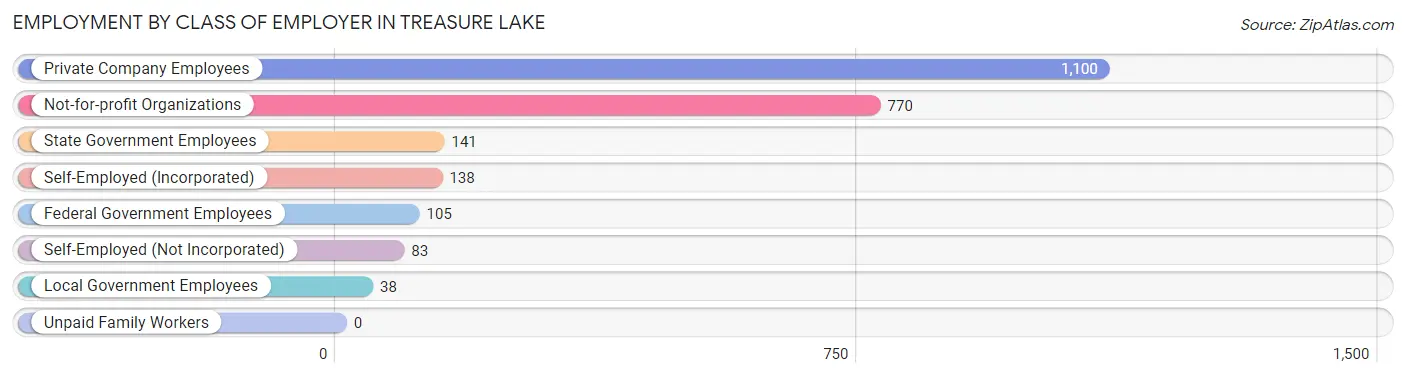
| Employer Class | # Employees | % Employees |
| Private Company Employees | 1,100 | 46.3% |
| Self-Employed (Incorporated) | 138 | 5.8% |
| Self-Employed (Not Incorporated) | 83 | 3.5% |
| Not-for-profit Organizations | 770 | 32.4% |
| Local Government Employees | 38 | 1.6% |
| State Government Employees | 141 | 5.9% |
| Federal Government Employees | 105 | 4.4% |
| Unpaid Family Workers | 0 | 0.0% |
| Total | 2,375 | 100.0% |
Employment Status by Age in Treasure Lake
According to the labor force statistics for Treasure Lake, out of the total population over 16 years of age (4,131), 61.2% or 2,528 individuals are in the labor force, with 4.7% or 119 of them unemployed. The age group with the highest labor force participation rate is 25 to 29 years, with 89.6% or 241 individuals in the labor force. Within the labor force, the 20 to 24 years age range has the highest percentage of unemployed individuals, with 45.3% or 117 of them being unemployed.
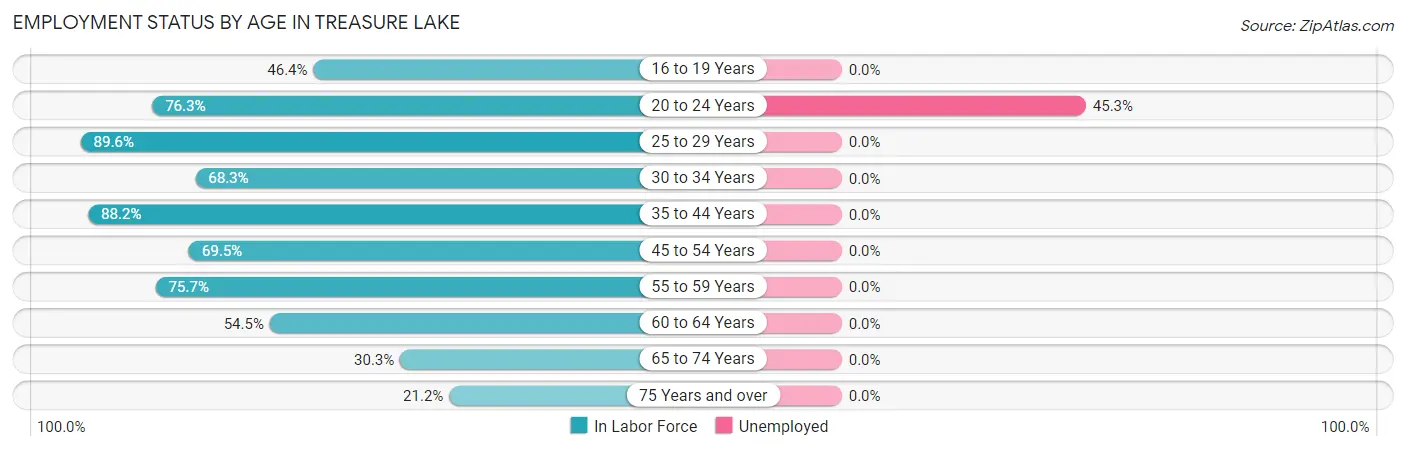
| Age Bracket | In Labor Force | Unemployed |
| 16 to 19 Years | 111 (46.4%) | 0 (0.0%) |
| 20 to 24 Years | 258 (76.3%) | 117 (45.3%) |
| 25 to 29 Years | 241 (89.6%) | 0 (0.0%) |
| 30 to 34 Years | 228 (68.3%) | 0 (0.0%) |
| 35 to 44 Years | 413 (88.2%) | 0 (0.0%) |
| 45 to 54 Years | 640 (69.5%) | 0 (0.0%) |
| 55 to 59 Years | 243 (75.7%) | 0 (0.0%) |
| 60 to 64 Years | 116 (54.5%) | 0 (0.0%) |
| 65 to 74 Years | 203 (30.3%) | 0 (0.0%) |
| 75 Years and over | 76 (21.2%) | 0 (0.0%) |
| Total | 2,528 (61.2%) | 119 (4.7%) |
Employment Status by Educational Attainment in Treasure Lake
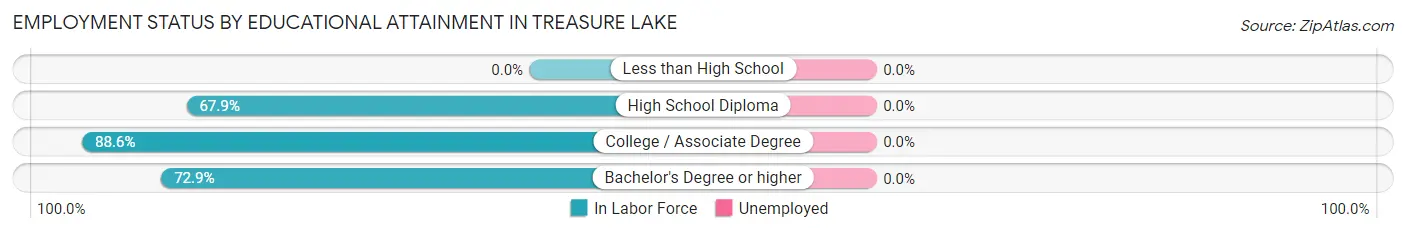
| Educational Attainment | In Labor Force | Unemployed |
| Less than High School | 0 (0.0%) | 0 (0.0%) |
| High School Diploma | 326 (67.9%) | 0 (0.0%) |
| College / Associate Degree | 365 (88.6%) | 0 (0.0%) |
| Bachelor's Degree or higher | 1,190 (72.9%) | 0 (0.0%) |
| Total | 1,882 (74.5%) | 0 (0.0%) |
Employment Occupations by Sex in Treasure Lake
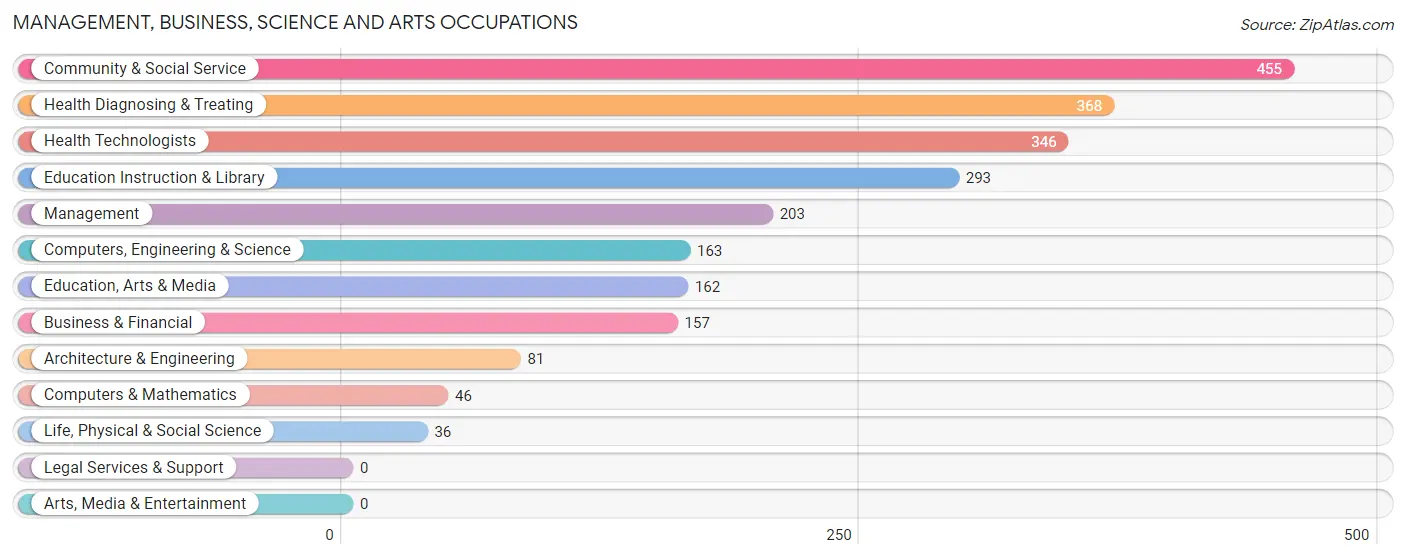
Management, Business, Science and Arts Occupations
The most common Management, Business, Science and Arts occupations in Treasure Lake are Community & Social Service (455 | 19.1%), Health Diagnosing & Treating (368 | 15.4%), Health Technologists (346 | 14.5%), Education Instruction & Library (293 | 12.3%), and Management (203 | 8.5%).
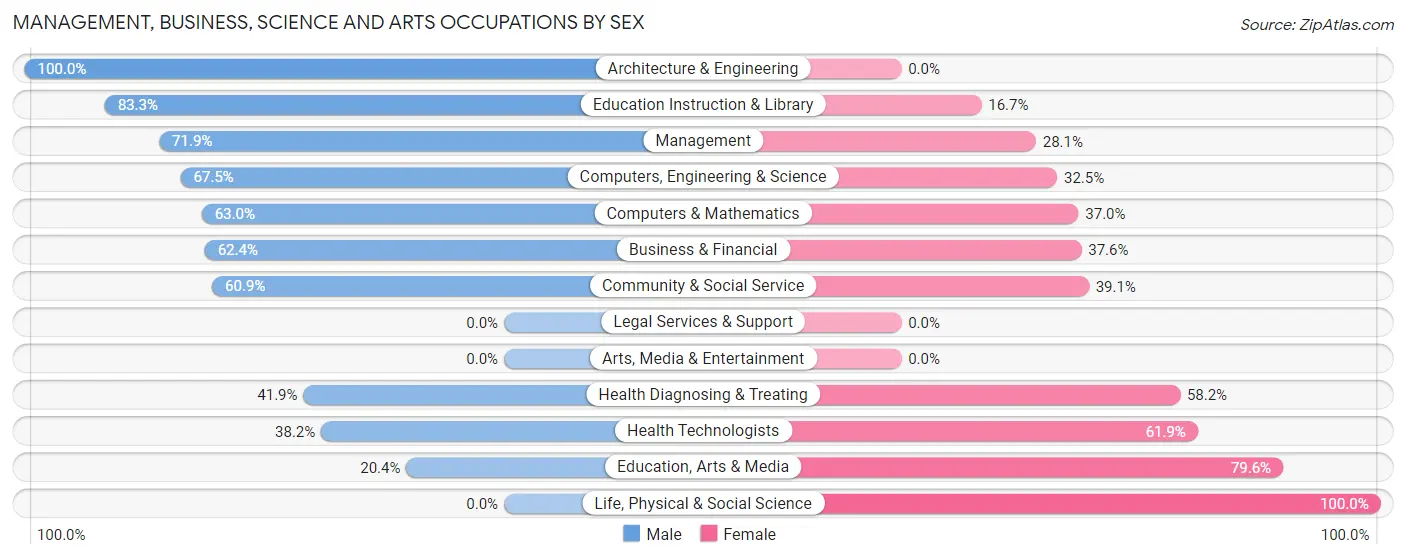
Management, Business, Science and Arts Occupations by Sex
Within the Management, Business, Science and Arts occupations in Treasure Lake, the most male-oriented occupations are Architecture & Engineering (100.0%), Education Instruction & Library (83.3%), and Management (71.9%), while the most female-oriented occupations are Life, Physical & Social Science (100.0%), Education, Arts & Media (79.6%), and Health Technologists (61.9%).
| Occupation | Male | Female |
| Management | 146 (71.9%) | 57 (28.1%) |
| Business & Financial | 98 (62.4%) | 59 (37.6%) |
| Computers, Engineering & Science | 110 (67.5%) | 53 (32.5%) |
| Computers & Mathematics | 29 (63.0%) | 17 (37.0%) |
| Architecture & Engineering | 81 (100.0%) | 0 (0.0%) |
| Life, Physical & Social Science | 0 (0.0%) | 36 (100.0%) |
| Community & Social Service | 277 (60.9%) | 178 (39.1%) |
| Education, Arts & Media | 33 (20.4%) | 129 (79.6%) |
| Legal Services & Support | 0 (0.0%) | 0 (0.0%) |
| Education Instruction & Library | 244 (83.3%) | 49 (16.7%) |
| Arts, Media & Entertainment | 0 (0.0%) | 0 (0.0%) |
| Health Diagnosing & Treating | 154 (41.8%) | 214 (58.2%) |
| Health Technologists | 132 (38.2%) | 214 (61.9%) |
| Total (Category) | 785 (58.3%) | 561 (41.7%) |
| Total (Overall) | 1,599 (67.0%) | 789 (33.0%) |
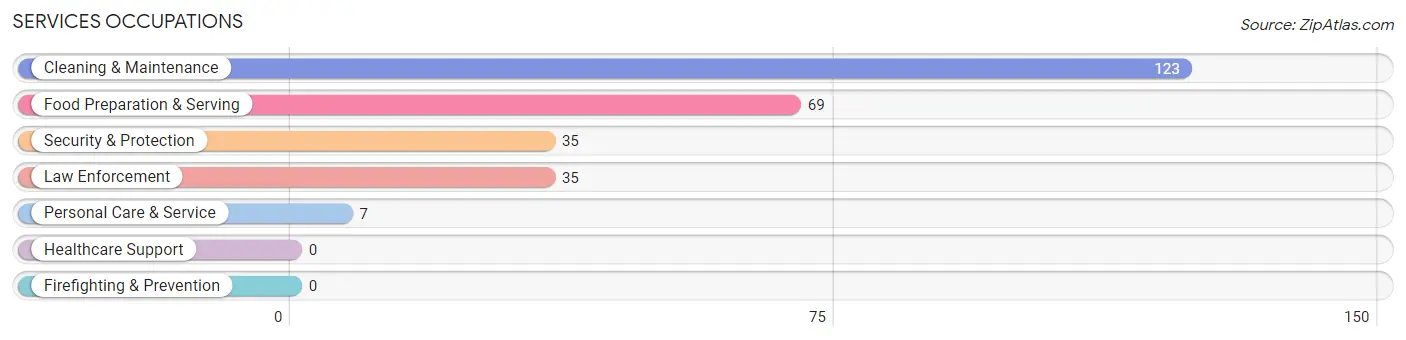
Services Occupations
The most common Services occupations in Treasure Lake are Cleaning & Maintenance (123 | 5.1%), Food Preparation & Serving (69 | 2.9%), Security & Protection (35 | 1.5%), Law Enforcement (35 | 1.5%), and Personal Care & Service (7 | 0.3%).
Services Occupations by Sex
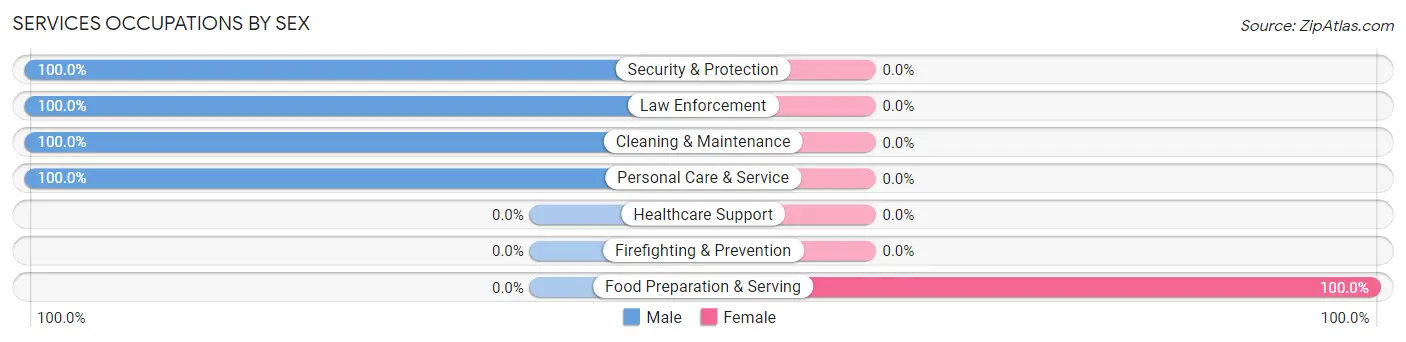
| Occupation | Male | Female |
| Healthcare Support | 0 (0.0%) | 0 (0.0%) |
| Security & Protection | 35 (100.0%) | 0 (0.0%) |
| Firefighting & Prevention | 0 (0.0%) | 0 (0.0%) |
| Law Enforcement | 35 (100.0%) | 0 (0.0%) |
| Food Preparation & Serving | 0 (0.0%) | 69 (100.0%) |
| Cleaning & Maintenance | 123 (100.0%) | 0 (0.0%) |
| Personal Care & Service | 7 (100.0%) | 0 (0.0%) |
| Total (Category) | 165 (70.5%) | 69 (29.5%) |
| Total (Overall) | 1,599 (67.0%) | 789 (33.0%) |
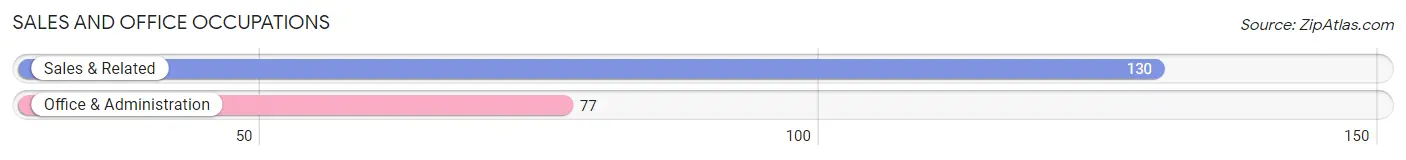
Sales and Office Occupations
The most common Sales and Office occupations in Treasure Lake are Sales & Related (130 | 5.4%), and Office & Administration (77 | 3.2%).
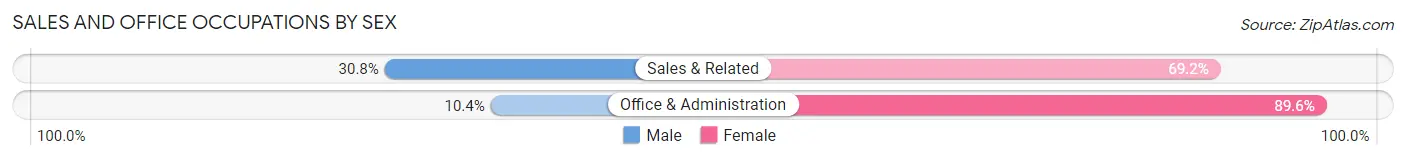
Sales and Office Occupations by Sex
| Occupation | Male | Female |
| Sales & Related | 40 (30.8%) | 90 (69.2%) |
| Office & Administration | 8 (10.4%) | 69 (89.6%) |
| Total (Category) | 48 (23.2%) | 159 (76.8%) |
| Total (Overall) | 1,599 (67.0%) | 789 (33.0%) |
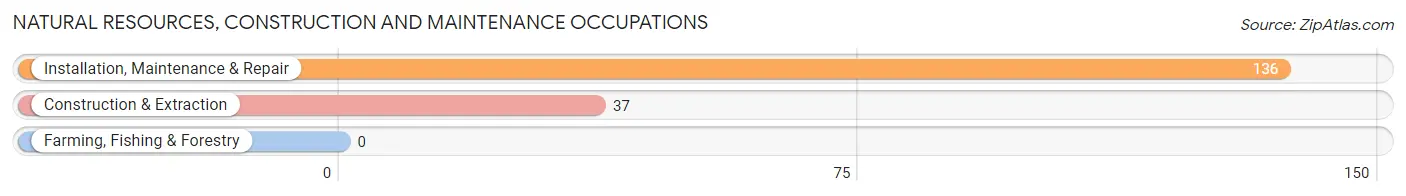
Natural Resources, Construction and Maintenance Occupations
The most common Natural Resources, Construction and Maintenance occupations in Treasure Lake are Installation, Maintenance & Repair (136 | 5.7%), and Construction & Extraction (37 | 1.5%).
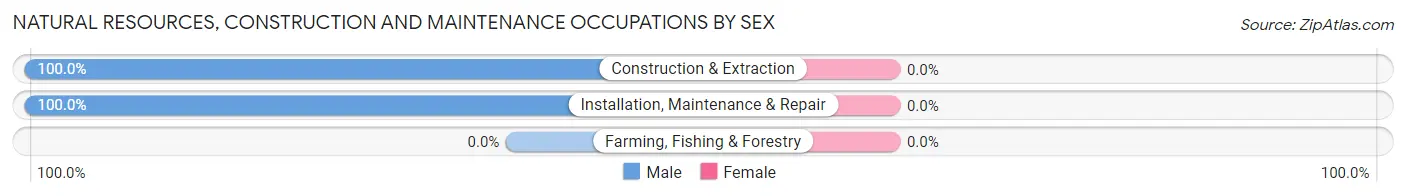
Natural Resources, Construction and Maintenance Occupations by Sex
| Occupation | Male | Female |
| Farming, Fishing & Forestry | 0 (0.0%) | 0 (0.0%) |
| Construction & Extraction | 37 (100.0%) | 0 (0.0%) |
| Installation, Maintenance & Repair | 136 (100.0%) | 0 (0.0%) |
| Total (Category) | 173 (100.0%) | 0 (0.0%) |
| Total (Overall) | 1,599 (67.0%) | 789 (33.0%) |
Production, Transportation and Moving Occupations
The most common Production, Transportation and Moving occupations in Treasure Lake are Material Moving (232 | 9.7%), and Production (196 | 8.2%).
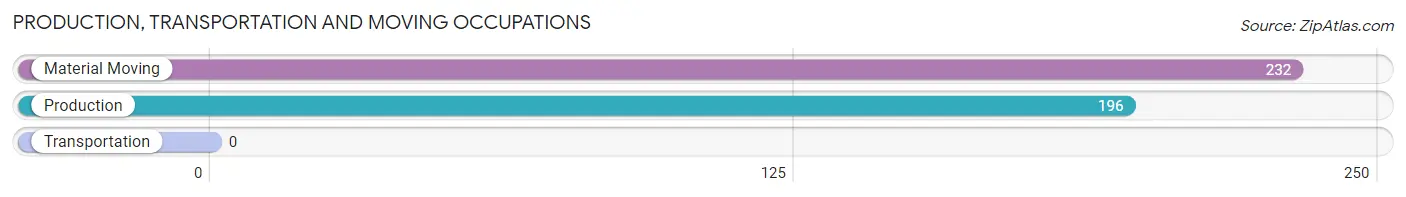
Production, Transportation and Moving Occupations by Sex
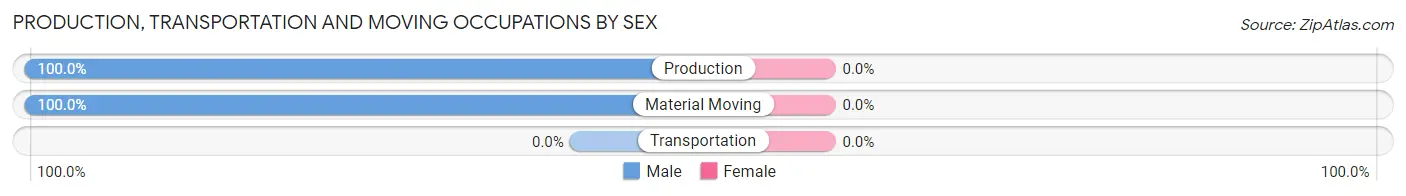
| Occupation | Male | Female |
| Production | 196 (100.0%) | 0 (0.0%) |
| Transportation | 0 (0.0%) | 0 (0.0%) |
| Material Moving | 232 (100.0%) | 0 (0.0%) |
| Total (Category) | 428 (100.0%) | 0 (0.0%) |
| Total (Overall) | 1,599 (67.0%) | 789 (33.0%) |
Employment Industries by Sex in Treasure Lake
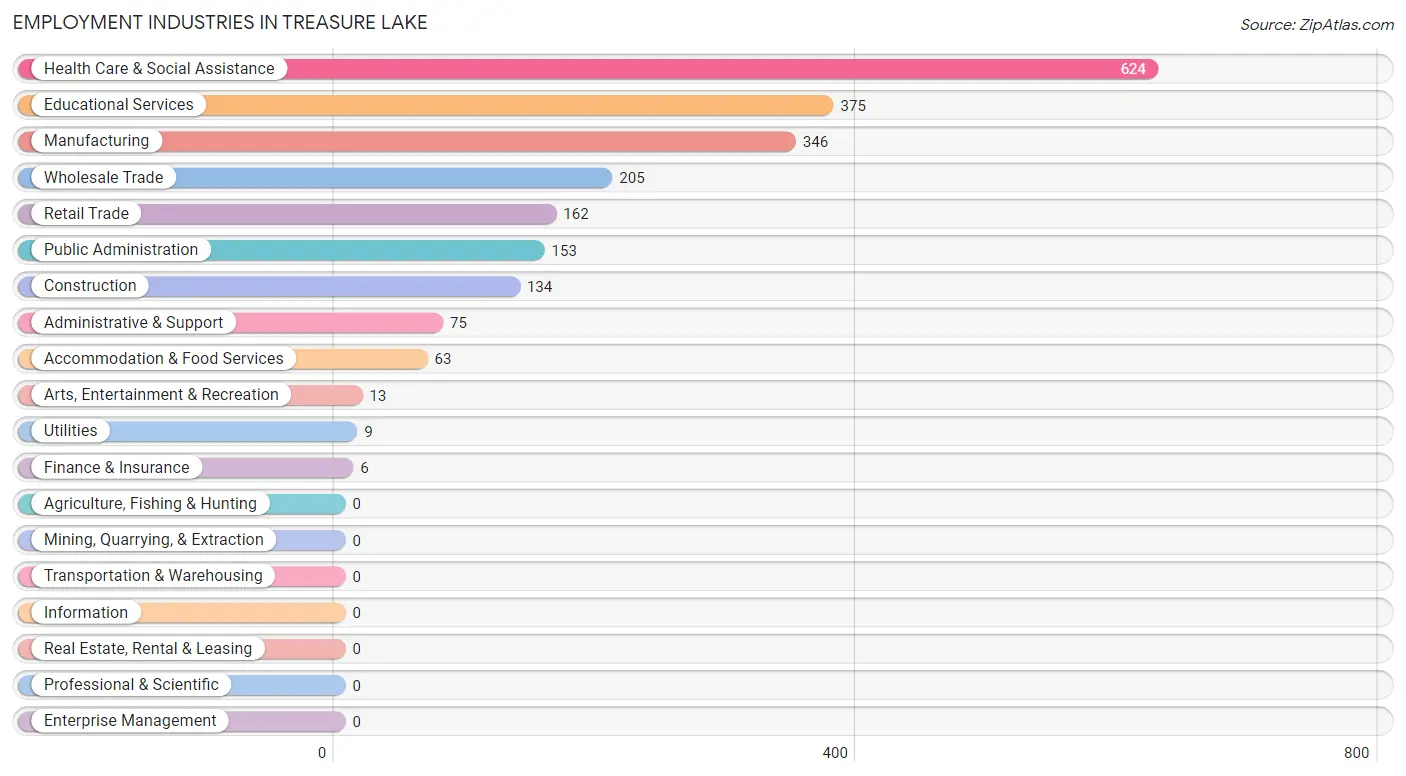
Employment Industries in Treasure Lake
The major employment industries in Treasure Lake include Health Care & Social Assistance (624 | 26.1%), Educational Services (375 | 15.7%), Manufacturing (346 | 14.5%), Wholesale Trade (205 | 8.6%), and Retail Trade (162 | 6.8%).
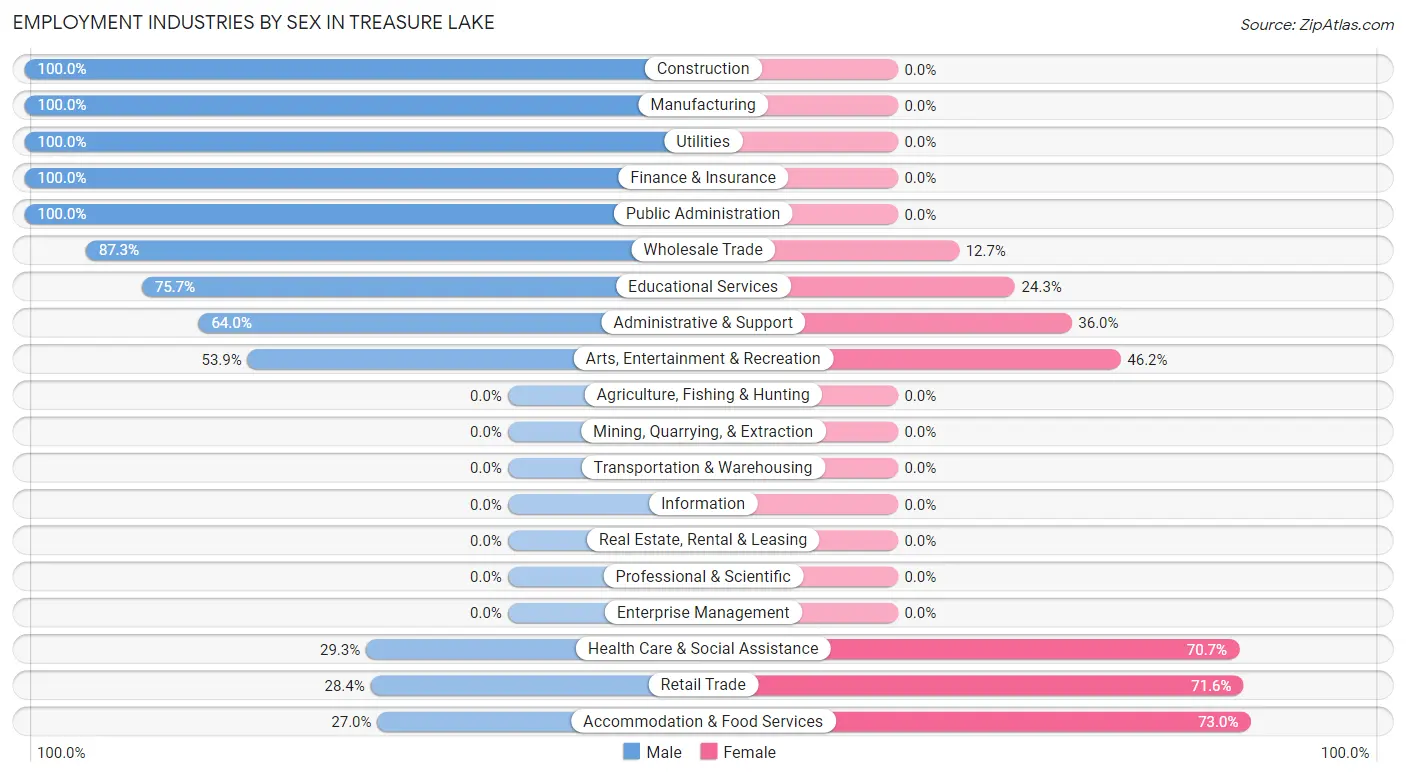
Employment Industries by Sex in Treasure Lake
The Treasure Lake industries that see more men than women are Construction (100.0%), Manufacturing (100.0%), and Utilities (100.0%), whereas the industries that tend to have a higher number of women are Accommodation & Food Services (73.0%), Retail Trade (71.6%), and Health Care & Social Assistance (70.7%).
| Industry | Male | Female |
| Agriculture, Fishing & Hunting | 0 (0.0%) | 0 (0.0%) |
| Mining, Quarrying, & Extraction | 0 (0.0%) | 0 (0.0%) |
| Construction | 134 (100.0%) | 0 (0.0%) |
| Manufacturing | 346 (100.0%) | 0 (0.0%) |
| Wholesale Trade | 179 (87.3%) | 26 (12.7%) |
| Retail Trade | 46 (28.4%) | 116 (71.6%) |
| Transportation & Warehousing | 0 (0.0%) | 0 (0.0%) |
| Utilities | 9 (100.0%) | 0 (0.0%) |
| Information | 0 (0.0%) | 0 (0.0%) |
| Finance & Insurance | 6 (100.0%) | 0 (0.0%) |
| Real Estate, Rental & Leasing | 0 (0.0%) | 0 (0.0%) |
| Professional & Scientific | 0 (0.0%) | 0 (0.0%) |
| Enterprise Management | 0 (0.0%) | 0 (0.0%) |
| Administrative & Support | 48 (64.0%) | 27 (36.0%) |
| Educational Services | 284 (75.7%) | 91 (24.3%) |
| Health Care & Social Assistance | 183 (29.3%) | 441 (70.7%) |
| Arts, Entertainment & Recreation | 7 (53.8%) | 6 (46.2%) |
| Accommodation & Food Services | 17 (27.0%) | 46 (73.0%) |
| Public Administration | 153 (100.0%) | 0 (0.0%) |
| Total | 1,599 (67.0%) | 789 (33.0%) |
Education in Treasure Lake
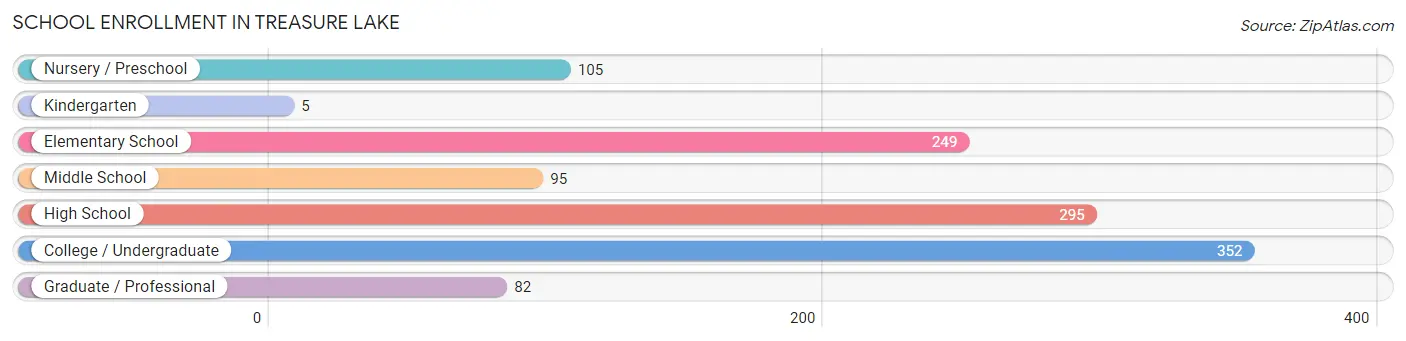
School Enrollment in Treasure Lake
The most common levels of schooling among the 1,183 students in Treasure Lake are college / undergraduate (352 | 29.7%), high school (295 | 24.9%), and elementary school (249 | 21.0%).
| School Level | # Students | % Students |
| Nursery / Preschool | 105 | 8.9% |
| Kindergarten | 5 | 0.4% |
| Elementary School | 249 | 21.0% |
| Middle School | 95 | 8.0% |
| High School | 295 | 24.9% |
| College / Undergraduate | 352 | 29.7% |
| Graduate / Professional | 82 | 6.9% |
| Total | 1,183 | 100.0% |
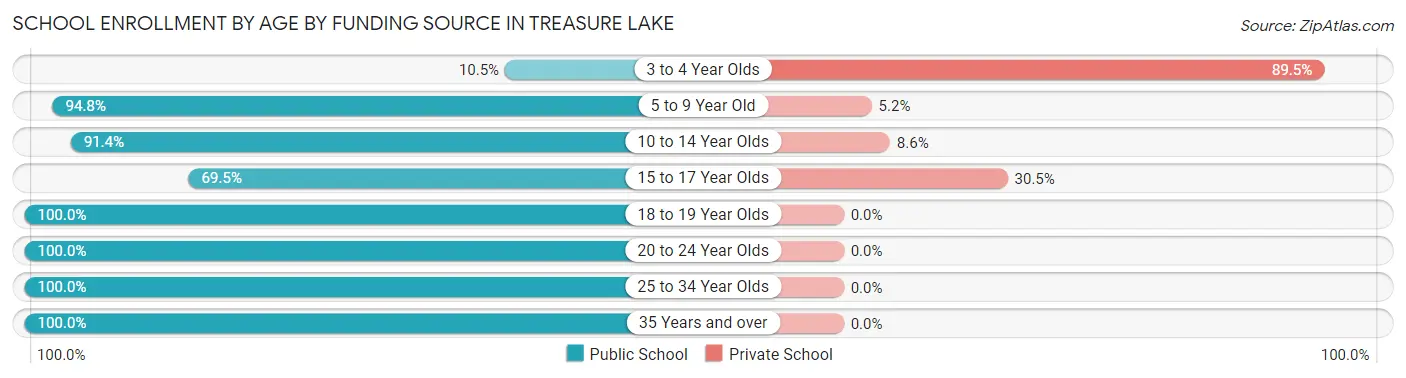
School Enrollment by Age by Funding Source in Treasure Lake
Out of a total of 1,183 students who are enrolled in schools in Treasure Lake, 156 (13.2%) attend a private institution, while the remaining 1,027 (86.8%) are enrolled in public schools. The age group of 3 to 4 year olds has the highest likelihood of being enrolled in private schools, with 85 (89.5% in the age bracket) enrolled. Conversely, the age group of 18 to 19 year olds has the lowest likelihood of being enrolled in a private school, with 108 (100.0% in the age bracket) attending a public institution.
| Age Bracket | Public School | Private School |
| 3 to 4 Year Olds | 10 (10.5%) | 85 (89.5%) |
| 5 to 9 Year Old | 182 (94.8%) | 10 (5.2%) |
| 10 to 14 Year Olds | 223 (91.4%) | 21 (8.6%) |
| 15 to 17 Year Olds | 91 (69.5%) | 40 (30.5%) |
| 18 to 19 Year Olds | 108 (100.0%) | 0 (0.0%) |
| 20 to 24 Year Olds | 128 (100.0%) | 0 (0.0%) |
| 25 to 34 Year Olds | 203 (100.0%) | 0 (0.0%) |
| 35 Years and over | 82 (100.0%) | 0 (0.0%) |
| Total | 1,027 (86.8%) | 156 (13.2%) |
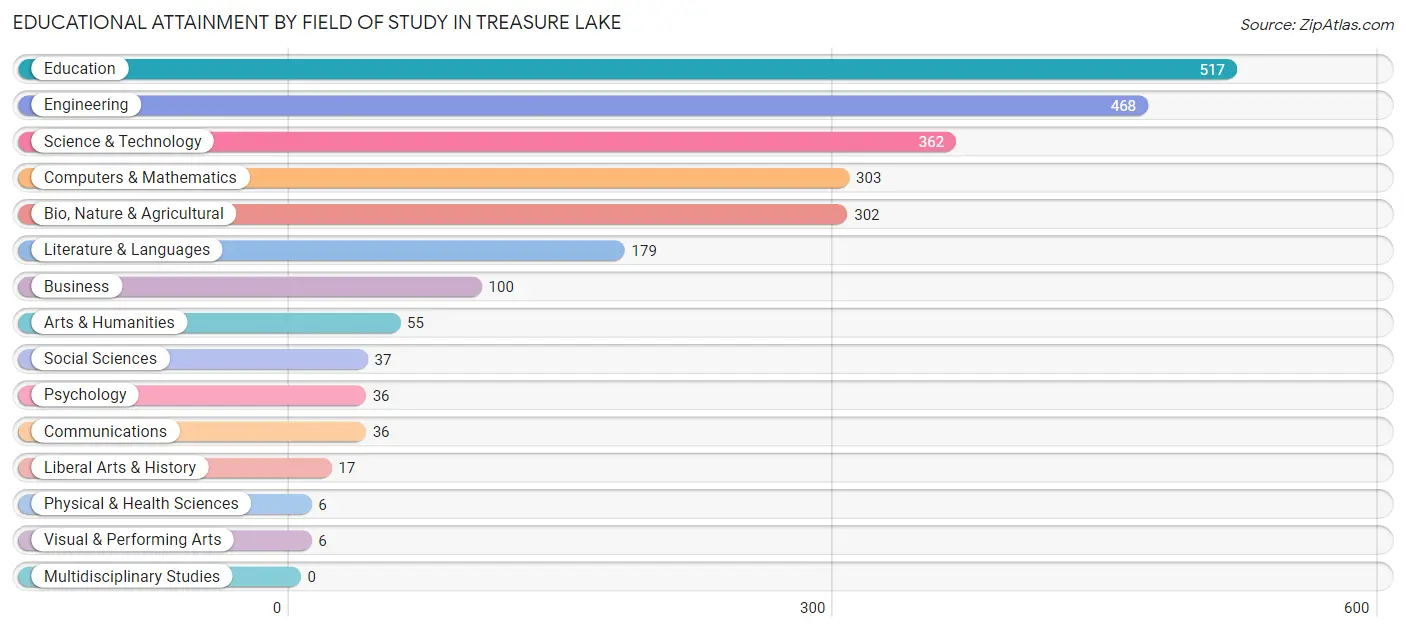
Educational Attainment by Field of Study in Treasure Lake
Education (517 | 21.3%), engineering (468 | 19.3%), science & technology (362 | 14.9%), computers & mathematics (303 | 12.5%), and bio, nature & agricultural (302 | 12.5%) are the most common fields of study among 2,424 individuals in Treasure Lake who have obtained a bachelor's degree or higher.
| Field of Study | # Graduates | % Graduates |
| Computers & Mathematics | 303 | 12.5% |
| Bio, Nature & Agricultural | 302 | 12.5% |
| Physical & Health Sciences | 6 | 0.3% |
| Psychology | 36 | 1.5% |
| Social Sciences | 37 | 1.5% |
| Engineering | 468 | 19.3% |
| Multidisciplinary Studies | 0 | 0.0% |
| Science & Technology | 362 | 14.9% |
| Business | 100 | 4.1% |
| Education | 517 | 21.3% |
| Literature & Languages | 179 | 7.4% |
| Liberal Arts & History | 17 | 0.7% |
| Visual & Performing Arts | 6 | 0.3% |
| Communications | 36 | 1.5% |
| Arts & Humanities | 55 | 2.3% |
| Total | 2,424 | 100.0% |
Transportation & Commute in Treasure Lake
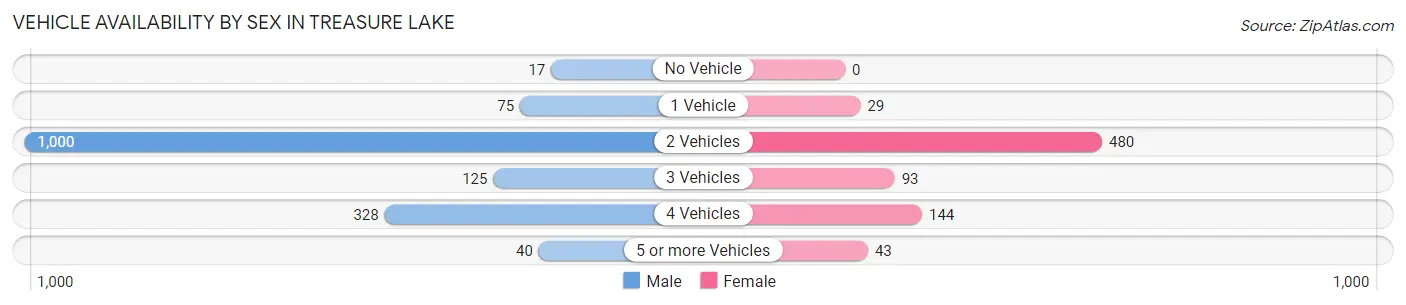
Vehicle Availability by Sex in Treasure Lake
The most prevalent vehicle ownership categories in Treasure Lake are males with 2 vehicles (1,000, accounting for 63.1%) and females with 2 vehicles (480, making up 126.7%).
| Vehicles Available | Male | Female |
| No Vehicle | 17 (1.1%) | 0 (0.0%) |
| 1 Vehicle | 75 (4.7%) | 29 (3.7%) |
| 2 Vehicles | 1,000 (63.1%) | 480 (60.8%) |
| 3 Vehicles | 125 (7.9%) | 93 (11.8%) |
| 4 Vehicles | 328 (20.7%) | 144 (18.2%) |
| 5 or more Vehicles | 40 (2.5%) | 43 (5.4%) |
| Total | 1,585 (100.0%) | 789 (100.0%) |
Commute Time in Treasure Lake
The most frequently occuring commute durations in Treasure Lake are 15 to 19 minutes (756 commuters, 34.6%), 10 to 14 minutes (421 commuters, 19.3%), and 20 to 24 minutes (338 commuters, 15.5%).
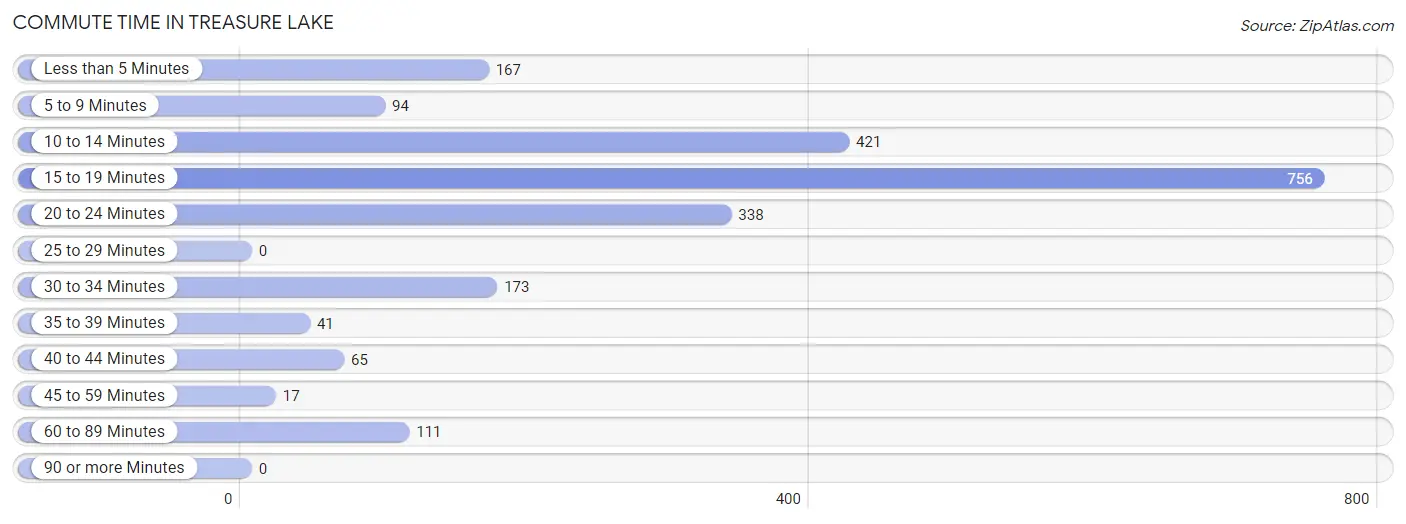
| Commute Time | # Commuters | % Commuters |
| Less than 5 Minutes | 167 | 7.6% |
| 5 to 9 Minutes | 94 | 4.3% |
| 10 to 14 Minutes | 421 | 19.3% |
| 15 to 19 Minutes | 756 | 34.6% |
| 20 to 24 Minutes | 338 | 15.5% |
| 25 to 29 Minutes | 0 | 0.0% |
| 30 to 34 Minutes | 173 | 7.9% |
| 35 to 39 Minutes | 41 | 1.9% |
| 40 to 44 Minutes | 65 | 3.0% |
| 45 to 59 Minutes | 17 | 0.8% |
| 60 to 89 Minutes | 111 | 5.1% |
| 90 or more Minutes | 0 | 0.0% |
Commute Time by Sex in Treasure Lake
The most common commute times in Treasure Lake are 15 to 19 minutes (480 commuters, 32.0%) for males and 15 to 19 minutes (276 commuters, 40.5%) for females.
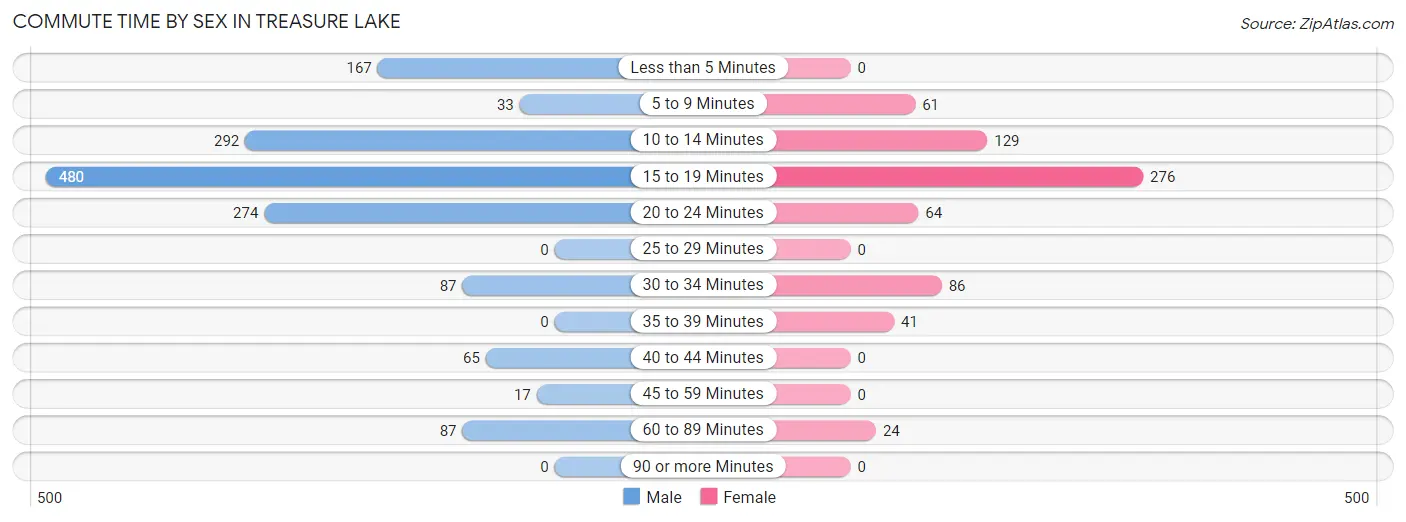
| Commute Time | Male | Female |
| Less than 5 Minutes | 167 (11.1%) | 0 (0.0%) |
| 5 to 9 Minutes | 33 (2.2%) | 61 (9.0%) |
| 10 to 14 Minutes | 292 (19.4%) | 129 (18.9%) |
| 15 to 19 Minutes | 480 (32.0%) | 276 (40.5%) |
| 20 to 24 Minutes | 274 (18.2%) | 64 (9.4%) |
| 25 to 29 Minutes | 0 (0.0%) | 0 (0.0%) |
| 30 to 34 Minutes | 87 (5.8%) | 86 (12.6%) |
| 35 to 39 Minutes | 0 (0.0%) | 41 (6.0%) |
| 40 to 44 Minutes | 65 (4.3%) | 0 (0.0%) |
| 45 to 59 Minutes | 17 (1.1%) | 0 (0.0%) |
| 60 to 89 Minutes | 87 (5.8%) | 24 (3.5%) |
| 90 or more Minutes | 0 (0.0%) | 0 (0.0%) |
Time of Departure to Work by Sex in Treasure Lake
The most frequent times of departure to work in Treasure Lake are 8:00 AM to 8:29 AM (523, 34.8%) for males and 6:00 AM to 6:29 AM (152, 22.3%) for females.
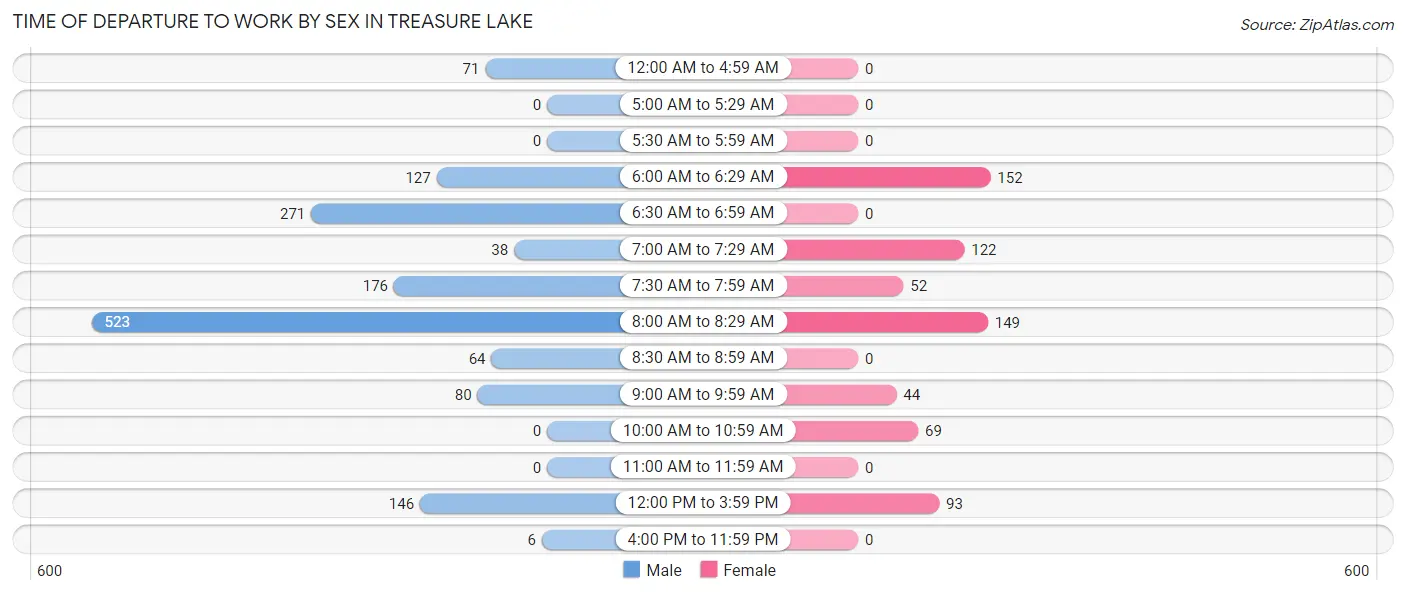
| Time of Departure | Male | Female |
| 12:00 AM to 4:59 AM | 71 (4.7%) | 0 (0.0%) |
| 5:00 AM to 5:29 AM | 0 (0.0%) | 0 (0.0%) |
| 5:30 AM to 5:59 AM | 0 (0.0%) | 0 (0.0%) |
| 6:00 AM to 6:29 AM | 127 (8.5%) | 152 (22.3%) |
| 6:30 AM to 6:59 AM | 271 (18.0%) | 0 (0.0%) |
| 7:00 AM to 7:29 AM | 38 (2.5%) | 122 (17.9%) |
| 7:30 AM to 7:59 AM | 176 (11.7%) | 52 (7.6%) |
| 8:00 AM to 8:29 AM | 523 (34.8%) | 149 (21.9%) |
| 8:30 AM to 8:59 AM | 64 (4.3%) | 0 (0.0%) |
| 9:00 AM to 9:59 AM | 80 (5.3%) | 44 (6.5%) |
| 10:00 AM to 10:59 AM | 0 (0.0%) | 69 (10.1%) |
| 11:00 AM to 11:59 AM | 0 (0.0%) | 0 (0.0%) |
| 12:00 PM to 3:59 PM | 146 (9.7%) | 93 (13.7%) |
| 4:00 PM to 11:59 PM | 6 (0.4%) | 0 (0.0%) |
| Total | 1,502 (100.0%) | 681 (100.0%) |
Housing Occupancy in Treasure Lake
Occupancy by Ownership in Treasure Lake
Of the total 1,701 dwellings in Treasure Lake, owner-occupied units account for 1,671 (98.2%), while renter-occupied units make up 30 (1.8%).
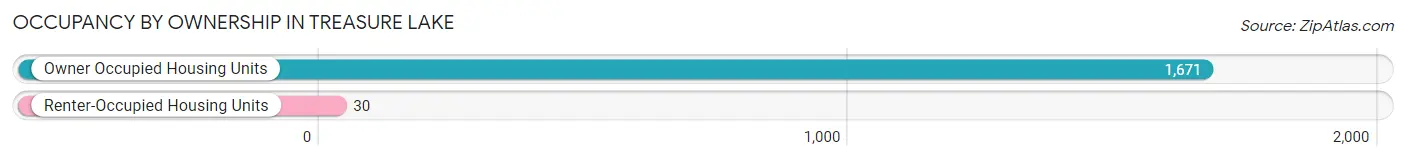
| Occupancy | # Housing Units | % Housing Units |
| Owner Occupied Housing Units | 1,671 | 98.2% |
| Renter-Occupied Housing Units | 30 | 1.8% |
| Total Occupied Housing Units | 1,701 | 100.0% |
Occupancy by Household Size in Treasure Lake
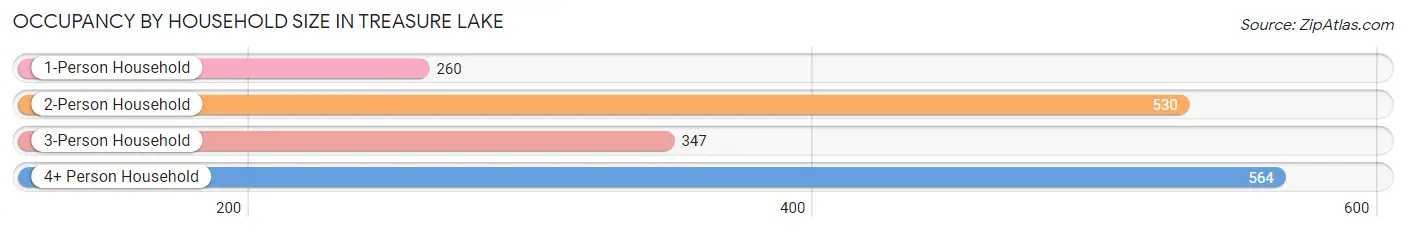
| Household Size | # Housing Units | % Housing Units |
| 1-Person Household | 260 | 15.3% |
| 2-Person Household | 530 | 31.2% |
| 3-Person Household | 347 | 20.4% |
| 4+ Person Household | 564 | 33.2% |
| Total Housing Units | 1,701 | 100.0% |
Occupancy by Ownership by Household Size in Treasure Lake
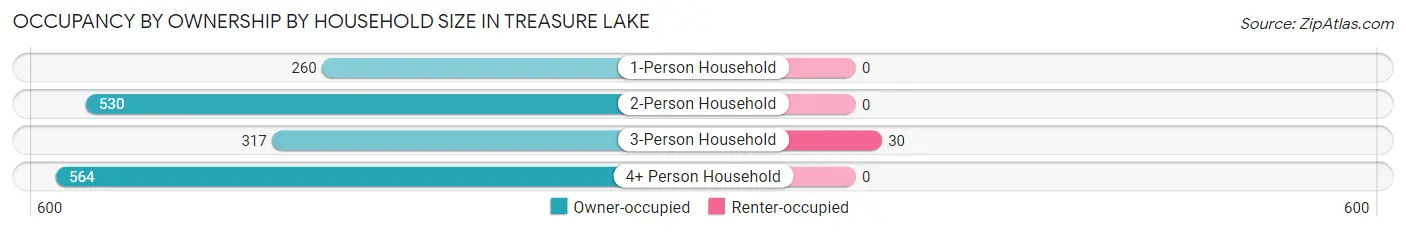
| Household Size | Owner-occupied | Renter-occupied |
| 1-Person Household | 260 (100.0%) | 0 (0.0%) |
| 2-Person Household | 530 (100.0%) | 0 (0.0%) |
| 3-Person Household | 317 (91.3%) | 30 (8.6%) |
| 4+ Person Household | 564 (100.0%) | 0 (0.0%) |
| Total Housing Units | 1,671 (98.2%) | 30 (1.8%) |
Occupancy by Educational Attainment in Treasure Lake
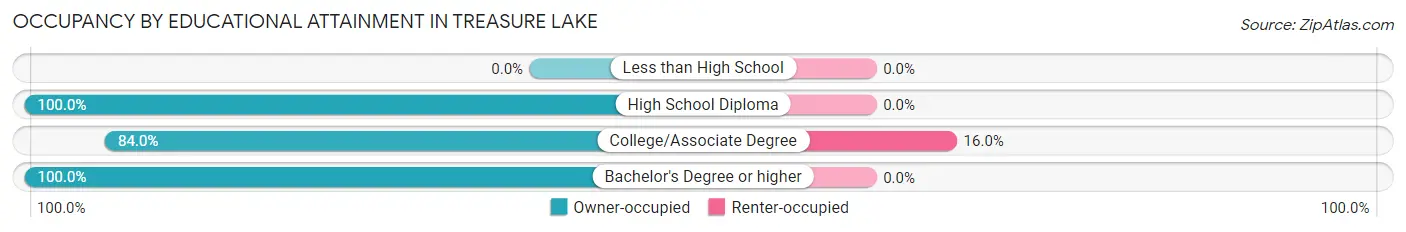
| Household Size | Owner-occupied | Renter-occupied |
| Less than High School | 0 (0.0%) | 0 (0.0%) |
| High School Diploma | 317 (100.0%) | 0 (0.0%) |
| College/Associate Degree | 158 (84.0%) | 30 (16.0%) |
| Bachelor's Degree or higher | 1,196 (100.0%) | 0 (0.0%) |
Occupancy by Age of Householder in Treasure Lake
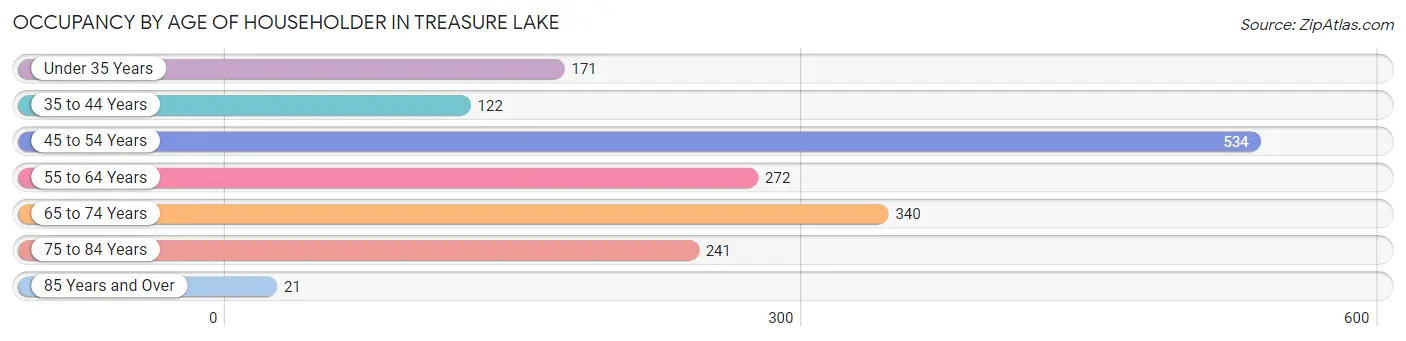
| Age Bracket | # Households | % Households |
| Under 35 Years | 171 | 10.1% |
| 35 to 44 Years | 122 | 7.2% |
| 45 to 54 Years | 534 | 31.4% |
| 55 to 64 Years | 272 | 16.0% |
| 65 to 74 Years | 340 | 20.0% |
| 75 to 84 Years | 241 | 14.2% |
| 85 Years and Over | 21 | 1.2% |
| Total | 1,701 | 100.0% |
Housing Finances in Treasure Lake
Median Income by Occupancy in Treasure Lake
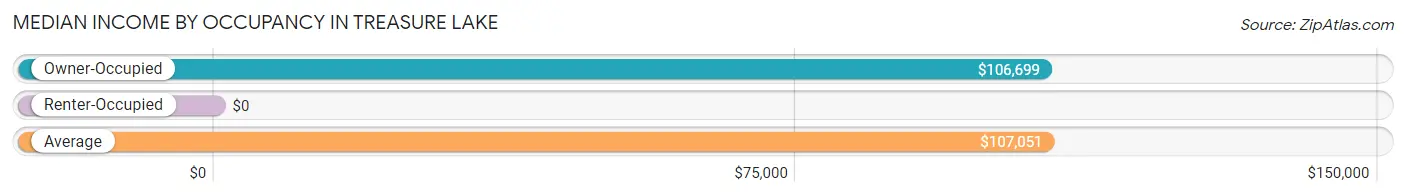
| Occupancy Type | # Households | Median Income |
| Owner-Occupied | 1,671 (98.2%) | $106,699 |
| Renter-Occupied | 30 (1.8%) | $0 |
| Average | 1,701 (100.0%) | $107,051 |
Occupancy by Householder Income Bracket in Treasure Lake
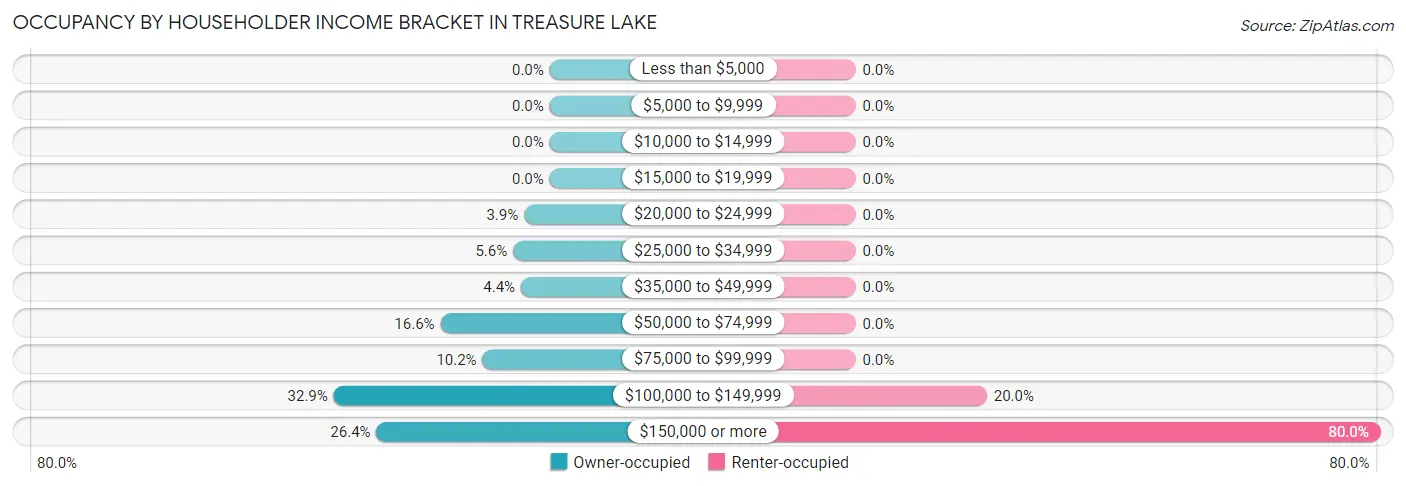
| Income Bracket | Owner-occupied | Renter-occupied |
| Less than $5,000 | 0 (0.0%) | 0 (0.0%) |
| $5,000 to $9,999 | 0 (0.0%) | 0 (0.0%) |
| $10,000 to $14,999 | 0 (0.0%) | 0 (0.0%) |
| $15,000 to $19,999 | 0 (0.0%) | 0 (0.0%) |
| $20,000 to $24,999 | 65 (3.9%) | 0 (0.0%) |
| $25,000 to $34,999 | 93 (5.6%) | 0 (0.0%) |
| $35,000 to $49,999 | 73 (4.4%) | 0 (0.0%) |
| $50,000 to $74,999 | 278 (16.6%) | 0 (0.0%) |
| $75,000 to $99,999 | 171 (10.2%) | 0 (0.0%) |
| $100,000 to $149,999 | 550 (32.9%) | 6 (20.0%) |
| $150,000 or more | 441 (26.4%) | 24 (80.0%) |
| Total | 1,671 (100.0%) | 30 (100.0%) |
Monthly Housing Cost Tiers in Treasure Lake
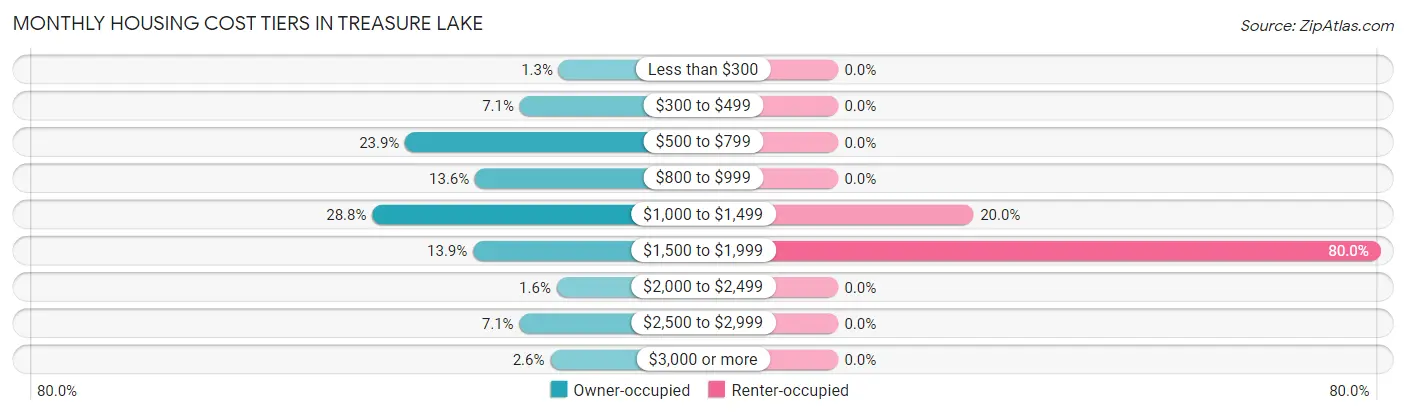
| Monthly Cost | Owner-occupied | Renter-occupied |
| Less than $300 | 22 (1.3%) | 0 (0.0%) |
| $300 to $499 | 118 (7.1%) | 0 (0.0%) |
| $500 to $799 | 400 (23.9%) | 0 (0.0%) |
| $800 to $999 | 228 (13.6%) | 0 (0.0%) |
| $1,000 to $1,499 | 481 (28.8%) | 6 (20.0%) |
| $1,500 to $1,999 | 233 (13.9%) | 24 (80.0%) |
| $2,000 to $2,499 | 27 (1.6%) | 0 (0.0%) |
| $2,500 to $2,999 | 119 (7.1%) | 0 (0.0%) |
| $3,000 or more | 43 (2.6%) | 0 (0.0%) |
| Total | 1,671 (100.0%) | 30 (100.0%) |
Physical Housing Characteristics in Treasure Lake
Housing Structures in Treasure Lake
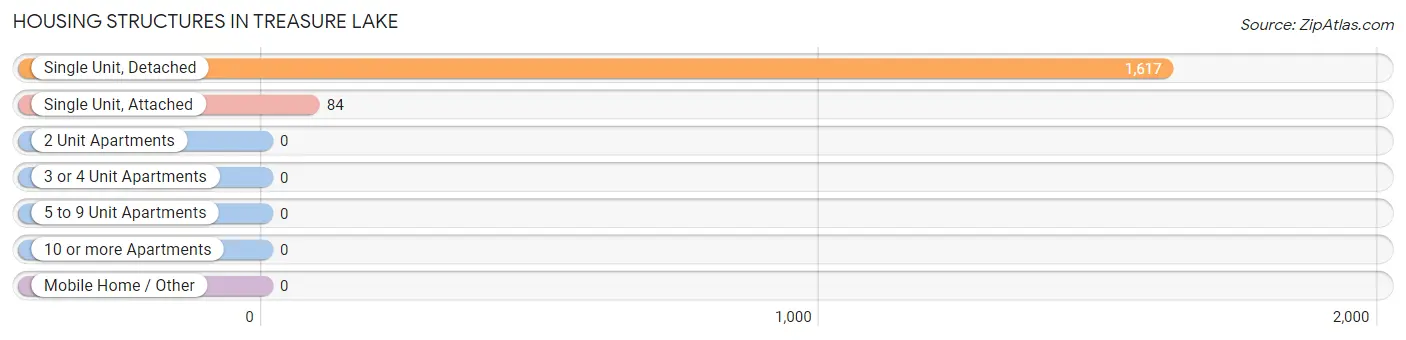
| Structure Type | # Housing Units | % Housing Units |
| Single Unit, Detached | 1,617 | 95.1% |
| Single Unit, Attached | 84 | 4.9% |
| 2 Unit Apartments | 0 | 0.0% |
| 3 or 4 Unit Apartments | 0 | 0.0% |
| 5 to 9 Unit Apartments | 0 | 0.0% |
| 10 or more Apartments | 0 | 0.0% |
| Mobile Home / Other | 0 | 0.0% |
| Total | 1,701 | 100.0% |
Housing Structures by Occupancy in Treasure Lake
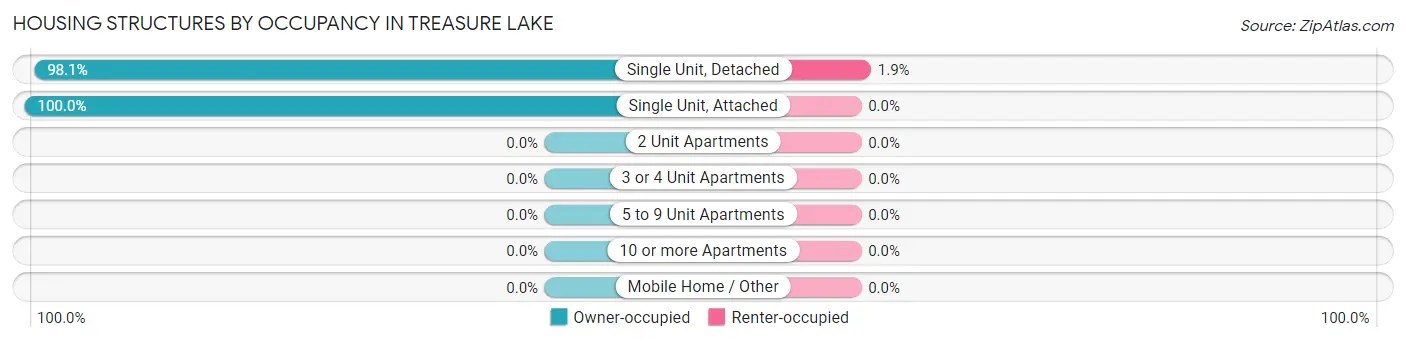
| Structure Type | Owner-occupied | Renter-occupied |
| Single Unit, Detached | 1,587 (98.1%) | 30 (1.9%) |
| Single Unit, Attached | 84 (100.0%) | 0 (0.0%) |
| 2 Unit Apartments | 0 (0.0%) | 0 (0.0%) |
| 3 or 4 Unit Apartments | 0 (0.0%) | 0 (0.0%) |
| 5 to 9 Unit Apartments | 0 (0.0%) | 0 (0.0%) |
| 10 or more Apartments | 0 (0.0%) | 0 (0.0%) |
| Mobile Home / Other | 0 (0.0%) | 0 (0.0%) |
| Total | 1,671 (98.2%) | 30 (1.8%) |
Housing Structures by Number of Rooms in Treasure Lake
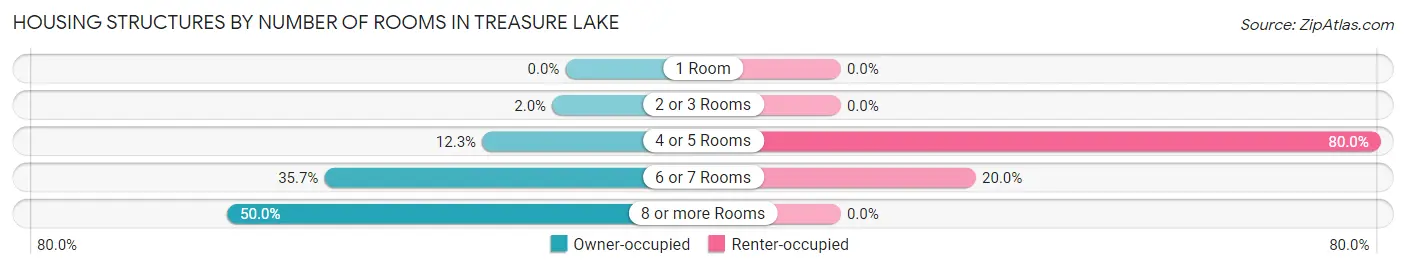
| Number of Rooms | Owner-occupied | Renter-occupied |
| 1 Room | 0 (0.0%) | 0 (0.0%) |
| 2 or 3 Rooms | 33 (2.0%) | 0 (0.0%) |
| 4 or 5 Rooms | 206 (12.3%) | 24 (80.0%) |
| 6 or 7 Rooms | 596 (35.7%) | 6 (20.0%) |
| 8 or more Rooms | 836 (50.0%) | 0 (0.0%) |
| Total | 1,671 (100.0%) | 30 (100.0%) |
Housing Structure by Heating Type in Treasure Lake
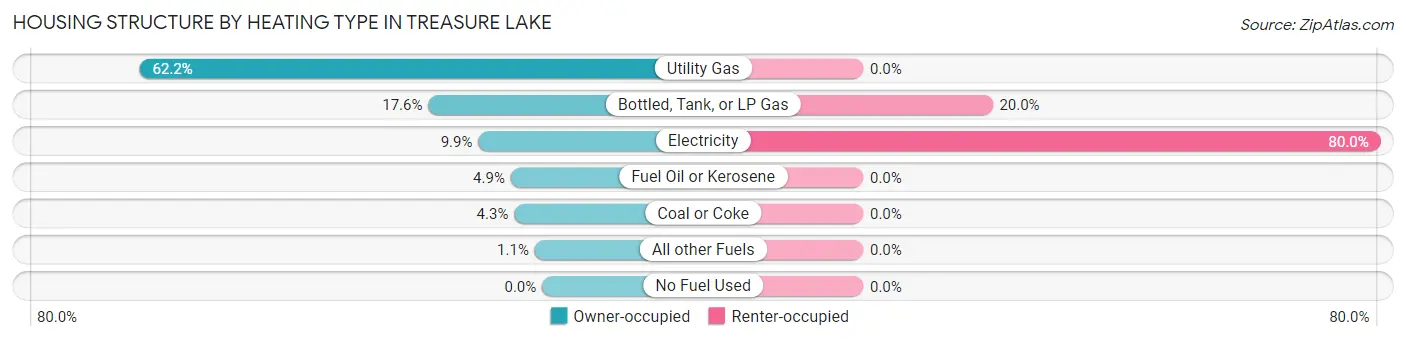
| Heating Type | Owner-occupied | Renter-occupied |
| Utility Gas | 1,040 (62.2%) | 0 (0.0%) |
| Bottled, Tank, or LP Gas | 294 (17.6%) | 6 (20.0%) |
| Electricity | 165 (9.9%) | 24 (80.0%) |
| Fuel Oil or Kerosene | 81 (4.9%) | 0 (0.0%) |
| Coal or Coke | 72 (4.3%) | 0 (0.0%) |
| All other Fuels | 19 (1.1%) | 0 (0.0%) |
| No Fuel Used | 0 (0.0%) | 0 (0.0%) |
| Total | 1,671 (100.0%) | 30 (100.0%) |
Household Vehicle Usage in Treasure Lake
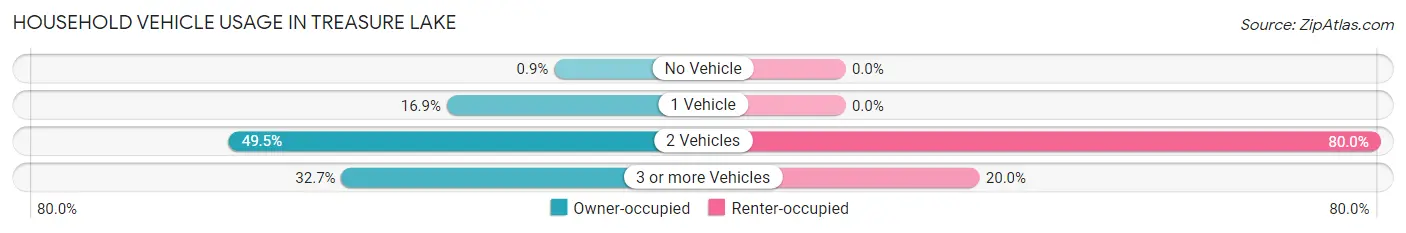
| Vehicles per Household | Owner-occupied | Renter-occupied |
| No Vehicle | 15 (0.9%) | 0 (0.0%) |
| 1 Vehicle | 283 (16.9%) | 0 (0.0%) |
| 2 Vehicles | 827 (49.5%) | 24 (80.0%) |
| 3 or more Vehicles | 546 (32.7%) | 6 (20.0%) |
| Total | 1,671 (100.0%) | 30 (100.0%) |
Real Estate & Mortgages in Treasure Lake
Real Estate and Mortgage Overview in Treasure Lake
| Characteristic | Without Mortgage | With Mortgage |
| Housing Units | 742 | 929 |
| Median Property Value | $265,100 | $193,300 |
| Median Household Income | $96,958 | $248 |
| Monthly Housing Costs | $631 | $43 |
| Real Estate Taxes | $3,045 | $0 |
Property Value by Mortgage Status in Treasure Lake
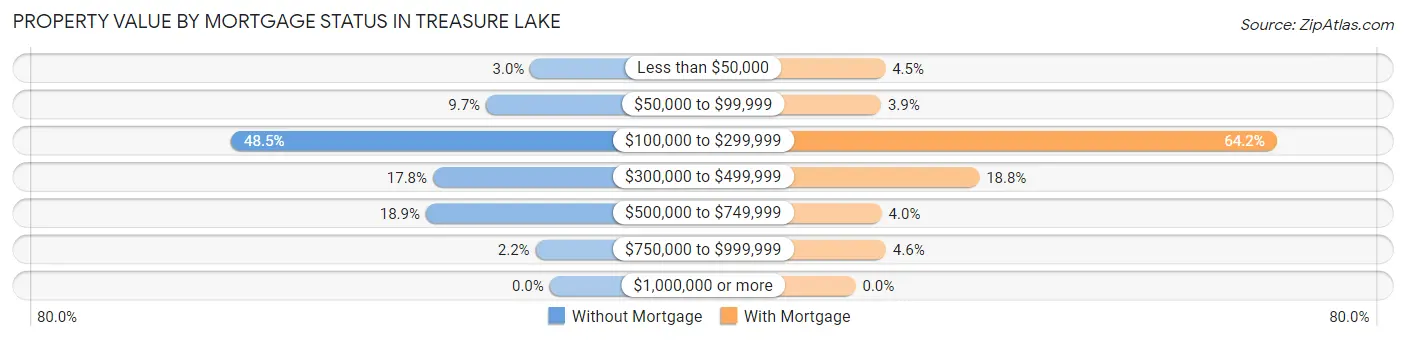
| Property Value | Without Mortgage | With Mortgage |
| Less than $50,000 | 22 (3.0%) | 42 (4.5%) |
| $50,000 to $99,999 | 72 (9.7%) | 36 (3.9%) |
| $100,000 to $299,999 | 360 (48.5%) | 596 (64.2%) |
| $300,000 to $499,999 | 132 (17.8%) | 175 (18.8%) |
| $500,000 to $749,999 | 140 (18.9%) | 37 (4.0%) |
| $750,000 to $999,999 | 16 (2.2%) | 43 (4.6%) |
| $1,000,000 or more | 0 (0.0%) | 0 (0.0%) |
| Total | 742 (100.0%) | 929 (100.0%) |
Household Income by Mortgage Status in Treasure Lake
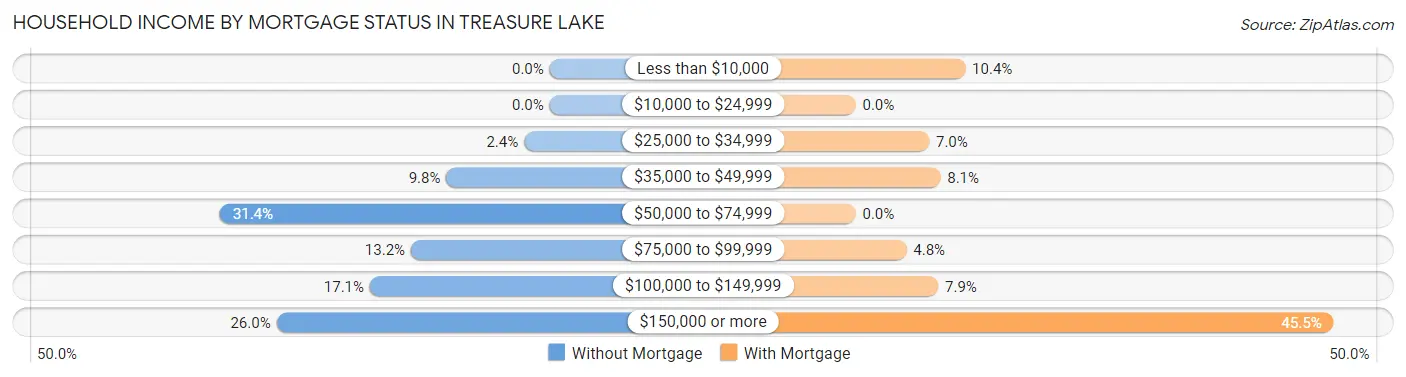
| Household Income | Without Mortgage | With Mortgage |
| Less than $10,000 | 0 (0.0%) | 97 (10.4%) |
| $10,000 to $24,999 | 0 (0.0%) | 0 (0.0%) |
| $25,000 to $34,999 | 18 (2.4%) | 65 (7.0%) |
| $35,000 to $49,999 | 73 (9.8%) | 75 (8.1%) |
| $50,000 to $74,999 | 233 (31.4%) | 0 (0.0%) |
| $75,000 to $99,999 | 98 (13.2%) | 45 (4.8%) |
| $100,000 to $149,999 | 127 (17.1%) | 73 (7.9%) |
| $150,000 or more | 193 (26.0%) | 423 (45.5%) |
| Total | 742 (100.0%) | 929 (100.0%) |
Property Value to Household Income Ratio in Treasure Lake
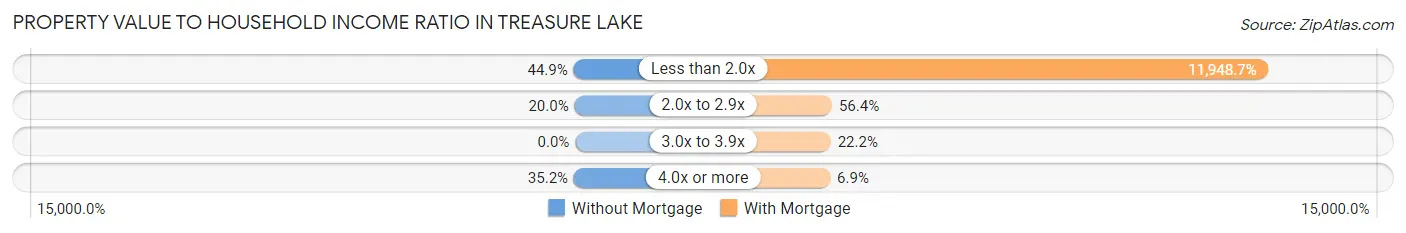
| Value-to-Income Ratio | Without Mortgage | With Mortgage |
| Less than 2.0x | 333 (44.9%) | 111,003 (11,948.7%) |
| 2.0x to 2.9x | 148 (20.0%) | 524 (56.4%) |
| 3.0x to 3.9x | 0 (0.0%) | 206 (22.2%) |
| 4.0x or more | 261 (35.2%) | 64 (6.9%) |
| Total | 742 (100.0%) | 929 (100.0%) |
Real Estate Taxes by Mortgage Status in Treasure Lake
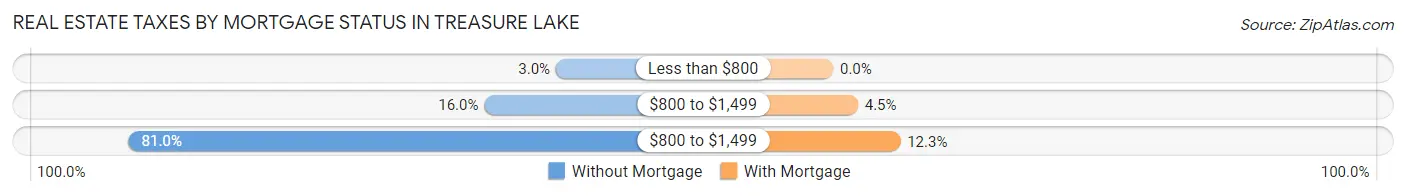
| Property Taxes | Without Mortgage | With Mortgage |
| Less than $800 | 22 (3.0%) | 0 (0.0%) |
| $800 to $1,499 | 119 (16.0%) | 42 (4.5%) |
| $800 to $1,499 | 601 (81.0%) | 114 (12.3%) |
| Total | 742 (100.0%) | 929 (100.0%) |
Health & Disability in Treasure Lake
Health Insurance Coverage by Age in Treasure Lake
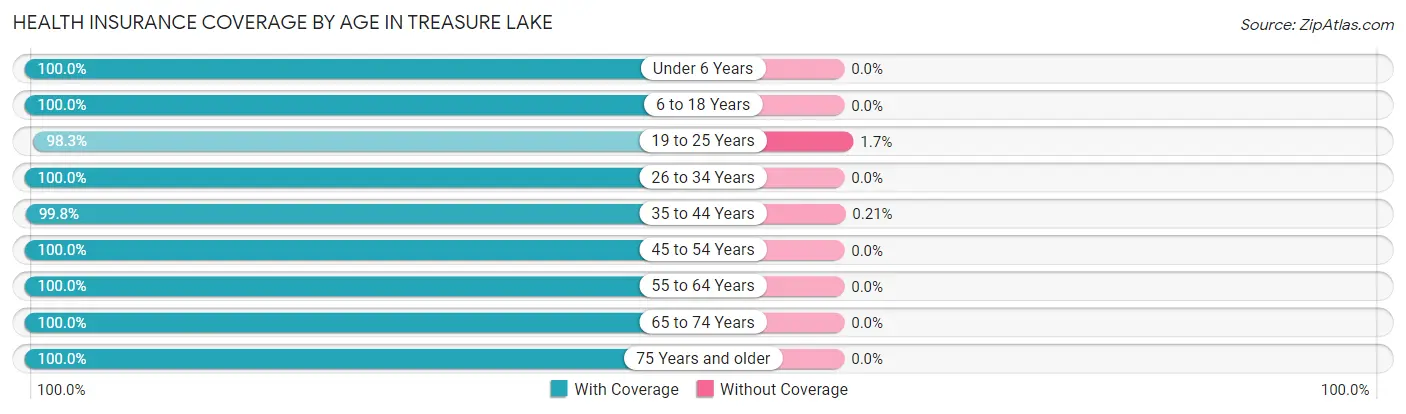
| Age Bracket | With Coverage | Without Coverage |
| Under 6 Years | 338 (100.0%) | 0 (0.0%) |
| 6 to 18 Years | 645 (100.0%) | 0 (0.0%) |
| 19 to 25 Years | 347 (98.3%) | 6 (1.7%) |
| 26 to 34 Years | 579 (100.0%) | 0 (0.0%) |
| 35 to 44 Years | 467 (99.8%) | 1 (0.2%) |
| 45 to 54 Years | 921 (100.0%) | 0 (0.0%) |
| 55 to 64 Years | 534 (100.0%) | 0 (0.0%) |
| 65 to 74 Years | 670 (100.0%) | 0 (0.0%) |
| 75 Years and older | 358 (100.0%) | 0 (0.0%) |
| Total | 4,859 (99.9%) | 7 (0.1%) |
Health Insurance Coverage by Citizenship Status in Treasure Lake
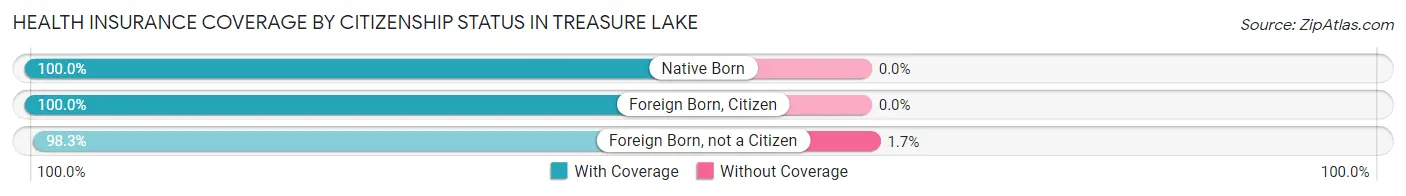
| Citizenship Status | With Coverage | Without Coverage |
| Native Born | 338 (100.0%) | 0 (0.0%) |
| Foreign Born, Citizen | 645 (100.0%) | 0 (0.0%) |
| Foreign Born, not a Citizen | 347 (98.3%) | 6 (1.7%) |
Health Insurance Coverage by Household Income in Treasure Lake
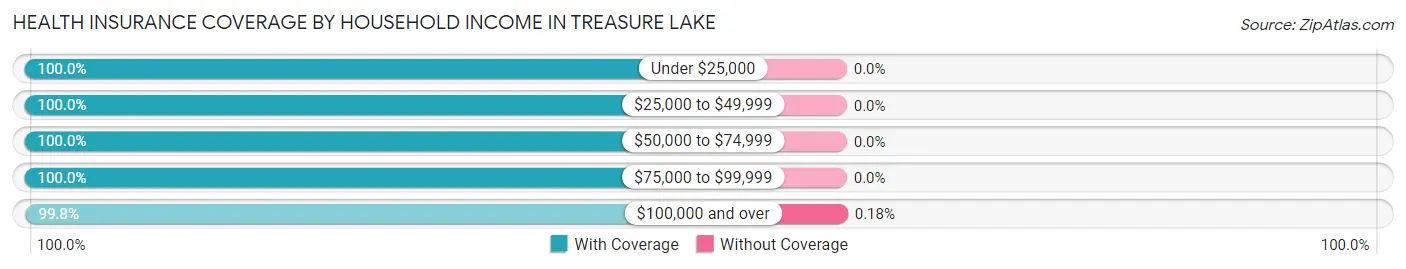
| Household Income | With Coverage | Without Coverage |
| Under $25,000 | 127 (100.0%) | 0 (0.0%) |
| $25,000 to $49,999 | 205 (100.0%) | 0 (0.0%) |
| $50,000 to $74,999 | 724 (100.0%) | 0 (0.0%) |
| $75,000 to $99,999 | 409 (100.0%) | 0 (0.0%) |
| $100,000 and over | 3,392 (99.8%) | 6 (0.2%) |
Public vs Private Health Insurance Coverage by Age in Treasure Lake
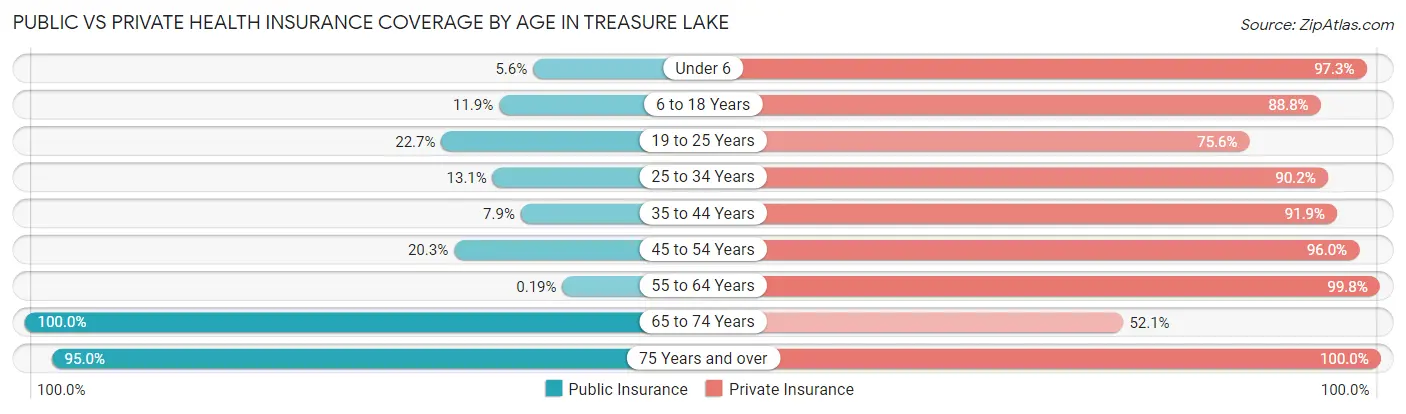
| Age Bracket | Public Insurance | Private Insurance |
| Under 6 | 19 (5.6%) | 329 (97.3%) |
| 6 to 18 Years | 77 (11.9%) | 573 (88.8%) |
| 19 to 25 Years | 80 (22.7%) | 267 (75.6%) |
| 25 to 34 Years | 76 (13.1%) | 522 (90.2%) |
| 35 to 44 Years | 37 (7.9%) | 430 (91.9%) |
| 45 to 54 Years | 187 (20.3%) | 884 (96.0%) |
| 55 to 64 Years | 1 (0.2%) | 533 (99.8%) |
| 65 to 74 Years | 670 (100.0%) | 349 (52.1%) |
| 75 Years and over | 340 (95.0%) | 358 (100.0%) |
| Total | 1,487 (30.6%) | 4,245 (87.2%) |
Disability Status by Sex by Age in Treasure Lake
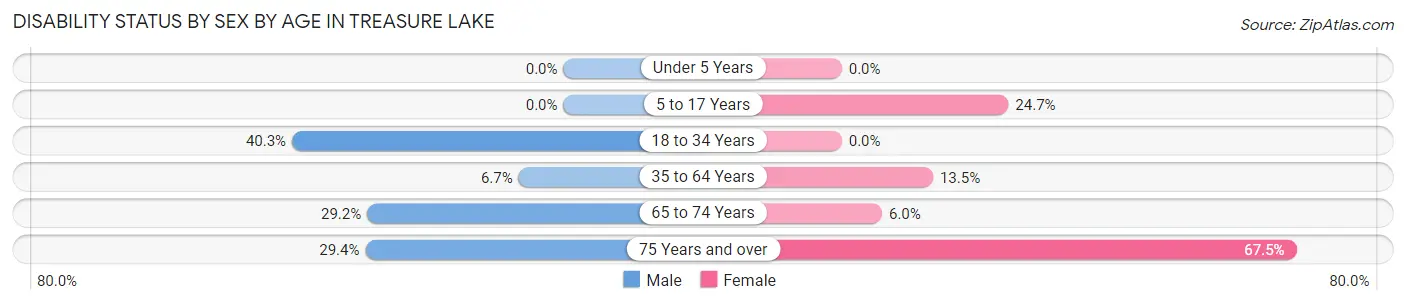
| Age Bracket | Male | Female |
| Under 5 Years | 0 (0.0%) | 0 (0.0%) |
| 5 to 17 Years | 0 (0.0%) | 72 (24.7%) |
| 18 to 34 Years | 293 (40.3%) | 0 (0.0%) |
| 35 to 64 Years | 68 (6.7%) | 122 (13.5%) |
| 65 to 74 Years | 93 (29.1%) | 21 (6.0%) |
| 75 Years and over | 70 (29.4%) | 81 (67.5%) |
Disability Class by Sex by Age in Treasure Lake
Disability Class: Hearing Difficulty
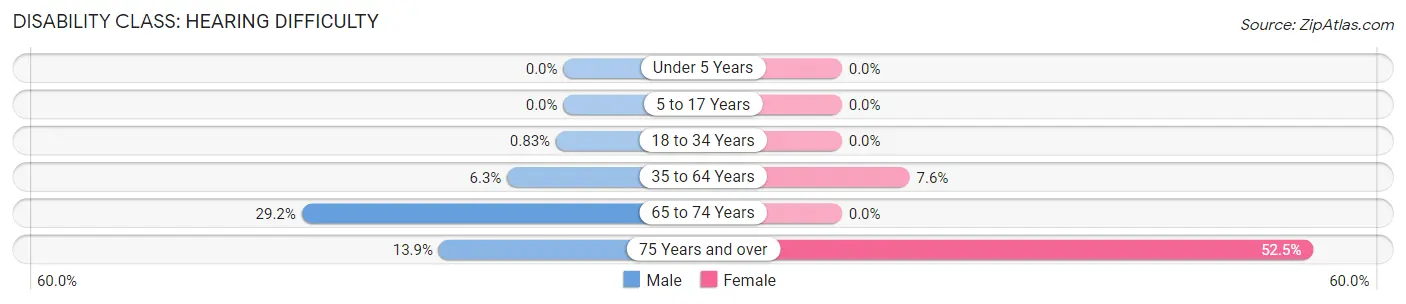
| Age Bracket | Male | Female |
| Under 5 Years | 0 (0.0%) | 0 (0.0%) |
| 5 to 17 Years | 0 (0.0%) | 0 (0.0%) |
| 18 to 34 Years | 6 (0.8%) | 0 (0.0%) |
| 35 to 64 Years | 64 (6.3%) | 68 (7.5%) |
| 65 to 74 Years | 93 (29.1%) | 0 (0.0%) |
| 75 Years and over | 33 (13.9%) | 63 (52.5%) |
Disability Class: Vision Difficulty
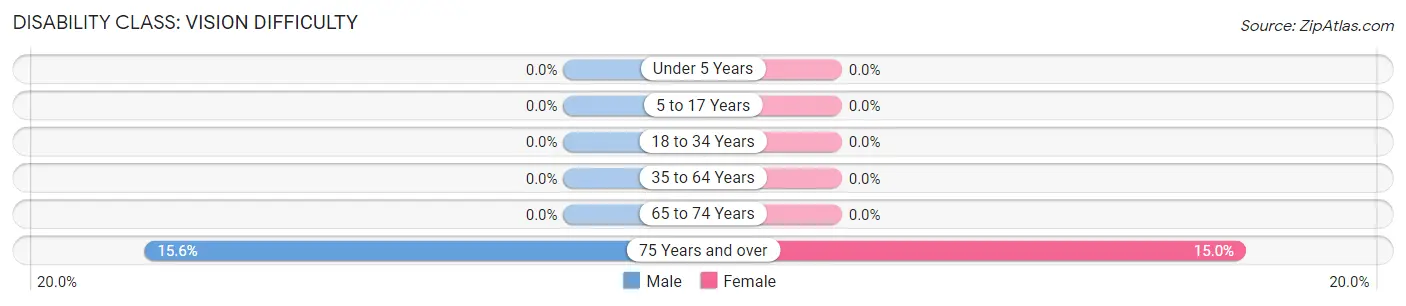
| Age Bracket | Male | Female |
| Under 5 Years | 0 (0.0%) | 0 (0.0%) |
| 5 to 17 Years | 0 (0.0%) | 0 (0.0%) |
| 18 to 34 Years | 0 (0.0%) | 0 (0.0%) |
| 35 to 64 Years | 0 (0.0%) | 0 (0.0%) |
| 65 to 74 Years | 0 (0.0%) | 0 (0.0%) |
| 75 Years and over | 37 (15.5%) | 18 (15.0%) |
Disability Class: Cognitive Difficulty
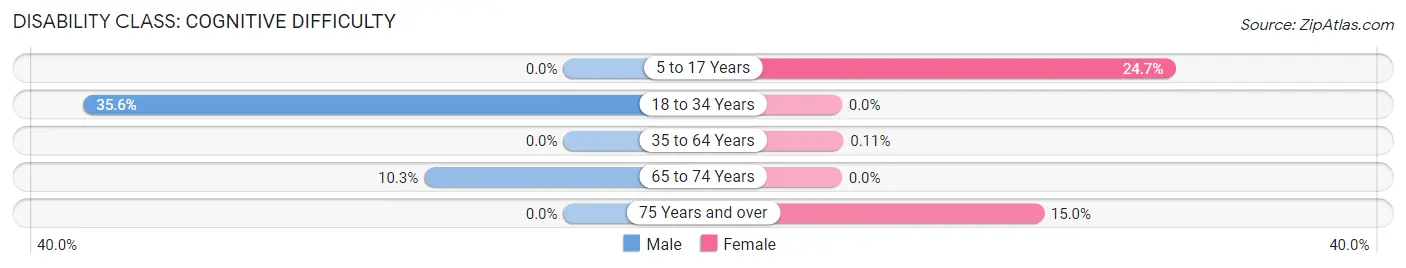
| Age Bracket | Male | Female |
| 5 to 17 Years | 0 (0.0%) | 72 (24.7%) |
| 18 to 34 Years | 259 (35.6%) | 0 (0.0%) |
| 35 to 64 Years | 0 (0.0%) | 1 (0.1%) |
| 65 to 74 Years | 33 (10.3%) | 0 (0.0%) |
| 75 Years and over | 0 (0.0%) | 18 (15.0%) |
Disability Class: Ambulatory Difficulty
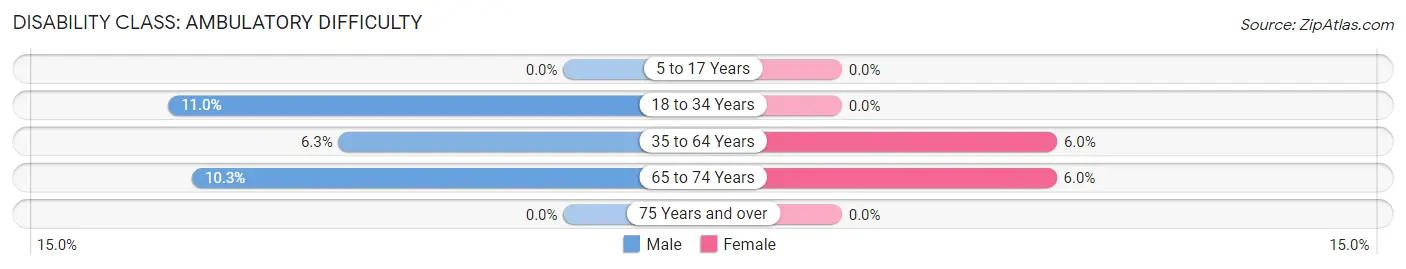
| Age Bracket | Male | Female |
| 5 to 17 Years | 0 (0.0%) | 0 (0.0%) |
| 18 to 34 Years | 80 (11.0%) | 0 (0.0%) |
| 35 to 64 Years | 64 (6.3%) | 54 (6.0%) |
| 65 to 74 Years | 33 (10.3%) | 21 (6.0%) |
| 75 Years and over | 0 (0.0%) | 0 (0.0%) |
Disability Class: Self-Care Difficulty
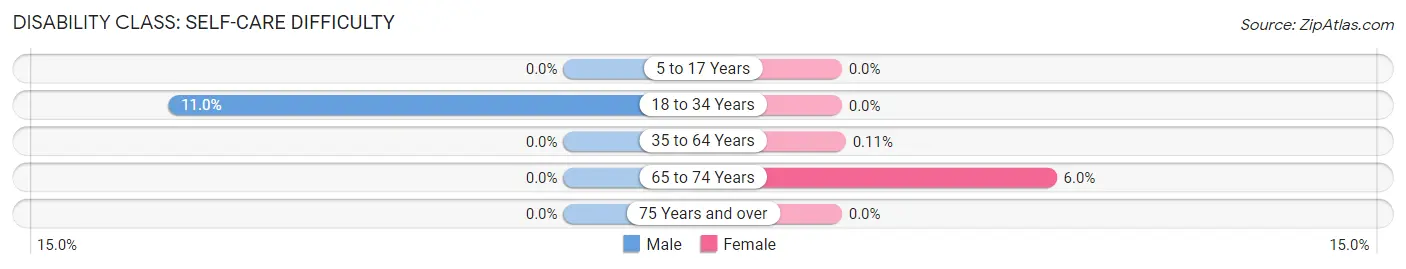
| Age Bracket | Male | Female |
| 5 to 17 Years | 0 (0.0%) | 0 (0.0%) |
| 18 to 34 Years | 80 (11.0%) | 0 (0.0%) |
| 35 to 64 Years | 0 (0.0%) | 1 (0.1%) |
| 65 to 74 Years | 0 (0.0%) | 21 (6.0%) |
| 75 Years and over | 0 (0.0%) | 0 (0.0%) |
Technology Access in Treasure Lake
Computing Device Access in Treasure Lake
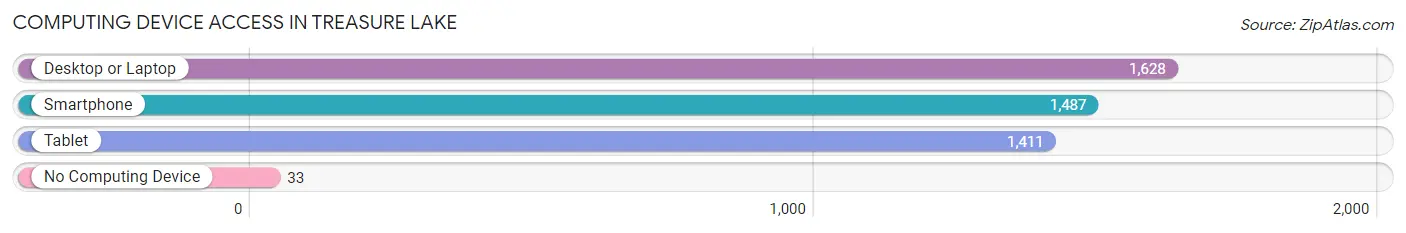
| Device Type | # Households | % Households |
| Desktop or Laptop | 1,628 | 95.7% |
| Smartphone | 1,487 | 87.4% |
| Tablet | 1,411 | 83.0% |
| No Computing Device | 33 | 1.9% |
| Total | 1,701 | 100.0% |
Internet Access in Treasure Lake
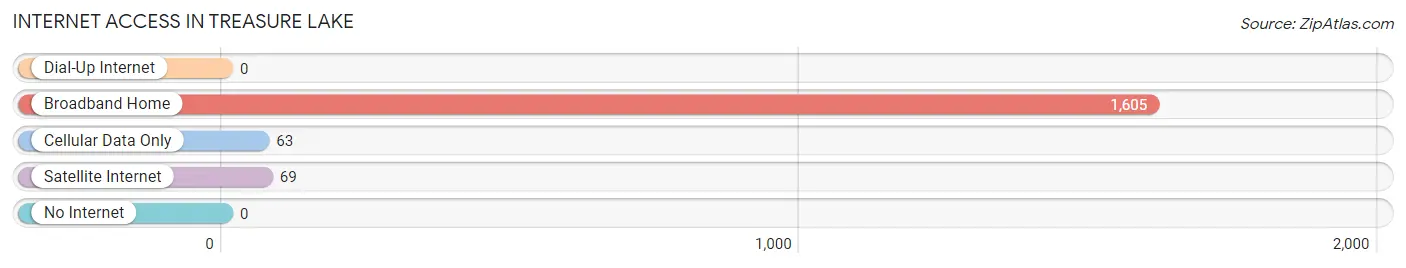
| Internet Type | # Households | % Households |
| Dial-Up Internet | 0 | 0.0% |
| Broadband Home | 1,605 | 94.4% |
| Cellular Data Only | 63 | 3.7% |
| Satellite Internet | 69 | 4.1% |
| No Internet | 0 | 0.0% |
| Total | 1,701 | 100.0% |
Treasure Lake Summary
Treasure Lake is a private residential community located in the borough of DuBois, Pennsylvania. It is situated in the foothills of the Allegheny Mountains, approximately 90 miles northeast of Pittsburgh. The community was founded in 1965 and is home to over 2,000 residents.
History
Treasure Lake was founded in 1965 by the Treasure Lake Corporation, a private real estate development company. The company purchased 2,000 acres of land in the foothills of the Allegheny Mountains and began developing the area into a residential community. The community was designed to provide a safe and secure environment for families to live and enjoy the outdoors. The community was designed with a variety of amenities, including two lakes, a golf course, a ski resort, and a variety of recreational activities.
Geography
Treasure Lake is located in the foothills of the Allegheny Mountains, approximately 90 miles northeast of Pittsburgh. The community is situated on 2,000 acres of land and is surrounded by forests and rolling hills. The two lakes, Treasure Lake and Lakeview, are the centerpiece of the community and provide a variety of recreational activities, including fishing, swimming, and boating. The community also features a golf course, a ski resort, and a variety of other recreational activities.
Economy
Treasure Lake is a private residential community and does not have a traditional economy. However, the community does have a variety of businesses and services that provide employment opportunities for residents. These businesses include restaurants, retail stores, and professional services. The community also has a variety of recreational activities, such as golf, skiing, and boating, which provide additional employment opportunities.
Demographics
As of the 2010 census, the population of Treasure Lake was 2,072. The population is predominantly white (94.3%) and the median age is 44. The median household income is $50,000 and the median home value is $150,000. The community is served by the DuBois Area School District.
Treasure Lake is a unique and vibrant community that provides a safe and secure environment for families to live and enjoy the outdoors. The community is home to a variety of businesses and services, as well as recreational activities, that provide employment opportunities and a variety of amenities for residents. The community is also served by the DuBois Area School District, which provides quality education for the children of Treasure Lake.
Common Questions
What is Per Capita Income in Treasure Lake?
Per Capita income in Treasure Lake is $51,802.
What is the Median Family Income in Treasure Lake?
Median Family Income in Treasure Lake is $111,283.
What is the Median Household income in Treasure Lake?
Median Household Income in Treasure Lake is $107,051.
What is Income or Wage Gap in Treasure Lake?
Income or Wage Gap in Treasure Lake is 19.8%.
Women in Treasure Lake earn 80.2 cents for every dollar earned by a man.
What is Inequality or Gini Index in Treasure Lake?
Inequality or Gini Index in Treasure Lake is 0.40.
What is the Total Population of Treasure Lake?
Total Population of Treasure Lake is 4,890.
What is the Total Male Population of Treasure Lake?
Total Male Population of Treasure Lake is 2,787.
What is the Total Female Population of Treasure Lake?
Total Female Population of Treasure Lake is 2,103.
What is the Ratio of Males per 100 Females in Treasure Lake?
There are 132.52 Males per 100 Females in Treasure Lake.
What is the Ratio of Females per 100 Males in Treasure Lake?
There are 75.46 Females per 100 Males in Treasure Lake.
What is the Median Population Age in Treasure Lake?
Median Population Age in Treasure Lake is 46.2 Years.
What is the Average Family Size in Treasure Lake
Average Family Size in Treasure Lake is 3.2 People.
What is the Average Household Size in Treasure Lake
Average Household Size in Treasure Lake is 2.9 People.
How Large is the Labor Force in Treasure Lake?
There are 2,528 People in the Labor Forcein in Treasure Lake.
What is the Percentage of People in the Labor Force in Treasure Lake?
61.2% of People are in the Labor Force in Treasure Lake.
What is the Unemployment Rate in Treasure Lake?
Unemployment Rate in Treasure Lake is 4.7%.