Oakwood, PA Map & Demographics
Oakwood Map
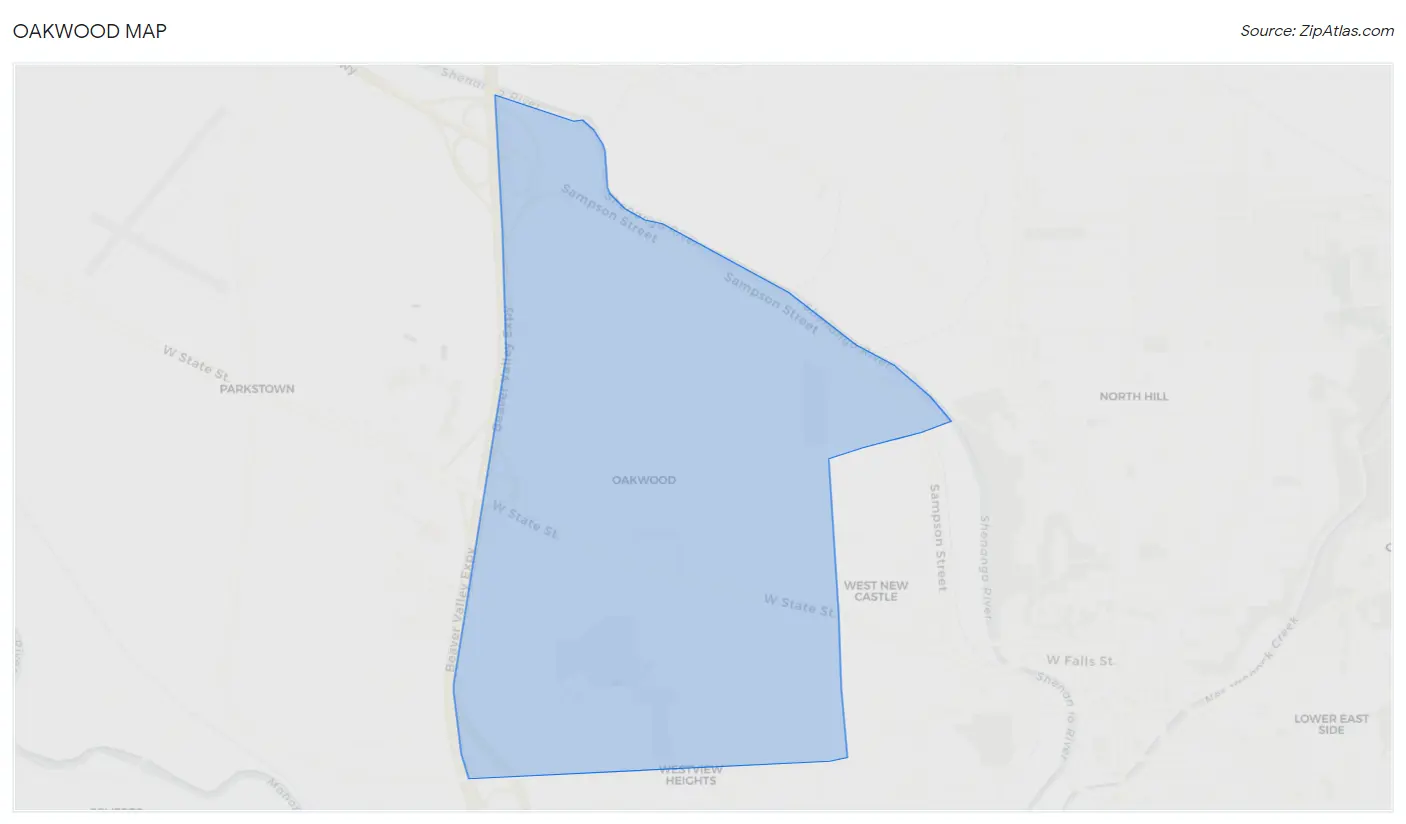
Oakwood Overview
$26,874
PER CAPITA INCOME
$79,018
AVG FAMILY INCOME
$63,458
AVG HOUSEHOLD INCOME
32.1%
WAGE / INCOME GAP [ % ]
67.9¢/ $1
WAGE / INCOME GAP [ $ ]
0.34
INEQUALITY / GINI INDEX
2,248
TOTAL POPULATION
1,042
MALE POPULATION
1,206
FEMALE POPULATION
86.40
MALES / 100 FEMALES
115.74
FEMALES / 100 MALES
45.7
MEDIAN AGE
3.0
AVG FAMILY SIZE
2.5
AVG HOUSEHOLD SIZE
976
LABOR FORCE [ PEOPLE ]
55.8%
PERCENT IN LABOR FORCE
2.7%
UNEMPLOYMENT RATE
Income in Oakwood
Income Overview in Oakwood
Per Capita Income in Oakwood is $26,874, while median incomes of families and households are $79,018 and $63,458 respectively.
| Characteristic | Number | Measure |
| Per Capita Income | 2,248 | $26,874 |
| Median Family Income | 645 | $79,018 |
| Mean Family Income | 645 | $78,192 |
| Median Household Income | 887 | $63,458 |
| Mean Household Income | 887 | $68,629 |
| Income Deficit | 645 | $0 |
| Wage / Income Gap (%) | 2,248 | 32.10% |
| Wage / Income Gap ($) | 2,248 | 67.90¢ per $1 |
| Gini / Inequality Index | 2,248 | 0.34 |
Earnings by Sex in Oakwood
Average Earnings in Oakwood are $34,716, $36,636 for men and $24,875 for women, a difference of 32.1%.
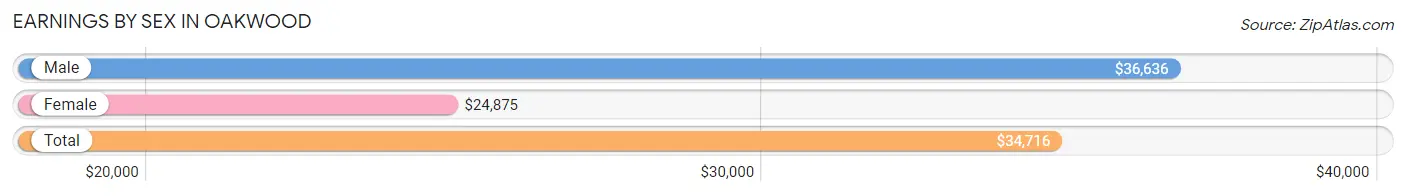
| Sex | Number | Average Earnings |
| Male | 560 (53.7%) | $36,636 |
| Female | 482 (46.3%) | $24,875 |
| Total | 1,042 (100.0%) | $34,716 |
Earnings by Sex by Income Bracket in Oakwood
The most common earnings brackets in Oakwood are $100,000+ for men (84 | 15.0%) and $2,500 to $4,999 for women (132 | 27.4%).
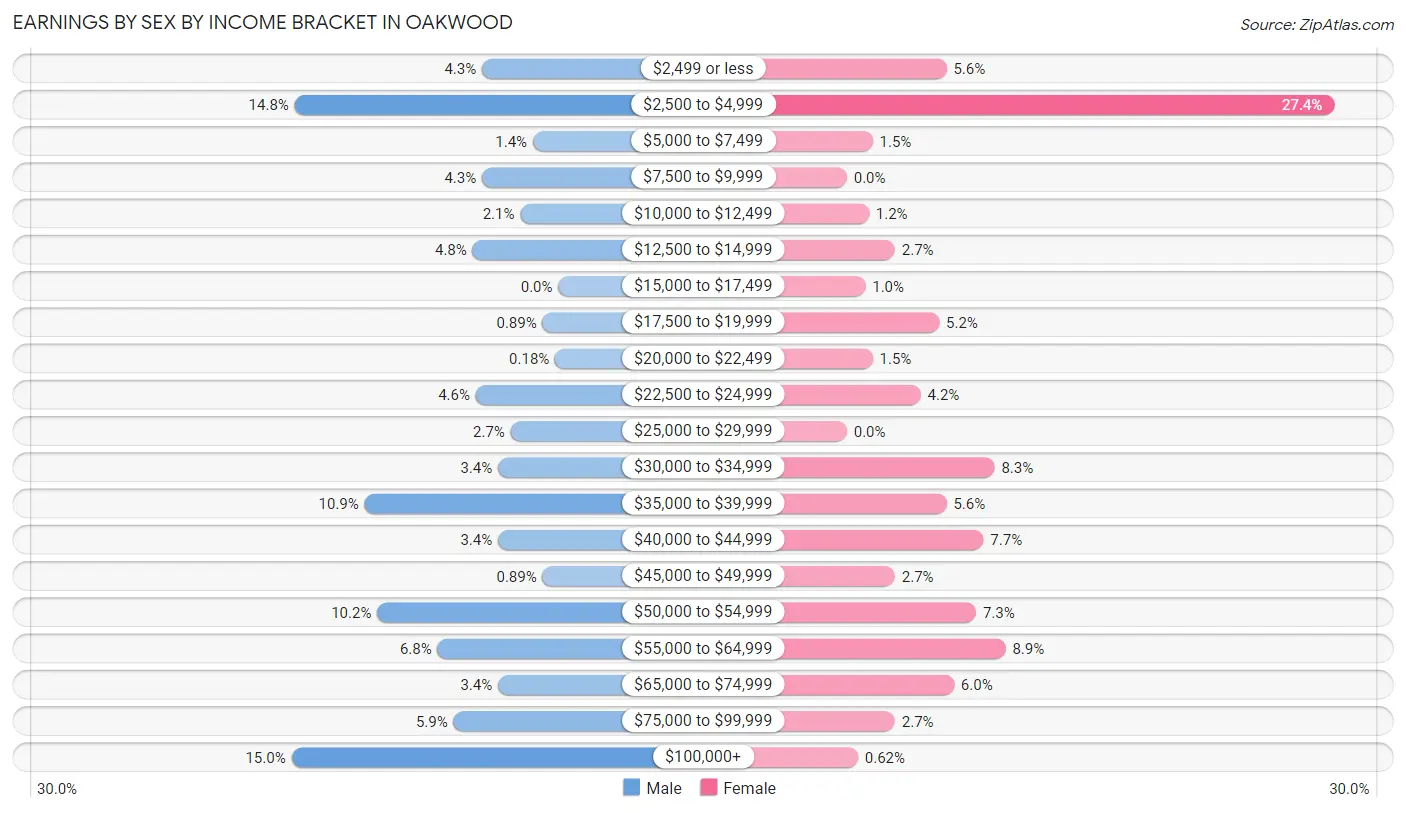
| Income | Male | Female |
| $2,499 or less | 24 (4.3%) | 27 (5.6%) |
| $2,500 to $4,999 | 83 (14.8%) | 132 (27.4%) |
| $5,000 to $7,499 | 8 (1.4%) | 7 (1.5%) |
| $7,500 to $9,999 | 24 (4.3%) | 0 (0.0%) |
| $10,000 to $12,499 | 12 (2.1%) | 6 (1.2%) |
| $12,500 to $14,999 | 27 (4.8%) | 13 (2.7%) |
| $15,000 to $17,499 | 0 (0.0%) | 5 (1.0%) |
| $17,500 to $19,999 | 5 (0.9%) | 25 (5.2%) |
| $20,000 to $22,499 | 1 (0.2%) | 7 (1.5%) |
| $22,500 to $24,999 | 26 (4.6%) | 20 (4.2%) |
| $25,000 to $29,999 | 15 (2.7%) | 0 (0.0%) |
| $30,000 to $34,999 | 19 (3.4%) | 40 (8.3%) |
| $35,000 to $39,999 | 61 (10.9%) | 27 (5.6%) |
| $40,000 to $44,999 | 19 (3.4%) | 37 (7.7%) |
| $45,000 to $49,999 | 5 (0.9%) | 13 (2.7%) |
| $50,000 to $54,999 | 57 (10.2%) | 35 (7.3%) |
| $55,000 to $64,999 | 38 (6.8%) | 43 (8.9%) |
| $65,000 to $74,999 | 19 (3.4%) | 29 (6.0%) |
| $75,000 to $99,999 | 33 (5.9%) | 13 (2.7%) |
| $100,000+ | 84 (15.0%) | 3 (0.6%) |
| Total | 560 (100.0%) | 482 (100.0%) |
Earnings by Sex by Educational Attainment in Oakwood
Average earnings in Oakwood are $37,091 for men and $33,063 for women, a difference of 10.9%. Men with an educational attainment of college or associate's degree enjoy the highest average annual earnings of $63,194, while those with less than high school education earn the least with $24,485. Women with an educational attainment of college or associate's degree earn the most with the average annual earnings of $37,891, while those with college or associate's degree education have the smallest earnings of $37,891.
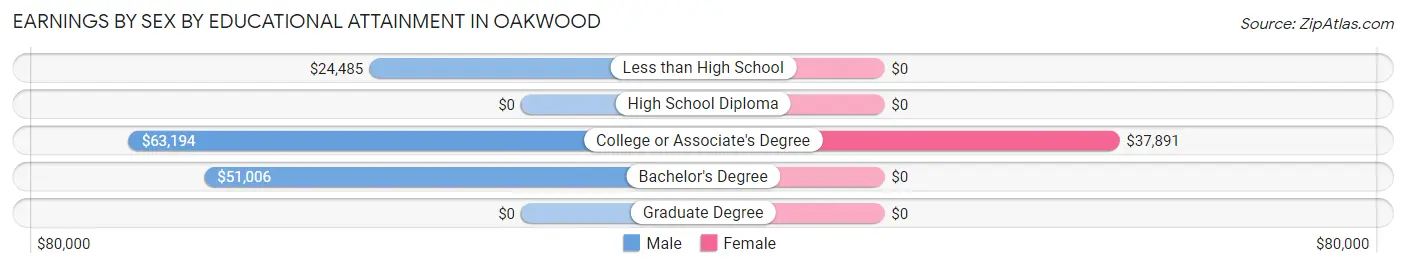
| Educational Attainment | Male Income | Female Income |
| Less than High School | $24,485 | $0 |
| High School Diploma | - | - |
| College or Associate's Degree | $63,194 | $37,891 |
| Bachelor's Degree | $51,006 | $0 |
| Graduate Degree | - | - |
| Total | $37,091 | $33,063 |
Family Income in Oakwood
Family Income Brackets in Oakwood
According to the Oakwood family income data, there are 213 families falling into the $100,000 to $149,999 income range, which is the most common income bracket and makes up 33.0% of all families.
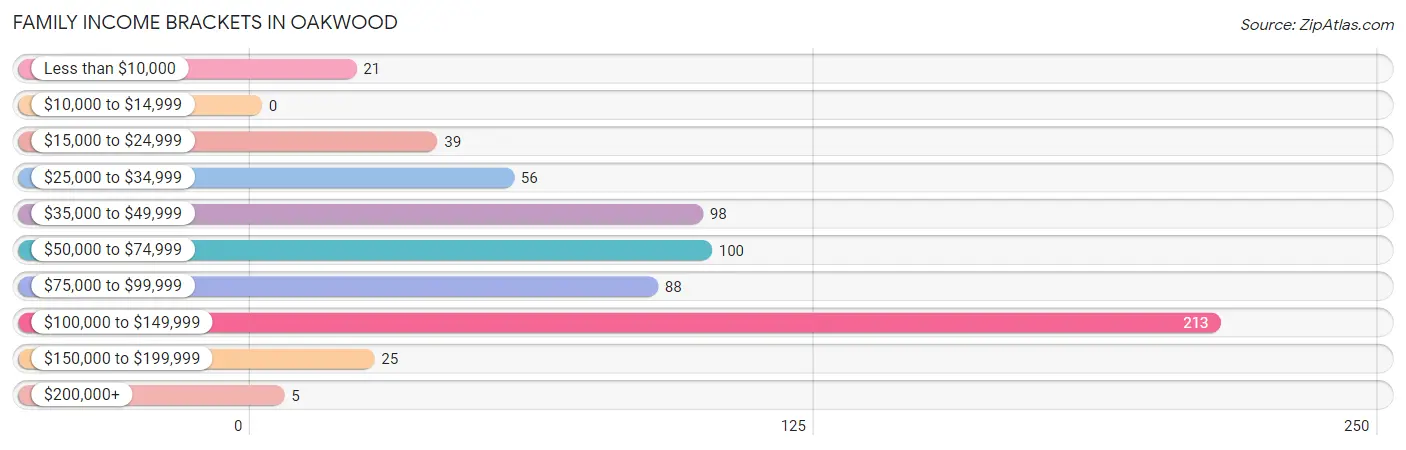
| Income Bracket | # Families | % Families |
| Less than $10,000 | 21 | 3.3% |
| $10,000 to $14,999 | 0 | 0.0% |
| $15,000 to $24,999 | 39 | 6.0% |
| $25,000 to $34,999 | 56 | 8.7% |
| $35,000 to $49,999 | 98 | 15.2% |
| $50,000 to $74,999 | 100 | 15.5% |
| $75,000 to $99,999 | 88 | 13.6% |
| $100,000 to $149,999 | 213 | 33.0% |
| $150,000 to $199,999 | 25 | 3.9% |
| $200,000+ | 5 | 0.8% |
Family Income by Famaliy Size in Oakwood
5-person families (51 | 7.9%) account for the highest median family income in Oakwood with $109,803 per family, while 3-person families (193 | 29.9%) have the highest median income of $31,458 per family member.
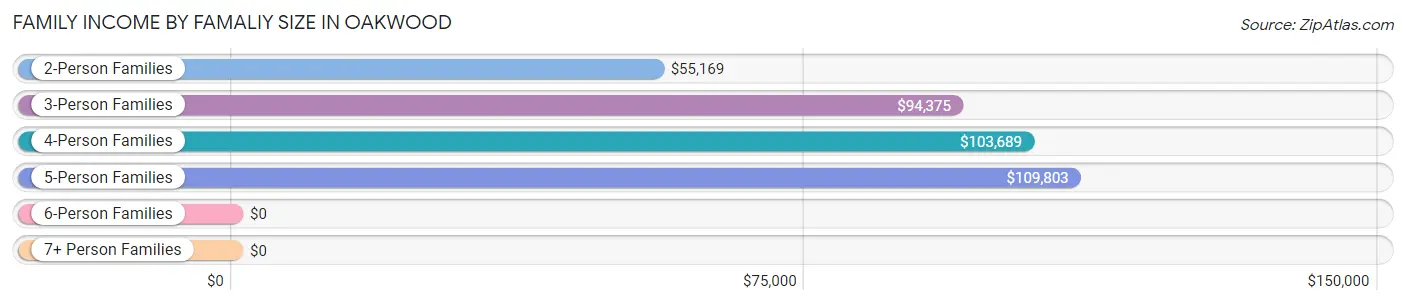
| Income Bracket | # Families | Median Income |
| 2-Person Families | 297 (46.1%) | $55,169 |
| 3-Person Families | 193 (29.9%) | $94,375 |
| 4-Person Families | 67 (10.4%) | $103,689 |
| 5-Person Families | 51 (7.9%) | $109,803 |
| 6-Person Families | 33 (5.1%) | $0 |
| 7+ Person Families | 4 (0.6%) | $0 |
| Total | 645 (100.0%) | $79,018 |
Family Income by Number of Earners in Oakwood
The median family income in Oakwood is $79,018, with families comprising 3+ earners (55) having the highest median family income of $111,042, while families with 1 earner (265) have the lowest median family income of $47,734, accounting for 8.5% and 41.1% of families, respectively.
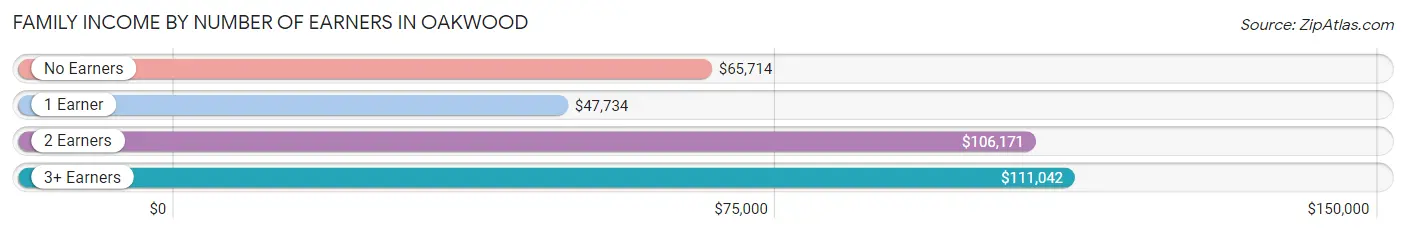
| Number of Earners | # Families | Median Income |
| No Earners | 106 (16.4%) | $65,714 |
| 1 Earner | 265 (41.1%) | $47,734 |
| 2 Earners | 219 (34.0%) | $106,171 |
| 3+ Earners | 55 (8.5%) | $111,042 |
| Total | 645 (100.0%) | $79,018 |
Household Income in Oakwood
Household Income Brackets in Oakwood
With 223 households falling in the category, the $100,000 to $149,999 income range is the most frequent in Oakwood, accounting for 25.1% of all households. In contrast, only 5 households (0.6%) fall into the $200,000+ income bracket, making it the least populous group.
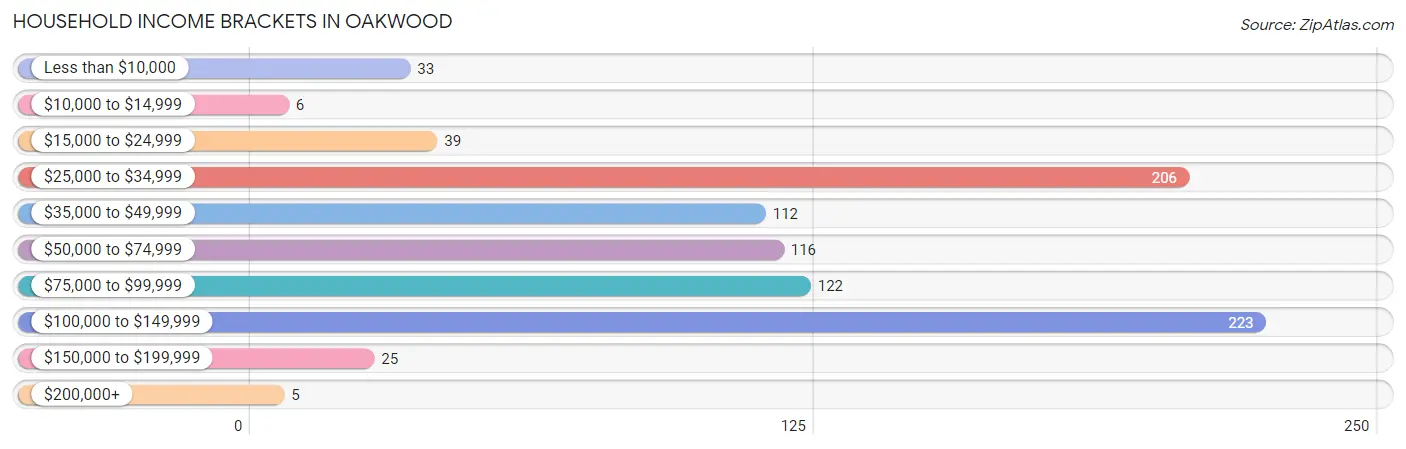
| Income Bracket | # Households | % Households |
| Less than $10,000 | 33 | 3.7% |
| $10,000 to $14,999 | 6 | 0.7% |
| $15,000 to $24,999 | 39 | 4.4% |
| $25,000 to $34,999 | 206 | 23.2% |
| $35,000 to $49,999 | 112 | 12.6% |
| $50,000 to $74,999 | 116 | 13.1% |
| $75,000 to $99,999 | 122 | 13.8% |
| $100,000 to $149,999 | 223 | 25.1% |
| $150,000 to $199,999 | 25 | 2.8% |
| $200,000+ | 5 | 0.6% |
Household Income by Householder Age in Oakwood
The median household income in Oakwood is $63,458, with the highest median household income of $103,537 found in the 25 to 44 years age bracket for the primary householder. A total of 216 households (24.3%) fall into this category. Meanwhile, the 15 to 24 years age bracket for the primary householder has the lowest median household income of $0, with 6 households (0.7%) in this group.
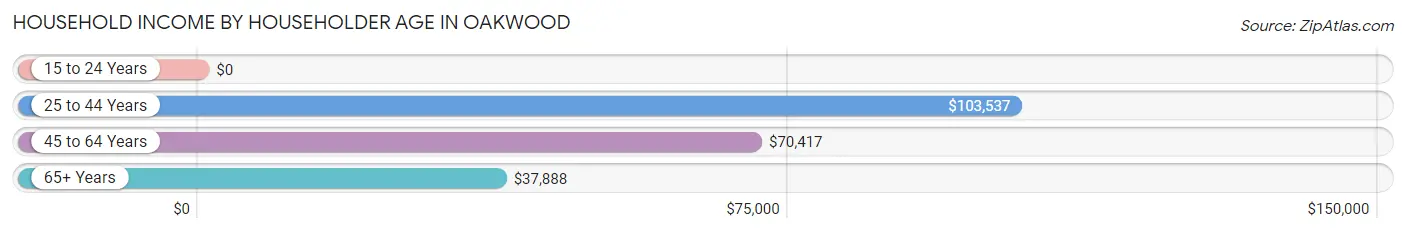
| Income Bracket | # Households | Median Income |
| 15 to 24 Years | 6 (0.7%) | $0 |
| 25 to 44 Years | 216 (24.3%) | $103,537 |
| 45 to 64 Years | 340 (38.3%) | $70,417 |
| 65+ Years | 325 (36.6%) | $37,888 |
| Total | 887 (100.0%) | $63,458 |
Poverty in Oakwood
Income Below Poverty by Sex and Age in Oakwood
With 10.3% poverty level for males and 8.9% for females among the residents of Oakwood, 12 to 14 year old males and under 5 year old females are the most vulnerable to poverty, with 34 males (50.0%) and 25 females (31.7%) in their respective age groups living below the poverty level.
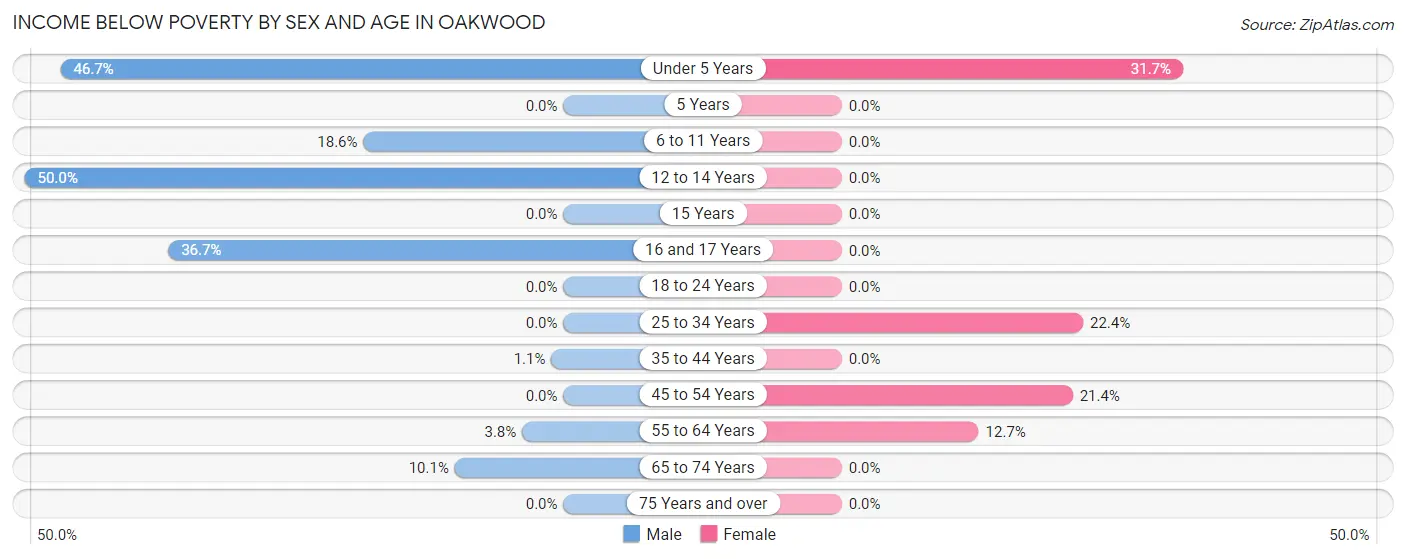
| Age Bracket | Male | Female |
| Under 5 Years | 21 (46.7%) | 25 (31.7%) |
| 5 Years | 0 (0.0%) | 0 (0.0%) |
| 6 to 11 Years | 18 (18.6%) | 0 (0.0%) |
| 12 to 14 Years | 34 (50.0%) | 0 (0.0%) |
| 15 Years | 0 (0.0%) | 0 (0.0%) |
| 16 and 17 Years | 11 (36.7%) | 0 (0.0%) |
| 18 to 24 Years | 0 (0.0%) | 0 (0.0%) |
| 25 to 34 Years | 0 (0.0%) | 30 (22.4%) |
| 35 to 44 Years | 2 (1.1%) | 0 (0.0%) |
| 45 to 54 Years | 0 (0.0%) | 36 (21.4%) |
| 55 to 64 Years | 8 (3.8%) | 16 (12.7%) |
| 65 to 74 Years | 13 (10.1%) | 0 (0.0%) |
| 75 Years and over | 0 (0.0%) | 0 (0.0%) |
| Total | 107 (10.3%) | 107 (8.9%) |
Income Above Poverty by Sex and Age in Oakwood
According to the poverty statistics in Oakwood, males aged 18 to 24 years and females aged 6 to 11 years are the age groups that are most secure financially, with 100.0% of males and 100.0% of females in these age groups living above the poverty line.
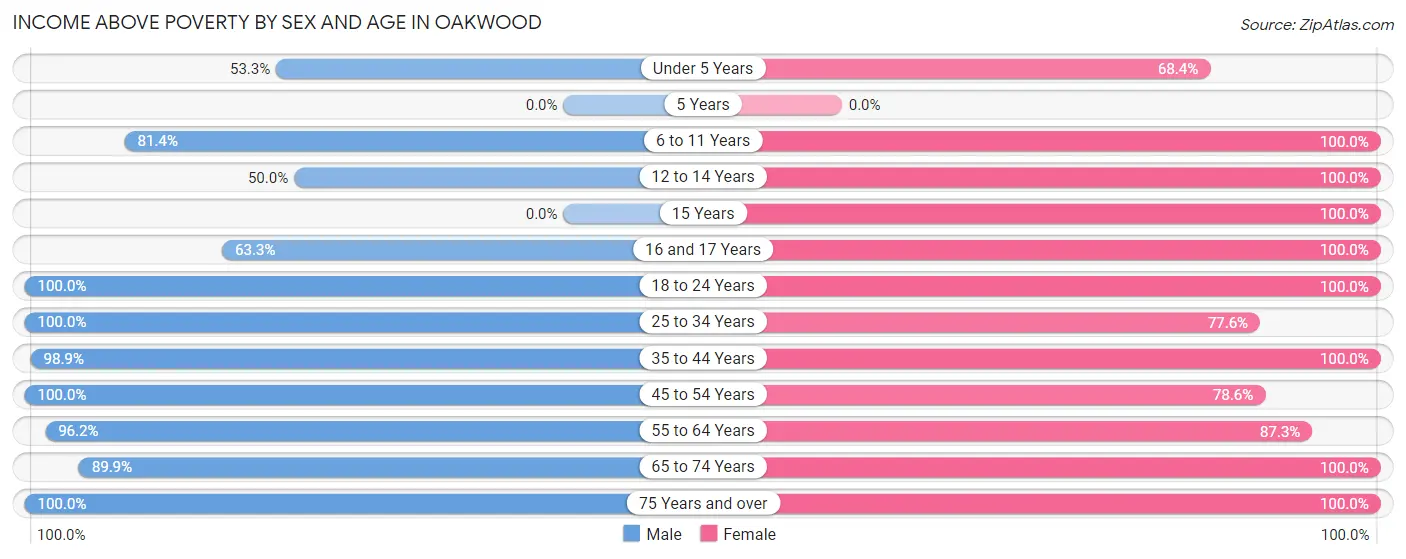
| Age Bracket | Male | Female |
| Under 5 Years | 24 (53.3%) | 54 (68.3%) |
| 5 Years | 0 (0.0%) | 0 (0.0%) |
| 6 to 11 Years | 79 (81.4%) | 135 (100.0%) |
| 12 to 14 Years | 34 (50.0%) | 34 (100.0%) |
| 15 Years | 0 (0.0%) | 34 (100.0%) |
| 16 and 17 Years | 19 (63.3%) | 4 (100.0%) |
| 18 to 24 Years | 42 (100.0%) | 23 (100.0%) |
| 25 to 34 Years | 76 (100.0%) | 104 (77.6%) |
| 35 to 44 Years | 177 (98.9%) | 130 (100.0%) |
| 45 to 54 Years | 95 (100.0%) | 132 (78.6%) |
| 55 to 64 Years | 201 (96.2%) | 110 (87.3%) |
| 65 to 74 Years | 116 (89.9%) | 196 (100.0%) |
| 75 Years and over | 65 (100.0%) | 143 (100.0%) |
| Total | 928 (89.7%) | 1,099 (91.1%) |
Income Below Poverty Among Married-Couple Families in Oakwood
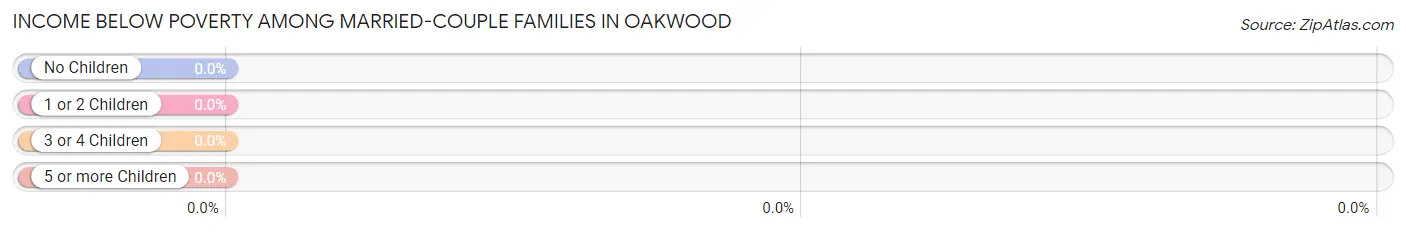
| Children | Above Poverty | Below Poverty |
| No Children | 203 (100.0%) | 0 (0.0%) |
| 1 or 2 Children | 188 (100.0%) | 0 (0.0%) |
| 3 or 4 Children | 9 (100.0%) | 0 (0.0%) |
| 5 or more Children | 0 (0.0%) | 0 (0.0%) |
| Total | 400 (100.0%) | 0 (0.0%) |
Income Below Poverty Among Single-Parent Households in Oakwood
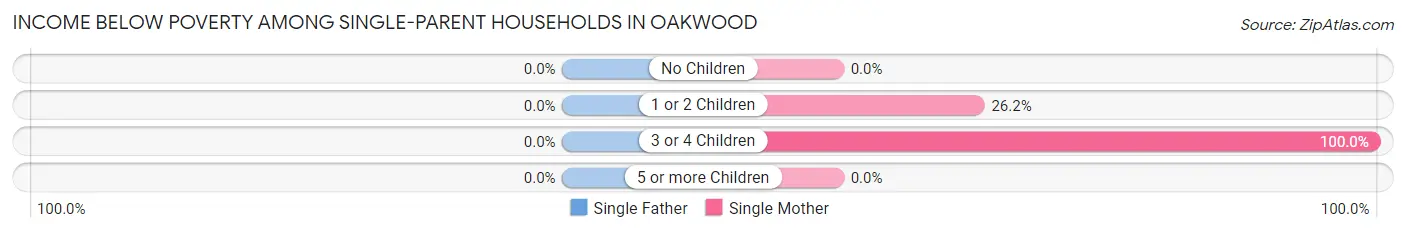
| Children | Single Father | Single Mother |
| No Children | 0 (0.0%) | 0 (0.0%) |
| 1 or 2 Children | 0 (0.0%) | 16 (26.2%) |
| 3 or 4 Children | 0 (0.0%) | 21 (100.0%) |
| 5 or more Children | 0 (0.0%) | 0 (0.0%) |
| Total | 0 (0.0%) | 37 (19.3%) |
Income Below Poverty Among Married-Couple vs Single-Parent Households in Oakwood
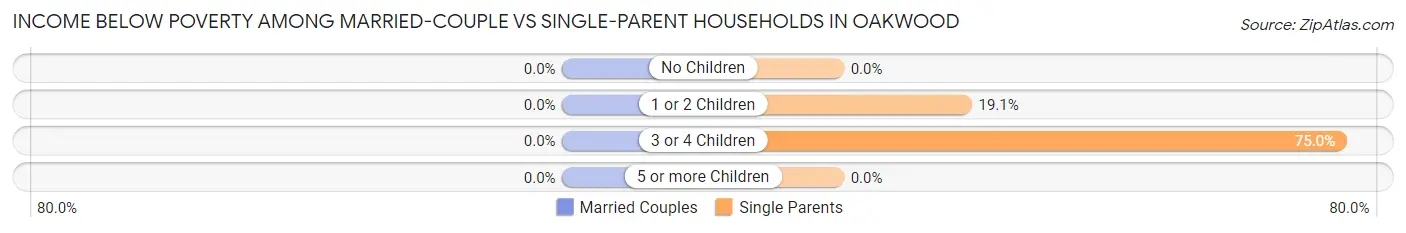
| Children | Married-Couple Families | Single-Parent Households |
| No Children | 0 (0.0%) | 0 (0.0%) |
| 1 or 2 Children | 0 (0.0%) | 16 (19.1%) |
| 3 or 4 Children | 0 (0.0%) | 21 (75.0%) |
| 5 or more Children | 0 (0.0%) | 0 (0.0%) |
| Total | 0 (0.0%) | 37 (15.1%) |
Race in Oakwood
The most populous races in Oakwood are White / Caucasian (2,046 | 91.0%), Black / African American (107 | 4.8%), and Two or more Races (95 | 4.2%).
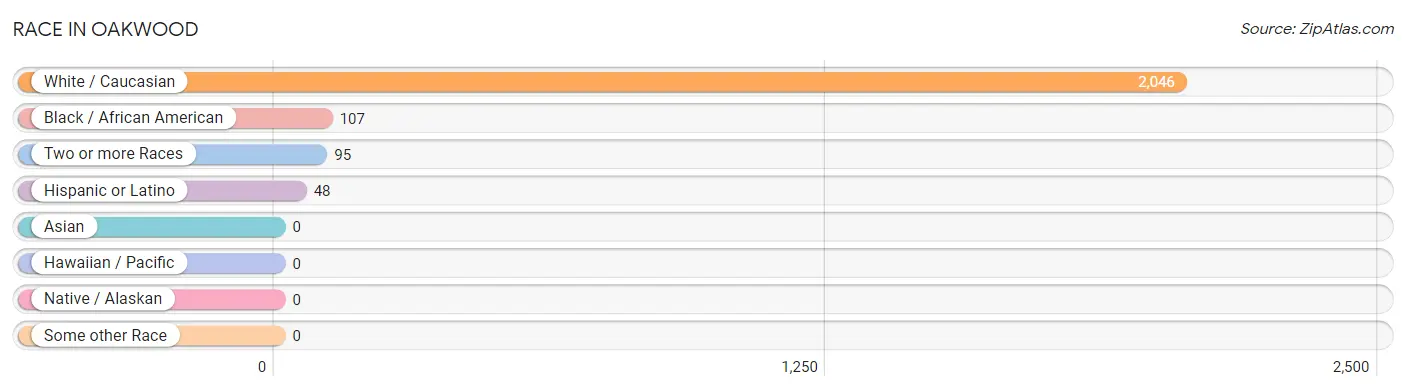
| Race | # Population | % Population |
| Asian | 0 | 0.0% |
| Black / African American | 107 | 4.8% |
| Hawaiian / Pacific | 0 | 0.0% |
| Hispanic or Latino | 48 | 2.1% |
| Native / Alaskan | 0 | 0.0% |
| White / Caucasian | 2,046 | 91.0% |
| Two or more Races | 95 | 4.2% |
| Some other Race | 0 | 0.0% |
| Total | 2,248 | 100.0% |
Ancestry in Oakwood
The most populous ancestries reported in Oakwood are German (672 | 29.9%), Irish (562 | 25.0%), Italian (442 | 19.7%), English (233 | 10.4%), and Polish (158 | 7.0%), together accounting for 91.9% of all Oakwood residents.
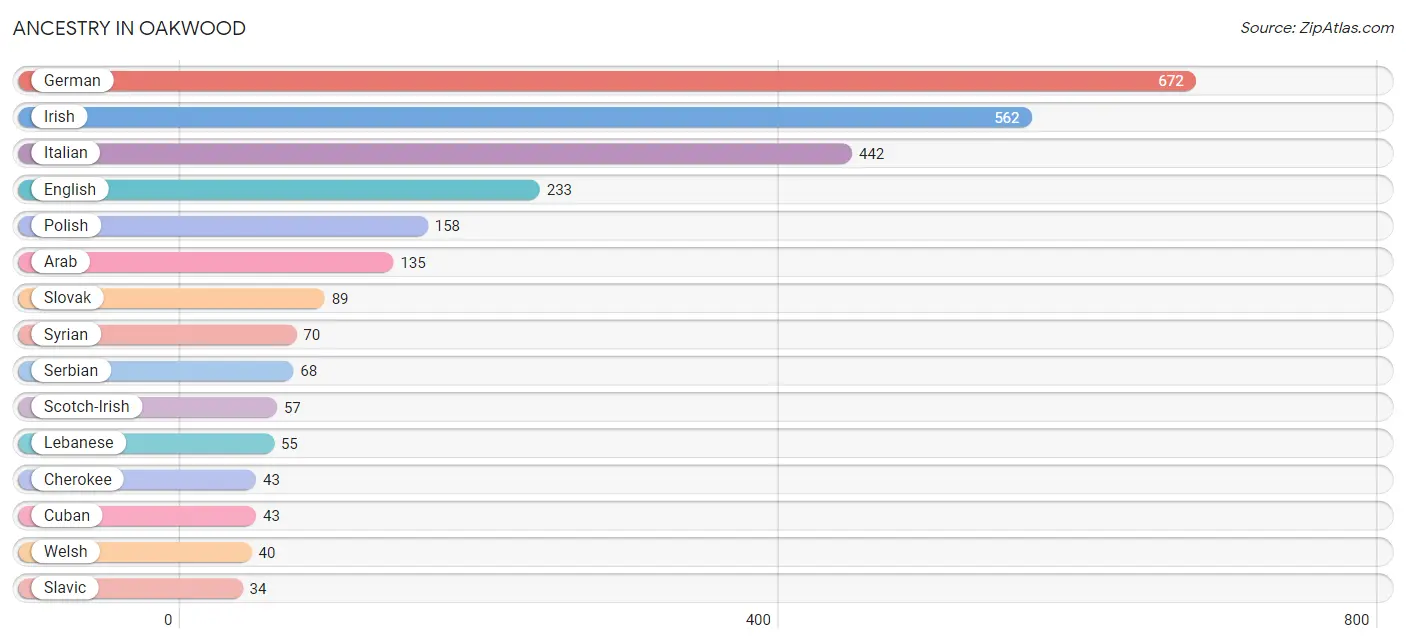
| Ancestry | # Population | % Population |
| Arab | 135 | 6.0% |
| British | 6 | 0.3% |
| Canadian | 31 | 1.4% |
| Cherokee | 43 | 1.9% |
| Cuban | 43 | 1.9% |
| Dutch | 31 | 1.4% |
| English | 233 | 10.4% |
| French | 7 | 0.3% |
| German | 672 | 29.9% |
| Hungarian | 16 | 0.7% |
| Iranian | 8 | 0.4% |
| Irish | 562 | 25.0% |
| Italian | 442 | 19.7% |
| Lebanese | 55 | 2.5% |
| Pennsylvania German | 16 | 0.7% |
| Polish | 158 | 7.0% |
| Puerto Rican | 5 | 0.2% |
| Scotch-Irish | 57 | 2.5% |
| Serbian | 68 | 3.0% |
| Slavic | 34 | 1.5% |
| Slovak | 89 | 4.0% |
| Swedish | 19 | 0.9% |
| Syrian | 70 | 3.1% |
| Ukrainian | 10 | 0.4% |
| Welsh | 40 | 1.8% | View All 25 Rows |
Immigrants in Oakwood
The most numerous immigrant groups reported in Oakwood came from Canada (15 | 0.7%), Europe (13 | 0.6%), Germany (13 | 0.6%), Western Europe (13 | 0.6%), and Asia (8 | 0.4%), together accounting for 2.8% of all Oakwood residents.
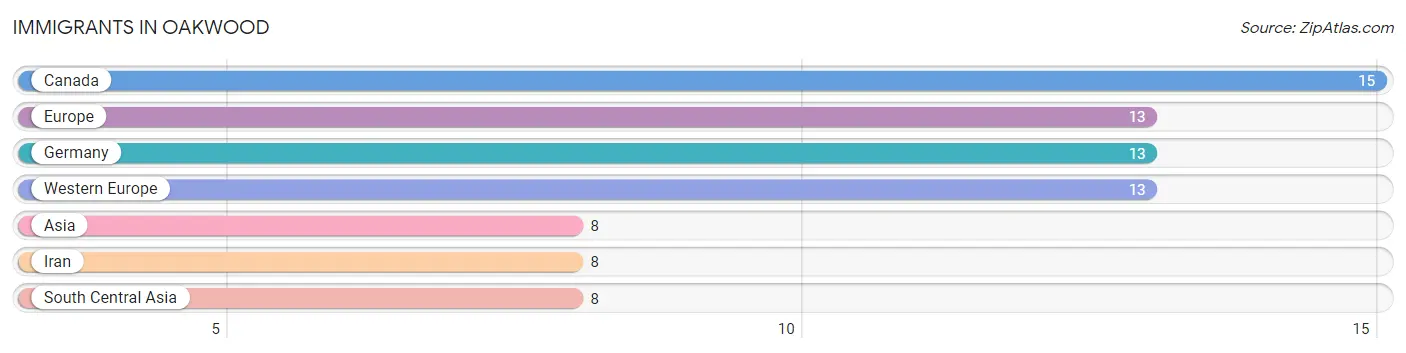
| Immigration Origin | # Population | % Population |
| Asia | 8 | 0.4% |
| Canada | 15 | 0.7% |
| Europe | 13 | 0.6% |
| Germany | 13 | 0.6% |
| Iran | 8 | 0.4% |
| South Central Asia | 8 | 0.4% |
| Western Europe | 13 | 0.6% | View All 7 Rows |
Sex and Age in Oakwood
Sex and Age in Oakwood
The most populous age groups in Oakwood are 60 to 64 Years (167 | 16.0%) for men and 65 to 69 Years (130 | 10.8%) for women.
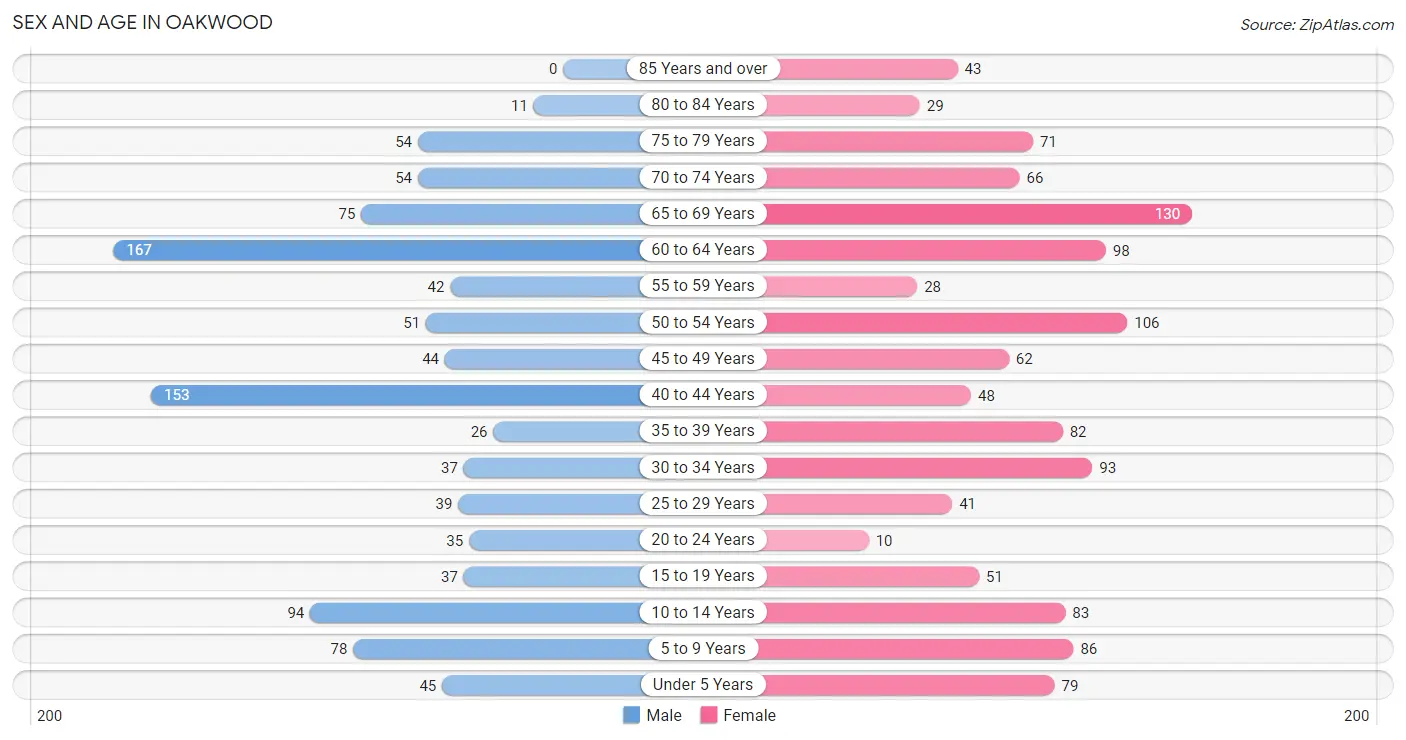
| Age Bracket | Male | Female |
| Under 5 Years | 45 (4.3%) | 79 (6.6%) |
| 5 to 9 Years | 78 (7.5%) | 86 (7.1%) |
| 10 to 14 Years | 94 (9.0%) | 83 (6.9%) |
| 15 to 19 Years | 37 (3.5%) | 51 (4.2%) |
| 20 to 24 Years | 35 (3.4%) | 10 (0.8%) |
| 25 to 29 Years | 39 (3.7%) | 41 (3.4%) |
| 30 to 34 Years | 37 (3.5%) | 93 (7.7%) |
| 35 to 39 Years | 26 (2.5%) | 82 (6.8%) |
| 40 to 44 Years | 153 (14.7%) | 48 (4.0%) |
| 45 to 49 Years | 44 (4.2%) | 62 (5.1%) |
| 50 to 54 Years | 51 (4.9%) | 106 (8.8%) |
| 55 to 59 Years | 42 (4.0%) | 28 (2.3%) |
| 60 to 64 Years | 167 (16.0%) | 98 (8.1%) |
| 65 to 69 Years | 75 (7.2%) | 130 (10.8%) |
| 70 to 74 Years | 54 (5.2%) | 66 (5.5%) |
| 75 to 79 Years | 54 (5.2%) | 71 (5.9%) |
| 80 to 84 Years | 11 (1.1%) | 29 (2.4%) |
| 85 Years and over | 0 (0.0%) | 43 (3.6%) |
| Total | 1,042 (100.0%) | 1,206 (100.0%) |
Families and Households in Oakwood
Median Family Size in Oakwood
The median family size in Oakwood is 2.98 persons per family, with single male/father families (53 | 8.2%) accounting for the largest median family size of 3.02 persons per family. On the other hand, single female/mother families (192 | 29.8%) represent the smallest median family size with 2.97 persons per family.
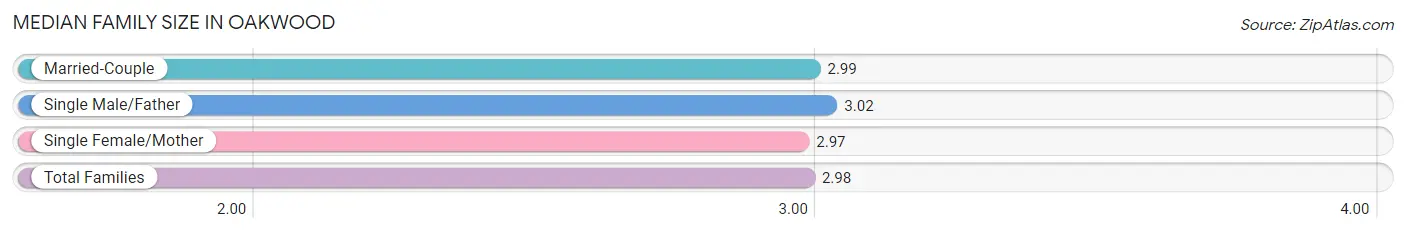
| Family Type | # Families | Family Size |
| Married-Couple | 400 (62.0%) | 2.99 |
| Single Male/Father | 53 (8.2%) | 3.02 |
| Single Female/Mother | 192 (29.8%) | 2.97 |
| Total Families | 645 (100.0%) | 2.98 |
Median Household Size in Oakwood
The median household size in Oakwood is 2.53 persons per household, with single female/mother households (192 | 21.6%) accounting for the largest median household size of 3.19 persons per household. non-family households (242 | 27.3%) represent the smallest median household size with 1.14 persons per household.
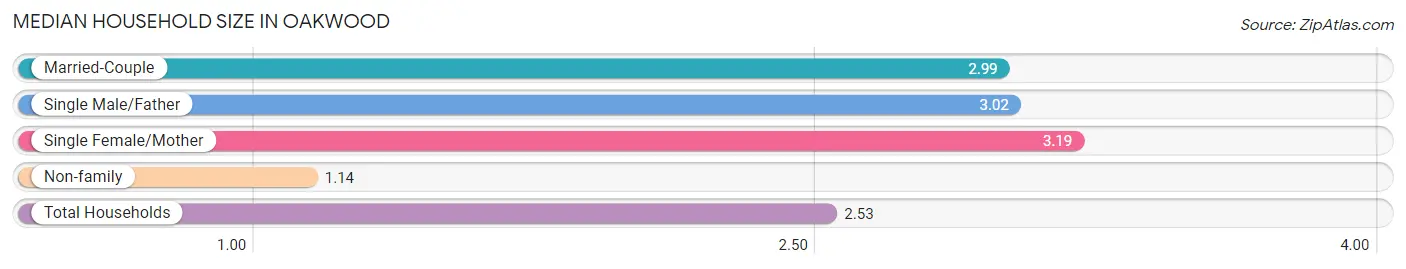
| Household Type | # Households | Household Size |
| Married-Couple | 400 (45.1%) | 2.99 |
| Single Male/Father | 53 (6.0%) | 3.02 |
| Single Female/Mother | 192 (21.6%) | 3.19 |
| Non-family | 242 (27.3%) | 1.14 |
| Total Households | 887 (100.0%) | 2.53 |
Household Size by Marriage Status in Oakwood
Out of a total of 887 households in Oakwood, 645 (72.7%) are family households, while 242 (27.3%) are nonfamily households. The most numerous type of family households are 2-person households, comprising 264, and the most common type of nonfamily households are 1-person households, comprising 214.
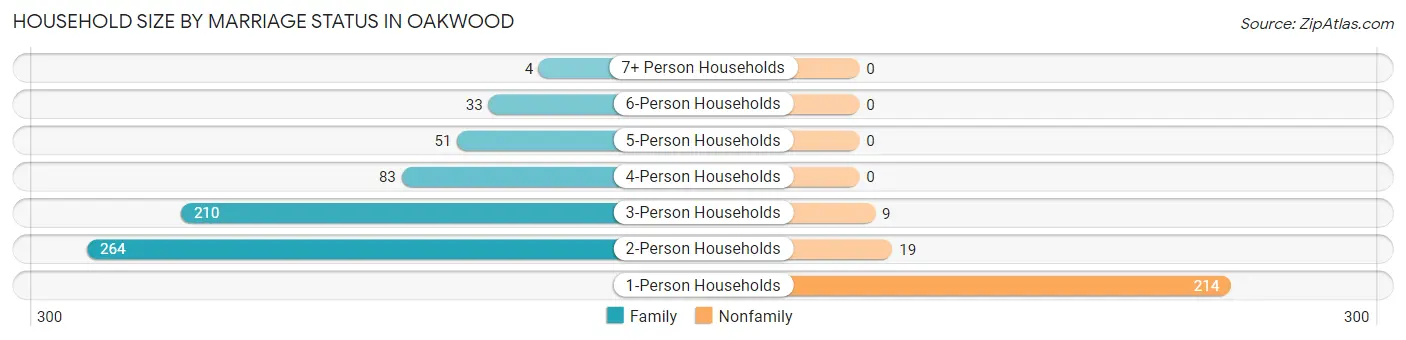
| Household Size | Family Households | Nonfamily Households |
| 1-Person Households | - | 214 (24.1%) |
| 2-Person Households | 264 (29.8%) | 19 (2.1%) |
| 3-Person Households | 210 (23.7%) | 9 (1.0%) |
| 4-Person Households | 83 (9.4%) | 0 (0.0%) |
| 5-Person Households | 51 (5.8%) | 0 (0.0%) |
| 6-Person Households | 33 (3.7%) | 0 (0.0%) |
| 7+ Person Households | 4 (0.4%) | 0 (0.0%) |
| Total | 645 (72.7%) | 242 (27.3%) |
Female Fertility in Oakwood
Fertility by Age in Oakwood
| Age Bracket | Women with Births | Births / 1,000 Women |
| 15 to 19 years | 0 (0.0%) | 0.0 |
| 20 to 34 years | 0 (0.0%) | 0.0 |
| 35 to 50 years | 0 (0.0%) | 0.0 |
| Total | 0 (0.0%) | 0.0 |
Fertility by Age by Marriage Status in Oakwood
| Age Bracket | Married | Unmarried |
| 15 to 19 years | 0 (0.0%) | 0 (0.0%) |
| 20 to 34 years | 0 (0.0%) | 0 (0.0%) |
| 35 to 50 years | 0 (0.0%) | 0 (0.0%) |
| Total | 0 (0.0%) | 0 (0.0%) |
Fertility by Education in Oakwood
| Educational Attainment | Women with Births | Births / 1,000 Women |
| Less than High School | 0 (0.0%) | 0.0 |
| High School Diploma | 0 (0.0%) | 0.0 |
| College or Associate's Degree | 0 (0.0%) | 0.0 |
| Bachelor's Degree | 0 (0.0%) | 0.0 |
| Graduate Degree | 0 (0.0%) | 0.0 |
| Total | 0 (0.0%) | 0.0 |
Fertility by Education by Marriage Status in Oakwood
| Educational Attainment | Married | Unmarried |
| Less than High School | 0 (0.0%) | 0 (0.0%) |
| High School Diploma | 0 (0.0%) | 0 (0.0%) |
| College or Associate's Degree | 0 (0.0%) | 0 (0.0%) |
| Bachelor's Degree | 0 (0.0%) | 0 (0.0%) |
| Graduate Degree | 0 (0.0%) | 0 (0.0%) |
| Total | 0 (0.0%) | 0 (0.0%) |
Employment Characteristics in Oakwood
Employment by Class of Employer in Oakwood
Among the 900 employed individuals in Oakwood, private company employees (753 | 83.7%), state government employees (40 | 4.4%), and not-for-profit organizations (38 | 4.2%) make up the most common classes of employment.
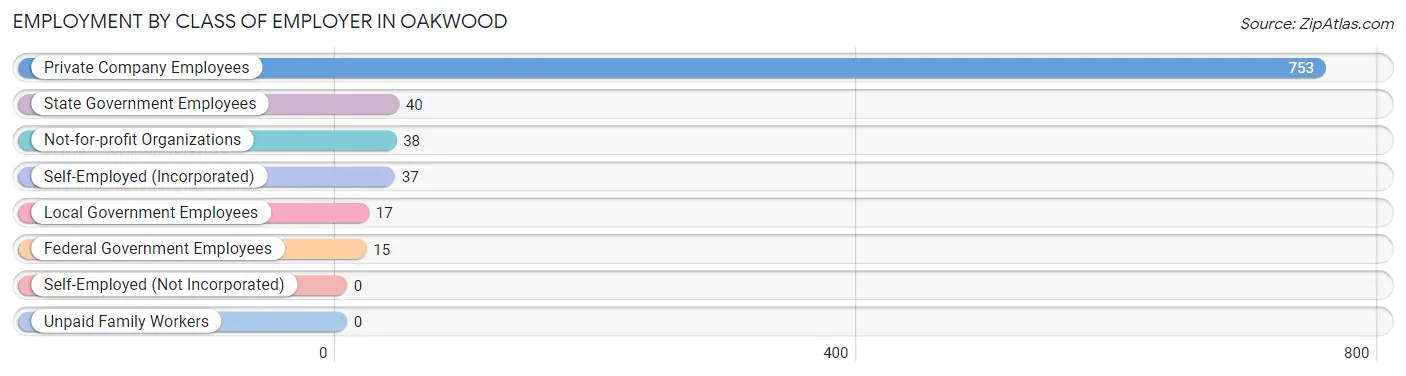
| Employer Class | # Employees | % Employees |
| Private Company Employees | 753 | 83.7% |
| Self-Employed (Incorporated) | 37 | 4.1% |
| Self-Employed (Not Incorporated) | 0 | 0.0% |
| Not-for-profit Organizations | 38 | 4.2% |
| Local Government Employees | 17 | 1.9% |
| State Government Employees | 40 | 4.4% |
| Federal Government Employees | 15 | 1.7% |
| Unpaid Family Workers | 0 | 0.0% |
| Total | 900 | 100.0% |
Employment Status by Age in Oakwood
According to the labor force statistics for Oakwood, out of the total population over 16 years of age (1,749), 55.8% or 976 individuals are in the labor force, with 2.7% or 26 of them unemployed. The age group with the highest labor force participation rate is 20 to 24 years, with 100.0% or 45 individuals in the labor force. Within the labor force, the 16 to 19 years age range has the highest percentage of unemployed individuals, with 36.0% or 9 of them being unemployed.
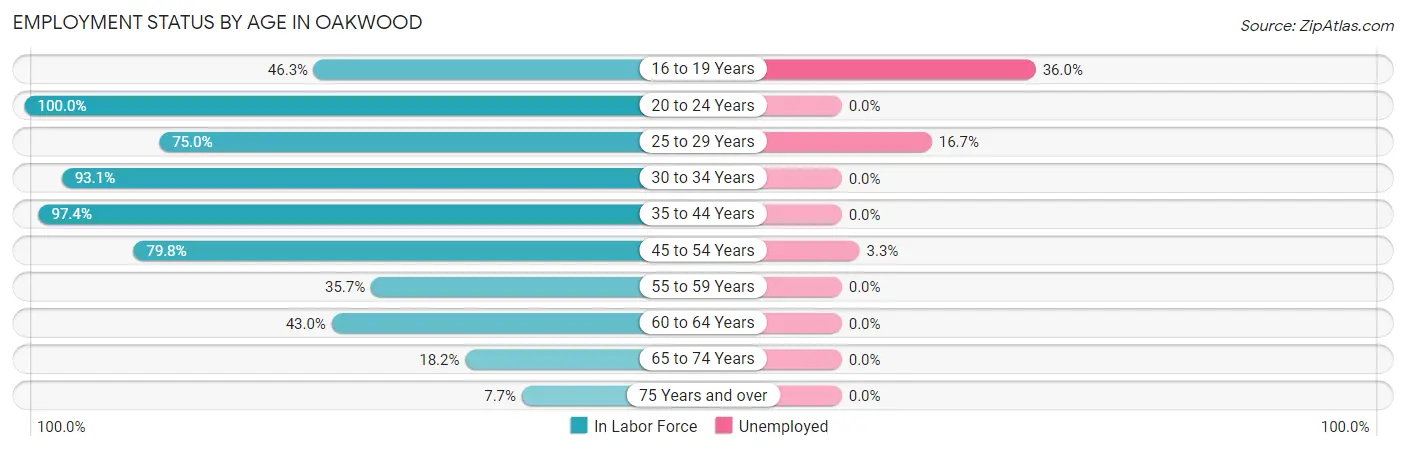
| Age Bracket | In Labor Force | Unemployed |
| 16 to 19 Years | 25 (46.3%) | 9 (36.0%) |
| 20 to 24 Years | 45 (100.0%) | 0 (0.0%) |
| 25 to 29 Years | 60 (75.0%) | 10 (16.7%) |
| 30 to 34 Years | 121 (93.1%) | 0 (0.0%) |
| 35 to 44 Years | 301 (97.4%) | 0 (0.0%) |
| 45 to 54 Years | 210 (79.8%) | 7 (3.3%) |
| 55 to 59 Years | 25 (35.7%) | 0 (0.0%) |
| 60 to 64 Years | 114 (43.0%) | 0 (0.0%) |
| 65 to 74 Years | 59 (18.2%) | 0 (0.0%) |
| 75 Years and over | 16 (7.7%) | 0 (0.0%) |
| Total | 976 (55.8%) | 26 (2.7%) |
Employment Status by Educational Attainment in Oakwood
According to labor force statistics for Oakwood, 74.4% of individuals (831) out of the total population between 25 and 64 years of age (1,117) are in the labor force, with 2.0% or 17 of them being unemployed. The group with the highest labor force participation rate are those with the educational attainment of bachelor's degree or higher, with 97.1% or 231 individuals in the labor force. Within the labor force, individuals with bachelor's degree or higher education have the highest percentage of unemployment, with 4.3% or 10 of them being unemployed.
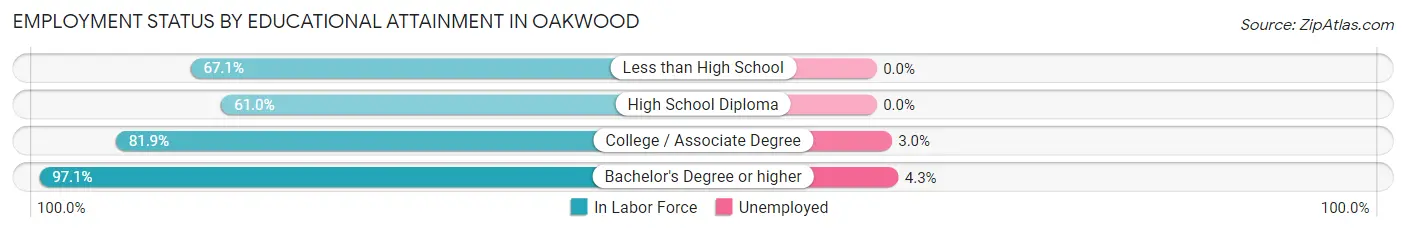
| Educational Attainment | In Labor Force | Unemployed |
| Less than High School | 57 (67.1%) | 0 (0.0%) |
| High School Diploma | 313 (61.0%) | 0 (0.0%) |
| College / Associate Degree | 230 (81.9%) | 8 (3.0%) |
| Bachelor's Degree or higher | 231 (97.1%) | 10 (4.3%) |
| Total | 831 (74.4%) | 22 (2.0%) |
Employment Occupations by Sex in Oakwood
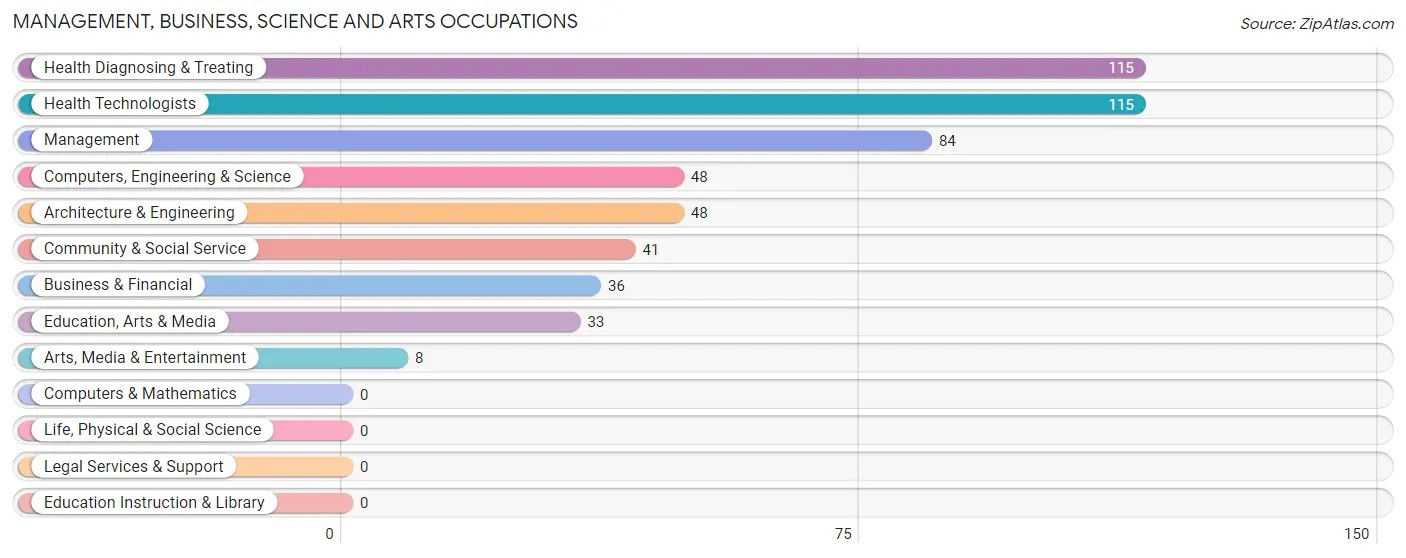
Management, Business, Science and Arts Occupations
The most common Management, Business, Science and Arts occupations in Oakwood are Health Diagnosing & Treating (115 | 12.1%), Health Technologists (115 | 12.1%), Management (84 | 8.8%), Computers, Engineering & Science (48 | 5.1%), and Architecture & Engineering (48 | 5.1%).
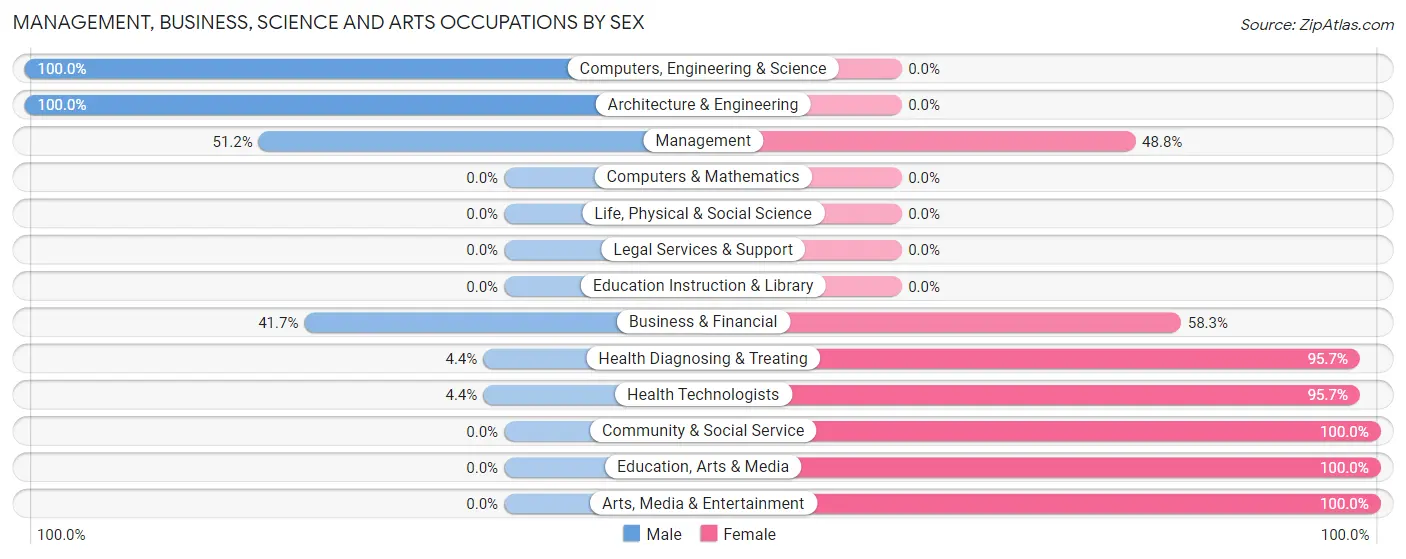
Management, Business, Science and Arts Occupations by Sex
Within the Management, Business, Science and Arts occupations in Oakwood, the most male-oriented occupations are Computers, Engineering & Science (100.0%), Architecture & Engineering (100.0%), and Management (51.2%), while the most female-oriented occupations are Community & Social Service (100.0%), Education, Arts & Media (100.0%), and Arts, Media & Entertainment (100.0%).
| Occupation | Male | Female |
| Management | 43 (51.2%) | 41 (48.8%) |
| Business & Financial | 15 (41.7%) | 21 (58.3%) |
| Computers, Engineering & Science | 48 (100.0%) | 0 (0.0%) |
| Computers & Mathematics | 0 (0.0%) | 0 (0.0%) |
| Architecture & Engineering | 48 (100.0%) | 0 (0.0%) |
| Life, Physical & Social Science | 0 (0.0%) | 0 (0.0%) |
| Community & Social Service | 0 (0.0%) | 41 (100.0%) |
| Education, Arts & Media | 0 (0.0%) | 33 (100.0%) |
| Legal Services & Support | 0 (0.0%) | 0 (0.0%) |
| Education Instruction & Library | 0 (0.0%) | 0 (0.0%) |
| Arts, Media & Entertainment | 0 (0.0%) | 8 (100.0%) |
| Health Diagnosing & Treating | 5 (4.3%) | 110 (95.7%) |
| Health Technologists | 5 (4.3%) | 110 (95.7%) |
| Total (Category) | 111 (34.3%) | 213 (65.7%) |
| Total (Overall) | 479 (50.4%) | 471 (49.6%) |
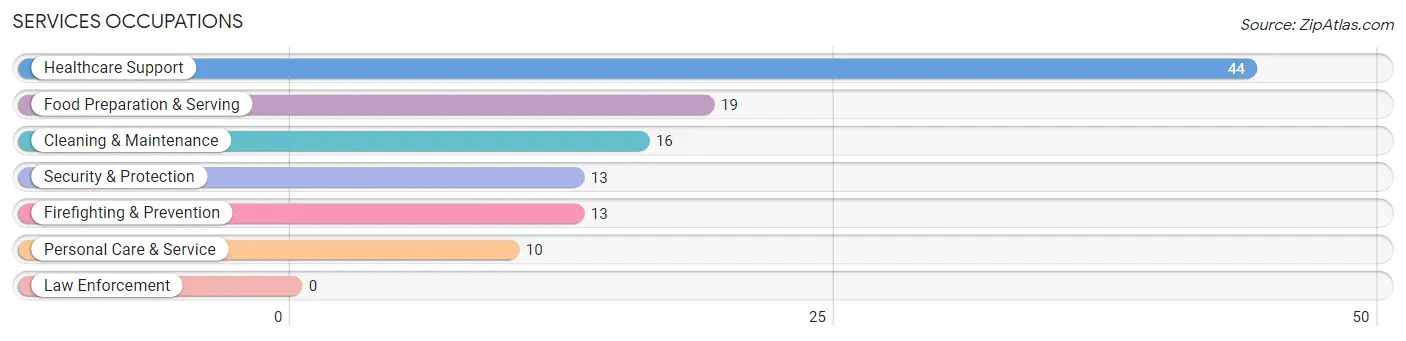
Services Occupations
The most common Services occupations in Oakwood are Healthcare Support (44 | 4.6%), Food Preparation & Serving (19 | 2.0%), Cleaning & Maintenance (16 | 1.7%), Security & Protection (13 | 1.4%), and Firefighting & Prevention (13 | 1.4%).
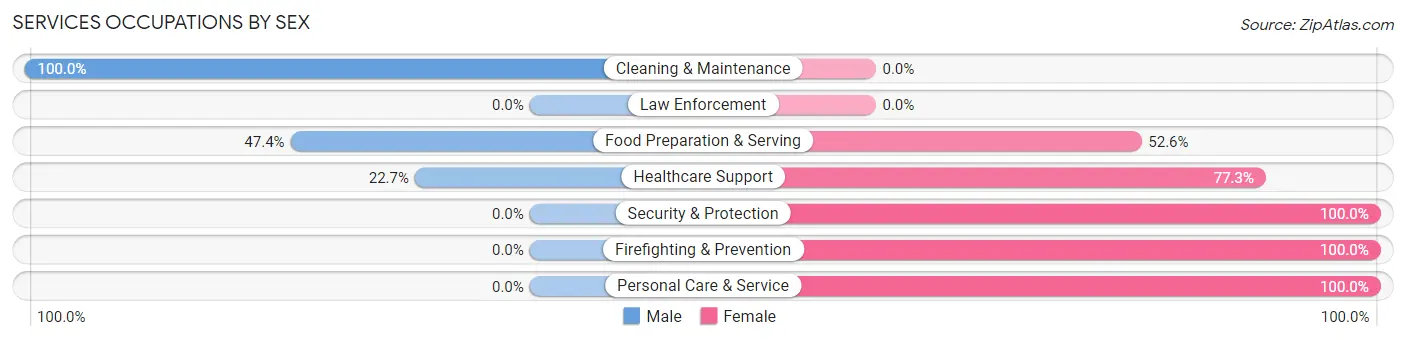
Services Occupations by Sex
Within the Services occupations in Oakwood, the most male-oriented occupations are Cleaning & Maintenance (100.0%), Food Preparation & Serving (47.4%), and Healthcare Support (22.7%), while the most female-oriented occupations are Security & Protection (100.0%), Firefighting & Prevention (100.0%), and Personal Care & Service (100.0%).
| Occupation | Male | Female |
| Healthcare Support | 10 (22.7%) | 34 (77.3%) |
| Security & Protection | 0 (0.0%) | 13 (100.0%) |
| Firefighting & Prevention | 0 (0.0%) | 13 (100.0%) |
| Law Enforcement | 0 (0.0%) | 0 (0.0%) |
| Food Preparation & Serving | 9 (47.4%) | 10 (52.6%) |
| Cleaning & Maintenance | 16 (100.0%) | 0 (0.0%) |
| Personal Care & Service | 0 (0.0%) | 10 (100.0%) |
| Total (Category) | 35 (34.3%) | 67 (65.7%) |
| Total (Overall) | 479 (50.4%) | 471 (49.6%) |
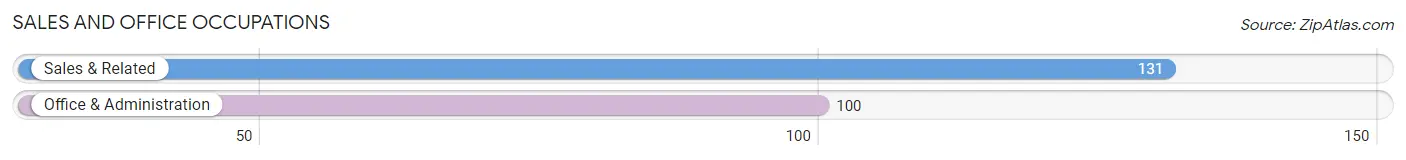
Sales and Office Occupations
The most common Sales and Office occupations in Oakwood are Sales & Related (131 | 13.8%), and Office & Administration (100 | 10.5%).
Sales and Office Occupations by Sex
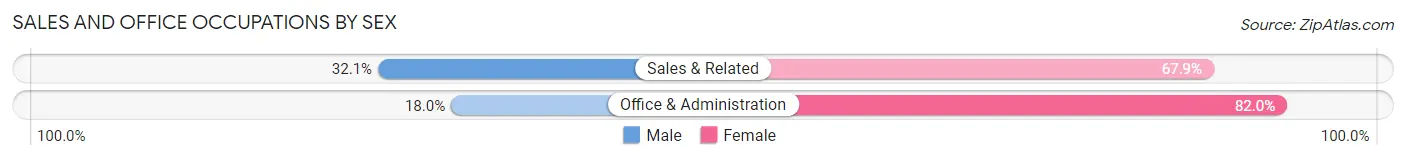
| Occupation | Male | Female |
| Sales & Related | 42 (32.1%) | 89 (67.9%) |
| Office & Administration | 18 (18.0%) | 82 (82.0%) |
| Total (Category) | 60 (26.0%) | 171 (74.0%) |
| Total (Overall) | 479 (50.4%) | 471 (49.6%) |
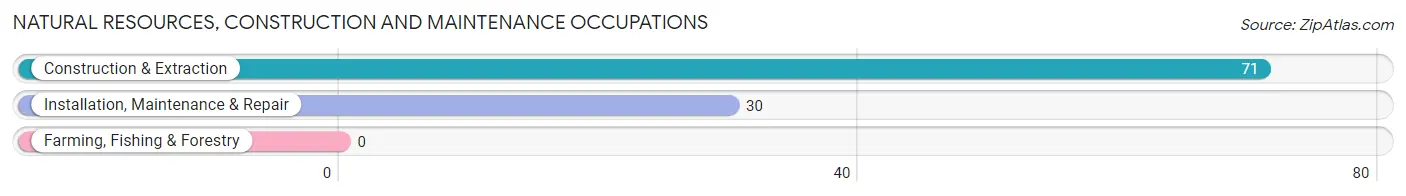
Natural Resources, Construction and Maintenance Occupations
The most common Natural Resources, Construction and Maintenance occupations in Oakwood are Construction & Extraction (71 | 7.5%), and Installation, Maintenance & Repair (30 | 3.2%).
Natural Resources, Construction and Maintenance Occupations by Sex
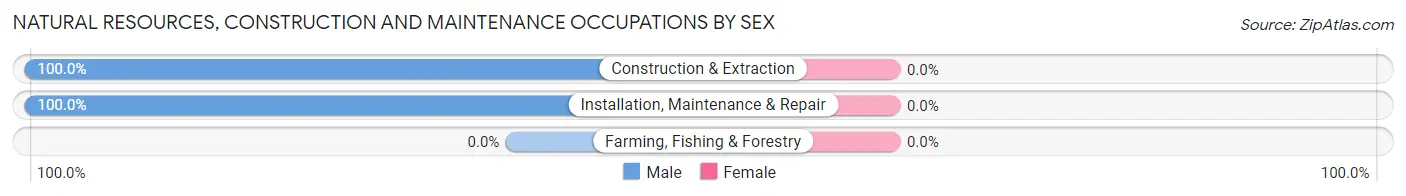
| Occupation | Male | Female |
| Farming, Fishing & Forestry | 0 (0.0%) | 0 (0.0%) |
| Construction & Extraction | 71 (100.0%) | 0 (0.0%) |
| Installation, Maintenance & Repair | 30 (100.0%) | 0 (0.0%) |
| Total (Category) | 101 (100.0%) | 0 (0.0%) |
| Total (Overall) | 479 (50.4%) | 471 (49.6%) |
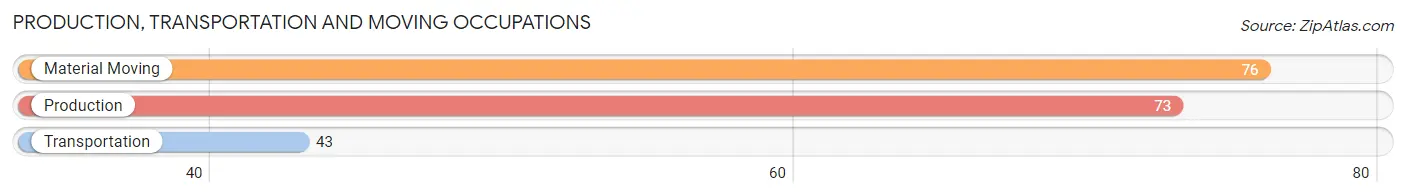
Production, Transportation and Moving Occupations
The most common Production, Transportation and Moving occupations in Oakwood are Material Moving (76 | 8.0%), Production (73 | 7.7%), and Transportation (43 | 4.5%).
Production, Transportation and Moving Occupations by Sex
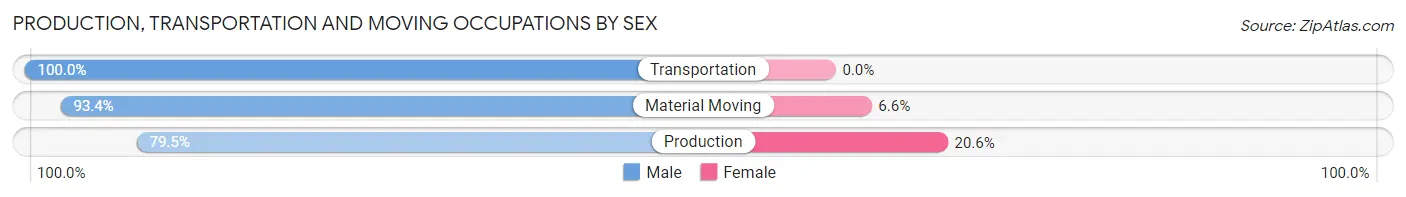
| Occupation | Male | Female |
| Production | 58 (79.4%) | 15 (20.5%) |
| Transportation | 43 (100.0%) | 0 (0.0%) |
| Material Moving | 71 (93.4%) | 5 (6.6%) |
| Total (Category) | 172 (89.6%) | 20 (10.4%) |
| Total (Overall) | 479 (50.4%) | 471 (49.6%) |
Employment Industries by Sex in Oakwood
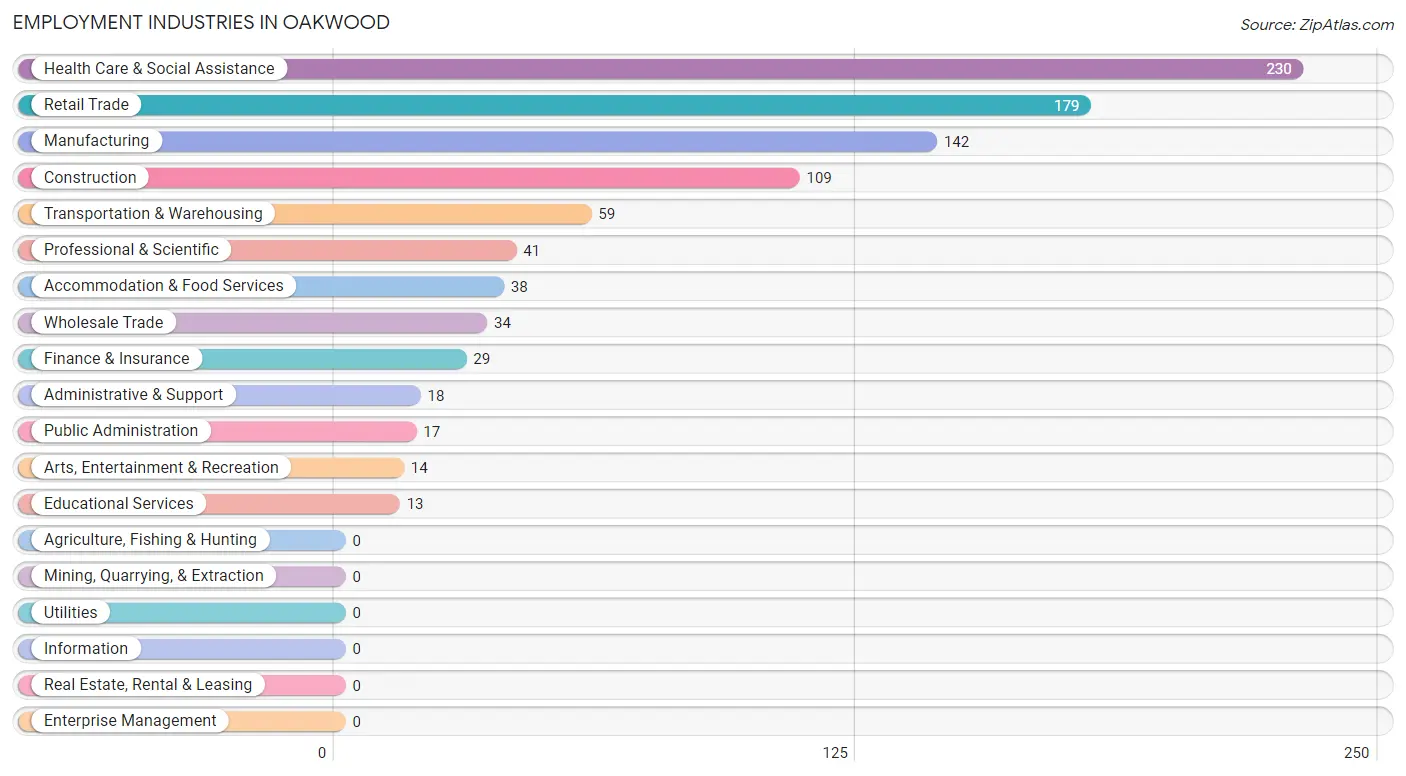
Employment Industries in Oakwood
The major employment industries in Oakwood include Health Care & Social Assistance (230 | 24.2%), Retail Trade (179 | 18.8%), Manufacturing (142 | 14.9%), Construction (109 | 11.5%), and Transportation & Warehousing (59 | 6.2%).
Employment Industries by Sex in Oakwood
The Oakwood industries that see more men than women are Professional & Scientific (100.0%), Arts, Entertainment & Recreation (100.0%), and Accommodation & Food Services (86.8%), whereas the industries that tend to have a higher number of women are Educational Services (100.0%), Health Care & Social Assistance (93.0%), and Public Administration (76.5%).
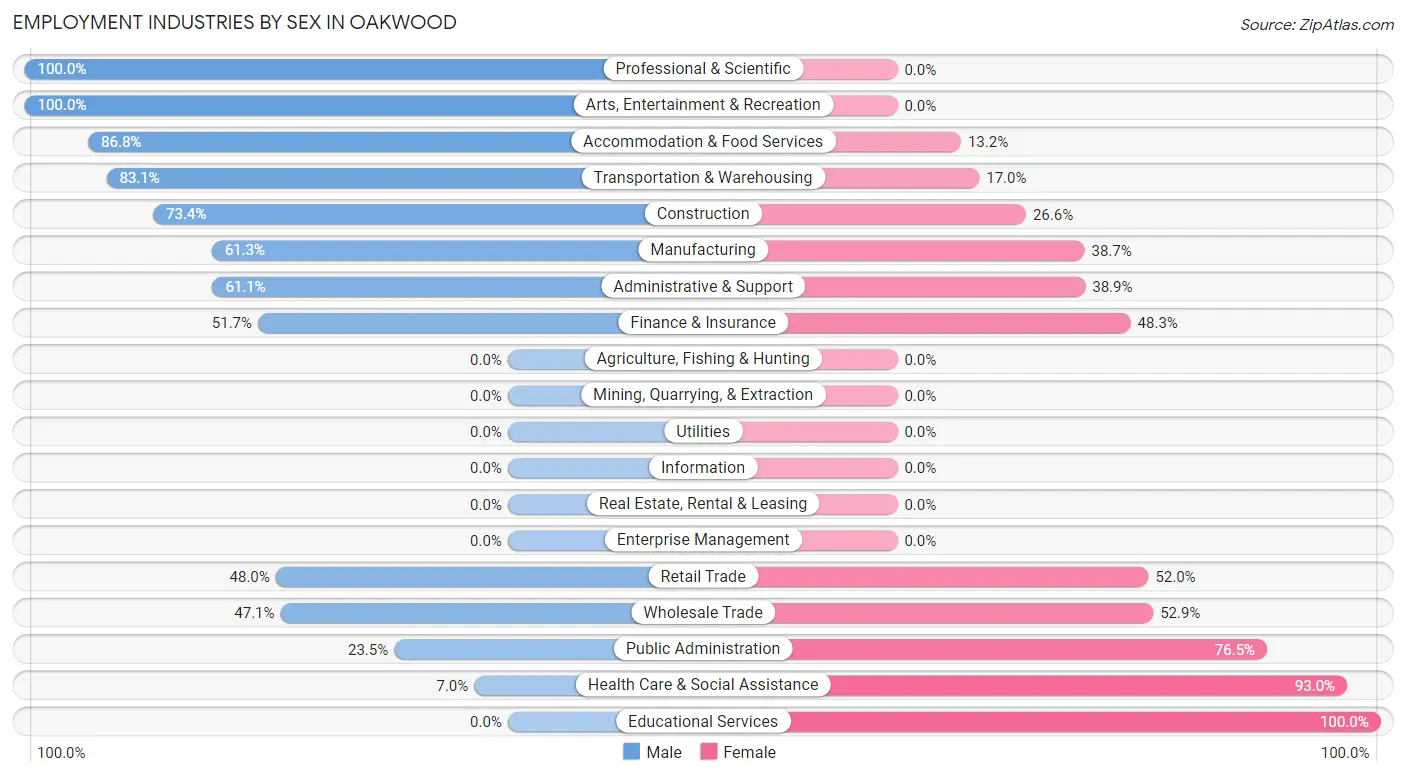
| Industry | Male | Female |
| Agriculture, Fishing & Hunting | 0 (0.0%) | 0 (0.0%) |
| Mining, Quarrying, & Extraction | 0 (0.0%) | 0 (0.0%) |
| Construction | 80 (73.4%) | 29 (26.6%) |
| Manufacturing | 87 (61.3%) | 55 (38.7%) |
| Wholesale Trade | 16 (47.1%) | 18 (52.9%) |
| Retail Trade | 86 (48.0%) | 93 (52.0%) |
| Transportation & Warehousing | 49 (83.1%) | 10 (17.0%) |
| Utilities | 0 (0.0%) | 0 (0.0%) |
| Information | 0 (0.0%) | 0 (0.0%) |
| Finance & Insurance | 15 (51.7%) | 14 (48.3%) |
| Real Estate, Rental & Leasing | 0 (0.0%) | 0 (0.0%) |
| Professional & Scientific | 41 (100.0%) | 0 (0.0%) |
| Enterprise Management | 0 (0.0%) | 0 (0.0%) |
| Administrative & Support | 11 (61.1%) | 7 (38.9%) |
| Educational Services | 0 (0.0%) | 13 (100.0%) |
| Health Care & Social Assistance | 16 (7.0%) | 214 (93.0%) |
| Arts, Entertainment & Recreation | 14 (100.0%) | 0 (0.0%) |
| Accommodation & Food Services | 33 (86.8%) | 5 (13.2%) |
| Public Administration | 4 (23.5%) | 13 (76.5%) |
| Total | 479 (50.4%) | 471 (49.6%) |
Education in Oakwood
School Enrollment in Oakwood
The most common levels of schooling among the 442 students in Oakwood are elementary school (185 | 41.9%), middle school (148 | 33.5%), and high school (79 | 17.9%).
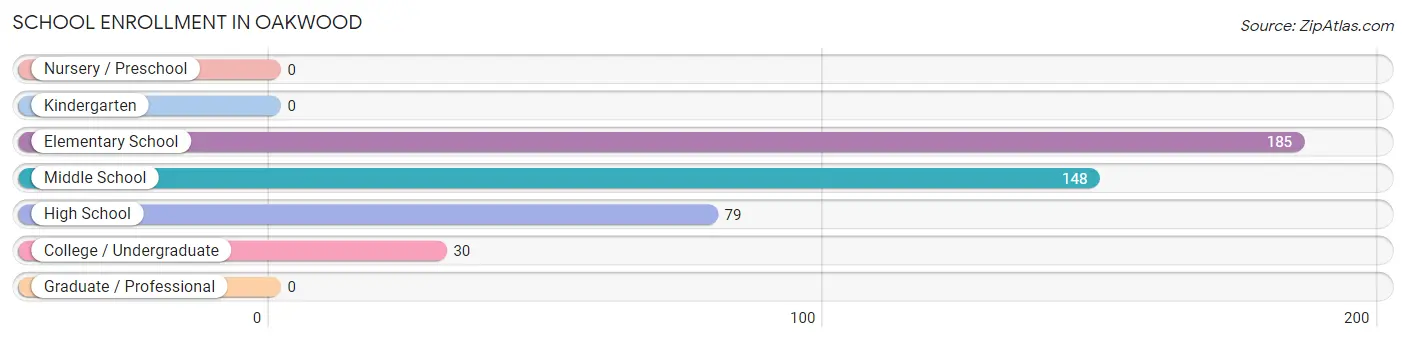
| School Level | # Students | % Students |
| Nursery / Preschool | 0 | 0.0% |
| Kindergarten | 0 | 0.0% |
| Elementary School | 185 | 41.9% |
| Middle School | 148 | 33.5% |
| High School | 79 | 17.9% |
| College / Undergraduate | 30 | 6.8% |
| Graduate / Professional | 0 | 0.0% |
| Total | 442 | 100.0% |
School Enrollment by Age by Funding Source in Oakwood
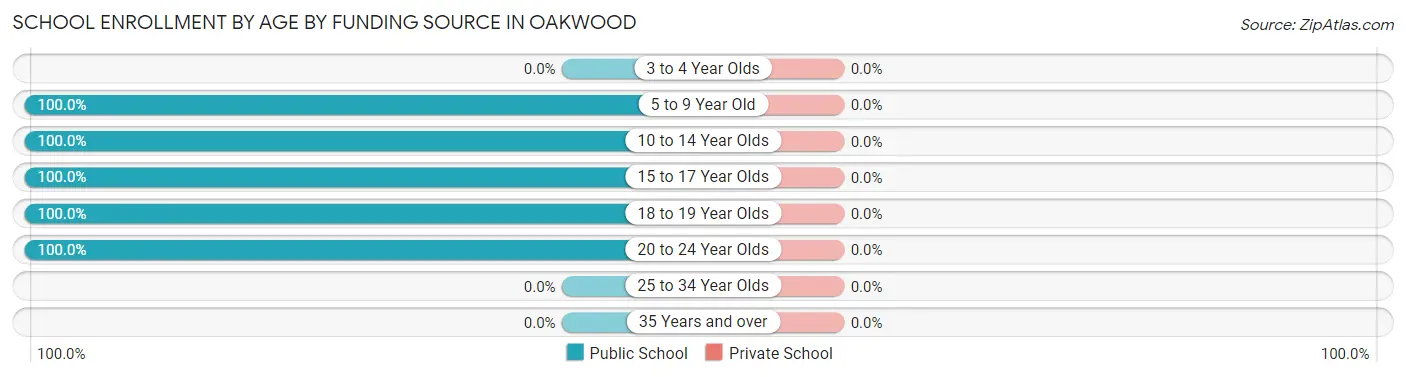
| Age Bracket | Public School | Private School |
| 3 to 4 Year Olds | 0 (0.0%) | 0 (0.0%) |
| 5 to 9 Year Old | 164 (100.0%) | 0 (0.0%) |
| 10 to 14 Year Olds | 177 (100.0%) | 0 (0.0%) |
| 15 to 17 Year Olds | 68 (100.0%) | 0 (0.0%) |
| 18 to 19 Year Olds | 13 (100.0%) | 0 (0.0%) |
| 20 to 24 Year Olds | 20 (100.0%) | 0 (0.0%) |
| 25 to 34 Year Olds | 0 (0.0%) | 0 (0.0%) |
| 35 Years and over | 0 (0.0%) | 0 (0.0%) |
| Total | 442 (100.0%) | 0 (0.0%) |
Educational Attainment by Field of Study in Oakwood
Science & technology (98 | 23.7%), business (96 | 23.2%), education (72 | 17.4%), engineering (71 | 17.2%), and bio, nature & agricultural (33 | 8.0%) are the most common fields of study among 414 individuals in Oakwood who have obtained a bachelor's degree or higher.
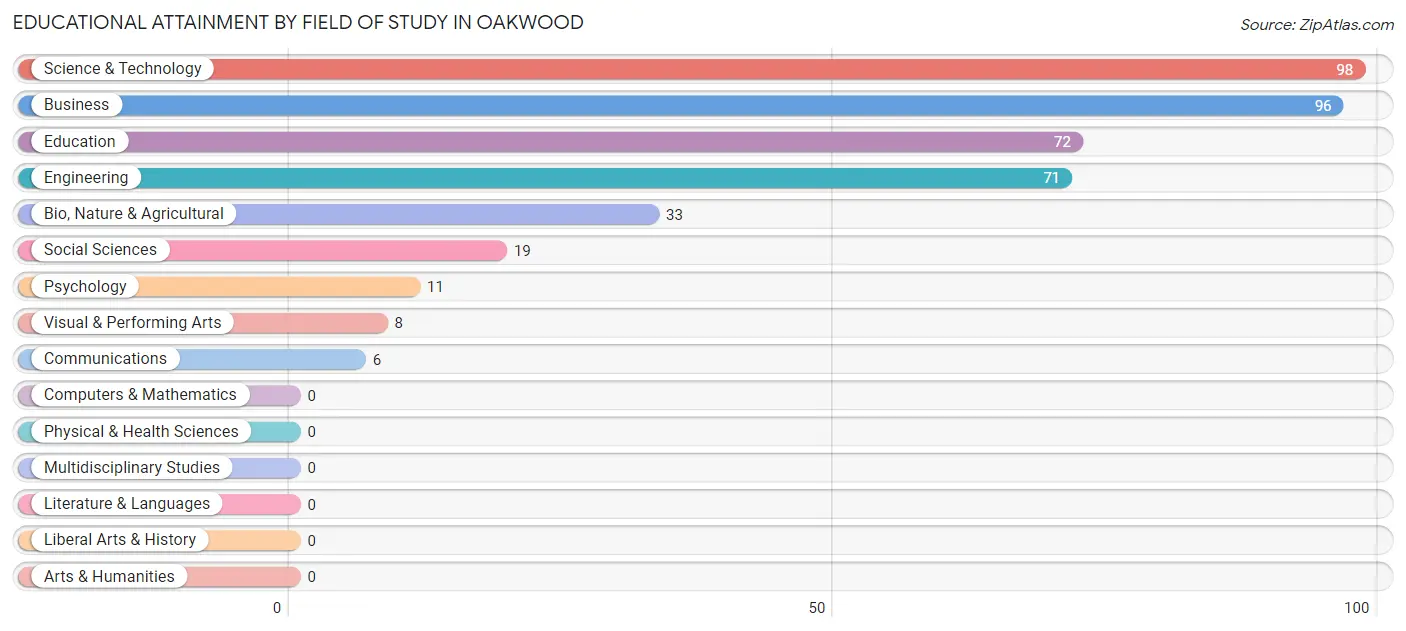
| Field of Study | # Graduates | % Graduates |
| Computers & Mathematics | 0 | 0.0% |
| Bio, Nature & Agricultural | 33 | 8.0% |
| Physical & Health Sciences | 0 | 0.0% |
| Psychology | 11 | 2.7% |
| Social Sciences | 19 | 4.6% |
| Engineering | 71 | 17.2% |
| Multidisciplinary Studies | 0 | 0.0% |
| Science & Technology | 98 | 23.7% |
| Business | 96 | 23.2% |
| Education | 72 | 17.4% |
| Literature & Languages | 0 | 0.0% |
| Liberal Arts & History | 0 | 0.0% |
| Visual & Performing Arts | 8 | 1.9% |
| Communications | 6 | 1.5% |
| Arts & Humanities | 0 | 0.0% |
| Total | 414 | 100.0% |
Transportation & Commute in Oakwood
Vehicle Availability by Sex in Oakwood
The most prevalent vehicle ownership categories in Oakwood are males with 2 vehicles (217, accounting for 46.5%) and females with 2 vehicles (191, making up 50.2%).
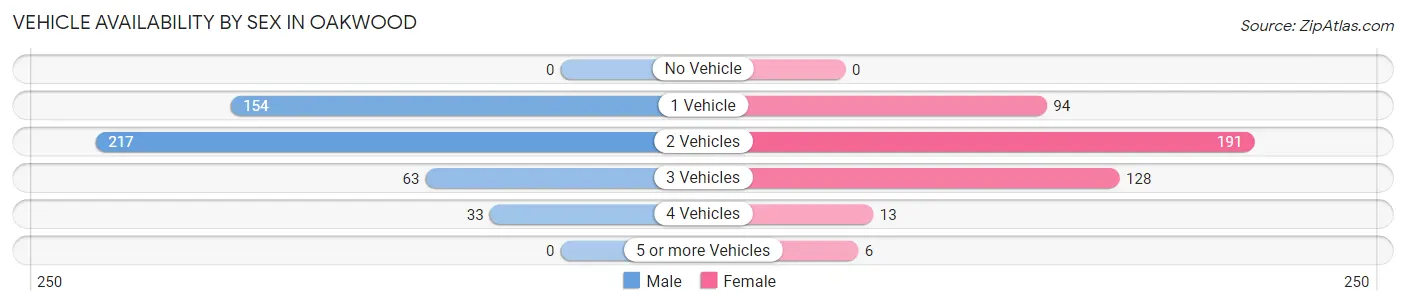
| Vehicles Available | Male | Female |
| No Vehicle | 0 (0.0%) | 0 (0.0%) |
| 1 Vehicle | 154 (33.0%) | 94 (21.8%) |
| 2 Vehicles | 217 (46.5%) | 191 (44.2%) |
| 3 Vehicles | 63 (13.5%) | 128 (29.6%) |
| 4 Vehicles | 33 (7.1%) | 13 (3.0%) |
| 5 or more Vehicles | 0 (0.0%) | 6 (1.4%) |
| Total | 467 (100.0%) | 432 (100.0%) |
Commute Time in Oakwood
The most frequently occuring commute durations in Oakwood are 5 to 9 minutes (217 commuters, 28.9%), 20 to 24 minutes (157 commuters, 20.9%), and 10 to 14 minutes (101 commuters, 13.4%).
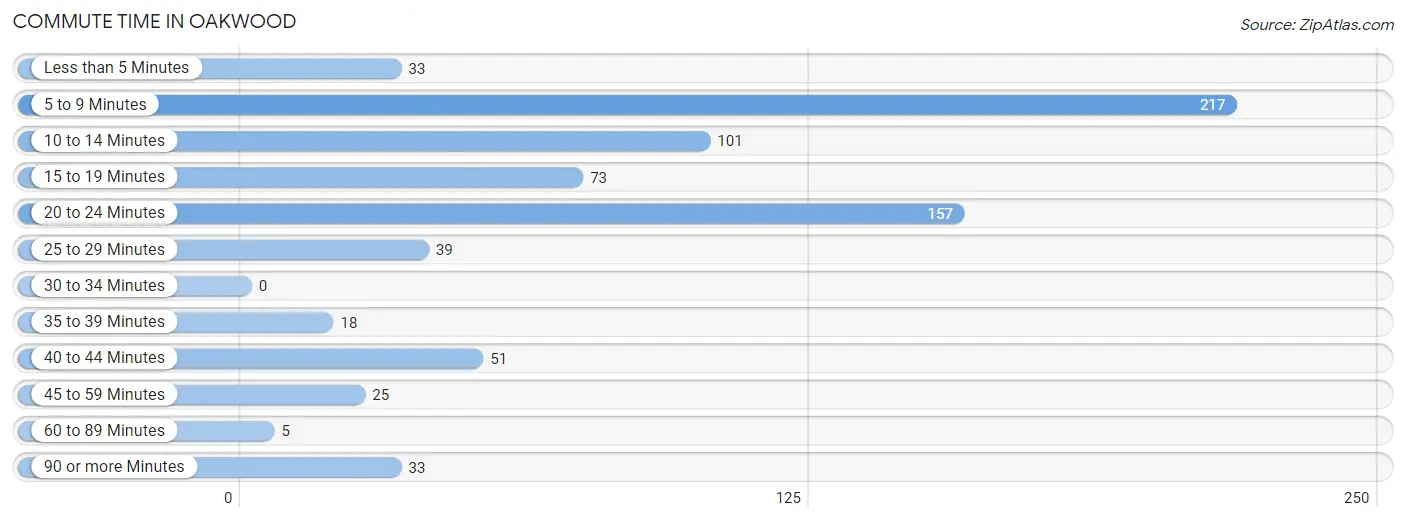
| Commute Time | # Commuters | % Commuters |
| Less than 5 Minutes | 33 | 4.4% |
| 5 to 9 Minutes | 217 | 28.9% |
| 10 to 14 Minutes | 101 | 13.4% |
| 15 to 19 Minutes | 73 | 9.7% |
| 20 to 24 Minutes | 157 | 20.9% |
| 25 to 29 Minutes | 39 | 5.2% |
| 30 to 34 Minutes | 0 | 0.0% |
| 35 to 39 Minutes | 18 | 2.4% |
| 40 to 44 Minutes | 51 | 6.8% |
| 45 to 59 Minutes | 25 | 3.3% |
| 60 to 89 Minutes | 5 | 0.7% |
| 90 or more Minutes | 33 | 4.4% |
Commute Time by Sex in Oakwood
The most common commute times in Oakwood are 5 to 9 minutes (143 commuters, 35.0%) for males and 20 to 24 minutes (100 commuters, 29.1%) for females.
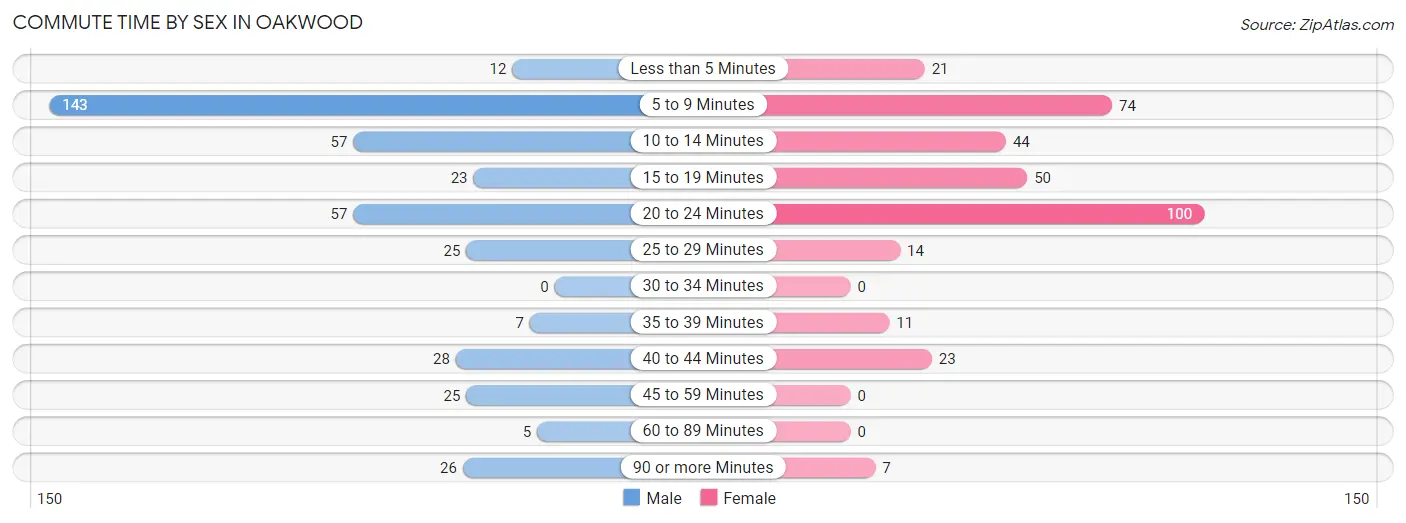
| Commute Time | Male | Female |
| Less than 5 Minutes | 12 (2.9%) | 21 (6.1%) |
| 5 to 9 Minutes | 143 (35.0%) | 74 (21.5%) |
| 10 to 14 Minutes | 57 (14.0%) | 44 (12.8%) |
| 15 to 19 Minutes | 23 (5.6%) | 50 (14.5%) |
| 20 to 24 Minutes | 57 (14.0%) | 100 (29.1%) |
| 25 to 29 Minutes | 25 (6.1%) | 14 (4.1%) |
| 30 to 34 Minutes | 0 (0.0%) | 0 (0.0%) |
| 35 to 39 Minutes | 7 (1.7%) | 11 (3.2%) |
| 40 to 44 Minutes | 28 (6.9%) | 23 (6.7%) |
| 45 to 59 Minutes | 25 (6.1%) | 0 (0.0%) |
| 60 to 89 Minutes | 5 (1.2%) | 0 (0.0%) |
| 90 or more Minutes | 26 (6.4%) | 7 (2.0%) |
Time of Departure to Work by Sex in Oakwood
The most frequent times of departure to work in Oakwood are 4:00 PM to 11:59 PM (63, 15.4%) for males and 7:00 AM to 7:29 AM (86, 25.0%) for females.
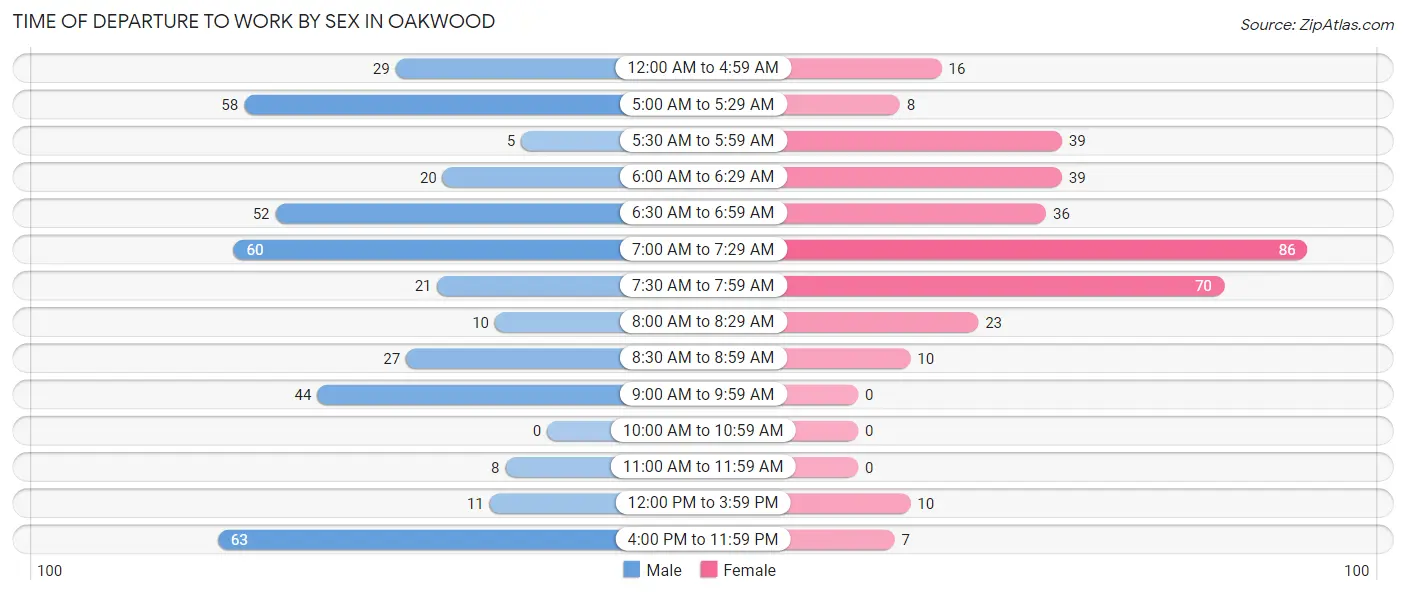
| Time of Departure | Male | Female |
| 12:00 AM to 4:59 AM | 29 (7.1%) | 16 (4.6%) |
| 5:00 AM to 5:29 AM | 58 (14.2%) | 8 (2.3%) |
| 5:30 AM to 5:59 AM | 5 (1.2%) | 39 (11.3%) |
| 6:00 AM to 6:29 AM | 20 (4.9%) | 39 (11.3%) |
| 6:30 AM to 6:59 AM | 52 (12.8%) | 36 (10.5%) |
| 7:00 AM to 7:29 AM | 60 (14.7%) | 86 (25.0%) |
| 7:30 AM to 7:59 AM | 21 (5.1%) | 70 (20.3%) |
| 8:00 AM to 8:29 AM | 10 (2.5%) | 23 (6.7%) |
| 8:30 AM to 8:59 AM | 27 (6.6%) | 10 (2.9%) |
| 9:00 AM to 9:59 AM | 44 (10.8%) | 0 (0.0%) |
| 10:00 AM to 10:59 AM | 0 (0.0%) | 0 (0.0%) |
| 11:00 AM to 11:59 AM | 8 (2.0%) | 0 (0.0%) |
| 12:00 PM to 3:59 PM | 11 (2.7%) | 10 (2.9%) |
| 4:00 PM to 11:59 PM | 63 (15.4%) | 7 (2.0%) |
| Total | 408 (100.0%) | 344 (100.0%) |
Housing Occupancy in Oakwood
Occupancy by Ownership in Oakwood
Of the total 887 dwellings in Oakwood, owner-occupied units account for 806 (90.9%), while renter-occupied units make up 81 (9.1%).
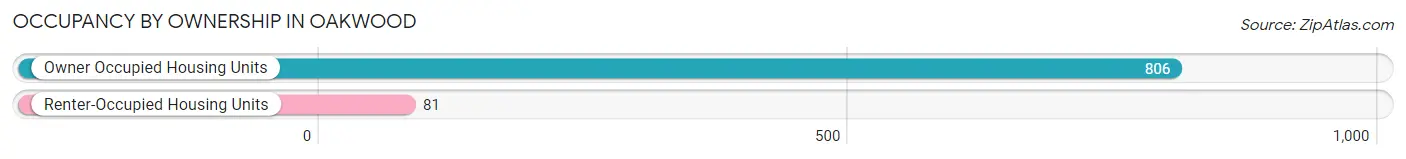
| Occupancy | # Housing Units | % Housing Units |
| Owner Occupied Housing Units | 806 | 90.9% |
| Renter-Occupied Housing Units | 81 | 9.1% |
| Total Occupied Housing Units | 887 | 100.0% |
Occupancy by Household Size in Oakwood
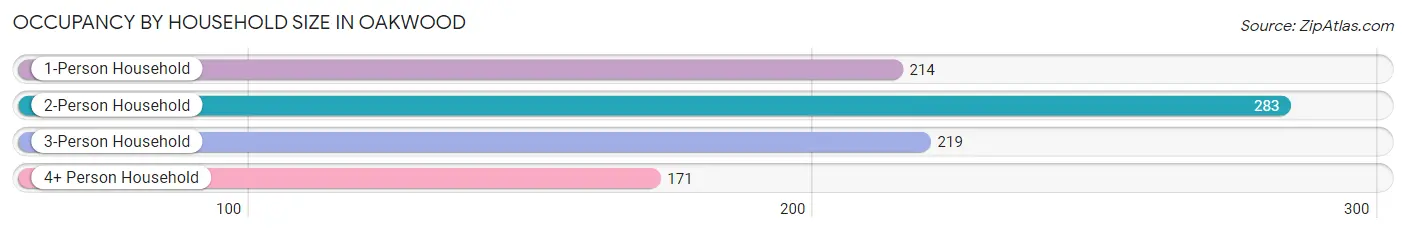
| Household Size | # Housing Units | % Housing Units |
| 1-Person Household | 214 | 24.1% |
| 2-Person Household | 283 | 31.9% |
| 3-Person Household | 219 | 24.7% |
| 4+ Person Household | 171 | 19.3% |
| Total Housing Units | 887 | 100.0% |
Occupancy by Ownership by Household Size in Oakwood
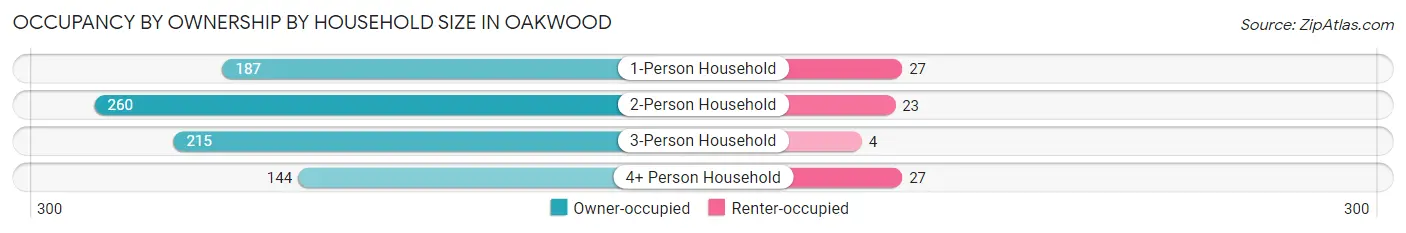
| Household Size | Owner-occupied | Renter-occupied |
| 1-Person Household | 187 (87.4%) | 27 (12.6%) |
| 2-Person Household | 260 (91.9%) | 23 (8.1%) |
| 3-Person Household | 215 (98.2%) | 4 (1.8%) |
| 4+ Person Household | 144 (84.2%) | 27 (15.8%) |
| Total Housing Units | 806 (90.9%) | 81 (9.1%) |
Occupancy by Educational Attainment in Oakwood
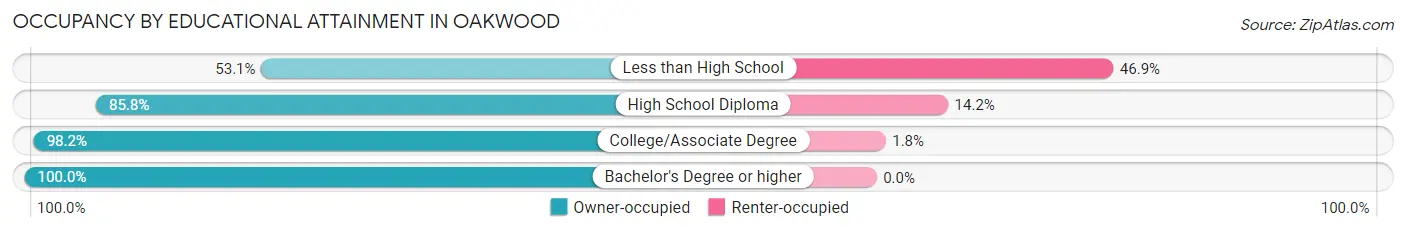
| Household Size | Owner-occupied | Renter-occupied |
| Less than High School | 26 (53.1%) | 23 (46.9%) |
| High School Diploma | 327 (85.8%) | 54 (14.2%) |
| College/Associate Degree | 217 (98.2%) | 4 (1.8%) |
| Bachelor's Degree or higher | 236 (100.0%) | 0 (0.0%) |
Occupancy by Age of Householder in Oakwood
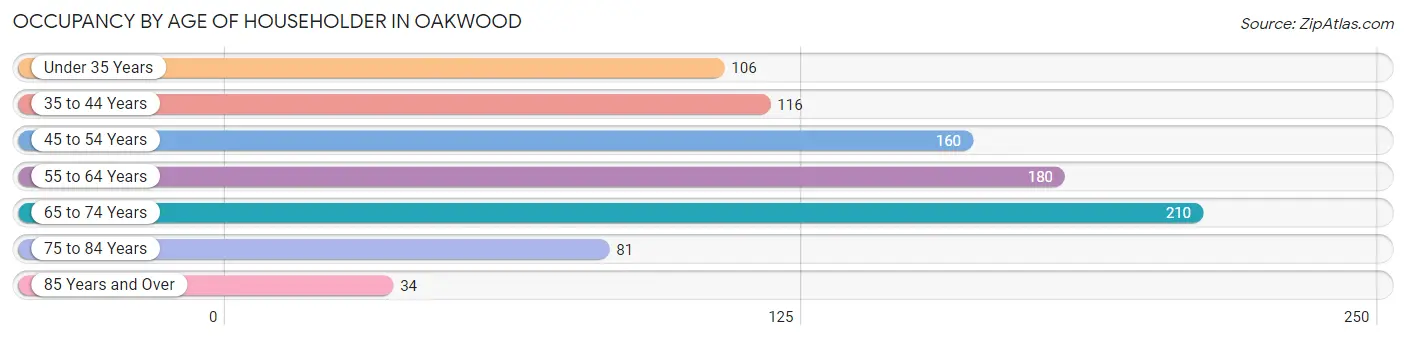
| Age Bracket | # Households | % Households |
| Under 35 Years | 106 | 11.9% |
| 35 to 44 Years | 116 | 13.1% |
| 45 to 54 Years | 160 | 18.0% |
| 55 to 64 Years | 180 | 20.3% |
| 65 to 74 Years | 210 | 23.7% |
| 75 to 84 Years | 81 | 9.1% |
| 85 Years and Over | 34 | 3.8% |
| Total | 887 | 100.0% |
Housing Finances in Oakwood
Median Income by Occupancy in Oakwood
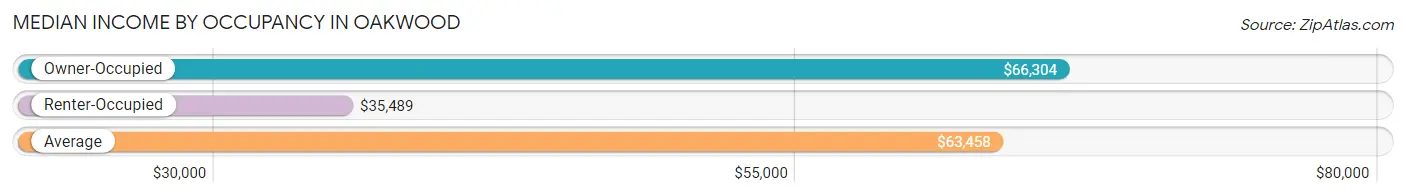
| Occupancy Type | # Households | Median Income |
| Owner-Occupied | 806 (90.9%) | $66,304 |
| Renter-Occupied | 81 (9.1%) | $35,489 |
| Average | 887 (100.0%) | $63,458 |
Occupancy by Householder Income Bracket in Oakwood
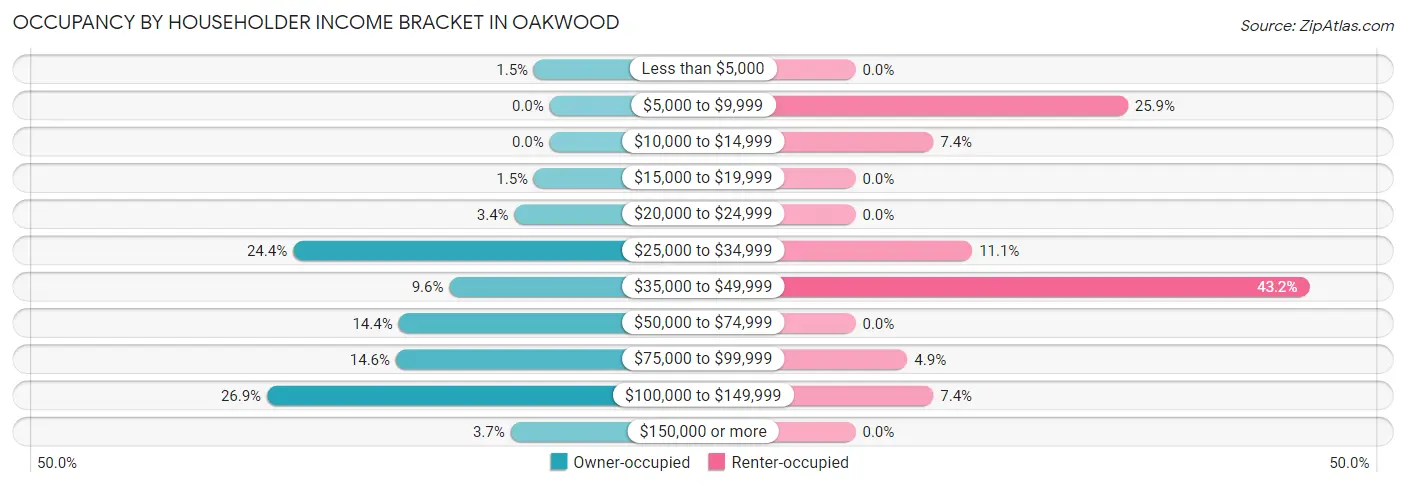
| Income Bracket | Owner-occupied | Renter-occupied |
| Less than $5,000 | 12 (1.5%) | 0 (0.0%) |
| $5,000 to $9,999 | 0 (0.0%) | 21 (25.9%) |
| $10,000 to $14,999 | 0 (0.0%) | 6 (7.4%) |
| $15,000 to $19,999 | 12 (1.5%) | 0 (0.0%) |
| $20,000 to $24,999 | 27 (3.4%) | 0 (0.0%) |
| $25,000 to $34,999 | 197 (24.4%) | 9 (11.1%) |
| $35,000 to $49,999 | 77 (9.6%) | 35 (43.2%) |
| $50,000 to $74,999 | 116 (14.4%) | 0 (0.0%) |
| $75,000 to $99,999 | 118 (14.6%) | 4 (4.9%) |
| $100,000 to $149,999 | 217 (26.9%) | 6 (7.4%) |
| $150,000 or more | 30 (3.7%) | 0 (0.0%) |
| Total | 806 (100.0%) | 81 (100.0%) |
Monthly Housing Cost Tiers in Oakwood
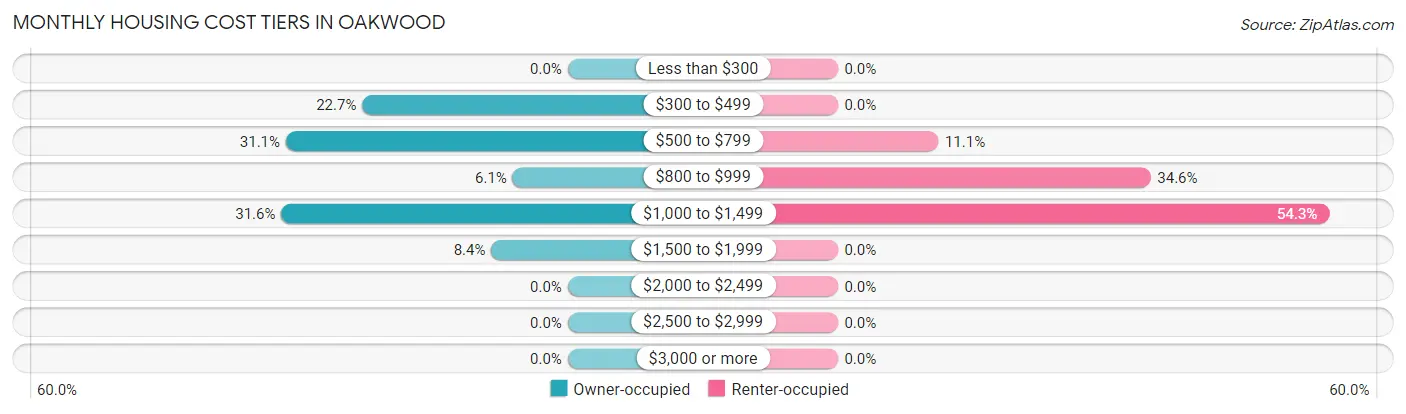
| Monthly Cost | Owner-occupied | Renter-occupied |
| Less than $300 | 0 (0.0%) | 0 (0.0%) |
| $300 to $499 | 183 (22.7%) | 0 (0.0%) |
| $500 to $799 | 251 (31.1%) | 9 (11.1%) |
| $800 to $999 | 49 (6.1%) | 28 (34.6%) |
| $1,000 to $1,499 | 255 (31.6%) | 44 (54.3%) |
| $1,500 to $1,999 | 68 (8.4%) | 0 (0.0%) |
| $2,000 to $2,499 | 0 (0.0%) | 0 (0.0%) |
| $2,500 to $2,999 | 0 (0.0%) | 0 (0.0%) |
| $3,000 or more | 0 (0.0%) | 0 (0.0%) |
| Total | 806 (100.0%) | 81 (100.0%) |
Physical Housing Characteristics in Oakwood
Housing Structures in Oakwood
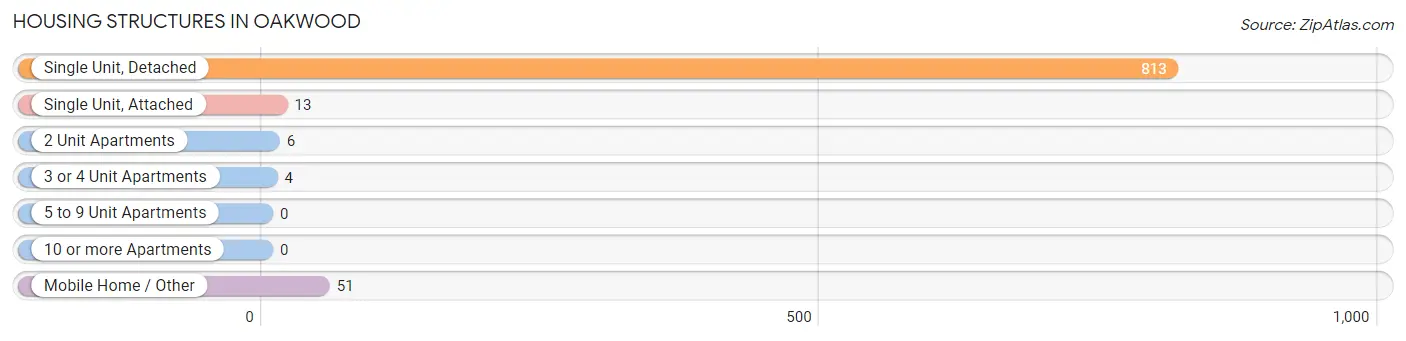
| Structure Type | # Housing Units | % Housing Units |
| Single Unit, Detached | 813 | 91.7% |
| Single Unit, Attached | 13 | 1.5% |
| 2 Unit Apartments | 6 | 0.7% |
| 3 or 4 Unit Apartments | 4 | 0.4% |
| 5 to 9 Unit Apartments | 0 | 0.0% |
| 10 or more Apartments | 0 | 0.0% |
| Mobile Home / Other | 51 | 5.8% |
| Total | 887 | 100.0% |
Housing Structures by Occupancy in Oakwood
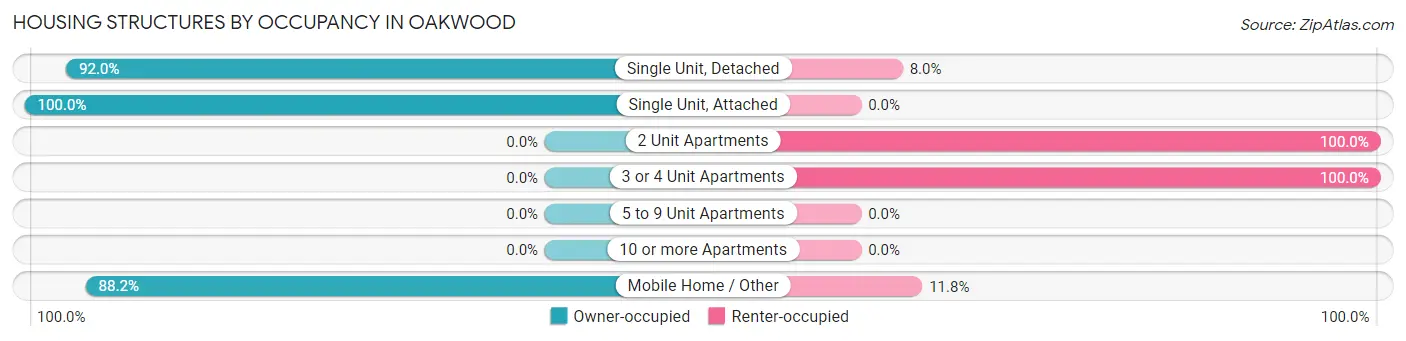
| Structure Type | Owner-occupied | Renter-occupied |
| Single Unit, Detached | 748 (92.0%) | 65 (8.0%) |
| Single Unit, Attached | 13 (100.0%) | 0 (0.0%) |
| 2 Unit Apartments | 0 (0.0%) | 6 (100.0%) |
| 3 or 4 Unit Apartments | 0 (0.0%) | 4 (100.0%) |
| 5 to 9 Unit Apartments | 0 (0.0%) | 0 (0.0%) |
| 10 or more Apartments | 0 (0.0%) | 0 (0.0%) |
| Mobile Home / Other | 45 (88.2%) | 6 (11.8%) |
| Total | 806 (90.9%) | 81 (9.1%) |
Housing Structures by Number of Rooms in Oakwood
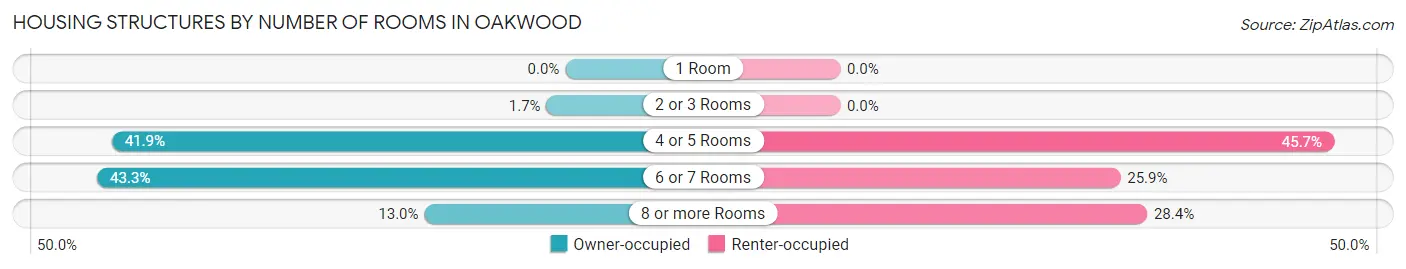
| Number of Rooms | Owner-occupied | Renter-occupied |
| 1 Room | 0 (0.0%) | 0 (0.0%) |
| 2 or 3 Rooms | 14 (1.7%) | 0 (0.0%) |
| 4 or 5 Rooms | 338 (41.9%) | 37 (45.7%) |
| 6 or 7 Rooms | 349 (43.3%) | 21 (25.9%) |
| 8 or more Rooms | 105 (13.0%) | 23 (28.4%) |
| Total | 806 (100.0%) | 81 (100.0%) |
Housing Structure by Heating Type in Oakwood
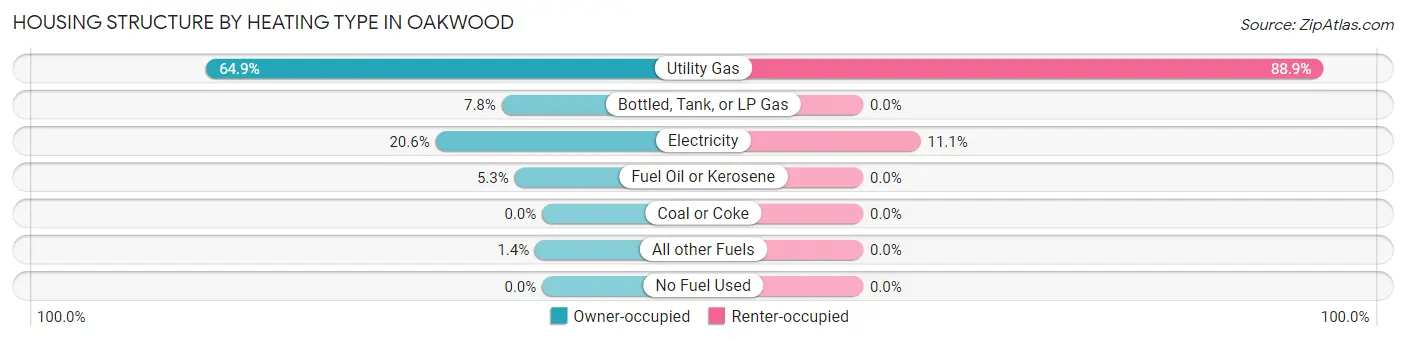
| Heating Type | Owner-occupied | Renter-occupied |
| Utility Gas | 523 (64.9%) | 72 (88.9%) |
| Bottled, Tank, or LP Gas | 63 (7.8%) | 0 (0.0%) |
| Electricity | 166 (20.6%) | 9 (11.1%) |
| Fuel Oil or Kerosene | 43 (5.3%) | 0 (0.0%) |
| Coal or Coke | 0 (0.0%) | 0 (0.0%) |
| All other Fuels | 11 (1.4%) | 0 (0.0%) |
| No Fuel Used | 0 (0.0%) | 0 (0.0%) |
| Total | 806 (100.0%) | 81 (100.0%) |
Household Vehicle Usage in Oakwood
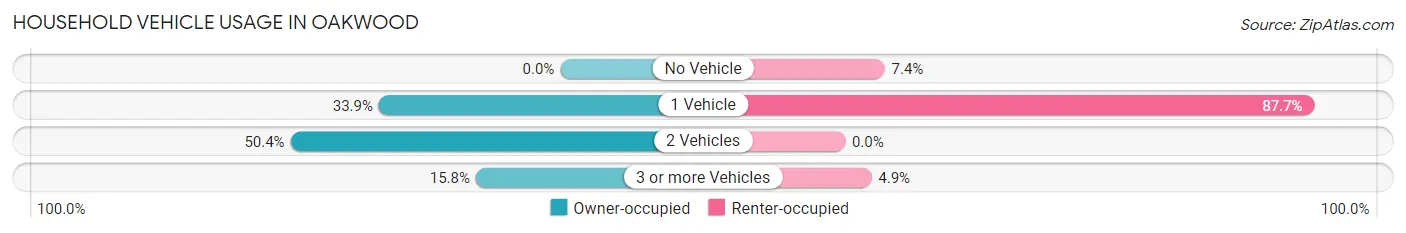
| Vehicles per Household | Owner-occupied | Renter-occupied |
| No Vehicle | 0 (0.0%) | 6 (7.4%) |
| 1 Vehicle | 273 (33.9%) | 71 (87.6%) |
| 2 Vehicles | 406 (50.4%) | 0 (0.0%) |
| 3 or more Vehicles | 127 (15.8%) | 4 (4.9%) |
| Total | 806 (100.0%) | 81 (100.0%) |
Real Estate & Mortgages in Oakwood
Real Estate and Mortgage Overview in Oakwood
| Characteristic | Without Mortgage | With Mortgage |
| Housing Units | 369 | 437 |
| Median Property Value | $107,300 | $107,400 |
| Median Household Income | $67,232 | $25 |
| Monthly Housing Costs | $503 | $0 |
| Real Estate Taxes | $1,555 | $0 |
Property Value by Mortgage Status in Oakwood
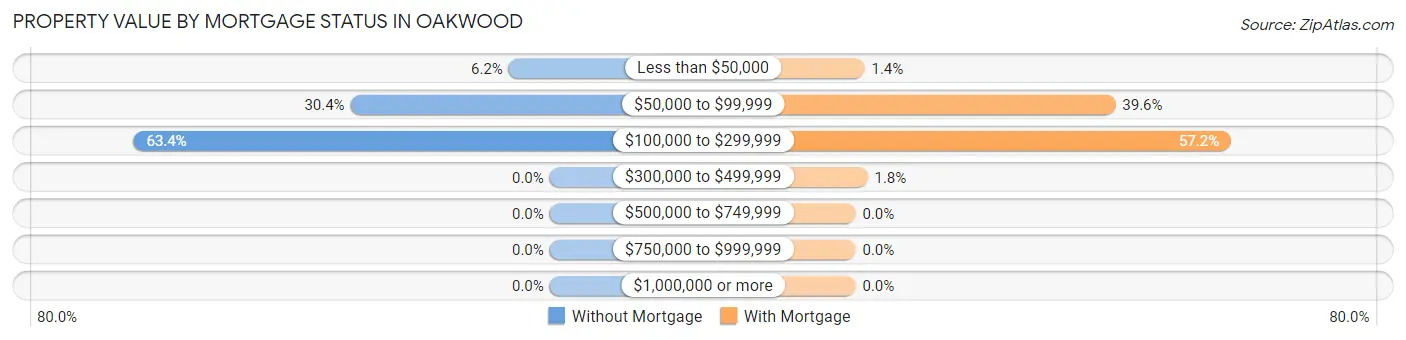
| Property Value | Without Mortgage | With Mortgage |
| Less than $50,000 | 23 (6.2%) | 6 (1.4%) |
| $50,000 to $99,999 | 112 (30.3%) | 173 (39.6%) |
| $100,000 to $299,999 | 234 (63.4%) | 250 (57.2%) |
| $300,000 to $499,999 | 0 (0.0%) | 8 (1.8%) |
| $500,000 to $749,999 | 0 (0.0%) | 0 (0.0%) |
| $750,000 to $999,999 | 0 (0.0%) | 0 (0.0%) |
| $1,000,000 or more | 0 (0.0%) | 0 (0.0%) |
| Total | 369 (100.0%) | 437 (100.0%) |
Household Income by Mortgage Status in Oakwood
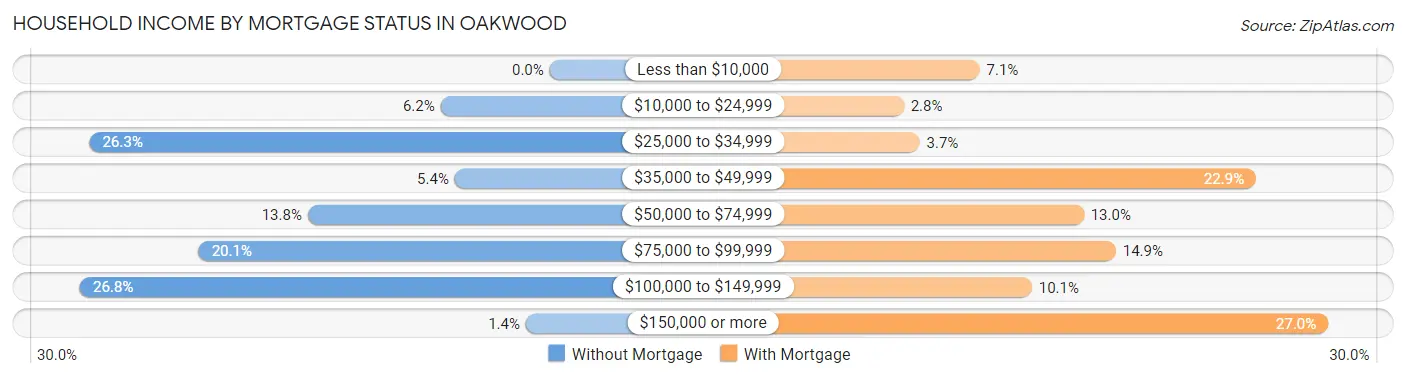
| Household Income | Without Mortgage | With Mortgage |
| Less than $10,000 | 0 (0.0%) | 31 (7.1%) |
| $10,000 to $24,999 | 23 (6.2%) | 12 (2.8%) |
| $25,000 to $34,999 | 97 (26.3%) | 16 (3.7%) |
| $35,000 to $49,999 | 20 (5.4%) | 100 (22.9%) |
| $50,000 to $74,999 | 51 (13.8%) | 57 (13.0%) |
| $75,000 to $99,999 | 74 (20.1%) | 65 (14.9%) |
| $100,000 to $149,999 | 99 (26.8%) | 44 (10.1%) |
| $150,000 or more | 5 (1.4%) | 118 (27.0%) |
| Total | 369 (100.0%) | 437 (100.0%) |
Property Value to Household Income Ratio in Oakwood
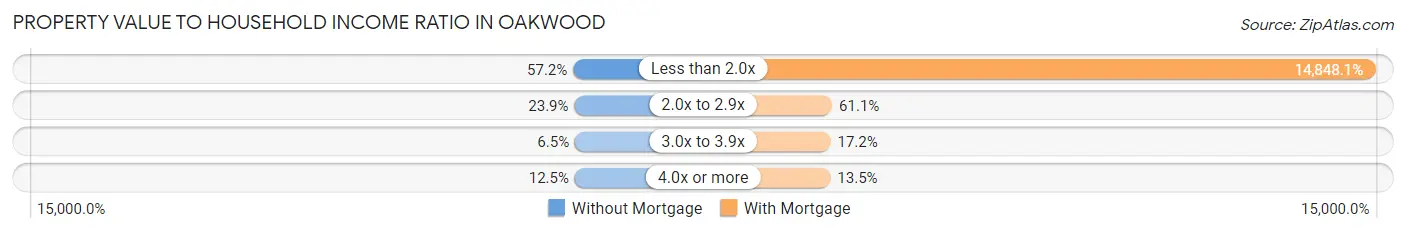
| Value-to-Income Ratio | Without Mortgage | With Mortgage |
| Less than 2.0x | 211 (57.2%) | 64,886 (14,848.1%) |
| 2.0x to 2.9x | 88 (23.8%) | 267 (61.1%) |
| 3.0x to 3.9x | 24 (6.5%) | 75 (17.2%) |
| 4.0x or more | 46 (12.5%) | 59 (13.5%) |
| Total | 369 (100.0%) | 437 (100.0%) |
Real Estate Taxes by Mortgage Status in Oakwood
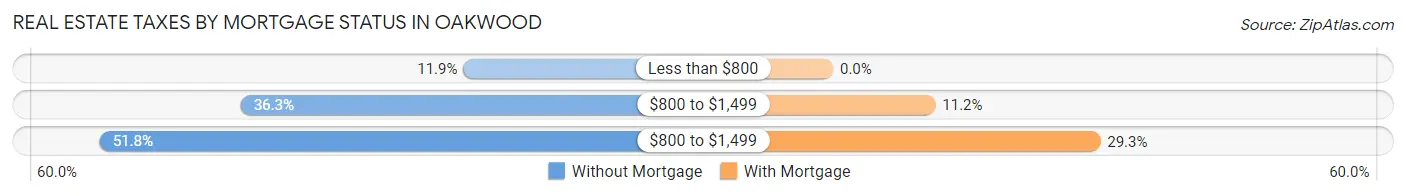
| Property Taxes | Without Mortgage | With Mortgage |
| Less than $800 | 44 (11.9%) | 0 (0.0%) |
| $800 to $1,499 | 134 (36.3%) | 49 (11.2%) |
| $800 to $1,499 | 191 (51.8%) | 128 (29.3%) |
| Total | 369 (100.0%) | 437 (100.0%) |
Health & Disability in Oakwood
Health Insurance Coverage by Age in Oakwood
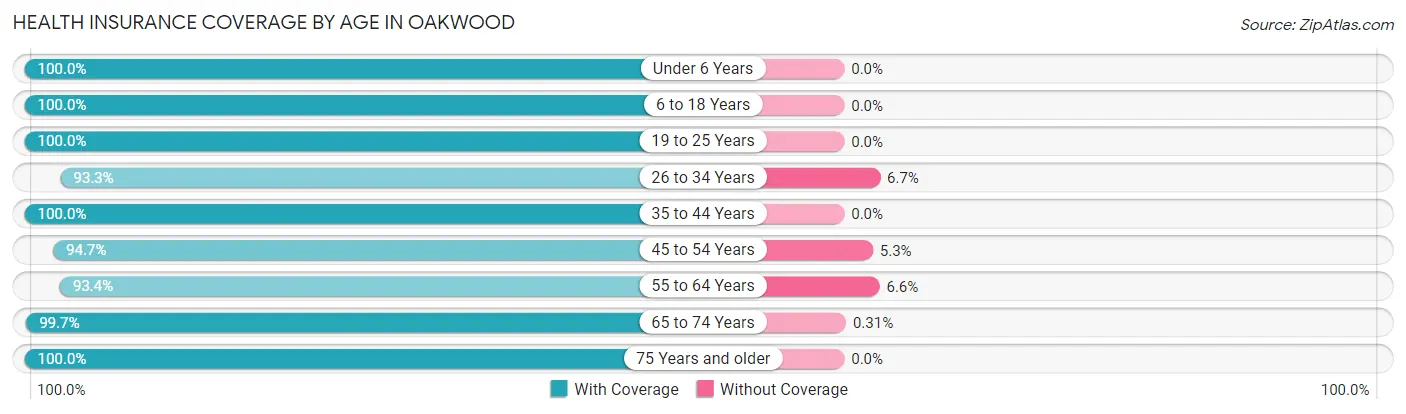
| Age Bracket | With Coverage | Without Coverage |
| Under 6 Years | 124 (100.0%) | 0 (0.0%) |
| 6 to 18 Years | 423 (100.0%) | 0 (0.0%) |
| 19 to 25 Years | 51 (100.0%) | 0 (0.0%) |
| 26 to 34 Years | 196 (93.3%) | 14 (6.7%) |
| 35 to 44 Years | 309 (100.0%) | 0 (0.0%) |
| 45 to 54 Years | 249 (94.7%) | 14 (5.3%) |
| 55 to 64 Years | 313 (93.4%) | 22 (6.6%) |
| 65 to 74 Years | 324 (99.7%) | 1 (0.3%) |
| 75 Years and older | 208 (100.0%) | 0 (0.0%) |
| Total | 2,197 (97.7%) | 51 (2.3%) |
Health Insurance Coverage by Citizenship Status in Oakwood
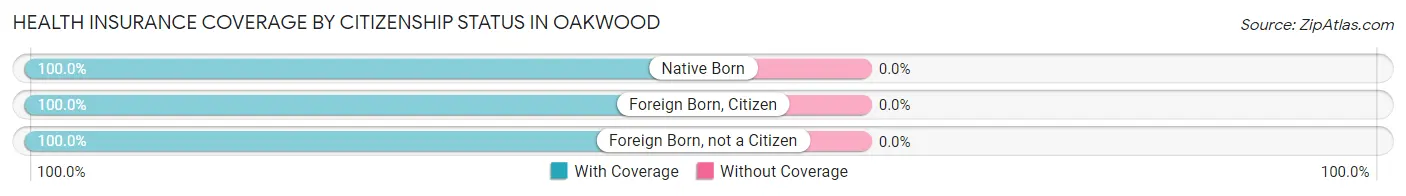
| Citizenship Status | With Coverage | Without Coverage |
| Native Born | 124 (100.0%) | 0 (0.0%) |
| Foreign Born, Citizen | 423 (100.0%) | 0 (0.0%) |
| Foreign Born, not a Citizen | 51 (100.0%) | 0 (0.0%) |
Health Insurance Coverage by Household Income in Oakwood
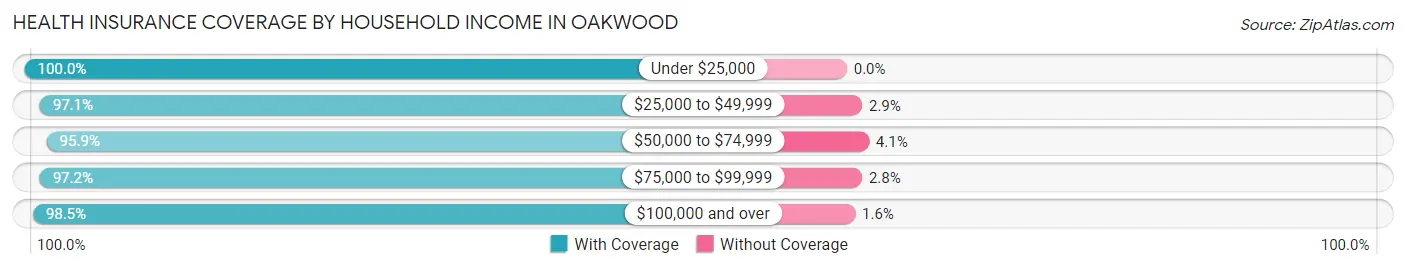
| Household Income | With Coverage | Without Coverage |
| Under $25,000 | 230 (100.0%) | 0 (0.0%) |
| $25,000 to $49,999 | 475 (97.1%) | 14 (2.9%) |
| $50,000 to $74,999 | 324 (95.9%) | 14 (4.1%) |
| $75,000 to $99,999 | 274 (97.2%) | 8 (2.8%) |
| $100,000 and over | 890 (98.5%) | 14 (1.5%) |
Public vs Private Health Insurance Coverage by Age in Oakwood
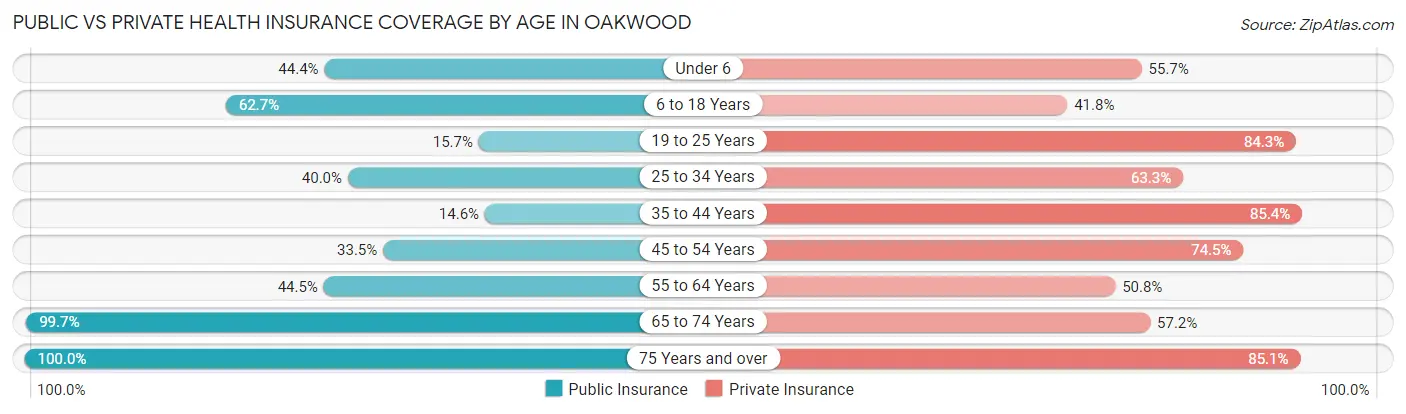
| Age Bracket | Public Insurance | Private Insurance |
| Under 6 | 55 (44.4%) | 69 (55.6%) |
| 6 to 18 Years | 265 (62.6%) | 177 (41.8%) |
| 19 to 25 Years | 8 (15.7%) | 43 (84.3%) |
| 25 to 34 Years | 84 (40.0%) | 133 (63.3%) |
| 35 to 44 Years | 45 (14.6%) | 264 (85.4%) |
| 45 to 54 Years | 88 (33.5%) | 196 (74.5%) |
| 55 to 64 Years | 149 (44.5%) | 170 (50.7%) |
| 65 to 74 Years | 324 (99.7%) | 186 (57.2%) |
| 75 Years and over | 208 (100.0%) | 177 (85.1%) |
| Total | 1,226 (54.5%) | 1,415 (62.9%) |
Disability Status by Sex by Age in Oakwood
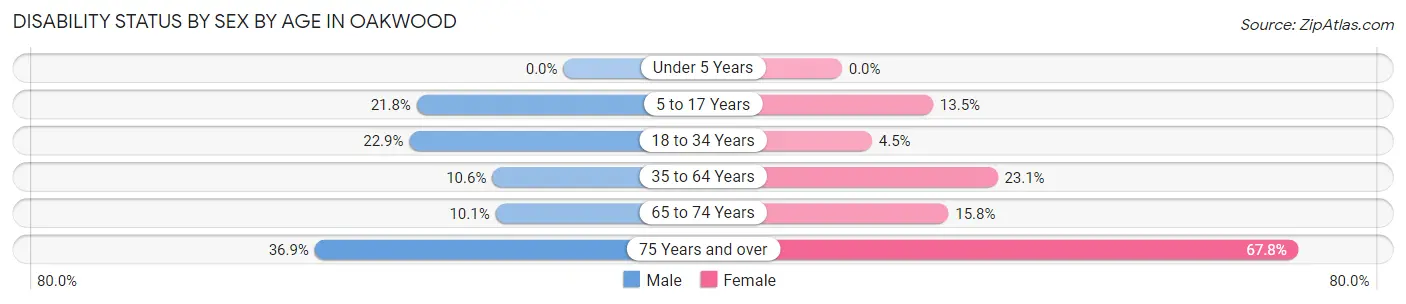
| Age Bracket | Male | Female |
| Under 5 Years | 0 (0.0%) | 0 (0.0%) |
| 5 to 17 Years | 44 (21.8%) | 28 (13.5%) |
| 18 to 34 Years | 27 (22.9%) | 7 (4.5%) |
| 35 to 64 Years | 51 (10.6%) | 98 (23.1%) |
| 65 to 74 Years | 13 (10.1%) | 31 (15.8%) |
| 75 Years and over | 24 (36.9%) | 97 (67.8%) |
Disability Class by Sex by Age in Oakwood
Disability Class: Hearing Difficulty
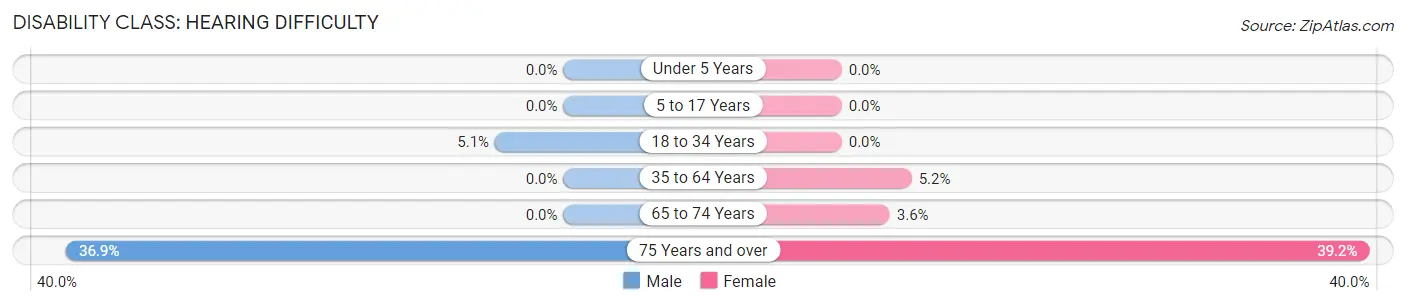
| Age Bracket | Male | Female |
| Under 5 Years | 0 (0.0%) | 0 (0.0%) |
| 5 to 17 Years | 0 (0.0%) | 0 (0.0%) |
| 18 to 34 Years | 6 (5.1%) | 0 (0.0%) |
| 35 to 64 Years | 0 (0.0%) | 22 (5.2%) |
| 65 to 74 Years | 0 (0.0%) | 7 (3.6%) |
| 75 Years and over | 24 (36.9%) | 56 (39.2%) |
Disability Class: Vision Difficulty
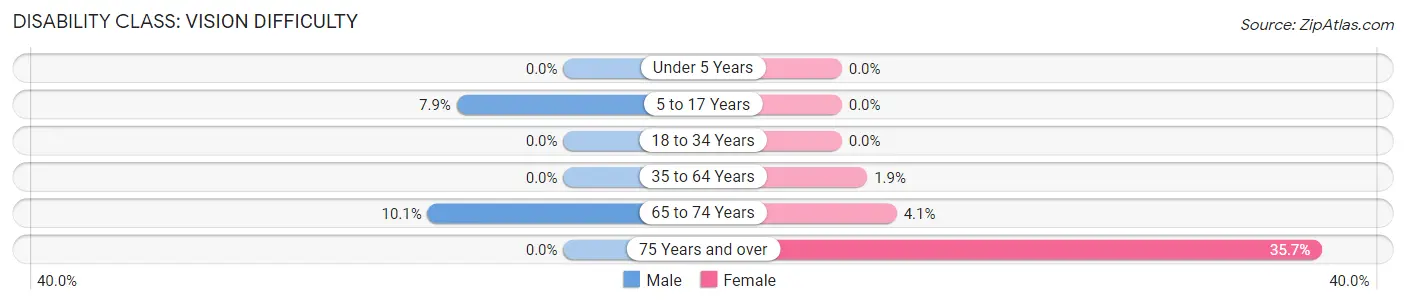
| Age Bracket | Male | Female |
| Under 5 Years | 0 (0.0%) | 0 (0.0%) |
| 5 to 17 Years | 16 (7.9%) | 0 (0.0%) |
| 18 to 34 Years | 0 (0.0%) | 0 (0.0%) |
| 35 to 64 Years | 0 (0.0%) | 8 (1.9%) |
| 65 to 74 Years | 13 (10.1%) | 8 (4.1%) |
| 75 Years and over | 0 (0.0%) | 51 (35.7%) |
Disability Class: Cognitive Difficulty
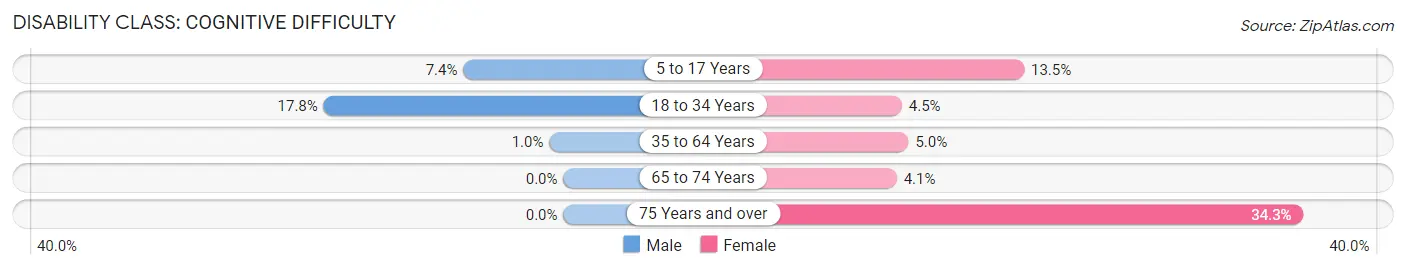
| Age Bracket | Male | Female |
| 5 to 17 Years | 15 (7.4%) | 28 (13.5%) |
| 18 to 34 Years | 21 (17.8%) | 7 (4.5%) |
| 35 to 64 Years | 5 (1.0%) | 21 (5.0%) |
| 65 to 74 Years | 0 (0.0%) | 8 (4.1%) |
| 75 Years and over | 0 (0.0%) | 49 (34.3%) |
Disability Class: Ambulatory Difficulty
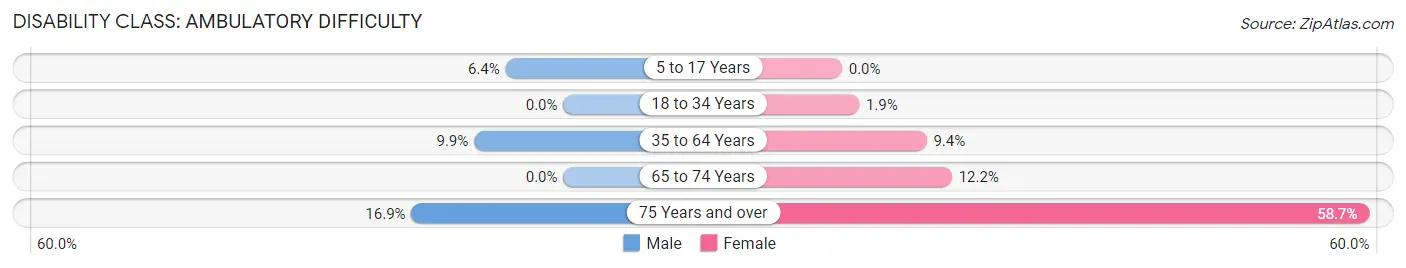
| Age Bracket | Male | Female |
| 5 to 17 Years | 13 (6.4%) | 0 (0.0%) |
| 18 to 34 Years | 0 (0.0%) | 3 (1.9%) |
| 35 to 64 Years | 48 (9.9%) | 40 (9.4%) |
| 65 to 74 Years | 0 (0.0%) | 24 (12.2%) |
| 75 Years and over | 11 (16.9%) | 84 (58.7%) |
Disability Class: Self-Care Difficulty
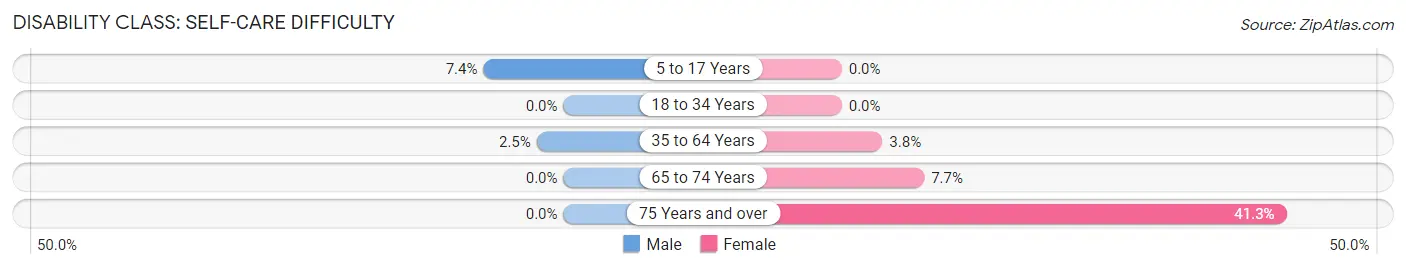
| Age Bracket | Male | Female |
| 5 to 17 Years | 15 (7.4%) | 0 (0.0%) |
| 18 to 34 Years | 0 (0.0%) | 0 (0.0%) |
| 35 to 64 Years | 12 (2.5%) | 16 (3.8%) |
| 65 to 74 Years | 0 (0.0%) | 15 (7.6%) |
| 75 Years and over | 0 (0.0%) | 59 (41.3%) |
Technology Access in Oakwood
Computing Device Access in Oakwood
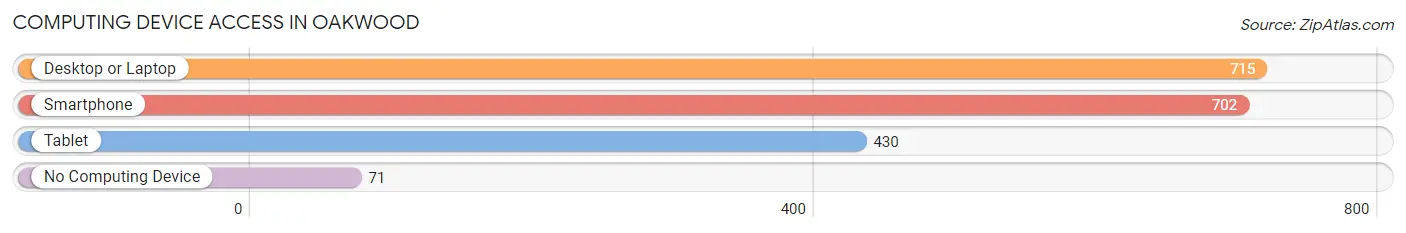
| Device Type | # Households | % Households |
| Desktop or Laptop | 715 | 80.6% |
| Smartphone | 702 | 79.1% |
| Tablet | 430 | 48.5% |
| No Computing Device | 71 | 8.0% |
| Total | 887 | 100.0% |
Internet Access in Oakwood
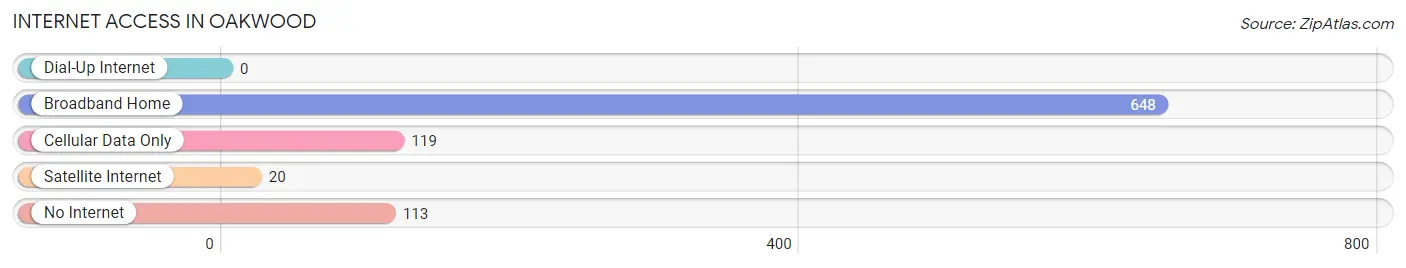
| Internet Type | # Households | % Households |
| Dial-Up Internet | 0 | 0.0% |
| Broadband Home | 648 | 73.1% |
| Cellular Data Only | 119 | 13.4% |
| Satellite Internet | 20 | 2.2% |
| No Internet | 113 | 12.7% |
| Total | 887 | 100.0% |
Oakwood Summary
Oakwood is a small borough located in Allegheny County, Pennsylvania. It is situated in the southwestern part of the state, approximately 20 miles from the city of Pittsburgh. The borough is bordered by the boroughs of Ingram and West View, and the townships of Ross and Shaler. According to the 2010 census, Oakwood had a population of 1,845.
History
Oakwood was founded in 1891 by a group of investors from Pittsburgh. The investors purchased a tract of land from the estate of William Penn and named it Oakwood. The borough was incorporated in 1895.
The original settlers of Oakwood were mostly of German and Irish descent. The first industry in the area was a brickyard, which was established in 1892. The brickyard provided employment for many of the early settlers.
In the early 1900s, Oakwood began to grow rapidly. The population increased from 1,000 in 1900 to 2,000 in 1910. The growth was due in part to the construction of the Pittsburgh and West View Railway, which connected Oakwood to Pittsburgh.
The borough continued to grow throughout the 20th century. In the 1950s, Oakwood was home to several small businesses, including a grocery store, a hardware store, and a drug store.
Geography
Oakwood is located in southwestern Pennsylvania, approximately 20 miles from the city of Pittsburgh. The borough is situated in the Allegheny Plateau region of the state. The terrain is mostly flat, with some rolling hills.
The borough is bordered by the boroughs of Ingram and West View, and the townships of Ross and Shaler. The Allegheny River forms the western boundary of the borough.
Oakwood has a total area of 0.7 square miles, all of which is land. The borough is located in the Eastern Standard Time Zone.
Economy
Oakwood’s economy is largely based on small businesses. The borough is home to several small retail stores, restaurants, and professional services.
The borough is also home to several manufacturing companies, including a steel mill and a paper mill. These companies provide employment for many of the borough’s residents.
Demographics
According to the 2010 census, Oakwood had a population of 1,845. The racial makeup of the borough was 94.3% White, 2.2% African American, 0.3% Native American, 0.7% Asian, 0.1% Pacific Islander, and 2.4% from other races.
The median household income in Oakwood was $41,944, and the median family income was $50,944. The per capita income was $20,944. Approximately 8.3% of the population was below the poverty line.
Conclusion
Oakwood is a small borough located in southwestern Pennsylvania. It was founded in 1891 and incorporated in 1895. The borough has a population of 1,845 and is home to several small businesses. The economy is largely based on small businesses and manufacturing companies. The racial makeup of the borough is mostly White, with a small percentage of African American, Native American, Asian, and Pacific Islander residents. The median household income is $41,944, and the per capita income is $20,944.
Common Questions
What is Per Capita Income in Oakwood?
Per Capita income in Oakwood is $26,874.
What is the Median Family Income in Oakwood?
Median Family Income in Oakwood is $79,018.
What is the Median Household income in Oakwood?
Median Household Income in Oakwood is $63,458.
What is Income or Wage Gap in Oakwood?
Income or Wage Gap in Oakwood is 32.1%.
Women in Oakwood earn 67.9 cents for every dollar earned by a man.
What is Inequality or Gini Index in Oakwood?
Inequality or Gini Index in Oakwood is 0.34.
What is the Total Population of Oakwood?
Total Population of Oakwood is 2,248.
What is the Total Male Population of Oakwood?
Total Male Population of Oakwood is 1,042.
What is the Total Female Population of Oakwood?
Total Female Population of Oakwood is 1,206.
What is the Ratio of Males per 100 Females in Oakwood?
There are 86.40 Males per 100 Females in Oakwood.
What is the Ratio of Females per 100 Males in Oakwood?
There are 115.74 Females per 100 Males in Oakwood.
What is the Median Population Age in Oakwood?
Median Population Age in Oakwood is 45.7 Years.
What is the Average Family Size in Oakwood
Average Family Size in Oakwood is 3.0 People.
What is the Average Household Size in Oakwood
Average Household Size in Oakwood is 2.5 People.
How Large is the Labor Force in Oakwood?
There are 976 People in the Labor Forcein in Oakwood.
What is the Percentage of People in the Labor Force in Oakwood?
55.8% of People are in the Labor Force in Oakwood.
What is the Unemployment Rate in Oakwood?
Unemployment Rate in Oakwood is 2.7%.