Forestville, PA Map & Demographics
Forestville Map
Forestville Overview
$34,122
PER CAPITA INCOME
$110,071
AVG FAMILY INCOME
$110,519
AVG HOUSEHOLD INCOME
25.7%
WAGE / INCOME GAP [ % ]
74.3¢/ $1
WAGE / INCOME GAP [ $ ]
0.24
INEQUALITY / GINI INDEX
533
TOTAL POPULATION
301
MALE POPULATION
232
FEMALE POPULATION
129.74
MALES / 100 FEMALES
77.08
FEMALES / 100 MALES
39.4
MEDIAN AGE
2.9
AVG FAMILY SIZE
2.8
AVG HOUSEHOLD SIZE
331
LABOR FORCE [ PEOPLE ]
70.6%
PERCENT IN LABOR FORCE
1.2%
UNEMPLOYMENT RATE
Forestville Zip Codes
Forestville Area Codes
Income in Forestville
Income Overview in Forestville
Per Capita Income in Forestville is $34,122, while median incomes of families and households are $110,071 and $110,519 respectively.
| Characteristic | Number | Measure |
| Per Capita Income | 533 | $34,122 |
| Median Family Income | 163 | $110,071 |
| Mean Family Income | 163 | $97,441 |
| Median Household Income | 190 | $110,519 |
| Mean Household Income | 190 | $98,612 |
| Income Deficit | 163 | $0 |
| Wage / Income Gap (%) | 533 | 25.66% |
| Wage / Income Gap ($) | 533 | 74.34¢ per $1 |
| Gini / Inequality Index | 533 | 0.24 |
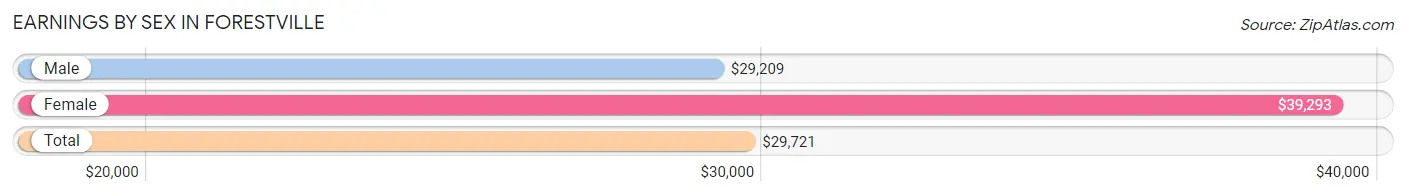
Earnings by Sex in Forestville
Average Earnings in Forestville are $29,721, $29,209 for men and $39,293 for women, a difference of 25.7%.
| Sex | Number | Average Earnings |
| Male | 230 (70.3%) | $29,209 |
| Female | 97 (29.7%) | $39,293 |
| Total | 327 (100.0%) | $29,721 |
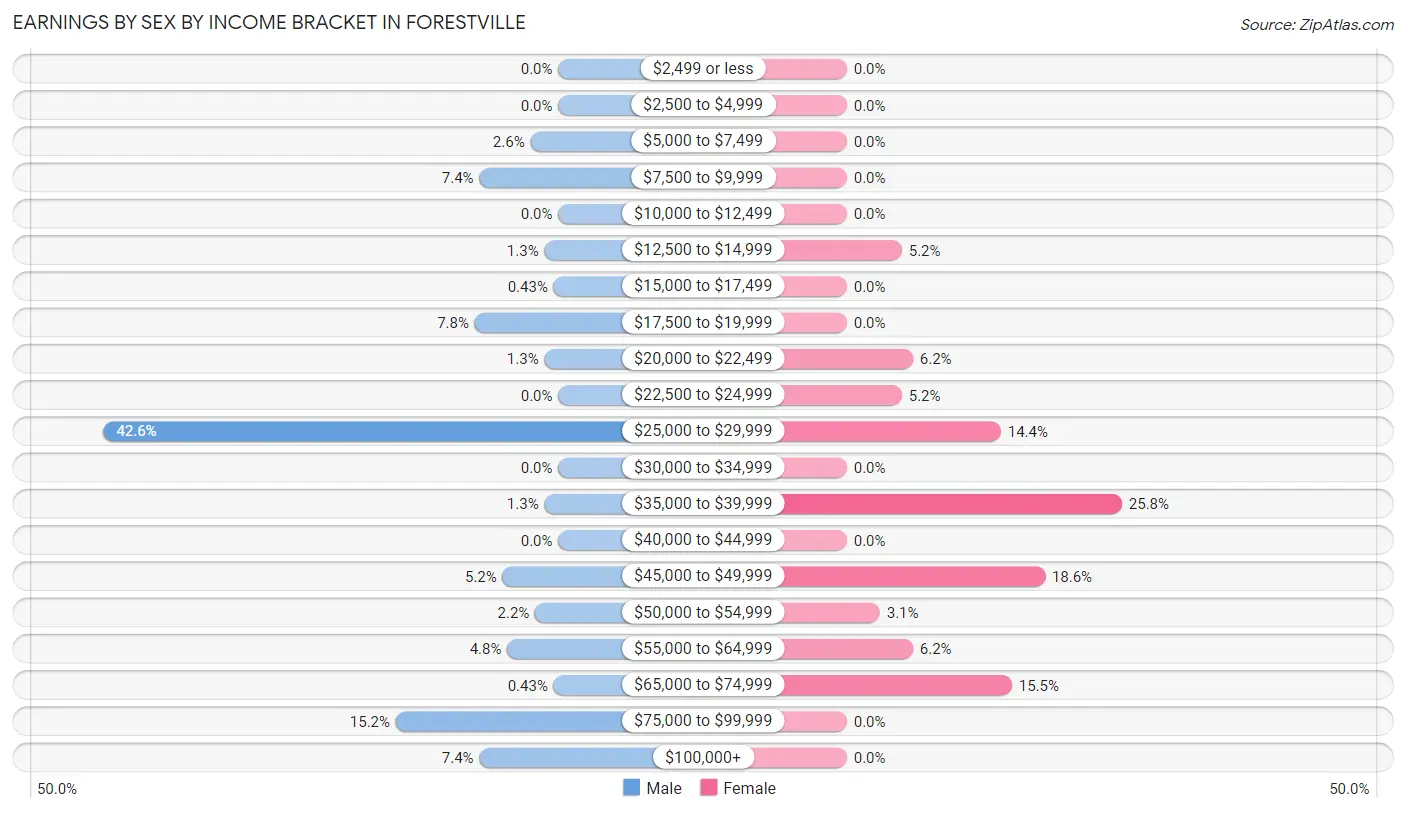
Earnings by Sex by Income Bracket in Forestville
The most common earnings brackets in Forestville are $25,000 to $29,999 for men (98 | 42.6%) and $35,000 to $39,999 for women (25 | 25.8%).
| Income | Male | Female |
| $2,499 or less | 0 (0.0%) | 0 (0.0%) |
| $2,500 to $4,999 | 0 (0.0%) | 0 (0.0%) |
| $5,000 to $7,499 | 6 (2.6%) | 0 (0.0%) |
| $7,500 to $9,999 | 17 (7.4%) | 0 (0.0%) |
| $10,000 to $12,499 | 0 (0.0%) | 0 (0.0%) |
| $12,500 to $14,999 | 3 (1.3%) | 5 (5.1%) |
| $15,000 to $17,499 | 1 (0.4%) | 0 (0.0%) |
| $17,500 to $19,999 | 18 (7.8%) | 0 (0.0%) |
| $20,000 to $22,499 | 3 (1.3%) | 6 (6.2%) |
| $22,500 to $24,999 | 0 (0.0%) | 5 (5.1%) |
| $25,000 to $29,999 | 98 (42.6%) | 14 (14.4%) |
| $30,000 to $34,999 | 0 (0.0%) | 0 (0.0%) |
| $35,000 to $39,999 | 3 (1.3%) | 25 (25.8%) |
| $40,000 to $44,999 | 0 (0.0%) | 0 (0.0%) |
| $45,000 to $49,999 | 12 (5.2%) | 18 (18.6%) |
| $50,000 to $54,999 | 5 (2.2%) | 3 (3.1%) |
| $55,000 to $64,999 | 11 (4.8%) | 6 (6.2%) |
| $65,000 to $74,999 | 1 (0.4%) | 15 (15.5%) |
| $75,000 to $99,999 | 35 (15.2%) | 0 (0.0%) |
| $100,000+ | 17 (7.4%) | 0 (0.0%) |
| Total | 230 (100.0%) | 97 (100.0%) |
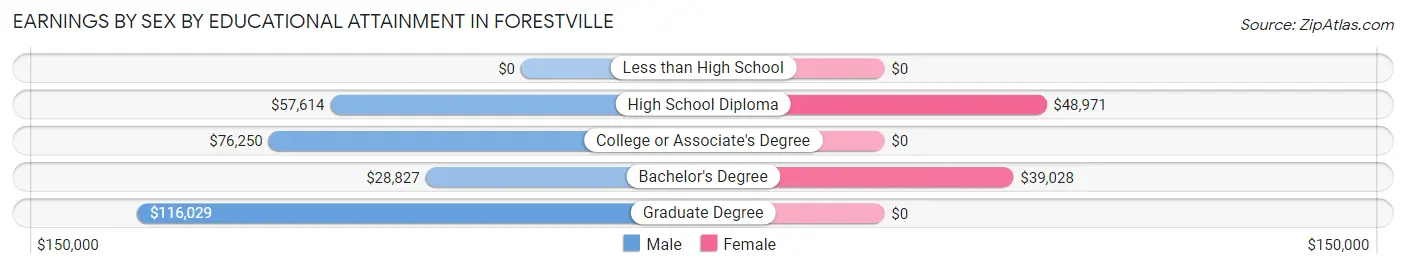
Earnings by Sex by Educational Attainment in Forestville
| Educational Attainment | Male Income | Female Income |
| Less than High School | - | - |
| High School Diploma | $57,614 | $48,971 |
| College or Associate's Degree | $76,250 | $0 |
| Bachelor's Degree | $28,827 | $39,028 |
| Graduate Degree | $116,029 | $0 |
| Total | - | - |
Family Income in Forestville
Family Income Brackets in Forestville
According to the Forestville family income data, there are 60 families falling into the $100,000 to $149,999 income range, which is the most common income bracket and makes up 36.8% of all families.
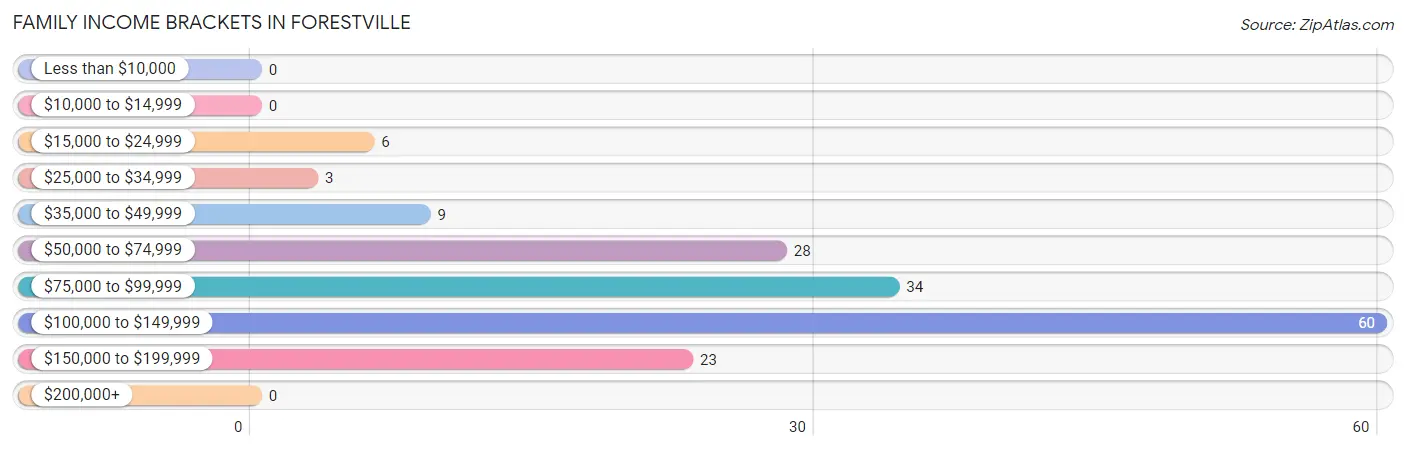
| Income Bracket | # Families | % Families |
| Less than $10,000 | 0 | 0.0% |
| $10,000 to $14,999 | 0 | 0.0% |
| $15,000 to $24,999 | 6 | 3.7% |
| $25,000 to $34,999 | 3 | 1.8% |
| $35,000 to $49,999 | 9 | 5.5% |
| $50,000 to $74,999 | 28 | 17.2% |
| $75,000 to $99,999 | 34 | 20.9% |
| $100,000 to $149,999 | 60 | 36.8% |
| $150,000 to $199,999 | 23 | 14.1% |
| $200,000+ | 0 | 0.0% |
Family Income by Famaliy Size in Forestville
2-person families (71 | 43.6%) account for the highest median family income in Forestville with $75,380 per family, while 2-person families (71 | 43.6%) have the highest median income of $37,690 per family member.
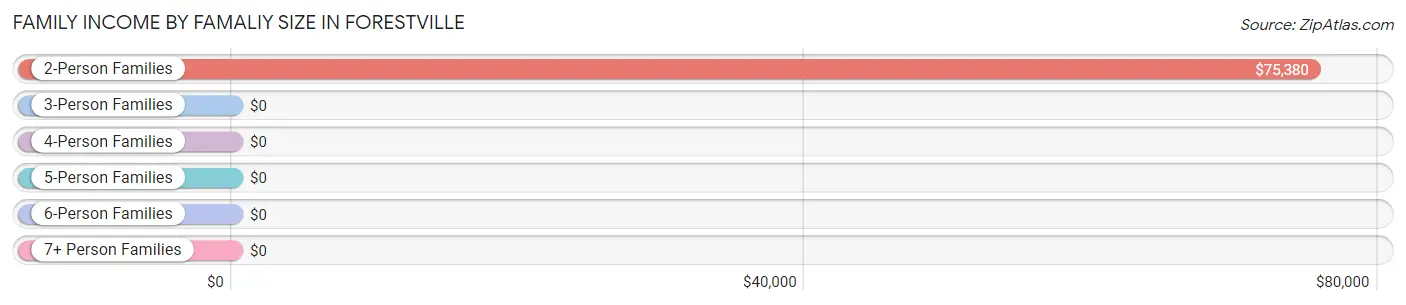
| Income Bracket | # Families | Median Income |
| 2-Person Families | 71 (43.6%) | $75,380 |
| 3-Person Families | 54 (33.1%) | $0 |
| 4-Person Families | 15 (9.2%) | $0 |
| 5-Person Families | 23 (14.1%) | $0 |
| 6-Person Families | 0 (0.0%) | $0 |
| 7+ Person Families | 0 (0.0%) | $0 |
| Total | 163 (100.0%) | $110,071 |
Family Income by Number of Earners in Forestville
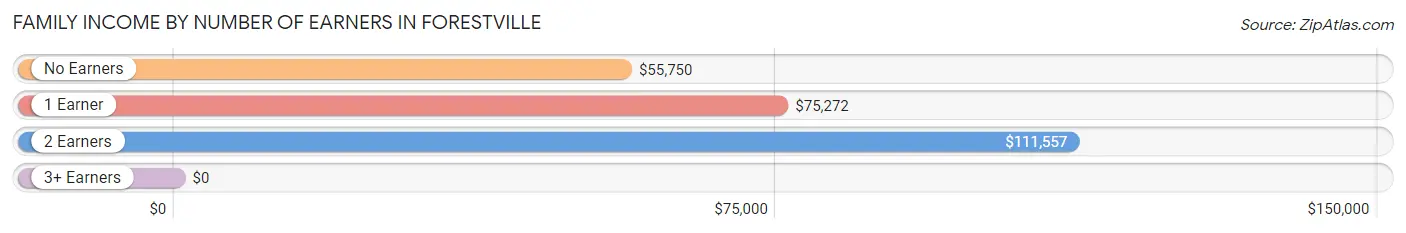
| Number of Earners | # Families | Median Income |
| No Earners | 15 (9.2%) | $55,750 |
| 1 Earner | 41 (25.2%) | $75,272 |
| 2 Earners | 86 (52.8%) | $111,557 |
| 3+ Earners | 21 (12.9%) | $0 |
| Total | 163 (100.0%) | $110,071 |
Household Income in Forestville
Household Income Brackets in Forestville
With 83 households falling in the category, the $100,000 to $149,999 income range is the most frequent in Forestville, accounting for 43.7% of all households.
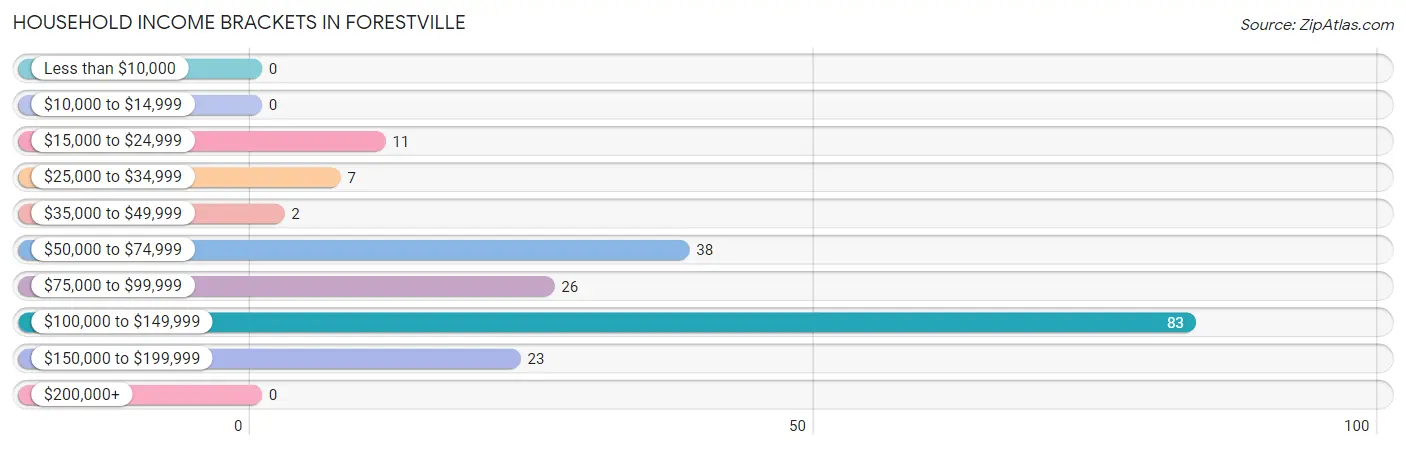
| Income Bracket | # Households | % Households |
| Less than $10,000 | 0 | 0.0% |
| $10,000 to $14,999 | 0 | 0.0% |
| $15,000 to $24,999 | 11 | 5.8% |
| $25,000 to $34,999 | 7 | 3.7% |
| $35,000 to $49,999 | 2 | 1.1% |
| $50,000 to $74,999 | 38 | 20.0% |
| $75,000 to $99,999 | 26 | 13.7% |
| $100,000 to $149,999 | 83 | 43.7% |
| $150,000 to $199,999 | 23 | 12.1% |
| $200,000+ | 0 | 0.0% |
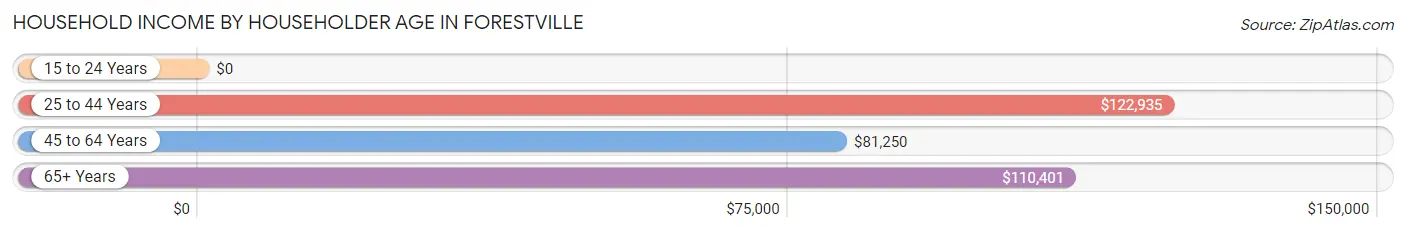
Household Income by Householder Age in Forestville
The median household income in Forestville is $110,519, with the highest median household income of $122,935 found in the 25 to 44 years age bracket for the primary householder. A total of 72 households (37.9%) fall into this category.
| Income Bracket | # Households | Median Income |
| 15 to 24 Years | 0 (0.0%) | $0 |
| 25 to 44 Years | 72 (37.9%) | $122,935 |
| 45 to 64 Years | 29 (15.3%) | $81,250 |
| 65+ Years | 89 (46.8%) | $110,401 |
| Total | 190 (100.0%) | $110,519 |
Poverty in Forestville
Income Below Poverty by Sex and Age in Forestville
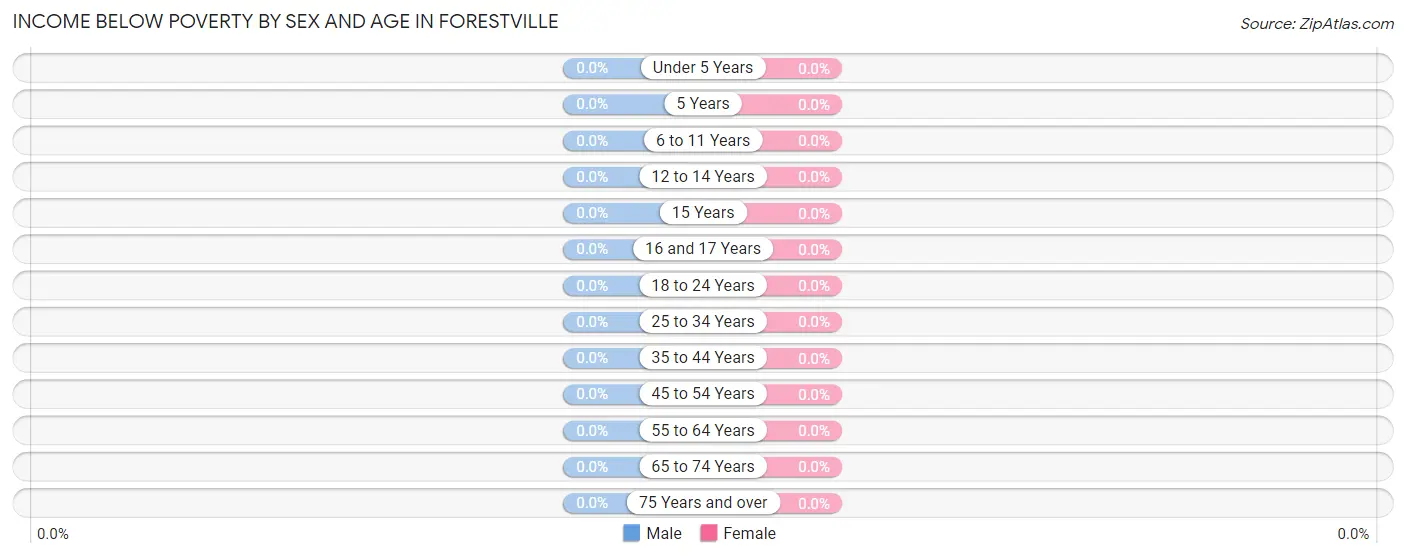
| Age Bracket | Male | Female |
| Under 5 Years | 0 (0.0%) | 0 (0.0%) |
| 5 Years | 0 (0.0%) | 0 (0.0%) |
| 6 to 11 Years | 0 (0.0%) | 0 (0.0%) |
| 12 to 14 Years | 0 (0.0%) | 0 (0.0%) |
| 15 Years | 0 (0.0%) | 0 (0.0%) |
| 16 and 17 Years | 0 (0.0%) | 0 (0.0%) |
| 18 to 24 Years | 0 (0.0%) | 0 (0.0%) |
| 25 to 34 Years | 0 (0.0%) | 0 (0.0%) |
| 35 to 44 Years | 0 (0.0%) | 0 (0.0%) |
| 45 to 54 Years | 0 (0.0%) | 0 (0.0%) |
| 55 to 64 Years | 0 (0.0%) | 0 (0.0%) |
| 65 to 74 Years | 0 (0.0%) | 0 (0.0%) |
| 75 Years and over | 0 (0.0%) | 0 (0.0%) |
| Total | 0 (0.0%) | 0 (0.0%) |
Income Above Poverty by Sex and Age in Forestville
According to the poverty statistics in Forestville, males aged 6 to 11 years and females aged 6 to 11 years are the age groups that are most secure financially, with 100.0% of males and 100.0% of females in these age groups living above the poverty line.
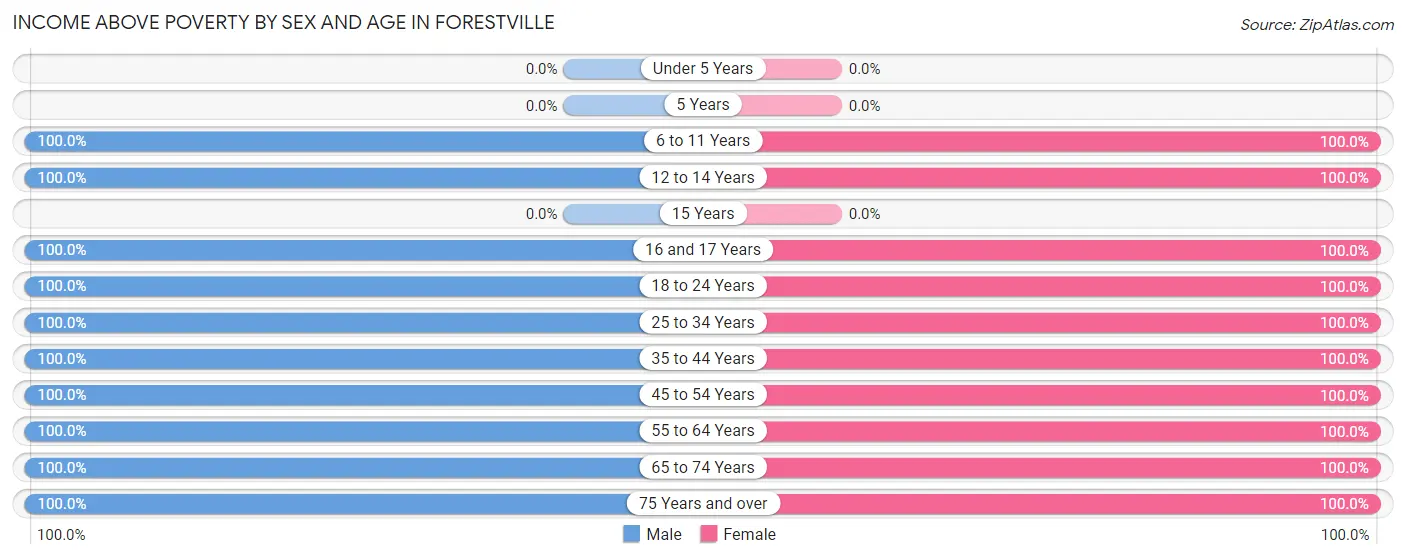
| Age Bracket | Male | Female |
| Under 5 Years | 0 (0.0%) | 0 (0.0%) |
| 5 Years | 0 (0.0%) | 0 (0.0%) |
| 6 to 11 Years | 17 (100.0%) | 36 (100.0%) |
| 12 to 14 Years | 10 (100.0%) | 1 (100.0%) |
| 15 Years | 0 (0.0%) | 0 (0.0%) |
| 16 and 17 Years | 23 (100.0%) | 19 (100.0%) |
| 18 to 24 Years | 35 (100.0%) | 8 (100.0%) |
| 25 to 34 Years | 27 (100.0%) | 25 (100.0%) |
| 35 to 44 Years | 81 (100.0%) | 42 (100.0%) |
| 45 to 54 Years | 11 (100.0%) | 10 (100.0%) |
| 55 to 64 Years | 19 (100.0%) | 9 (100.0%) |
| 65 to 74 Years | 69 (100.0%) | 69 (100.0%) |
| 75 Years and over | 9 (100.0%) | 13 (100.0%) |
| Total | 301 (100.0%) | 232 (100.0%) |
Income Below Poverty Among Married-Couple Families in Forestville
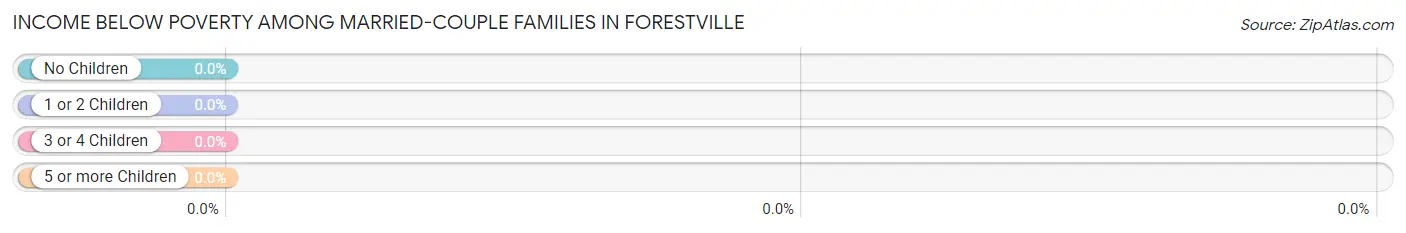
| Children | Above Poverty | Below Poverty |
| No Children | 90 (100.0%) | 0 (0.0%) |
| 1 or 2 Children | 7 (100.0%) | 0 (0.0%) |
| 3 or 4 Children | 17 (100.0%) | 0 (0.0%) |
| 5 or more Children | 0 (0.0%) | 0 (0.0%) |
| Total | 114 (100.0%) | 0 (0.0%) |
Income Below Poverty Among Single-Parent Households in Forestville
| Children | Single Father | Single Mother |
| No Children | 0 (0.0%) | 0 (0.0%) |
| 1 or 2 Children | 0 (0.0%) | 0 (0.0%) |
| 3 or 4 Children | 0 (0.0%) | 0 (0.0%) |
| 5 or more Children | 0 (0.0%) | 0 (0.0%) |
| Total | 0 (0.0%) | 0 (0.0%) |
Income Below Poverty Among Married-Couple vs Single-Parent Households in Forestville
| Children | Married-Couple Families | Single-Parent Households |
| No Children | 0 (0.0%) | 0 (0.0%) |
| 1 or 2 Children | 0 (0.0%) | 0 (0.0%) |
| 3 or 4 Children | 0 (0.0%) | 0 (0.0%) |
| 5 or more Children | 0 (0.0%) | 0 (0.0%) |
| Total | 0 (0.0%) | 0 (0.0%) |
Race in Forestville
The most populous races in Forestville are , and White / Caucasian (533 | 100.0%).
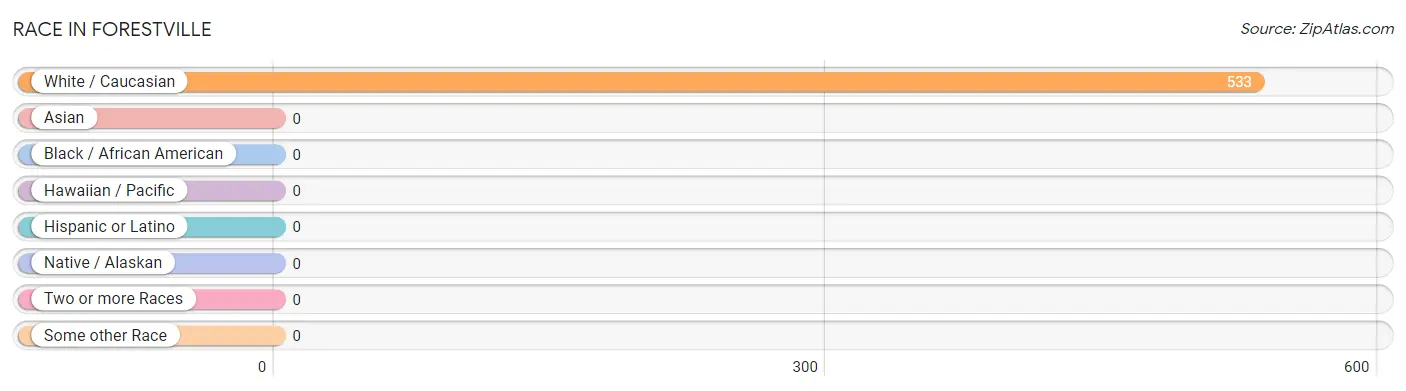
| Race | # Population | % Population |
| Asian | 0 | 0.0% |
| Black / African American | 0 | 0.0% |
| Hawaiian / Pacific | 0 | 0.0% |
| Hispanic or Latino | 0 | 0.0% |
| Native / Alaskan | 0 | 0.0% |
| White / Caucasian | 533 | 100.0% |
| Two or more Races | 0 | 0.0% |
| Some other Race | 0 | 0.0% |
| Total | 533 | 100.0% |
Ancestry in Forestville
The most populous ancestries reported in Forestville are Irish (166 | 31.1%), Polish (66 | 12.4%), Romanian (52 | 9.8%), Ukrainian (36 | 6.8%), and German (33 | 6.2%), together accounting for 66.2% of all Forestville residents.
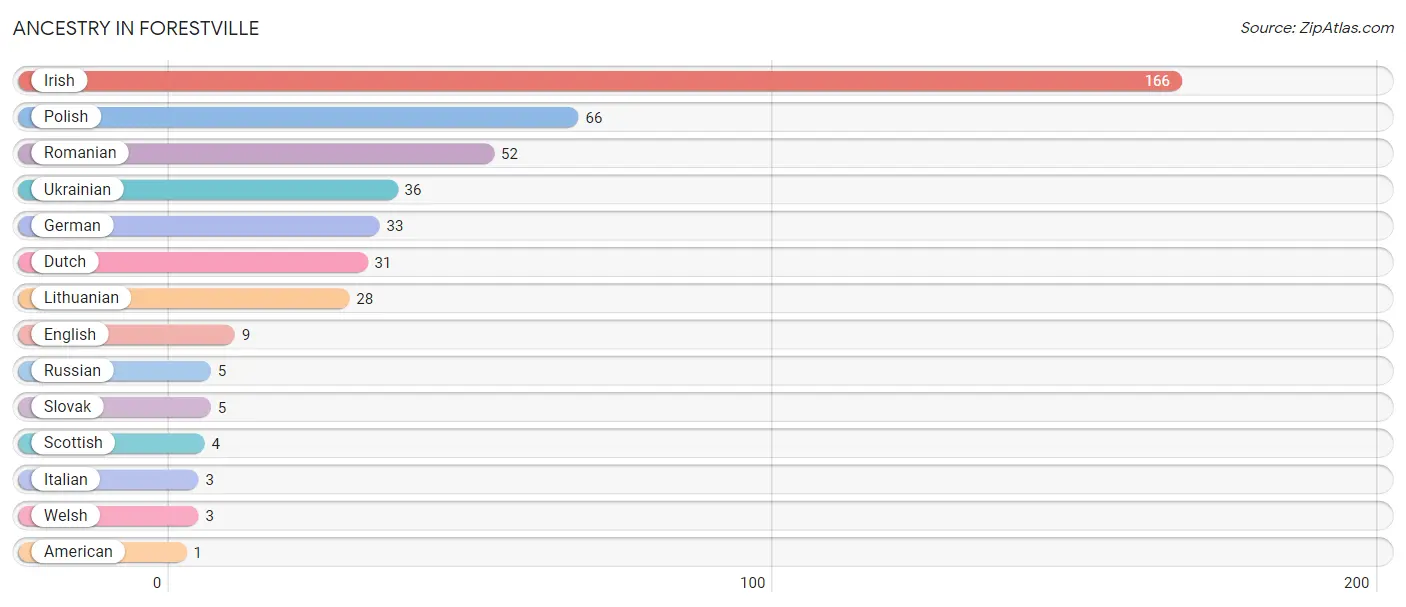
| Ancestry | # Population | % Population |
| American | 1 | 0.2% |
| Dutch | 31 | 5.8% |
| English | 9 | 1.7% |
| German | 33 | 6.2% |
| Irish | 166 | 31.1% |
| Italian | 3 | 0.6% |
| Lithuanian | 28 | 5.2% |
| Polish | 66 | 12.4% |
| Romanian | 52 | 9.8% |
| Russian | 5 | 0.9% |
| Scottish | 4 | 0.7% |
| Slovak | 5 | 0.9% |
| Ukrainian | 36 | 6.8% |
| Welsh | 3 | 0.6% | View All 14 Rows |
Immigrants in Forestville

| Immigration Origin | # Population | % Population | View All 0 Rows |
Sex and Age in Forestville
Sex and Age in Forestville
The most populous age groups in Forestville are 65 to 69 Years (66 | 21.9%) for men and 70 to 74 Years (55 | 23.7%) for women.
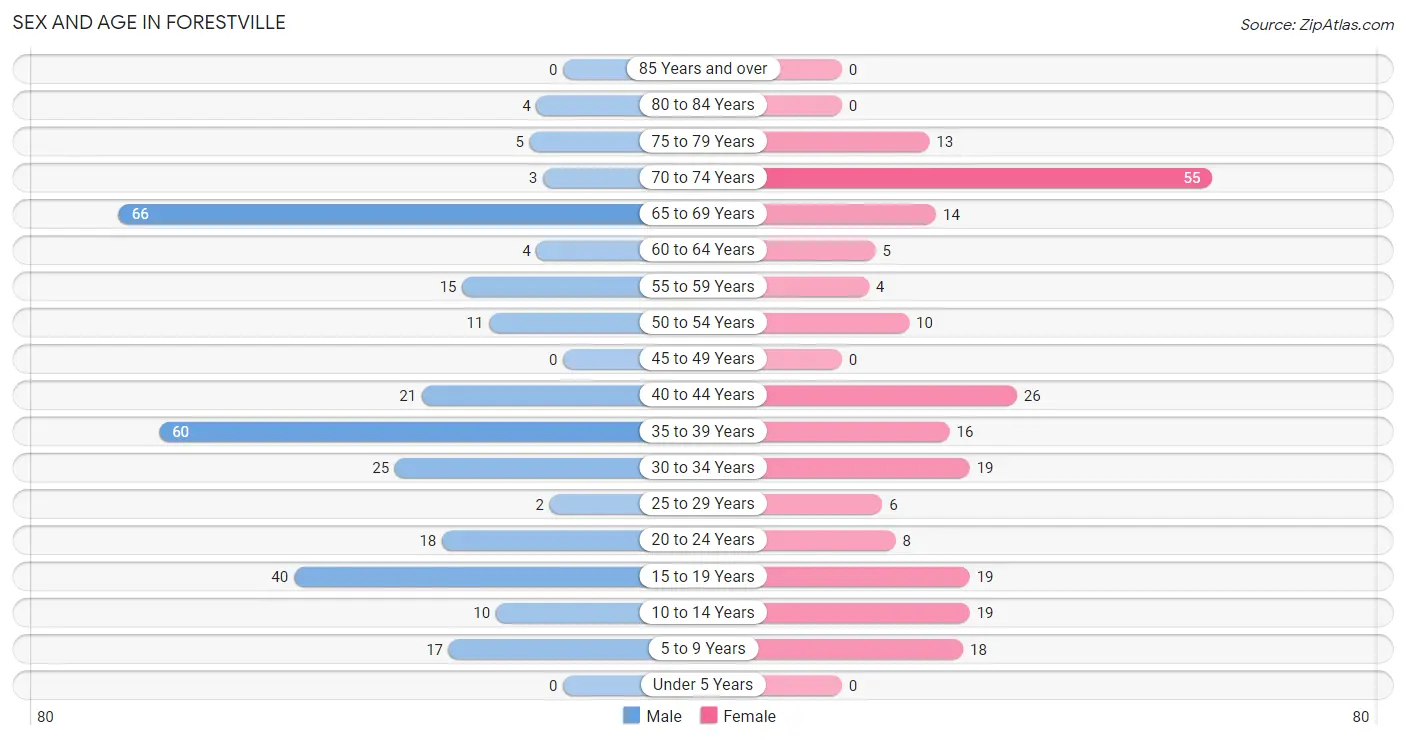
| Age Bracket | Male | Female |
| Under 5 Years | 0 (0.0%) | 0 (0.0%) |
| 5 to 9 Years | 17 (5.7%) | 18 (7.8%) |
| 10 to 14 Years | 10 (3.3%) | 19 (8.2%) |
| 15 to 19 Years | 40 (13.3%) | 19 (8.2%) |
| 20 to 24 Years | 18 (6.0%) | 8 (3.5%) |
| 25 to 29 Years | 2 (0.7%) | 6 (2.6%) |
| 30 to 34 Years | 25 (8.3%) | 19 (8.2%) |
| 35 to 39 Years | 60 (19.9%) | 16 (6.9%) |
| 40 to 44 Years | 21 (7.0%) | 26 (11.2%) |
| 45 to 49 Years | 0 (0.0%) | 0 (0.0%) |
| 50 to 54 Years | 11 (3.6%) | 10 (4.3%) |
| 55 to 59 Years | 15 (5.0%) | 4 (1.7%) |
| 60 to 64 Years | 4 (1.3%) | 5 (2.2%) |
| 65 to 69 Years | 66 (21.9%) | 14 (6.0%) |
| 70 to 74 Years | 3 (1.0%) | 55 (23.7%) |
| 75 to 79 Years | 5 (1.7%) | 13 (5.6%) |
| 80 to 84 Years | 4 (1.3%) | 0 (0.0%) |
| 85 Years and over | 0 (0.0%) | 0 (0.0%) |
| Total | 301 (100.0%) | 232 (100.0%) |
Families and Households in Forestville
Median Family Size in Forestville
The median family size in Forestville is 2.93 persons per family, with single female/mother families (26 | 16.0%) accounting for the largest median family size of 3.58 persons per family. On the other hand, single male/father families (23 | 14.1%) represent the smallest median family size with 1.74 persons per family.
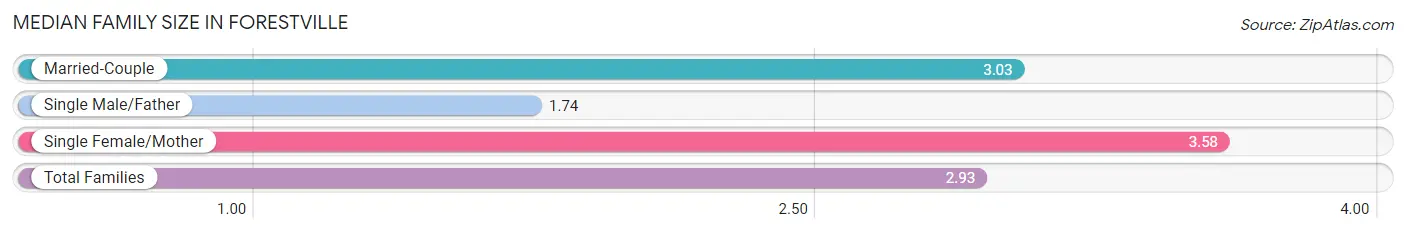
| Family Type | # Families | Family Size |
| Married-Couple | 114 (69.9%) | 3.03 |
| Single Male/Father | 23 (14.1%) | 1.74 |
| Single Female/Mother | 26 (16.0%) | 3.58 |
| Total Families | 163 (100.0%) | 2.93 |
Median Household Size in Forestville
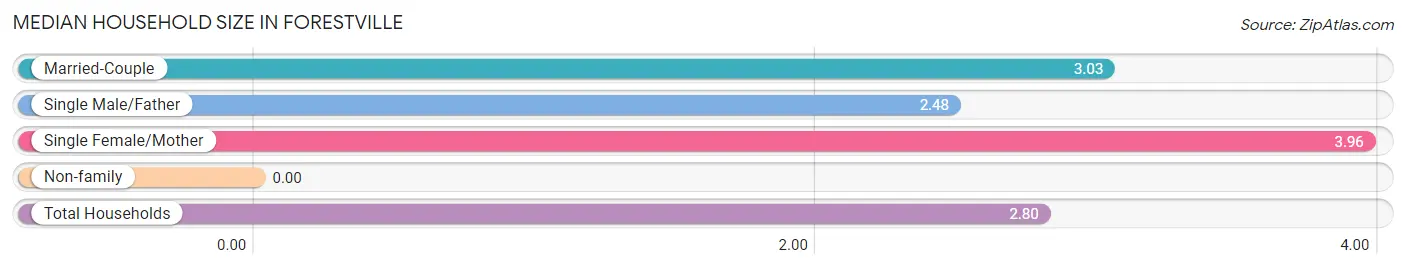
| Household Type | # Households | Household Size |
| Married-Couple | 114 (60.0%) | 3.03 |
| Single Male/Father | 23 (12.1%) | 2.48 |
| Single Female/Mother | 26 (13.7%) | 3.96 |
| Non-family | 27 (14.2%) | - |
| Total Households | 190 (100.0%) | 2.80 |
Household Size by Marriage Status in Forestville
Out of a total of 190 households in Forestville, 163 (85.8%) are family households, while 27 (14.2%) are nonfamily households. The most numerous type of family households are 3-person households, comprising 86, and the most common type of nonfamily households are 1-person households, comprising 27.
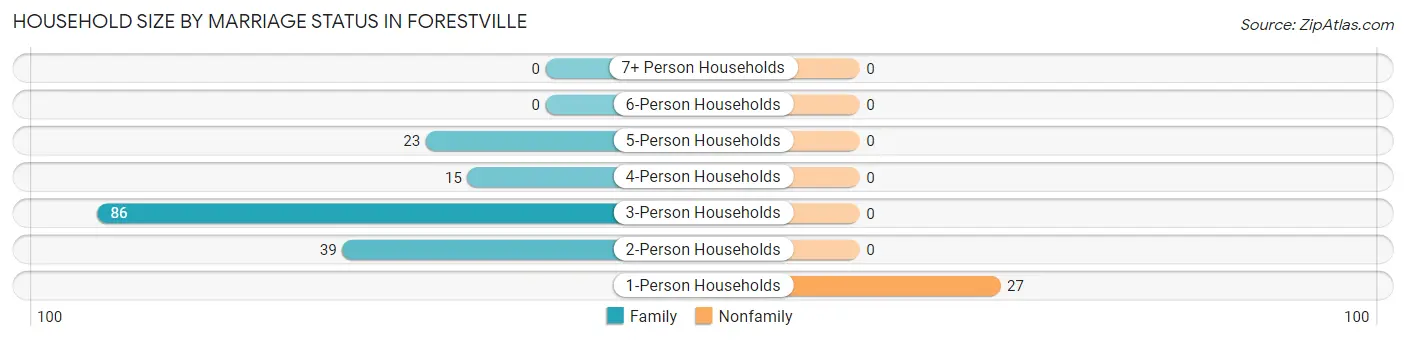
| Household Size | Family Households | Nonfamily Households |
| 1-Person Households | - | 27 (14.2%) |
| 2-Person Households | 39 (20.5%) | 0 (0.0%) |
| 3-Person Households | 86 (45.3%) | 0 (0.0%) |
| 4-Person Households | 15 (7.9%) | 0 (0.0%) |
| 5-Person Households | 23 (12.1%) | 0 (0.0%) |
| 6-Person Households | 0 (0.0%) | 0 (0.0%) |
| 7+ Person Households | 0 (0.0%) | 0 (0.0%) |
| Total | 163 (85.8%) | 27 (14.2%) |
Female Fertility in Forestville
Fertility by Age in Forestville
Average fertility rate in Forestville is 10.0 births per 1,000 women. Women in the age bracket of 35 to 50 years have the highest fertility rate with 21.0 births per 1,000 women. Women in the age bracket of 35 to 50 years acount for 100.0% of all women with births.

| Age Bracket | Women with Births | Births / 1,000 Women |
| 15 to 19 years | 0 (0.0%) | 0.0 |
| 20 to 34 years | 0 (0.0%) | 0.0 |
| 35 to 50 years | 1 (100.0%) | 21.0 |
| Total | 1 (100.0%) | 10.0 |
Fertility by Age by Marriage Status in Forestville
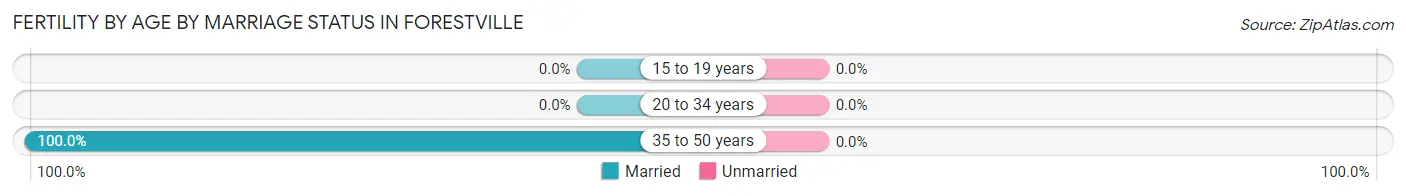
| Age Bracket | Married | Unmarried |
| 15 to 19 years | 0 (0.0%) | 0 (0.0%) |
| 20 to 34 years | 0 (0.0%) | 0 (0.0%) |
| 35 to 50 years | 1 (100.0%) | 0 (0.0%) |
| Total | 1 (100.0%) | 0 (0.0%) |
Fertility by Education in Forestville
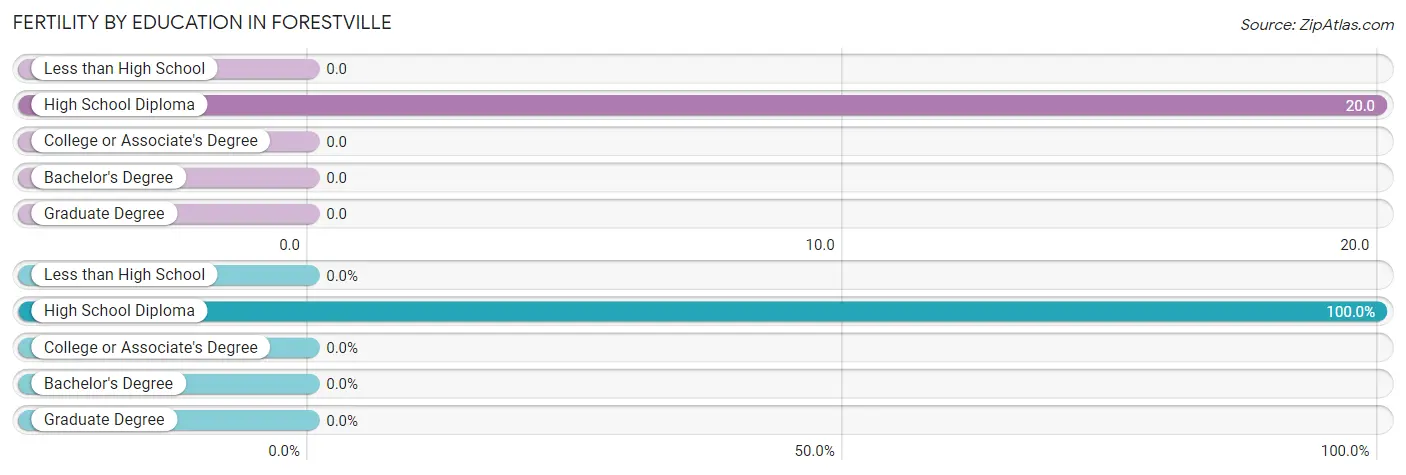
| Educational Attainment | Women with Births | Births / 1,000 Women |
| Less than High School | 0 (0.0%) | 0.0 |
| High School Diploma | 1 (100.0%) | 20.0 |
| College or Associate's Degree | 0 (0.0%) | 0.0 |
| Bachelor's Degree | 0 (0.0%) | 0.0 |
| Graduate Degree | 0 (0.0%) | 0.0 |
| Total | 1 (100.0%) | 10.0 |
Fertility by Education by Marriage Status in Forestville
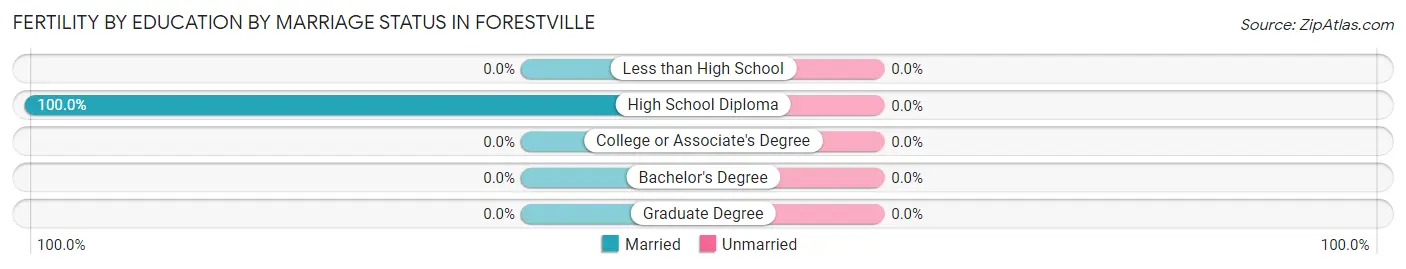
| Educational Attainment | Married | Unmarried |
| Less than High School | 0 (0.0%) | 0 (0.0%) |
| High School Diploma | 1 (100.0%) | 0 (0.0%) |
| College or Associate's Degree | 0 (0.0%) | 0 (0.0%) |
| Bachelor's Degree | 0 (0.0%) | 0 (0.0%) |
| Graduate Degree | 0 (0.0%) | 0 (0.0%) |
| Total | 1 (100.0%) | 0 (0.0%) |
Employment Characteristics in Forestville
Employment by Class of Employer in Forestville
Among the 327 employed individuals in Forestville, private company employees (222 | 67.9%), self-employed (not incorporated) (56 | 17.1%), and not-for-profit organizations (31 | 9.5%) make up the most common classes of employment.
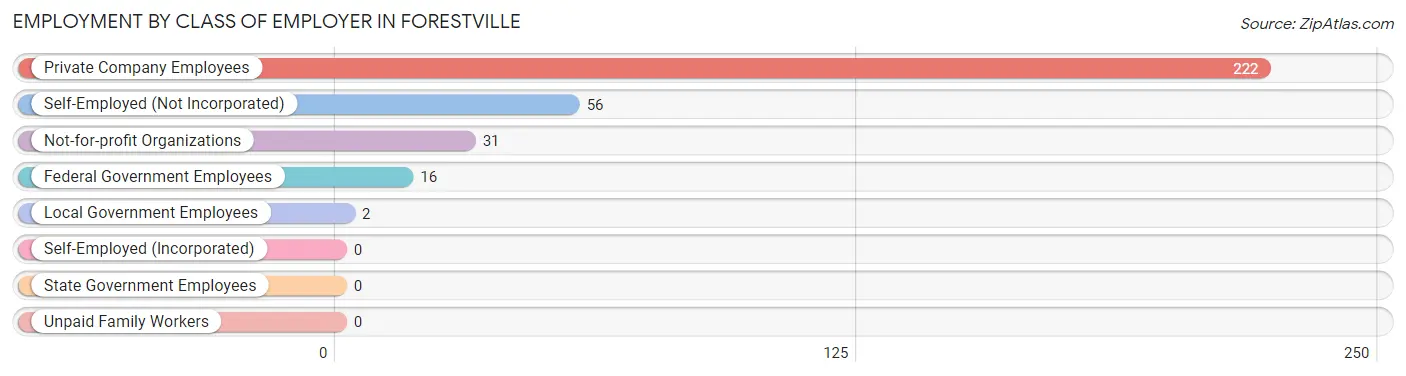
| Employer Class | # Employees | % Employees |
| Private Company Employees | 222 | 67.9% |
| Self-Employed (Incorporated) | 0 | 0.0% |
| Self-Employed (Not Incorporated) | 56 | 17.1% |
| Not-for-profit Organizations | 31 | 9.5% |
| Local Government Employees | 2 | 0.6% |
| State Government Employees | 0 | 0.0% |
| Federal Government Employees | 16 | 4.9% |
| Unpaid Family Workers | 0 | 0.0% |
| Total | 327 | 100.0% |
Employment Status by Age in Forestville
According to the labor force statistics for Forestville, out of the total population over 16 years of age (469), 70.6% or 331 individuals are in the labor force, with 1.2% or 4 of them unemployed. The age group with the highest labor force participation rate is 20 to 24 years, with 100.0% or 26 individuals in the labor force. Within the labor force, the 60 to 64 years age range has the highest percentage of unemployed individuals, with 44.4% or 4 of them being unemployed.
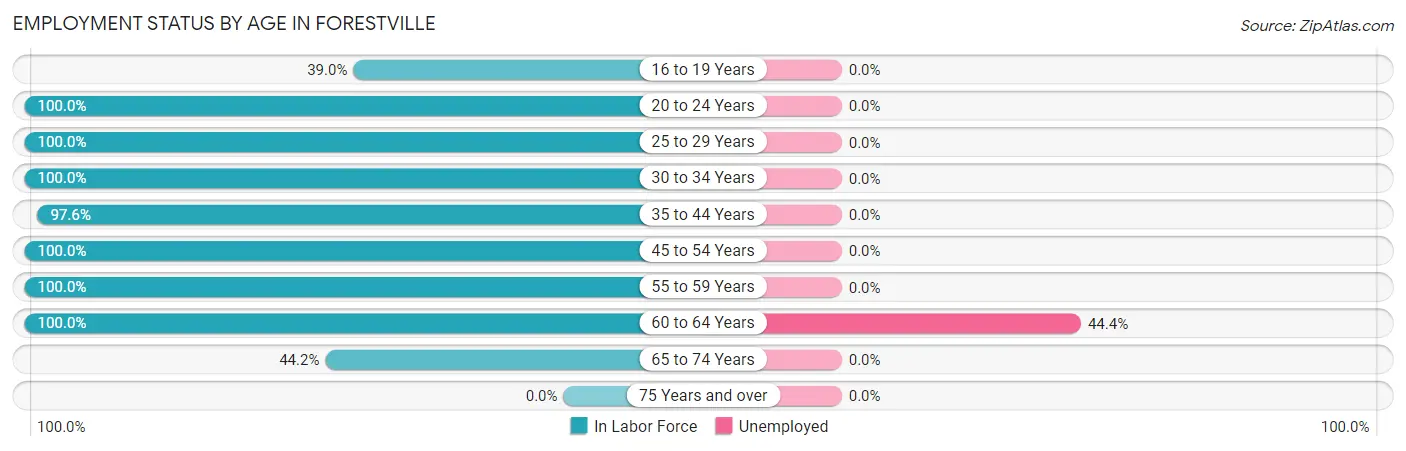
| Age Bracket | In Labor Force | Unemployed |
| 16 to 19 Years | 23 (39.0%) | 0 (0.0%) |
| 20 to 24 Years | 26 (100.0%) | 0 (0.0%) |
| 25 to 29 Years | 8 (100.0%) | 0 (0.0%) |
| 30 to 34 Years | 44 (100.0%) | 0 (0.0%) |
| 35 to 44 Years | 120 (97.6%) | 0 (0.0%) |
| 45 to 54 Years | 21 (100.0%) | 0 (0.0%) |
| 55 to 59 Years | 19 (100.0%) | 0 (0.0%) |
| 60 to 64 Years | 9 (100.0%) | 4 (44.4%) |
| 65 to 74 Years | 61 (44.2%) | 0 (0.0%) |
| 75 Years and over | 0 (0.0%) | 0 (0.0%) |
| Total | 331 (70.6%) | 4 (1.2%) |
Employment Status by Educational Attainment in Forestville
According to labor force statistics for Forestville, 98.7% of individuals (221) out of the total population between 25 and 64 years of age (224) are in the labor force, with 1.8% or 4 of them being unemployed. The group with the highest labor force participation rate are those with the educational attainment of less than high school, with 100.0% or 29 individuals in the labor force. Within the labor force, individuals with high school diploma education have the highest percentage of unemployment, with 6.6% or 4 of them being unemployed.
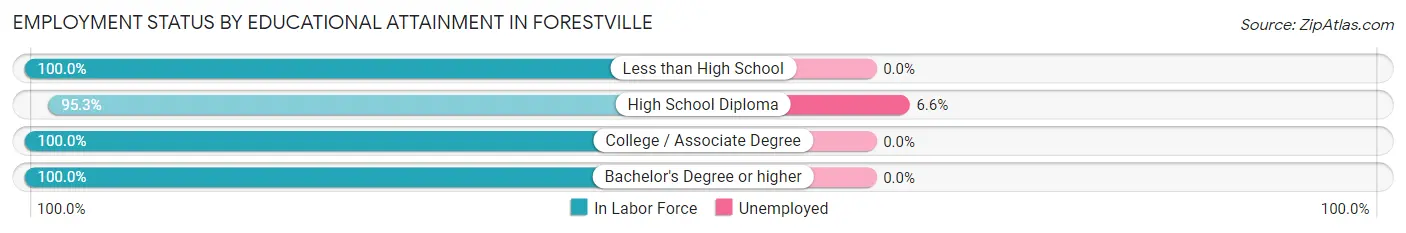
| Educational Attainment | In Labor Force | Unemployed |
| Less than High School | 29 (100.0%) | 0 (0.0%) |
| High School Diploma | 61 (95.3%) | 4 (6.6%) |
| College / Associate Degree | 46 (100.0%) | 0 (0.0%) |
| Bachelor's Degree or higher | 85 (100.0%) | 0 (0.0%) |
| Total | 221 (98.7%) | 4 (1.8%) |
Employment Occupations by Sex in Forestville
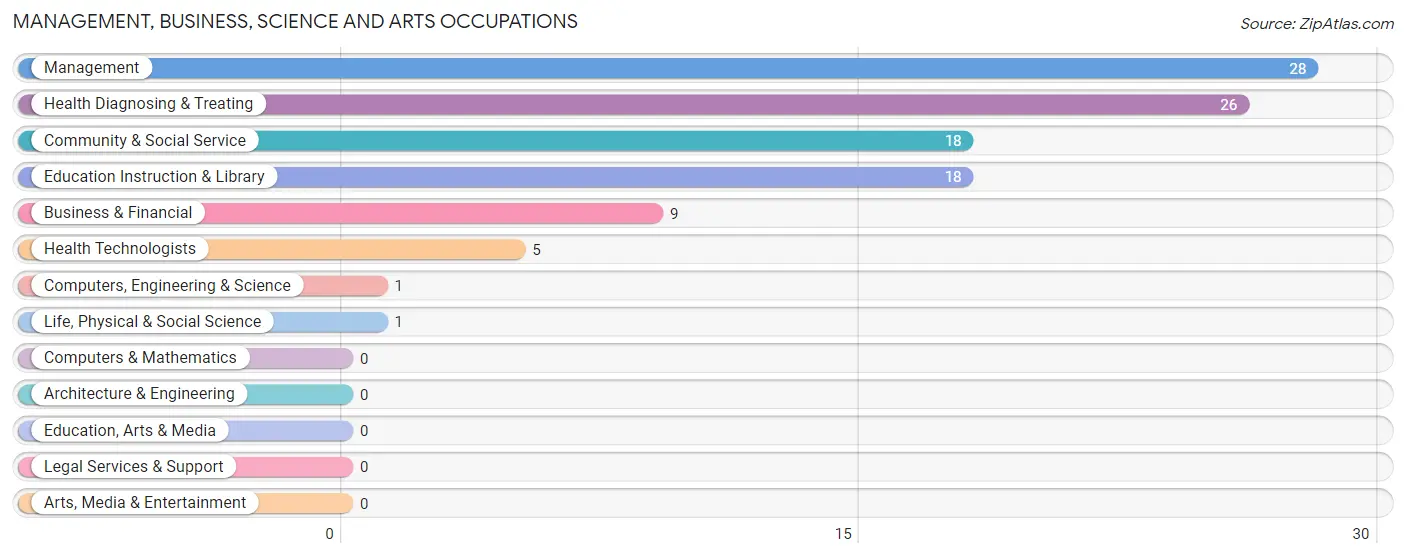
Management, Business, Science and Arts Occupations
The most common Management, Business, Science and Arts occupations in Forestville are Management (28 | 8.6%), Health Diagnosing & Treating (26 | 8.0%), Community & Social Service (18 | 5.5%), Education Instruction & Library (18 | 5.5%), and Business & Financial (9 | 2.8%).
Management, Business, Science and Arts Occupations by Sex
Within the Management, Business, Science and Arts occupations in Forestville, the most male-oriented occupations are Computers, Engineering & Science (100.0%), Life, Physical & Social Science (100.0%), and Business & Financial (66.7%), while the most female-oriented occupations are Community & Social Service (100.0%), Education Instruction & Library (100.0%), and Health Diagnosing & Treating (100.0%).
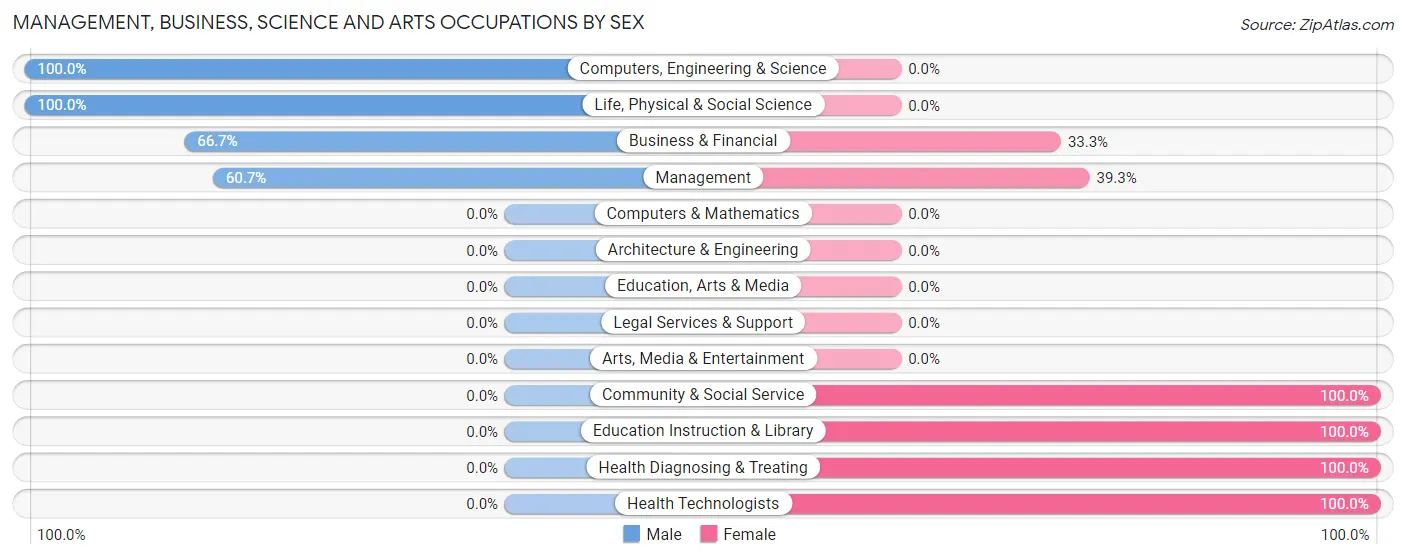
| Occupation | Male | Female |
| Management | 17 (60.7%) | 11 (39.3%) |
| Business & Financial | 6 (66.7%) | 3 (33.3%) |
| Computers, Engineering & Science | 1 (100.0%) | 0 (0.0%) |
| Computers & Mathematics | 0 (0.0%) | 0 (0.0%) |
| Architecture & Engineering | 0 (0.0%) | 0 (0.0%) |
| Life, Physical & Social Science | 1 (100.0%) | 0 (0.0%) |
| Community & Social Service | 0 (0.0%) | 18 (100.0%) |
| Education, Arts & Media | 0 (0.0%) | 0 (0.0%) |
| Legal Services & Support | 0 (0.0%) | 0 (0.0%) |
| Education Instruction & Library | 0 (0.0%) | 18 (100.0%) |
| Arts, Media & Entertainment | 0 (0.0%) | 0 (0.0%) |
| Health Diagnosing & Treating | 0 (0.0%) | 26 (100.0%) |
| Health Technologists | 0 (0.0%) | 5 (100.0%) |
| Total (Category) | 24 (29.3%) | 58 (70.7%) |
| Total (Overall) | 230 (70.3%) | 97 (29.7%) |
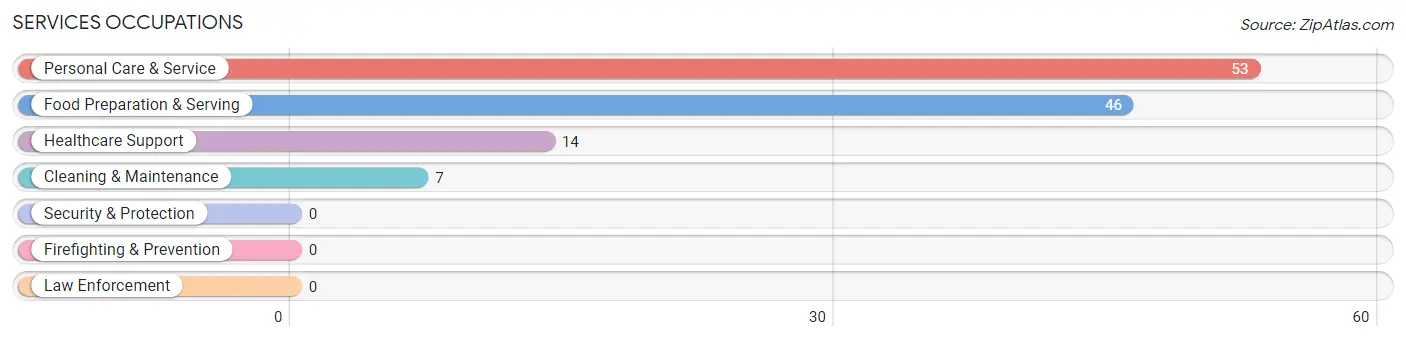
Services Occupations
The most common Services occupations in Forestville are Personal Care & Service (53 | 16.2%), Food Preparation & Serving (46 | 14.1%), Healthcare Support (14 | 4.3%), and Cleaning & Maintenance (7 | 2.1%).
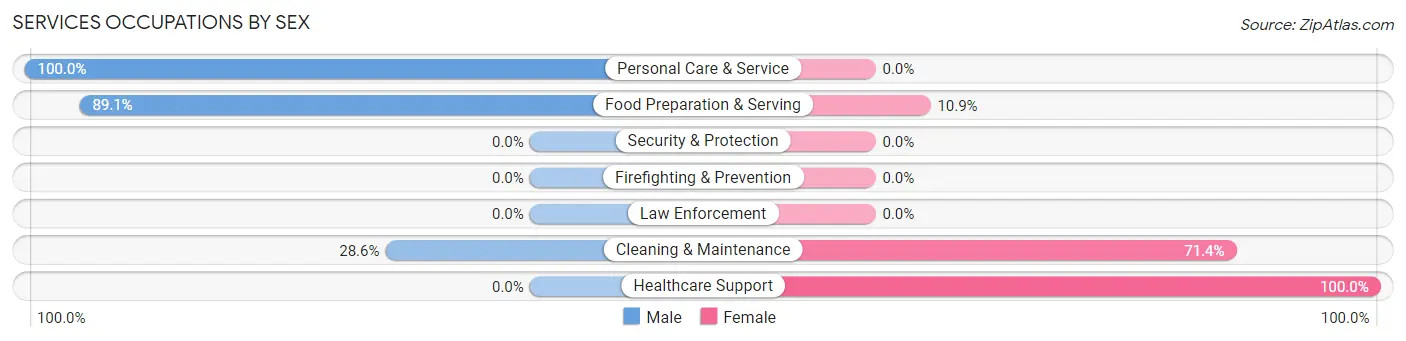
Services Occupations by Sex
Within the Services occupations in Forestville, the most male-oriented occupations are Personal Care & Service (100.0%), Food Preparation & Serving (89.1%), and Cleaning & Maintenance (28.6%), while the most female-oriented occupations are Healthcare Support (100.0%), Cleaning & Maintenance (71.4%), and Food Preparation & Serving (10.9%).
| Occupation | Male | Female |
| Healthcare Support | 0 (0.0%) | 14 (100.0%) |
| Security & Protection | 0 (0.0%) | 0 (0.0%) |
| Firefighting & Prevention | 0 (0.0%) | 0 (0.0%) |
| Law Enforcement | 0 (0.0%) | 0 (0.0%) |
| Food Preparation & Serving | 41 (89.1%) | 5 (10.9%) |
| Cleaning & Maintenance | 2 (28.6%) | 5 (71.4%) |
| Personal Care & Service | 53 (100.0%) | 0 (0.0%) |
| Total (Category) | 96 (80.0%) | 24 (20.0%) |
| Total (Overall) | 230 (70.3%) | 97 (29.7%) |
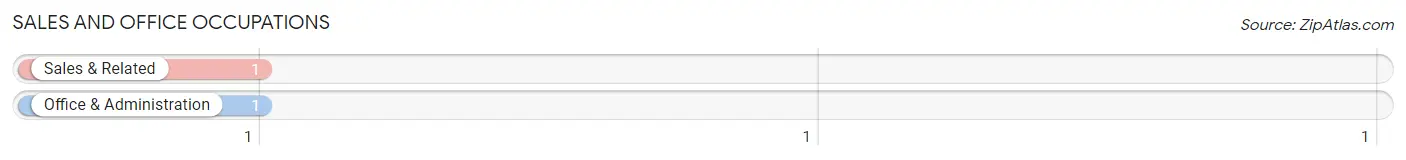
Sales and Office Occupations
The most common Sales and Office occupations in Forestville are Sales & Related (1 | 0.3%), and Office & Administration (1 | 0.3%).
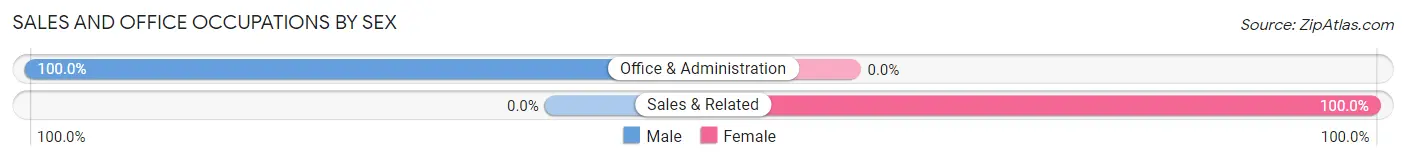
Sales and Office Occupations by Sex
| Occupation | Male | Female |
| Sales & Related | 0 (0.0%) | 1 (100.0%) |
| Office & Administration | 1 (100.0%) | 0 (0.0%) |
| Total (Category) | 1 (50.0%) | 1 (50.0%) |
| Total (Overall) | 230 (70.3%) | 97 (29.7%) |
Natural Resources, Construction and Maintenance Occupations
The most common Natural Resources, Construction and Maintenance occupations in Forestville are , and Construction & Extraction (34 | 10.4%).
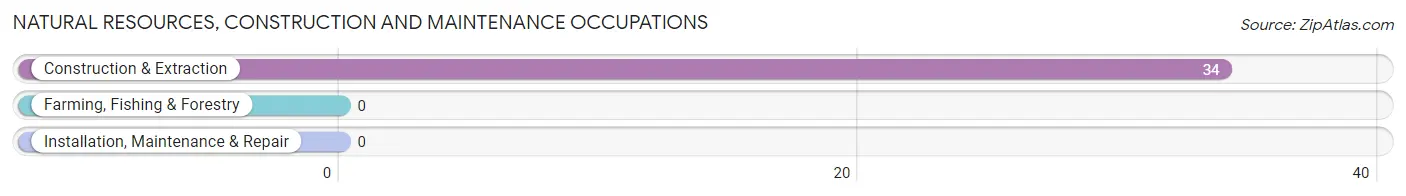
Natural Resources, Construction and Maintenance Occupations by Sex
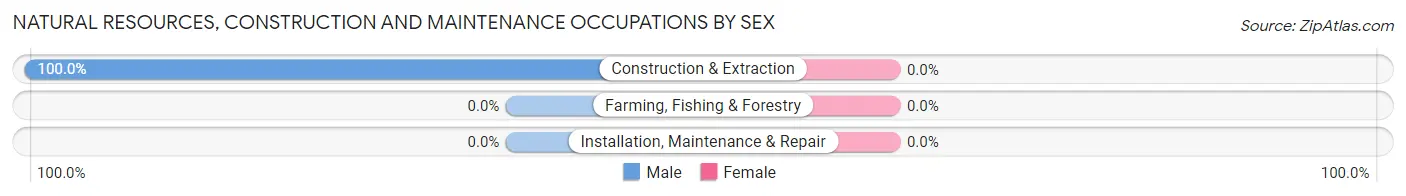
| Occupation | Male | Female |
| Farming, Fishing & Forestry | 0 (0.0%) | 0 (0.0%) |
| Construction & Extraction | 34 (100.0%) | 0 (0.0%) |
| Installation, Maintenance & Repair | 0 (0.0%) | 0 (0.0%) |
| Total (Category) | 34 (100.0%) | 0 (0.0%) |
| Total (Overall) | 230 (70.3%) | 97 (29.7%) |
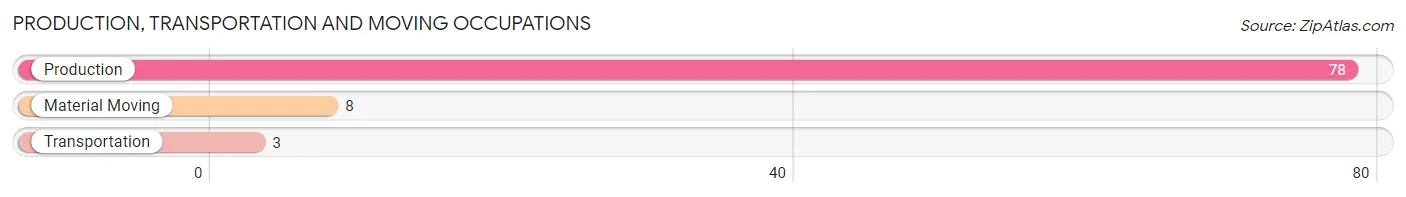
Production, Transportation and Moving Occupations
The most common Production, Transportation and Moving occupations in Forestville are Production (78 | 23.8%), Material Moving (8 | 2.5%), and Transportation (3 | 0.9%).
Production, Transportation and Moving Occupations by Sex
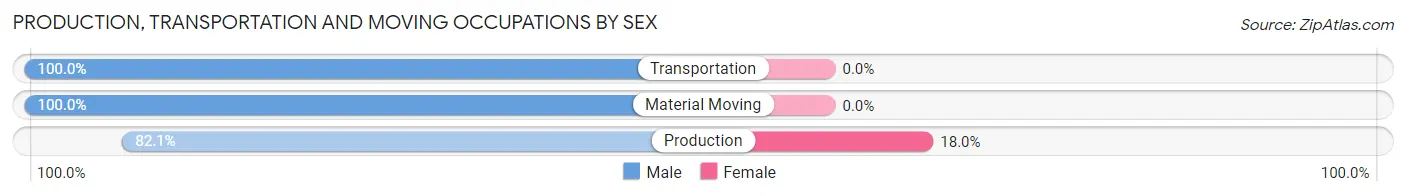
| Occupation | Male | Female |
| Production | 64 (82.1%) | 14 (17.9%) |
| Transportation | 3 (100.0%) | 0 (0.0%) |
| Material Moving | 8 (100.0%) | 0 (0.0%) |
| Total (Category) | 75 (84.3%) | 14 (15.7%) |
| Total (Overall) | 230 (70.3%) | 97 (29.7%) |
Employment Industries by Sex in Forestville
Employment Industries in Forestville
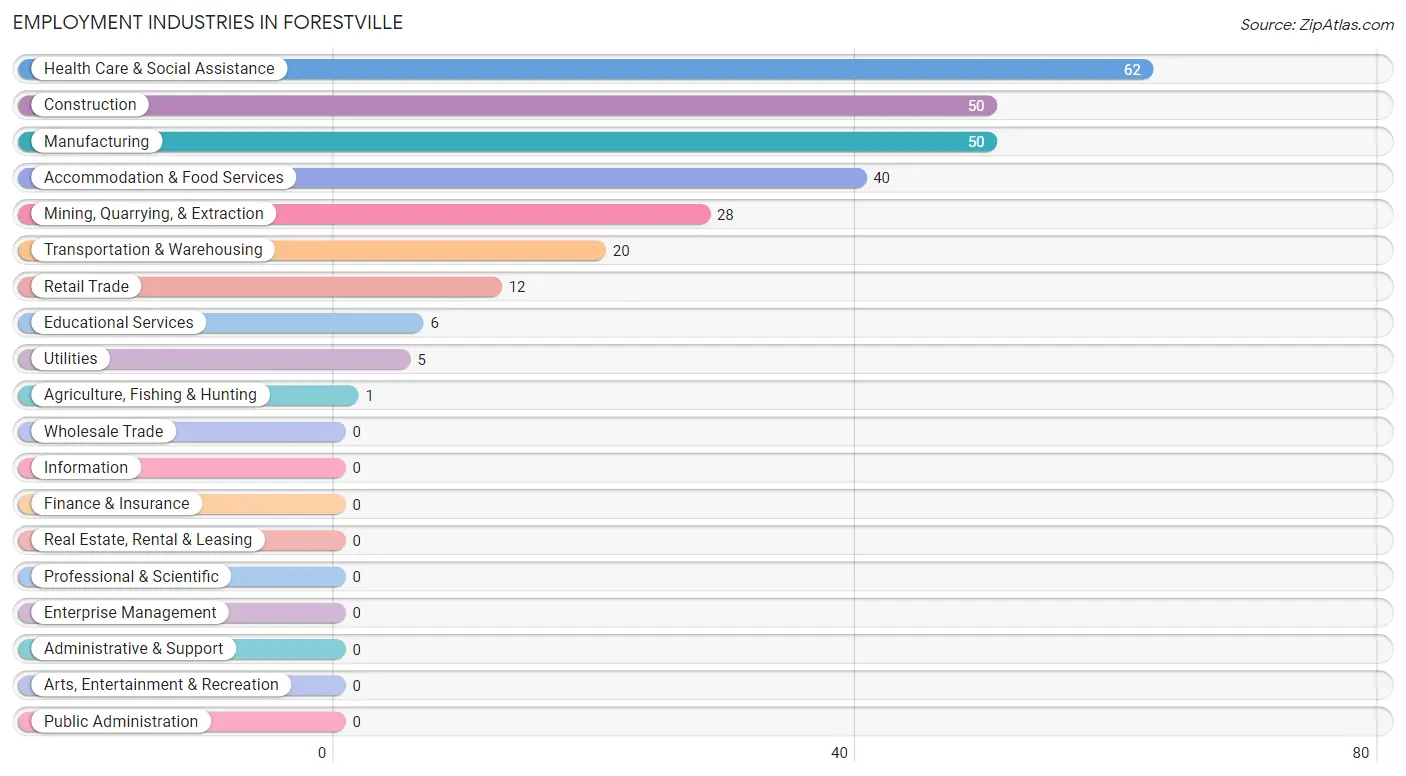
The major employment industries in Forestville include Health Care & Social Assistance (62 | 19.0%), Construction (50 | 15.3%), Manufacturing (50 | 15.3%), Accommodation & Food Services (40 | 12.2%), and Mining, Quarrying, & Extraction (28 | 8.6%).
Employment Industries by Sex in Forestville
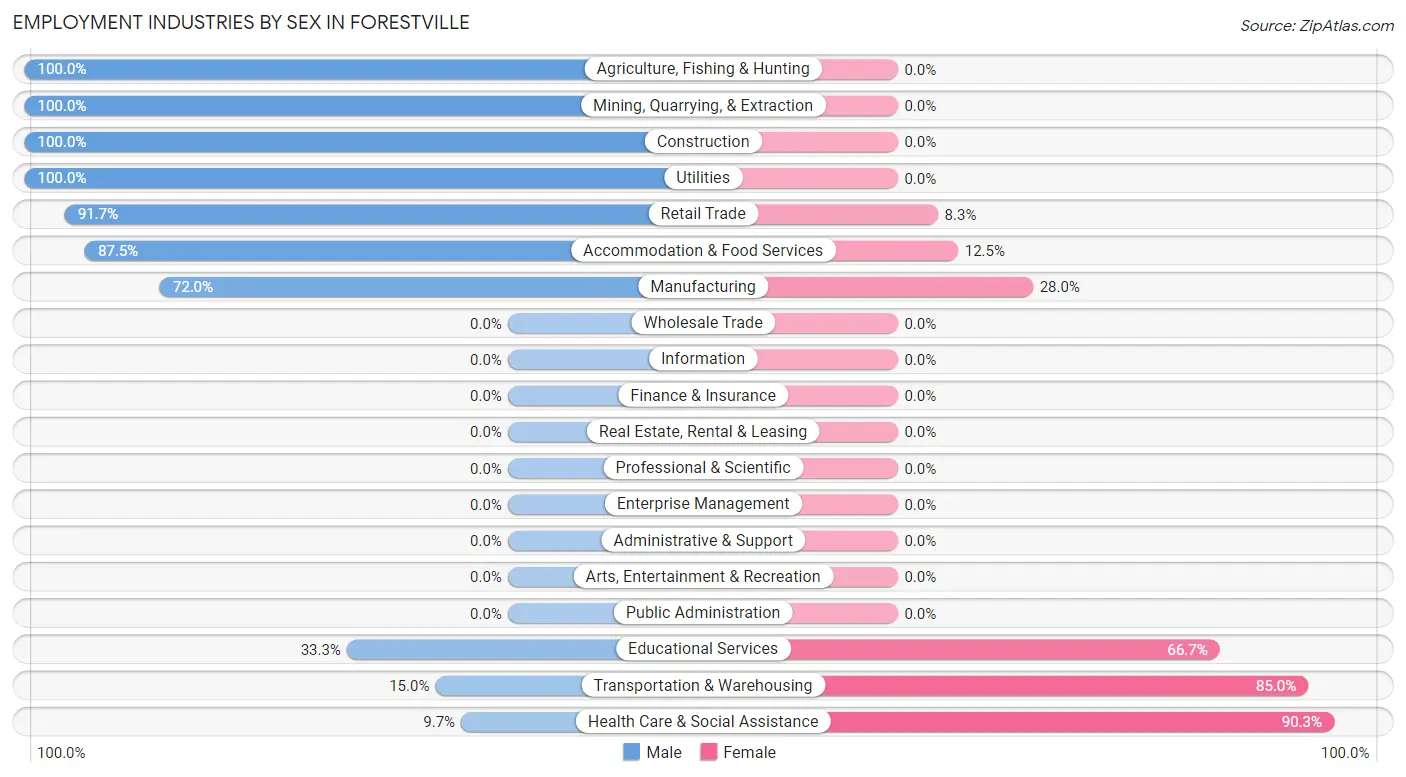
The Forestville industries that see more men than women are Agriculture, Fishing & Hunting (100.0%), Mining, Quarrying, & Extraction (100.0%), and Construction (100.0%), whereas the industries that tend to have a higher number of women are Health Care & Social Assistance (90.3%), Transportation & Warehousing (85.0%), and Educational Services (66.7%).
| Industry | Male | Female |
| Agriculture, Fishing & Hunting | 1 (100.0%) | 0 (0.0%) |
| Mining, Quarrying, & Extraction | 28 (100.0%) | 0 (0.0%) |
| Construction | 50 (100.0%) | 0 (0.0%) |
| Manufacturing | 36 (72.0%) | 14 (28.0%) |
| Wholesale Trade | 0 (0.0%) | 0 (0.0%) |
| Retail Trade | 11 (91.7%) | 1 (8.3%) |
| Transportation & Warehousing | 3 (15.0%) | 17 (85.0%) |
| Utilities | 5 (100.0%) | 0 (0.0%) |
| Information | 0 (0.0%) | 0 (0.0%) |
| Finance & Insurance | 0 (0.0%) | 0 (0.0%) |
| Real Estate, Rental & Leasing | 0 (0.0%) | 0 (0.0%) |
| Professional & Scientific | 0 (0.0%) | 0 (0.0%) |
| Enterprise Management | 0 (0.0%) | 0 (0.0%) |
| Administrative & Support | 0 (0.0%) | 0 (0.0%) |
| Educational Services | 2 (33.3%) | 4 (66.7%) |
| Health Care & Social Assistance | 6 (9.7%) | 56 (90.3%) |
| Arts, Entertainment & Recreation | 0 (0.0%) | 0 (0.0%) |
| Accommodation & Food Services | 35 (87.5%) | 5 (12.5%) |
| Public Administration | 0 (0.0%) | 0 (0.0%) |
| Total | 230 (70.3%) | 97 (29.7%) |
Education in Forestville
School Enrollment in Forestville
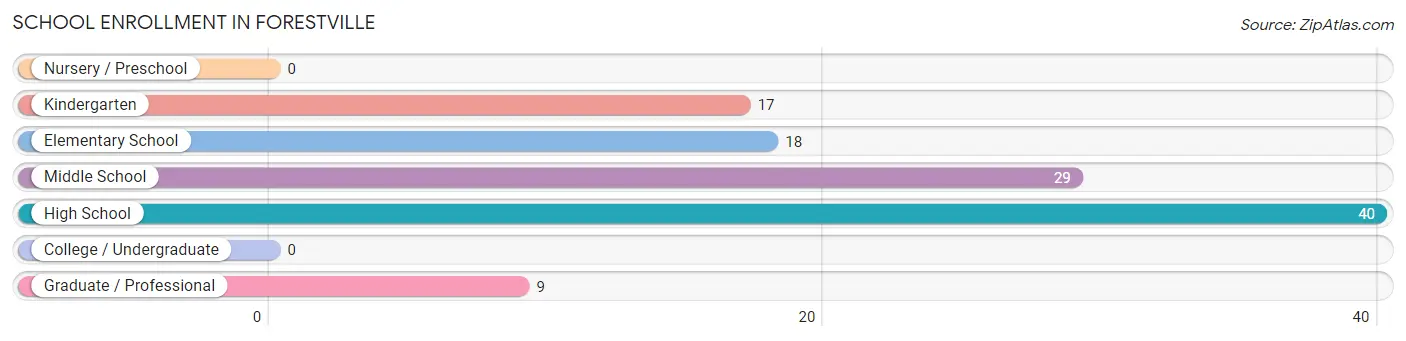
The most common levels of schooling among the 113 students in Forestville are high school (40 | 35.4%), middle school (29 | 25.7%), and elementary school (18 | 15.9%).
| School Level | # Students | % Students |
| Nursery / Preschool | 0 | 0.0% |
| Kindergarten | 17 | 15.0% |
| Elementary School | 18 | 15.9% |
| Middle School | 29 | 25.7% |
| High School | 40 | 35.4% |
| College / Undergraduate | 0 | 0.0% |
| Graduate / Professional | 9 | 8.0% |
| Total | 113 | 100.0% |
School Enrollment by Age by Funding Source in Forestville
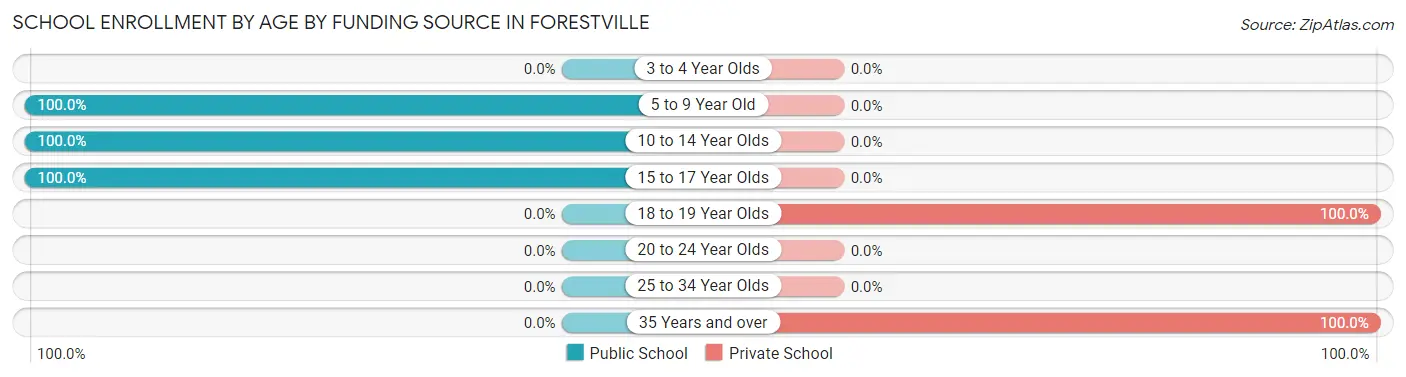
Out of a total of 113 students who are enrolled in schools in Forestville, 26 (23.0%) attend a private institution, while the remaining 87 (77.0%) are enrolled in public schools. The age group of 18 to 19 year olds has the highest likelihood of being enrolled in private schools, with 17 (100.0% in the age bracket) enrolled. Conversely, the age group of 5 to 9 year old has the lowest likelihood of being enrolled in a private school, with 35 (100.0% in the age bracket) attending a public institution.
| Age Bracket | Public School | Private School |
| 3 to 4 Year Olds | 0 (0.0%) | 0 (0.0%) |
| 5 to 9 Year Old | 35 (100.0%) | 0 (0.0%) |
| 10 to 14 Year Olds | 29 (100.0%) | 0 (0.0%) |
| 15 to 17 Year Olds | 23 (100.0%) | 0 (0.0%) |
| 18 to 19 Year Olds | 0 (0.0%) | 17 (100.0%) |
| 20 to 24 Year Olds | 0 (0.0%) | 0 (0.0%) |
| 25 to 34 Year Olds | 0 (0.0%) | 0 (0.0%) |
| 35 Years and over | 0 (0.0%) | 9 (100.0%) |
| Total | 87 (77.0%) | 26 (23.0%) |
Educational Attainment by Field of Study in Forestville
Social sciences (55 | 39.3%), engineering (44 | 31.4%), education (28 | 20.0%), business (9 | 6.4%), and psychology (2 | 1.4%) are the most common fields of study among 140 individuals in Forestville who have obtained a bachelor's degree or higher.
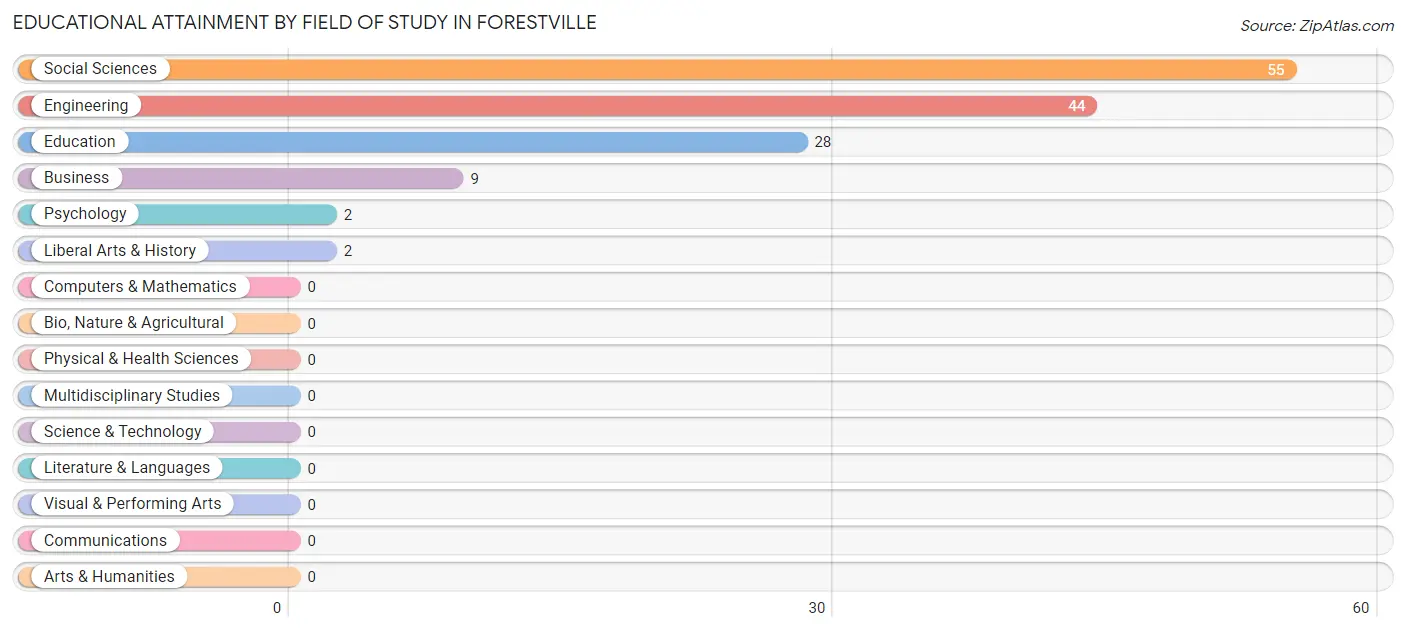
| Field of Study | # Graduates | % Graduates |
| Computers & Mathematics | 0 | 0.0% |
| Bio, Nature & Agricultural | 0 | 0.0% |
| Physical & Health Sciences | 0 | 0.0% |
| Psychology | 2 | 1.4% |
| Social Sciences | 55 | 39.3% |
| Engineering | 44 | 31.4% |
| Multidisciplinary Studies | 0 | 0.0% |
| Science & Technology | 0 | 0.0% |
| Business | 9 | 6.4% |
| Education | 28 | 20.0% |
| Literature & Languages | 0 | 0.0% |
| Liberal Arts & History | 2 | 1.4% |
| Visual & Performing Arts | 0 | 0.0% |
| Communications | 0 | 0.0% |
| Arts & Humanities | 0 | 0.0% |
| Total | 140 | 100.0% |
Transportation & Commute in Forestville
Vehicle Availability by Sex in Forestville
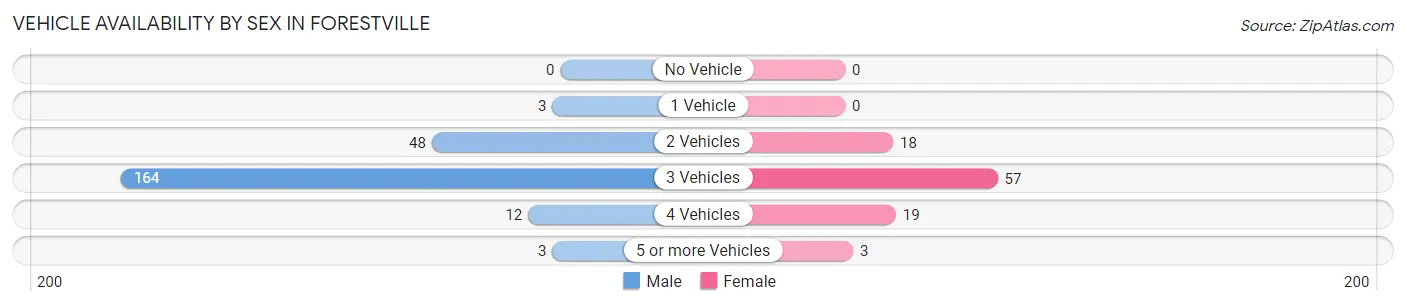
The most prevalent vehicle ownership categories in Forestville are males with 3 vehicles (164, accounting for 71.3%) and females with 3 vehicles (57, making up 169.1%).
| Vehicles Available | Male | Female |
| No Vehicle | 0 (0.0%) | 0 (0.0%) |
| 1 Vehicle | 3 (1.3%) | 0 (0.0%) |
| 2 Vehicles | 48 (20.9%) | 18 (18.6%) |
| 3 Vehicles | 164 (71.3%) | 57 (58.8%) |
| 4 Vehicles | 12 (5.2%) | 19 (19.6%) |
| 5 or more Vehicles | 3 (1.3%) | 3 (3.1%) |
| Total | 230 (100.0%) | 97 (100.0%) |
Commute Time in Forestville
The most frequently occuring commute durations in Forestville are 10 to 14 minutes (97 commuters, 29.7%), 60 to 89 minutes (74 commuters, 22.6%), and 30 to 34 minutes (63 commuters, 19.3%).
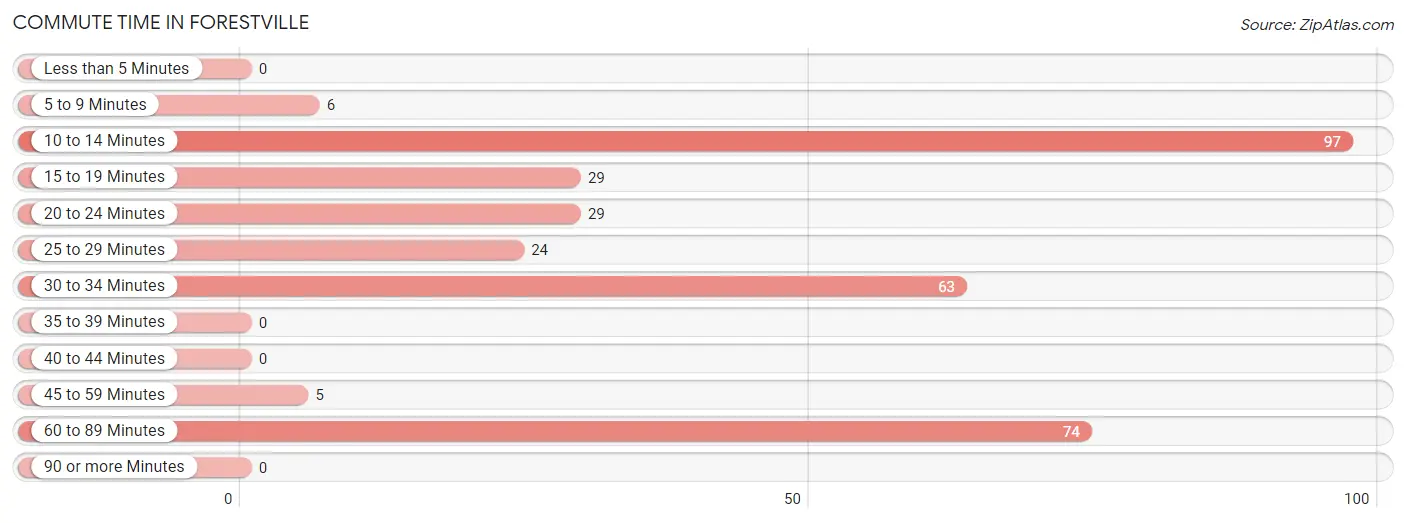
| Commute Time | # Commuters | % Commuters |
| Less than 5 Minutes | 0 | 0.0% |
| 5 to 9 Minutes | 6 | 1.8% |
| 10 to 14 Minutes | 97 | 29.7% |
| 15 to 19 Minutes | 29 | 8.9% |
| 20 to 24 Minutes | 29 | 8.9% |
| 25 to 29 Minutes | 24 | 7.3% |
| 30 to 34 Minutes | 63 | 19.3% |
| 35 to 39 Minutes | 0 | 0.0% |
| 40 to 44 Minutes | 0 | 0.0% |
| 45 to 59 Minutes | 5 | 1.5% |
| 60 to 89 Minutes | 74 | 22.6% |
| 90 or more Minutes | 0 | 0.0% |
Commute Time by Sex in Forestville
The most common commute times in Forestville are 60 to 89 minutes (74 commuters, 32.2%) for males and 10 to 14 minutes (26 commuters, 26.8%) for females.
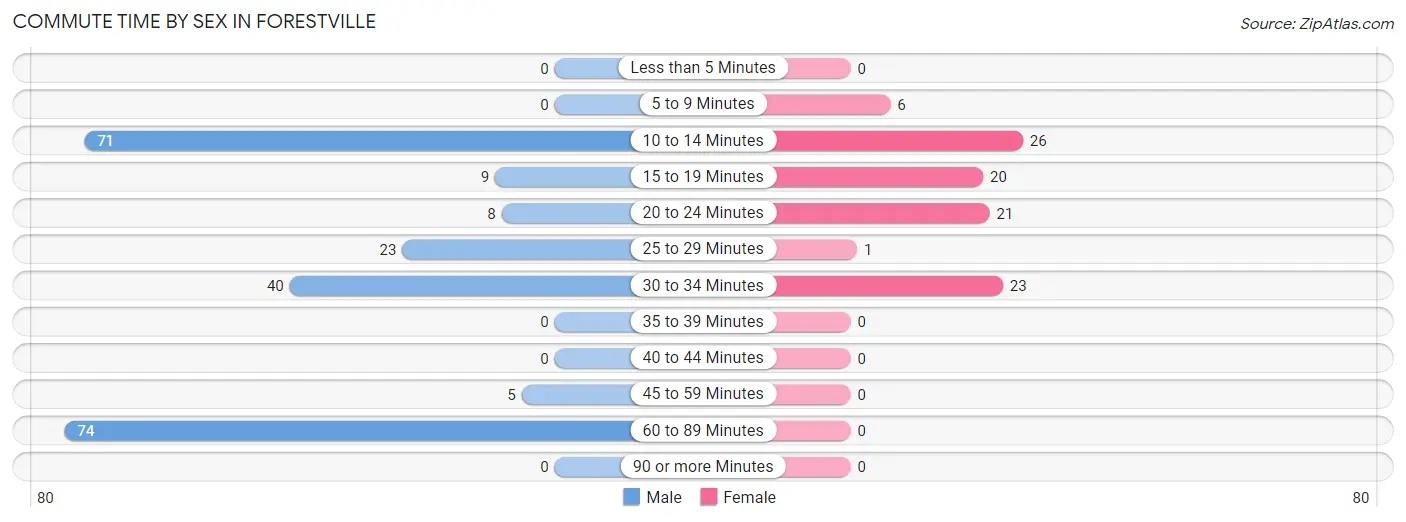
| Commute Time | Male | Female |
| Less than 5 Minutes | 0 (0.0%) | 0 (0.0%) |
| 5 to 9 Minutes | 0 (0.0%) | 6 (6.2%) |
| 10 to 14 Minutes | 71 (30.9%) | 26 (26.8%) |
| 15 to 19 Minutes | 9 (3.9%) | 20 (20.6%) |
| 20 to 24 Minutes | 8 (3.5%) | 21 (21.6%) |
| 25 to 29 Minutes | 23 (10.0%) | 1 (1.0%) |
| 30 to 34 Minutes | 40 (17.4%) | 23 (23.7%) |
| 35 to 39 Minutes | 0 (0.0%) | 0 (0.0%) |
| 40 to 44 Minutes | 0 (0.0%) | 0 (0.0%) |
| 45 to 59 Minutes | 5 (2.2%) | 0 (0.0%) |
| 60 to 89 Minutes | 74 (32.2%) | 0 (0.0%) |
| 90 or more Minutes | 0 (0.0%) | 0 (0.0%) |
Time of Departure to Work by Sex in Forestville
The most frequent times of departure to work in Forestville are 5:00 AM to 5:29 AM (76, 33.0%) for males and 7:30 AM to 7:59 AM (24, 24.7%) for females.
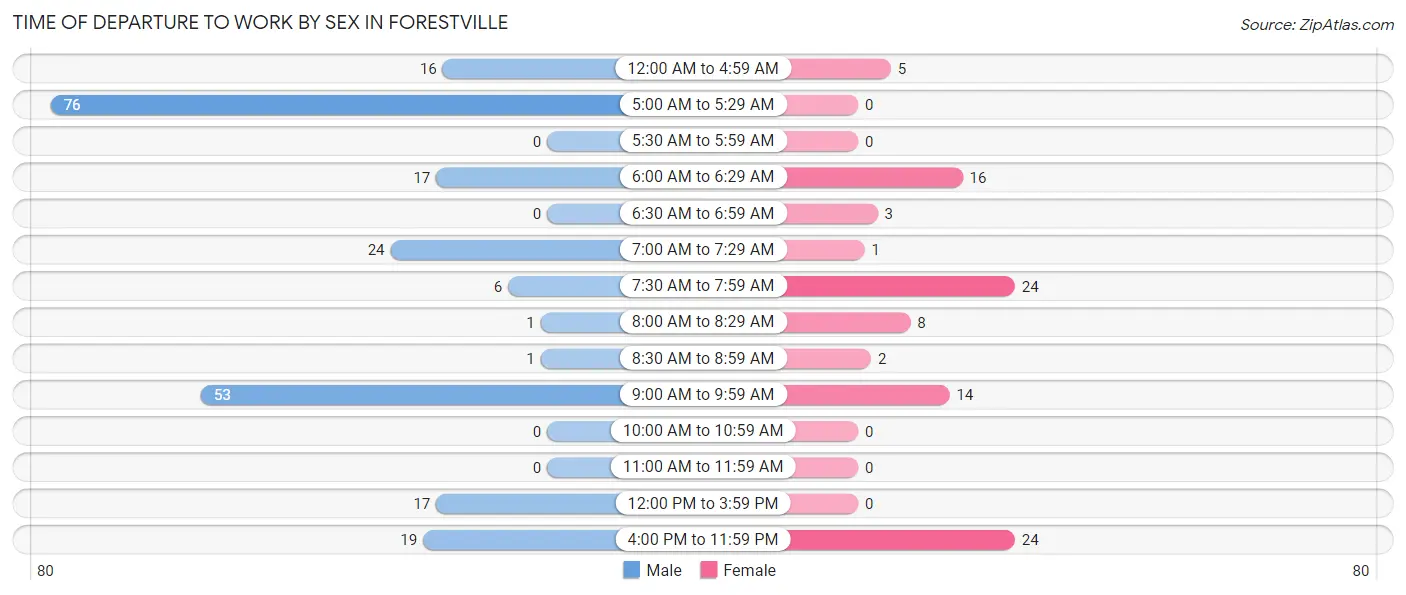
| Time of Departure | Male | Female |
| 12:00 AM to 4:59 AM | 16 (7.0%) | 5 (5.1%) |
| 5:00 AM to 5:29 AM | 76 (33.0%) | 0 (0.0%) |
| 5:30 AM to 5:59 AM | 0 (0.0%) | 0 (0.0%) |
| 6:00 AM to 6:29 AM | 17 (7.4%) | 16 (16.5%) |
| 6:30 AM to 6:59 AM | 0 (0.0%) | 3 (3.1%) |
| 7:00 AM to 7:29 AM | 24 (10.4%) | 1 (1.0%) |
| 7:30 AM to 7:59 AM | 6 (2.6%) | 24 (24.7%) |
| 8:00 AM to 8:29 AM | 1 (0.4%) | 8 (8.3%) |
| 8:30 AM to 8:59 AM | 1 (0.4%) | 2 (2.1%) |
| 9:00 AM to 9:59 AM | 53 (23.0%) | 14 (14.4%) |
| 10:00 AM to 10:59 AM | 0 (0.0%) | 0 (0.0%) |
| 11:00 AM to 11:59 AM | 0 (0.0%) | 0 (0.0%) |
| 12:00 PM to 3:59 PM | 17 (7.4%) | 0 (0.0%) |
| 4:00 PM to 11:59 PM | 19 (8.3%) | 24 (24.7%) |
| Total | 230 (100.0%) | 97 (100.0%) |
Housing Occupancy in Forestville
Occupancy by Ownership in Forestville
Of the total 190 dwellings in Forestville, owner-occupied units account for 167 (87.9%), while renter-occupied units make up 23 (12.1%).
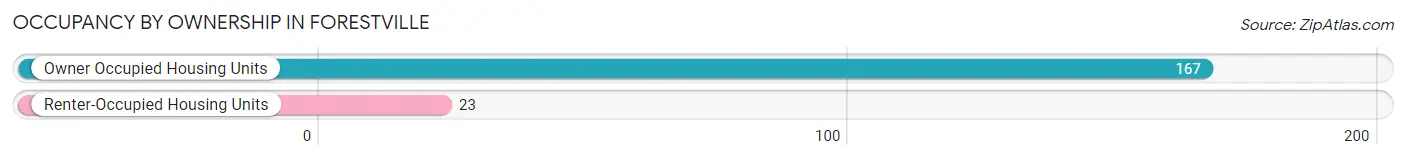
| Occupancy | # Housing Units | % Housing Units |
| Owner Occupied Housing Units | 167 | 87.9% |
| Renter-Occupied Housing Units | 23 | 12.1% |
| Total Occupied Housing Units | 190 | 100.0% |
Occupancy by Household Size in Forestville
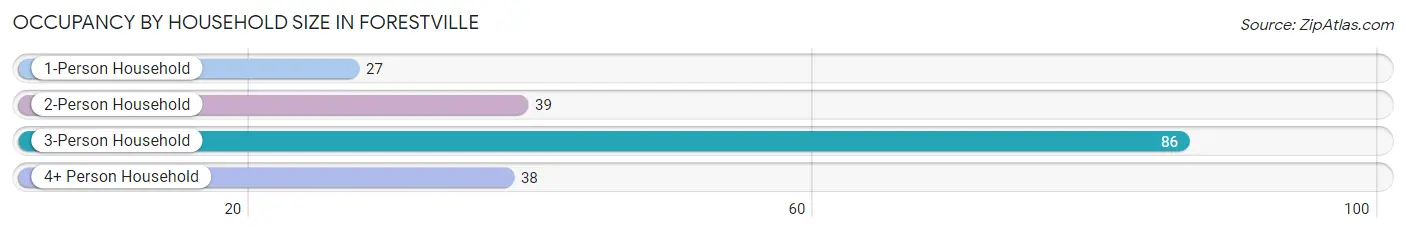
| Household Size | # Housing Units | % Housing Units |
| 1-Person Household | 27 | 14.2% |
| 2-Person Household | 39 | 20.5% |
| 3-Person Household | 86 | 45.3% |
| 4+ Person Household | 38 | 20.0% |
| Total Housing Units | 190 | 100.0% |
Occupancy by Ownership by Household Size in Forestville
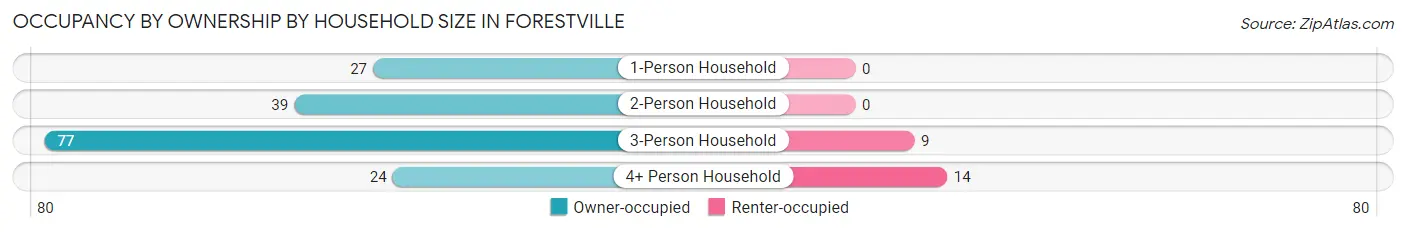
| Household Size | Owner-occupied | Renter-occupied |
| 1-Person Household | 27 (100.0%) | 0 (0.0%) |
| 2-Person Household | 39 (100.0%) | 0 (0.0%) |
| 3-Person Household | 77 (89.5%) | 9 (10.5%) |
| 4+ Person Household | 24 (63.2%) | 14 (36.8%) |
| Total Housing Units | 167 (87.9%) | 23 (12.1%) |
Occupancy by Educational Attainment in Forestville
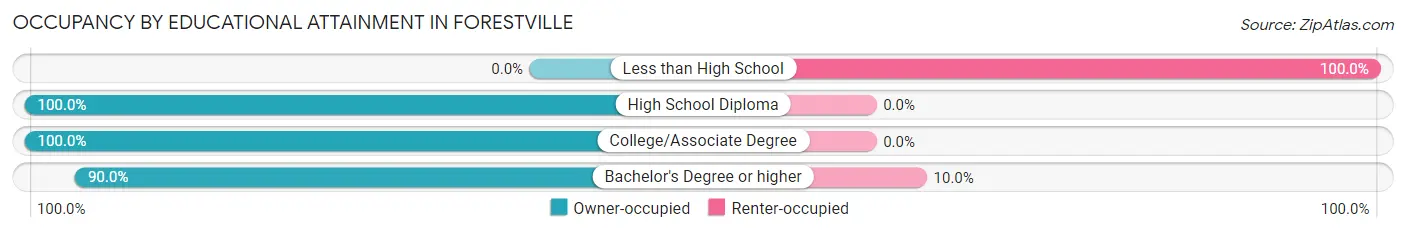
| Household Size | Owner-occupied | Renter-occupied |
| Less than High School | 0 (0.0%) | 14 (100.0%) |
| High School Diploma | 42 (100.0%) | 0 (0.0%) |
| College/Associate Degree | 44 (100.0%) | 0 (0.0%) |
| Bachelor's Degree or higher | 81 (90.0%) | 9 (10.0%) |
Occupancy by Age of Householder in Forestville
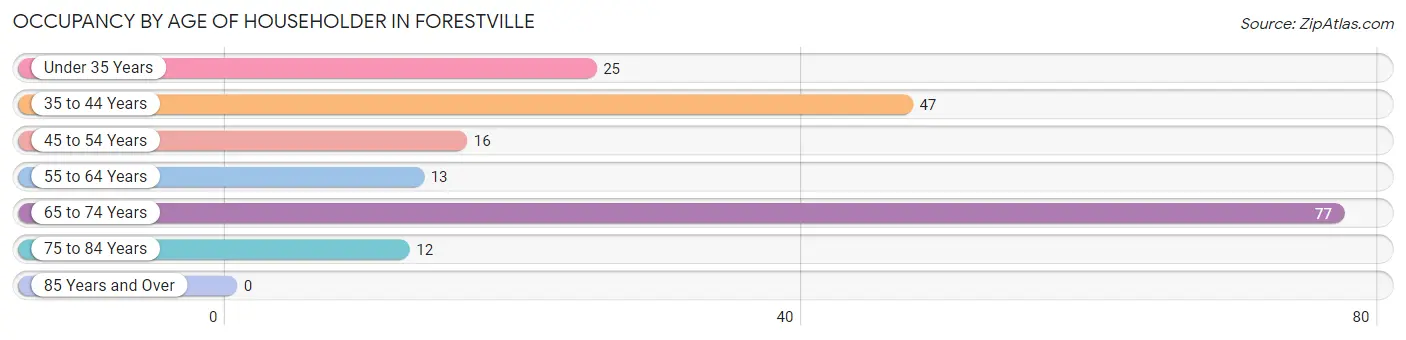
| Age Bracket | # Households | % Households |
| Under 35 Years | 25 | 13.2% |
| 35 to 44 Years | 47 | 24.7% |
| 45 to 54 Years | 16 | 8.4% |
| 55 to 64 Years | 13 | 6.8% |
| 65 to 74 Years | 77 | 40.5% |
| 75 to 84 Years | 12 | 6.3% |
| 85 Years and Over | 0 | 0.0% |
| Total | 190 | 100.0% |
Housing Finances in Forestville
Median Income by Occupancy in Forestville
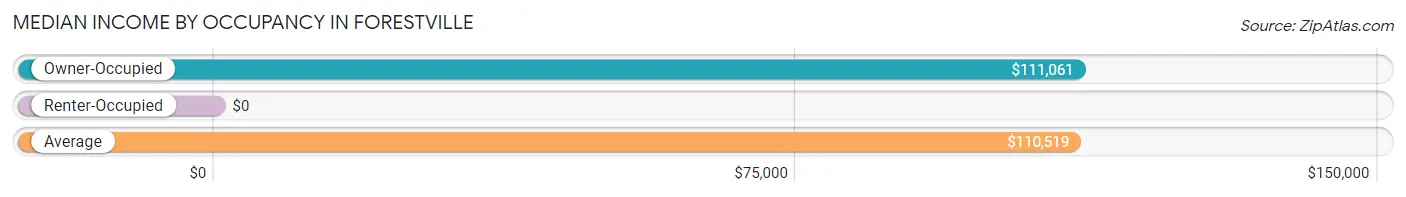
| Occupancy Type | # Households | Median Income |
| Owner-Occupied | 167 (87.9%) | $111,061 |
| Renter-Occupied | 23 (12.1%) | $0 |
| Average | 190 (100.0%) | $110,519 |
Occupancy by Householder Income Bracket in Forestville
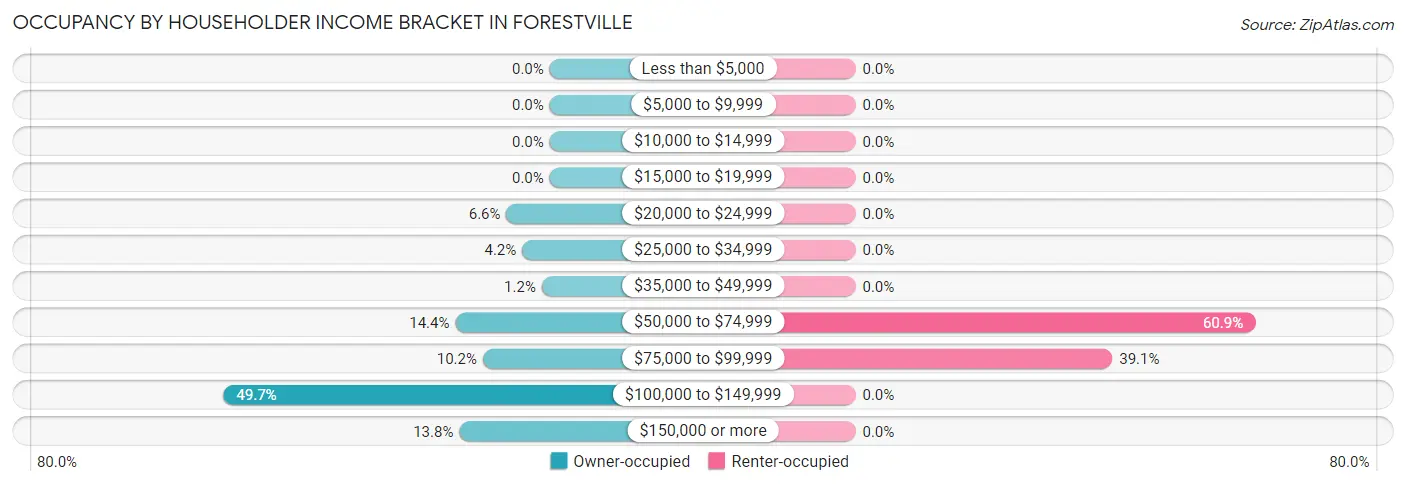
| Income Bracket | Owner-occupied | Renter-occupied |
| Less than $5,000 | 0 (0.0%) | 0 (0.0%) |
| $5,000 to $9,999 | 0 (0.0%) | 0 (0.0%) |
| $10,000 to $14,999 | 0 (0.0%) | 0 (0.0%) |
| $15,000 to $19,999 | 0 (0.0%) | 0 (0.0%) |
| $20,000 to $24,999 | 11 (6.6%) | 0 (0.0%) |
| $25,000 to $34,999 | 7 (4.2%) | 0 (0.0%) |
| $35,000 to $49,999 | 2 (1.2%) | 0 (0.0%) |
| $50,000 to $74,999 | 24 (14.4%) | 14 (60.9%) |
| $75,000 to $99,999 | 17 (10.2%) | 9 (39.1%) |
| $100,000 to $149,999 | 83 (49.7%) | 0 (0.0%) |
| $150,000 or more | 23 (13.8%) | 0 (0.0%) |
| Total | 167 (100.0%) | 23 (100.0%) |
Monthly Housing Cost Tiers in Forestville
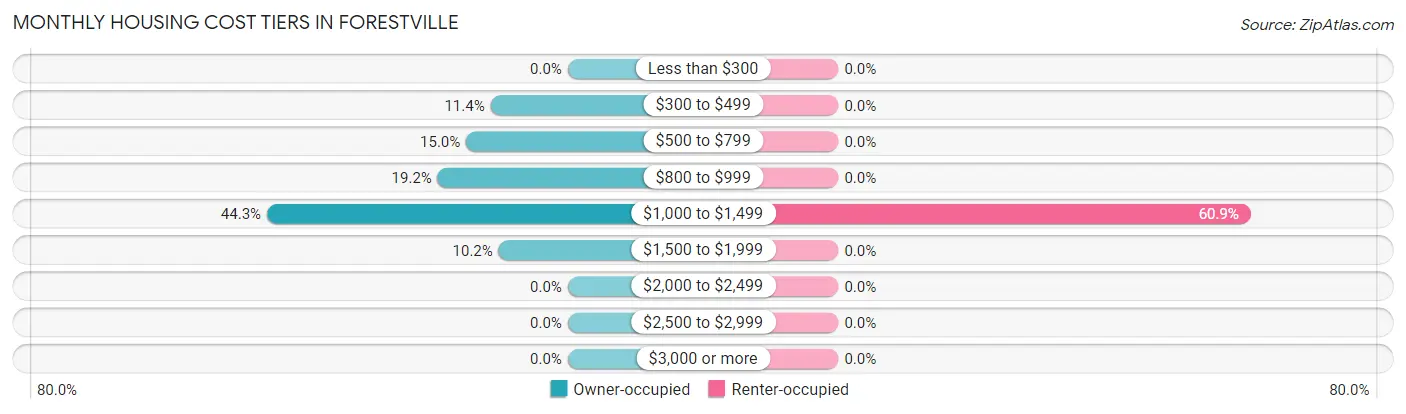
| Monthly Cost | Owner-occupied | Renter-occupied |
| Less than $300 | 0 (0.0%) | 0 (0.0%) |
| $300 to $499 | 19 (11.4%) | 0 (0.0%) |
| $500 to $799 | 25 (15.0%) | 0 (0.0%) |
| $800 to $999 | 32 (19.2%) | 0 (0.0%) |
| $1,000 to $1,499 | 74 (44.3%) | 14 (60.9%) |
| $1,500 to $1,999 | 17 (10.2%) | 0 (0.0%) |
| $2,000 to $2,499 | 0 (0.0%) | 0 (0.0%) |
| $2,500 to $2,999 | 0 (0.0%) | 0 (0.0%) |
| $3,000 or more | 0 (0.0%) | 0 (0.0%) |
| Total | 167 (100.0%) | 23 (100.0%) |
Physical Housing Characteristics in Forestville
Housing Structures in Forestville
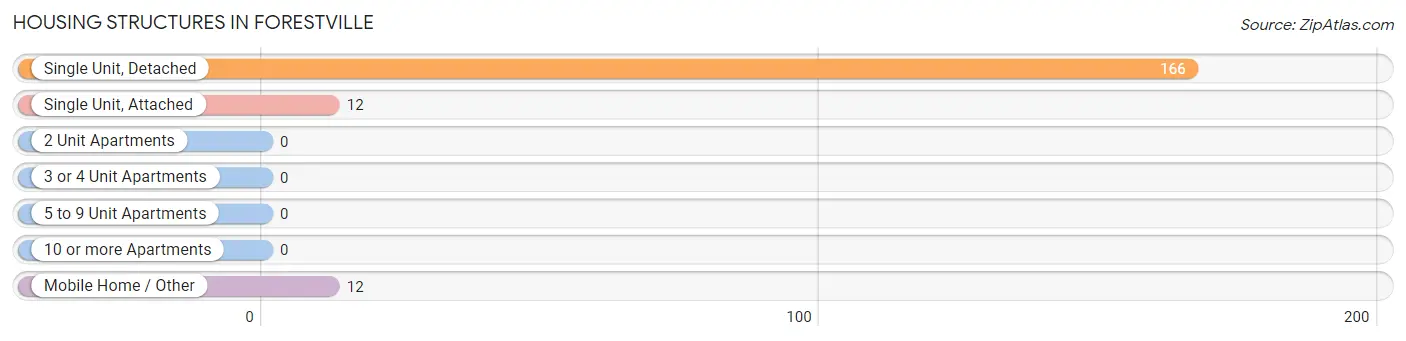
| Structure Type | # Housing Units | % Housing Units |
| Single Unit, Detached | 166 | 87.4% |
| Single Unit, Attached | 12 | 6.3% |
| 2 Unit Apartments | 0 | 0.0% |
| 3 or 4 Unit Apartments | 0 | 0.0% |
| 5 to 9 Unit Apartments | 0 | 0.0% |
| 10 or more Apartments | 0 | 0.0% |
| Mobile Home / Other | 12 | 6.3% |
| Total | 190 | 100.0% |
Housing Structures by Occupancy in Forestville
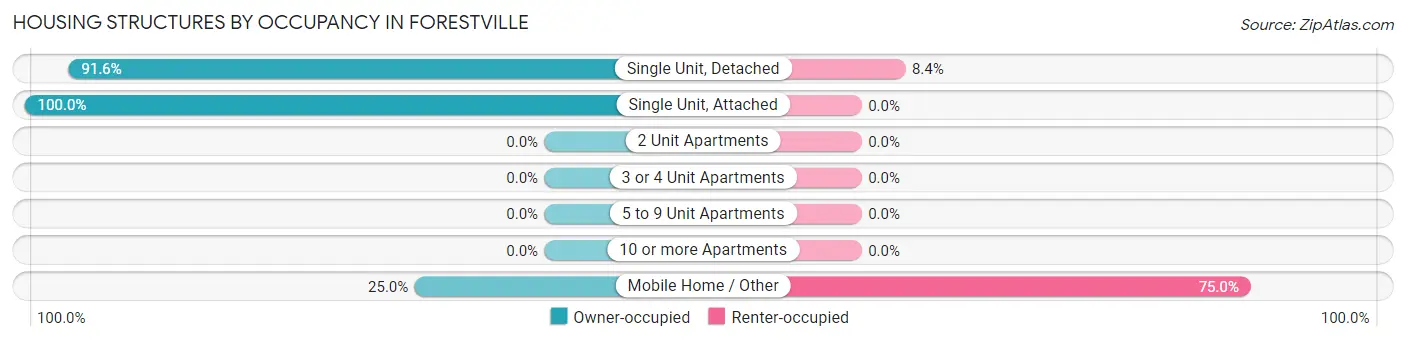
| Structure Type | Owner-occupied | Renter-occupied |
| Single Unit, Detached | 152 (91.6%) | 14 (8.4%) |
| Single Unit, Attached | 12 (100.0%) | 0 (0.0%) |
| 2 Unit Apartments | 0 (0.0%) | 0 (0.0%) |
| 3 or 4 Unit Apartments | 0 (0.0%) | 0 (0.0%) |
| 5 to 9 Unit Apartments | 0 (0.0%) | 0 (0.0%) |
| 10 or more Apartments | 0 (0.0%) | 0 (0.0%) |
| Mobile Home / Other | 3 (25.0%) | 9 (75.0%) |
| Total | 167 (87.9%) | 23 (12.1%) |
Housing Structures by Number of Rooms in Forestville
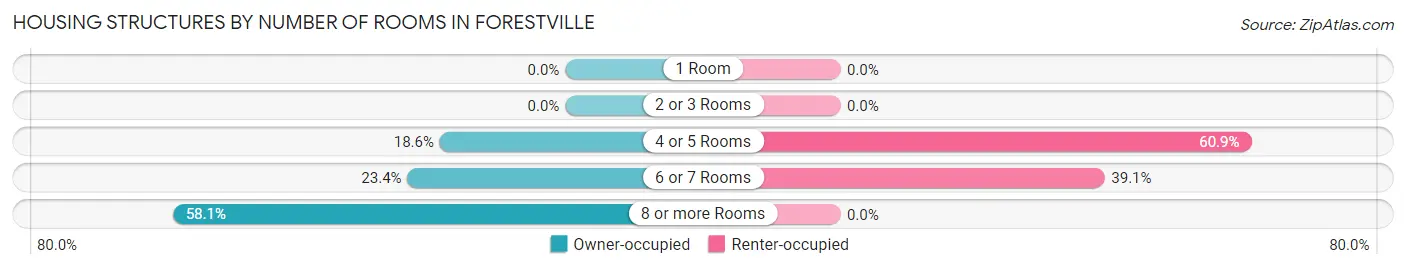
| Number of Rooms | Owner-occupied | Renter-occupied |
| 1 Room | 0 (0.0%) | 0 (0.0%) |
| 2 or 3 Rooms | 0 (0.0%) | 0 (0.0%) |
| 4 or 5 Rooms | 31 (18.6%) | 14 (60.9%) |
| 6 or 7 Rooms | 39 (23.4%) | 9 (39.1%) |
| 8 or more Rooms | 97 (58.1%) | 0 (0.0%) |
| Total | 167 (100.0%) | 23 (100.0%) |
Housing Structure by Heating Type in Forestville
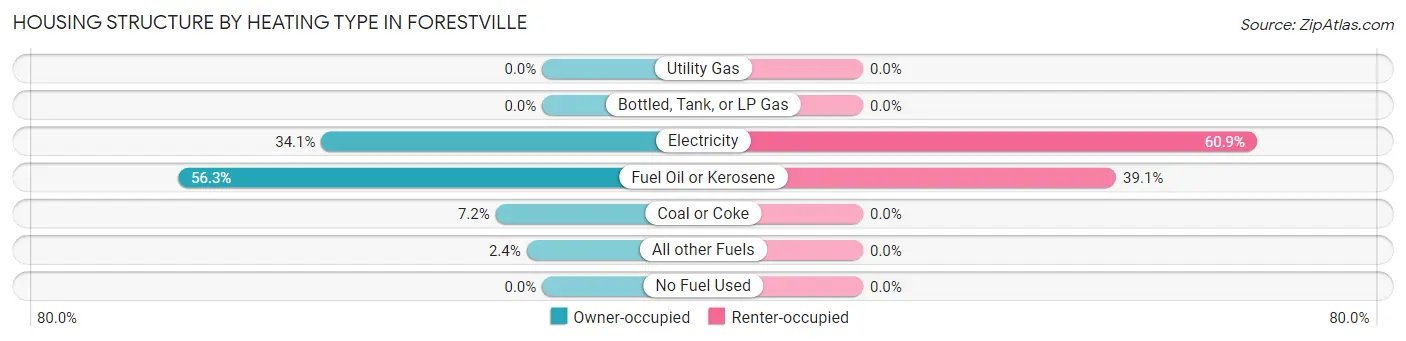
| Heating Type | Owner-occupied | Renter-occupied |
| Utility Gas | 0 (0.0%) | 0 (0.0%) |
| Bottled, Tank, or LP Gas | 0 (0.0%) | 0 (0.0%) |
| Electricity | 57 (34.1%) | 14 (60.9%) |
| Fuel Oil or Kerosene | 94 (56.3%) | 9 (39.1%) |
| Coal or Coke | 12 (7.2%) | 0 (0.0%) |
| All other Fuels | 4 (2.4%) | 0 (0.0%) |
| No Fuel Used | 0 (0.0%) | 0 (0.0%) |
| Total | 167 (100.0%) | 23 (100.0%) |
Household Vehicle Usage in Forestville
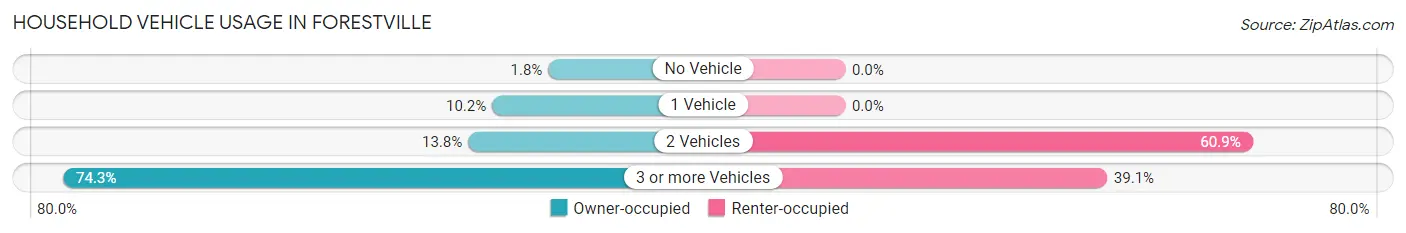
| Vehicles per Household | Owner-occupied | Renter-occupied |
| No Vehicle | 3 (1.8%) | 0 (0.0%) |
| 1 Vehicle | 17 (10.2%) | 0 (0.0%) |
| 2 Vehicles | 23 (13.8%) | 14 (60.9%) |
| 3 or more Vehicles | 124 (74.3%) | 9 (39.1%) |
| Total | 167 (100.0%) | 23 (100.0%) |
Real Estate & Mortgages in Forestville
Real Estate and Mortgage Overview in Forestville
| Characteristic | Without Mortgage | With Mortgage |
| Housing Units | 103 | 64 |
| Median Property Value | $251,400 | $90,000 |
| Median Household Income | $110,118 | $23 |
| Monthly Housing Costs | $1,303 | $0 |
| Real Estate Taxes | $4,112 | $0 |
Property Value by Mortgage Status in Forestville
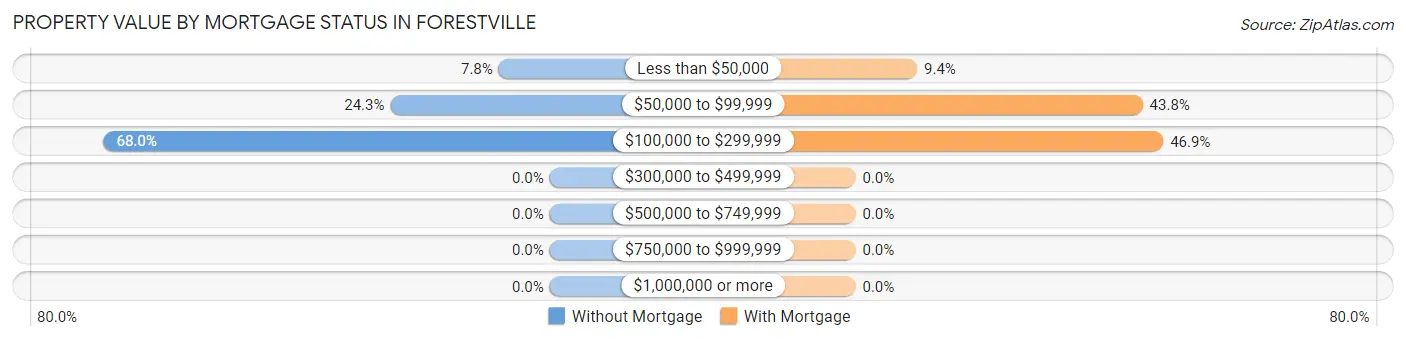
| Property Value | Without Mortgage | With Mortgage |
| Less than $50,000 | 8 (7.8%) | 6 (9.4%) |
| $50,000 to $99,999 | 25 (24.3%) | 28 (43.8%) |
| $100,000 to $299,999 | 70 (68.0%) | 30 (46.9%) |
| $300,000 to $499,999 | 0 (0.0%) | 0 (0.0%) |
| $500,000 to $749,999 | 0 (0.0%) | 0 (0.0%) |
| $750,000 to $999,999 | 0 (0.0%) | 0 (0.0%) |
| $1,000,000 or more | 0 (0.0%) | 0 (0.0%) |
| Total | 103 (100.0%) | 64 (100.0%) |
Household Income by Mortgage Status in Forestville
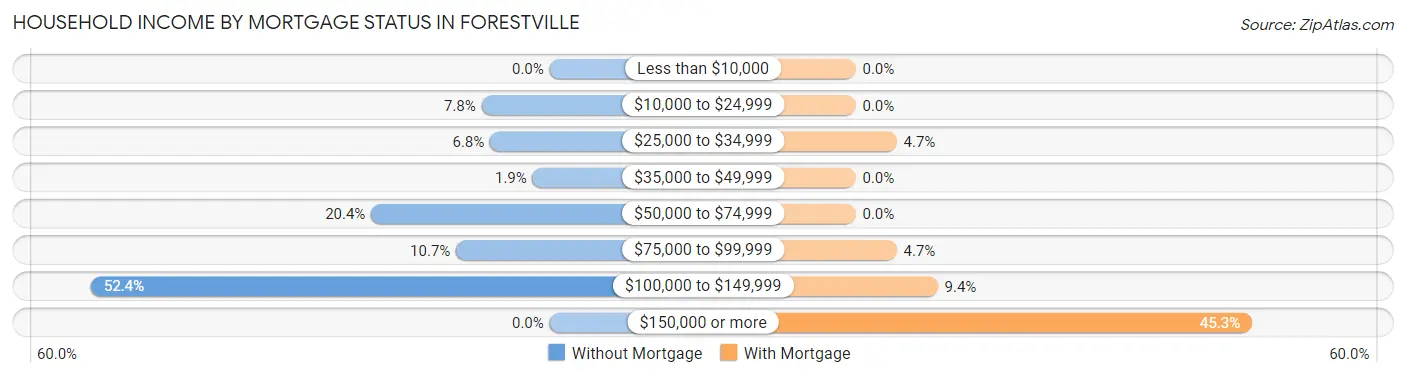
| Household Income | Without Mortgage | With Mortgage |
| Less than $10,000 | 0 (0.0%) | 0 (0.0%) |
| $10,000 to $24,999 | 8 (7.8%) | 0 (0.0%) |
| $25,000 to $34,999 | 7 (6.8%) | 3 (4.7%) |
| $35,000 to $49,999 | 2 (1.9%) | 0 (0.0%) |
| $50,000 to $74,999 | 21 (20.4%) | 0 (0.0%) |
| $75,000 to $99,999 | 11 (10.7%) | 3 (4.7%) |
| $100,000 to $149,999 | 54 (52.4%) | 6 (9.4%) |
| $150,000 or more | 0 (0.0%) | 29 (45.3%) |
| Total | 103 (100.0%) | 64 (100.0%) |
Property Value to Household Income Ratio in Forestville
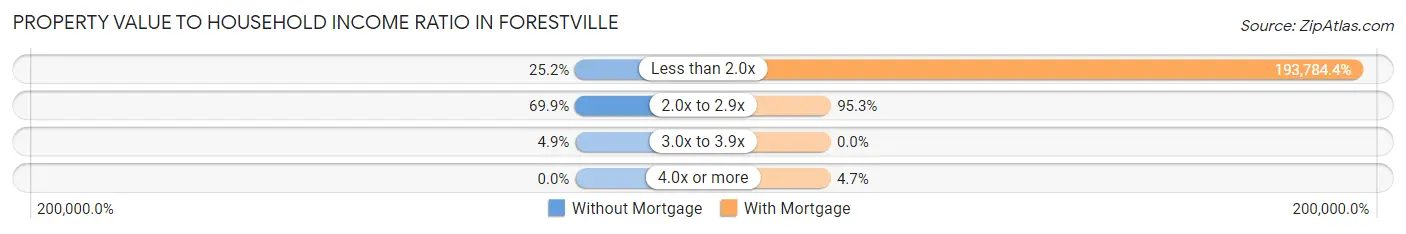
| Value-to-Income Ratio | Without Mortgage | With Mortgage |
| Less than 2.0x | 26 (25.2%) | 124,022 (193,784.4%) |
| 2.0x to 2.9x | 72 (69.9%) | 61 (95.3%) |
| 3.0x to 3.9x | 5 (4.9%) | 0 (0.0%) |
| 4.0x or more | 0 (0.0%) | 3 (4.7%) |
| Total | 103 (100.0%) | 64 (100.0%) |
Real Estate Taxes by Mortgage Status in Forestville
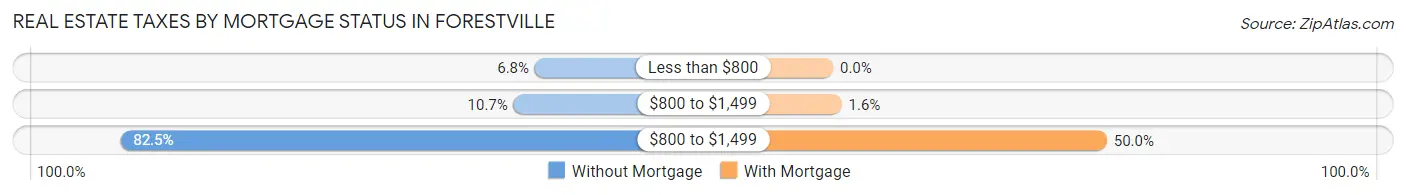
| Property Taxes | Without Mortgage | With Mortgage |
| Less than $800 | 7 (6.8%) | 0 (0.0%) |
| $800 to $1,499 | 11 (10.7%) | 1 (1.6%) |
| $800 to $1,499 | 85 (82.5%) | 32 (50.0%) |
| Total | 103 (100.0%) | 64 (100.0%) |
Health & Disability in Forestville
Health Insurance Coverage by Age in Forestville
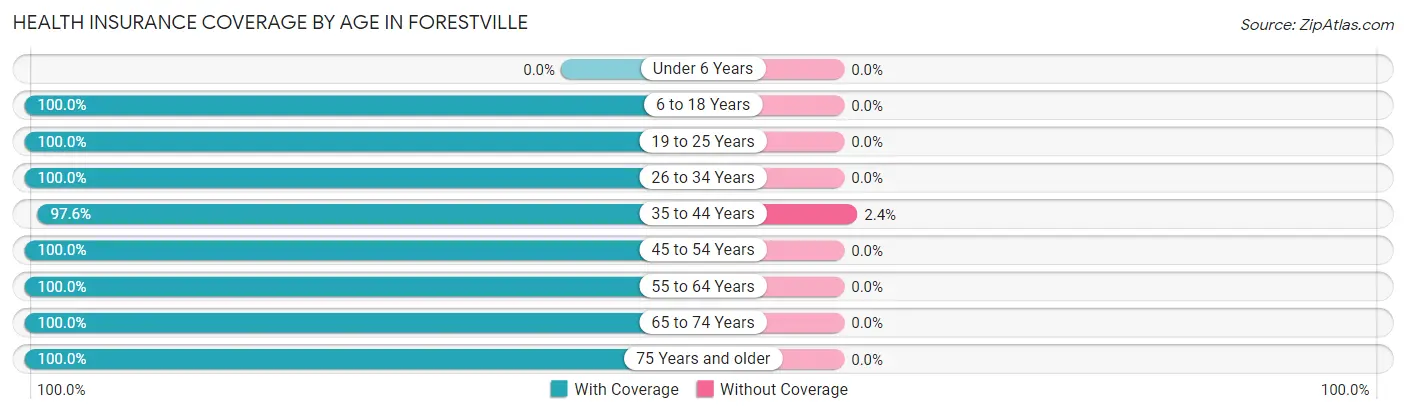
| Age Bracket | With Coverage | Without Coverage |
| Under 6 Years | 0 (0.0%) | 0 (0.0%) |
| 6 to 18 Years | 123 (100.0%) | 0 (0.0%) |
| 19 to 25 Years | 33 (100.0%) | 0 (0.0%) |
| 26 to 34 Years | 45 (100.0%) | 0 (0.0%) |
| 35 to 44 Years | 120 (97.6%) | 3 (2.4%) |
| 45 to 54 Years | 21 (100.0%) | 0 (0.0%) |
| 55 to 64 Years | 28 (100.0%) | 0 (0.0%) |
| 65 to 74 Years | 138 (100.0%) | 0 (0.0%) |
| 75 Years and older | 22 (100.0%) | 0 (0.0%) |
| Total | 530 (99.4%) | 3 (0.6%) |
Health Insurance Coverage by Citizenship Status in Forestville
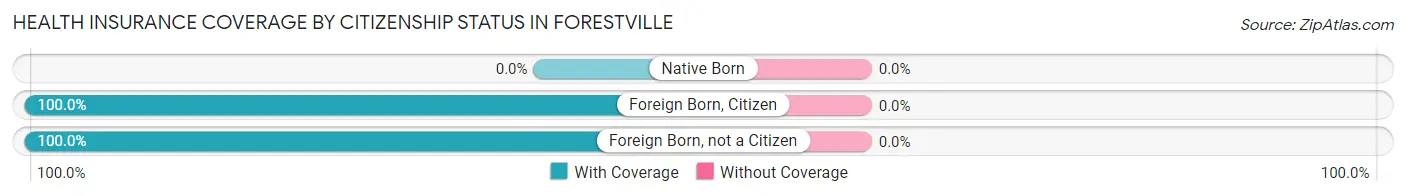
| Citizenship Status | With Coverage | Without Coverage |
| Native Born | 0 (0.0%) | 0 (0.0%) |
| Foreign Born, Citizen | 123 (100.0%) | 0 (0.0%) |
| Foreign Born, not a Citizen | 33 (100.0%) | 0 (0.0%) |
Health Insurance Coverage by Household Income in Forestville
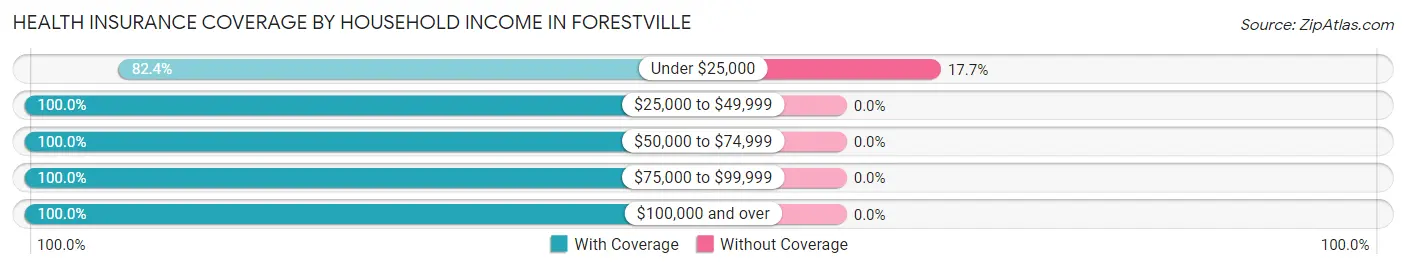
| Household Income | With Coverage | Without Coverage |
| Under $25,000 | 14 (82.4%) | 3 (17.6%) |
| $25,000 to $49,999 | 12 (100.0%) | 0 (0.0%) |
| $50,000 to $74,999 | 105 (100.0%) | 0 (0.0%) |
| $75,000 to $99,999 | 58 (100.0%) | 0 (0.0%) |
| $100,000 and over | 340 (100.0%) | 0 (0.0%) |
Public vs Private Health Insurance Coverage by Age in Forestville
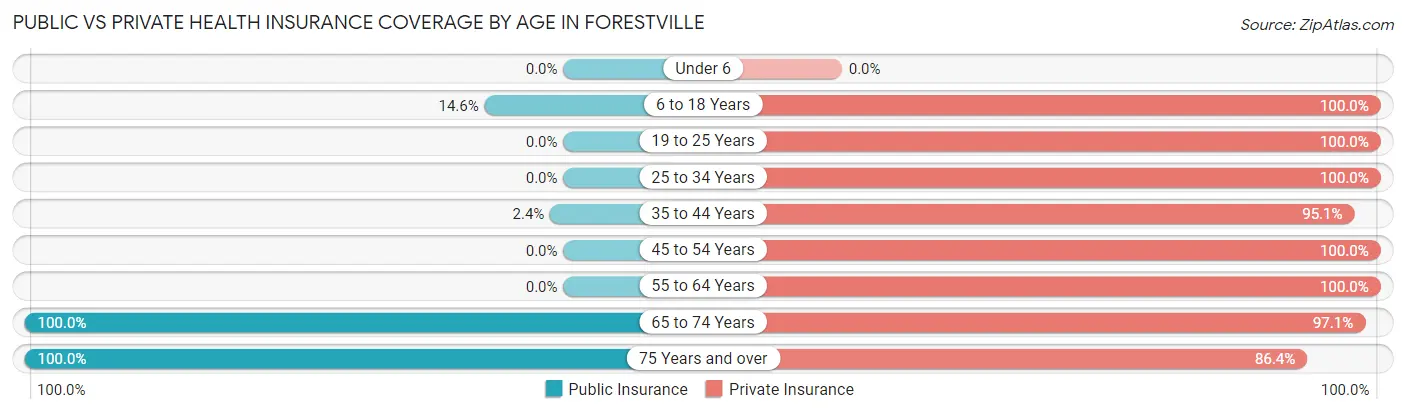
| Age Bracket | Public Insurance | Private Insurance |
| Under 6 | 0 (0.0%) | 0 (0.0%) |
| 6 to 18 Years | 18 (14.6%) | 123 (100.0%) |
| 19 to 25 Years | 0 (0.0%) | 33 (100.0%) |
| 25 to 34 Years | 0 (0.0%) | 45 (100.0%) |
| 35 to 44 Years | 3 (2.4%) | 117 (95.1%) |
| 45 to 54 Years | 0 (0.0%) | 21 (100.0%) |
| 55 to 64 Years | 0 (0.0%) | 28 (100.0%) |
| 65 to 74 Years | 138 (100.0%) | 134 (97.1%) |
| 75 Years and over | 22 (100.0%) | 19 (86.4%) |
| Total | 181 (34.0%) | 520 (97.6%) |
Disability Status by Sex by Age in Forestville
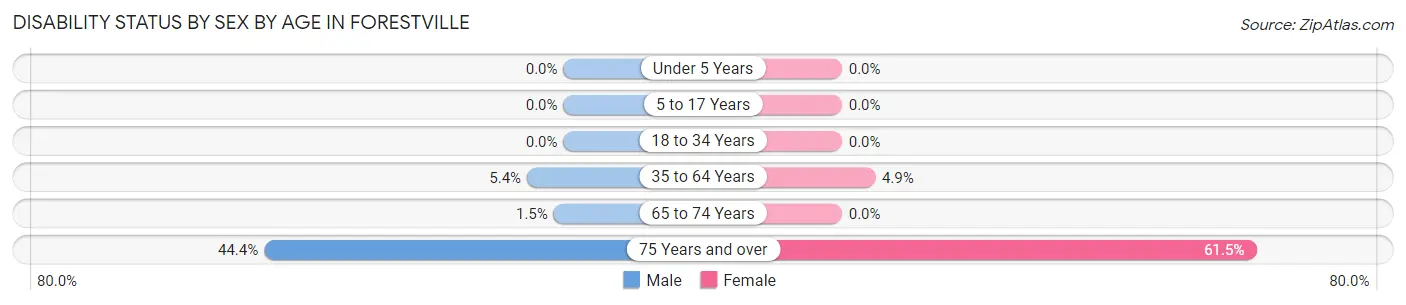
| Age Bracket | Male | Female |
| Under 5 Years | 0 (0.0%) | 0 (0.0%) |
| 5 to 17 Years | 0 (0.0%) | 0 (0.0%) |
| 18 to 34 Years | 0 (0.0%) | 0 (0.0%) |
| 35 to 64 Years | 6 (5.4%) | 3 (4.9%) |
| 65 to 74 Years | 1 (1.5%) | 0 (0.0%) |
| 75 Years and over | 4 (44.4%) | 8 (61.5%) |
Disability Class by Sex by Age in Forestville
Disability Class: Hearing Difficulty
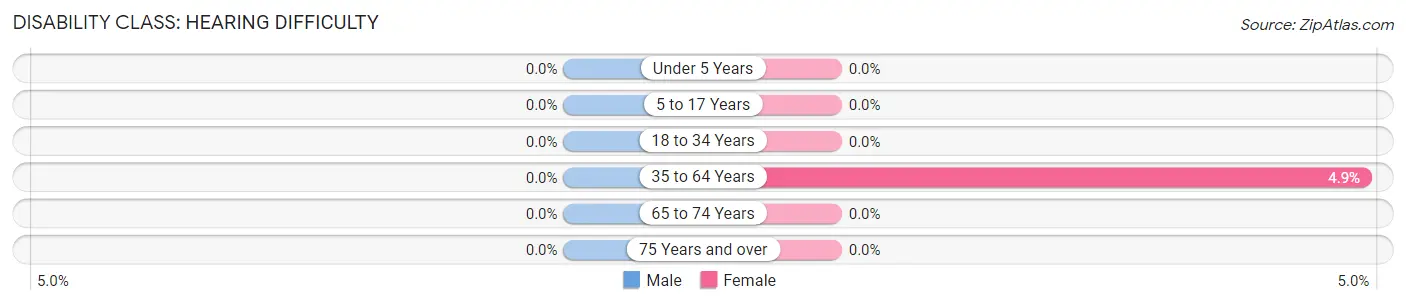
| Age Bracket | Male | Female |
| Under 5 Years | 0 (0.0%) | 0 (0.0%) |
| 5 to 17 Years | 0 (0.0%) | 0 (0.0%) |
| 18 to 34 Years | 0 (0.0%) | 0 (0.0%) |
| 35 to 64 Years | 0 (0.0%) | 3 (4.9%) |
| 65 to 74 Years | 0 (0.0%) | 0 (0.0%) |
| 75 Years and over | 0 (0.0%) | 0 (0.0%) |
Disability Class: Vision Difficulty
| Age Bracket | Male | Female |
| Under 5 Years | 0 (0.0%) | 0 (0.0%) |
| 5 to 17 Years | 0 (0.0%) | 0 (0.0%) |
| 18 to 34 Years | 0 (0.0%) | 0 (0.0%) |
| 35 to 64 Years | 0 (0.0%) | 0 (0.0%) |
| 65 to 74 Years | 0 (0.0%) | 0 (0.0%) |
| 75 Years and over | 0 (0.0%) | 0 (0.0%) |
Disability Class: Cognitive Difficulty
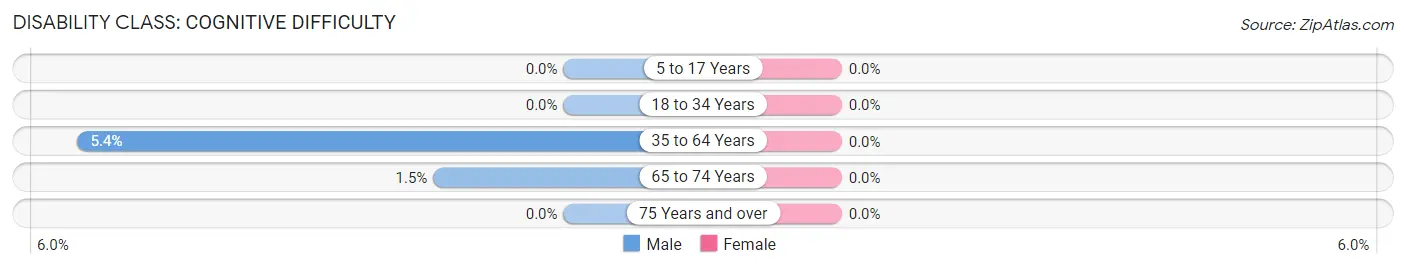
| Age Bracket | Male | Female |
| 5 to 17 Years | 0 (0.0%) | 0 (0.0%) |
| 18 to 34 Years | 0 (0.0%) | 0 (0.0%) |
| 35 to 64 Years | 6 (5.4%) | 0 (0.0%) |
| 65 to 74 Years | 1 (1.5%) | 0 (0.0%) |
| 75 Years and over | 0 (0.0%) | 0 (0.0%) |
Disability Class: Ambulatory Difficulty
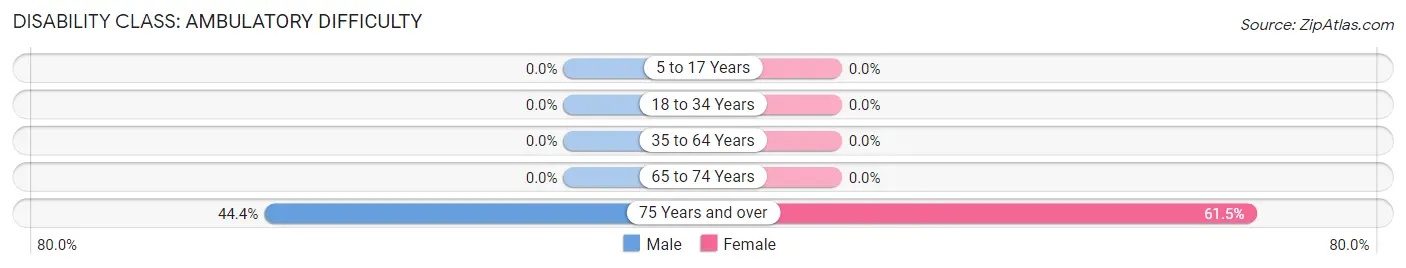
| Age Bracket | Male | Female |
| 5 to 17 Years | 0 (0.0%) | 0 (0.0%) |
| 18 to 34 Years | 0 (0.0%) | 0 (0.0%) |
| 35 to 64 Years | 0 (0.0%) | 0 (0.0%) |
| 65 to 74 Years | 0 (0.0%) | 0 (0.0%) |
| 75 Years and over | 4 (44.4%) | 8 (61.5%) |
Disability Class: Self-Care Difficulty
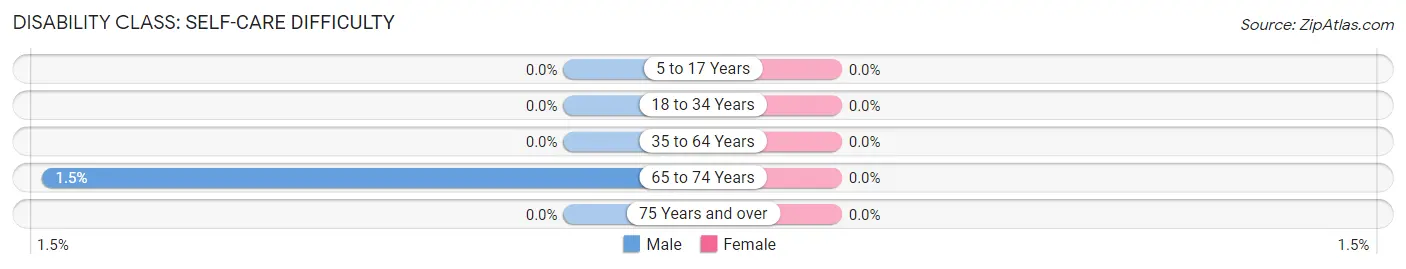
| Age Bracket | Male | Female |
| 5 to 17 Years | 0 (0.0%) | 0 (0.0%) |
| 18 to 34 Years | 0 (0.0%) | 0 (0.0%) |
| 35 to 64 Years | 0 (0.0%) | 0 (0.0%) |
| 65 to 74 Years | 1 (1.5%) | 0 (0.0%) |
| 75 Years and over | 0 (0.0%) | 0 (0.0%) |
Technology Access in Forestville
Computing Device Access in Forestville
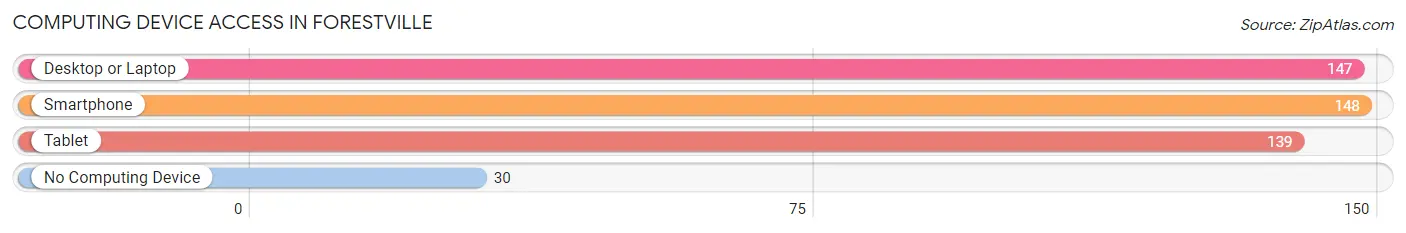
| Device Type | # Households | % Households |
| Desktop or Laptop | 147 | 77.4% |
| Smartphone | 148 | 77.9% |
| Tablet | 139 | 73.2% |
| No Computing Device | 30 | 15.8% |
| Total | 190 | 100.0% |
Internet Access in Forestville
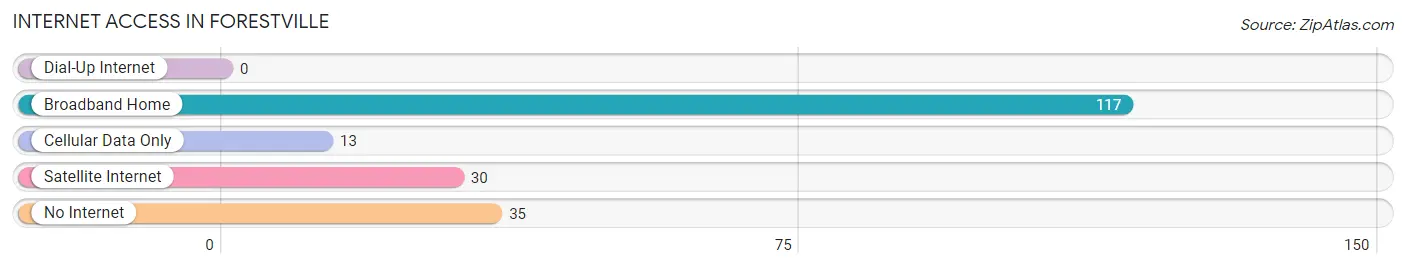
| Internet Type | # Households | % Households |
| Dial-Up Internet | 0 | 0.0% |
| Broadband Home | 117 | 61.6% |
| Cellular Data Only | 13 | 6.8% |
| Satellite Internet | 30 | 15.8% |
| No Internet | 35 | 18.4% |
| Total | 190 | 100.0% |
Forestville Summary
History
The small town of Forestville, Pennsylvania is located in the northwestern corner of the state, in the county of Mercer. It is situated on the banks of the Shenango River, and is surrounded by the towns of Hermitage, Sharon, and Farrell. The town was founded in 1832 by a group of settlers from Connecticut, who named it after the nearby forest. The town was originally a farming community, and the main crops were corn, wheat, and oats.
In the late 19th century, the town began to grow and develop. The first industry to come to Forestville was a sawmill, which was built in 1876. This was followed by a gristmill, a tannery, and a brickyard. The town also had a number of stores, including a general store, a drug store, and a hardware store.
In the early 20th century, the town continued to grow and develop. The first bank was established in 1906, and the first newspaper, the Forestville Herald, was published in 1908. The town also had a number of churches, including the First Presbyterian Church, which was founded in 1833.
In the mid-20th century, the town began to decline. The sawmill and gristmill closed in the 1950s, and the tannery and brickyard closed in the 1960s. The population of the town began to decline as well, and by the 1970s, the population had dropped to just over 500.
Geography
Forestville is located in the northwestern corner of Pennsylvania, in the county of Mercer. It is situated on the banks of the Shenango River, and is surrounded by the towns of Hermitage, Sharon, and Farrell. The town is located in a rural area, and is surrounded by rolling hills and farmland. The town is located about 30 miles from the city of Pittsburgh.
The climate in Forestville is typical of the region, with cold winters and hot, humid summers. The average temperature in the winter is around 30 degrees Fahrenheit, and the average temperature in the summer is around 75 degrees Fahrenheit. The town receives an average of 40 inches of precipitation per year.
Economy
The economy of Forestville is largely based on agriculture. The town is home to a number of farms, which produce a variety of crops, including corn, wheat, oats, and hay. The town also has a number of small businesses, including a general store, a drug store, and a hardware store.
The town is also home to a number of manufacturing companies, including a plastics factory and a metal fabrication plant. The town is also home to a number of service-based businesses, including a number of restaurants, a hotel, and a number of auto repair shops.
Demographics
As of the 2010 census, the population of Forestville was 545. The population is largely white, with a small percentage of African Americans and Hispanics. The median age of the population is 44.7 years, and the median household income is $37,500. The town has a poverty rate of 16.3%, which is higher than the national average.
Conclusion
Forestville, Pennsylvania is a small town located in the northwestern corner of the state. It was founded in 1832 by a group of settlers from Connecticut, and was originally a farming community. In the late 19th century, the town began to grow and develop, and the first industry to come to Forestville was a sawmill. In the early 20th century, the town continued to grow and develop, and the first bank and newspaper were established. In the mid-20th century, the town began to decline, and the population has since dropped to just over 500. The economy of Forestville is largely based on agriculture, and the town is also home to a number of manufacturing and service-based businesses. The population of the town is largely white, with a small percentage of African Americans and Hispanics.
Common Questions
What is Per Capita Income in Forestville?
Per Capita income in Forestville is $34,122.
What is the Median Family Income in Forestville?
Median Family Income in Forestville is $110,071.
What is the Median Household income in Forestville?
Median Household Income in Forestville is $110,519.
What is Income or Wage Gap in Forestville?
Income or Wage Gap in Forestville is 25.7%.
Women in Forestville earn 74.3 cents for every dollar earned by a man.
What is Inequality or Gini Index in Forestville?
Inequality or Gini Index in Forestville is 0.24.
What is the Total Population of Forestville?
Total Population of Forestville is 533.
What is the Total Male Population of Forestville?
Total Male Population of Forestville is 301.
What is the Total Female Population of Forestville?
Total Female Population of Forestville is 232.
What is the Ratio of Males per 100 Females in Forestville?
There are 129.74 Males per 100 Females in Forestville.
What is the Ratio of Females per 100 Males in Forestville?
There are 77.08 Females per 100 Males in Forestville.
What is the Median Population Age in Forestville?
Median Population Age in Forestville is 39.4 Years.
What is the Average Family Size in Forestville
Average Family Size in Forestville is 2.9 People.
What is the Average Household Size in Forestville
Average Household Size in Forestville is 2.8 People.
How Large is the Labor Force in Forestville?
There are 331 People in the Labor Forcein in Forestville.
What is the Percentage of People in the Labor Force in Forestville?
70.6% of People are in the Labor Force in Forestville.
What is the Unemployment Rate in Forestville?
Unemployment Rate in Forestville is 1.2%.