Zip Codes with the Highest Percentage of Population with a Degree in Engineering in Lebanon, PA
RELATED REPORTS & OPTIONS
Engineering
Lebanon
Compare Zip Codes
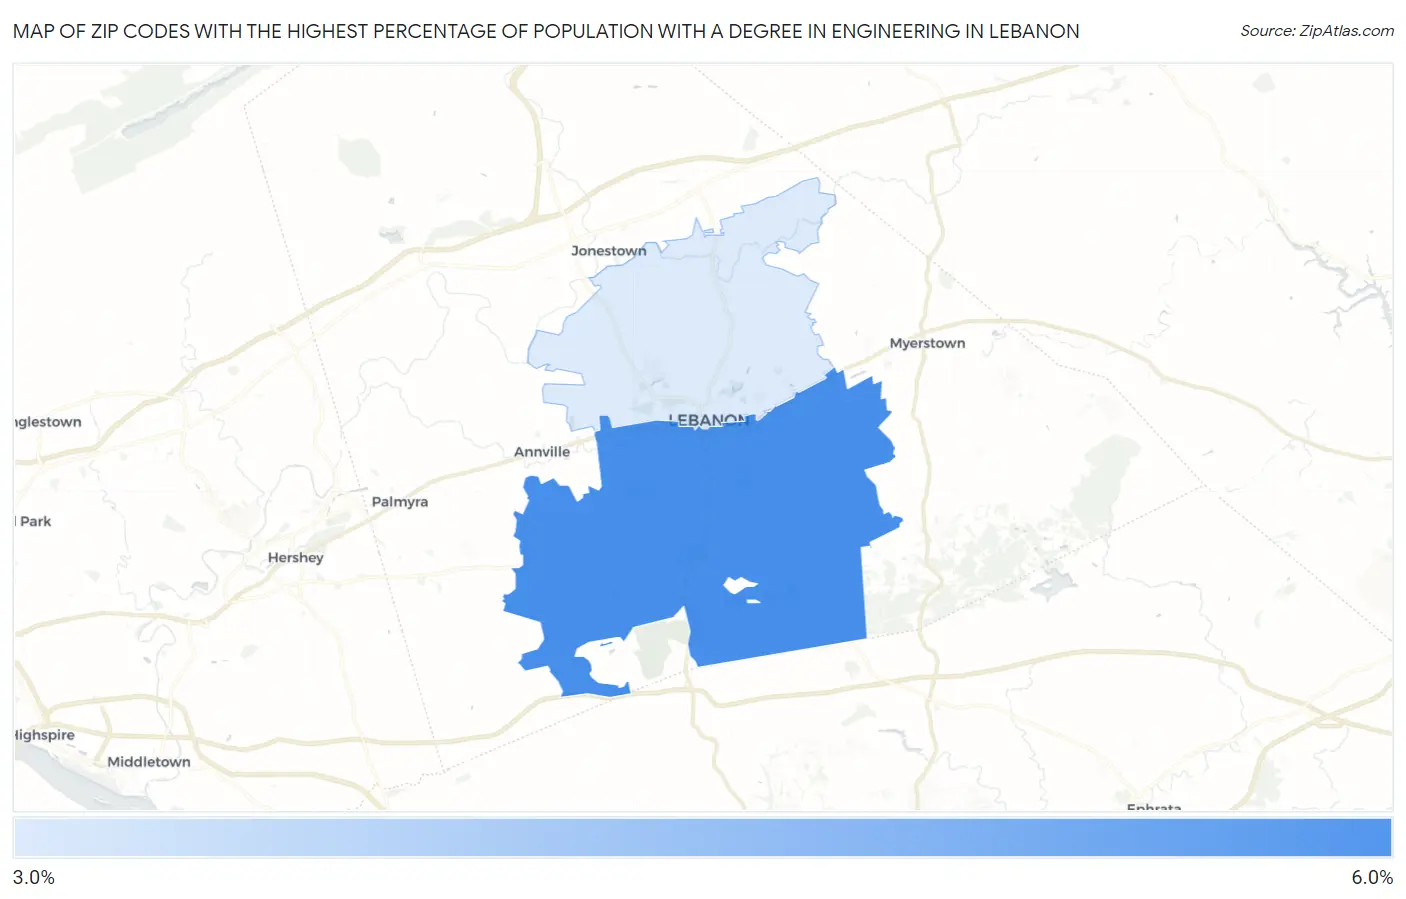
Map of Zip Codes with the Highest Percentage of Population with a Degree in Engineering in Lebanon
3.7%
5.5%
Zip Codes with the Highest Percentage of Population with a Degree in Engineering in Lebanon, PA
| Zip Code | % Graduates | vs State | vs National | |
| 1. | 17042 | 5.5% | 6.7%(-1.20)#635 | 7.6%(-2.11)#12,355 |
| 2. | 17046 | 3.7% | 6.7%(-3.02)#902 | 7.6%(-3.93)#17,108 |
1
Common Questions
What are the Top Zip Codes with the Highest Percentage of Population with a Degree in Engineering in Lebanon, PA?
Top Zip Codes with the Highest Percentage of Population with a Degree in Engineering in Lebanon, PA are:
What zip code has the Highest Percentage of Population with a Degree in Engineering in Lebanon, PA?
17042 has the Highest Percentage of Population with a Degree in Engineering in Lebanon, PA with 5.5%.
What is the Percentage of Population with a Degree in Engineering in Lebanon, PA?
Percentage of Population with a Degree in Engineering in Lebanon is 2.0%.
What is the Percentage of Population with a Degree in Engineering in Pennsylvania?
Percentage of Population with a Degree in Engineering in Pennsylvania is 6.7%.
What is the Percentage of Population with a Degree in Engineering in the United States?
Percentage of Population with a Degree in Engineering in the United States is 7.6%.