Baidland, PA Map & Demographics
Baidland Map
Baidland Overview
$48,885
PER CAPITA INCOME
$112,625
AVG FAMILY INCOME
$102,520
AVG HOUSEHOLD INCOME
29.0%
WAGE / INCOME GAP [ % ]
71.0¢/ $1
WAGE / INCOME GAP [ $ ]
0.50
INEQUALITY / GINI INDEX
1,742
TOTAL POPULATION
862
MALE POPULATION
880
FEMALE POPULATION
97.95
MALES / 100 FEMALES
102.09
FEMALES / 100 MALES
40.8
MEDIAN AGE
2.7
AVG FAMILY SIZE
2.3
AVG HOUSEHOLD SIZE
989
LABOR FORCE [ PEOPLE ]
66.9%
PERCENT IN LABOR FORCE
10.7%
UNEMPLOYMENT RATE
Income in Baidland
Income Overview in Baidland
Per Capita Income in Baidland is $48,885, while median incomes of families and households are $112,625 and $102,520 respectively.
| Characteristic | Number | Measure |
| Per Capita Income | 1,742 | $48,885 |
| Median Family Income | 556 | $112,625 |
| Mean Family Income | 556 | $138,651 |
| Median Household Income | 747 | $102,520 |
| Mean Household Income | 747 | $113,481 |
| Income Deficit | 556 | $0 |
| Wage / Income Gap (%) | 1,742 | 28.95% |
| Wage / Income Gap ($) | 1,742 | 71.05¢ per $1 |
| Gini / Inequality Index | 1,742 | 0.50 |
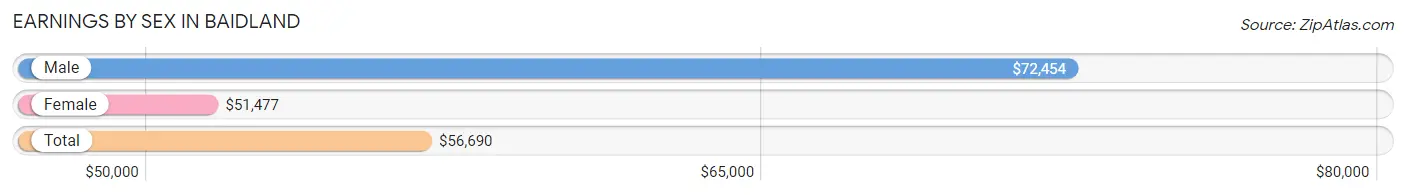
Earnings by Sex in Baidland
Average Earnings in Baidland are $56,690, $72,454 for men and $51,477 for women, a difference of 28.9%.
| Sex | Number | Average Earnings |
| Male | 475 (52.8%) | $72,454 |
| Female | 425 (47.2%) | $51,477 |
| Total | 900 (100.0%) | $56,690 |
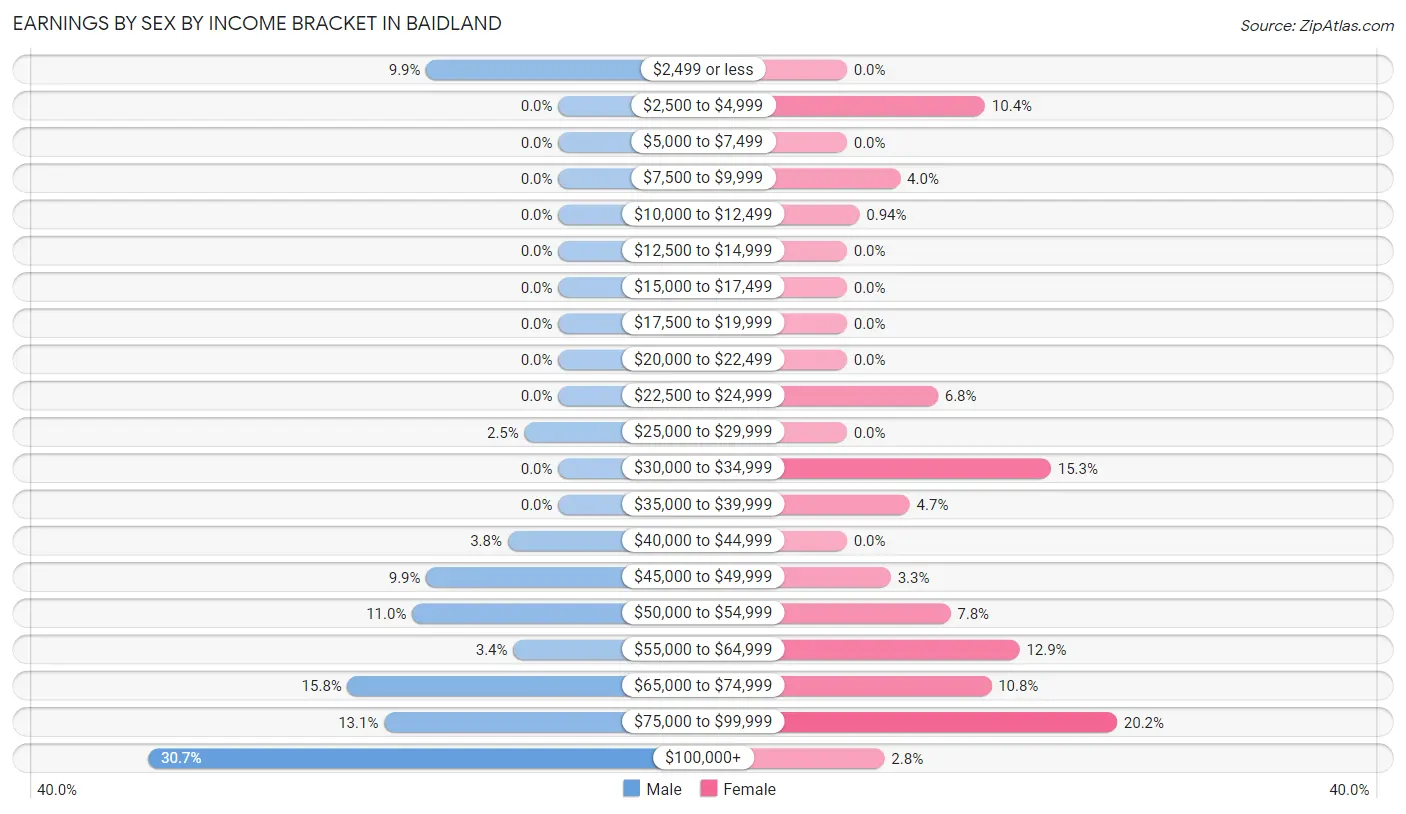
Earnings by Sex by Income Bracket in Baidland
The most common earnings brackets in Baidland are $100,000+ for men (146 | 30.7%) and $75,000 to $99,999 for women (86 | 20.2%).
| Income | Male | Female |
| $2,499 or less | 47 (9.9%) | 0 (0.0%) |
| $2,500 to $4,999 | 0 (0.0%) | 44 (10.3%) |
| $5,000 to $7,499 | 0 (0.0%) | 0 (0.0%) |
| $7,500 to $9,999 | 0 (0.0%) | 17 (4.0%) |
| $10,000 to $12,499 | 0 (0.0%) | 4 (0.9%) |
| $12,500 to $14,999 | 0 (0.0%) | 0 (0.0%) |
| $15,000 to $17,499 | 0 (0.0%) | 0 (0.0%) |
| $17,500 to $19,999 | 0 (0.0%) | 0 (0.0%) |
| $20,000 to $22,499 | 0 (0.0%) | 0 (0.0%) |
| $22,500 to $24,999 | 0 (0.0%) | 29 (6.8%) |
| $25,000 to $29,999 | 12 (2.5%) | 0 (0.0%) |
| $30,000 to $34,999 | 0 (0.0%) | 65 (15.3%) |
| $35,000 to $39,999 | 0 (0.0%) | 20 (4.7%) |
| $40,000 to $44,999 | 18 (3.8%) | 0 (0.0%) |
| $45,000 to $49,999 | 47 (9.9%) | 14 (3.3%) |
| $50,000 to $54,999 | 52 (11.0%) | 33 (7.8%) |
| $55,000 to $64,999 | 16 (3.4%) | 55 (12.9%) |
| $65,000 to $74,999 | 75 (15.8%) | 46 (10.8%) |
| $75,000 to $99,999 | 62 (13.1%) | 86 (20.2%) |
| $100,000+ | 146 (30.7%) | 12 (2.8%) |
| Total | 475 (100.0%) | 425 (100.0%) |
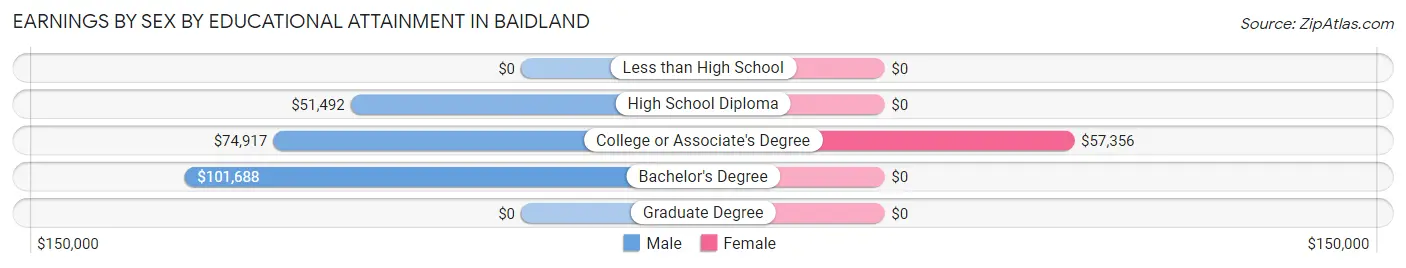
Earnings by Sex by Educational Attainment in Baidland
Average earnings in Baidland are $72,454 for men and $52,121 for women, a difference of 28.1%. Men with an educational attainment of bachelor's degree enjoy the highest average annual earnings of $101,688, while those with high school diploma education earn the least with $51,492. Women with an educational attainment of college or associate's degree earn the most with the average annual earnings of $57,356, while those with college or associate's degree education have the smallest earnings of $57,356.
| Educational Attainment | Male Income | Female Income |
| Less than High School | - | - |
| High School Diploma | $51,492 | $0 |
| College or Associate's Degree | $74,917 | $57,356 |
| Bachelor's Degree | $101,688 | $0 |
| Graduate Degree | - | - |
| Total | $72,454 | $52,121 |
Family Income in Baidland
Family Income Brackets in Baidland
According to the Baidland family income data, there are 199 families falling into the $150,000 to $199,999 income range, which is the most common income bracket and makes up 35.8% of all families.
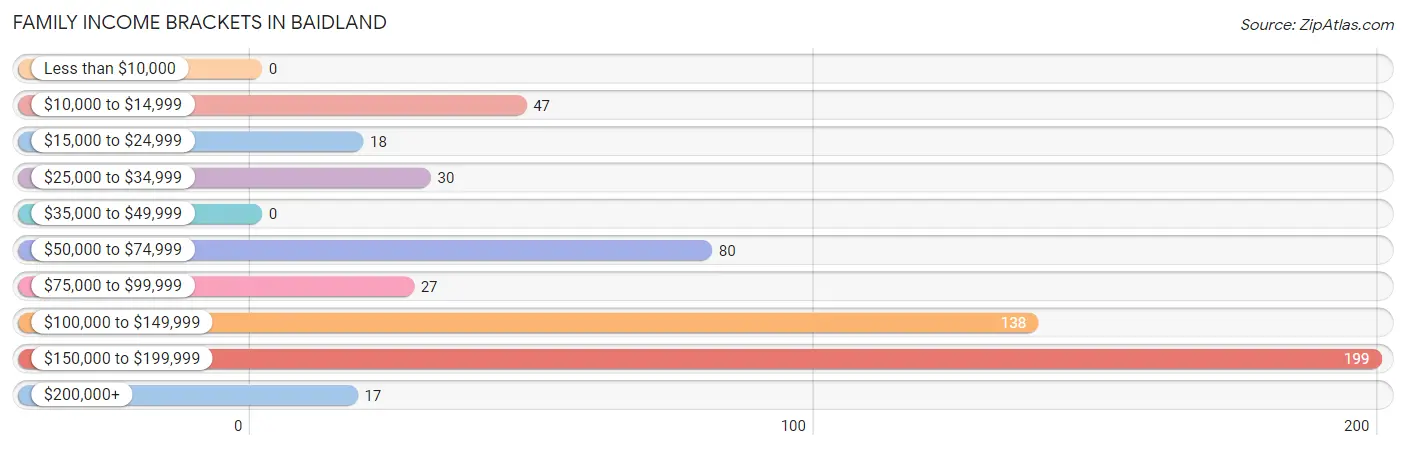
| Income Bracket | # Families | % Families |
| Less than $10,000 | 0 | 0.0% |
| $10,000 to $14,999 | 47 | 8.5% |
| $15,000 to $24,999 | 18 | 3.2% |
| $25,000 to $34,999 | 30 | 5.4% |
| $35,000 to $49,999 | 0 | 0.0% |
| $50,000 to $74,999 | 80 | 14.4% |
| $75,000 to $99,999 | 27 | 4.9% |
| $100,000 to $149,999 | 138 | 24.8% |
| $150,000 to $199,999 | 199 | 35.8% |
| $200,000+ | 17 | 3.1% |
Family Income by Famaliy Size in Baidland
2-person families (293 | 52.7%) account for the highest median family income in Baidland with $120,547 per family, while 2-person families (293 | 52.7%) have the highest median income of $60,274 per family member.
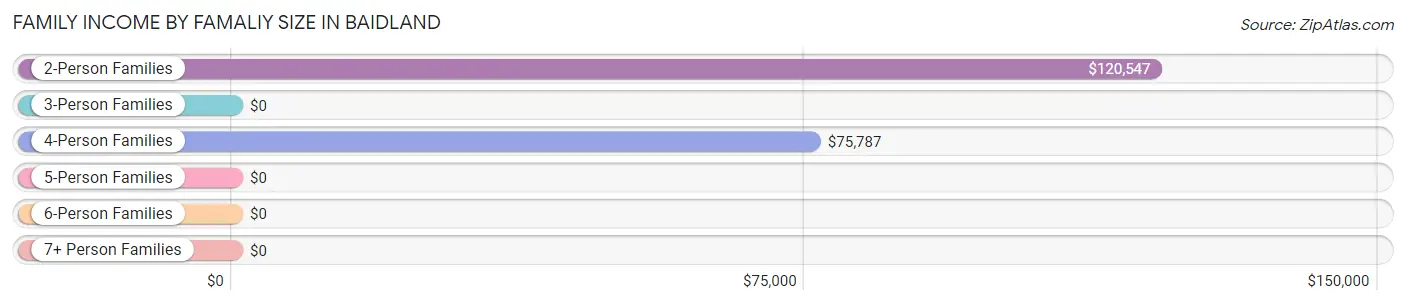
| Income Bracket | # Families | Median Income |
| 2-Person Families | 293 (52.7%) | $120,547 |
| 3-Person Families | 175 (31.5%) | $0 |
| 4-Person Families | 59 (10.6%) | $75,787 |
| 5-Person Families | 29 (5.2%) | $0 |
| 6-Person Families | 0 (0.0%) | $0 |
| 7+ Person Families | 0 (0.0%) | $0 |
| Total | 556 (100.0%) | $112,625 |
Family Income by Number of Earners in Baidland
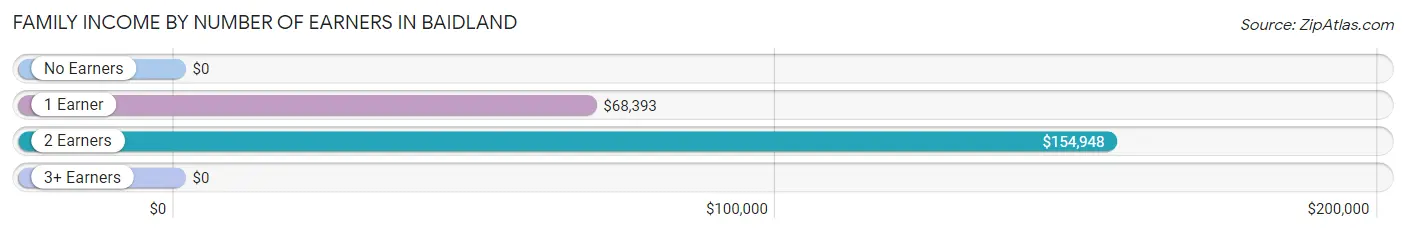
| Number of Earners | # Families | Median Income |
| No Earners | 94 (16.9%) | $0 |
| 1 Earner | 135 (24.3%) | $68,393 |
| 2 Earners | 327 (58.8%) | $154,948 |
| 3+ Earners | 0 (0.0%) | $0 |
| Total | 556 (100.0%) | $112,625 |
Household Income in Baidland
Household Income Brackets in Baidland
With 199 households falling in the category, the $150,000 to $199,999 income range is the most frequent in Baidland, accounting for 26.6% of all households. In contrast, only 17 households (2.3%) fall into the $200,000+ income bracket, making it the least populous group.
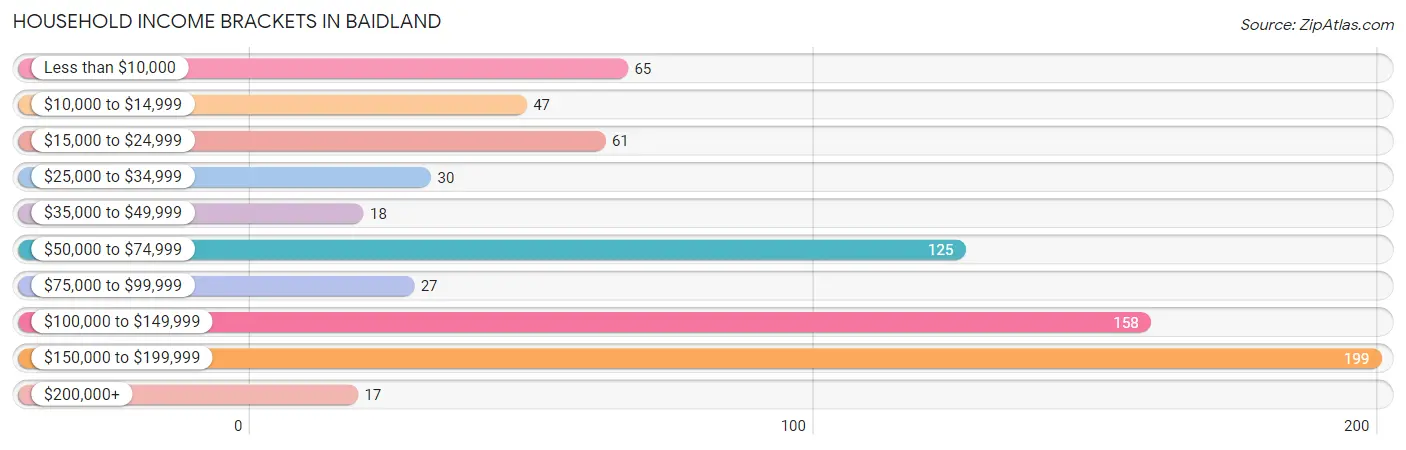
| Income Bracket | # Households | % Households |
| Less than $10,000 | 65 | 8.7% |
| $10,000 to $14,999 | 47 | 6.3% |
| $15,000 to $24,999 | 61 | 8.2% |
| $25,000 to $34,999 | 30 | 4.0% |
| $35,000 to $49,999 | 18 | 2.4% |
| $50,000 to $74,999 | 125 | 16.7% |
| $75,000 to $99,999 | 27 | 3.6% |
| $100,000 to $149,999 | 158 | 21.2% |
| $150,000 to $199,999 | 199 | 26.6% |
| $200,000+ | 17 | 2.3% |
Household Income by Householder Age in Baidland
The median household income in Baidland is $102,520, with the highest median household income of $157,684 found in the 25 to 44 years age bracket for the primary householder. A total of 217 households (29.0%) fall into this category. Meanwhile, the 15 to 24 years age bracket for the primary householder has the lowest median household income of $0, with 52 households (7.0%) in this group.
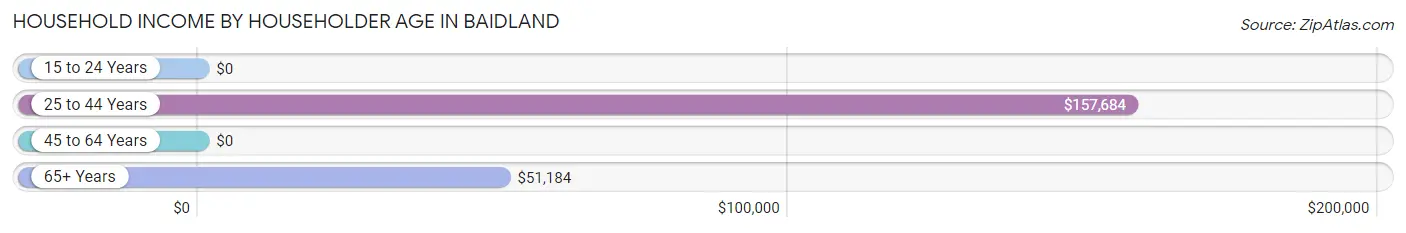
| Income Bracket | # Households | Median Income |
| 15 to 24 Years | 52 (7.0%) | $0 |
| 25 to 44 Years | 217 (29.0%) | $157,684 |
| 45 to 64 Years | 286 (38.3%) | $0 |
| 65+ Years | 192 (25.7%) | $51,184 |
| Total | 747 (100.0%) | $102,520 |
Poverty in Baidland
Income Below Poverty by Sex and Age in Baidland
With 27.7% poverty level for males and 2.9% for females among the residents of Baidland, 18 to 24 year old males and 55 to 64 year old females are the most vulnerable to poverty, with 52 males (75.4%) and 22 females (12.9%) in their respective age groups living below the poverty level.
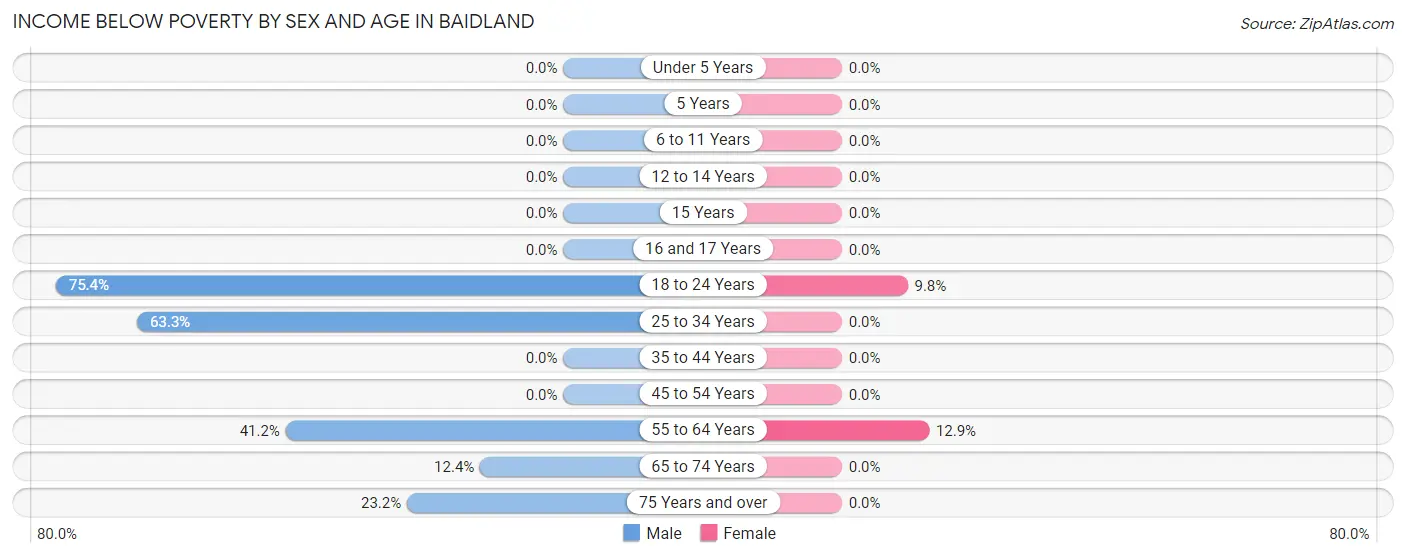
| Age Bracket | Male | Female |
| Under 5 Years | 0 (0.0%) | 0 (0.0%) |
| 5 Years | 0 (0.0%) | 0 (0.0%) |
| 6 to 11 Years | 0 (0.0%) | 0 (0.0%) |
| 12 to 14 Years | 0 (0.0%) | 0 (0.0%) |
| 15 Years | 0 (0.0%) | 0 (0.0%) |
| 16 and 17 Years | 0 (0.0%) | 0 (0.0%) |
| 18 to 24 Years | 52 (75.4%) | 4 (9.8%) |
| 25 to 34 Years | 107 (63.3%) | 0 (0.0%) |
| 35 to 44 Years | 0 (0.0%) | 0 (0.0%) |
| 45 to 54 Years | 0 (0.0%) | 0 (0.0%) |
| 55 to 64 Years | 47 (41.2%) | 22 (12.9%) |
| 65 to 74 Years | 20 (12.3%) | 0 (0.0%) |
| 75 Years and over | 13 (23.2%) | 0 (0.0%) |
| Total | 239 (27.7%) | 26 (2.9%) |
Income Above Poverty by Sex and Age in Baidland
According to the poverty statistics in Baidland, males aged under 5 years and females aged under 5 years are the age groups that are most secure financially, with 100.0% of males and 100.0% of females in these age groups living above the poverty line.
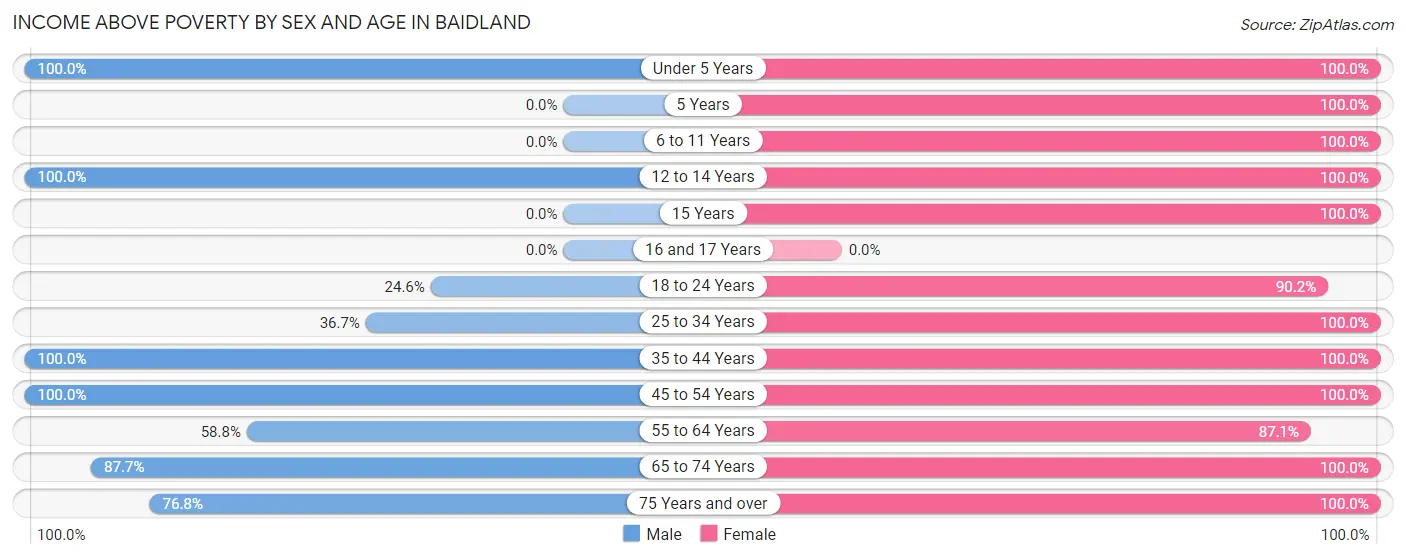
| Age Bracket | Male | Female |
| Under 5 Years | 24 (100.0%) | 45 (100.0%) |
| 5 Years | 0 (0.0%) | 30 (100.0%) |
| 6 to 11 Years | 0 (0.0%) | 87 (100.0%) |
| 12 to 14 Years | 20 (100.0%) | 27 (100.0%) |
| 15 Years | 0 (0.0%) | 31 (100.0%) |
| 16 and 17 Years | 0 (0.0%) | 0 (0.0%) |
| 18 to 24 Years | 17 (24.6%) | 37 (90.2%) |
| 25 to 34 Years | 62 (36.7%) | 75 (100.0%) |
| 35 to 44 Years | 166 (100.0%) | 144 (100.0%) |
| 45 to 54 Years | 82 (100.0%) | 104 (100.0%) |
| 55 to 64 Years | 67 (58.8%) | 148 (87.1%) |
| 65 to 74 Years | 142 (87.6%) | 59 (100.0%) |
| 75 Years and over | 43 (76.8%) | 67 (100.0%) |
| Total | 623 (72.3%) | 854 (97.1%) |
Income Below Poverty Among Married-Couple Families in Baidland
The poverty statistics for married-couple families in Baidland show that 3.6% or 18 of the total 496 families live below the poverty line. Families with no children have the highest poverty rate of 5.5%, comprising of 18 families. On the other hand, families with 1 or 2 children have the lowest poverty rate of 0.0%, which includes 0 families.
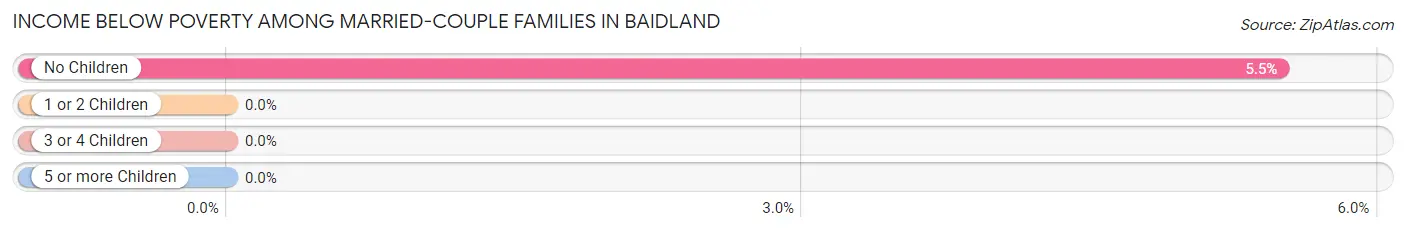
| Children | Above Poverty | Below Poverty |
| No Children | 310 (94.5%) | 18 (5.5%) |
| 1 or 2 Children | 139 (100.0%) | 0 (0.0%) |
| 3 or 4 Children | 29 (100.0%) | 0 (0.0%) |
| 5 or more Children | 0 (0.0%) | 0 (0.0%) |
| Total | 478 (96.4%) | 18 (3.6%) |
Income Below Poverty Among Single-Parent Households in Baidland
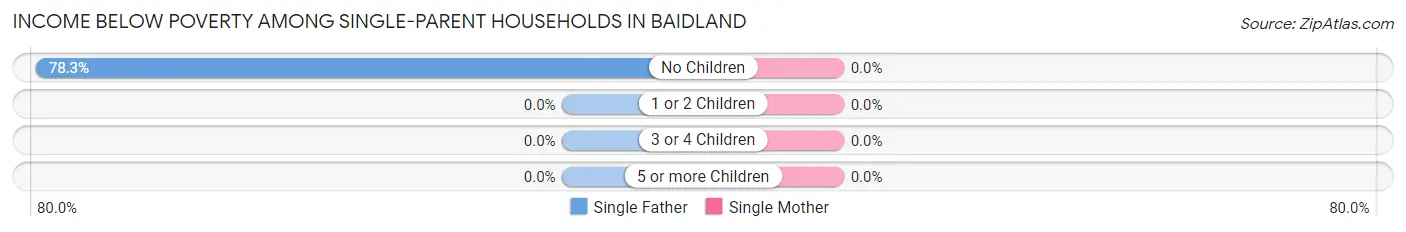
| Children | Single Father | Single Mother |
| No Children | 47 (78.3%) | 0 (0.0%) |
| 1 or 2 Children | 0 (0.0%) | 0 (0.0%) |
| 3 or 4 Children | 0 (0.0%) | 0 (0.0%) |
| 5 or more Children | 0 (0.0%) | 0 (0.0%) |
| Total | 47 (78.3%) | 0 (0.0%) |
Income Below Poverty Among Married-Couple vs Single-Parent Households in Baidland
The poverty data for Baidland shows that 18 of the married-couple family households (3.6%) and 47 of the single-parent households (78.3%) are living below the poverty level. Within the married-couple family households, those with no children have the highest poverty rate, with 18 households (5.5%) falling below the poverty line. Among the single-parent households, those with no children have the highest poverty rate, with 47 household (78.3%) living below poverty.
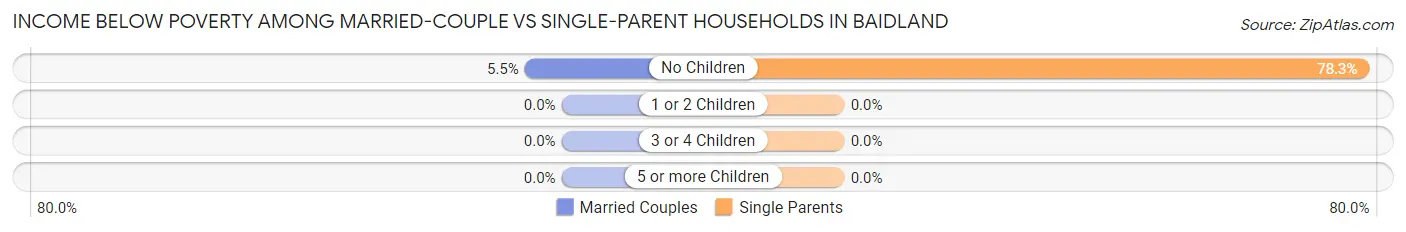
| Children | Married-Couple Families | Single-Parent Households |
| No Children | 18 (5.5%) | 47 (78.3%) |
| 1 or 2 Children | 0 (0.0%) | 0 (0.0%) |
| 3 or 4 Children | 0 (0.0%) | 0 (0.0%) |
| 5 or more Children | 0 (0.0%) | 0 (0.0%) |
| Total | 18 (3.6%) | 47 (78.3%) |
Race in Baidland
The most populous races in Baidland are White / Caucasian (1,696 | 97.4%), and Two or more Races (46 | 2.6%).
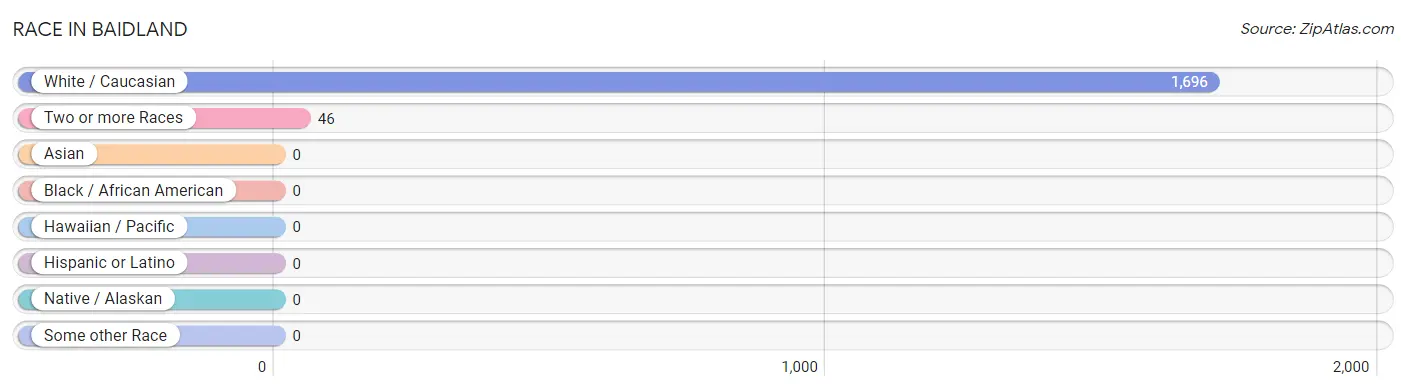
| Race | # Population | % Population |
| Asian | 0 | 0.0% |
| Black / African American | 0 | 0.0% |
| Hawaiian / Pacific | 0 | 0.0% |
| Hispanic or Latino | 0 | 0.0% |
| Native / Alaskan | 0 | 0.0% |
| White / Caucasian | 1,696 | 97.4% |
| Two or more Races | 46 | 2.6% |
| Some other Race | 0 | 0.0% |
| Total | 1,742 | 100.0% |
Ancestry in Baidland
The most populous ancestries reported in Baidland are Italian (518 | 29.7%), German (475 | 27.3%), English (240 | 13.8%), Polish (233 | 13.4%), and European (126 | 7.2%), together accounting for 91.4% of all Baidland residents.
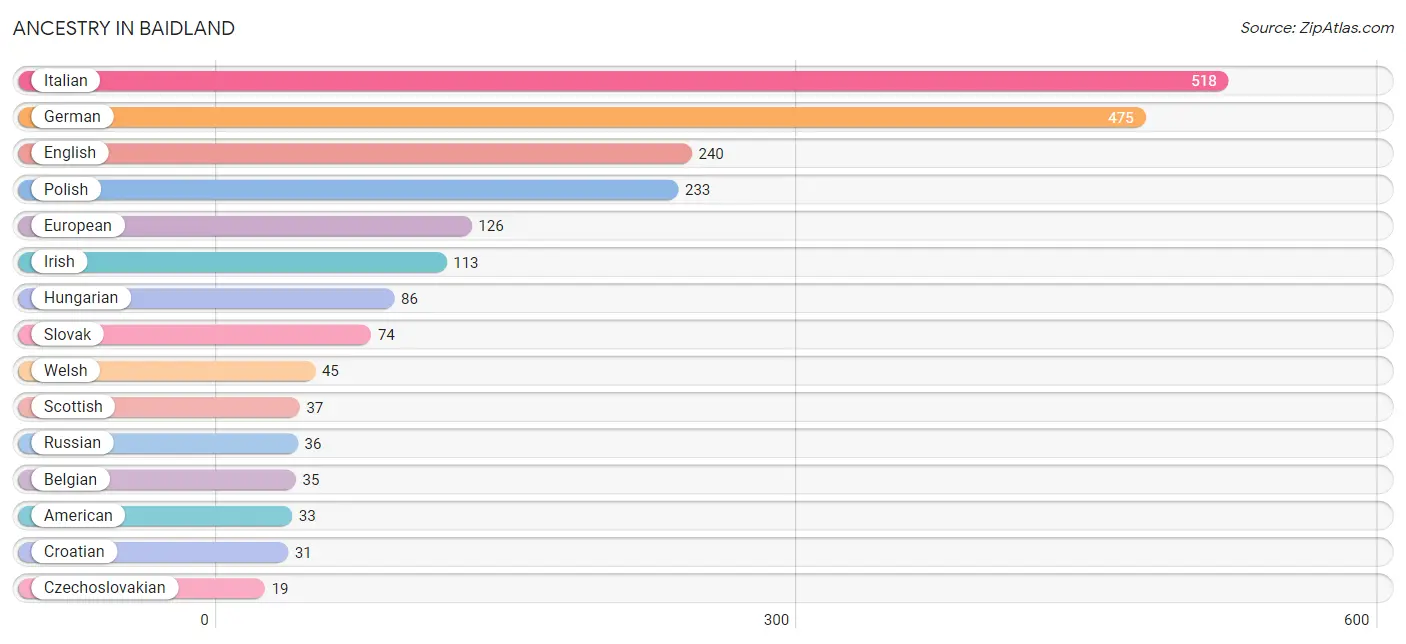
| Ancestry | # Population | % Population |
| American | 33 | 1.9% |
| Belgian | 35 | 2.0% |
| Croatian | 31 | 1.8% |
| Czech | 13 | 0.7% |
| Czechoslovakian | 19 | 1.1% |
| English | 240 | 13.8% |
| European | 126 | 7.2% |
| French | 13 | 0.7% |
| German | 475 | 27.3% |
| Hungarian | 86 | 4.9% |
| Irish | 113 | 6.5% |
| Italian | 518 | 29.7% |
| Polish | 233 | 13.4% |
| Russian | 36 | 2.1% |
| Scottish | 37 | 2.1% |
| Serbian | 13 | 0.7% |
| Slovak | 74 | 4.3% |
| Welsh | 45 | 2.6% | View All 18 Rows |
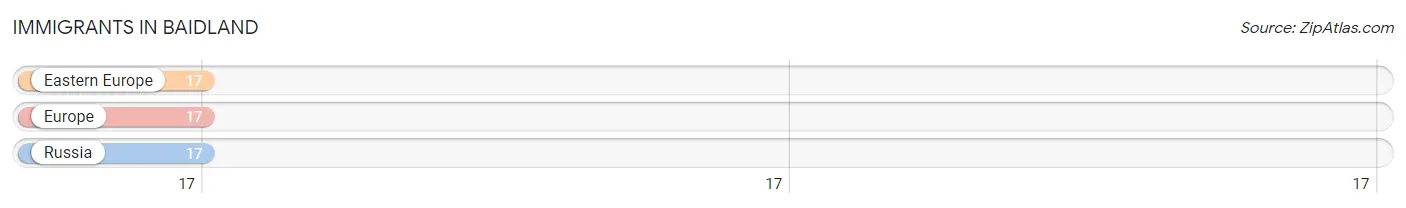
Immigrants in Baidland
The most numerous immigrant groups reported in Baidland came from Eastern Europe (17 | 1.0%), Europe (17 | 1.0%), and Russia (17 | 1.0%), together accounting for 2.9% of all Baidland residents.
| Immigration Origin | # Population | % Population |
| Eastern Europe | 17 | 1.0% |
| Europe | 17 | 1.0% |
| Russia | 17 | 1.0% | View All 3 Rows |
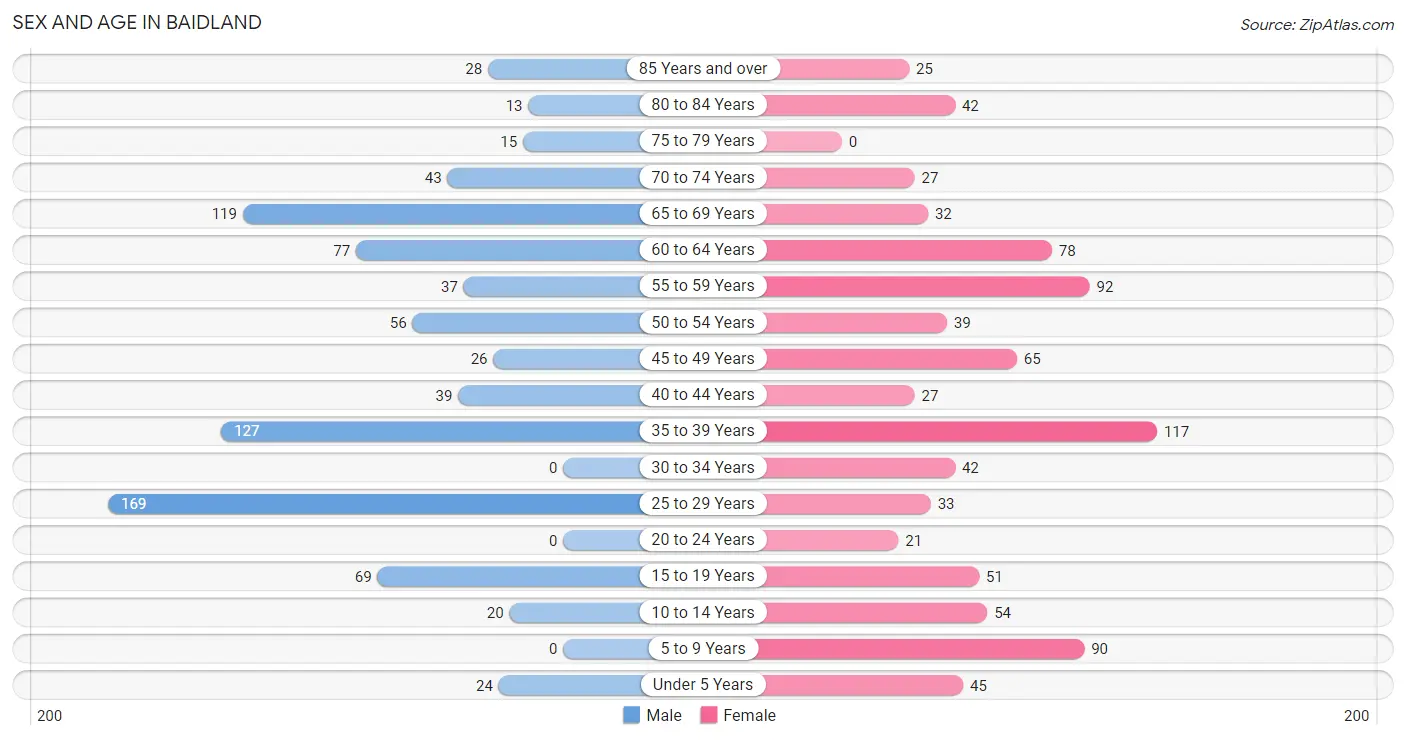
Sex and Age in Baidland
Sex and Age in Baidland
The most populous age groups in Baidland are 25 to 29 Years (169 | 19.6%) for men and 35 to 39 Years (117 | 13.3%) for women.
| Age Bracket | Male | Female |
| Under 5 Years | 24 (2.8%) | 45 (5.1%) |
| 5 to 9 Years | 0 (0.0%) | 90 (10.2%) |
| 10 to 14 Years | 20 (2.3%) | 54 (6.1%) |
| 15 to 19 Years | 69 (8.0%) | 51 (5.8%) |
| 20 to 24 Years | 0 (0.0%) | 21 (2.4%) |
| 25 to 29 Years | 169 (19.6%) | 33 (3.7%) |
| 30 to 34 Years | 0 (0.0%) | 42 (4.8%) |
| 35 to 39 Years | 127 (14.7%) | 117 (13.3%) |
| 40 to 44 Years | 39 (4.5%) | 27 (3.1%) |
| 45 to 49 Years | 26 (3.0%) | 65 (7.4%) |
| 50 to 54 Years | 56 (6.5%) | 39 (4.4%) |
| 55 to 59 Years | 37 (4.3%) | 92 (10.4%) |
| 60 to 64 Years | 77 (8.9%) | 78 (8.9%) |
| 65 to 69 Years | 119 (13.8%) | 32 (3.6%) |
| 70 to 74 Years | 43 (5.0%) | 27 (3.1%) |
| 75 to 79 Years | 15 (1.7%) | 0 (0.0%) |
| 80 to 84 Years | 13 (1.5%) | 42 (4.8%) |
| 85 Years and over | 28 (3.3%) | 25 (2.8%) |
| Total | 862 (100.0%) | 880 (100.0%) |
Families and Households in Baidland
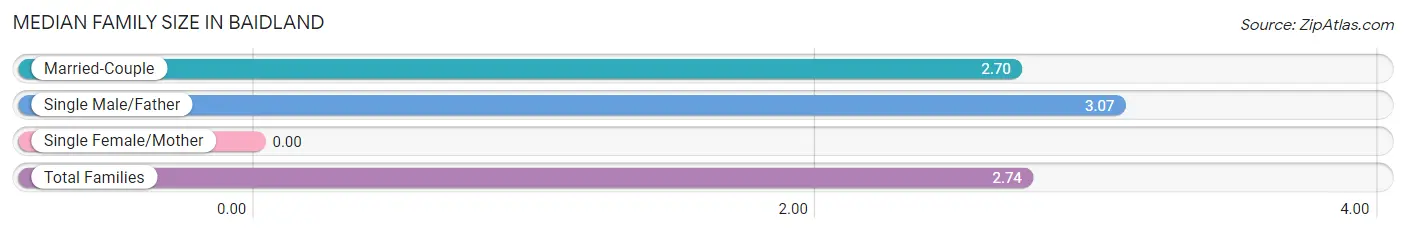
Median Family Size in Baidland
| Family Type | # Families | Family Size |
| Married-Couple | 496 (89.2%) | 2.70 |
| Single Male/Father | 60 (10.8%) | 3.07 |
| Single Female/Mother | 0 (0.0%) | - |
| Total Families | 556 (100.0%) | 2.74 |
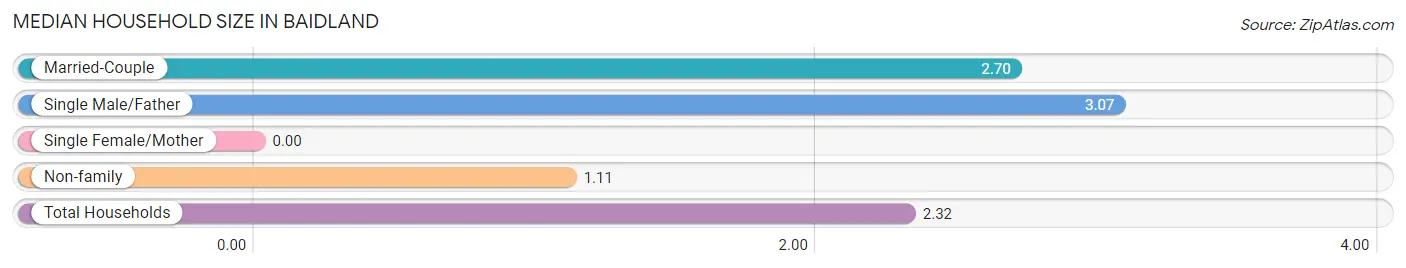
Median Household Size in Baidland
| Household Type | # Households | Household Size |
| Married-Couple | 496 (66.4%) | 2.70 |
| Single Male/Father | 60 (8.0%) | 3.07 |
| Single Female/Mother | 0 (0.0%) | - |
| Non-family | 191 (25.6%) | 1.11 |
| Total Households | 747 (100.0%) | 2.32 |
Household Size by Marriage Status in Baidland
Out of a total of 747 households in Baidland, 556 (74.4%) are family households, while 191 (25.6%) are nonfamily households. The most numerous type of family households are 2-person households, comprising 293, and the most common type of nonfamily households are 1-person households, comprising 171.
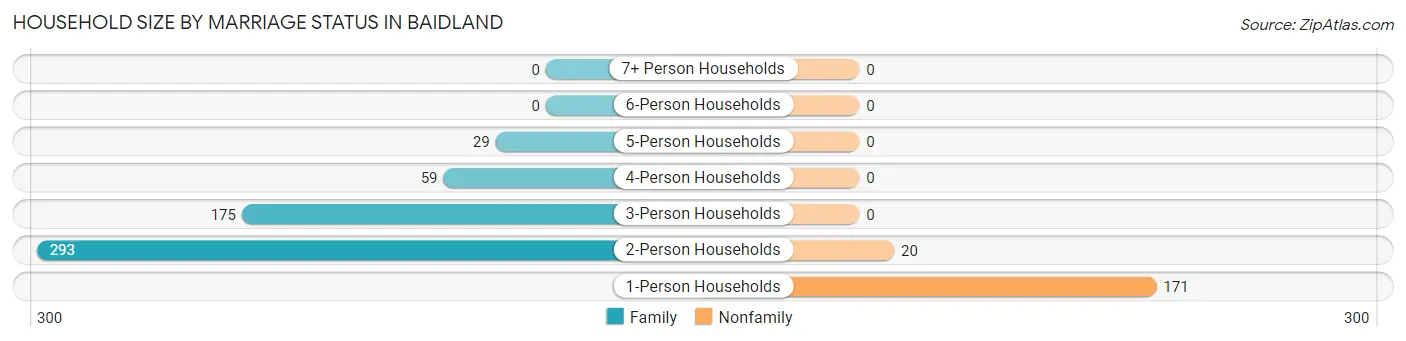
| Household Size | Family Households | Nonfamily Households |
| 1-Person Households | - | 171 (22.9%) |
| 2-Person Households | 293 (39.2%) | 20 (2.7%) |
| 3-Person Households | 175 (23.4%) | 0 (0.0%) |
| 4-Person Households | 59 (7.9%) | 0 (0.0%) |
| 5-Person Households | 29 (3.9%) | 0 (0.0%) |
| 6-Person Households | 0 (0.0%) | 0 (0.0%) |
| 7+ Person Households | 0 (0.0%) | 0 (0.0%) |
| Total | 556 (74.4%) | 191 (25.6%) |
Female Fertility in Baidland
Fertility by Age in Baidland
Average fertility rate in Baidland is 65.0 births per 1,000 women. Women in the age bracket of 35 to 50 years have the highest fertility rate with 110.0 births per 1,000 women. Women in the age bracket of 35 to 50 years acount for 100.0% of all women with births.
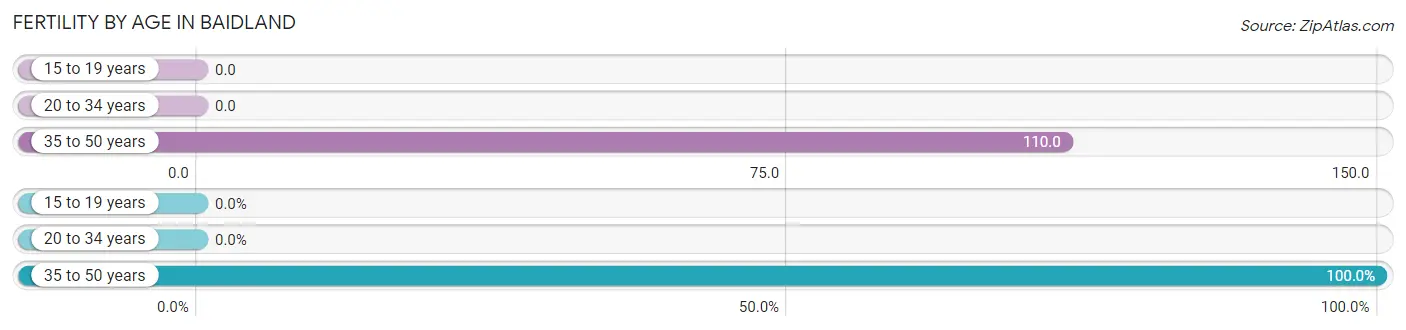
| Age Bracket | Women with Births | Births / 1,000 Women |
| 15 to 19 years | 0 (0.0%) | 0.0 |
| 20 to 34 years | 0 (0.0%) | 0.0 |
| 35 to 50 years | 23 (100.0%) | 110.0 |
| Total | 23 (100.0%) | 65.0 |
Fertility by Age by Marriage Status in Baidland
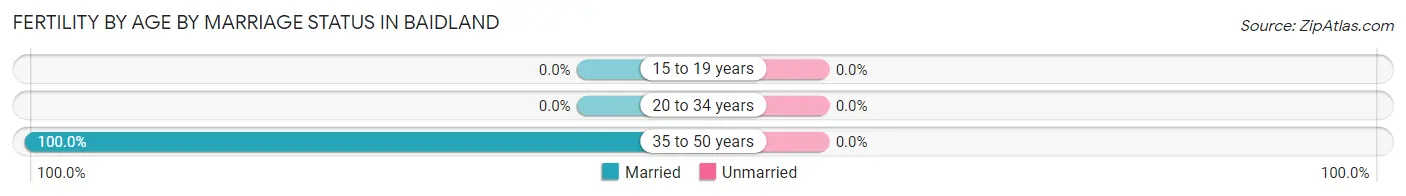
| Age Bracket | Married | Unmarried |
| 15 to 19 years | 0 (0.0%) | 0 (0.0%) |
| 20 to 34 years | 0 (0.0%) | 0 (0.0%) |
| 35 to 50 years | 23 (100.0%) | 0 (0.0%) |
| Total | 23 (100.0%) | 0 (0.0%) |
Fertility by Education in Baidland
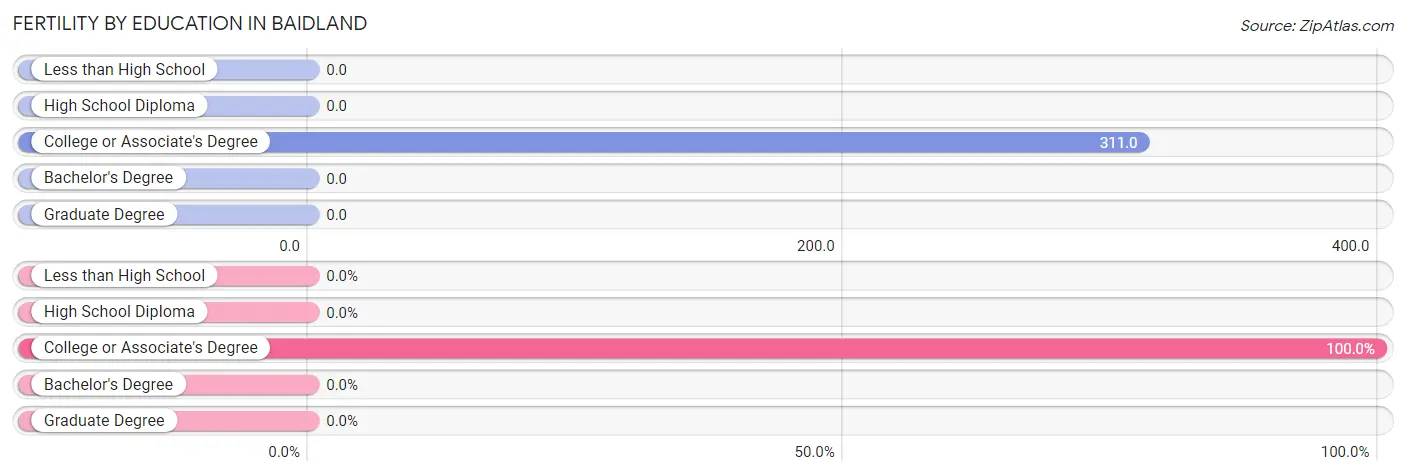
| Educational Attainment | Women with Births | Births / 1,000 Women |
| Less than High School | 0 (0.0%) | 0.0 |
| High School Diploma | 0 (0.0%) | 0.0 |
| College or Associate's Degree | 23 (100.0%) | 311.0 |
| Bachelor's Degree | 0 (0.0%) | 0.0 |
| Graduate Degree | 0 (0.0%) | 0.0 |
| Total | 23 (100.0%) | 65.0 |
Fertility by Education by Marriage Status in Baidland
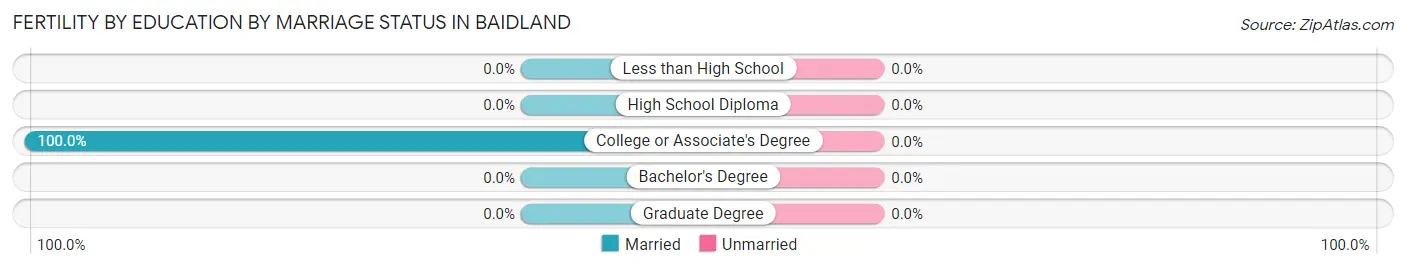
| Educational Attainment | Married | Unmarried |
| Less than High School | 0 (0.0%) | 0 (0.0%) |
| High School Diploma | 0 (0.0%) | 0 (0.0%) |
| College or Associate's Degree | 23 (100.0%) | 0 (0.0%) |
| Bachelor's Degree | 0 (0.0%) | 0 (0.0%) |
| Graduate Degree | 0 (0.0%) | 0 (0.0%) |
| Total | 23 (100.0%) | 0 (0.0%) |
Employment Characteristics in Baidland
Employment by Class of Employer in Baidland
Among the 883 employed individuals in Baidland, private company employees (501 | 56.7%), not-for-profit organizations (218 | 24.7%), and self-employed (incorporated) (85 | 9.6%) make up the most common classes of employment.
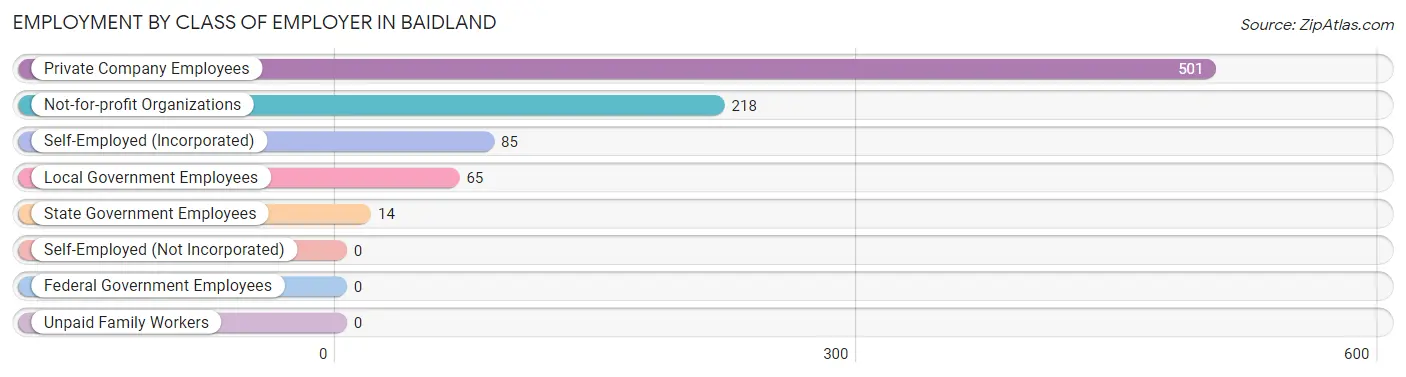
| Employer Class | # Employees | % Employees |
| Private Company Employees | 501 | 56.7% |
| Self-Employed (Incorporated) | 85 | 9.6% |
| Self-Employed (Not Incorporated) | 0 | 0.0% |
| Not-for-profit Organizations | 218 | 24.7% |
| Local Government Employees | 65 | 7.4% |
| State Government Employees | 14 | 1.6% |
| Federal Government Employees | 0 | 0.0% |
| Unpaid Family Workers | 0 | 0.0% |
| Total | 883 | 100.0% |
Employment Status by Age in Baidland
According to the labor force statistics for Baidland, out of the total population over 16 years of age (1,478), 66.9% or 989 individuals are in the labor force, with 10.7% or 106 of them unemployed. The age group with the highest labor force participation rate is 30 to 34 years, with 100.0% or 42 individuals in the labor force. Within the labor force, the 16 to 19 years age range has the highest percentage of unemployed individuals, with 100.0% or 52 of them being unemployed.
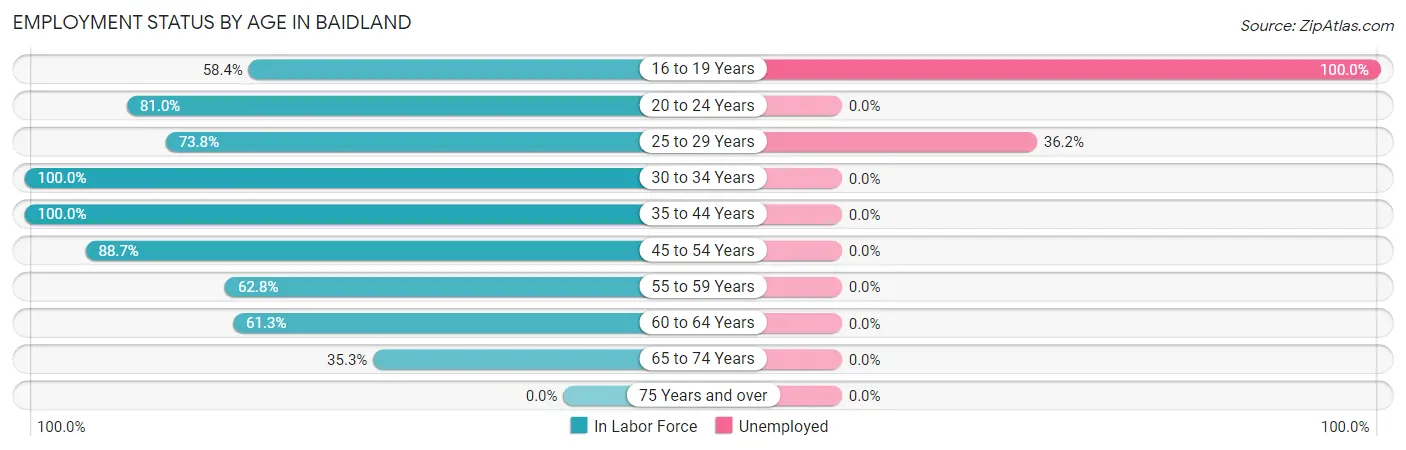
| Age Bracket | In Labor Force | Unemployed |
| 16 to 19 Years | 52 (58.4%) | 52 (100.0%) |
| 20 to 24 Years | 17 (81.0%) | 0 (0.0%) |
| 25 to 29 Years | 149 (73.8%) | 54 (36.2%) |
| 30 to 34 Years | 42 (100.0%) | 0 (0.0%) |
| 35 to 44 Years | 310 (100.0%) | 0 (0.0%) |
| 45 to 54 Years | 165 (88.7%) | 0 (0.0%) |
| 55 to 59 Years | 81 (62.8%) | 0 (0.0%) |
| 60 to 64 Years | 95 (61.3%) | 0 (0.0%) |
| 65 to 74 Years | 78 (35.3%) | 0 (0.0%) |
| 75 Years and over | 0 (0.0%) | 0 (0.0%) |
| Total | 989 (66.9%) | 106 (10.7%) |
Employment Status by Educational Attainment in Baidland
According to labor force statistics for Baidland, 82.2% of individuals (842) out of the total population between 25 and 64 years of age (1,024) are in the labor force, with 6.4% or 54 of them being unemployed. The group with the highest labor force participation rate are those with the educational attainment of bachelor's degree or higher, with 96.6% or 392 individuals in the labor force. Within the labor force, individuals with high school diploma education have the highest percentage of unemployment, with 22.0% or 54 of them being unemployed.
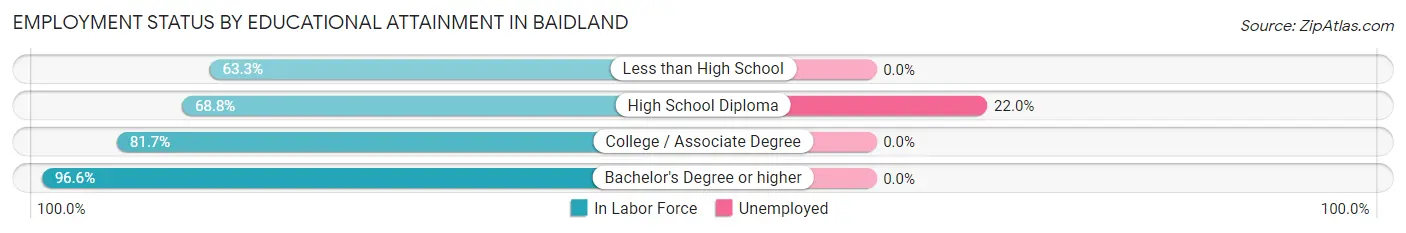
| Educational Attainment | In Labor Force | Unemployed |
| Less than High School | 31 (63.3%) | 0 (0.0%) |
| High School Diploma | 245 (68.8%) | 78 (22.0%) |
| College / Associate Degree | 174 (81.7%) | 0 (0.0%) |
| Bachelor's Degree or higher | 392 (96.6%) | 0 (0.0%) |
| Total | 842 (82.2%) | 66 (6.4%) |
Employment Occupations by Sex in Baidland
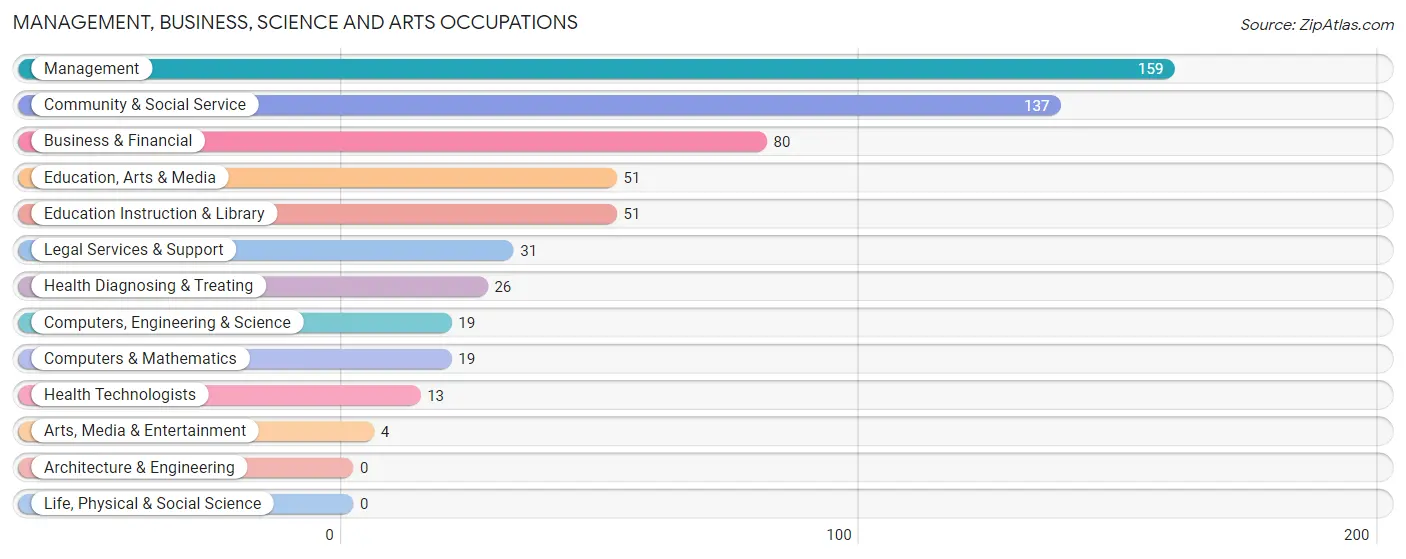
Management, Business, Science and Arts Occupations
The most common Management, Business, Science and Arts occupations in Baidland are Management (159 | 18.0%), Community & Social Service (137 | 15.5%), Business & Financial (80 | 9.1%), Education, Arts & Media (51 | 5.8%), and Education Instruction & Library (51 | 5.8%).
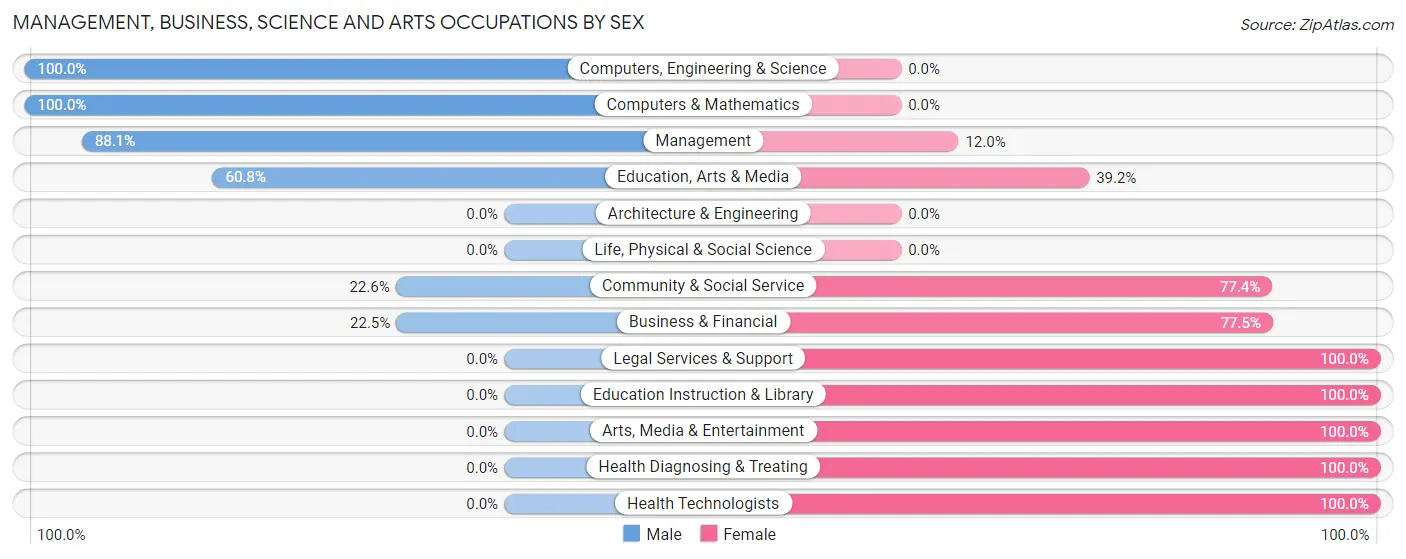
Management, Business, Science and Arts Occupations by Sex
Within the Management, Business, Science and Arts occupations in Baidland, the most male-oriented occupations are Computers, Engineering & Science (100.0%), Computers & Mathematics (100.0%), and Management (88.0%), while the most female-oriented occupations are Legal Services & Support (100.0%), Education Instruction & Library (100.0%), and Arts, Media & Entertainment (100.0%).
| Occupation | Male | Female |
| Management | 140 (88.0%) | 19 (11.9%) |
| Business & Financial | 18 (22.5%) | 62 (77.5%) |
| Computers, Engineering & Science | 19 (100.0%) | 0 (0.0%) |
| Computers & Mathematics | 19 (100.0%) | 0 (0.0%) |
| Architecture & Engineering | 0 (0.0%) | 0 (0.0%) |
| Life, Physical & Social Science | 0 (0.0%) | 0 (0.0%) |
| Community & Social Service | 31 (22.6%) | 106 (77.4%) |
| Education, Arts & Media | 31 (60.8%) | 20 (39.2%) |
| Legal Services & Support | 0 (0.0%) | 31 (100.0%) |
| Education Instruction & Library | 0 (0.0%) | 51 (100.0%) |
| Arts, Media & Entertainment | 0 (0.0%) | 4 (100.0%) |
| Health Diagnosing & Treating | 0 (0.0%) | 26 (100.0%) |
| Health Technologists | 0 (0.0%) | 13 (100.0%) |
| Total (Category) | 208 (49.4%) | 213 (50.6%) |
| Total (Overall) | 475 (53.8%) | 408 (46.2%) |
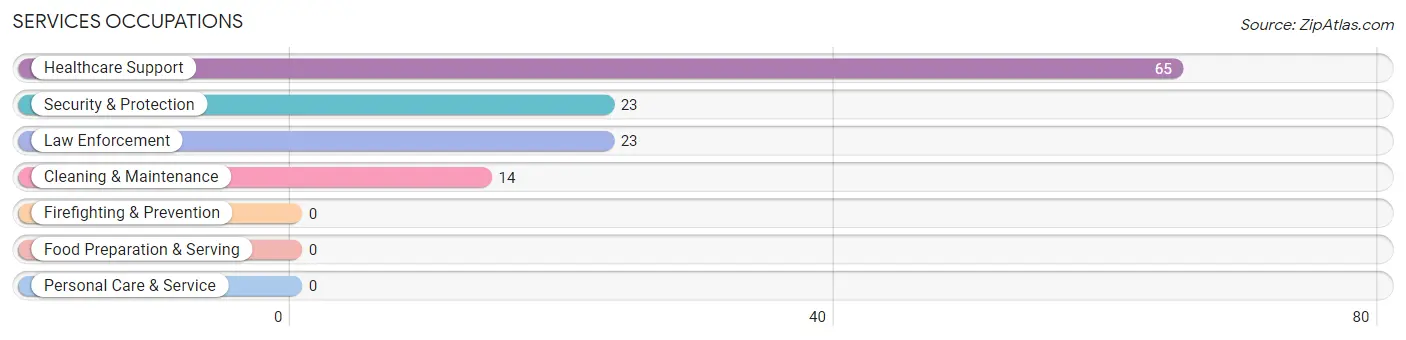
Services Occupations
The most common Services occupations in Baidland are Healthcare Support (65 | 7.4%), Security & Protection (23 | 2.6%), Law Enforcement (23 | 2.6%), and Cleaning & Maintenance (14 | 1.6%).
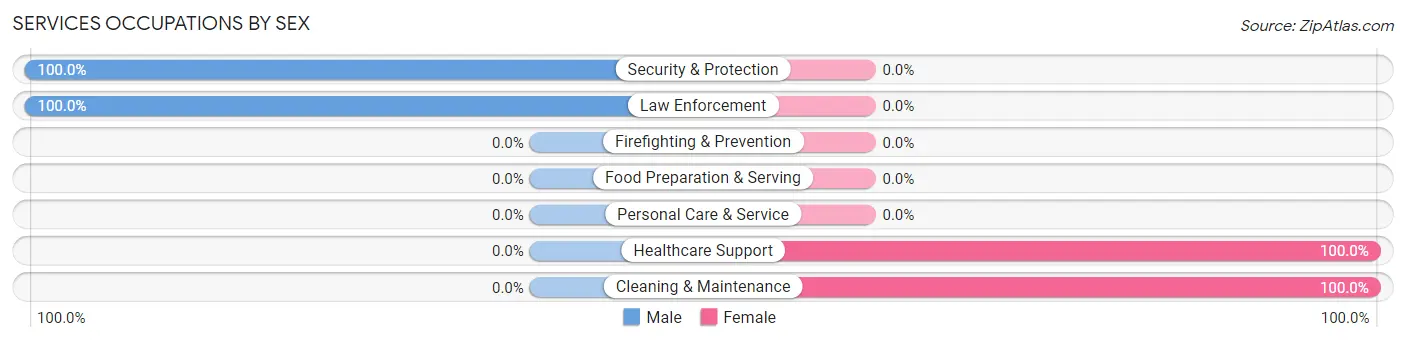
Services Occupations by Sex
Within the Services occupations in Baidland, the most male-oriented occupations are Security & Protection (100.0%), and Law Enforcement (100.0%), while the most female-oriented occupations are Healthcare Support (100.0%), and Cleaning & Maintenance (100.0%).
| Occupation | Male | Female |
| Healthcare Support | 0 (0.0%) | 65 (100.0%) |
| Security & Protection | 23 (100.0%) | 0 (0.0%) |
| Firefighting & Prevention | 0 (0.0%) | 0 (0.0%) |
| Law Enforcement | 23 (100.0%) | 0 (0.0%) |
| Food Preparation & Serving | 0 (0.0%) | 0 (0.0%) |
| Cleaning & Maintenance | 0 (0.0%) | 14 (100.0%) |
| Personal Care & Service | 0 (0.0%) | 0 (0.0%) |
| Total (Category) | 23 (22.6%) | 79 (77.4%) |
| Total (Overall) | 475 (53.8%) | 408 (46.2%) |
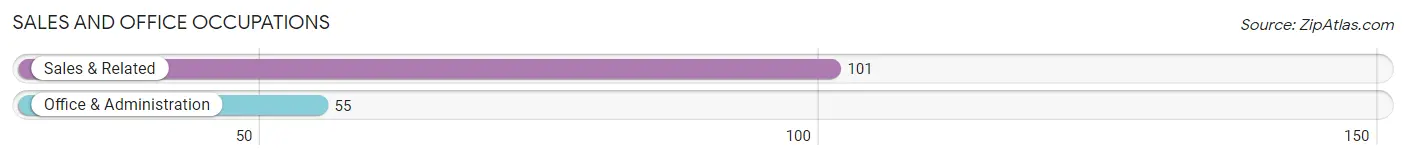
Sales and Office Occupations
The most common Sales and Office occupations in Baidland are Sales & Related (101 | 11.4%), and Office & Administration (55 | 6.2%).
Sales and Office Occupations by Sex
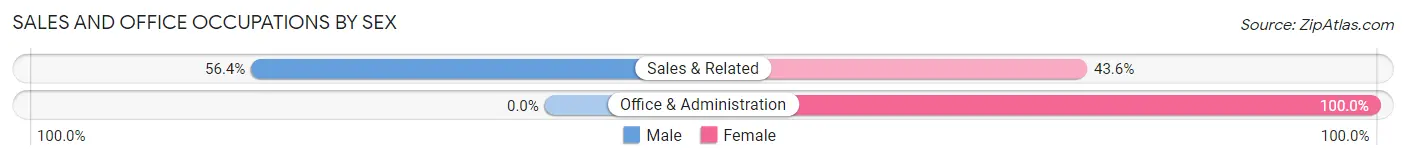
| Occupation | Male | Female |
| Sales & Related | 57 (56.4%) | 44 (43.6%) |
| Office & Administration | 0 (0.0%) | 55 (100.0%) |
| Total (Category) | 57 (36.5%) | 99 (63.5%) |
| Total (Overall) | 475 (53.8%) | 408 (46.2%) |
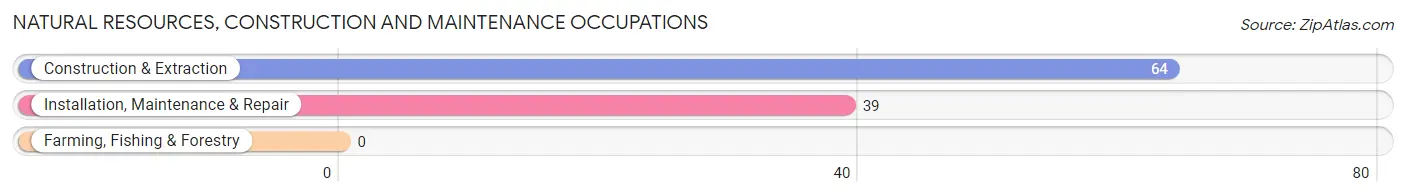
Natural Resources, Construction and Maintenance Occupations
The most common Natural Resources, Construction and Maintenance occupations in Baidland are Construction & Extraction (64 | 7.2%), and Installation, Maintenance & Repair (39 | 4.4%).
Natural Resources, Construction and Maintenance Occupations by Sex
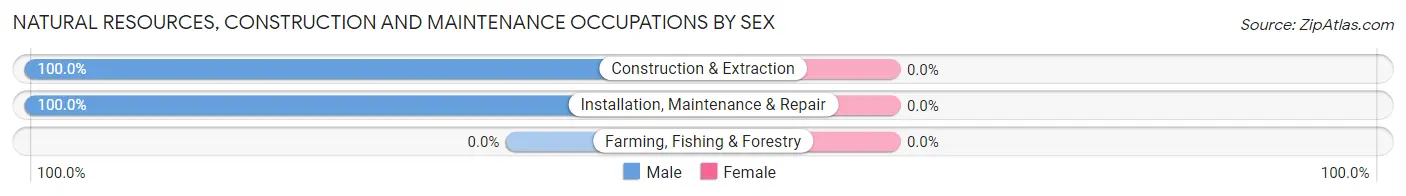
| Occupation | Male | Female |
| Farming, Fishing & Forestry | 0 (0.0%) | 0 (0.0%) |
| Construction & Extraction | 64 (100.0%) | 0 (0.0%) |
| Installation, Maintenance & Repair | 39 (100.0%) | 0 (0.0%) |
| Total (Category) | 103 (100.0%) | 0 (0.0%) |
| Total (Overall) | 475 (53.8%) | 408 (46.2%) |
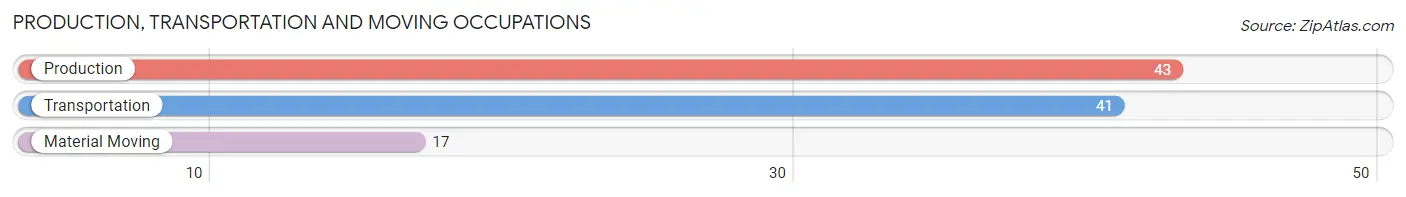
Production, Transportation and Moving Occupations
The most common Production, Transportation and Moving occupations in Baidland are Production (43 | 4.9%), Transportation (41 | 4.6%), and Material Moving (17 | 1.9%).
Production, Transportation and Moving Occupations by Sex
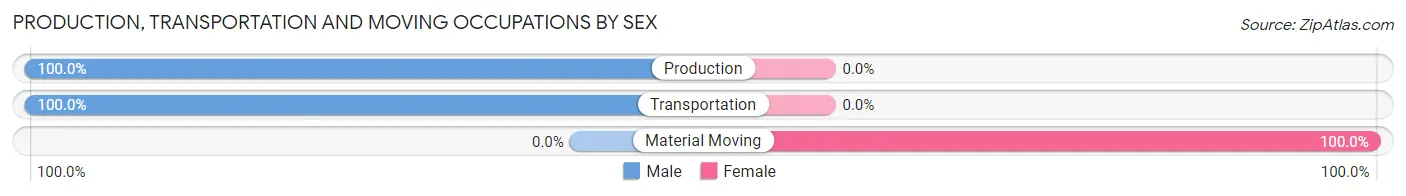
| Occupation | Male | Female |
| Production | 43 (100.0%) | 0 (0.0%) |
| Transportation | 41 (100.0%) | 0 (0.0%) |
| Material Moving | 0 (0.0%) | 17 (100.0%) |
| Total (Category) | 84 (83.2%) | 17 (16.8%) |
| Total (Overall) | 475 (53.8%) | 408 (46.2%) |
Employment Industries by Sex in Baidland
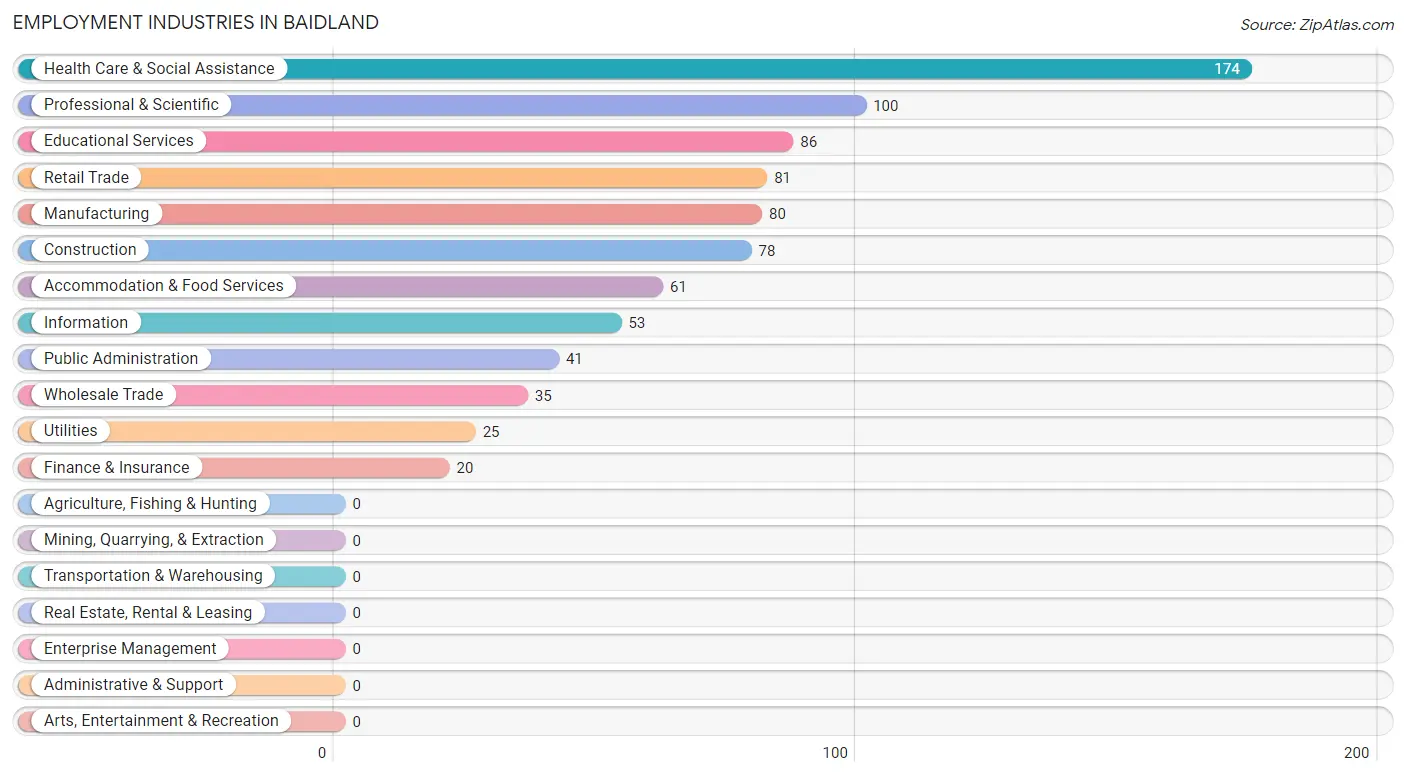
Employment Industries in Baidland
The major employment industries in Baidland include Health Care & Social Assistance (174 | 19.7%), Professional & Scientific (100 | 11.3%), Educational Services (86 | 9.7%), Retail Trade (81 | 9.2%), and Manufacturing (80 | 9.1%).
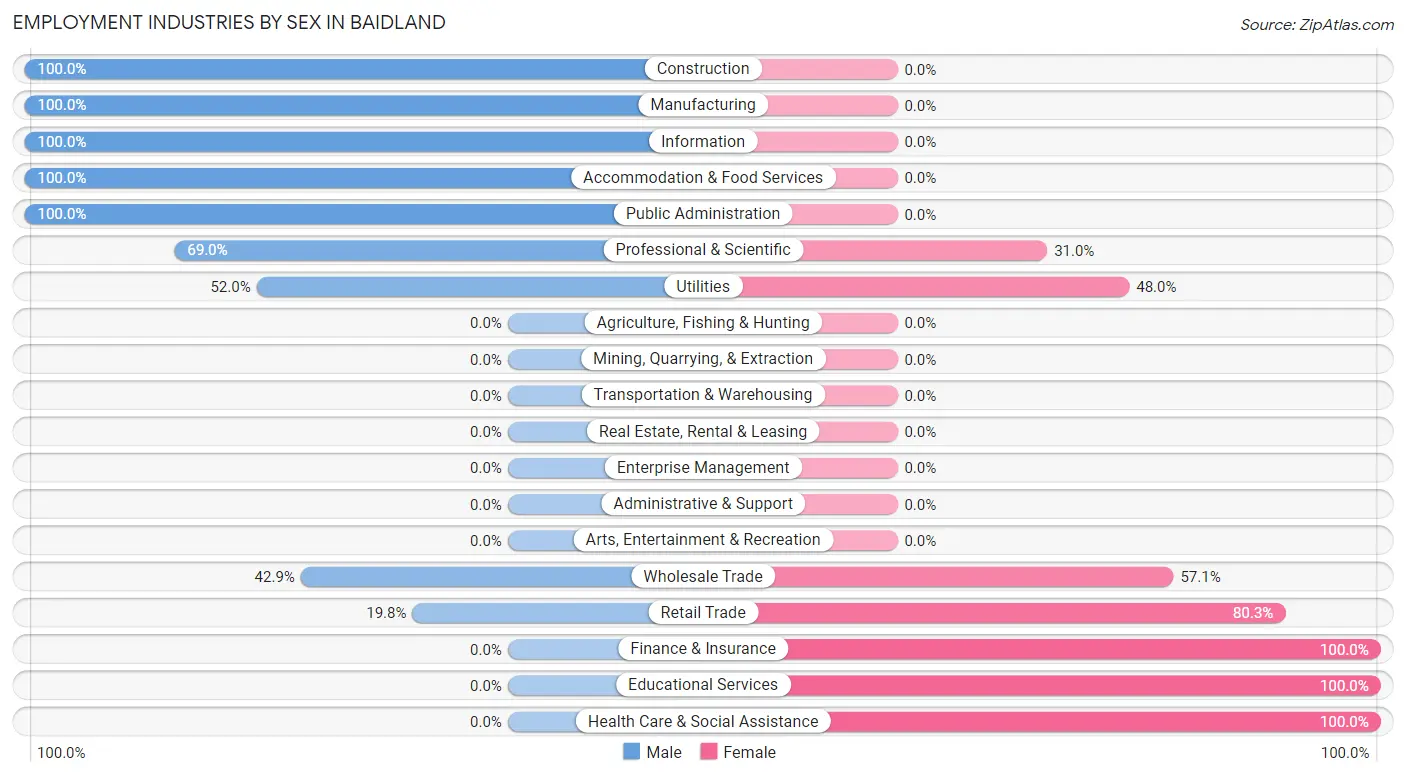
Employment Industries by Sex in Baidland
The Baidland industries that see more men than women are Construction (100.0%), Manufacturing (100.0%), and Information (100.0%), whereas the industries that tend to have a higher number of women are Finance & Insurance (100.0%), Educational Services (100.0%), and Health Care & Social Assistance (100.0%).
| Industry | Male | Female |
| Agriculture, Fishing & Hunting | 0 (0.0%) | 0 (0.0%) |
| Mining, Quarrying, & Extraction | 0 (0.0%) | 0 (0.0%) |
| Construction | 78 (100.0%) | 0 (0.0%) |
| Manufacturing | 80 (100.0%) | 0 (0.0%) |
| Wholesale Trade | 15 (42.9%) | 20 (57.1%) |
| Retail Trade | 16 (19.8%) | 65 (80.2%) |
| Transportation & Warehousing | 0 (0.0%) | 0 (0.0%) |
| Utilities | 13 (52.0%) | 12 (48.0%) |
| Information | 53 (100.0%) | 0 (0.0%) |
| Finance & Insurance | 0 (0.0%) | 20 (100.0%) |
| Real Estate, Rental & Leasing | 0 (0.0%) | 0 (0.0%) |
| Professional & Scientific | 69 (69.0%) | 31 (31.0%) |
| Enterprise Management | 0 (0.0%) | 0 (0.0%) |
| Administrative & Support | 0 (0.0%) | 0 (0.0%) |
| Educational Services | 0 (0.0%) | 86 (100.0%) |
| Health Care & Social Assistance | 0 (0.0%) | 174 (100.0%) |
| Arts, Entertainment & Recreation | 0 (0.0%) | 0 (0.0%) |
| Accommodation & Food Services | 61 (100.0%) | 0 (0.0%) |
| Public Administration | 41 (100.0%) | 0 (0.0%) |
| Total | 475 (53.8%) | 408 (46.2%) |
Education in Baidland
School Enrollment in Baidland
The most common levels of schooling among the 267 students in Baidland are elementary school (87 | 32.6%), high school (72 | 27.0%), and middle school (47 | 17.6%).
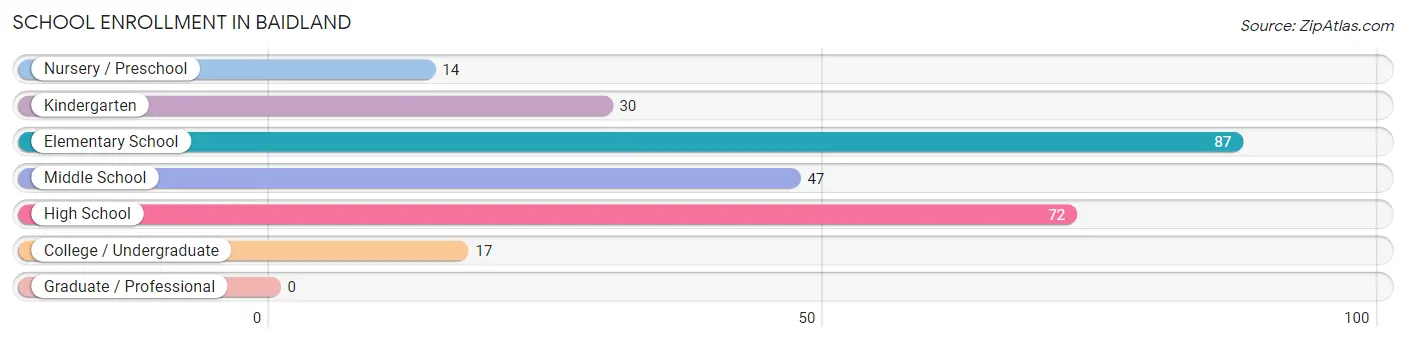
| School Level | # Students | % Students |
| Nursery / Preschool | 14 | 5.2% |
| Kindergarten | 30 | 11.2% |
| Elementary School | 87 | 32.6% |
| Middle School | 47 | 17.6% |
| High School | 72 | 27.0% |
| College / Undergraduate | 17 | 6.4% |
| Graduate / Professional | 0 | 0.0% |
| Total | 267 | 100.0% |
School Enrollment by Age by Funding Source in Baidland
Out of a total of 267 students who are enrolled in schools in Baidland, 107 (40.1%) attend a private institution, while the remaining 160 (59.9%) are enrolled in public schools. The age group of 5 to 9 year old has the highest likelihood of being enrolled in private schools, with 90 (100.0% in the age bracket) enrolled. Conversely, the age group of 3 to 4 year olds has the lowest likelihood of being enrolled in a private school, with 14 (100.0% in the age bracket) attending a public institution.
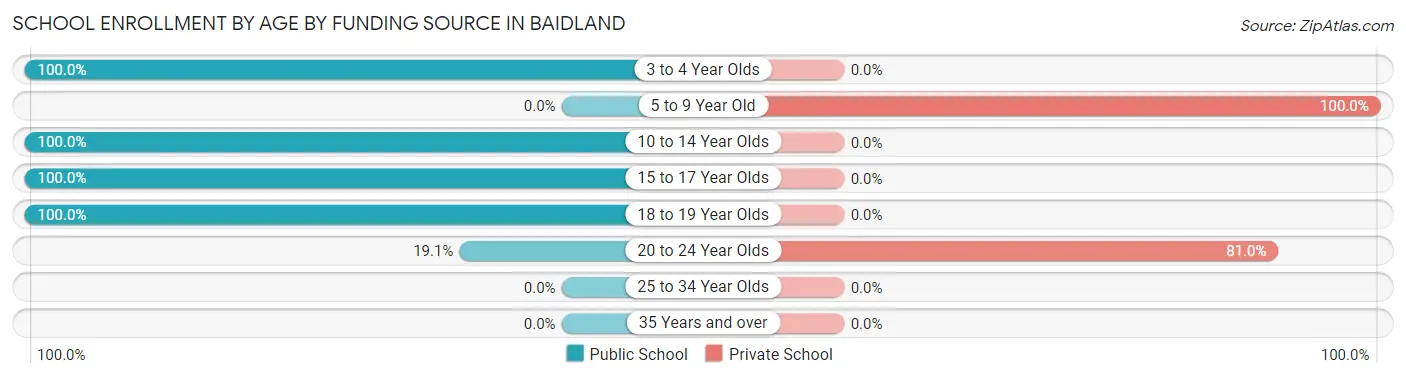
| Age Bracket | Public School | Private School |
| 3 to 4 Year Olds | 14 (100.0%) | 0 (0.0%) |
| 5 to 9 Year Old | 0 (0.0%) | 90 (100.0%) |
| 10 to 14 Year Olds | 74 (100.0%) | 0 (0.0%) |
| 15 to 17 Year Olds | 31 (100.0%) | 0 (0.0%) |
| 18 to 19 Year Olds | 37 (100.0%) | 0 (0.0%) |
| 20 to 24 Year Olds | 4 (19.1%) | 17 (80.9%) |
| 25 to 34 Year Olds | 0 (0.0%) | 0 (0.0%) |
| 35 Years and over | 0 (0.0%) | 0 (0.0%) |
| Total | 160 (59.9%) | 107 (40.1%) |
Educational Attainment by Field of Study in Baidland
Engineering (107 | 23.4%), liberal arts & history (65 | 14.2%), education (53 | 11.6%), business (43 | 9.4%), and bio, nature & agricultural (38 | 8.3%) are the most common fields of study among 458 individuals in Baidland who have obtained a bachelor's degree or higher.
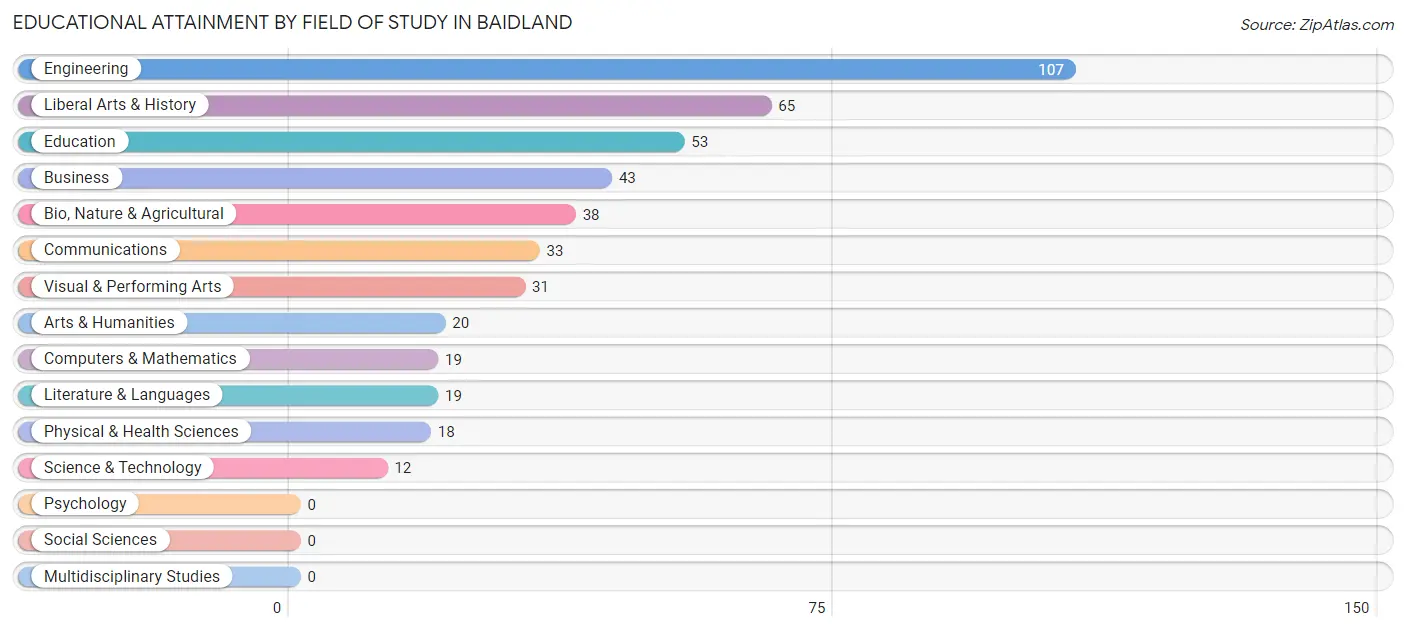
| Field of Study | # Graduates | % Graduates |
| Computers & Mathematics | 19 | 4.2% |
| Bio, Nature & Agricultural | 38 | 8.3% |
| Physical & Health Sciences | 18 | 3.9% |
| Psychology | 0 | 0.0% |
| Social Sciences | 0 | 0.0% |
| Engineering | 107 | 23.4% |
| Multidisciplinary Studies | 0 | 0.0% |
| Science & Technology | 12 | 2.6% |
| Business | 43 | 9.4% |
| Education | 53 | 11.6% |
| Literature & Languages | 19 | 4.2% |
| Liberal Arts & History | 65 | 14.2% |
| Visual & Performing Arts | 31 | 6.8% |
| Communications | 33 | 7.2% |
| Arts & Humanities | 20 | 4.4% |
| Total | 458 | 100.0% |
Transportation & Commute in Baidland
Vehicle Availability by Sex in Baidland
The most prevalent vehicle ownership categories in Baidland are males with 2 vehicles (317, accounting for 66.7%) and females with 2 vehicles (290, making up 78.5%).
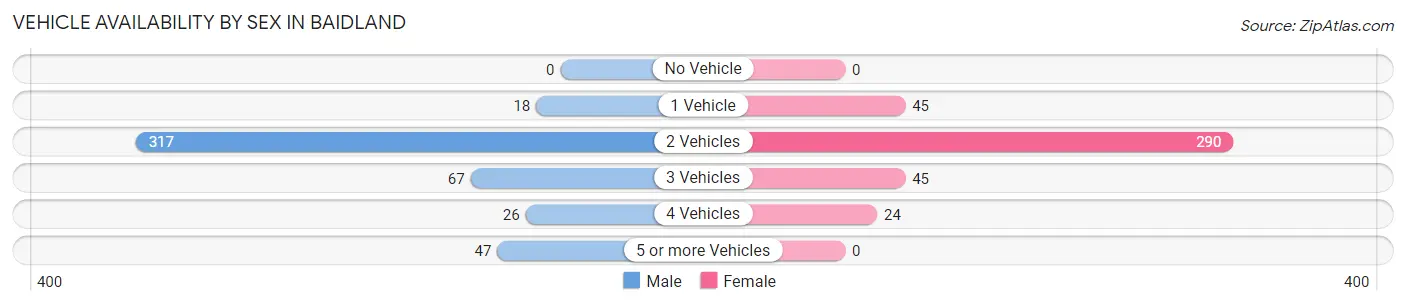
| Vehicles Available | Male | Female |
| No Vehicle | 0 (0.0%) | 0 (0.0%) |
| 1 Vehicle | 18 (3.8%) | 45 (11.1%) |
| 2 Vehicles | 317 (66.7%) | 290 (71.8%) |
| 3 Vehicles | 67 (14.1%) | 45 (11.1%) |
| 4 Vehicles | 26 (5.5%) | 24 (5.9%) |
| 5 or more Vehicles | 47 (9.9%) | 0 (0.0%) |
| Total | 475 (100.0%) | 404 (100.0%) |
Commute Time in Baidland
The most frequently occuring commute durations in Baidland are 45 to 59 minutes (282 commuters, 36.5%), 60 to 89 minutes (110 commuters, 14.2%), and 25 to 29 minutes (77 commuters, 10.0%).
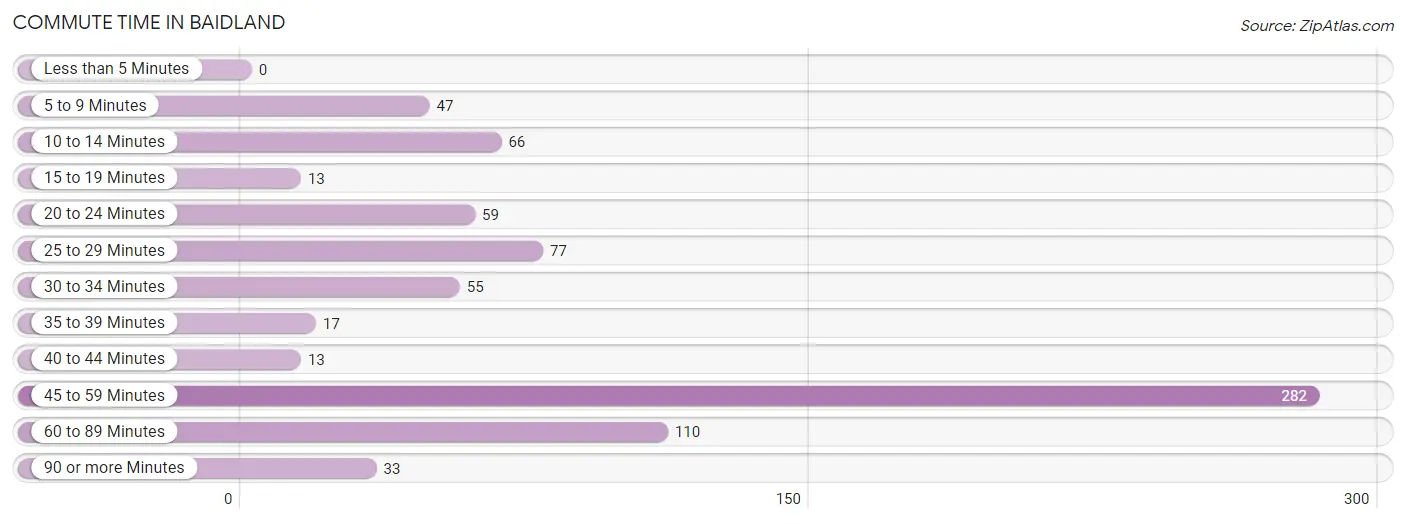
| Commute Time | # Commuters | % Commuters |
| Less than 5 Minutes | 0 | 0.0% |
| 5 to 9 Minutes | 47 | 6.1% |
| 10 to 14 Minutes | 66 | 8.6% |
| 15 to 19 Minutes | 13 | 1.7% |
| 20 to 24 Minutes | 59 | 7.6% |
| 25 to 29 Minutes | 77 | 10.0% |
| 30 to 34 Minutes | 55 | 7.1% |
| 35 to 39 Minutes | 17 | 2.2% |
| 40 to 44 Minutes | 13 | 1.7% |
| 45 to 59 Minutes | 282 | 36.5% |
| 60 to 89 Minutes | 110 | 14.2% |
| 90 or more Minutes | 33 | 4.3% |
Commute Time by Sex in Baidland
The most common commute times in Baidland are 45 to 59 minutes (173 commuters, 40.6%) for males and 45 to 59 minutes (109 commuters, 31.5%) for females.
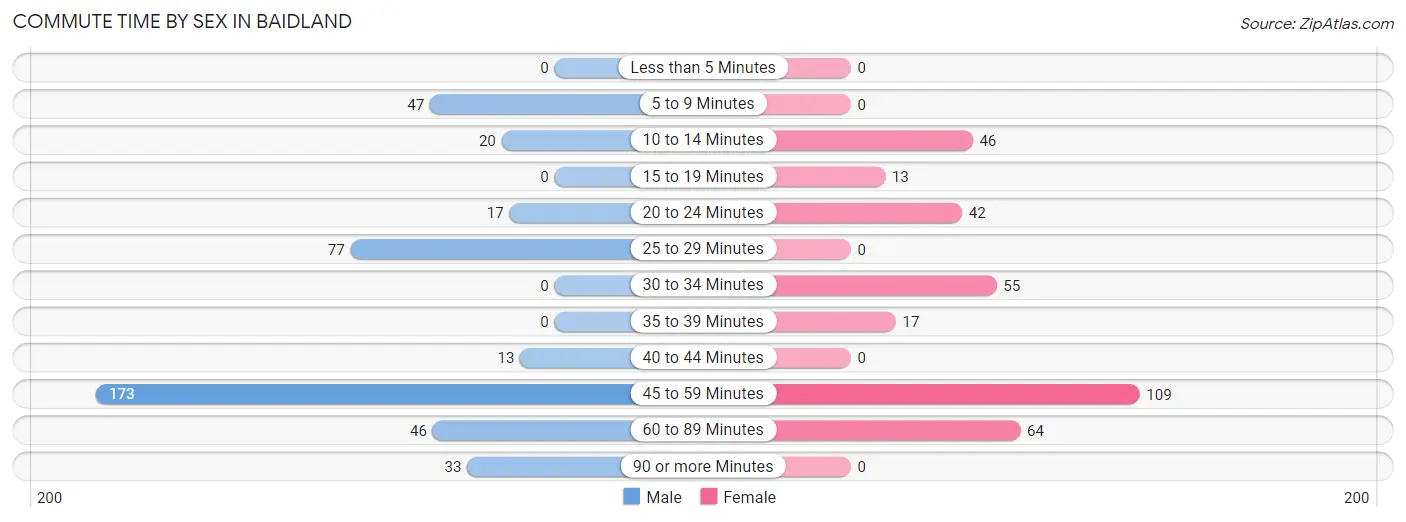
| Commute Time | Male | Female |
| Less than 5 Minutes | 0 (0.0%) | 0 (0.0%) |
| 5 to 9 Minutes | 47 (11.0%) | 0 (0.0%) |
| 10 to 14 Minutes | 20 (4.7%) | 46 (13.3%) |
| 15 to 19 Minutes | 0 (0.0%) | 13 (3.8%) |
| 20 to 24 Minutes | 17 (4.0%) | 42 (12.1%) |
| 25 to 29 Minutes | 77 (18.1%) | 0 (0.0%) |
| 30 to 34 Minutes | 0 (0.0%) | 55 (15.9%) |
| 35 to 39 Minutes | 0 (0.0%) | 17 (4.9%) |
| 40 to 44 Minutes | 13 (3.0%) | 0 (0.0%) |
| 45 to 59 Minutes | 173 (40.6%) | 109 (31.5%) |
| 60 to 89 Minutes | 46 (10.8%) | 64 (18.5%) |
| 90 or more Minutes | 33 (7.7%) | 0 (0.0%) |
Time of Departure to Work by Sex in Baidland
The most frequent times of departure to work in Baidland are 5:30 AM to 5:59 AM (133, 31.2%) for males and 6:30 AM to 6:59 AM (99, 28.6%) for females.
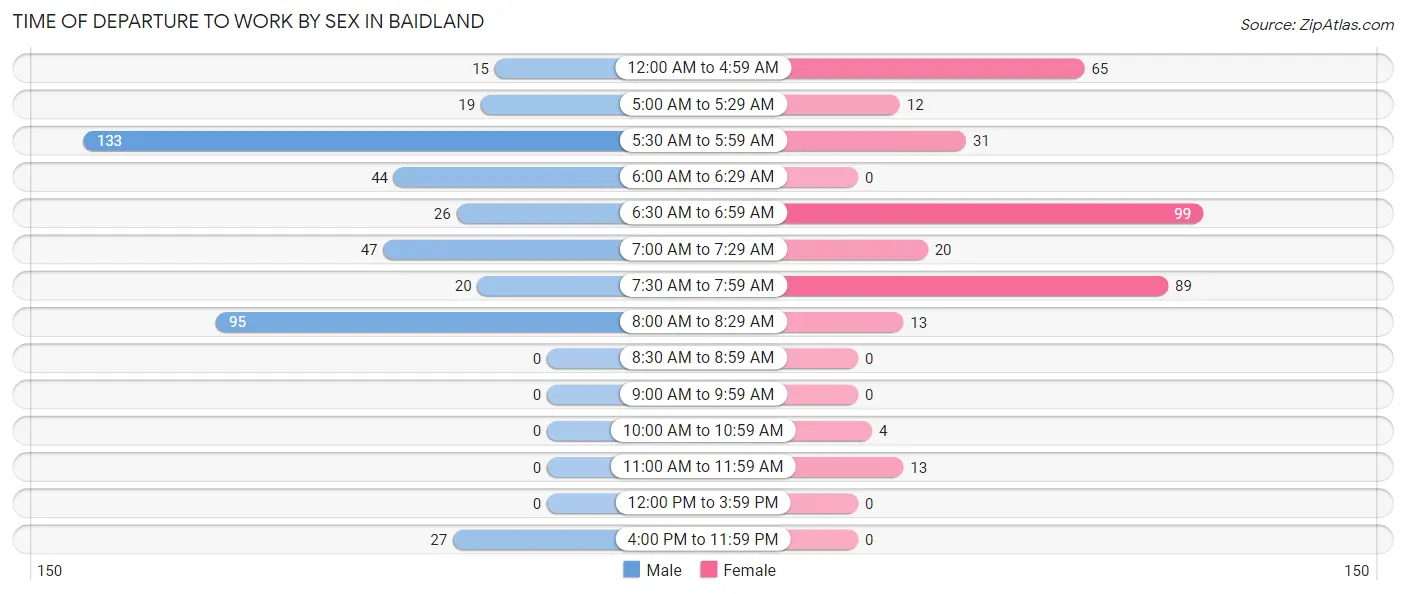
| Time of Departure | Male | Female |
| 12:00 AM to 4:59 AM | 15 (3.5%) | 65 (18.8%) |
| 5:00 AM to 5:29 AM | 19 (4.5%) | 12 (3.5%) |
| 5:30 AM to 5:59 AM | 133 (31.2%) | 31 (9.0%) |
| 6:00 AM to 6:29 AM | 44 (10.3%) | 0 (0.0%) |
| 6:30 AM to 6:59 AM | 26 (6.1%) | 99 (28.6%) |
| 7:00 AM to 7:29 AM | 47 (11.0%) | 20 (5.8%) |
| 7:30 AM to 7:59 AM | 20 (4.7%) | 89 (25.7%) |
| 8:00 AM to 8:29 AM | 95 (22.3%) | 13 (3.8%) |
| 8:30 AM to 8:59 AM | 0 (0.0%) | 0 (0.0%) |
| 9:00 AM to 9:59 AM | 0 (0.0%) | 0 (0.0%) |
| 10:00 AM to 10:59 AM | 0 (0.0%) | 4 (1.2%) |
| 11:00 AM to 11:59 AM | 0 (0.0%) | 13 (3.8%) |
| 12:00 PM to 3:59 PM | 0 (0.0%) | 0 (0.0%) |
| 4:00 PM to 11:59 PM | 27 (6.3%) | 0 (0.0%) |
| Total | 426 (100.0%) | 346 (100.0%) |
Housing Occupancy in Baidland
Occupancy by Ownership in Baidland
Of the total 747 dwellings in Baidland, owner-occupied units account for 676 (90.5%), while renter-occupied units make up 71 (9.5%).
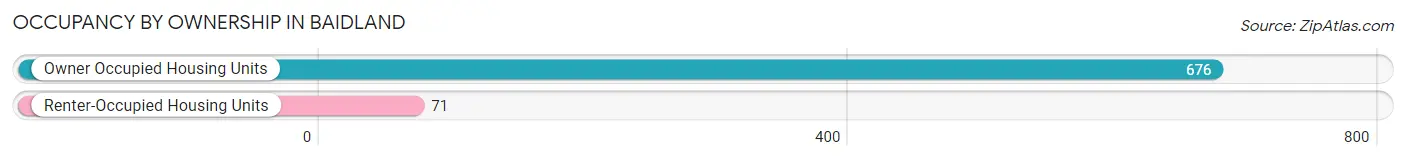
| Occupancy | # Housing Units | % Housing Units |
| Owner Occupied Housing Units | 676 | 90.5% |
| Renter-Occupied Housing Units | 71 | 9.5% |
| Total Occupied Housing Units | 747 | 100.0% |
Occupancy by Household Size in Baidland
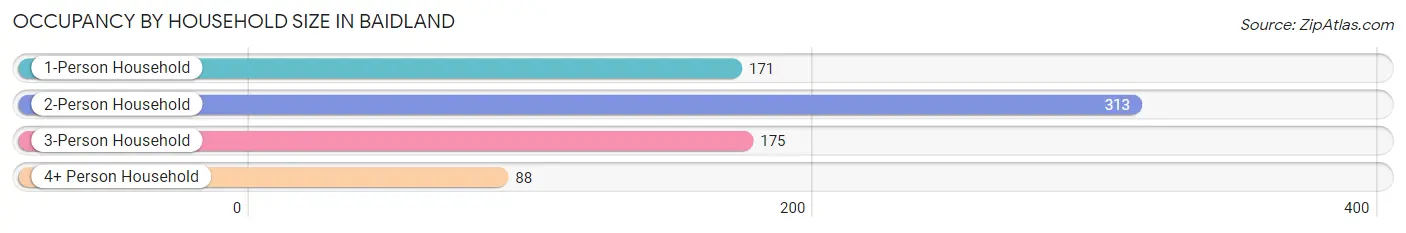
| Household Size | # Housing Units | % Housing Units |
| 1-Person Household | 171 | 22.9% |
| 2-Person Household | 313 | 41.9% |
| 3-Person Household | 175 | 23.4% |
| 4+ Person Household | 88 | 11.8% |
| Total Housing Units | 747 | 100.0% |
Occupancy by Ownership by Household Size in Baidland
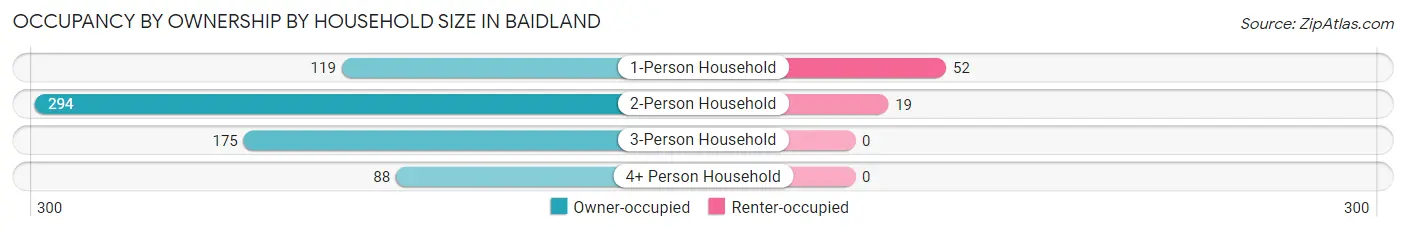
| Household Size | Owner-occupied | Renter-occupied |
| 1-Person Household | 119 (69.6%) | 52 (30.4%) |
| 2-Person Household | 294 (93.9%) | 19 (6.1%) |
| 3-Person Household | 175 (100.0%) | 0 (0.0%) |
| 4+ Person Household | 88 (100.0%) | 0 (0.0%) |
| Total Housing Units | 676 (90.5%) | 71 (9.5%) |
Occupancy by Educational Attainment in Baidland
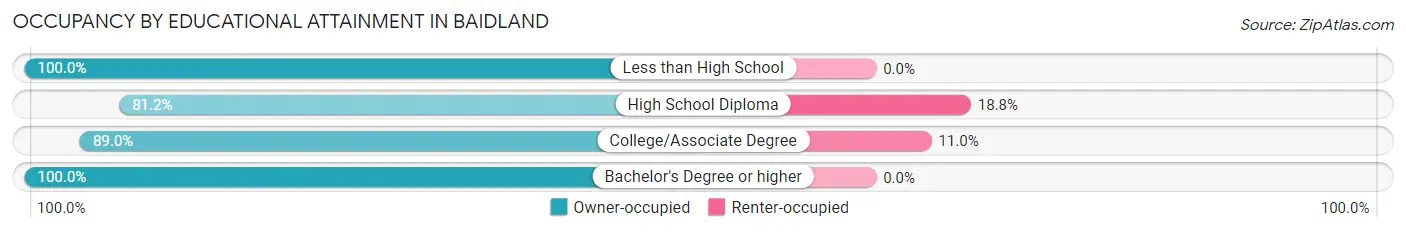
| Household Size | Owner-occupied | Renter-occupied |
| Less than High School | 31 (100.0%) | 0 (0.0%) |
| High School Diploma | 225 (81.2%) | 52 (18.8%) |
| College/Associate Degree | 154 (89.0%) | 19 (11.0%) |
| Bachelor's Degree or higher | 266 (100.0%) | 0 (0.0%) |
Occupancy by Age of Householder in Baidland
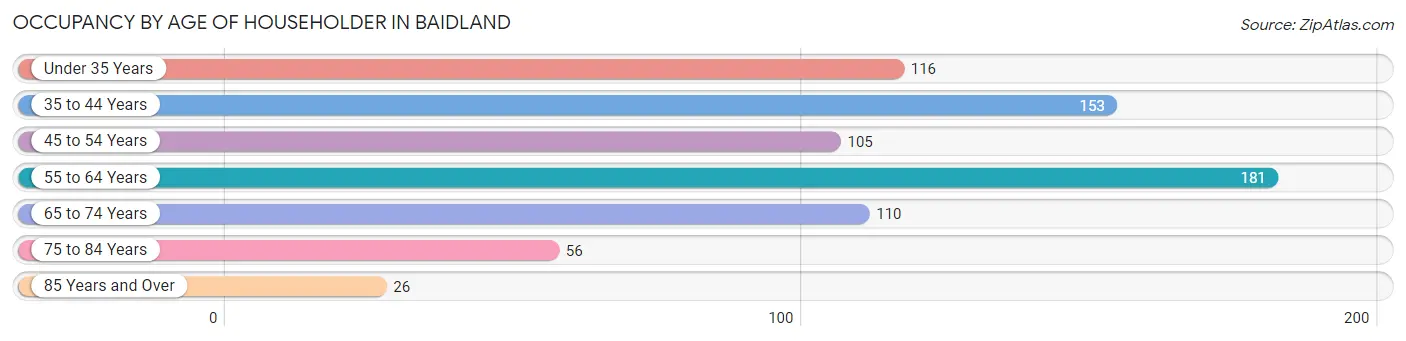
| Age Bracket | # Households | % Households |
| Under 35 Years | 116 | 15.5% |
| 35 to 44 Years | 153 | 20.5% |
| 45 to 54 Years | 105 | 14.1% |
| 55 to 64 Years | 181 | 24.2% |
| 65 to 74 Years | 110 | 14.7% |
| 75 to 84 Years | 56 | 7.5% |
| 85 Years and Over | 26 | 3.5% |
| Total | 747 | 100.0% |
Housing Finances in Baidland
Median Income by Occupancy in Baidland
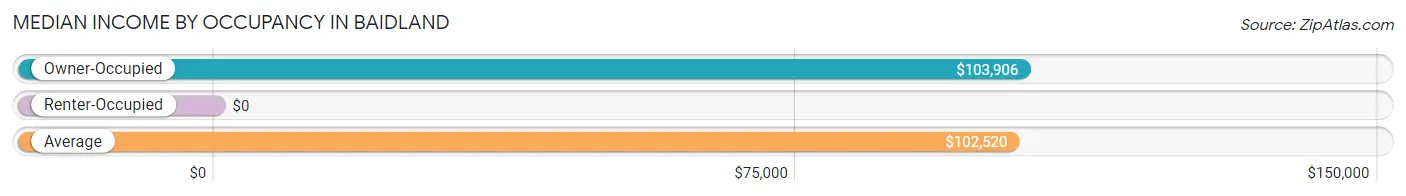
| Occupancy Type | # Households | Median Income |
| Owner-Occupied | 676 (90.5%) | $103,906 |
| Renter-Occupied | 71 (9.5%) | $0 |
| Average | 747 (100.0%) | $102,520 |
Occupancy by Householder Income Bracket in Baidland
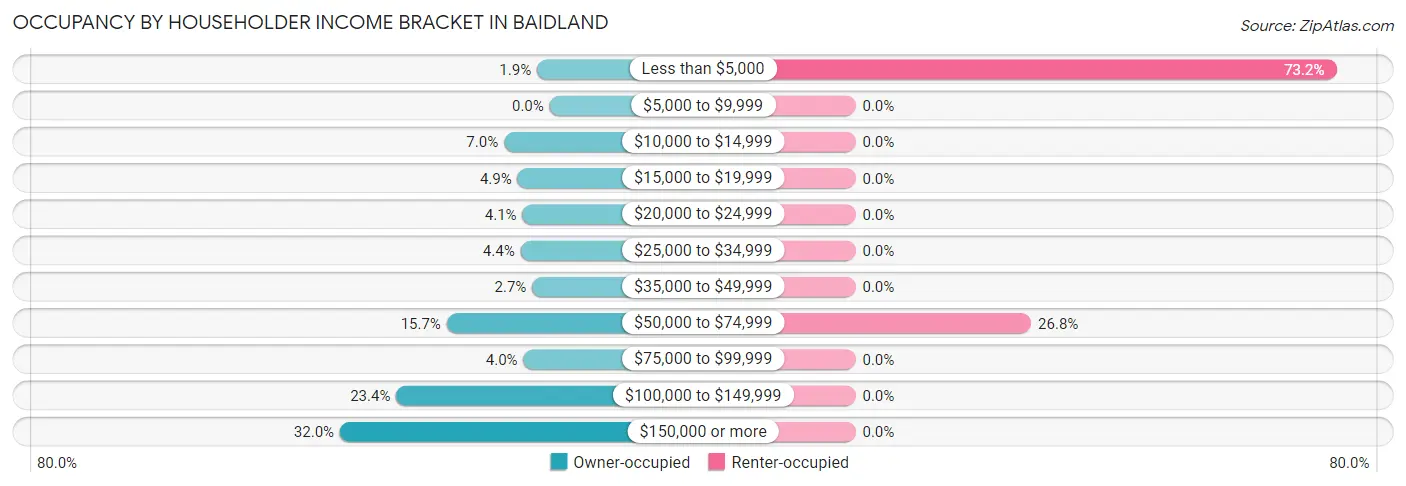
| Income Bracket | Owner-occupied | Renter-occupied |
| Less than $5,000 | 13 (1.9%) | 52 (73.2%) |
| $5,000 to $9,999 | 0 (0.0%) | 0 (0.0%) |
| $10,000 to $14,999 | 47 (7.0%) | 0 (0.0%) |
| $15,000 to $19,999 | 33 (4.9%) | 0 (0.0%) |
| $20,000 to $24,999 | 28 (4.1%) | 0 (0.0%) |
| $25,000 to $34,999 | 30 (4.4%) | 0 (0.0%) |
| $35,000 to $49,999 | 18 (2.7%) | 0 (0.0%) |
| $50,000 to $74,999 | 106 (15.7%) | 19 (26.8%) |
| $75,000 to $99,999 | 27 (4.0%) | 0 (0.0%) |
| $100,000 to $149,999 | 158 (23.4%) | 0 (0.0%) |
| $150,000 or more | 216 (32.0%) | 0 (0.0%) |
| Total | 676 (100.0%) | 71 (100.0%) |
Monthly Housing Cost Tiers in Baidland
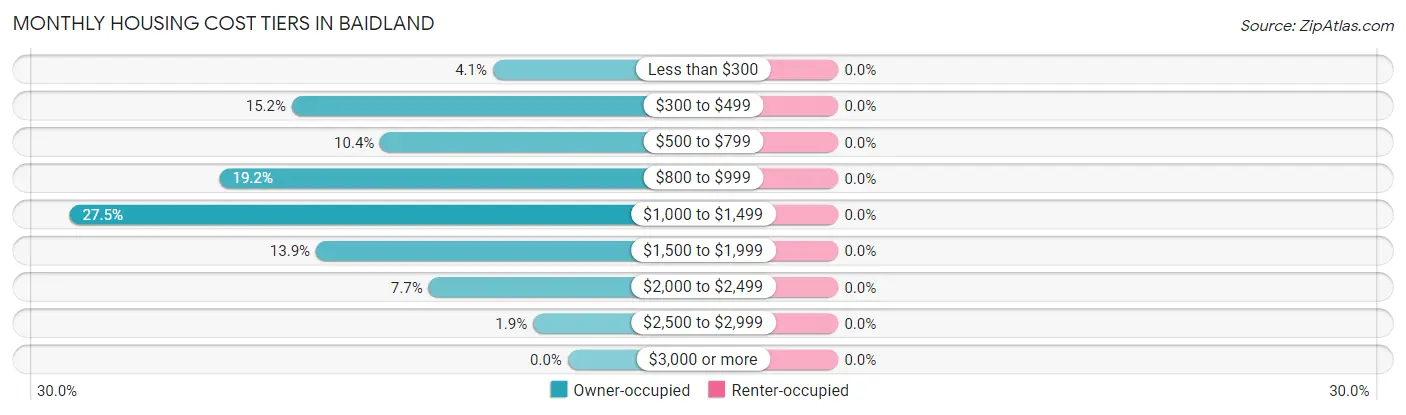
| Monthly Cost | Owner-occupied | Renter-occupied |
| Less than $300 | 28 (4.1%) | 0 (0.0%) |
| $300 to $499 | 103 (15.2%) | 0 (0.0%) |
| $500 to $799 | 70 (10.4%) | 0 (0.0%) |
| $800 to $999 | 130 (19.2%) | 0 (0.0%) |
| $1,000 to $1,499 | 186 (27.5%) | 0 (0.0%) |
| $1,500 to $1,999 | 94 (13.9%) | 0 (0.0%) |
| $2,000 to $2,499 | 52 (7.7%) | 0 (0.0%) |
| $2,500 to $2,999 | 13 (1.9%) | 0 (0.0%) |
| $3,000 or more | 0 (0.0%) | 0 (0.0%) |
| Total | 676 (100.0%) | 71 (100.0%) |
Physical Housing Characteristics in Baidland
Housing Structures in Baidland
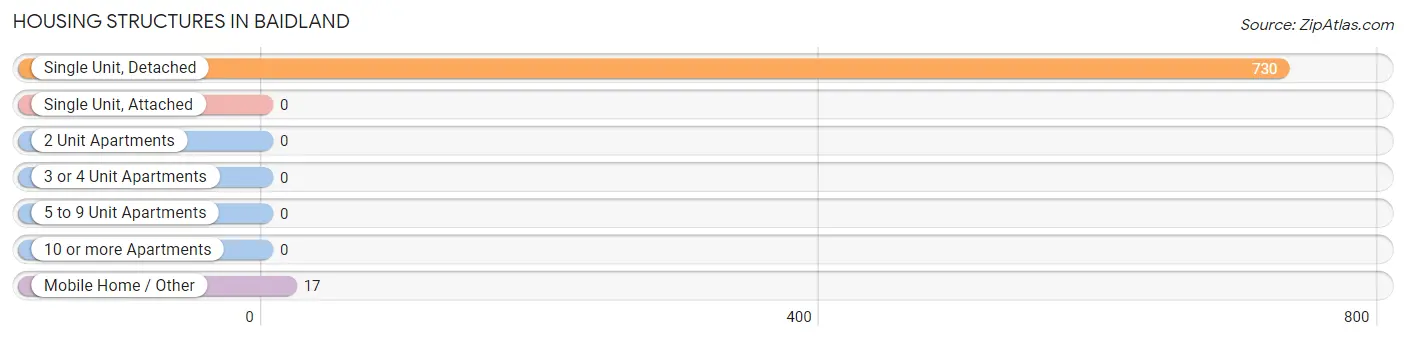
| Structure Type | # Housing Units | % Housing Units |
| Single Unit, Detached | 730 | 97.7% |
| Single Unit, Attached | 0 | 0.0% |
| 2 Unit Apartments | 0 | 0.0% |
| 3 or 4 Unit Apartments | 0 | 0.0% |
| 5 to 9 Unit Apartments | 0 | 0.0% |
| 10 or more Apartments | 0 | 0.0% |
| Mobile Home / Other | 17 | 2.3% |
| Total | 747 | 100.0% |
Housing Structures by Occupancy in Baidland
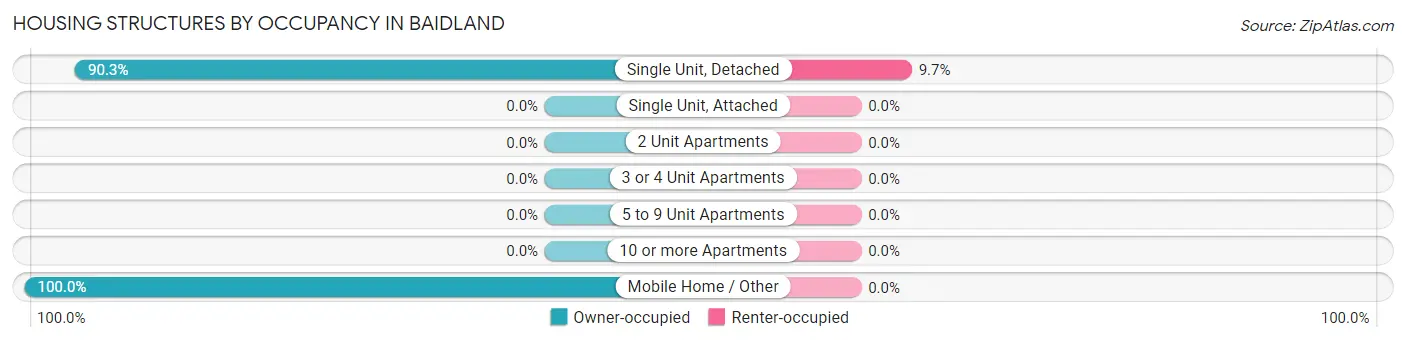
| Structure Type | Owner-occupied | Renter-occupied |
| Single Unit, Detached | 659 (90.3%) | 71 (9.7%) |
| Single Unit, Attached | 0 (0.0%) | 0 (0.0%) |
| 2 Unit Apartments | 0 (0.0%) | 0 (0.0%) |
| 3 or 4 Unit Apartments | 0 (0.0%) | 0 (0.0%) |
| 5 to 9 Unit Apartments | 0 (0.0%) | 0 (0.0%) |
| 10 or more Apartments | 0 (0.0%) | 0 (0.0%) |
| Mobile Home / Other | 17 (100.0%) | 0 (0.0%) |
| Total | 676 (90.5%) | 71 (9.5%) |
Housing Structures by Number of Rooms in Baidland
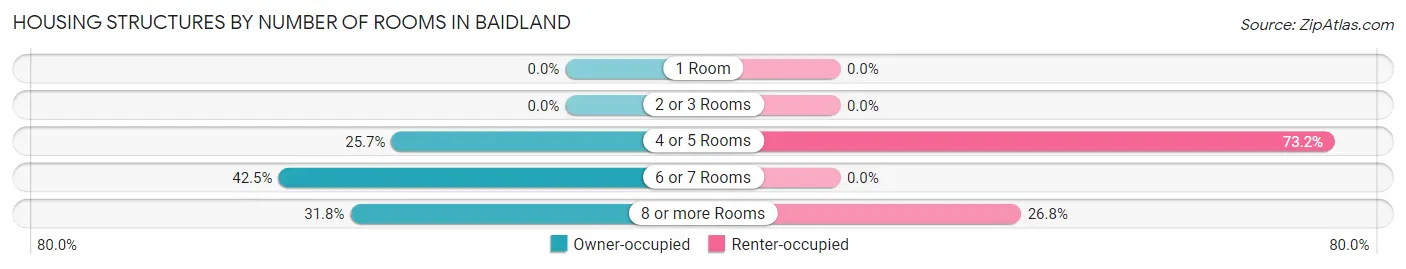
| Number of Rooms | Owner-occupied | Renter-occupied |
| 1 Room | 0 (0.0%) | 0 (0.0%) |
| 2 or 3 Rooms | 0 (0.0%) | 0 (0.0%) |
| 4 or 5 Rooms | 174 (25.7%) | 52 (73.2%) |
| 6 or 7 Rooms | 287 (42.5%) | 0 (0.0%) |
| 8 or more Rooms | 215 (31.8%) | 19 (26.8%) |
| Total | 676 (100.0%) | 71 (100.0%) |
Housing Structure by Heating Type in Baidland
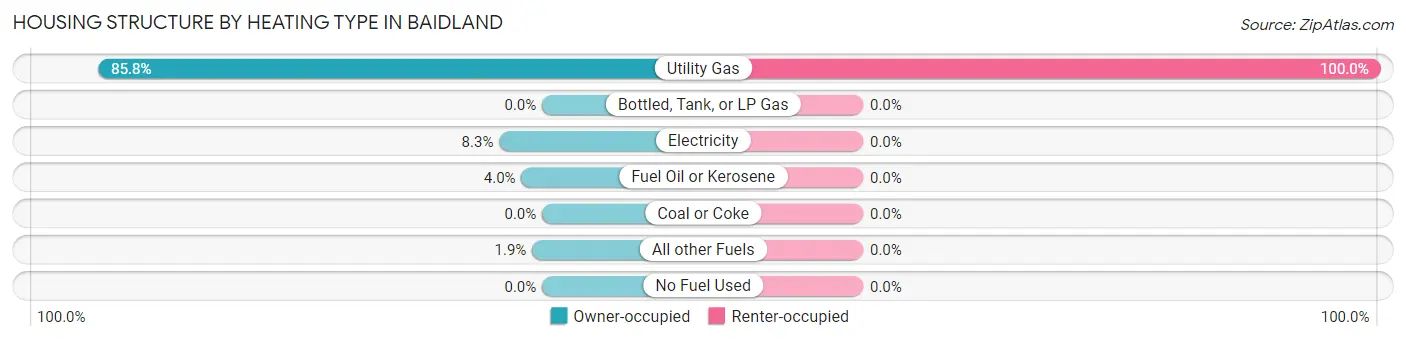
| Heating Type | Owner-occupied | Renter-occupied |
| Utility Gas | 580 (85.8%) | 71 (100.0%) |
| Bottled, Tank, or LP Gas | 0 (0.0%) | 0 (0.0%) |
| Electricity | 56 (8.3%) | 0 (0.0%) |
| Fuel Oil or Kerosene | 27 (4.0%) | 0 (0.0%) |
| Coal or Coke | 0 (0.0%) | 0 (0.0%) |
| All other Fuels | 13 (1.9%) | 0 (0.0%) |
| No Fuel Used | 0 (0.0%) | 0 (0.0%) |
| Total | 676 (100.0%) | 71 (100.0%) |
Household Vehicle Usage in Baidland
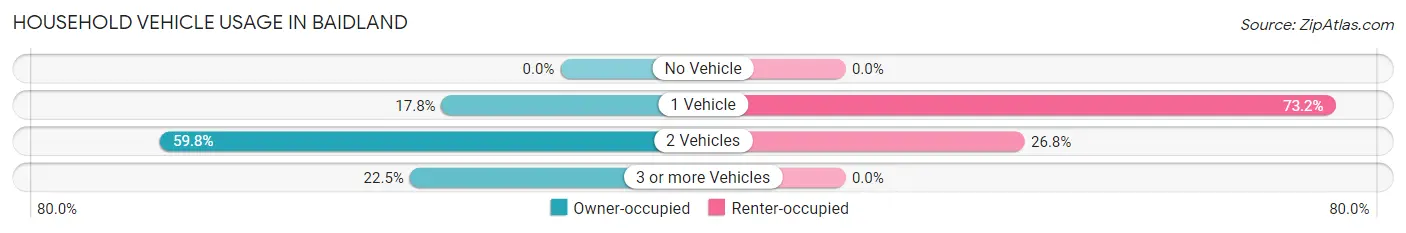
| Vehicles per Household | Owner-occupied | Renter-occupied |
| No Vehicle | 0 (0.0%) | 0 (0.0%) |
| 1 Vehicle | 120 (17.7%) | 52 (73.2%) |
| 2 Vehicles | 404 (59.8%) | 19 (26.8%) |
| 3 or more Vehicles | 152 (22.5%) | 0 (0.0%) |
| Total | 676 (100.0%) | 71 (100.0%) |
Real Estate & Mortgages in Baidland
Real Estate and Mortgage Overview in Baidland
| Characteristic | Without Mortgage | With Mortgage |
| Housing Units | 187 | 489 |
| Median Property Value | $184,900 | $171,100 |
| Median Household Income | $41,042 | $200 |
| Monthly Housing Costs | $415 | $0 |
| Real Estate Taxes | $1,895 | $0 |
Property Value by Mortgage Status in Baidland
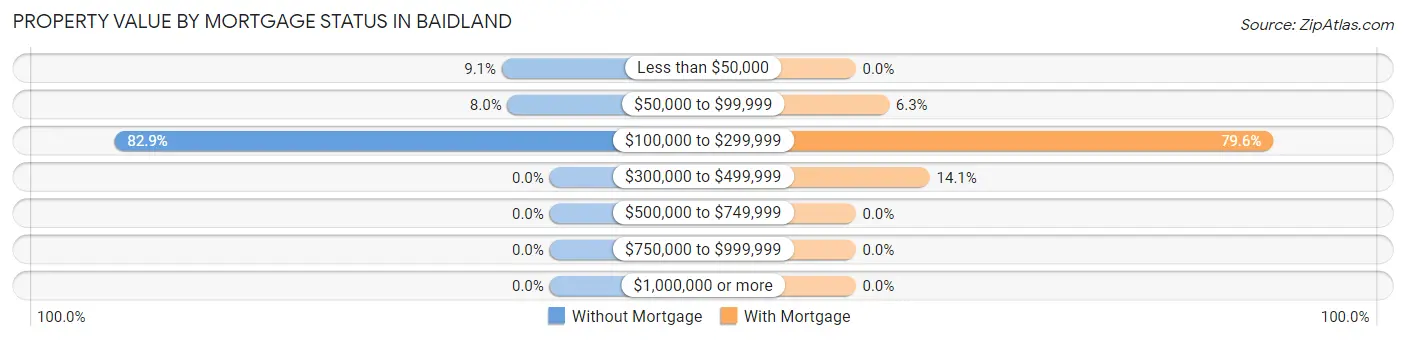
| Property Value | Without Mortgage | With Mortgage |
| Less than $50,000 | 17 (9.1%) | 0 (0.0%) |
| $50,000 to $99,999 | 15 (8.0%) | 31 (6.3%) |
| $100,000 to $299,999 | 155 (82.9%) | 389 (79.5%) |
| $300,000 to $499,999 | 0 (0.0%) | 69 (14.1%) |
| $500,000 to $749,999 | 0 (0.0%) | 0 (0.0%) |
| $750,000 to $999,999 | 0 (0.0%) | 0 (0.0%) |
| $1,000,000 or more | 0 (0.0%) | 0 (0.0%) |
| Total | 187 (100.0%) | 489 (100.0%) |
Household Income by Mortgage Status in Baidland
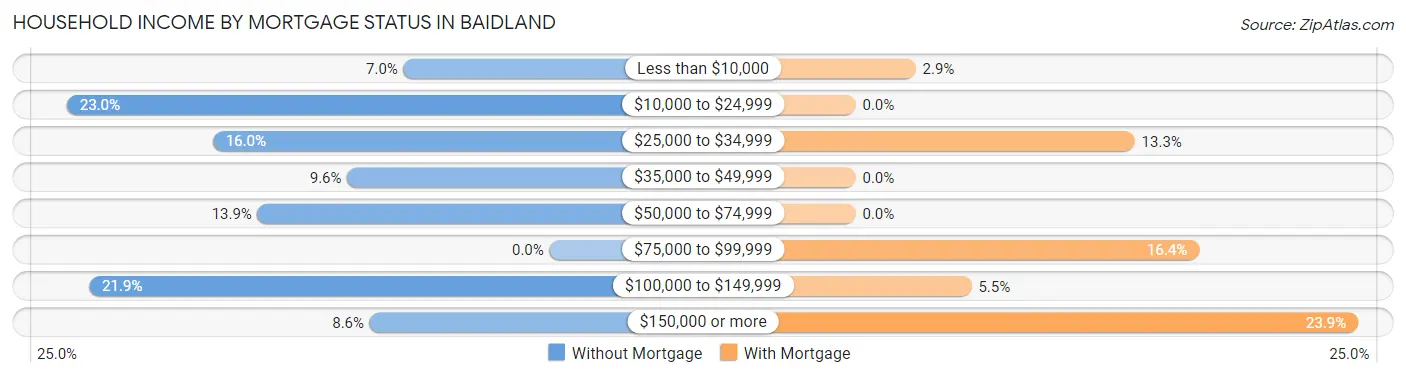
| Household Income | Without Mortgage | With Mortgage |
| Less than $10,000 | 13 (7.0%) | 14 (2.9%) |
| $10,000 to $24,999 | 43 (23.0%) | 0 (0.0%) |
| $25,000 to $34,999 | 30 (16.0%) | 65 (13.3%) |
| $35,000 to $49,999 | 18 (9.6%) | 0 (0.0%) |
| $50,000 to $74,999 | 26 (13.9%) | 0 (0.0%) |
| $75,000 to $99,999 | 0 (0.0%) | 80 (16.4%) |
| $100,000 to $149,999 | 41 (21.9%) | 27 (5.5%) |
| $150,000 or more | 16 (8.6%) | 117 (23.9%) |
| Total | 187 (100.0%) | 489 (100.0%) |
Property Value to Household Income Ratio in Baidland
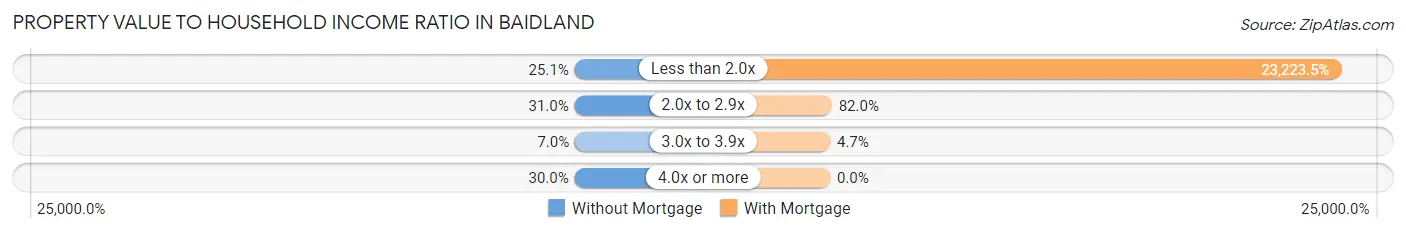
| Value-to-Income Ratio | Without Mortgage | With Mortgage |
| Less than 2.0x | 47 (25.1%) | 113,563 (23,223.5%) |
| 2.0x to 2.9x | 58 (31.0%) | 401 (82.0%) |
| 3.0x to 3.9x | 13 (7.0%) | 23 (4.7%) |
| 4.0x or more | 56 (29.9%) | 0 (0.0%) |
| Total | 187 (100.0%) | 489 (100.0%) |
Real Estate Taxes by Mortgage Status in Baidland
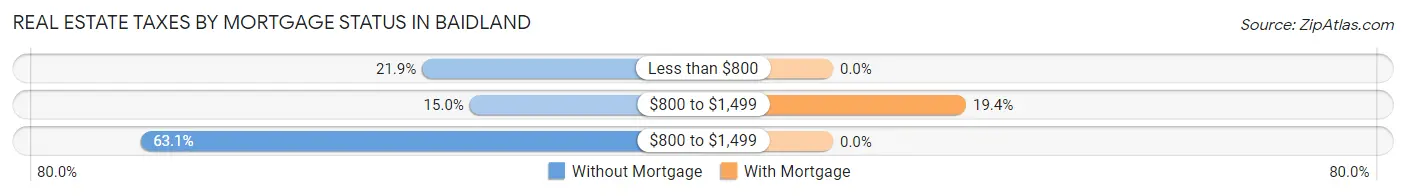
| Property Taxes | Without Mortgage | With Mortgage |
| Less than $800 | 41 (21.9%) | 0 (0.0%) |
| $800 to $1,499 | 28 (15.0%) | 95 (19.4%) |
| $800 to $1,499 | 118 (63.1%) | 0 (0.0%) |
| Total | 187 (100.0%) | 489 (100.0%) |
Health & Disability in Baidland
Health Insurance Coverage by Age in Baidland
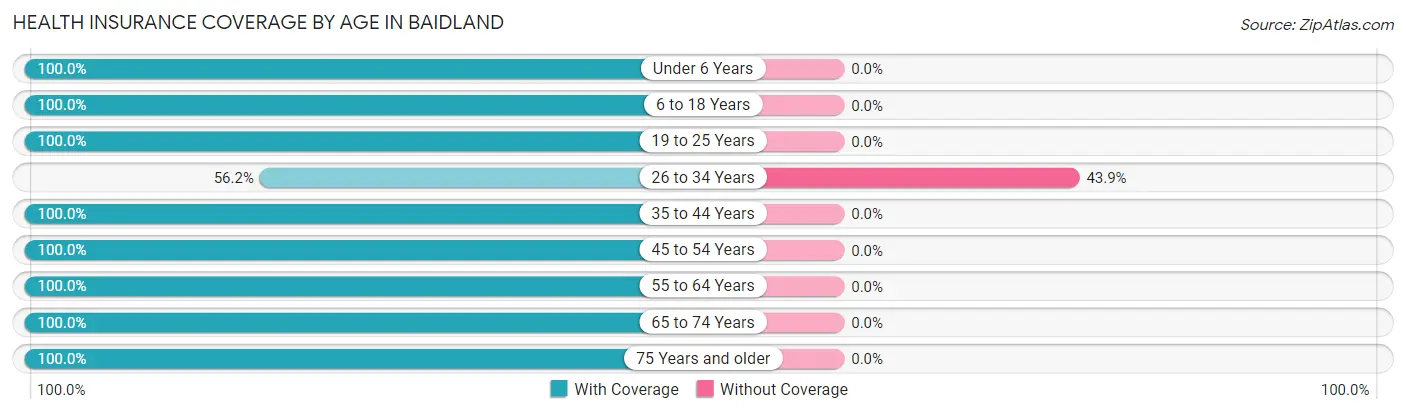
| Age Bracket | With Coverage | Without Coverage |
| Under 6 Years | 99 (100.0%) | 0 (0.0%) |
| 6 to 18 Years | 202 (100.0%) | 0 (0.0%) |
| 19 to 25 Years | 73 (100.0%) | 0 (0.0%) |
| 26 to 34 Years | 137 (56.1%) | 107 (43.9%) |
| 35 to 44 Years | 310 (100.0%) | 0 (0.0%) |
| 45 to 54 Years | 186 (100.0%) | 0 (0.0%) |
| 55 to 64 Years | 284 (100.0%) | 0 (0.0%) |
| 65 to 74 Years | 221 (100.0%) | 0 (0.0%) |
| 75 Years and older | 123 (100.0%) | 0 (0.0%) |
| Total | 1,635 (93.9%) | 107 (6.1%) |
Health Insurance Coverage by Citizenship Status in Baidland
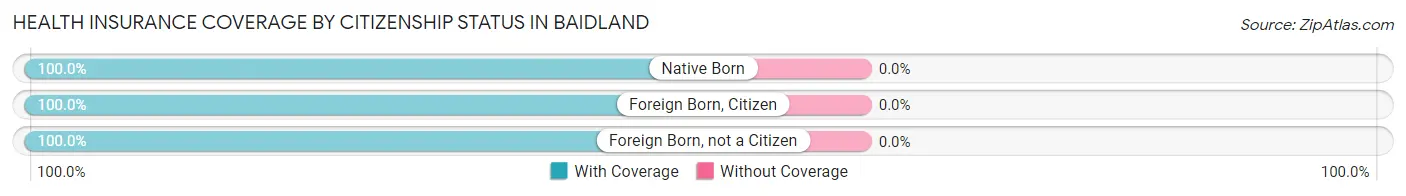
| Citizenship Status | With Coverage | Without Coverage |
| Native Born | 99 (100.0%) | 0 (0.0%) |
| Foreign Born, Citizen | 202 (100.0%) | 0 (0.0%) |
| Foreign Born, not a Citizen | 73 (100.0%) | 0 (0.0%) |
Health Insurance Coverage by Household Income in Baidland
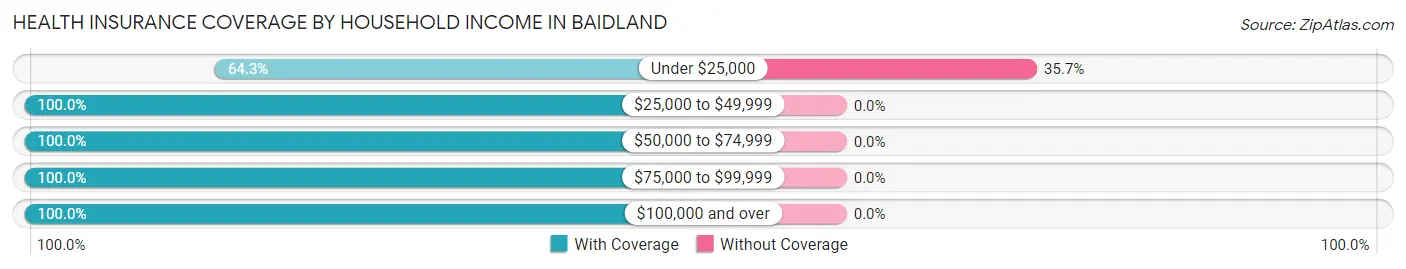
| Household Income | With Coverage | Without Coverage |
| Under $25,000 | 193 (64.3%) | 107 (35.7%) |
| $25,000 to $49,999 | 98 (100.0%) | 0 (0.0%) |
| $50,000 to $74,999 | 246 (100.0%) | 0 (0.0%) |
| $75,000 to $99,999 | 108 (100.0%) | 0 (0.0%) |
| $100,000 and over | 982 (100.0%) | 0 (0.0%) |
Public vs Private Health Insurance Coverage by Age in Baidland
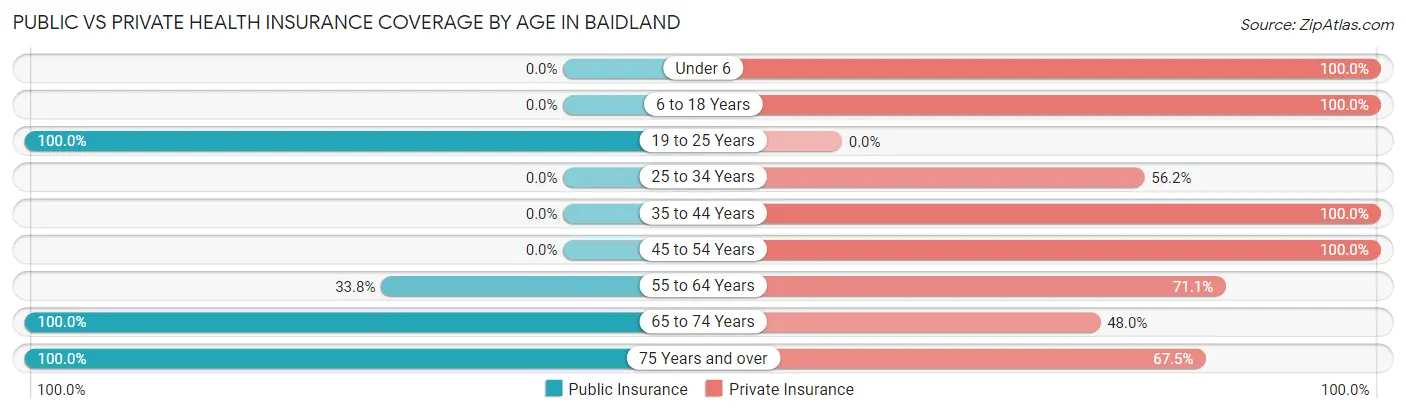
| Age Bracket | Public Insurance | Private Insurance |
| Under 6 | 0 (0.0%) | 99 (100.0%) |
| 6 to 18 Years | 0 (0.0%) | 202 (100.0%) |
| 19 to 25 Years | 73 (100.0%) | 0 (0.0%) |
| 25 to 34 Years | 0 (0.0%) | 137 (56.1%) |
| 35 to 44 Years | 0 (0.0%) | 310 (100.0%) |
| 45 to 54 Years | 0 (0.0%) | 186 (100.0%) |
| 55 to 64 Years | 96 (33.8%) | 202 (71.1%) |
| 65 to 74 Years | 221 (100.0%) | 106 (48.0%) |
| 75 Years and over | 123 (100.0%) | 83 (67.5%) |
| Total | 513 (29.4%) | 1,325 (76.1%) |
Disability Status by Sex by Age in Baidland
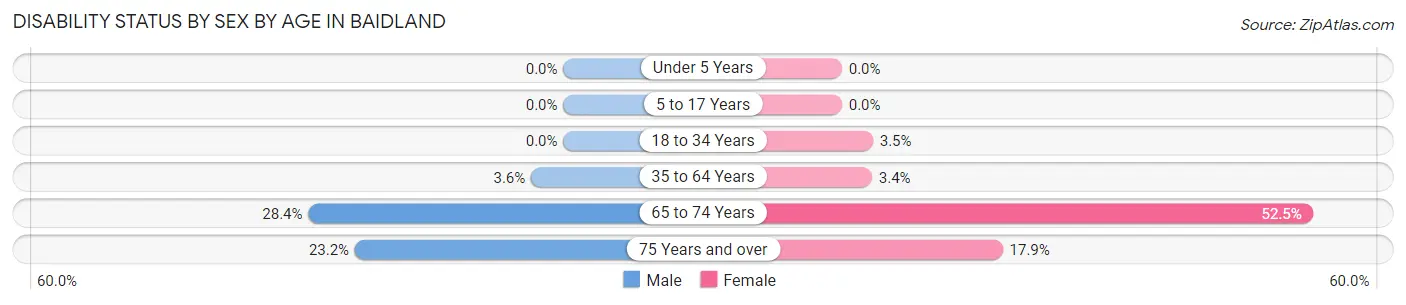
| Age Bracket | Male | Female |
| Under 5 Years | 0 (0.0%) | 0 (0.0%) |
| 5 to 17 Years | 0 (0.0%) | 0 (0.0%) |
| 18 to 34 Years | 0 (0.0%) | 4 (3.5%) |
| 35 to 64 Years | 13 (3.6%) | 14 (3.4%) |
| 65 to 74 Years | 46 (28.4%) | 31 (52.5%) |
| 75 Years and over | 13 (23.2%) | 12 (17.9%) |
Disability Class by Sex by Age in Baidland
Disability Class: Hearing Difficulty
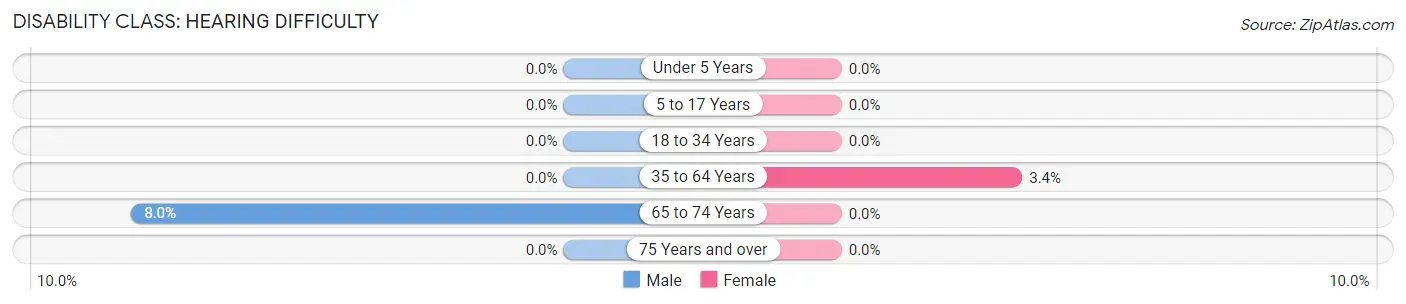
| Age Bracket | Male | Female |
| Under 5 Years | 0 (0.0%) | 0 (0.0%) |
| 5 to 17 Years | 0 (0.0%) | 0 (0.0%) |
| 18 to 34 Years | 0 (0.0%) | 0 (0.0%) |
| 35 to 64 Years | 0 (0.0%) | 14 (3.4%) |
| 65 to 74 Years | 13 (8.0%) | 0 (0.0%) |
| 75 Years and over | 0 (0.0%) | 0 (0.0%) |
Disability Class: Vision Difficulty
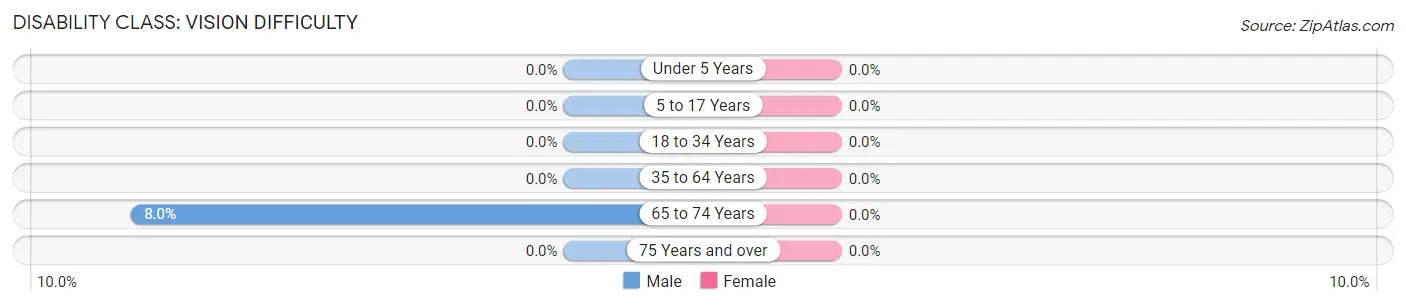
| Age Bracket | Male | Female |
| Under 5 Years | 0 (0.0%) | 0 (0.0%) |
| 5 to 17 Years | 0 (0.0%) | 0 (0.0%) |
| 18 to 34 Years | 0 (0.0%) | 0 (0.0%) |
| 35 to 64 Years | 0 (0.0%) | 0 (0.0%) |
| 65 to 74 Years | 13 (8.0%) | 0 (0.0%) |
| 75 Years and over | 0 (0.0%) | 0 (0.0%) |
Disability Class: Cognitive Difficulty
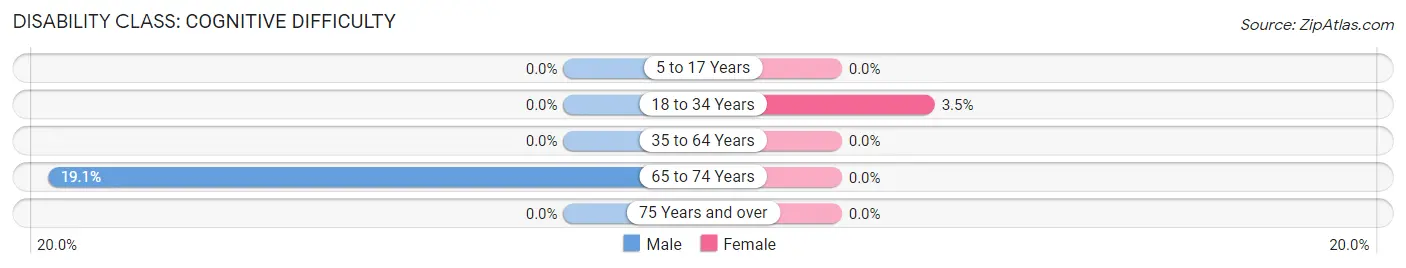
| Age Bracket | Male | Female |
| 5 to 17 Years | 0 (0.0%) | 0 (0.0%) |
| 18 to 34 Years | 0 (0.0%) | 4 (3.5%) |
| 35 to 64 Years | 0 (0.0%) | 0 (0.0%) |
| 65 to 74 Years | 31 (19.1%) | 0 (0.0%) |
| 75 Years and over | 0 (0.0%) | 0 (0.0%) |
Disability Class: Ambulatory Difficulty
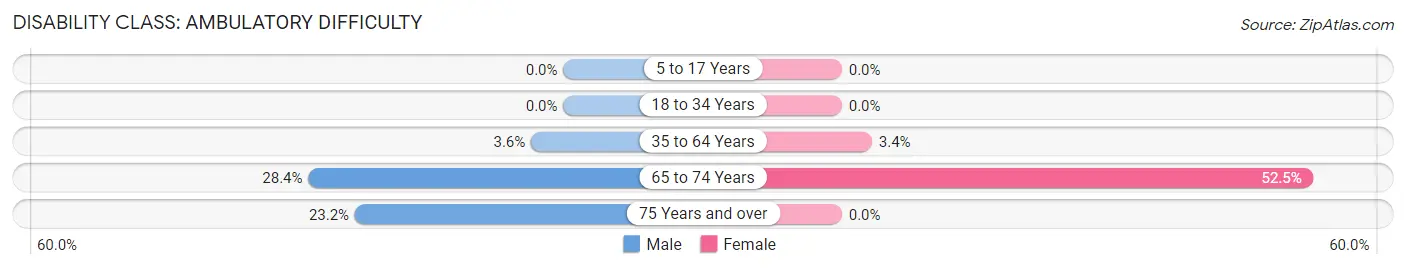
| Age Bracket | Male | Female |
| 5 to 17 Years | 0 (0.0%) | 0 (0.0%) |
| 18 to 34 Years | 0 (0.0%) | 0 (0.0%) |
| 35 to 64 Years | 13 (3.6%) | 14 (3.4%) |
| 65 to 74 Years | 46 (28.4%) | 31 (52.5%) |
| 75 Years and over | 13 (23.2%) | 0 (0.0%) |
Disability Class: Self-Care Difficulty
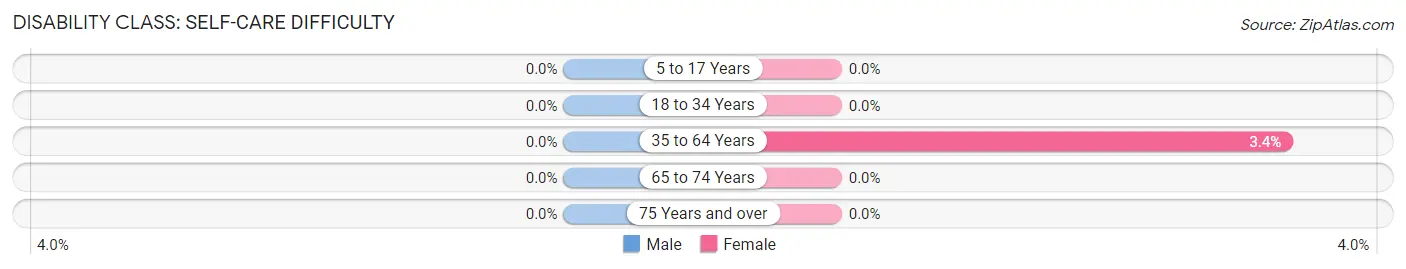
| Age Bracket | Male | Female |
| 5 to 17 Years | 0 (0.0%) | 0 (0.0%) |
| 18 to 34 Years | 0 (0.0%) | 0 (0.0%) |
| 35 to 64 Years | 0 (0.0%) | 14 (3.4%) |
| 65 to 74 Years | 0 (0.0%) | 0 (0.0%) |
| 75 Years and over | 0 (0.0%) | 0 (0.0%) |
Technology Access in Baidland
Computing Device Access in Baidland
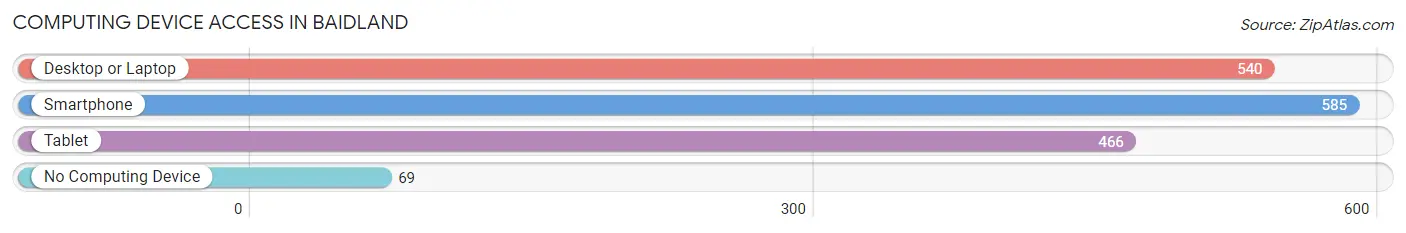
| Device Type | # Households | % Households |
| Desktop or Laptop | 540 | 72.3% |
| Smartphone | 585 | 78.3% |
| Tablet | 466 | 62.4% |
| No Computing Device | 69 | 9.2% |
| Total | 747 | 100.0% |
Internet Access in Baidland
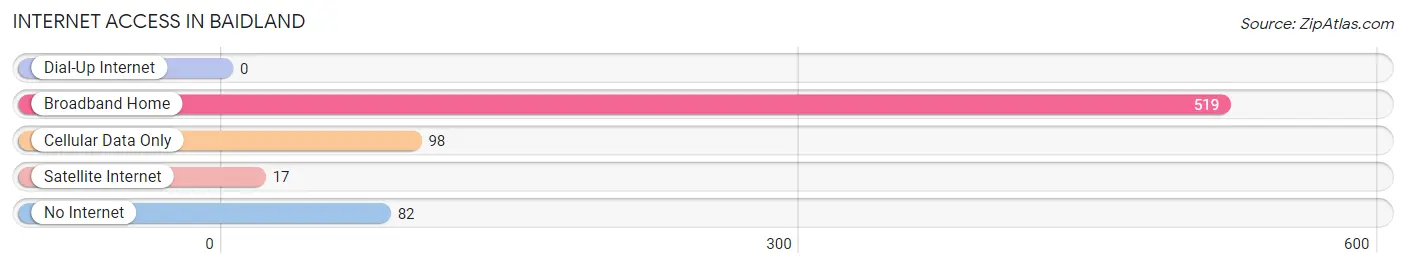
| Internet Type | # Households | % Households |
| Dial-Up Internet | 0 | 0.0% |
| Broadband Home | 519 | 69.5% |
| Cellular Data Only | 98 | 13.1% |
| Satellite Internet | 17 | 2.3% |
| No Internet | 82 | 11.0% |
| Total | 747 | 100.0% |
Baidland Summary
Baidland, Pennsylvania is a small borough located in Allegheny County, Pennsylvania. It is situated in the western part of the state, approximately 10 miles north of Pittsburgh. The borough is home to a population of approximately 1,500 people, and is part of the Pittsburgh Metropolitan Statistical Area.
History
Baidland was founded in 1876 by John Baid, a German immigrant who had come to the United States in search of a better life. He purchased a large tract of land in the area and began to develop it into a small farming community. The town was named after him, and it quickly grew in size and population. By the early 1900s, Baidland had become a thriving community with a variety of businesses, including a general store, a blacksmith shop, and a post office.
In the early 20th century, Baidland began to experience a decline in population as many of its residents moved away to larger cities in search of better job opportunities. This trend continued until the 1950s, when the borough began to experience a resurgence in population growth. This was due in part to the construction of the Pennsylvania Turnpike, which provided easy access to Pittsburgh and other nearby cities.
Geography
Baidland is located in the western part of Allegheny County, Pennsylvania. It is situated in the Allegheny Plateau, a region of rolling hills and valleys. The borough is bordered by the boroughs of Millvale to the north, Etna to the east, and Reserve Township to the south. The borough is also bordered by the Allegheny River to the west.
The borough has a total area of 0.7 square miles, all of which is land. The terrain is mostly flat, with some rolling hills. The climate is humid continental, with hot summers and cold winters.
Economy
Baidland’s economy is largely based on small businesses and services. The borough is home to a variety of small businesses, including restaurants, retail stores, and professional services. The borough also has a number of industrial businesses, including a steel mill and a paper mill.
The borough is also home to a number of educational institutions, including a public school district and a community college. The borough is also home to a number of churches and other religious organizations.
Demographics
As of the 2010 census, Baidland had a population of 1,500 people. The racial makeup of the borough was 94.7% White, 2.7% African American, 0.3% Native American, 0.7% Asian, and 1.3% from other races. The median household income was $37,500, and the median family income was $45,000.
Baidland is a small, close-knit community with a strong sense of identity and pride. The borough is home to a variety of cultural and recreational activities, including a summer concert series, a farmers’ market, and a variety of festivals and events. The borough is also home to a number of parks and recreational facilities, including a public pool and a skate park.
Common Questions
What is Per Capita Income in Baidland?
Per Capita income in Baidland is $48,885.
What is the Median Family Income in Baidland?
Median Family Income in Baidland is $112,625.
What is the Median Household income in Baidland?
Median Household Income in Baidland is $102,520.
What is Income or Wage Gap in Baidland?
Income or Wage Gap in Baidland is 29.0%.
Women in Baidland earn 71.0 cents for every dollar earned by a man.
What is Inequality or Gini Index in Baidland?
Inequality or Gini Index in Baidland is 0.50.
What is the Total Population of Baidland?
Total Population of Baidland is 1,742.
What is the Total Male Population of Baidland?
Total Male Population of Baidland is 862.
What is the Total Female Population of Baidland?
Total Female Population of Baidland is 880.
What is the Ratio of Males per 100 Females in Baidland?
There are 97.95 Males per 100 Females in Baidland.
What is the Ratio of Females per 100 Males in Baidland?
There are 102.09 Females per 100 Males in Baidland.
What is the Median Population Age in Baidland?
Median Population Age in Baidland is 40.8 Years.
What is the Average Family Size in Baidland
Average Family Size in Baidland is 2.7 People.
What is the Average Household Size in Baidland
Average Household Size in Baidland is 2.3 People.
How Large is the Labor Force in Baidland?
There are 989 People in the Labor Forcein in Baidland.
What is the Percentage of People in the Labor Force in Baidland?
66.9% of People are in the Labor Force in Baidland.
What is the Unemployment Rate in Baidland?
Unemployment Rate in Baidland is 10.7%.