Maitland, PA Map & Demographics
Maitland Map
Maitland Overview
$33,906
PER CAPITA INCOME
$72,853
AVG FAMILY INCOME
$72,628
AVG HOUSEHOLD INCOME
16.2%
WAGE / INCOME GAP [ % ]
83.8¢/ $1
WAGE / INCOME GAP [ $ ]
0.22
INEQUALITY / GINI INDEX
303
TOTAL POPULATION
160
MALE POPULATION
143
FEMALE POPULATION
111.89
MALES / 100 FEMALES
89.38
FEMALES / 100 MALES
51.6
MEDIAN AGE
2.0
AVG FAMILY SIZE
1.9
AVG HOUSEHOLD SIZE
207
LABOR FORCE [ PEOPLE ]
68.3%
PERCENT IN LABOR FORCE
Income in Maitland
Income Overview in Maitland
Per Capita Income in Maitland is $33,906, while median incomes of families and households are $72,853 and $72,628 respectively.
| Characteristic | Number | Measure |
| Per Capita Income | 303 | $33,906 |
| Median Family Income | 149 | $72,853 |
| Mean Family Income | 149 | $65,007 |
| Median Household Income | 156 | $72,628 |
| Mean Household Income | 156 | $63,888 |
| Income Deficit | 149 | $0 |
| Wage / Income Gap (%) | 303 | 16.16% |
| Wage / Income Gap ($) | 303 | 83.84¢ per $1 |
| Gini / Inequality Index | 303 | 0.22 |
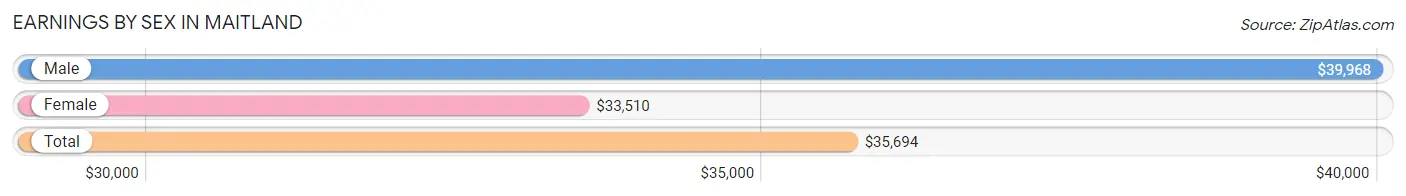
Earnings by Sex in Maitland
Average Earnings in Maitland are $35,694, $39,968 for men and $33,510 for women, a difference of 16.2%.
| Sex | Number | Average Earnings |
| Male | 91 (44.0%) | $39,968 |
| Female | 116 (56.0%) | $33,510 |
| Total | 207 (100.0%) | $35,694 |
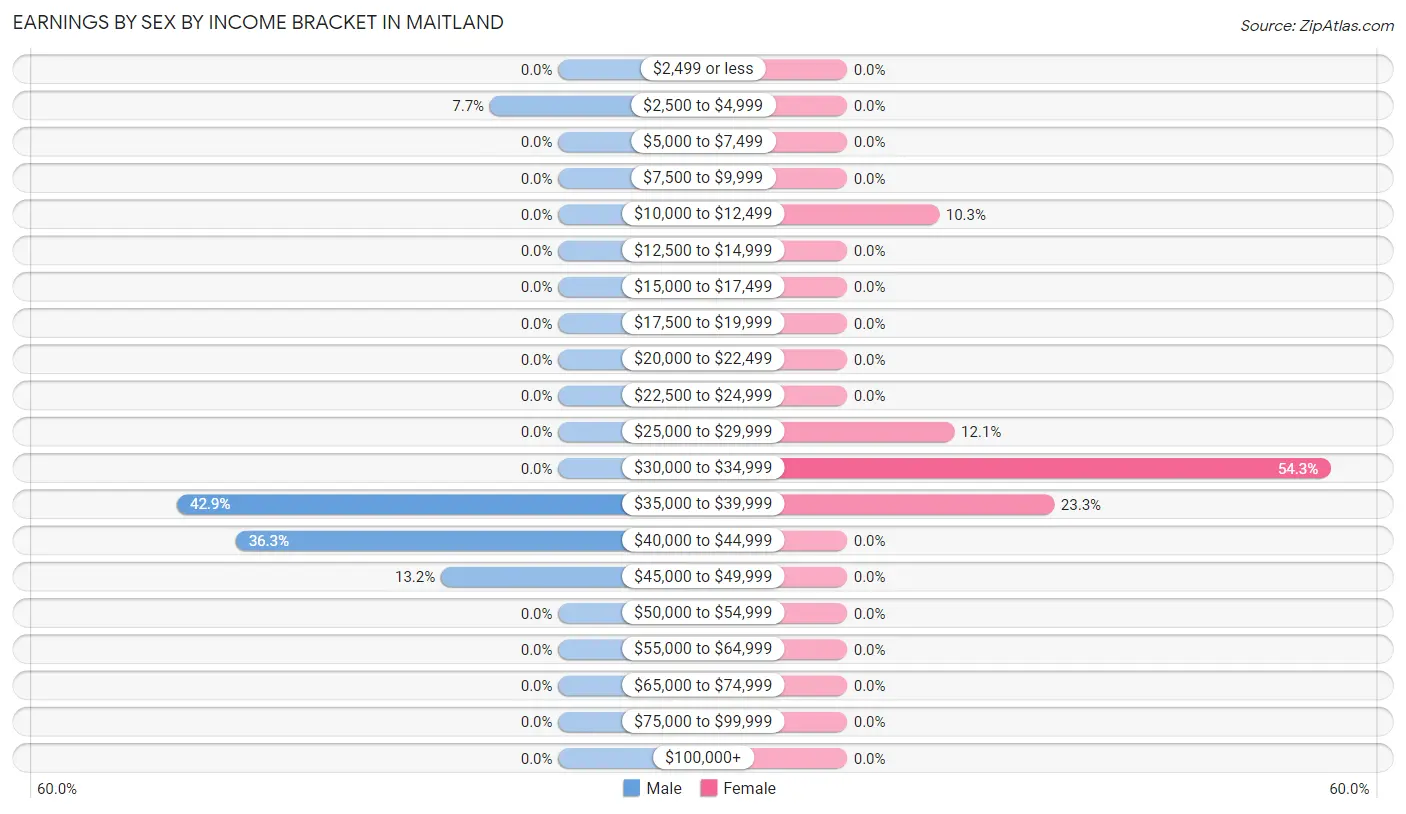
Earnings by Sex by Income Bracket in Maitland
The most common earnings brackets in Maitland are $35,000 to $39,999 for men (39 | 42.9%) and $30,000 to $34,999 for women (63 | 54.3%).
| Income | Male | Female |
| $2,499 or less | 0 (0.0%) | 0 (0.0%) |
| $2,500 to $4,999 | 7 (7.7%) | 0 (0.0%) |
| $5,000 to $7,499 | 0 (0.0%) | 0 (0.0%) |
| $7,500 to $9,999 | 0 (0.0%) | 0 (0.0%) |
| $10,000 to $12,499 | 0 (0.0%) | 12 (10.3%) |
| $12,500 to $14,999 | 0 (0.0%) | 0 (0.0%) |
| $15,000 to $17,499 | 0 (0.0%) | 0 (0.0%) |
| $17,500 to $19,999 | 0 (0.0%) | 0 (0.0%) |
| $20,000 to $22,499 | 0 (0.0%) | 0 (0.0%) |
| $22,500 to $24,999 | 0 (0.0%) | 0 (0.0%) |
| $25,000 to $29,999 | 0 (0.0%) | 14 (12.1%) |
| $30,000 to $34,999 | 0 (0.0%) | 63 (54.3%) |
| $35,000 to $39,999 | 39 (42.9%) | 27 (23.3%) |
| $40,000 to $44,999 | 33 (36.3%) | 0 (0.0%) |
| $45,000 to $49,999 | 12 (13.2%) | 0 (0.0%) |
| $50,000 to $54,999 | 0 (0.0%) | 0 (0.0%) |
| $55,000 to $64,999 | 0 (0.0%) | 0 (0.0%) |
| $65,000 to $74,999 | 0 (0.0%) | 0 (0.0%) |
| $75,000 to $99,999 | 0 (0.0%) | 0 (0.0%) |
| $100,000+ | 0 (0.0%) | 0 (0.0%) |
| Total | 91 (100.0%) | 116 (100.0%) |
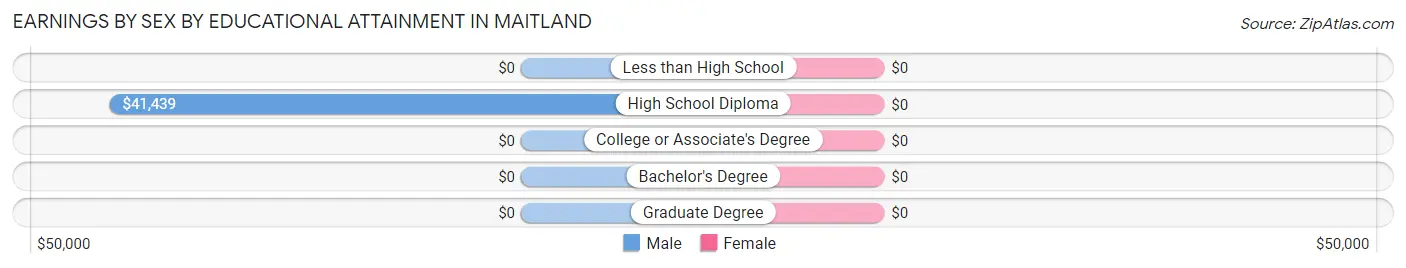
Earnings by Sex by Educational Attainment in Maitland
| Educational Attainment | Male Income | Female Income |
| Less than High School | - | - |
| High School Diploma | $41,439 | $0 |
| College or Associate's Degree | - | - |
| Bachelor's Degree | - | - |
| Graduate Degree | - | - |
| Total | $39,968 | $33,510 |
Family Income in Maitland
Family Income Brackets in Maitland
According to the Maitland family income data, there are 60 families falling into the $50,000 to $74,999 income range, which is the most common income bracket and makes up 40.3% of all families.
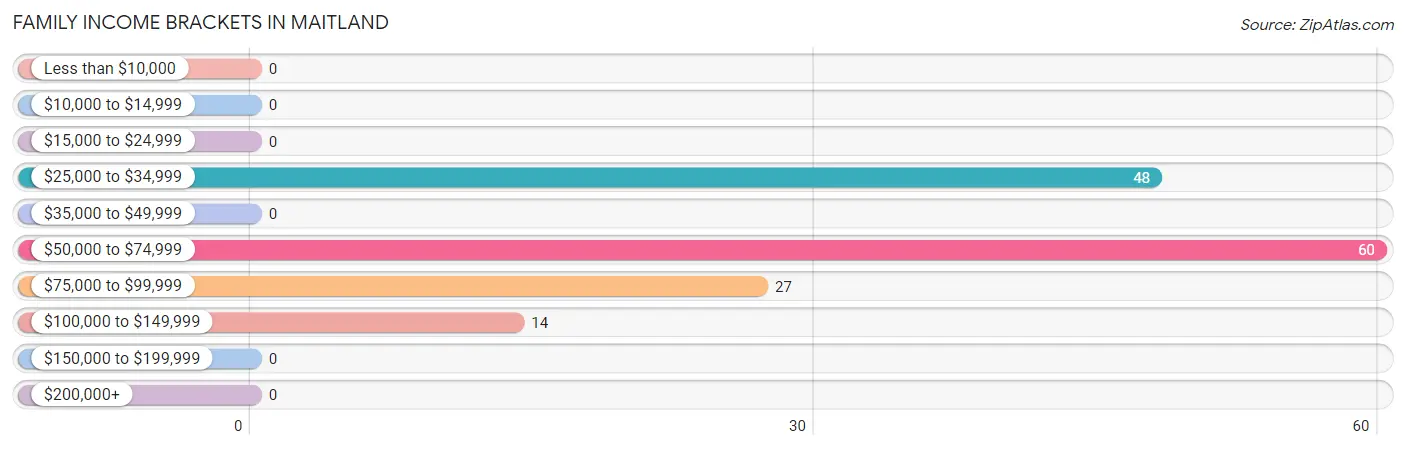
| Income Bracket | # Families | % Families |
| Less than $10,000 | 0 | 0.0% |
| $10,000 to $14,999 | 0 | 0.0% |
| $15,000 to $24,999 | 0 | 0.0% |
| $25,000 to $34,999 | 48 | 32.2% |
| $35,000 to $49,999 | 0 | 0.0% |
| $50,000 to $74,999 | 60 | 40.3% |
| $75,000 to $99,999 | 27 | 18.1% |
| $100,000 to $149,999 | 14 | 9.4% |
| $150,000 to $199,999 | 0 | 0.0% |
| $200,000+ | 0 | 0.0% |
Family Income by Famaliy Size in Maitland
2-person families (149 | 100.0%) account for the highest median family income in Maitland with $72,853 per family, while 2-person families (149 | 100.0%) have the highest median income of $36,426 per family member.
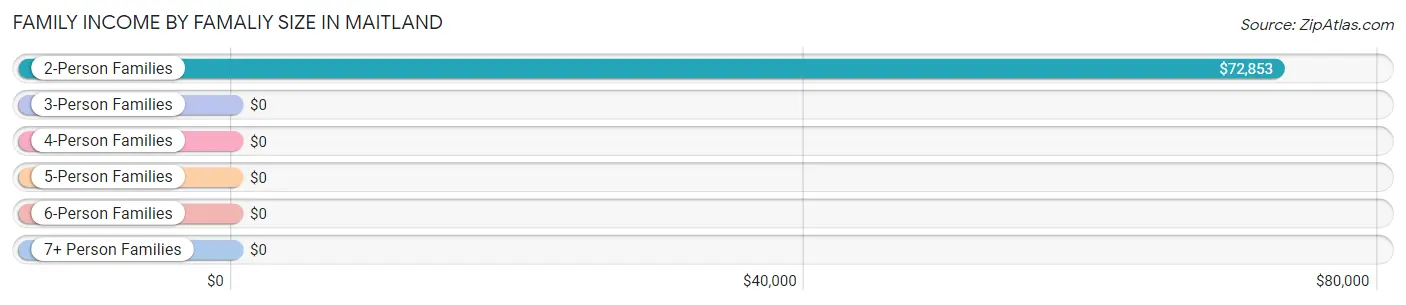
| Income Bracket | # Families | Median Income |
| 2-Person Families | 149 (100.0%) | $72,853 |
| 3-Person Families | 0 (0.0%) | $0 |
| 4-Person Families | 0 (0.0%) | $0 |
| 5-Person Families | 0 (0.0%) | $0 |
| 6-Person Families | 0 (0.0%) | $0 |
| 7+ Person Families | 0 (0.0%) | $0 |
| Total | 149 (100.0%) | $72,853 |
Family Income by Number of Earners in Maitland
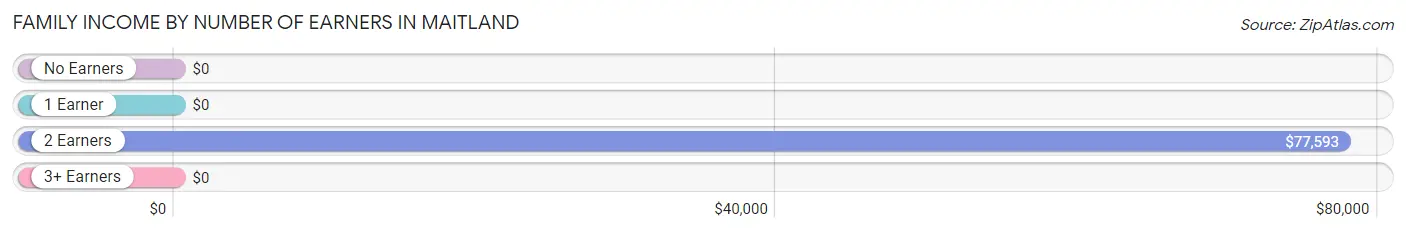
| Number of Earners | # Families | Median Income |
| No Earners | 42 (28.2%) | $0 |
| 1 Earner | 27 (18.1%) | $0 |
| 2 Earners | 80 (53.7%) | $77,593 |
| 3+ Earners | 0 (0.0%) | $0 |
| Total | 149 (100.0%) | $72,853 |
Household Income in Maitland
Household Income Brackets in Maitland
With 60 households falling in the category, the $50,000 to $74,999 income range is the most frequent in Maitland, accounting for 38.5% of all households.
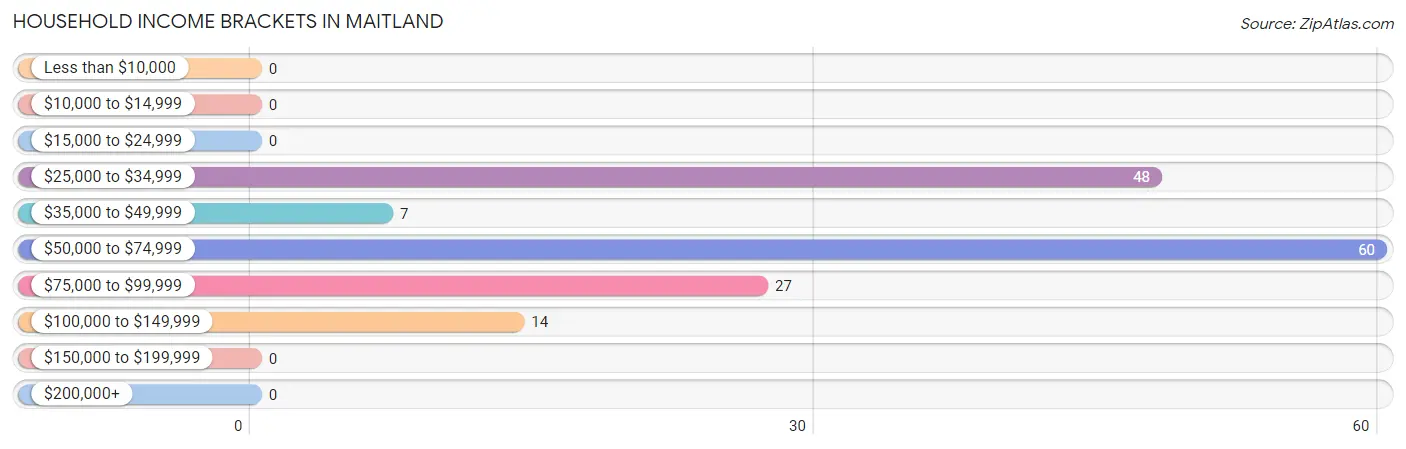
| Income Bracket | # Households | % Households |
| Less than $10,000 | 0 | 0.0% |
| $10,000 to $14,999 | 0 | 0.0% |
| $15,000 to $24,999 | 0 | 0.0% |
| $25,000 to $34,999 | 48 | 30.8% |
| $35,000 to $49,999 | 7 | 4.5% |
| $50,000 to $74,999 | 60 | 38.5% |
| $75,000 to $99,999 | 27 | 17.3% |
| $100,000 to $149,999 | 14 | 9.0% |
| $150,000 to $199,999 | 0 | 0.0% |
| $200,000+ | 0 | 0.0% |
Household Income by Householder Age in Maitland
The median household income in Maitland is $72,628, with the highest median household income of $73,974 found in the 45 to 64 years age bracket for the primary householder. A total of 114 households (73.1%) fall into this category.
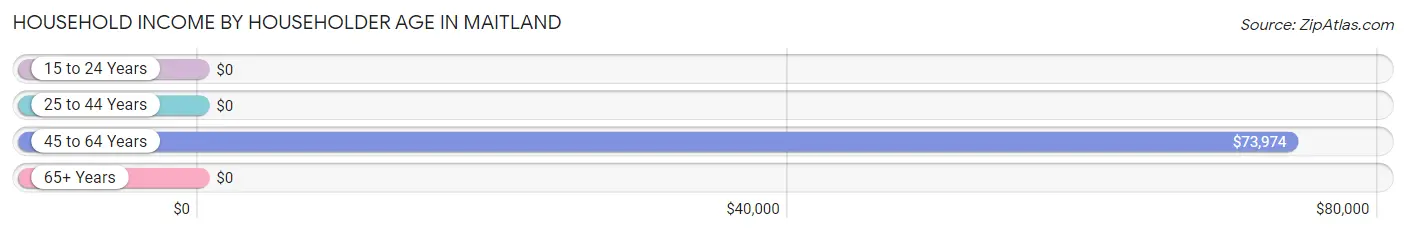
| Income Bracket | # Households | Median Income |
| 15 to 24 Years | 0 (0.0%) | $0 |
| 25 to 44 Years | 0 (0.0%) | $0 |
| 45 to 64 Years | 114 (73.1%) | $73,974 |
| 65+ Years | 42 (26.9%) | $0 |
| Total | 156 (100.0%) | $72,628 |
Poverty in Maitland
Income Below Poverty by Sex and Age in Maitland
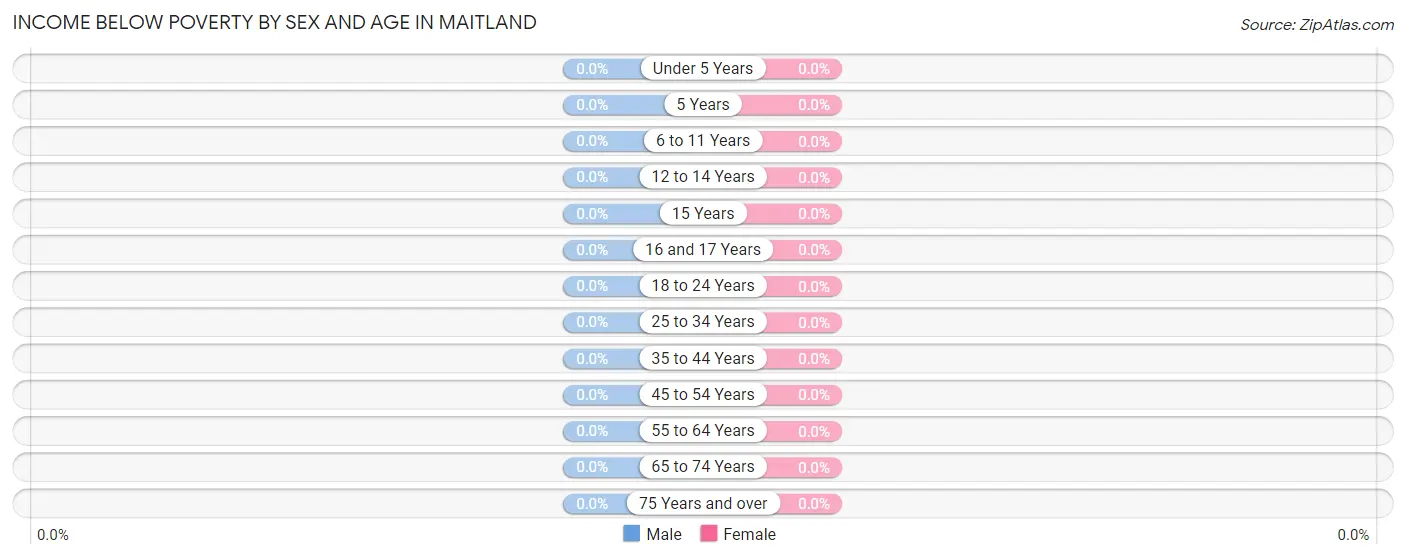
| Age Bracket | Male | Female |
| Under 5 Years | 0 (0.0%) | 0 (0.0%) |
| 5 Years | 0 (0.0%) | 0 (0.0%) |
| 6 to 11 Years | 0 (0.0%) | 0 (0.0%) |
| 12 to 14 Years | 0 (0.0%) | 0 (0.0%) |
| 15 Years | 0 (0.0%) | 0 (0.0%) |
| 16 and 17 Years | 0 (0.0%) | 0 (0.0%) |
| 18 to 24 Years | 0 (0.0%) | 0 (0.0%) |
| 25 to 34 Years | 0 (0.0%) | 0 (0.0%) |
| 35 to 44 Years | 0 (0.0%) | 0 (0.0%) |
| 45 to 54 Years | 0 (0.0%) | 0 (0.0%) |
| 55 to 64 Years | 0 (0.0%) | 0 (0.0%) |
| 65 to 74 Years | 0 (0.0%) | 0 (0.0%) |
| 75 Years and over | 0 (0.0%) | 0 (0.0%) |
| Total | 0 (0.0%) | 0 (0.0%) |
Income Above Poverty by Sex and Age in Maitland
According to the poverty statistics in Maitland, males aged 45 to 54 years and females aged 45 to 54 years are the age groups that are most secure financially, with 100.0% of males and 100.0% of females in these age groups living above the poverty line.
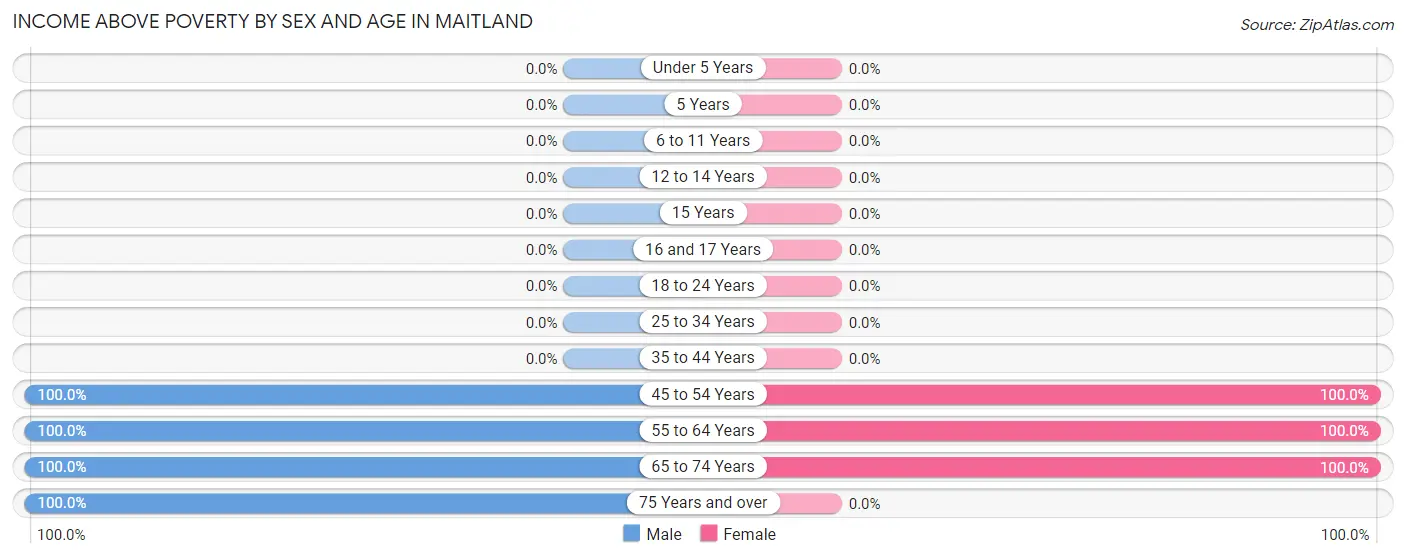
| Age Bracket | Male | Female |
| Under 5 Years | 0 (0.0%) | 0 (0.0%) |
| 5 Years | 0 (0.0%) | 0 (0.0%) |
| 6 to 11 Years | 0 (0.0%) | 0 (0.0%) |
| 12 to 14 Years | 0 (0.0%) | 0 (0.0%) |
| 15 Years | 0 (0.0%) | 0 (0.0%) |
| 16 and 17 Years | 0 (0.0%) | 0 (0.0%) |
| 18 to 24 Years | 0 (0.0%) | 0 (0.0%) |
| 25 to 34 Years | 0 (0.0%) | 0 (0.0%) |
| 35 to 44 Years | 0 (0.0%) | 0 (0.0%) |
| 45 to 54 Years | 72 (100.0%) | 105 (100.0%) |
| 55 to 64 Years | 46 (100.0%) | 11 (100.0%) |
| 65 to 74 Years | 10 (100.0%) | 27 (100.0%) |
| 75 Years and over | 32 (100.0%) | 0 (0.0%) |
| Total | 160 (100.0%) | 143 (100.0%) |
Income Below Poverty Among Married-Couple Families in Maitland
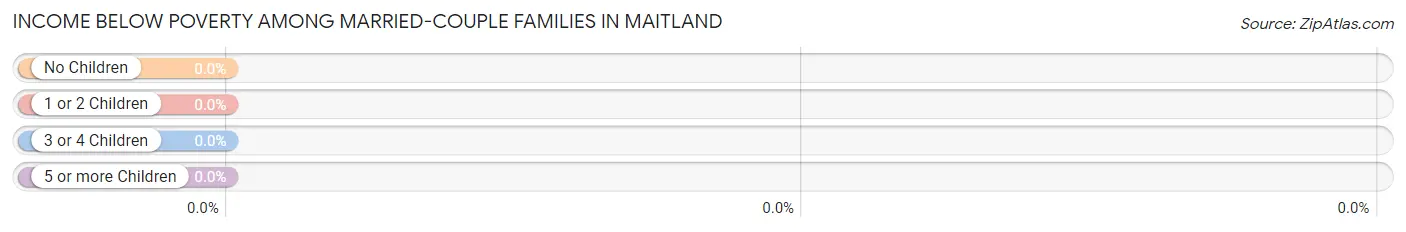
| Children | Above Poverty | Below Poverty |
| No Children | 149 (100.0%) | 0 (0.0%) |
| 1 or 2 Children | 0 (0.0%) | 0 (0.0%) |
| 3 or 4 Children | 0 (0.0%) | 0 (0.0%) |
| 5 or more Children | 0 (0.0%) | 0 (0.0%) |
| Total | 149 (100.0%) | 0 (0.0%) |
Income Below Poverty Among Single-Parent Households in Maitland
| Children | Single Father | Single Mother |
| No Children | 0 (0.0%) | 0 (0.0%) |
| 1 or 2 Children | 0 (0.0%) | 0 (0.0%) |
| 3 or 4 Children | 0 (0.0%) | 0 (0.0%) |
| 5 or more Children | 0 (0.0%) | 0 (0.0%) |
| Total | 0 (0.0%) | 0 (0.0%) |
Income Below Poverty Among Married-Couple vs Single-Parent Households in Maitland
| Children | Married-Couple Families | Single-Parent Households |
| No Children | 0 (0.0%) | 0 (0.0%) |
| 1 or 2 Children | 0 (0.0%) | 0 (0.0%) |
| 3 or 4 Children | 0 (0.0%) | 0 (0.0%) |
| 5 or more Children | 0 (0.0%) | 0 (0.0%) |
| Total | 0 (0.0%) | 0 (0.0%) |
Race in Maitland
The most populous races in Maitland are White / Caucasian (288 | 95.1%), and Asian (15 | 5.0%).
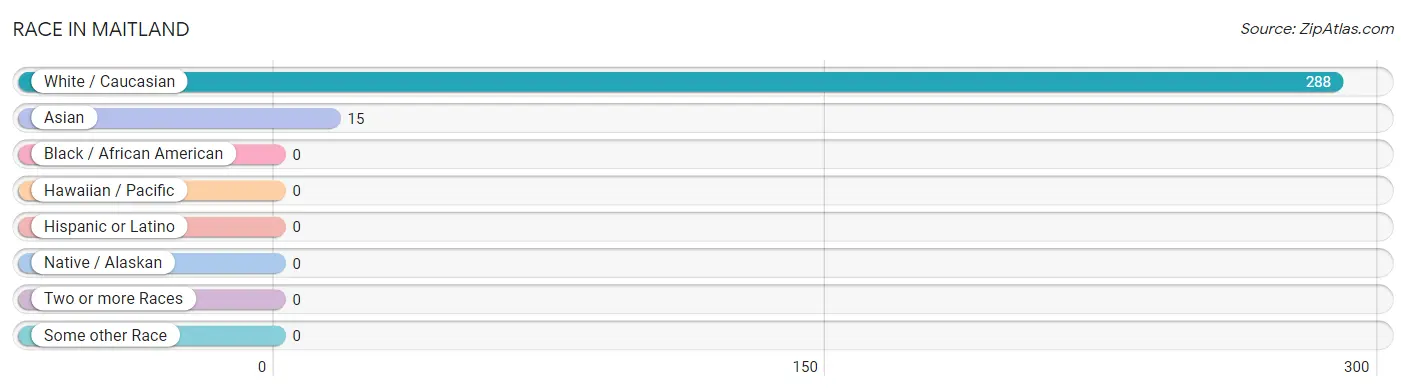
| Race | # Population | % Population |
| Asian | 15 | 5.0% |
| Black / African American | 0 | 0.0% |
| Hawaiian / Pacific | 0 | 0.0% |
| Hispanic or Latino | 0 | 0.0% |
| Native / Alaskan | 0 | 0.0% |
| White / Caucasian | 288 | 95.1% |
| Two or more Races | 0 | 0.0% |
| Some other Race | 0 | 0.0% |
| Total | 303 | 100.0% |
Ancestry in Maitland
The most populous ancestries reported in Maitland are German (221 | 72.9%), Italian (47 | 15.5%), French (32 | 10.6%), American (22 | 7.3%), and English (19 | 6.3%), together accounting for 112.5% of all Maitland residents.
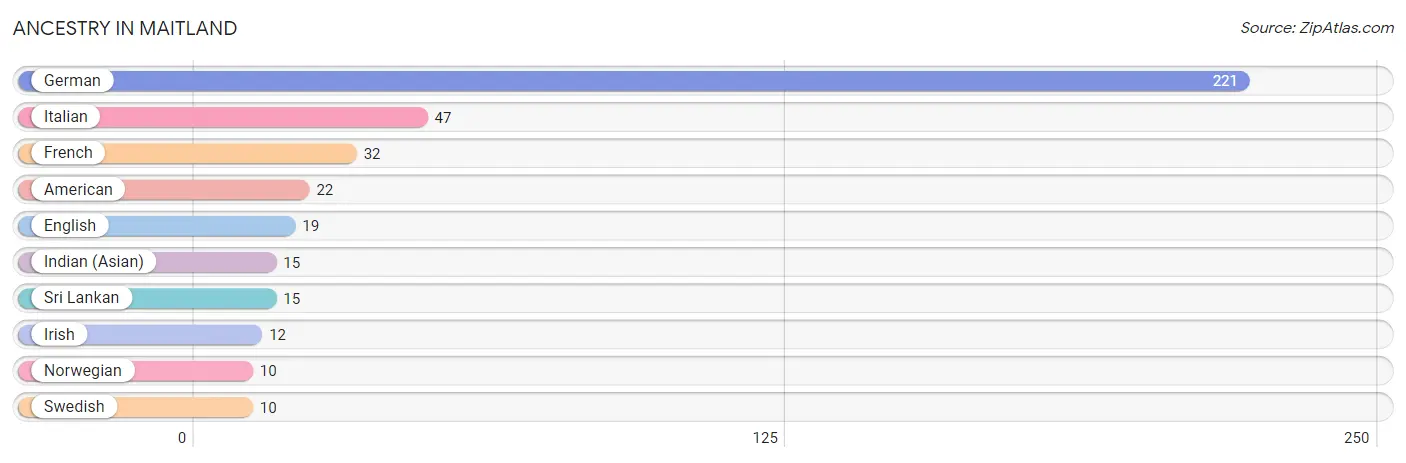
| Ancestry | # Population | % Population |
| American | 22 | 7.3% |
| English | 19 | 6.3% |
| French | 32 | 10.6% |
| German | 221 | 72.9% |
| Indian (Asian) | 15 | 5.0% |
| Irish | 12 | 4.0% |
| Italian | 47 | 15.5% |
| Norwegian | 10 | 3.3% |
| Sri Lankan | 15 | 5.0% |
| Swedish | 10 | 3.3% | View All 10 Rows |
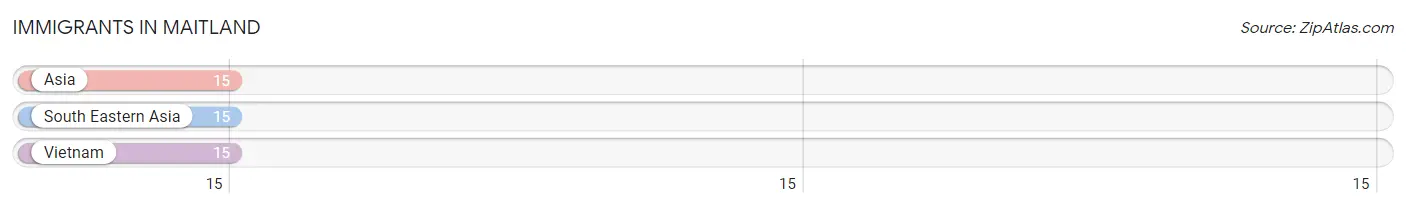
Immigrants in Maitland
The most numerous immigrant groups reported in Maitland came from Asia (15 | 5.0%), South Eastern Asia (15 | 5.0%), and Vietnam (15 | 5.0%), together accounting for 14.9% of all Maitland residents.
| Immigration Origin | # Population | % Population |
| Asia | 15 | 5.0% |
| South Eastern Asia | 15 | 5.0% |
| Vietnam | 15 | 5.0% | View All 3 Rows |
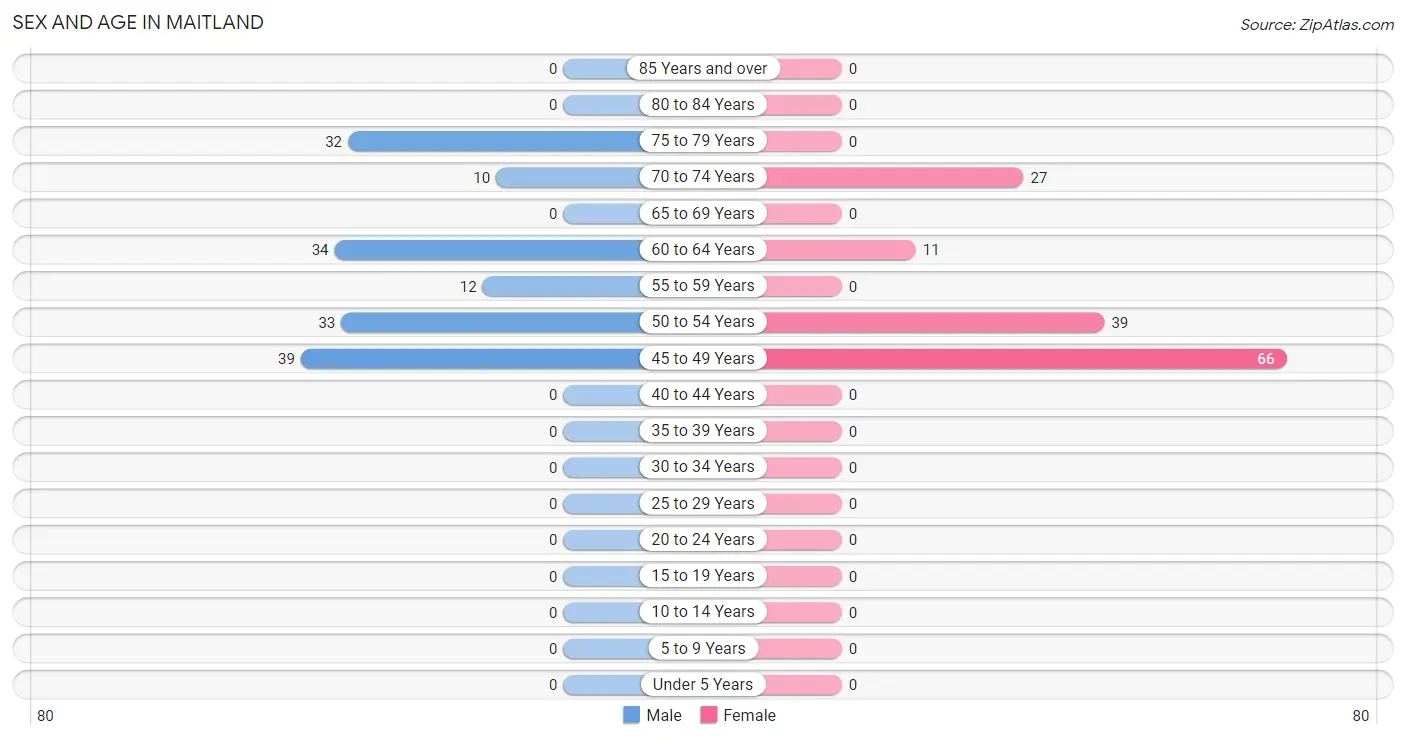
Sex and Age in Maitland
Sex and Age in Maitland
The most populous age groups in Maitland are 45 to 49 Years (39 | 24.4%) for men and 45 to 49 Years (66 | 46.2%) for women.
| Age Bracket | Male | Female |
| Under 5 Years | 0 (0.0%) | 0 (0.0%) |
| 5 to 9 Years | 0 (0.0%) | 0 (0.0%) |
| 10 to 14 Years | 0 (0.0%) | 0 (0.0%) |
| 15 to 19 Years | 0 (0.0%) | 0 (0.0%) |
| 20 to 24 Years | 0 (0.0%) | 0 (0.0%) |
| 25 to 29 Years | 0 (0.0%) | 0 (0.0%) |
| 30 to 34 Years | 0 (0.0%) | 0 (0.0%) |
| 35 to 39 Years | 0 (0.0%) | 0 (0.0%) |
| 40 to 44 Years | 0 (0.0%) | 0 (0.0%) |
| 45 to 49 Years | 39 (24.4%) | 66 (46.2%) |
| 50 to 54 Years | 33 (20.6%) | 39 (27.3%) |
| 55 to 59 Years | 12 (7.5%) | 0 (0.0%) |
| 60 to 64 Years | 34 (21.2%) | 11 (7.7%) |
| 65 to 69 Years | 0 (0.0%) | 0 (0.0%) |
| 70 to 74 Years | 10 (6.2%) | 27 (18.9%) |
| 75 to 79 Years | 32 (20.0%) | 0 (0.0%) |
| 80 to 84 Years | 0 (0.0%) | 0 (0.0%) |
| 85 Years and over | 0 (0.0%) | 0 (0.0%) |
| Total | 160 (100.0%) | 143 (100.0%) |
Families and Households in Maitland
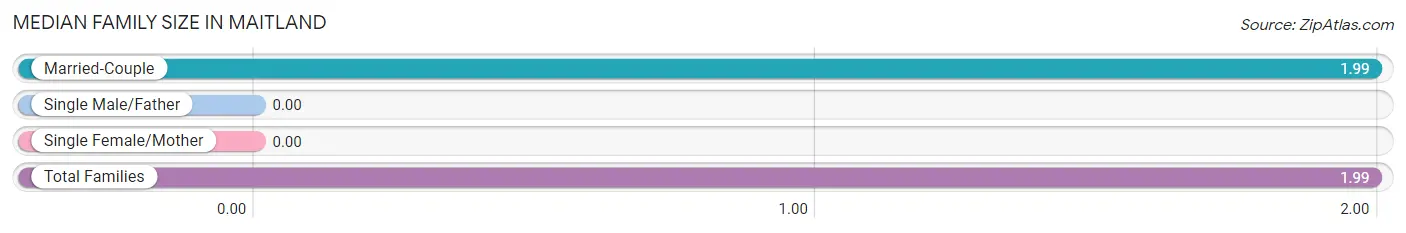
Median Family Size in Maitland
| Family Type | # Families | Family Size |
| Married-Couple | 149 (100.0%) | 1.99 |
| Single Male/Father | 0 (0.0%) | - |
| Single Female/Mother | 0 (0.0%) | - |
| Total Families | 149 (100.0%) | 1.99 |
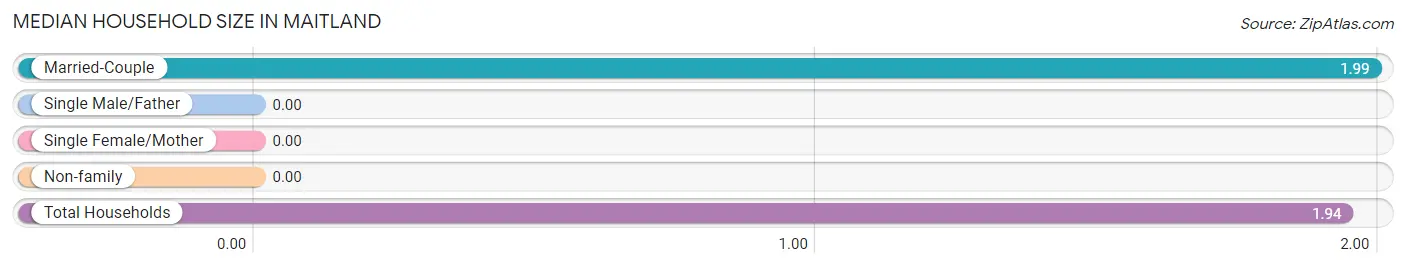
Median Household Size in Maitland
| Household Type | # Households | Household Size |
| Married-Couple | 149 (95.5%) | 1.99 |
| Single Male/Father | 0 (0.0%) | - |
| Single Female/Mother | 0 (0.0%) | - |
| Non-family | 7 (4.5%) | - |
| Total Households | 156 (100.0%) | 1.94 |
Household Size by Marriage Status in Maitland
Out of a total of 156 households in Maitland, 149 (95.5%) are family households, while 7 (4.5%) are nonfamily households. The most numerous type of family households are 2-person households, comprising 149, and the most common type of nonfamily households are 1-person households, comprising 7.
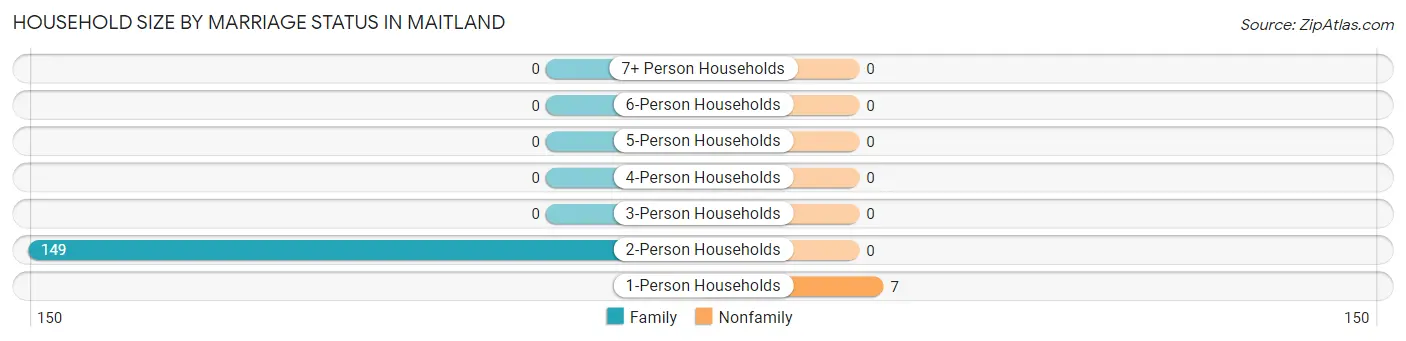
| Household Size | Family Households | Nonfamily Households |
| 1-Person Households | - | 7 (4.5%) |
| 2-Person Households | 149 (95.5%) | 0 (0.0%) |
| 3-Person Households | 0 (0.0%) | 0 (0.0%) |
| 4-Person Households | 0 (0.0%) | 0 (0.0%) |
| 5-Person Households | 0 (0.0%) | 0 (0.0%) |
| 6-Person Households | 0 (0.0%) | 0 (0.0%) |
| 7+ Person Households | 0 (0.0%) | 0 (0.0%) |
| Total | 149 (95.5%) | 7 (4.5%) |
Female Fertility in Maitland
Fertility by Age in Maitland
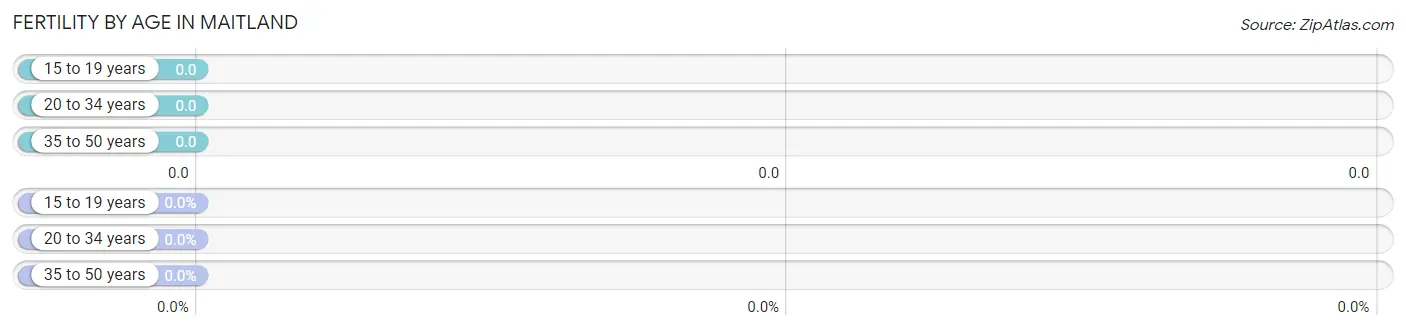
| Age Bracket | Women with Births | Births / 1,000 Women |
| 15 to 19 years | 0 (0.0%) | 0.0 |
| 20 to 34 years | 0 (0.0%) | 0.0 |
| 35 to 50 years | 0 (0.0%) | 0.0 |
| Total | 0 (0.0%) | 0.0 |
Fertility by Age by Marriage Status in Maitland
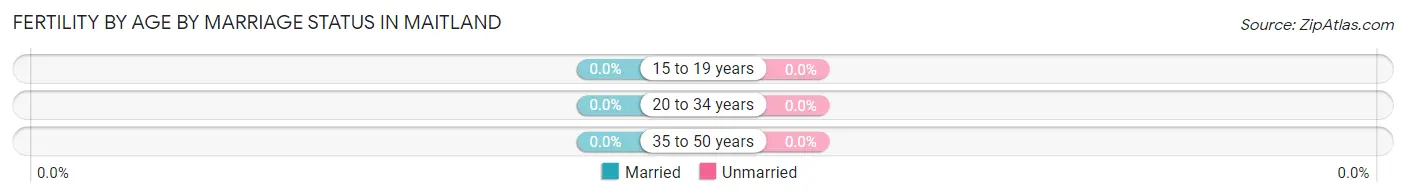
| Age Bracket | Married | Unmarried |
| 15 to 19 years | 0 (0.0%) | 0 (0.0%) |
| 20 to 34 years | 0 (0.0%) | 0 (0.0%) |
| 35 to 50 years | 0 (0.0%) | 0 (0.0%) |
| Total | 0 (0.0%) | 0 (0.0%) |
Fertility by Education in Maitland
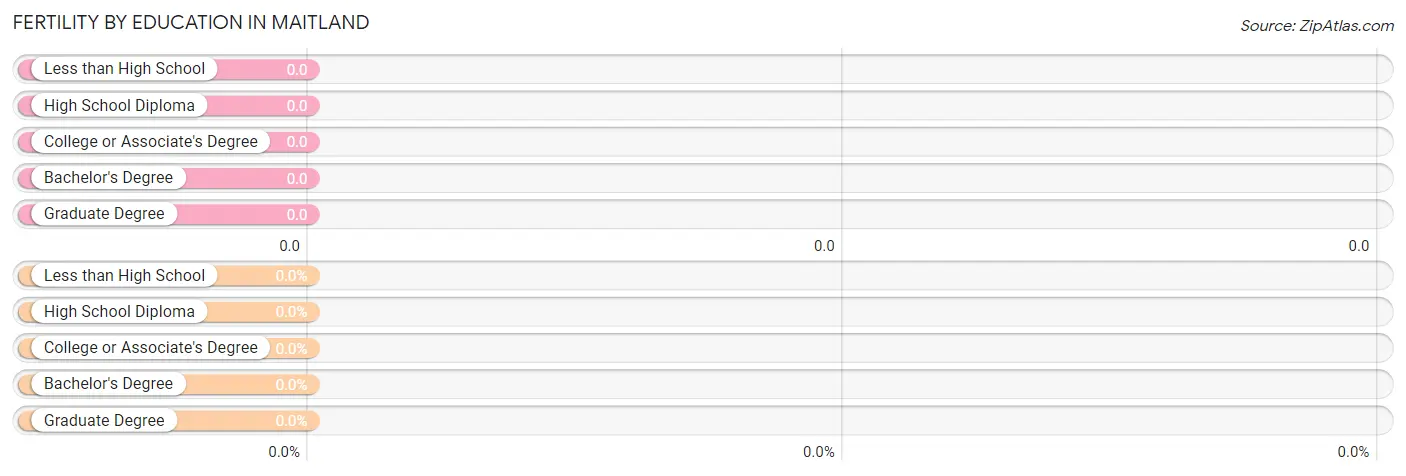
| Educational Attainment | Women with Births | Births / 1,000 Women |
| Less than High School | 0 (0.0%) | 0.0 |
| High School Diploma | 0 (0.0%) | 0.0 |
| College or Associate's Degree | 0 (0.0%) | 0.0 |
| Bachelor's Degree | 0 (0.0%) | 0.0 |
| Graduate Degree | 0 (0.0%) | 0.0 |
| Total | 0 (0.0%) | 0.0 |
Fertility by Education by Marriage Status in Maitland
| Educational Attainment | Married | Unmarried |
| Less than High School | 0 (0.0%) | 0 (0.0%) |
| High School Diploma | 0 (0.0%) | 0 (0.0%) |
| College or Associate's Degree | 0 (0.0%) | 0 (0.0%) |
| Bachelor's Degree | 0 (0.0%) | 0 (0.0%) |
| Graduate Degree | 0 (0.0%) | 0 (0.0%) |
| Total | 0 (0.0%) | 0 (0.0%) |
Employment Characteristics in Maitland
Employment by Class of Employer in Maitland
Among the 207 employed individuals in Maitland, private company employees (147 | 71.0%), self-employed (not incorporated) (33 | 15.9%), and not-for-profit organizations (27 | 13.0%) make up the most common classes of employment.
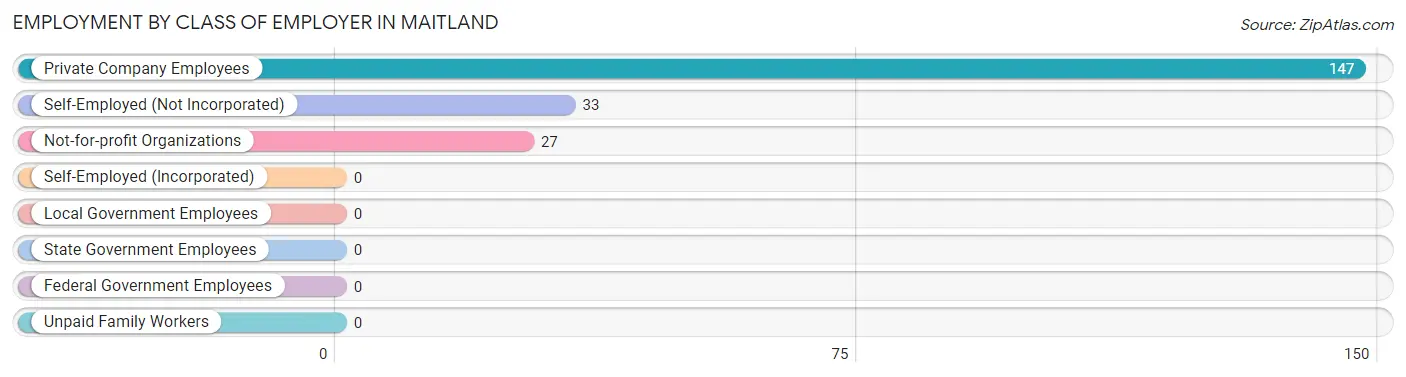
| Employer Class | # Employees | % Employees |
| Private Company Employees | 147 | 71.0% |
| Self-Employed (Incorporated) | 0 | 0.0% |
| Self-Employed (Not Incorporated) | 33 | 15.9% |
| Not-for-profit Organizations | 27 | 13.0% |
| Local Government Employees | 0 | 0.0% |
| State Government Employees | 0 | 0.0% |
| Federal Government Employees | 0 | 0.0% |
| Unpaid Family Workers | 0 | 0.0% |
| Total | 207 | 100.0% |
Employment Status by Age in Maitland
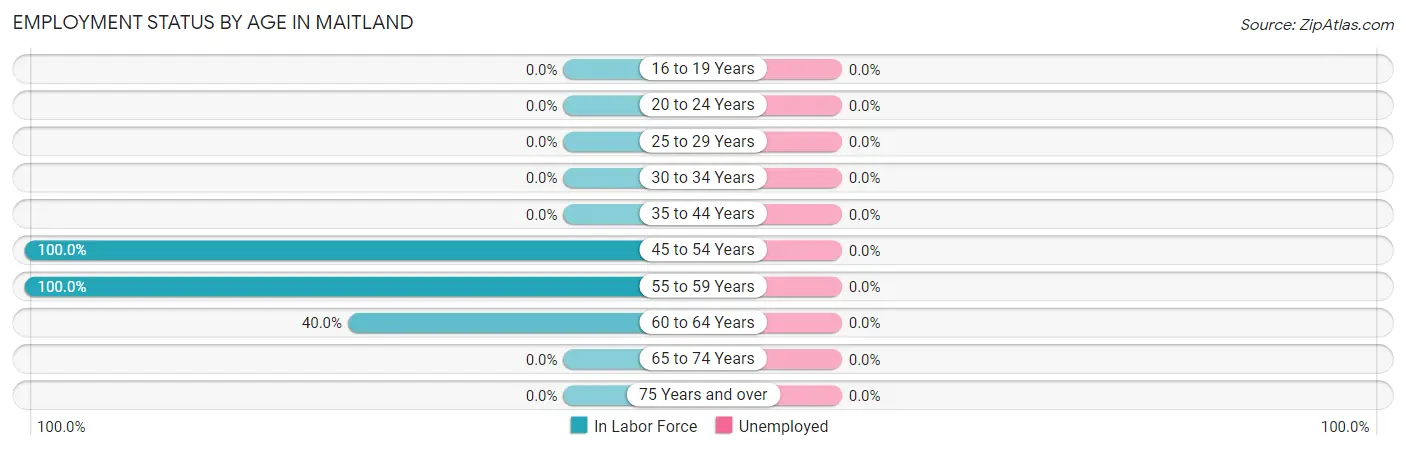
| Age Bracket | In Labor Force | Unemployed |
| 16 to 19 Years | 0 (0.0%) | 0 (0.0%) |
| 20 to 24 Years | 0 (0.0%) | 0 (0.0%) |
| 25 to 29 Years | 0 (0.0%) | 0 (0.0%) |
| 30 to 34 Years | 0 (0.0%) | 0 (0.0%) |
| 35 to 44 Years | 0 (0.0%) | 0 (0.0%) |
| 45 to 54 Years | 177 (100.0%) | 0 (0.0%) |
| 55 to 59 Years | 12 (100.0%) | 0 (0.0%) |
| 60 to 64 Years | 18 (40.0%) | 0 (0.0%) |
| 65 to 74 Years | 0 (0.0%) | 0 (0.0%) |
| 75 Years and over | 0 (0.0%) | 0 (0.0%) |
| Total | 207 (68.3%) | 0 (0.0%) |
Employment Status by Educational Attainment in Maitland
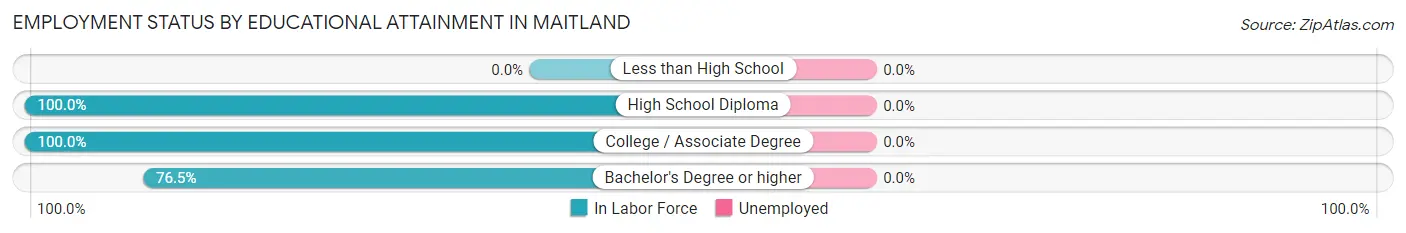
| Educational Attainment | In Labor Force | Unemployed |
| Less than High School | 0 (0.0%) | 0 (0.0%) |
| High School Diploma | 77 (100.0%) | 0 (0.0%) |
| College / Associate Degree | 78 (100.0%) | 0 (0.0%) |
| Bachelor's Degree or higher | 52 (76.5%) | 0 (0.0%) |
| Total | 207 (88.5%) | 0 (0.0%) |
Employment Occupations by Sex in Maitland
Management, Business, Science and Arts Occupations
The most common Management, Business, Science and Arts occupations in Maitland are , and Management (33 | 15.9%).
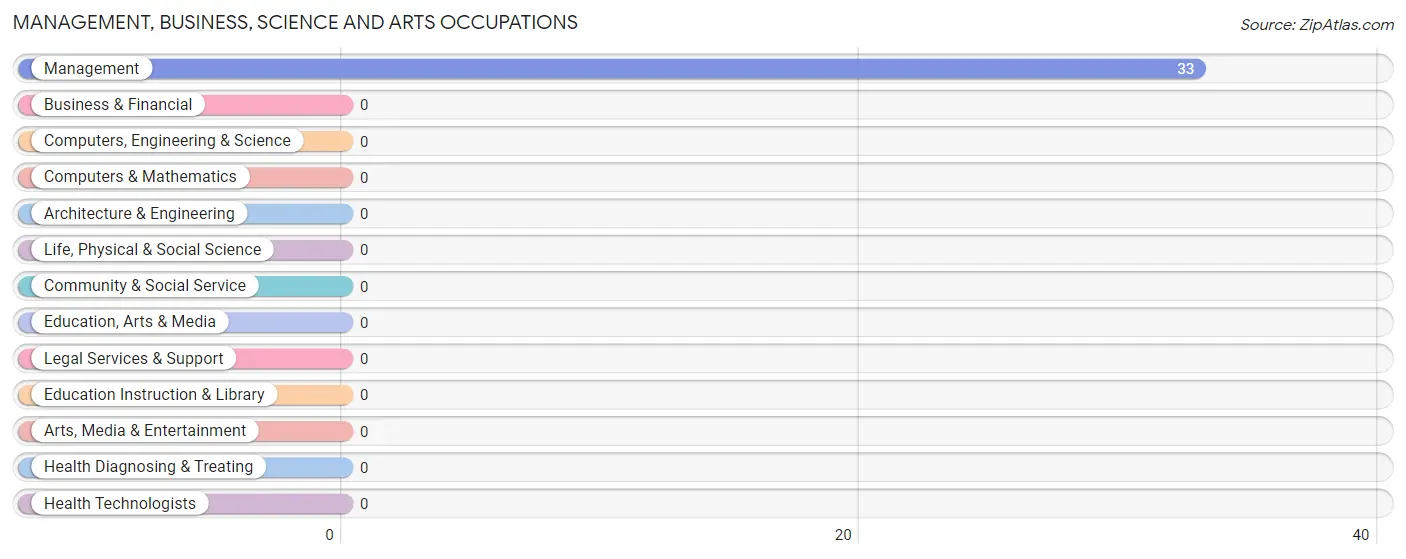
Management, Business, Science and Arts Occupations by Sex
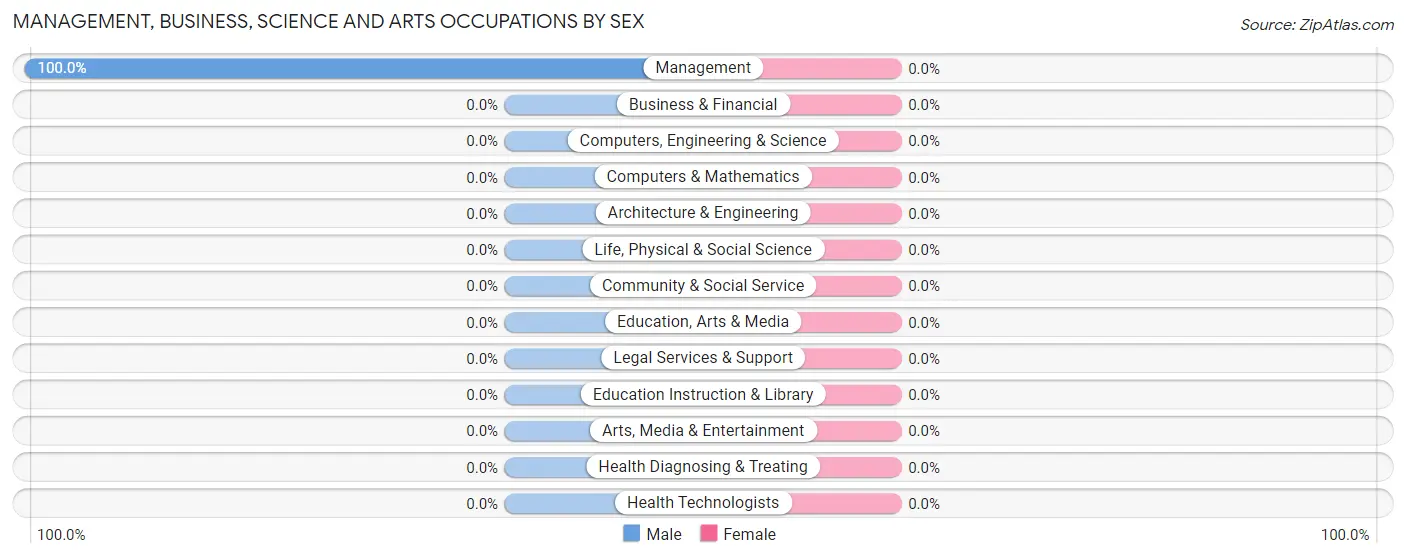
| Occupation | Male | Female |
| Management | 33 (100.0%) | 0 (0.0%) |
| Business & Financial | 0 (0.0%) | 0 (0.0%) |
| Computers, Engineering & Science | 0 (0.0%) | 0 (0.0%) |
| Computers & Mathematics | 0 (0.0%) | 0 (0.0%) |
| Architecture & Engineering | 0 (0.0%) | 0 (0.0%) |
| Life, Physical & Social Science | 0 (0.0%) | 0 (0.0%) |
| Community & Social Service | 0 (0.0%) | 0 (0.0%) |
| Education, Arts & Media | 0 (0.0%) | 0 (0.0%) |
| Legal Services & Support | 0 (0.0%) | 0 (0.0%) |
| Education Instruction & Library | 0 (0.0%) | 0 (0.0%) |
| Arts, Media & Entertainment | 0 (0.0%) | 0 (0.0%) |
| Health Diagnosing & Treating | 0 (0.0%) | 0 (0.0%) |
| Health Technologists | 0 (0.0%) | 0 (0.0%) |
| Total (Category) | 33 (100.0%) | 0 (0.0%) |
| Total (Overall) | 91 (44.0%) | 116 (56.0%) |
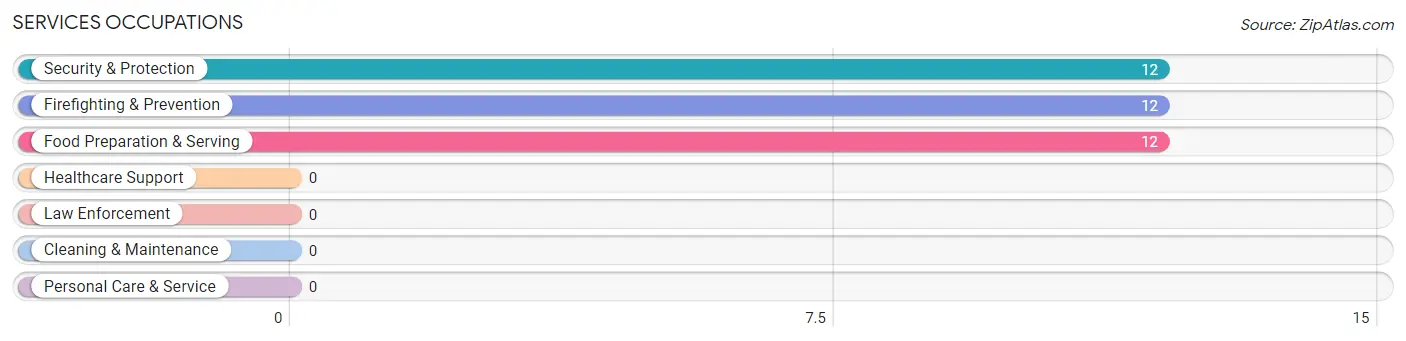
Services Occupations
The most common Services occupations in Maitland are Security & Protection (12 | 5.8%), Firefighting & Prevention (12 | 5.8%), and Food Preparation & Serving (12 | 5.8%).
Services Occupations by Sex
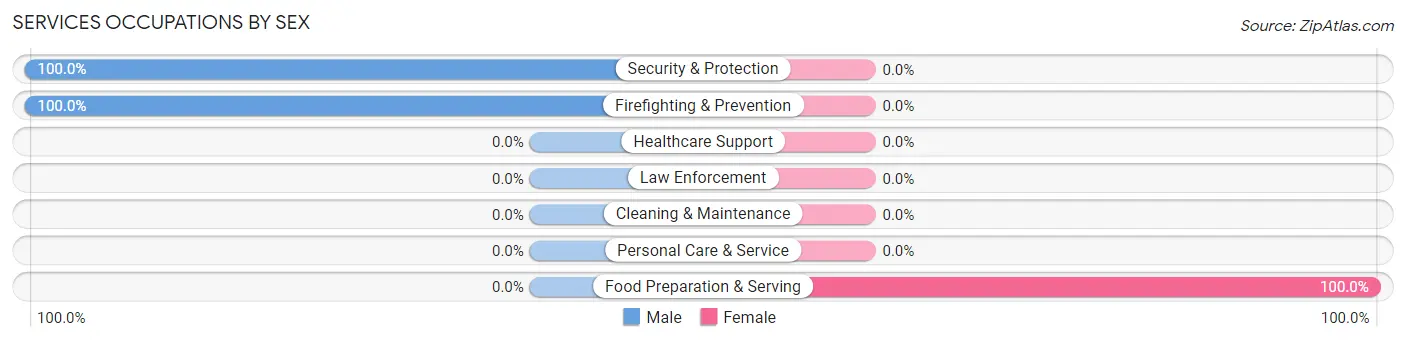
| Occupation | Male | Female |
| Healthcare Support | 0 (0.0%) | 0 (0.0%) |
| Security & Protection | 12 (100.0%) | 0 (0.0%) |
| Firefighting & Prevention | 12 (100.0%) | 0 (0.0%) |
| Law Enforcement | 0 (0.0%) | 0 (0.0%) |
| Food Preparation & Serving | 0 (0.0%) | 12 (100.0%) |
| Cleaning & Maintenance | 0 (0.0%) | 0 (0.0%) |
| Personal Care & Service | 0 (0.0%) | 0 (0.0%) |
| Total (Category) | 12 (50.0%) | 12 (50.0%) |
| Total (Overall) | 91 (44.0%) | 116 (56.0%) |
Sales and Office Occupations
The most common Sales and Office occupations in Maitland are , and Office & Administration (41 | 19.8%).
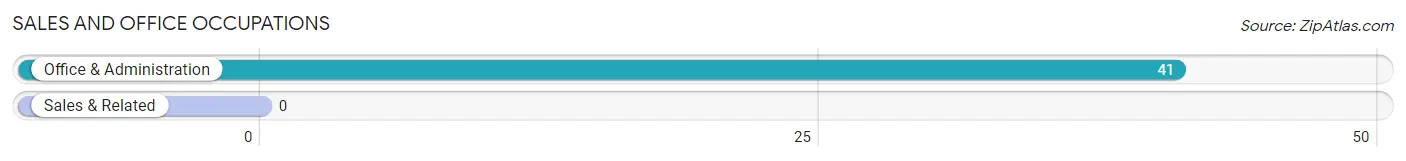
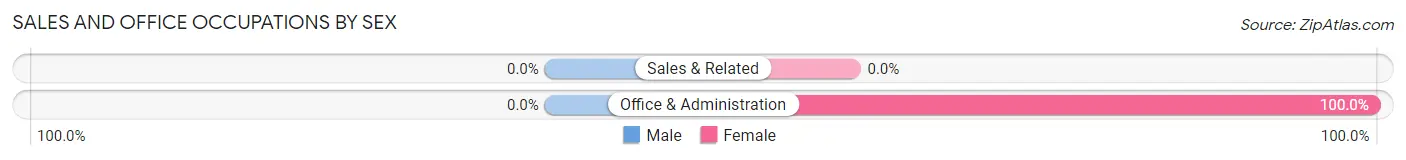
Sales and Office Occupations by Sex
| Occupation | Male | Female |
| Sales & Related | 0 (0.0%) | 0 (0.0%) |
| Office & Administration | 0 (0.0%) | 41 (100.0%) |
| Total (Category) | 0 (0.0%) | 41 (100.0%) |
| Total (Overall) | 91 (44.0%) | 116 (56.0%) |
Natural Resources, Construction and Maintenance Occupations
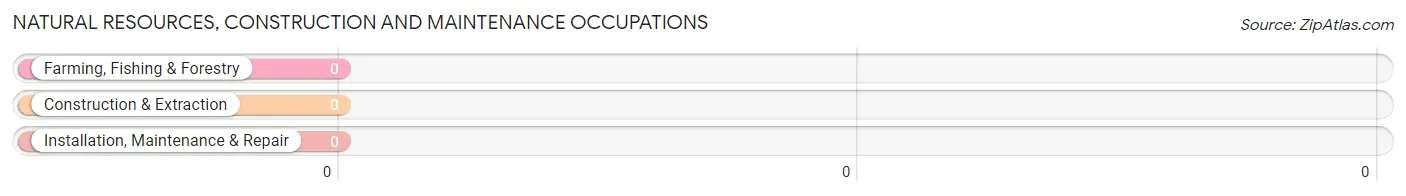
Natural Resources, Construction and Maintenance Occupations by Sex
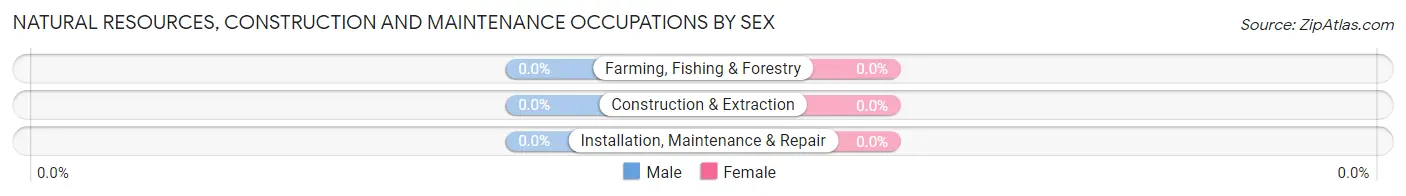
| Occupation | Male | Female |
| Farming, Fishing & Forestry | 0 (0.0%) | 0 (0.0%) |
| Construction & Extraction | 0 (0.0%) | 0 (0.0%) |
| Installation, Maintenance & Repair | 0 (0.0%) | 0 (0.0%) |
| Total (Category) | 0 (0.0%) | 0 (0.0%) |
| Total (Overall) | 91 (44.0%) | 116 (56.0%) |
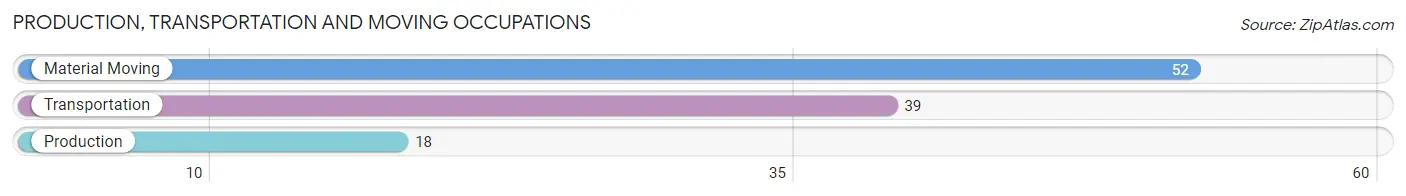
Production, Transportation and Moving Occupations
The most common Production, Transportation and Moving occupations in Maitland are Material Moving (52 | 25.1%), Transportation (39 | 18.8%), and Production (18 | 8.7%).
Production, Transportation and Moving Occupations by Sex
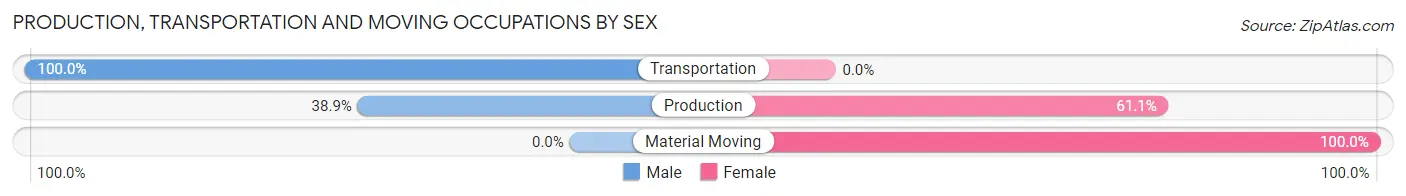
| Occupation | Male | Female |
| Production | 7 (38.9%) | 11 (61.1%) |
| Transportation | 39 (100.0%) | 0 (0.0%) |
| Material Moving | 0 (0.0%) | 52 (100.0%) |
| Total (Category) | 46 (42.2%) | 63 (57.8%) |
| Total (Overall) | 91 (44.0%) | 116 (56.0%) |
Employment Industries by Sex in Maitland
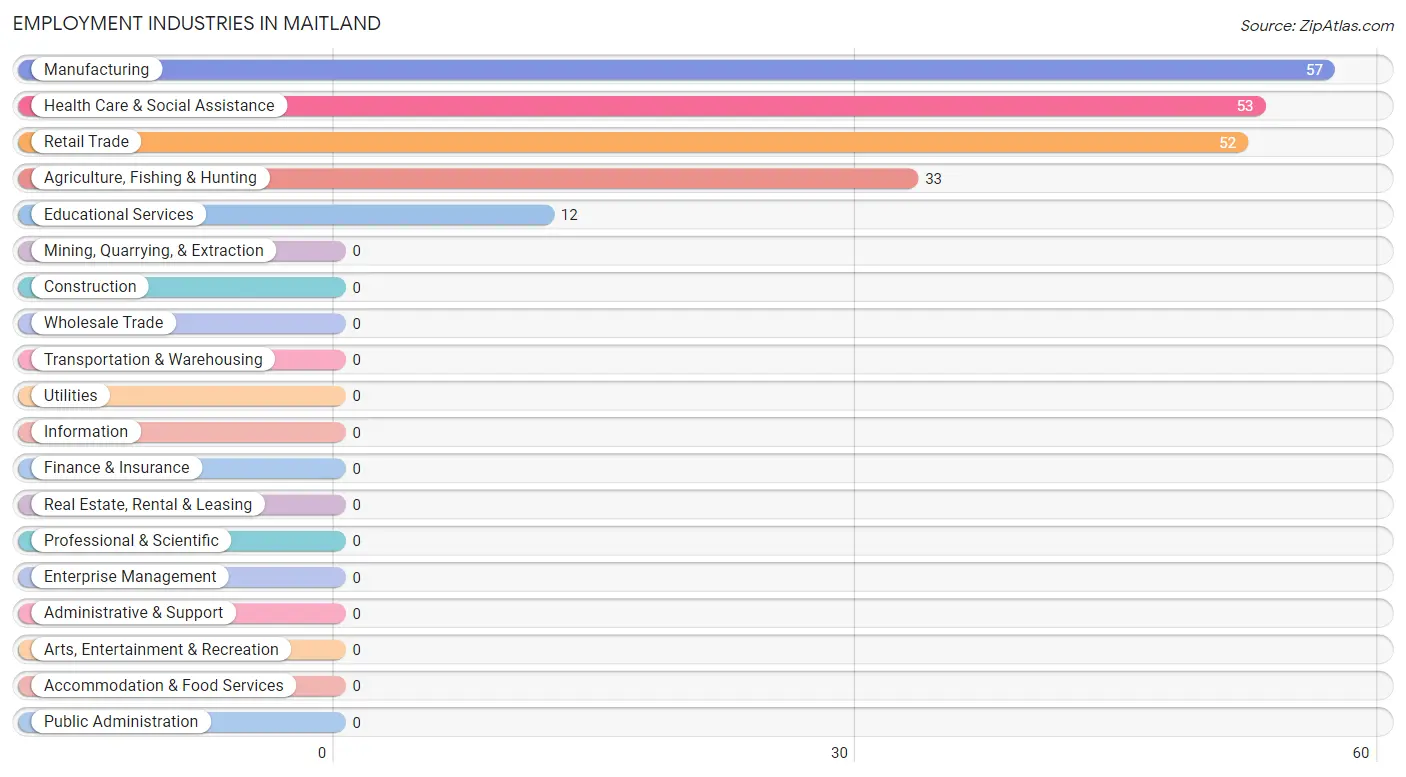
Employment Industries in Maitland
The major employment industries in Maitland include Manufacturing (57 | 27.5%), Health Care & Social Assistance (53 | 25.6%), Retail Trade (52 | 25.1%), Agriculture, Fishing & Hunting (33 | 15.9%), and Educational Services (12 | 5.8%).
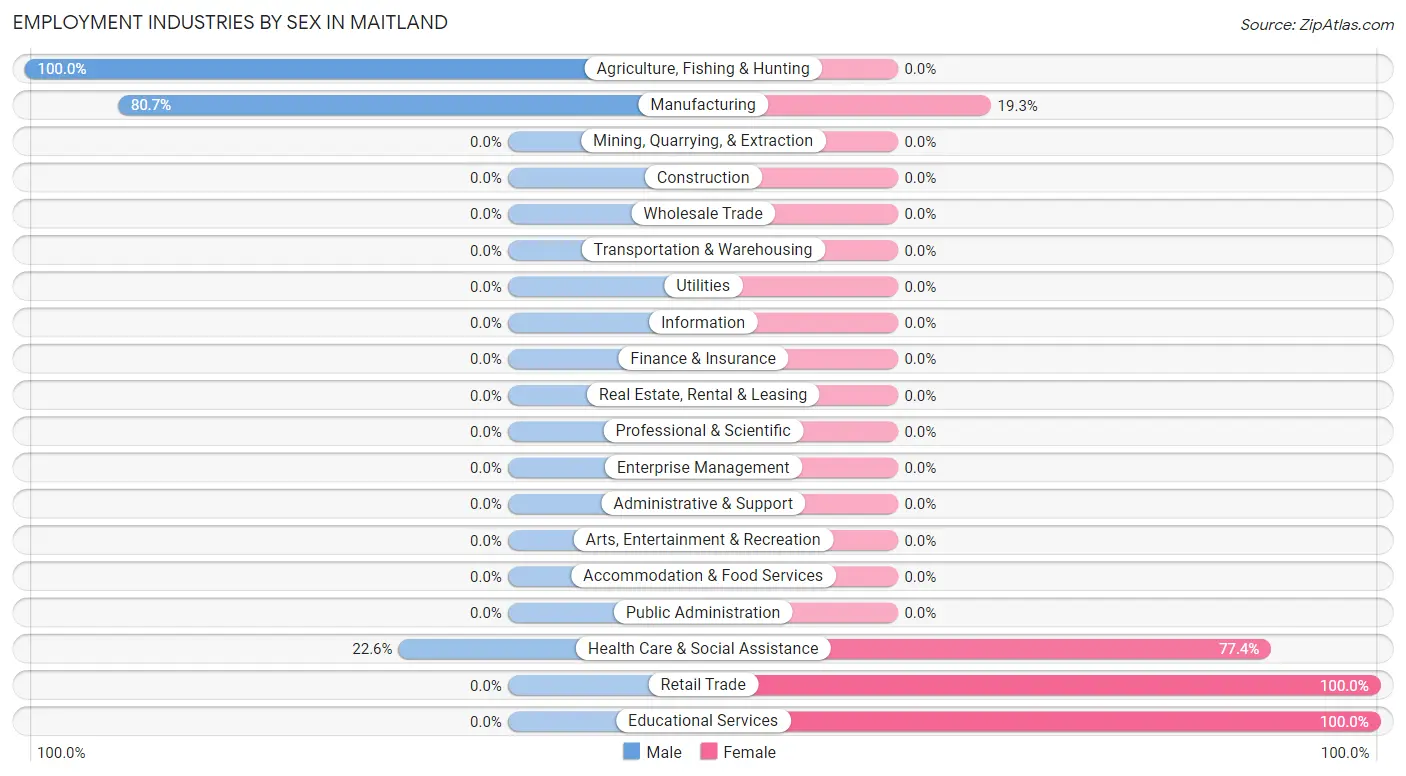
Employment Industries by Sex in Maitland
The Maitland industries that see more men than women are Agriculture, Fishing & Hunting (100.0%), Manufacturing (80.7%), and Health Care & Social Assistance (22.6%), whereas the industries that tend to have a higher number of women are Retail Trade (100.0%), Educational Services (100.0%), and Health Care & Social Assistance (77.4%).
| Industry | Male | Female |
| Agriculture, Fishing & Hunting | 33 (100.0%) | 0 (0.0%) |
| Mining, Quarrying, & Extraction | 0 (0.0%) | 0 (0.0%) |
| Construction | 0 (0.0%) | 0 (0.0%) |
| Manufacturing | 46 (80.7%) | 11 (19.3%) |
| Wholesale Trade | 0 (0.0%) | 0 (0.0%) |
| Retail Trade | 0 (0.0%) | 52 (100.0%) |
| Transportation & Warehousing | 0 (0.0%) | 0 (0.0%) |
| Utilities | 0 (0.0%) | 0 (0.0%) |
| Information | 0 (0.0%) | 0 (0.0%) |
| Finance & Insurance | 0 (0.0%) | 0 (0.0%) |
| Real Estate, Rental & Leasing | 0 (0.0%) | 0 (0.0%) |
| Professional & Scientific | 0 (0.0%) | 0 (0.0%) |
| Enterprise Management | 0 (0.0%) | 0 (0.0%) |
| Administrative & Support | 0 (0.0%) | 0 (0.0%) |
| Educational Services | 0 (0.0%) | 12 (100.0%) |
| Health Care & Social Assistance | 12 (22.6%) | 41 (77.4%) |
| Arts, Entertainment & Recreation | 0 (0.0%) | 0 (0.0%) |
| Accommodation & Food Services | 0 (0.0%) | 0 (0.0%) |
| Public Administration | 0 (0.0%) | 0 (0.0%) |
| Total | 91 (44.0%) | 116 (56.0%) |
Education in Maitland
School Enrollment in Maitland
| School Level | # Students | % Students |
| Nursery / Preschool | 0 | 0.0% |
| Kindergarten | 0 | 0.0% |
| Elementary School | 0 | 0.0% |
| Middle School | 0 | 0.0% |
| High School | 0 | 0.0% |
| College / Undergraduate | 0 | 0.0% |
| Graduate / Professional | 0 | 0.0% |
| Total | 0 | 0.0% |
School Enrollment by Age by Funding Source in Maitland
| Age Bracket | Public School | Private School |
| 3 to 4 Year Olds | 0 (0.0%) | 0 (0.0%) |
| 5 to 9 Year Old | 0 (0.0%) | 0 (0.0%) |
| 10 to 14 Year Olds | 0 (0.0%) | 0 (0.0%) |
| 15 to 17 Year Olds | 0 (0.0%) | 0 (0.0%) |
| 18 to 19 Year Olds | 0 (0.0%) | 0 (0.0%) |
| 20 to 24 Year Olds | 0 (0.0%) | 0 (0.0%) |
| 25 to 34 Year Olds | 0 (0.0%) | 0 (0.0%) |
| 35 Years and over | 0 (0.0%) | 0 (0.0%) |
| Total | 0 (0.0%) | 0 (0.0%) |
Educational Attainment by Field of Study in Maitland
Science & technology (52 | 61.9%), engineering (16 | 19.1%), and business (16 | 19.1%) are the most common fields of study among 84 individuals in Maitland who have obtained a bachelor's degree or higher.
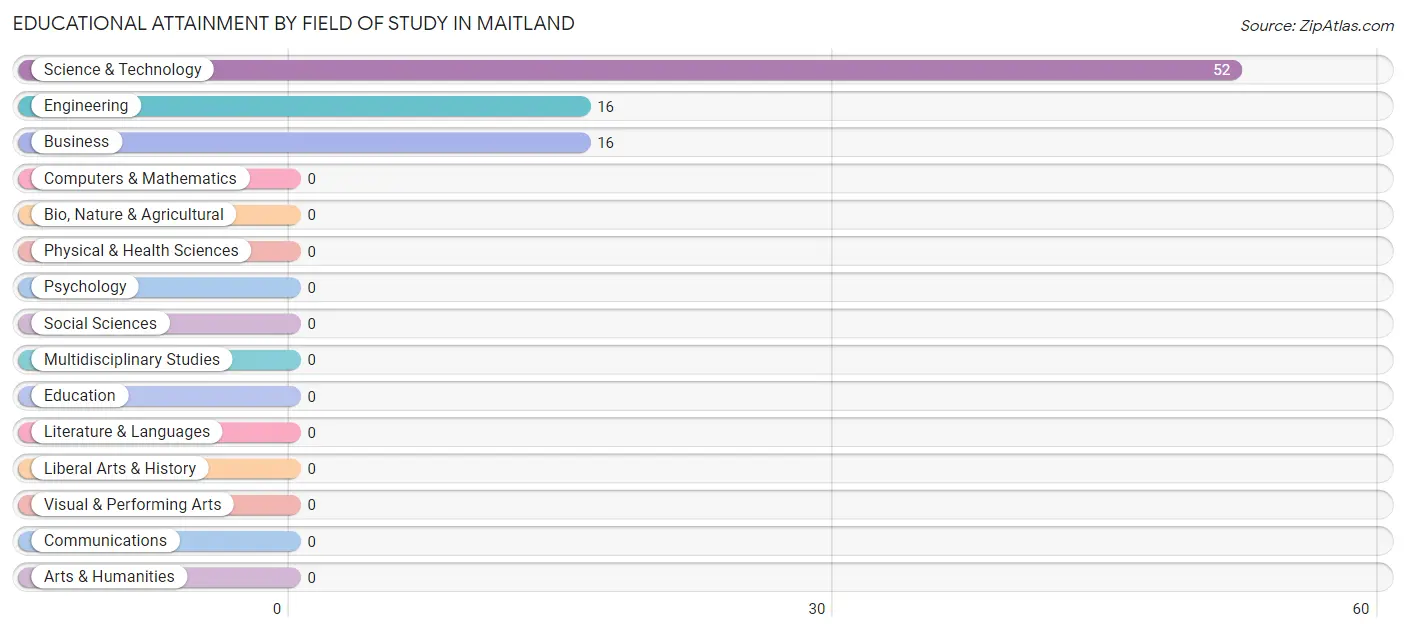
| Field of Study | # Graduates | % Graduates |
| Computers & Mathematics | 0 | 0.0% |
| Bio, Nature & Agricultural | 0 | 0.0% |
| Physical & Health Sciences | 0 | 0.0% |
| Psychology | 0 | 0.0% |
| Social Sciences | 0 | 0.0% |
| Engineering | 16 | 19.1% |
| Multidisciplinary Studies | 0 | 0.0% |
| Science & Technology | 52 | 61.9% |
| Business | 16 | 19.1% |
| Education | 0 | 0.0% |
| Literature & Languages | 0 | 0.0% |
| Liberal Arts & History | 0 | 0.0% |
| Visual & Performing Arts | 0 | 0.0% |
| Communications | 0 | 0.0% |
| Arts & Humanities | 0 | 0.0% |
| Total | 84 | 100.0% |
Transportation & Commute in Maitland
Vehicle Availability by Sex in Maitland
The most prevalent vehicle ownership categories in Maitland are males with 3 vehicles (45, accounting for 49.4%) and females with 3 vehicles (41, making up 38.8%).
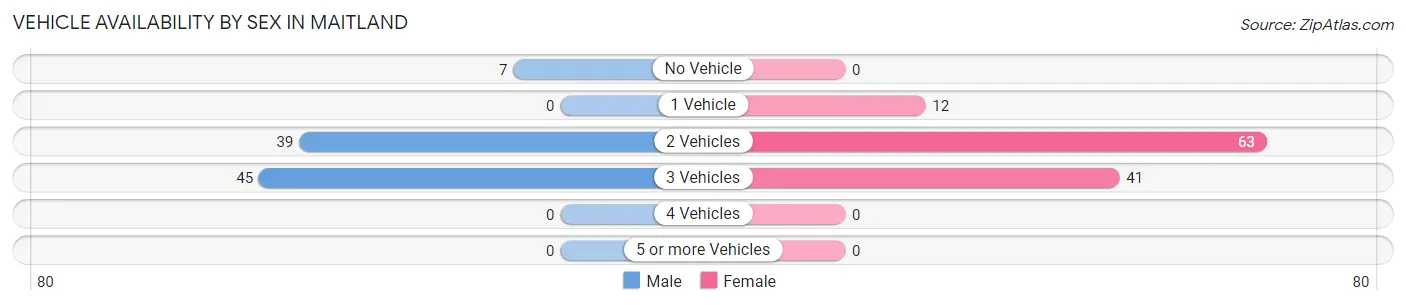
| Vehicles Available | Male | Female |
| No Vehicle | 7 (7.7%) | 0 (0.0%) |
| 1 Vehicle | 0 (0.0%) | 12 (10.3%) |
| 2 Vehicles | 39 (42.9%) | 63 (54.3%) |
| 3 Vehicles | 45 (49.4%) | 41 (35.3%) |
| 4 Vehicles | 0 (0.0%) | 0 (0.0%) |
| 5 or more Vehicles | 0 (0.0%) | 0 (0.0%) |
| Total | 91 (100.0%) | 116 (100.0%) |
Commute Time in Maitland
The most frequently occuring commute durations in Maitland are 10 to 14 minutes (125 commuters, 60.4%), 15 to 19 minutes (64 commuters, 30.9%), and 45 to 59 minutes (11 commuters, 5.3%).
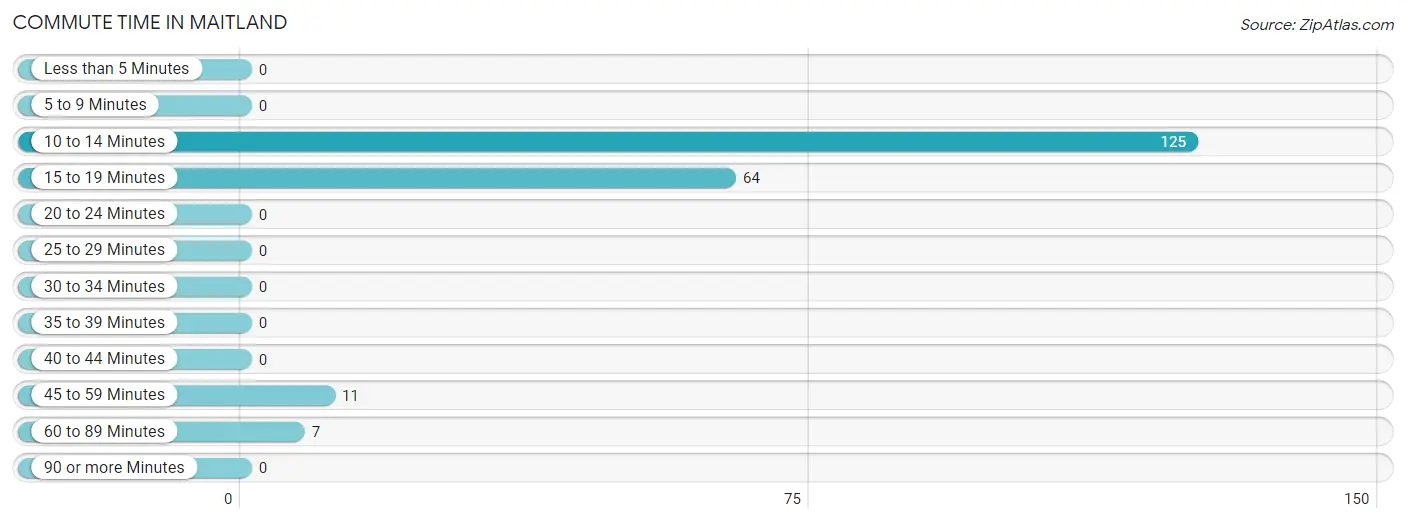
| Commute Time | # Commuters | % Commuters |
| Less than 5 Minutes | 0 | 0.0% |
| 5 to 9 Minutes | 0 | 0.0% |
| 10 to 14 Minutes | 125 | 60.4% |
| 15 to 19 Minutes | 64 | 30.9% |
| 20 to 24 Minutes | 0 | 0.0% |
| 25 to 29 Minutes | 0 | 0.0% |
| 30 to 34 Minutes | 0 | 0.0% |
| 35 to 39 Minutes | 0 | 0.0% |
| 40 to 44 Minutes | 0 | 0.0% |
| 45 to 59 Minutes | 11 | 5.3% |
| 60 to 89 Minutes | 7 | 3.4% |
| 90 or more Minutes | 0 | 0.0% |
Commute Time by Sex in Maitland
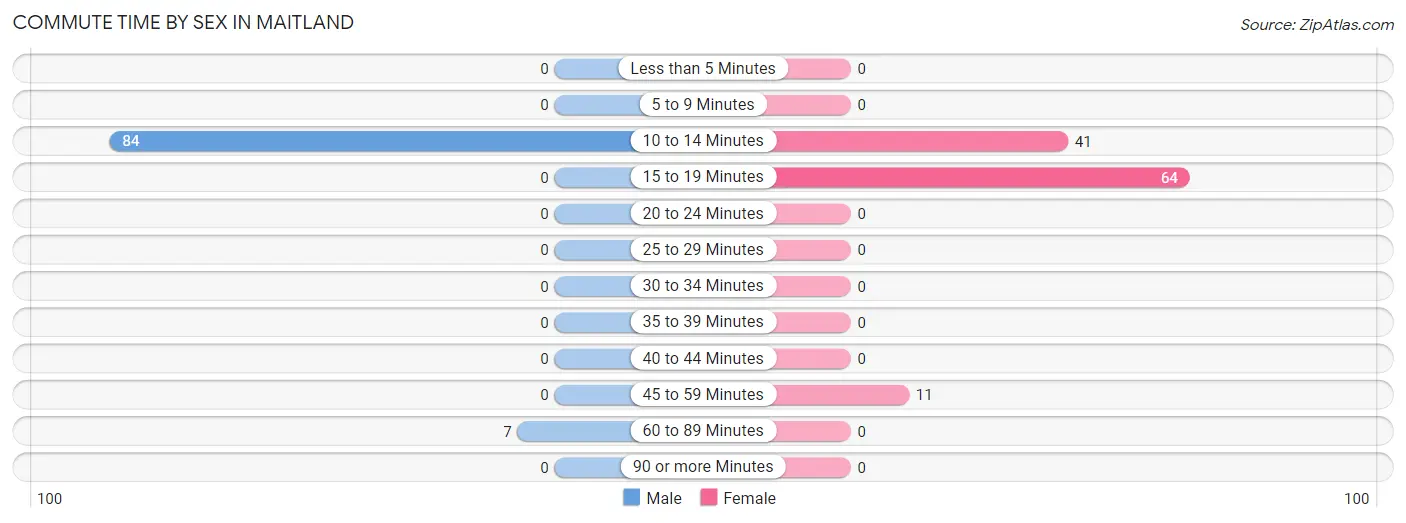
The most common commute times in Maitland are 10 to 14 minutes (84 commuters, 92.3%) for males and 15 to 19 minutes (64 commuters, 55.2%) for females.
| Commute Time | Male | Female |
| Less than 5 Minutes | 0 (0.0%) | 0 (0.0%) |
| 5 to 9 Minutes | 0 (0.0%) | 0 (0.0%) |
| 10 to 14 Minutes | 84 (92.3%) | 41 (35.3%) |
| 15 to 19 Minutes | 0 (0.0%) | 64 (55.2%) |
| 20 to 24 Minutes | 0 (0.0%) | 0 (0.0%) |
| 25 to 29 Minutes | 0 (0.0%) | 0 (0.0%) |
| 30 to 34 Minutes | 0 (0.0%) | 0 (0.0%) |
| 35 to 39 Minutes | 0 (0.0%) | 0 (0.0%) |
| 40 to 44 Minutes | 0 (0.0%) | 0 (0.0%) |
| 45 to 59 Minutes | 0 (0.0%) | 11 (9.5%) |
| 60 to 89 Minutes | 7 (7.7%) | 0 (0.0%) |
| 90 or more Minutes | 0 (0.0%) | 0 (0.0%) |
Time of Departure to Work by Sex in Maitland
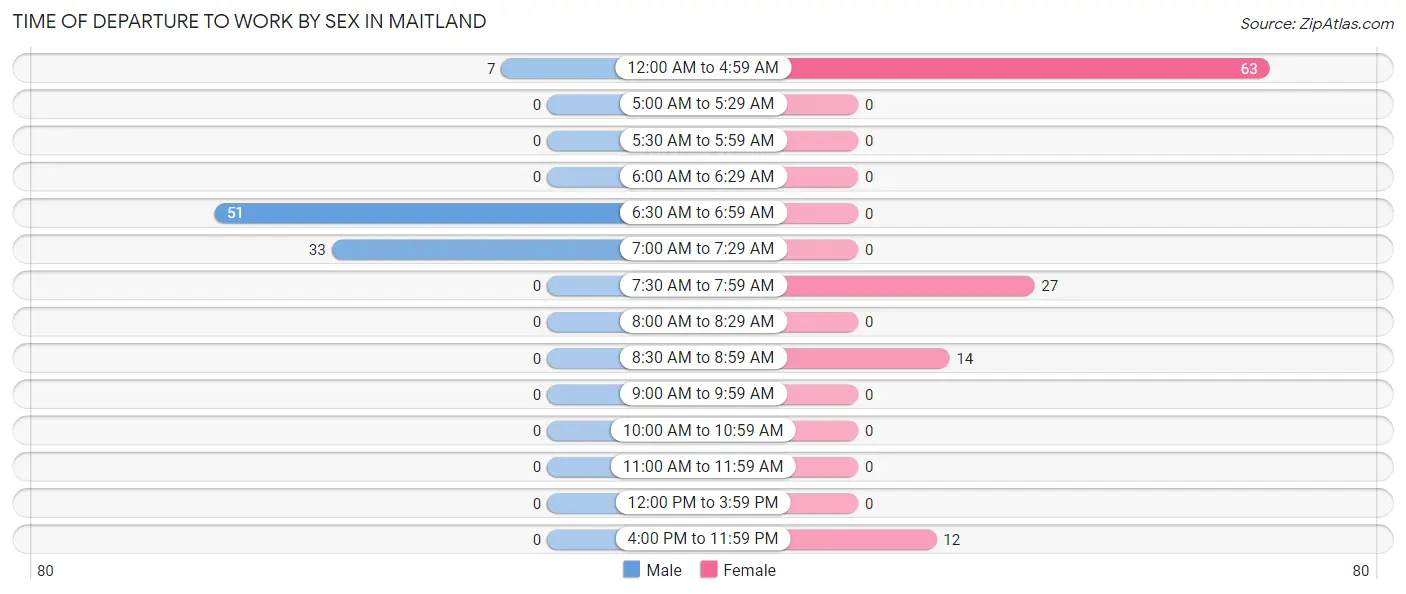
The most frequent times of departure to work in Maitland are 6:30 AM to 6:59 AM (51, 56.0%) for males and 12:00 AM to 4:59 AM (63, 54.3%) for females.
| Time of Departure | Male | Female |
| 12:00 AM to 4:59 AM | 7 (7.7%) | 63 (54.3%) |
| 5:00 AM to 5:29 AM | 0 (0.0%) | 0 (0.0%) |
| 5:30 AM to 5:59 AM | 0 (0.0%) | 0 (0.0%) |
| 6:00 AM to 6:29 AM | 0 (0.0%) | 0 (0.0%) |
| 6:30 AM to 6:59 AM | 51 (56.0%) | 0 (0.0%) |
| 7:00 AM to 7:29 AM | 33 (36.3%) | 0 (0.0%) |
| 7:30 AM to 7:59 AM | 0 (0.0%) | 27 (23.3%) |
| 8:00 AM to 8:29 AM | 0 (0.0%) | 0 (0.0%) |
| 8:30 AM to 8:59 AM | 0 (0.0%) | 14 (12.1%) |
| 9:00 AM to 9:59 AM | 0 (0.0%) | 0 (0.0%) |
| 10:00 AM to 10:59 AM | 0 (0.0%) | 0 (0.0%) |
| 11:00 AM to 11:59 AM | 0 (0.0%) | 0 (0.0%) |
| 12:00 PM to 3:59 PM | 0 (0.0%) | 0 (0.0%) |
| 4:00 PM to 11:59 PM | 0 (0.0%) | 12 (10.3%) |
| Total | 91 (100.0%) | 116 (100.0%) |
Housing Occupancy in Maitland
Occupancy by Ownership in Maitland
Of the total 156 dwellings in Maitland, owner-occupied units account for 149 (95.5%), while renter-occupied units make up 7 (4.5%).
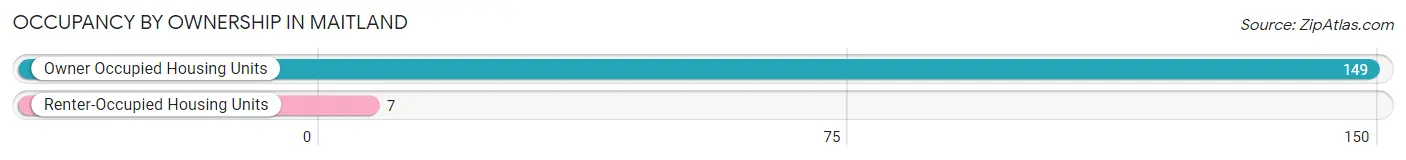
| Occupancy | # Housing Units | % Housing Units |
| Owner Occupied Housing Units | 149 | 95.5% |
| Renter-Occupied Housing Units | 7 | 4.5% |
| Total Occupied Housing Units | 156 | 100.0% |
Occupancy by Household Size in Maitland
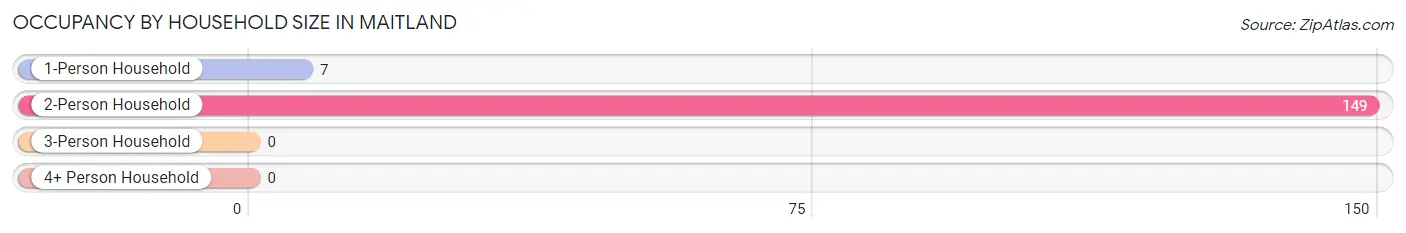
| Household Size | # Housing Units | % Housing Units |
| 1-Person Household | 7 | 4.5% |
| 2-Person Household | 149 | 95.5% |
| 3-Person Household | 0 | 0.0% |
| 4+ Person Household | 0 | 0.0% |
| Total Housing Units | 156 | 100.0% |
Occupancy by Ownership by Household Size in Maitland
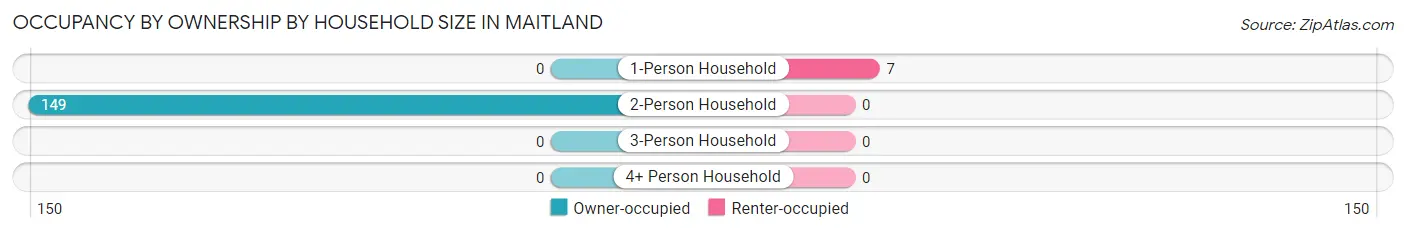
| Household Size | Owner-occupied | Renter-occupied |
| 1-Person Household | 0 (0.0%) | 7 (100.0%) |
| 2-Person Household | 149 (100.0%) | 0 (0.0%) |
| 3-Person Household | 0 (0.0%) | 0 (0.0%) |
| 4+ Person Household | 0 (0.0%) | 0 (0.0%) |
| Total Housing Units | 149 (95.5%) | 7 (4.5%) |
Occupancy by Educational Attainment in Maitland
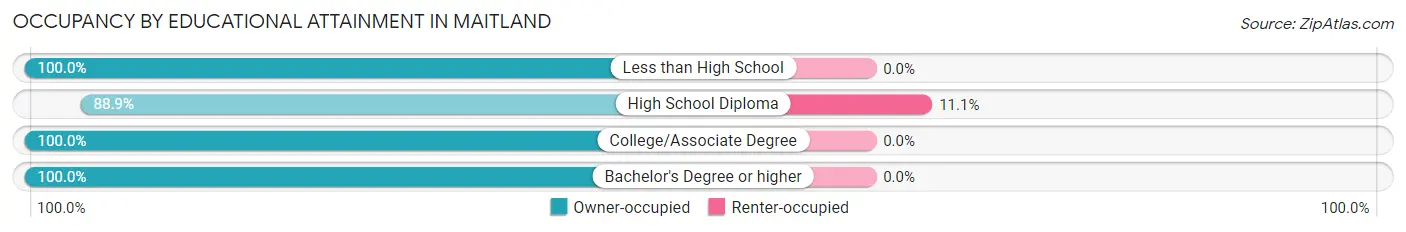
| Household Size | Owner-occupied | Renter-occupied |
| Less than High School | 11 (100.0%) | 0 (0.0%) |
| High School Diploma | 56 (88.9%) | 7 (11.1%) |
| College/Associate Degree | 66 (100.0%) | 0 (0.0%) |
| Bachelor's Degree or higher | 16 (100.0%) | 0 (0.0%) |
Occupancy by Age of Householder in Maitland
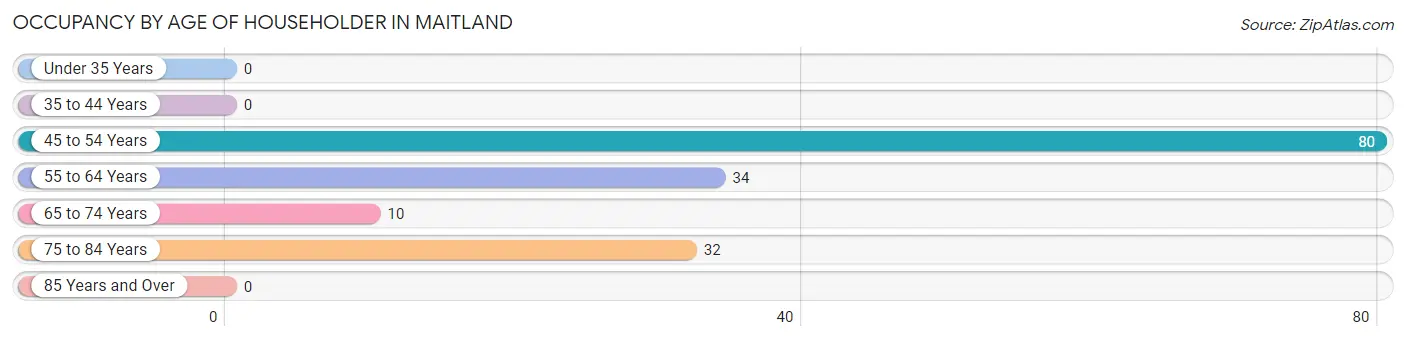
| Age Bracket | # Households | % Households |
| Under 35 Years | 0 | 0.0% |
| 35 to 44 Years | 0 | 0.0% |
| 45 to 54 Years | 80 | 51.3% |
| 55 to 64 Years | 34 | 21.8% |
| 65 to 74 Years | 10 | 6.4% |
| 75 to 84 Years | 32 | 20.5% |
| 85 Years and Over | 0 | 0.0% |
| Total | 156 | 100.0% |
Housing Finances in Maitland
Median Income by Occupancy in Maitland
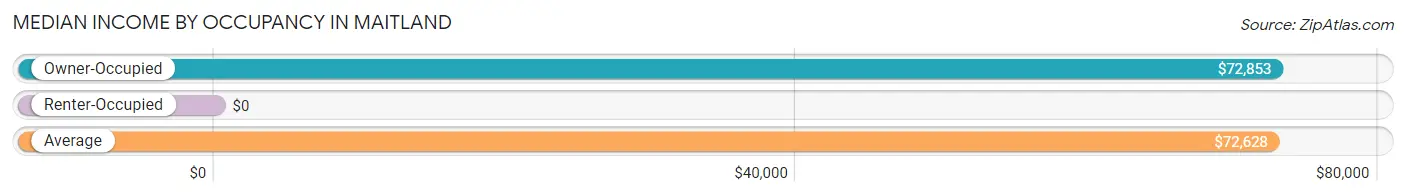
| Occupancy Type | # Households | Median Income |
| Owner-Occupied | 149 (95.5%) | $72,853 |
| Renter-Occupied | 7 (4.5%) | $0 |
| Average | 156 (100.0%) | $72,628 |
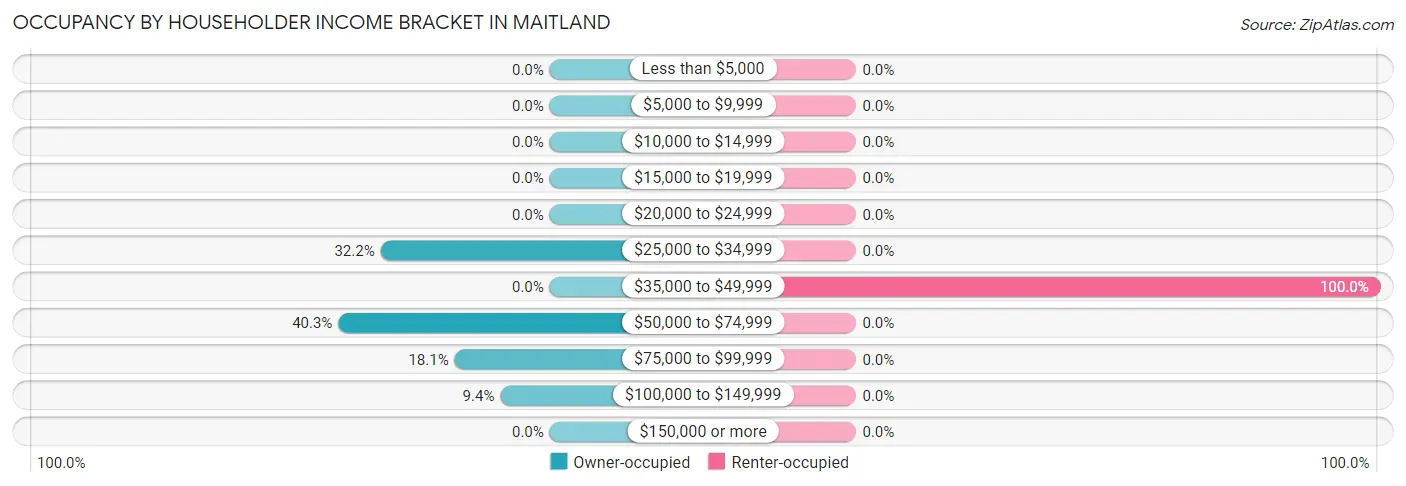
Occupancy by Householder Income Bracket in Maitland
| Income Bracket | Owner-occupied | Renter-occupied |
| Less than $5,000 | 0 (0.0%) | 0 (0.0%) |
| $5,000 to $9,999 | 0 (0.0%) | 0 (0.0%) |
| $10,000 to $14,999 | 0 (0.0%) | 0 (0.0%) |
| $15,000 to $19,999 | 0 (0.0%) | 0 (0.0%) |
| $20,000 to $24,999 | 0 (0.0%) | 0 (0.0%) |
| $25,000 to $34,999 | 48 (32.2%) | 0 (0.0%) |
| $35,000 to $49,999 | 0 (0.0%) | 7 (100.0%) |
| $50,000 to $74,999 | 60 (40.3%) | 0 (0.0%) |
| $75,000 to $99,999 | 27 (18.1%) | 0 (0.0%) |
| $100,000 to $149,999 | 14 (9.4%) | 0 (0.0%) |
| $150,000 or more | 0 (0.0%) | 0 (0.0%) |
| Total | 149 (100.0%) | 7 (100.0%) |
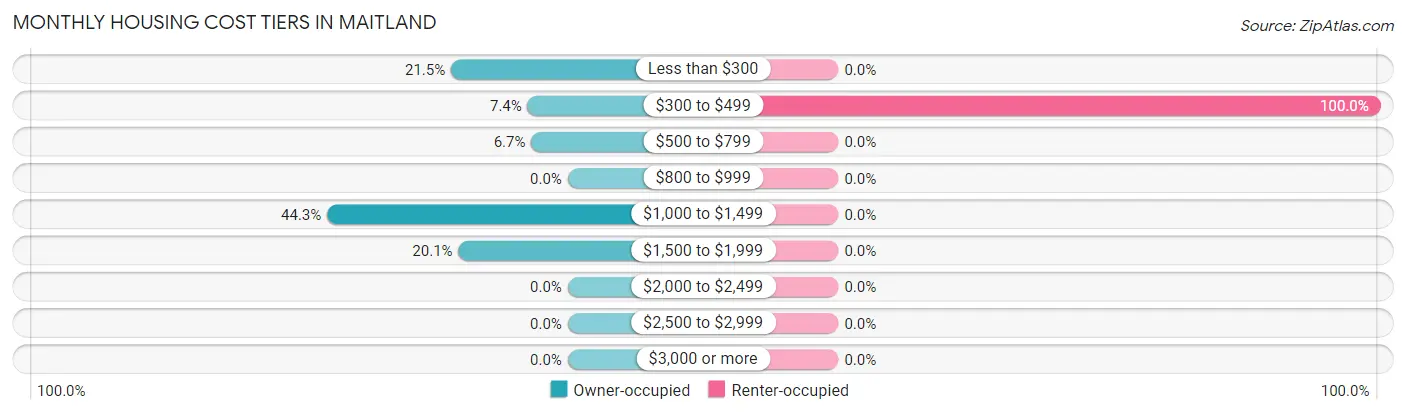
Monthly Housing Cost Tiers in Maitland
| Monthly Cost | Owner-occupied | Renter-occupied |
| Less than $300 | 32 (21.5%) | 0 (0.0%) |
| $300 to $499 | 11 (7.4%) | 7 (100.0%) |
| $500 to $799 | 10 (6.7%) | 0 (0.0%) |
| $800 to $999 | 0 (0.0%) | 0 (0.0%) |
| $1,000 to $1,499 | 66 (44.3%) | 0 (0.0%) |
| $1,500 to $1,999 | 30 (20.1%) | 0 (0.0%) |
| $2,000 to $2,499 | 0 (0.0%) | 0 (0.0%) |
| $2,500 to $2,999 | 0 (0.0%) | 0 (0.0%) |
| $3,000 or more | 0 (0.0%) | 0 (0.0%) |
| Total | 149 (100.0%) | 7 (100.0%) |
Physical Housing Characteristics in Maitland
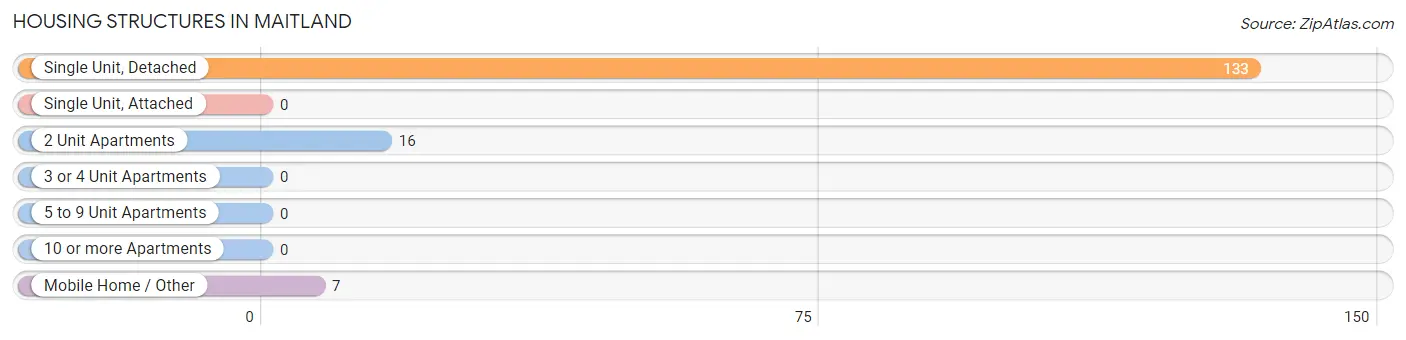
Housing Structures in Maitland
| Structure Type | # Housing Units | % Housing Units |
| Single Unit, Detached | 133 | 85.3% |
| Single Unit, Attached | 0 | 0.0% |
| 2 Unit Apartments | 16 | 10.3% |
| 3 or 4 Unit Apartments | 0 | 0.0% |
| 5 to 9 Unit Apartments | 0 | 0.0% |
| 10 or more Apartments | 0 | 0.0% |
| Mobile Home / Other | 7 | 4.5% |
| Total | 156 | 100.0% |
Housing Structures by Occupancy in Maitland
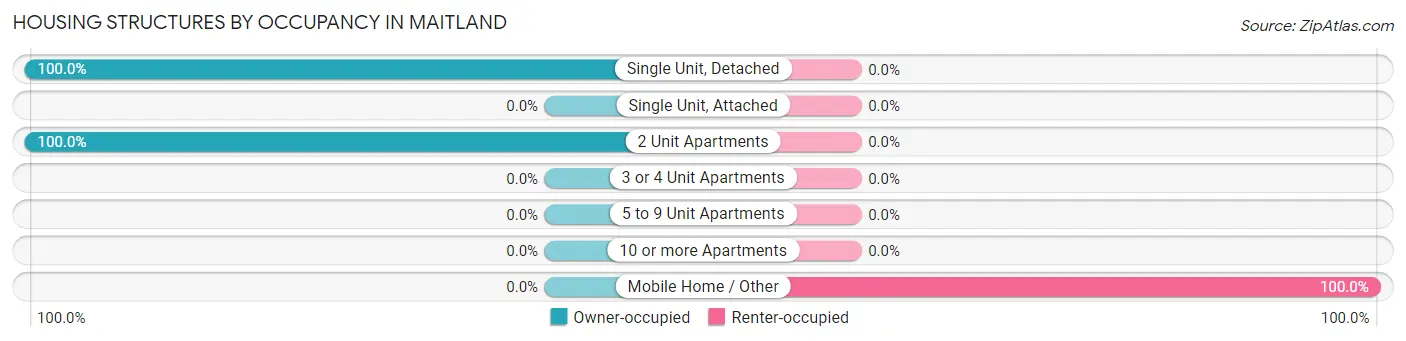
| Structure Type | Owner-occupied | Renter-occupied |
| Single Unit, Detached | 133 (100.0%) | 0 (0.0%) |
| Single Unit, Attached | 0 (0.0%) | 0 (0.0%) |
| 2 Unit Apartments | 16 (100.0%) | 0 (0.0%) |
| 3 or 4 Unit Apartments | 0 (0.0%) | 0 (0.0%) |
| 5 to 9 Unit Apartments | 0 (0.0%) | 0 (0.0%) |
| 10 or more Apartments | 0 (0.0%) | 0 (0.0%) |
| Mobile Home / Other | 0 (0.0%) | 7 (100.0%) |
| Total | 149 (95.5%) | 7 (4.5%) |
Housing Structures by Number of Rooms in Maitland
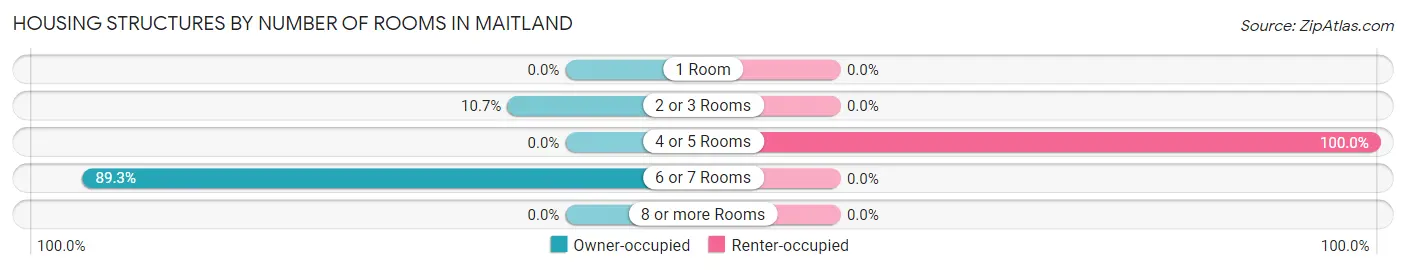
| Number of Rooms | Owner-occupied | Renter-occupied |
| 1 Room | 0 (0.0%) | 0 (0.0%) |
| 2 or 3 Rooms | 16 (10.7%) | 0 (0.0%) |
| 4 or 5 Rooms | 0 (0.0%) | 7 (100.0%) |
| 6 or 7 Rooms | 133 (89.3%) | 0 (0.0%) |
| 8 or more Rooms | 0 (0.0%) | 0 (0.0%) |
| Total | 149 (100.0%) | 7 (100.0%) |
Housing Structure by Heating Type in Maitland
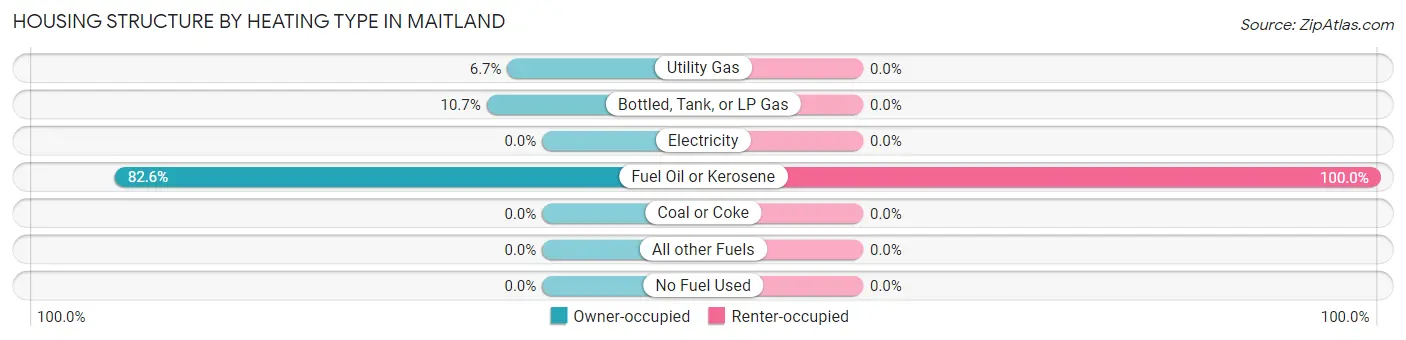
| Heating Type | Owner-occupied | Renter-occupied |
| Utility Gas | 10 (6.7%) | 0 (0.0%) |
| Bottled, Tank, or LP Gas | 16 (10.7%) | 0 (0.0%) |
| Electricity | 0 (0.0%) | 0 (0.0%) |
| Fuel Oil or Kerosene | 123 (82.6%) | 7 (100.0%) |
| Coal or Coke | 0 (0.0%) | 0 (0.0%) |
| All other Fuels | 0 (0.0%) | 0 (0.0%) |
| No Fuel Used | 0 (0.0%) | 0 (0.0%) |
| Total | 149 (100.0%) | 7 (100.0%) |
Household Vehicle Usage in Maitland
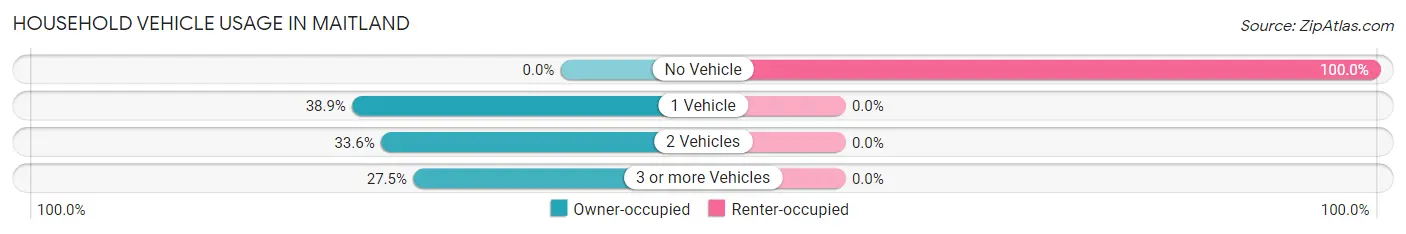
| Vehicles per Household | Owner-occupied | Renter-occupied |
| No Vehicle | 0 (0.0%) | 7 (100.0%) |
| 1 Vehicle | 58 (38.9%) | 0 (0.0%) |
| 2 Vehicles | 50 (33.6%) | 0 (0.0%) |
| 3 or more Vehicles | 41 (27.5%) | 0 (0.0%) |
| Total | 149 (100.0%) | 7 (100.0%) |
Real Estate & Mortgages in Maitland
Real Estate and Mortgage Overview in Maitland
| Characteristic | Without Mortgage | With Mortgage |
| Housing Units | 53 | 96 |
| Median Property Value | $162,900 | $91,300 |
| Median Household Income | - | - |
| Monthly Housing Costs | $291 | $0 |
| Real Estate Taxes | $1,758 | $0 |
Property Value by Mortgage Status in Maitland
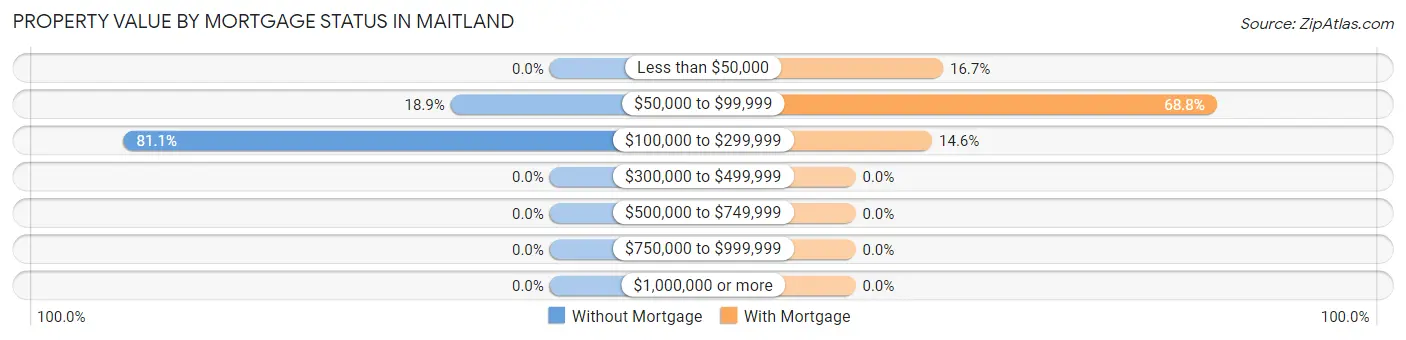
| Property Value | Without Mortgage | With Mortgage |
| Less than $50,000 | 0 (0.0%) | 16 (16.7%) |
| $50,000 to $99,999 | 10 (18.9%) | 66 (68.8%) |
| $100,000 to $299,999 | 43 (81.1%) | 14 (14.6%) |
| $300,000 to $499,999 | 0 (0.0%) | 0 (0.0%) |
| $500,000 to $749,999 | 0 (0.0%) | 0 (0.0%) |
| $750,000 to $999,999 | 0 (0.0%) | 0 (0.0%) |
| $1,000,000 or more | 0 (0.0%) | 0 (0.0%) |
| Total | 53 (100.0%) | 96 (100.0%) |
Household Income by Mortgage Status in Maitland
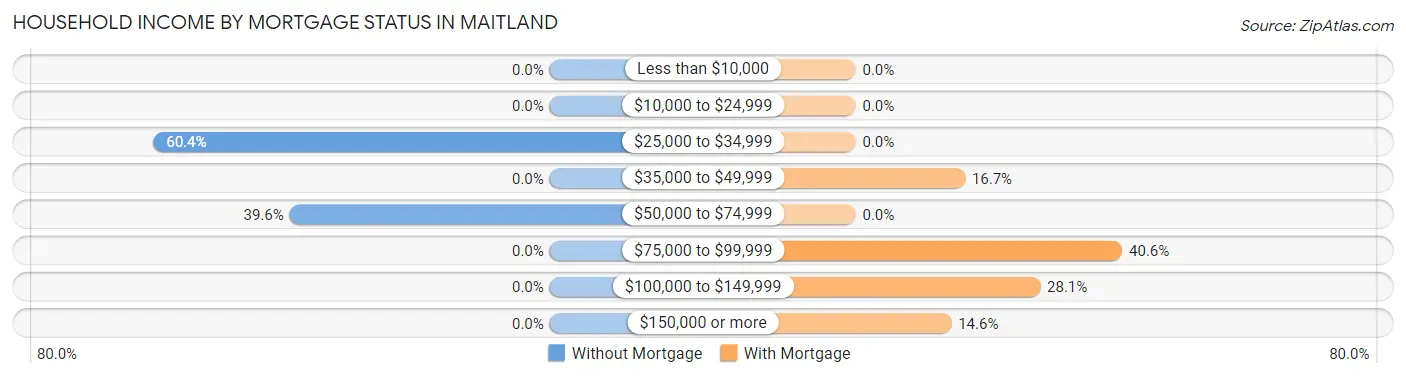
| Household Income | Without Mortgage | With Mortgage |
| Less than $10,000 | 0 (0.0%) | 0 (0.0%) |
| $10,000 to $24,999 | 0 (0.0%) | 0 (0.0%) |
| $25,000 to $34,999 | 32 (60.4%) | 0 (0.0%) |
| $35,000 to $49,999 | 0 (0.0%) | 16 (16.7%) |
| $50,000 to $74,999 | 21 (39.6%) | 0 (0.0%) |
| $75,000 to $99,999 | 0 (0.0%) | 39 (40.6%) |
| $100,000 to $149,999 | 0 (0.0%) | 27 (28.1%) |
| $150,000 or more | 0 (0.0%) | 14 (14.6%) |
| Total | 53 (100.0%) | 96 (100.0%) |
Property Value to Household Income Ratio in Maitland
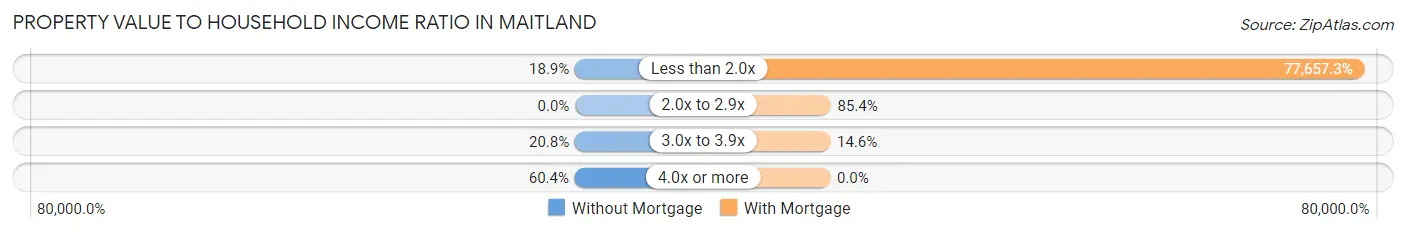
| Value-to-Income Ratio | Without Mortgage | With Mortgage |
| Less than 2.0x | 10 (18.9%) | 74,551 (77,657.3%) |
| 2.0x to 2.9x | 0 (0.0%) | 82 (85.4%) |
| 3.0x to 3.9x | 11 (20.7%) | 14 (14.6%) |
| 4.0x or more | 32 (60.4%) | 0 (0.0%) |
| Total | 53 (100.0%) | 96 (100.0%) |
Real Estate Taxes by Mortgage Status in Maitland
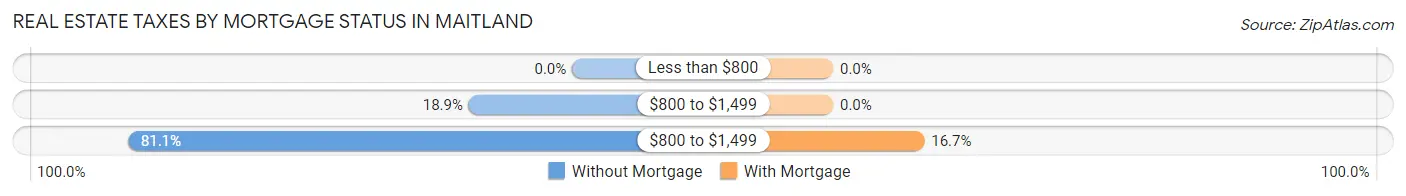
| Property Taxes | Without Mortgage | With Mortgage |
| Less than $800 | 0 (0.0%) | 0 (0.0%) |
| $800 to $1,499 | 10 (18.9%) | 0 (0.0%) |
| $800 to $1,499 | 43 (81.1%) | 16 (16.7%) |
| Total | 53 (100.0%) | 96 (100.0%) |
Health & Disability in Maitland
Health Insurance Coverage by Age in Maitland
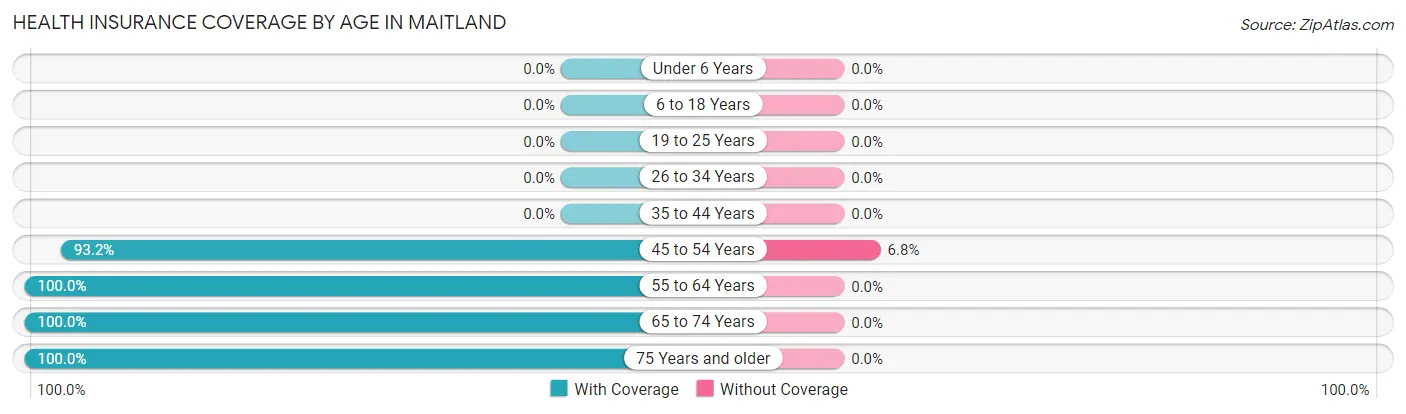
| Age Bracket | With Coverage | Without Coverage |
| Under 6 Years | 0 (0.0%) | 0 (0.0%) |
| 6 to 18 Years | 0 (0.0%) | 0 (0.0%) |
| 19 to 25 Years | 0 (0.0%) | 0 (0.0%) |
| 26 to 34 Years | 0 (0.0%) | 0 (0.0%) |
| 35 to 44 Years | 0 (0.0%) | 0 (0.0%) |
| 45 to 54 Years | 165 (93.2%) | 12 (6.8%) |
| 55 to 64 Years | 57 (100.0%) | 0 (0.0%) |
| 65 to 74 Years | 37 (100.0%) | 0 (0.0%) |
| 75 Years and older | 32 (100.0%) | 0 (0.0%) |
| Total | 291 (96.0%) | 12 (4.0%) |
Health Insurance Coverage by Citizenship Status in Maitland
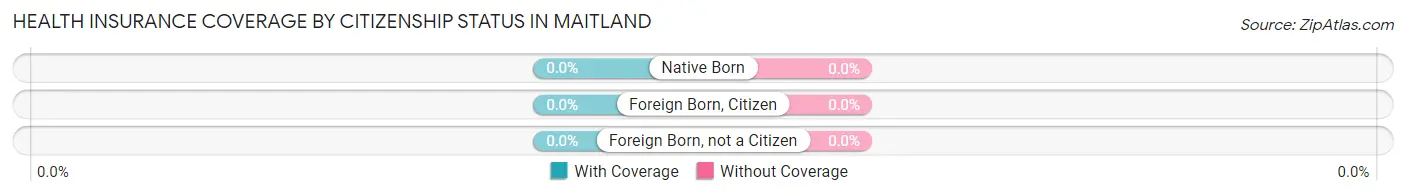
| Citizenship Status | With Coverage | Without Coverage |
| Native Born | 0 (0.0%) | 0 (0.0%) |
| Foreign Born, Citizen | 0 (0.0%) | 0 (0.0%) |
| Foreign Born, not a Citizen | 0 (0.0%) | 0 (0.0%) |
Health Insurance Coverage by Household Income in Maitland
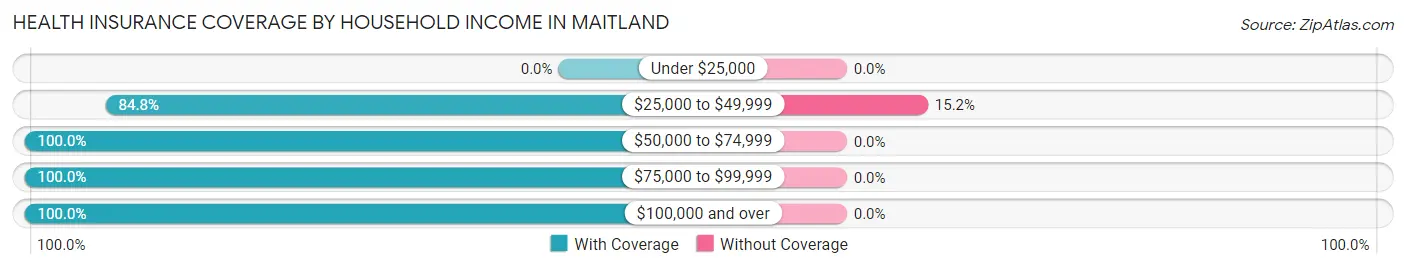
| Household Income | With Coverage | Without Coverage |
| Under $25,000 | 0 (0.0%) | 0 (0.0%) |
| $25,000 to $49,999 | 67 (84.8%) | 12 (15.2%) |
| $50,000 to $74,999 | 138 (100.0%) | 0 (0.0%) |
| $75,000 to $99,999 | 60 (100.0%) | 0 (0.0%) |
| $100,000 and over | 26 (100.0%) | 0 (0.0%) |
Public vs Private Health Insurance Coverage by Age in Maitland
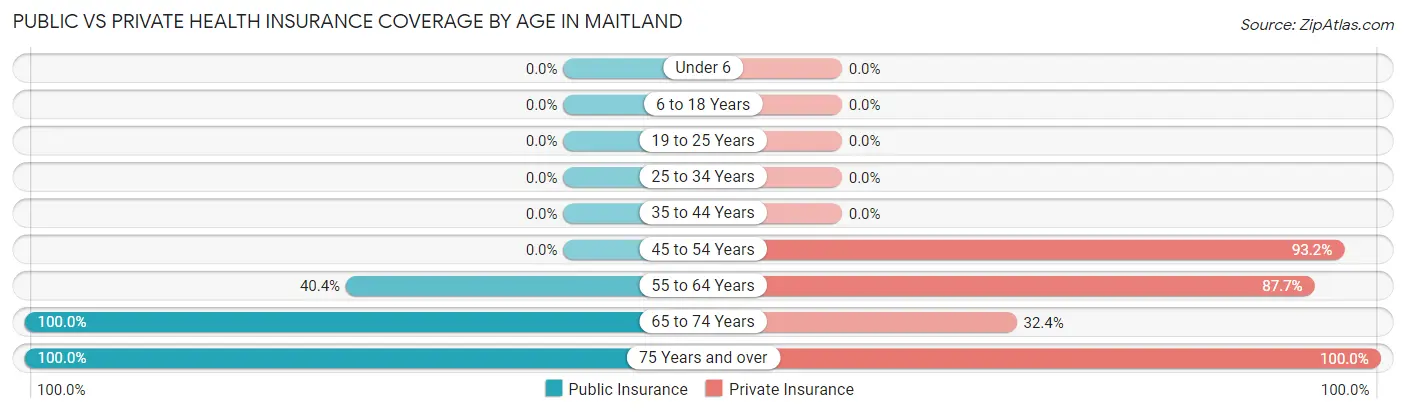
| Age Bracket | Public Insurance | Private Insurance |
| Under 6 | 0 (0.0%) | 0 (0.0%) |
| 6 to 18 Years | 0 (0.0%) | 0 (0.0%) |
| 19 to 25 Years | 0 (0.0%) | 0 (0.0%) |
| 25 to 34 Years | 0 (0.0%) | 0 (0.0%) |
| 35 to 44 Years | 0 (0.0%) | 0 (0.0%) |
| 45 to 54 Years | 0 (0.0%) | 165 (93.2%) |
| 55 to 64 Years | 23 (40.4%) | 50 (87.7%) |
| 65 to 74 Years | 37 (100.0%) | 12 (32.4%) |
| 75 Years and over | 32 (100.0%) | 32 (100.0%) |
| Total | 92 (30.4%) | 259 (85.5%) |
Disability Status by Sex by Age in Maitland
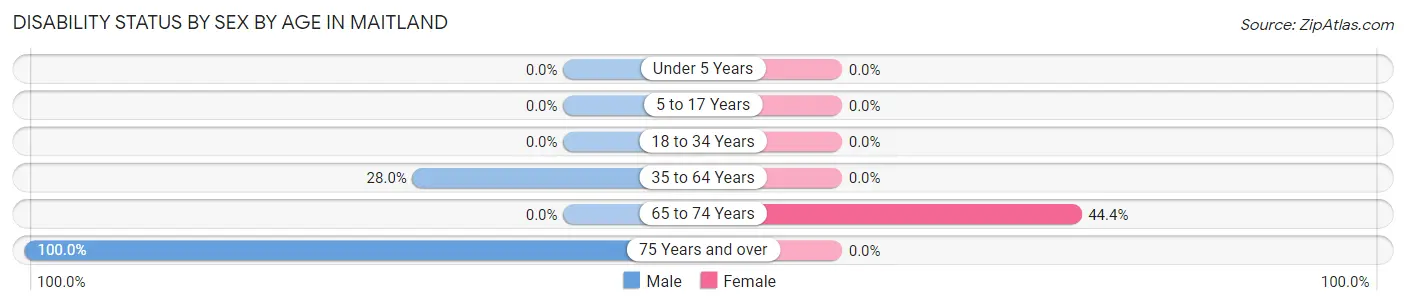
| Age Bracket | Male | Female |
| Under 5 Years | 0 (0.0%) | 0 (0.0%) |
| 5 to 17 Years | 0 (0.0%) | 0 (0.0%) |
| 18 to 34 Years | 0 (0.0%) | 0 (0.0%) |
| 35 to 64 Years | 33 (28.0%) | 0 (0.0%) |
| 65 to 74 Years | 0 (0.0%) | 12 (44.4%) |
| 75 Years and over | 32 (100.0%) | 0 (0.0%) |
Disability Class by Sex by Age in Maitland
Disability Class: Hearing Difficulty
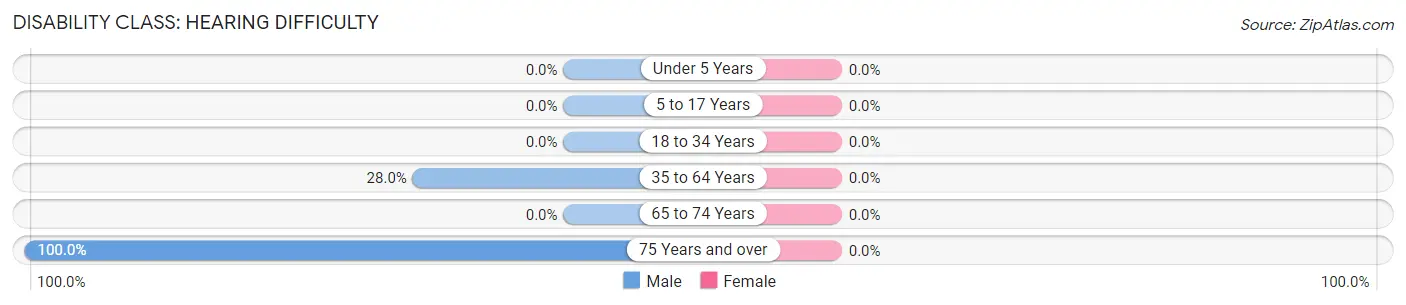
| Age Bracket | Male | Female |
| Under 5 Years | 0 (0.0%) | 0 (0.0%) |
| 5 to 17 Years | 0 (0.0%) | 0 (0.0%) |
| 18 to 34 Years | 0 (0.0%) | 0 (0.0%) |
| 35 to 64 Years | 33 (28.0%) | 0 (0.0%) |
| 65 to 74 Years | 0 (0.0%) | 0 (0.0%) |
| 75 Years and over | 32 (100.0%) | 0 (0.0%) |
Disability Class: Vision Difficulty
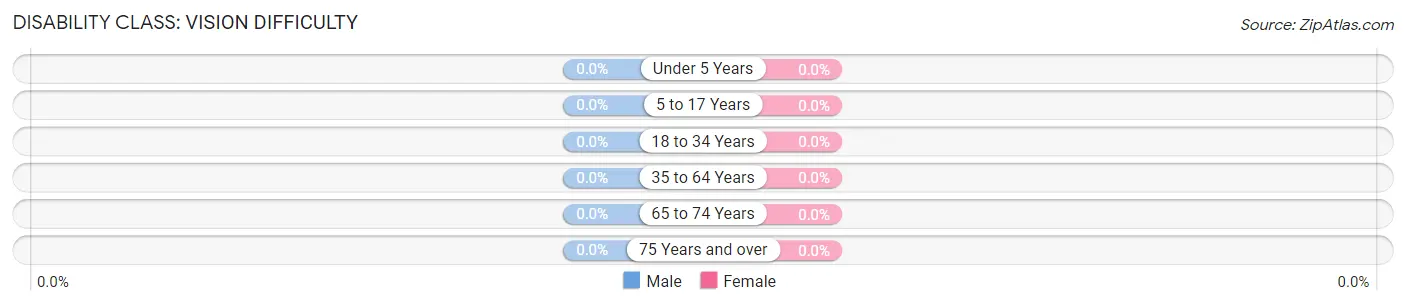
| Age Bracket | Male | Female |
| Under 5 Years | 0 (0.0%) | 0 (0.0%) |
| 5 to 17 Years | 0 (0.0%) | 0 (0.0%) |
| 18 to 34 Years | 0 (0.0%) | 0 (0.0%) |
| 35 to 64 Years | 0 (0.0%) | 0 (0.0%) |
| 65 to 74 Years | 0 (0.0%) | 0 (0.0%) |
| 75 Years and over | 0 (0.0%) | 0 (0.0%) |
Disability Class: Cognitive Difficulty
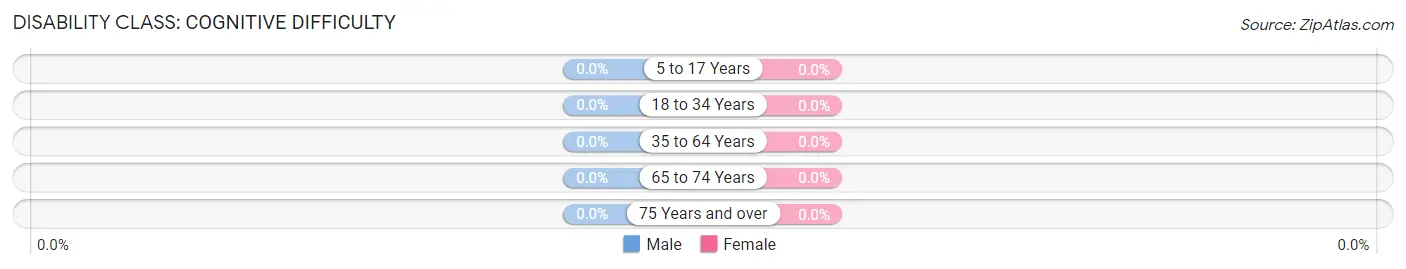
| Age Bracket | Male | Female |
| 5 to 17 Years | 0 (0.0%) | 0 (0.0%) |
| 18 to 34 Years | 0 (0.0%) | 0 (0.0%) |
| 35 to 64 Years | 0 (0.0%) | 0 (0.0%) |
| 65 to 74 Years | 0 (0.0%) | 0 (0.0%) |
| 75 Years and over | 0 (0.0%) | 0 (0.0%) |
Disability Class: Ambulatory Difficulty
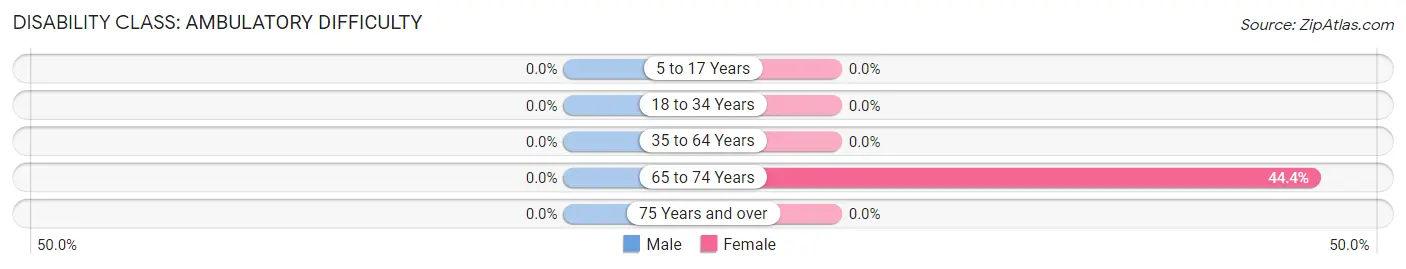
| Age Bracket | Male | Female |
| 5 to 17 Years | 0 (0.0%) | 0 (0.0%) |
| 18 to 34 Years | 0 (0.0%) | 0 (0.0%) |
| 35 to 64 Years | 0 (0.0%) | 0 (0.0%) |
| 65 to 74 Years | 0 (0.0%) | 12 (44.4%) |
| 75 Years and over | 0 (0.0%) | 0 (0.0%) |
Disability Class: Self-Care Difficulty
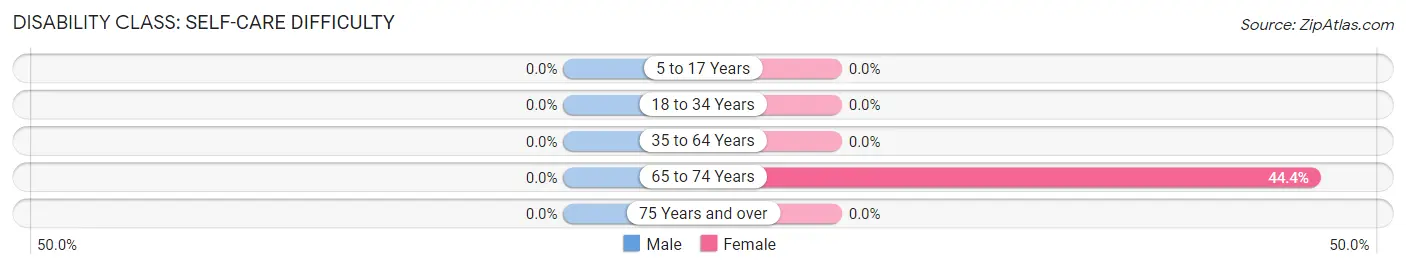
| Age Bracket | Male | Female |
| 5 to 17 Years | 0 (0.0%) | 0 (0.0%) |
| 18 to 34 Years | 0 (0.0%) | 0 (0.0%) |
| 35 to 64 Years | 0 (0.0%) | 0 (0.0%) |
| 65 to 74 Years | 0 (0.0%) | 12 (44.4%) |
| 75 Years and over | 0 (0.0%) | 0 (0.0%) |
Technology Access in Maitland
Computing Device Access in Maitland
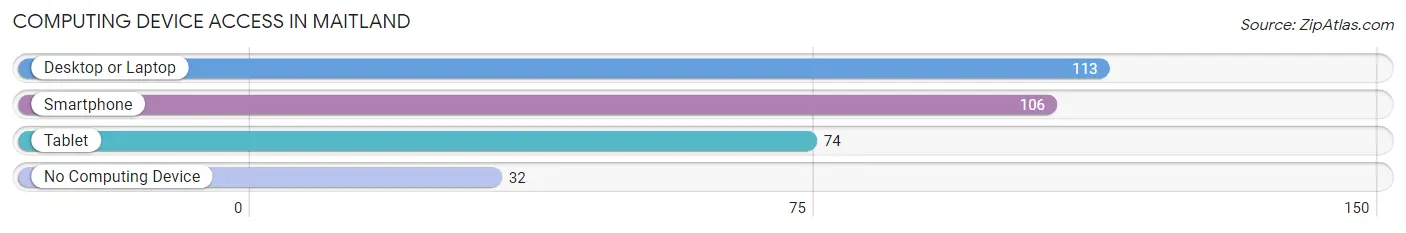
| Device Type | # Households | % Households |
| Desktop or Laptop | 113 | 72.4% |
| Smartphone | 106 | 67.9% |
| Tablet | 74 | 47.4% |
| No Computing Device | 32 | 20.5% |
| Total | 156 | 100.0% |
Internet Access in Maitland
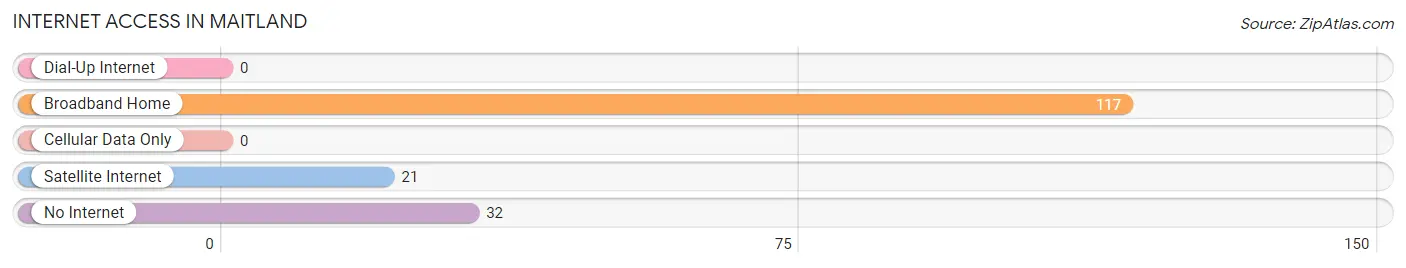
| Internet Type | # Households | % Households |
| Dial-Up Internet | 0 | 0.0% |
| Broadband Home | 117 | 75.0% |
| Cellular Data Only | 0 | 0.0% |
| Satellite Internet | 21 | 13.5% |
| No Internet | 32 | 20.5% |
| Total | 156 | 100.0% |
Maitland Summary
Maitland is a small town located in the state of Pennsylvania, United States. It is situated in the northern part of the state, in the county of Lancaster. The town has a population of approximately 1,500 people and is located in the heart of the Pennsylvania Dutch Country.
History
Maitland was founded in 1790 by a group of settlers from the nearby town of Lancaster. The town was named after the Maitland family, who were among the first settlers. The Maitland family had a large farm in the area and the town was built around it.
The town grew slowly over the years, but it was not until the late 19th century that it began to experience significant growth. This was due to the development of the railroad, which allowed for the transportation of goods and people to and from the town.
In the early 20th century, Maitland experienced a period of rapid growth. This was due to the development of the local coal industry, which provided jobs for many of the town's residents. The town also became a popular tourist destination, as it was located close to the popular tourist destination of Hershey Park.
Geography
Maitland is located in the northern part of the state of Pennsylvania, in the county of Lancaster. The town is situated in the heart of the Pennsylvania Dutch Country, and is surrounded by rolling hills and farmland. The town is located near the Susquehanna River, which provides a scenic backdrop to the town.
The climate in Maitland is generally mild, with temperatures ranging from the low 30s in the winter to the mid-80s in the summer. The town receives an average of 40 inches of precipitation each year, with most of it falling in the form of snow during the winter months.
Economy
Maitland's economy is largely based on agriculture and tourism. The town is home to several farms, which produce a variety of crops, including corn, wheat, and soybeans. The town is also home to several tourist attractions, including Hershey Park and the Pennsylvania Dutch Country.
The town also has a small manufacturing sector, which produces a variety of products, including furniture, clothing, and food products. The town also has a small retail sector, which includes several small shops and restaurants.
Demographics
As of the 2010 census, the population of Maitland was 1,500. The town is predominantly white, with approximately 95% of the population being of European descent. The town also has a small Hispanic population, which makes up about 2% of the population.
The median household income in Maitland is $45,000, which is slightly lower than the national average. The town also has a higher than average poverty rate, with approximately 15% of the population living below the poverty line.
Conclusion
Maitland is a small town located in the northern part of the state of Pennsylvania. The town has a population of approximately 1,500 people and is located in the heart of the Pennsylvania Dutch Country. The town's economy is largely based on agriculture and tourism, and the town has a small manufacturing and retail sector. The town is predominantly white, with a small Hispanic population. The median household income in Maitland is slightly lower than the national average, and the town has a higher than average poverty rate.
Common Questions
What is Per Capita Income in Maitland?
Per Capita income in Maitland is $33,906.
What is the Median Family Income in Maitland?
Median Family Income in Maitland is $72,853.
What is the Median Household income in Maitland?
Median Household Income in Maitland is $72,628.
What is Income or Wage Gap in Maitland?
Income or Wage Gap in Maitland is 16.2%.
Women in Maitland earn 83.8 cents for every dollar earned by a man.
What is Inequality or Gini Index in Maitland?
Inequality or Gini Index in Maitland is 0.22.
What is the Total Population of Maitland?
Total Population of Maitland is 303.
What is the Total Male Population of Maitland?
Total Male Population of Maitland is 160.
What is the Total Female Population of Maitland?
Total Female Population of Maitland is 143.
What is the Ratio of Males per 100 Females in Maitland?
There are 111.89 Males per 100 Females in Maitland.
What is the Ratio of Females per 100 Males in Maitland?
There are 89.38 Females per 100 Males in Maitland.
What is the Median Population Age in Maitland?
Median Population Age in Maitland is 51.6 Years.
What is the Average Family Size in Maitland
Average Family Size in Maitland is 2.0 People.
What is the Average Household Size in Maitland
Average Household Size in Maitland is 1.9 People.
How Large is the Labor Force in Maitland?
There are 207 People in the Labor Forcein in Maitland.
What is the Percentage of People in the Labor Force in Maitland?
68.3% of People are in the Labor Force in Maitland.