Noxen, PA Map & Demographics
Noxen Map
Noxen Overview
$26,601
PER CAPITA INCOME
$57,396
AVG FAMILY INCOME
$62,898
AVG HOUSEHOLD INCOME
63.4%
WAGE / INCOME GAP [ % ]
36.6¢/ $1
WAGE / INCOME GAP [ $ ]
0.34
INEQUALITY / GINI INDEX
603
TOTAL POPULATION
285
MALE POPULATION
318
FEMALE POPULATION
89.62
MALES / 100 FEMALES
111.58
FEMALES / 100 MALES
54.6
MEDIAN AGE
2.6
AVG FAMILY SIZE
2.3
AVG HOUSEHOLD SIZE
277
LABOR FORCE [ PEOPLE ]
51.3%
PERCENT IN LABOR FORCE
17.3%
UNEMPLOYMENT RATE
Noxen Zip Codes
Noxen Area Codes
Income in Noxen
Income Overview in Noxen
Per Capita Income in Noxen is $26,601, while median incomes of families and households are $57,396 and $62,898 respectively.
| Characteristic | Number | Measure |
| Per Capita Income | 603 | $26,601 |
| Median Family Income | 171 | $57,396 |
| Mean Family Income | 171 | $68,030 |
| Median Household Income | 267 | $62,898 |
| Mean Household Income | 267 | $60,815 |
| Income Deficit | 171 | $0 |
| Wage / Income Gap (%) | 603 | 63.37% |
| Wage / Income Gap ($) | 603 | 36.63¢ per $1 |
| Gini / Inequality Index | 603 | 0.34 |
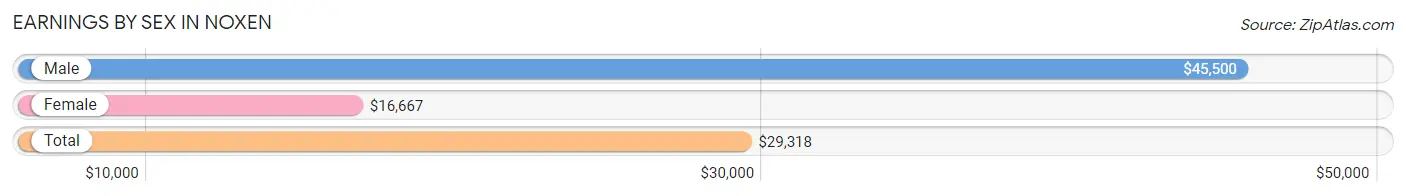
Earnings by Sex in Noxen
Average Earnings in Noxen are $29,318, $45,500 for men and $16,667 for women, a difference of 63.4%.
| Sex | Number | Average Earnings |
| Male | 158 (58.5%) | $45,500 |
| Female | 112 (41.5%) | $16,667 |
| Total | 270 (100.0%) | $29,318 |
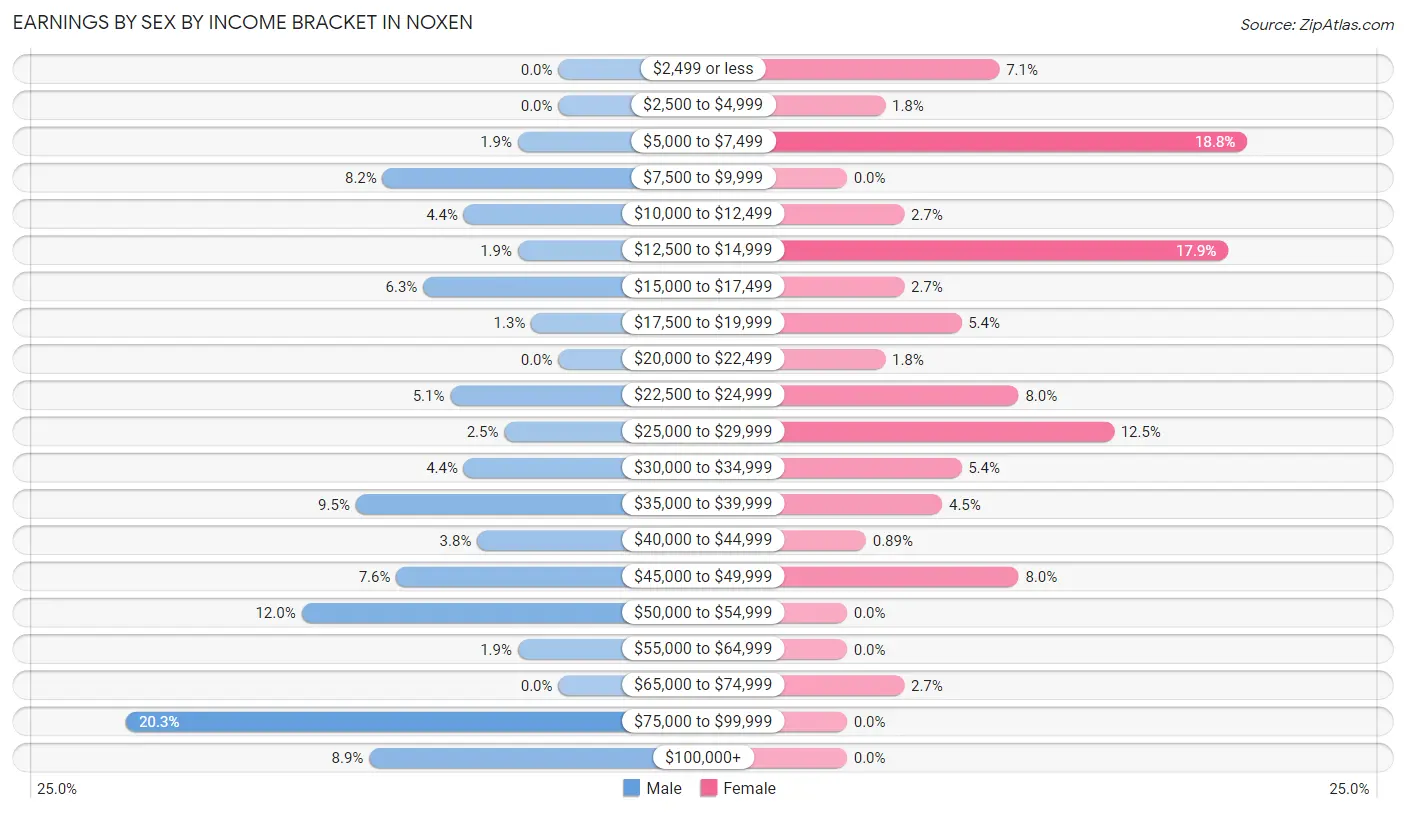
Earnings by Sex by Income Bracket in Noxen
The most common earnings brackets in Noxen are $75,000 to $99,999 for men (32 | 20.3%) and $5,000 to $7,499 for women (21 | 18.8%).
| Income | Male | Female |
| $2,499 or less | 0 (0.0%) | 8 (7.1%) |
| $2,500 to $4,999 | 0 (0.0%) | 2 (1.8%) |
| $5,000 to $7,499 | 3 (1.9%) | 21 (18.8%) |
| $7,500 to $9,999 | 13 (8.2%) | 0 (0.0%) |
| $10,000 to $12,499 | 7 (4.4%) | 3 (2.7%) |
| $12,500 to $14,999 | 3 (1.9%) | 20 (17.9%) |
| $15,000 to $17,499 | 10 (6.3%) | 3 (2.7%) |
| $17,500 to $19,999 | 2 (1.3%) | 6 (5.4%) |
| $20,000 to $22,499 | 0 (0.0%) | 2 (1.8%) |
| $22,500 to $24,999 | 8 (5.1%) | 9 (8.0%) |
| $25,000 to $29,999 | 4 (2.5%) | 14 (12.5%) |
| $30,000 to $34,999 | 7 (4.4%) | 6 (5.4%) |
| $35,000 to $39,999 | 15 (9.5%) | 5 (4.5%) |
| $40,000 to $44,999 | 6 (3.8%) | 1 (0.9%) |
| $45,000 to $49,999 | 12 (7.6%) | 9 (8.0%) |
| $50,000 to $54,999 | 19 (12.0%) | 0 (0.0%) |
| $55,000 to $64,999 | 3 (1.9%) | 0 (0.0%) |
| $65,000 to $74,999 | 0 (0.0%) | 3 (2.7%) |
| $75,000 to $99,999 | 32 (20.3%) | 0 (0.0%) |
| $100,000+ | 14 (8.9%) | 0 (0.0%) |
| Total | 158 (100.0%) | 112 (100.0%) |
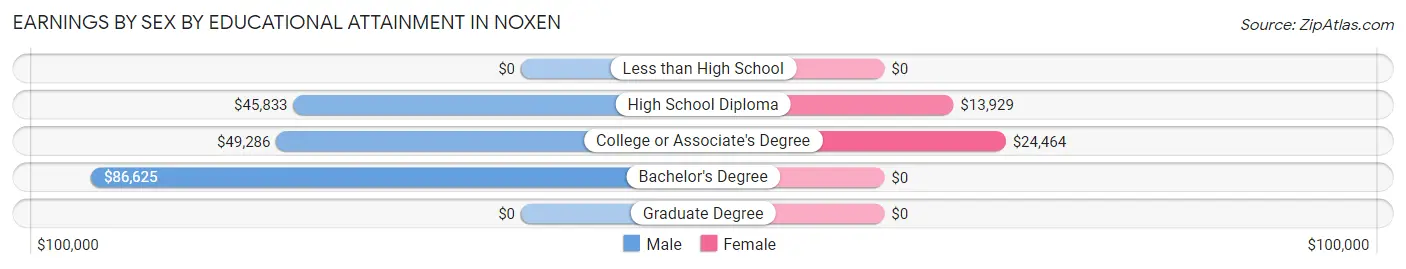
Earnings by Sex by Educational Attainment in Noxen
Average earnings in Noxen are $53,047 for men and $20,625 for women, a difference of 61.1%. Men with an educational attainment of bachelor's degree enjoy the highest average annual earnings of $86,625, while those with high school diploma education earn the least with $45,833. Women with an educational attainment of college or associate's degree earn the most with the average annual earnings of $24,464, while those with high school diploma education have the smallest earnings of $13,929.
| Educational Attainment | Male Income | Female Income |
| Less than High School | - | - |
| High School Diploma | $45,833 | $13,929 |
| College or Associate's Degree | $49,286 | $24,464 |
| Bachelor's Degree | $86,625 | $0 |
| Graduate Degree | - | - |
| Total | $53,047 | $20,625 |
Family Income in Noxen
Family Income Brackets in Noxen
According to the Noxen family income data, there are 37 families falling into the $35,000 to $49,999 income range, which is the most common income bracket and makes up 21.6% of all families.
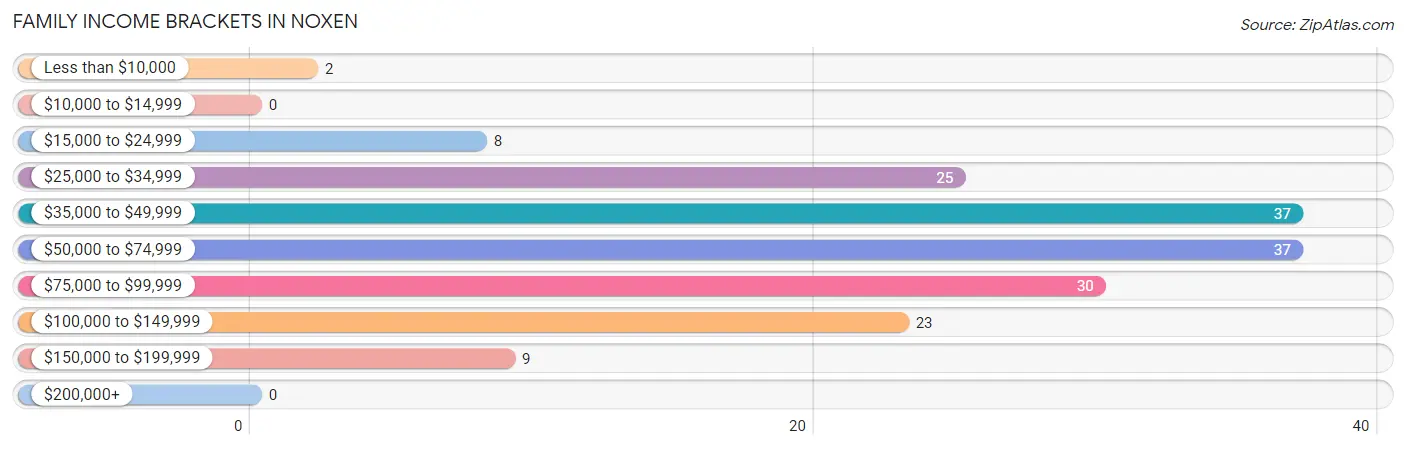
| Income Bracket | # Families | % Families |
| Less than $10,000 | 2 | 1.2% |
| $10,000 to $14,999 | 0 | 0.0% |
| $15,000 to $24,999 | 8 | 4.7% |
| $25,000 to $34,999 | 25 | 14.6% |
| $35,000 to $49,999 | 37 | 21.6% |
| $50,000 to $74,999 | 37 | 21.6% |
| $75,000 to $99,999 | 30 | 17.5% |
| $100,000 to $149,999 | 23 | 13.5% |
| $150,000 to $199,999 | 9 | 5.3% |
| $200,000+ | 0 | 0.0% |
Family Income by Famaliy Size in Noxen
3-person families (19 | 11.1%) account for the highest median family income in Noxen with $76,250 per family, while 2-person families (120 | 70.2%) have the highest median income of $28,334 per family member.
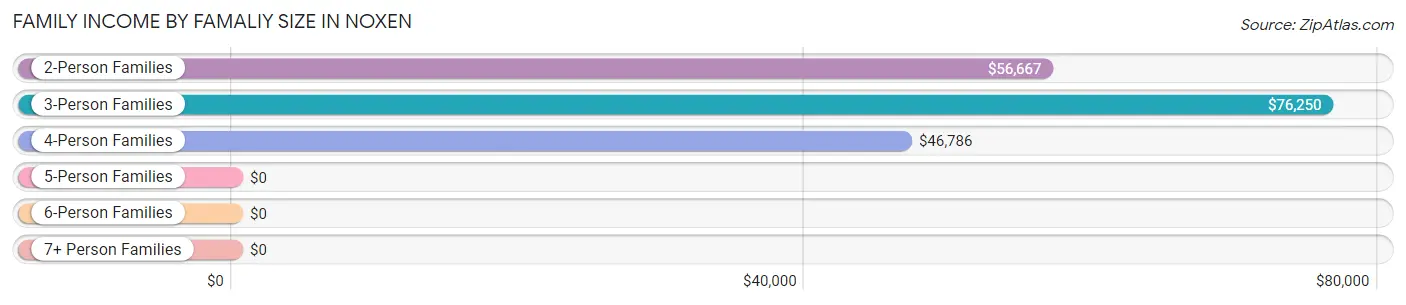
| Income Bracket | # Families | Median Income |
| 2-Person Families | 120 (70.2%) | $56,667 |
| 3-Person Families | 19 (11.1%) | $76,250 |
| 4-Person Families | 24 (14.0%) | $46,786 |
| 5-Person Families | 5 (2.9%) | $0 |
| 6-Person Families | 3 (1.8%) | $0 |
| 7+ Person Families | 0 (0.0%) | $0 |
| Total | 171 (100.0%) | $57,396 |
Family Income by Number of Earners in Noxen
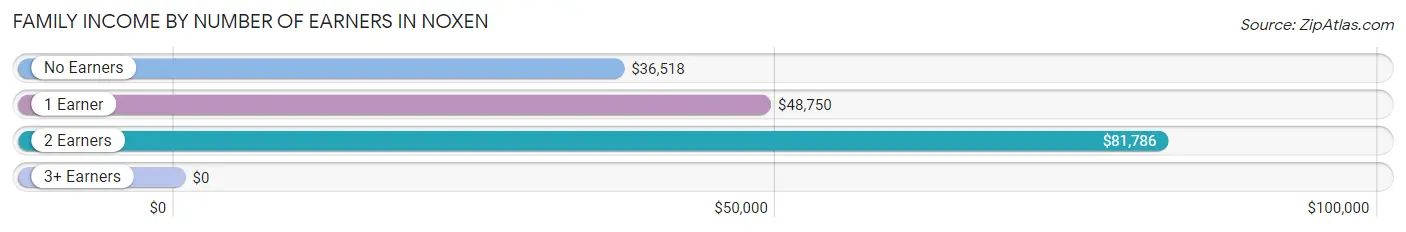
| Number of Earners | # Families | Median Income |
| No Earners | 65 (38.0%) | $36,518 |
| 1 Earner | 34 (19.9%) | $48,750 |
| 2 Earners | 66 (38.6%) | $81,786 |
| 3+ Earners | 6 (3.5%) | $0 |
| Total | 171 (100.0%) | $57,396 |
Household Income in Noxen
Household Income Brackets in Noxen
With 71 households falling in the category, the $50,000 to $74,999 income range is the most frequent in Noxen, accounting for 26.6% of all households.
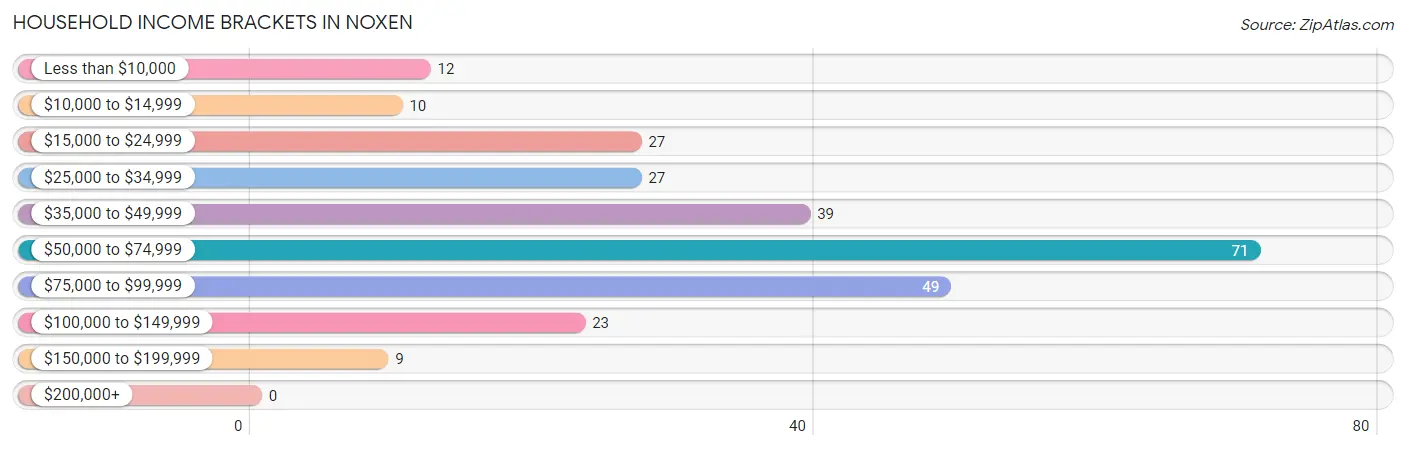
| Income Bracket | # Households | % Households |
| Less than $10,000 | 12 | 4.5% |
| $10,000 to $14,999 | 10 | 3.7% |
| $15,000 to $24,999 | 27 | 10.1% |
| $25,000 to $34,999 | 27 | 10.1% |
| $35,000 to $49,999 | 39 | 14.6% |
| $50,000 to $74,999 | 71 | 26.6% |
| $75,000 to $99,999 | 49 | 18.4% |
| $100,000 to $149,999 | 23 | 8.6% |
| $150,000 to $199,999 | 9 | 3.4% |
| $200,000+ | 0 | 0.0% |
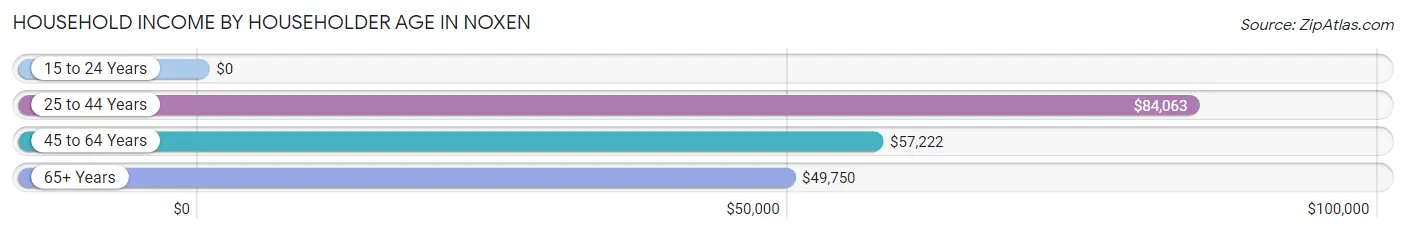
Household Income by Householder Age in Noxen
The median household income in Noxen is $62,898, with the highest median household income of $84,063 found in the 25 to 44 years age bracket for the primary householder. A total of 44 households (16.5%) fall into this category. Meanwhile, the 15 to 24 years age bracket for the primary householder has the lowest median household income of $0, with 10 households (3.7%) in this group.
| Income Bracket | # Households | Median Income |
| 15 to 24 Years | 10 (3.7%) | $0 |
| 25 to 44 Years | 44 (16.5%) | $84,063 |
| 45 to 64 Years | 68 (25.5%) | $57,222 |
| 65+ Years | 145 (54.3%) | $49,750 |
| Total | 267 (100.0%) | $62,898 |
Poverty in Noxen
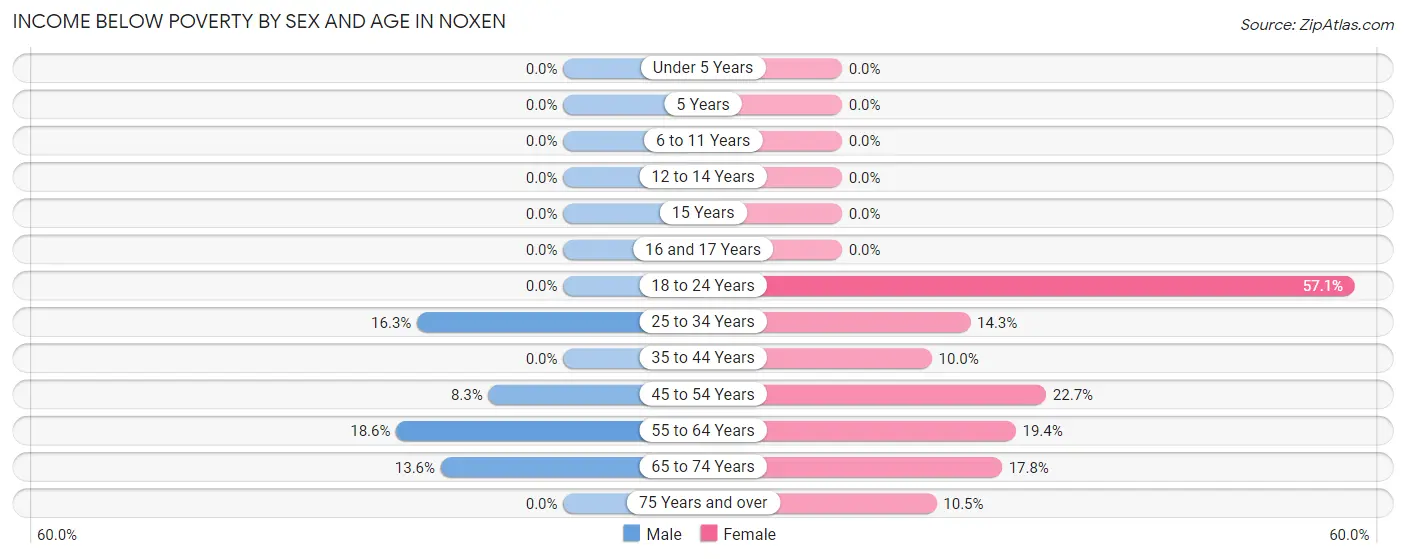
Income Below Poverty by Sex and Age in Noxen
With 9.1% poverty level for males and 17.3% for females among the residents of Noxen, 55 to 64 year old males and 18 to 24 year old females are the most vulnerable to poverty, with 8 males (18.6%) and 16 females (57.1%) in their respective age groups living below the poverty level.
| Age Bracket | Male | Female |
| Under 5 Years | 0 (0.0%) | 0 (0.0%) |
| 5 Years | 0 (0.0%) | 0 (0.0%) |
| 6 to 11 Years | 0 (0.0%) | 0 (0.0%) |
| 12 to 14 Years | 0 (0.0%) | 0 (0.0%) |
| 15 Years | 0 (0.0%) | 0 (0.0%) |
| 16 and 17 Years | 0 (0.0%) | 0 (0.0%) |
| 18 to 24 Years | 0 (0.0%) | 16 (57.1%) |
| 25 to 34 Years | 7 (16.3%) | 6 (14.3%) |
| 35 to 44 Years | 0 (0.0%) | 3 (10.0%) |
| 45 to 54 Years | 2 (8.3%) | 5 (22.7%) |
| 55 to 64 Years | 8 (18.6%) | 6 (19.4%) |
| 65 to 74 Years | 9 (13.6%) | 13 (17.8%) |
| 75 Years and over | 0 (0.0%) | 6 (10.5%) |
| Total | 26 (9.1%) | 55 (17.3%) |
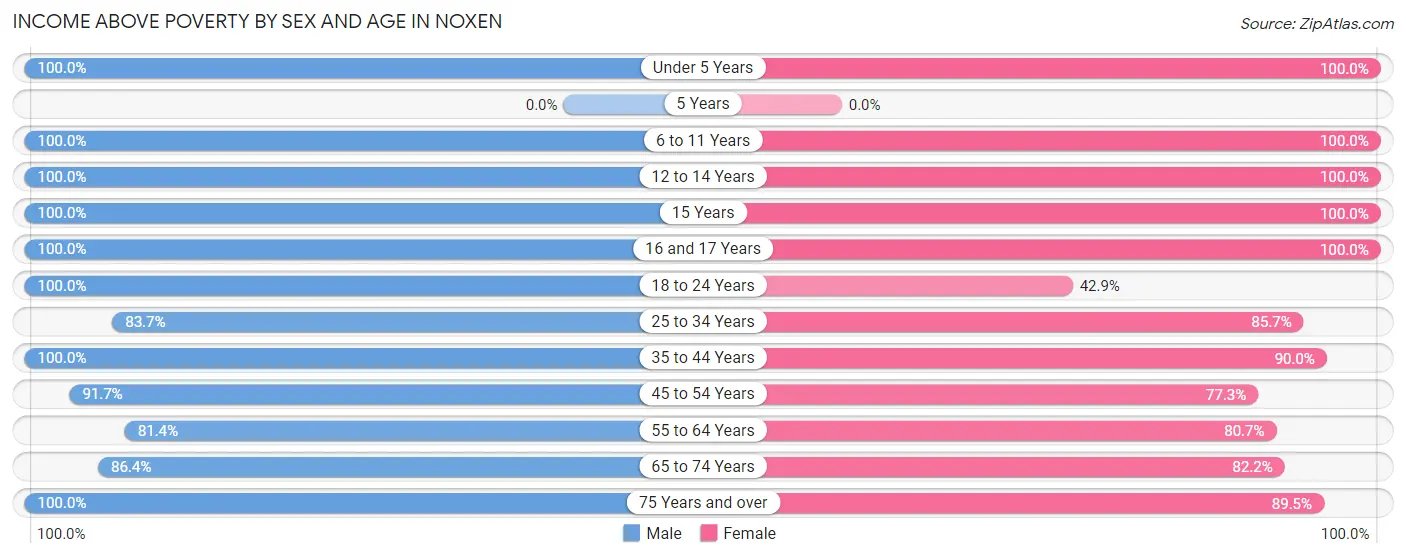
Income Above Poverty by Sex and Age in Noxen
According to the poverty statistics in Noxen, males aged under 5 years and females aged under 5 years are the age groups that are most secure financially, with 100.0% of males and 100.0% of females in these age groups living above the poverty line.
| Age Bracket | Male | Female |
| Under 5 Years | 8 (100.0%) | 5 (100.0%) |
| 5 Years | 0 (0.0%) | 0 (0.0%) |
| 6 to 11 Years | 8 (100.0%) | 14 (100.0%) |
| 12 to 14 Years | 17 (100.0%) | 2 (100.0%) |
| 15 Years | 2 (100.0%) | 7 (100.0%) |
| 16 and 17 Years | 10 (100.0%) | 7 (100.0%) |
| 18 to 24 Years | 25 (100.0%) | 12 (42.9%) |
| 25 to 34 Years | 36 (83.7%) | 36 (85.7%) |
| 35 to 44 Years | 11 (100.0%) | 27 (90.0%) |
| 45 to 54 Years | 22 (91.7%) | 17 (77.3%) |
| 55 to 64 Years | 35 (81.4%) | 25 (80.6%) |
| 65 to 74 Years | 57 (86.4%) | 60 (82.2%) |
| 75 Years and over | 28 (100.0%) | 51 (89.5%) |
| Total | 259 (90.9%) | 263 (82.7%) |
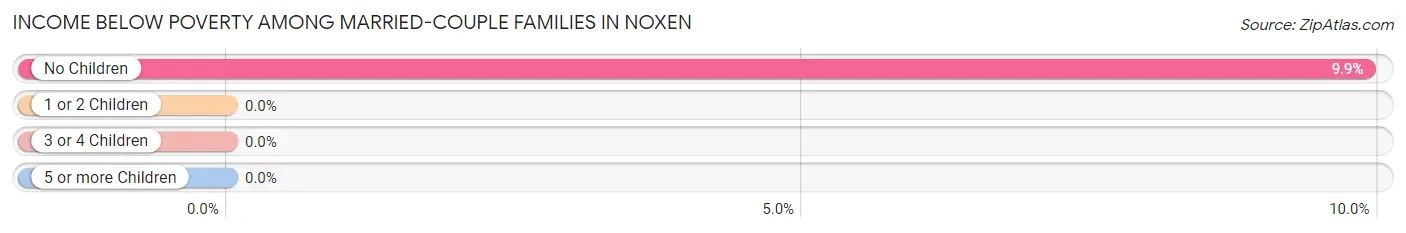
Income Below Poverty Among Married-Couple Families in Noxen
The poverty statistics for married-couple families in Noxen show that 8.0% or 10 of the total 125 families live below the poverty line. Families with no children have the highest poverty rate of 9.9%, comprising of 10 families. On the other hand, families with 1 or 2 children have the lowest poverty rate of 0.0%, which includes 0 families.
| Children | Above Poverty | Below Poverty |
| No Children | 91 (90.1%) | 10 (9.9%) |
| 1 or 2 Children | 21 (100.0%) | 0 (0.0%) |
| 3 or 4 Children | 3 (100.0%) | 0 (0.0%) |
| 5 or more Children | 0 (0.0%) | 0 (0.0%) |
| Total | 115 (92.0%) | 10 (8.0%) |
Income Below Poverty Among Single-Parent Households in Noxen
| Children | Single Father | Single Mother |
| No Children | 0 (0.0%) | 0 (0.0%) |
| 1 or 2 Children | 0 (0.0%) | 0 (0.0%) |
| 3 or 4 Children | 0 (0.0%) | 0 (0.0%) |
| 5 or more Children | 0 (0.0%) | 0 (0.0%) |
| Total | 0 (0.0%) | 0 (0.0%) |
Income Below Poverty Among Married-Couple vs Single-Parent Households in Noxen
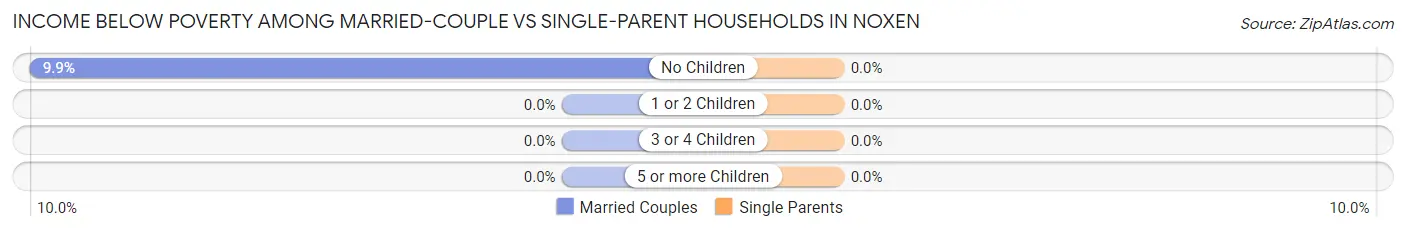
| Children | Married-Couple Families | Single-Parent Households |
| No Children | 10 (9.9%) | 0 (0.0%) |
| 1 or 2 Children | 0 (0.0%) | 0 (0.0%) |
| 3 or 4 Children | 0 (0.0%) | 0 (0.0%) |
| 5 or more Children | 0 (0.0%) | 0 (0.0%) |
| Total | 10 (8.0%) | 0 (0.0%) |
Race in Noxen
The most populous races in Noxen are White / Caucasian (593 | 98.3%), and Two or more Races (10 | 1.7%).
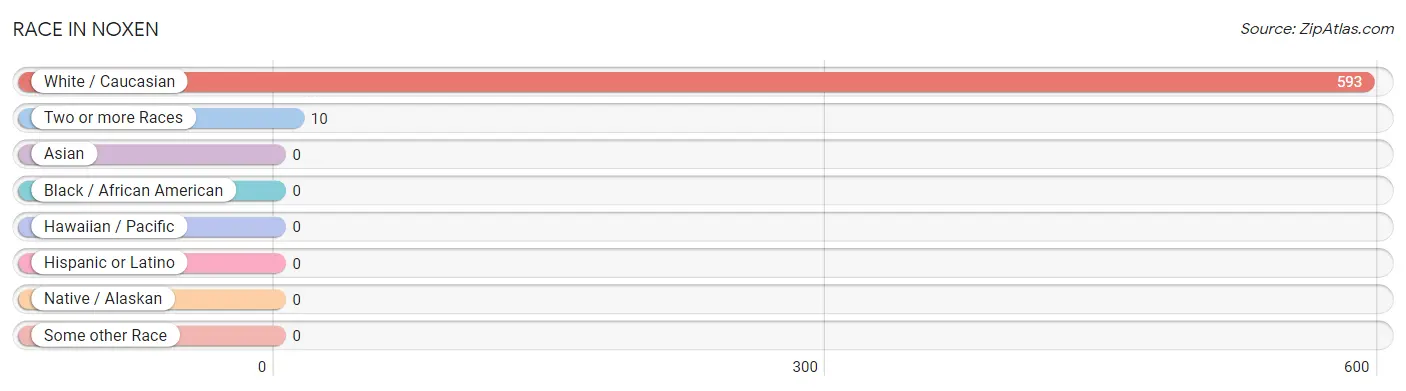
| Race | # Population | % Population |
| Asian | 0 | 0.0% |
| Black / African American | 0 | 0.0% |
| Hawaiian / Pacific | 0 | 0.0% |
| Hispanic or Latino | 0 | 0.0% |
| Native / Alaskan | 0 | 0.0% |
| White / Caucasian | 593 | 98.3% |
| Two or more Races | 10 | 1.7% |
| Some other Race | 0 | 0.0% |
| Total | 603 | 100.0% |
Ancestry in Noxen
The most populous ancestries reported in Noxen are Irish (101 | 16.8%), German (99 | 16.4%), English (92 | 15.3%), Italian (50 | 8.3%), and Polish (49 | 8.1%), together accounting for 64.9% of all Noxen residents.
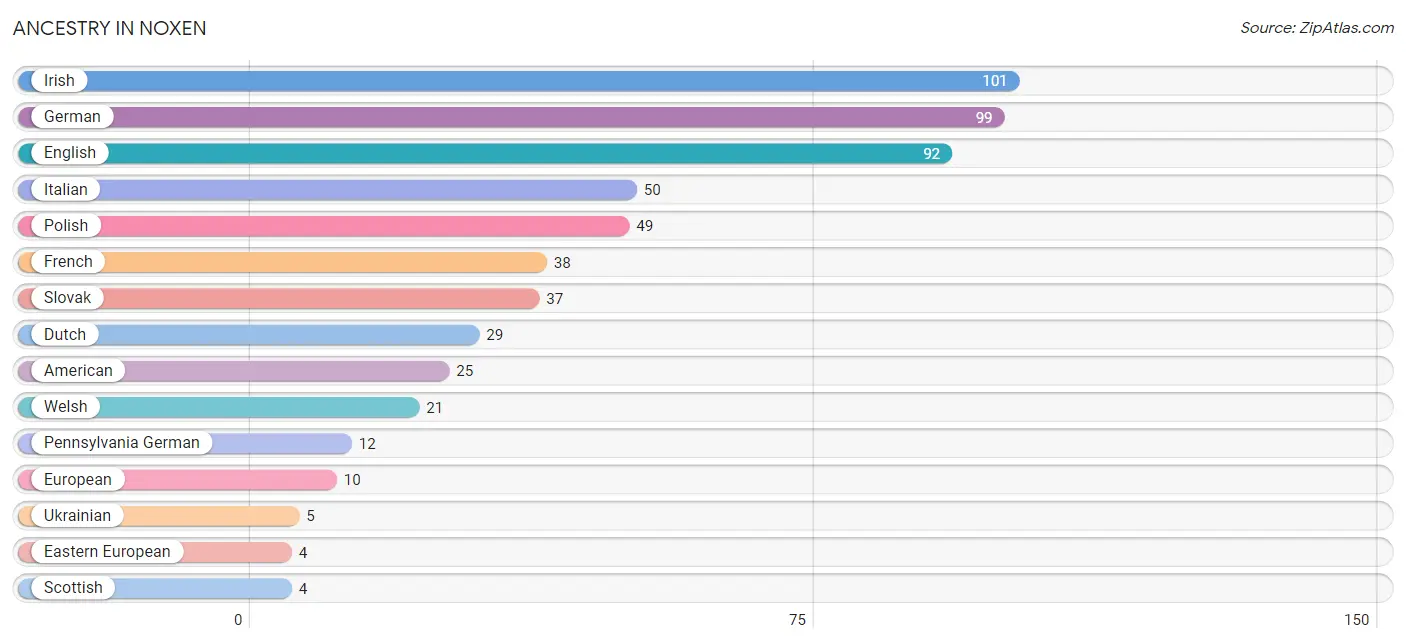
| Ancestry | # Population | % Population |
| American | 25 | 4.2% |
| Czech | 3 | 0.5% |
| Delaware | 2 | 0.3% |
| Dutch | 29 | 4.8% |
| Eastern European | 4 | 0.7% |
| English | 92 | 15.3% |
| European | 10 | 1.7% |
| French | 38 | 6.3% |
| German | 99 | 16.4% |
| Irish | 101 | 16.8% |
| Italian | 50 | 8.3% |
| Pennsylvania German | 12 | 2.0% |
| Polish | 49 | 8.1% |
| Russian | 2 | 0.3% |
| Scotch-Irish | 3 | 0.5% |
| Scottish | 4 | 0.7% |
| Slovak | 37 | 6.1% |
| Swedish | 3 | 0.5% |
| Ukrainian | 5 | 0.8% |
| Welsh | 21 | 3.5% | View All 20 Rows |
Immigrants in Noxen

| Immigration Origin | # Population | % Population | View All 0 Rows |
Sex and Age in Noxen
Sex and Age in Noxen
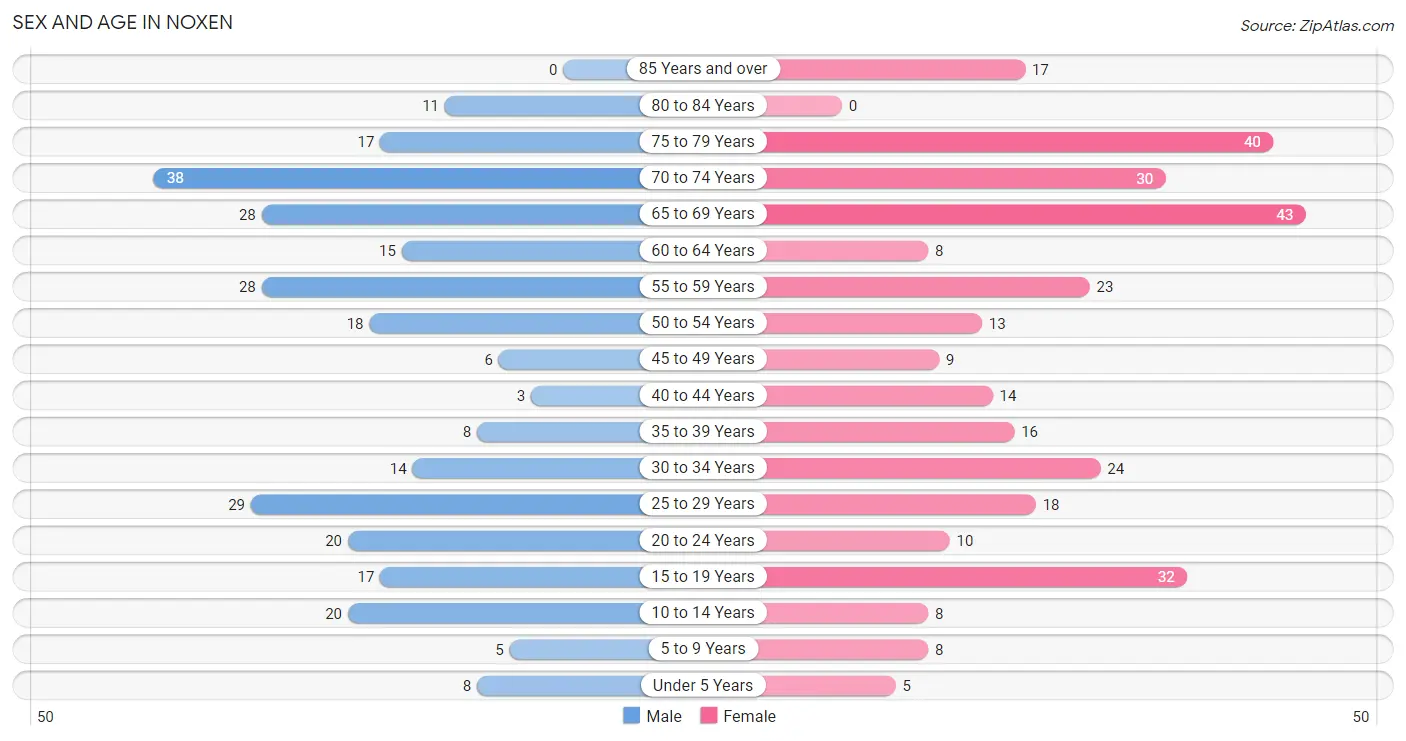
The most populous age groups in Noxen are 70 to 74 Years (38 | 13.3%) for men and 65 to 69 Years (43 | 13.5%) for women.
| Age Bracket | Male | Female |
| Under 5 Years | 8 (2.8%) | 5 (1.6%) |
| 5 to 9 Years | 5 (1.8%) | 8 (2.5%) |
| 10 to 14 Years | 20 (7.0%) | 8 (2.5%) |
| 15 to 19 Years | 17 (6.0%) | 32 (10.1%) |
| 20 to 24 Years | 20 (7.0%) | 10 (3.1%) |
| 25 to 29 Years | 29 (10.2%) | 18 (5.7%) |
| 30 to 34 Years | 14 (4.9%) | 24 (7.5%) |
| 35 to 39 Years | 8 (2.8%) | 16 (5.0%) |
| 40 to 44 Years | 3 (1.1%) | 14 (4.4%) |
| 45 to 49 Years | 6 (2.1%) | 9 (2.8%) |
| 50 to 54 Years | 18 (6.3%) | 13 (4.1%) |
| 55 to 59 Years | 28 (9.8%) | 23 (7.2%) |
| 60 to 64 Years | 15 (5.3%) | 8 (2.5%) |
| 65 to 69 Years | 28 (9.8%) | 43 (13.5%) |
| 70 to 74 Years | 38 (13.3%) | 30 (9.4%) |
| 75 to 79 Years | 17 (6.0%) | 40 (12.6%) |
| 80 to 84 Years | 11 (3.9%) | 0 (0.0%) |
| 85 Years and over | 0 (0.0%) | 17 (5.3%) |
| Total | 285 (100.0%) | 318 (100.0%) |
Families and Households in Noxen
Median Family Size in Noxen
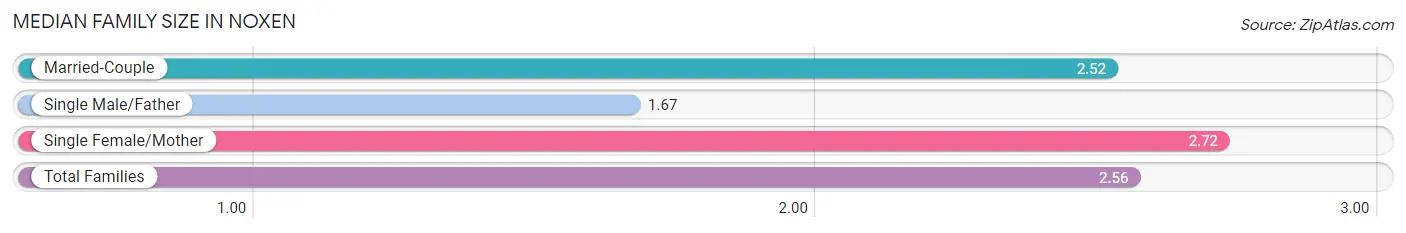
The median family size in Noxen is 2.56 persons per family, with single female/mother families (43 | 25.2%) accounting for the largest median family size of 2.72 persons per family. On the other hand, single male/father families (3 | 1.8%) represent the smallest median family size with 1.67 persons per family.
| Family Type | # Families | Family Size |
| Married-Couple | 125 (73.1%) | 2.52 |
| Single Male/Father | 3 (1.8%) | 1.67 |
| Single Female/Mother | 43 (25.2%) | 2.72 |
| Total Families | 171 (100.0%) | 2.56 |
Median Household Size in Noxen
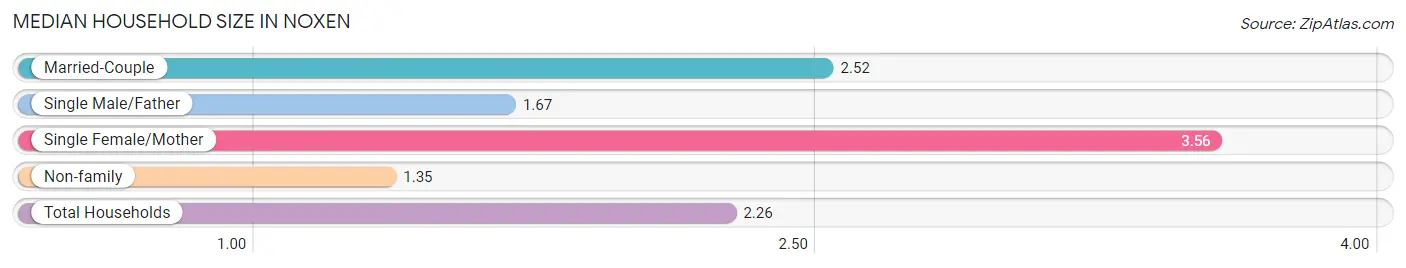
The median household size in Noxen is 2.26 persons per household, with single female/mother households (43 | 16.1%) accounting for the largest median household size of 3.56 persons per household. non-family households (96 | 36.0%) represent the smallest median household size with 1.35 persons per household.
| Household Type | # Households | Household Size |
| Married-Couple | 125 (46.8%) | 2.52 |
| Single Male/Father | 3 (1.1%) | 1.67 |
| Single Female/Mother | 43 (16.1%) | 3.56 |
| Non-family | 96 (36.0%) | 1.35 |
| Total Households | 267 (100.0%) | 2.26 |
Household Size by Marriage Status in Noxen
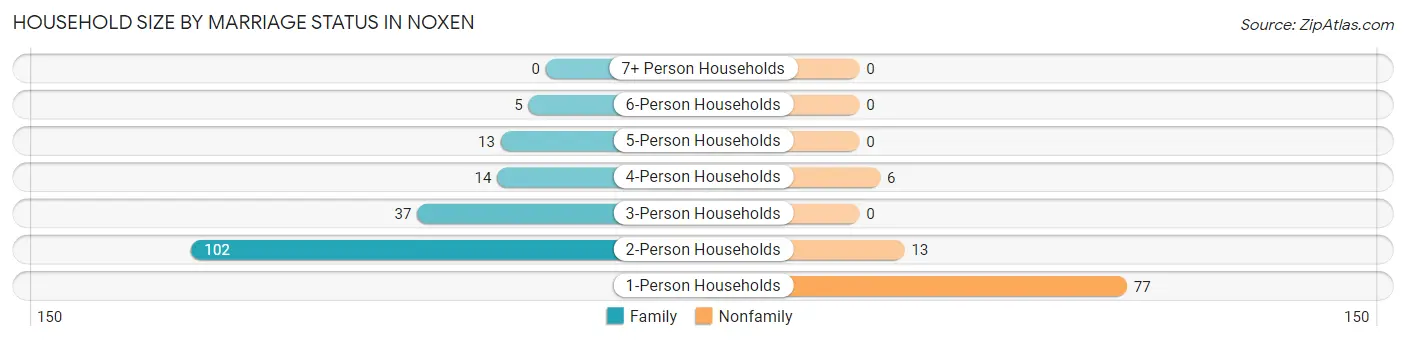
Out of a total of 267 households in Noxen, 171 (64.0%) are family households, while 96 (36.0%) are nonfamily households. The most numerous type of family households are 2-person households, comprising 102, and the most common type of nonfamily households are 1-person households, comprising 77.
| Household Size | Family Households | Nonfamily Households |
| 1-Person Households | - | 77 (28.8%) |
| 2-Person Households | 102 (38.2%) | 13 (4.9%) |
| 3-Person Households | 37 (13.9%) | 0 (0.0%) |
| 4-Person Households | 14 (5.2%) | 6 (2.2%) |
| 5-Person Households | 13 (4.9%) | 0 (0.0%) |
| 6-Person Households | 5 (1.9%) | 0 (0.0%) |
| 7+ Person Households | 0 (0.0%) | 0 (0.0%) |
| Total | 171 (64.0%) | 96 (36.0%) |
Female Fertility in Noxen
Fertility by Age in Noxen
Average fertility rate in Noxen is 24.0 births per 1,000 women. Women in the age bracket of 20 to 34 years have the highest fertility rate with 58.0 births per 1,000 women. Women in the age bracket of 20 to 34 years acount for 100.0% of all women with births.
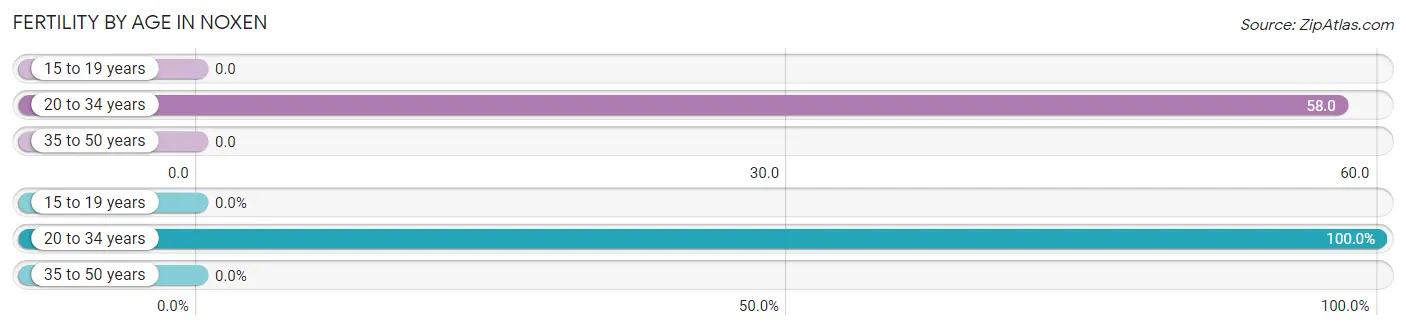
| Age Bracket | Women with Births | Births / 1,000 Women |
| 15 to 19 years | 0 (0.0%) | 0.0 |
| 20 to 34 years | 3 (100.0%) | 58.0 |
| 35 to 50 years | 0 (0.0%) | 0.0 |
| Total | 3 (100.0%) | 24.0 |
Fertility by Age by Marriage Status in Noxen
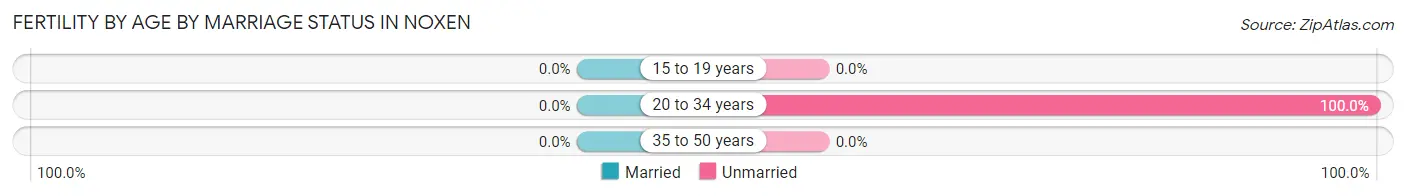
| Age Bracket | Married | Unmarried |
| 15 to 19 years | 0 (0.0%) | 0 (0.0%) |
| 20 to 34 years | 0 (0.0%) | 3 (100.0%) |
| 35 to 50 years | 0 (0.0%) | 0 (0.0%) |
| Total | 0 (0.0%) | 3 (100.0%) |
Fertility by Education in Noxen
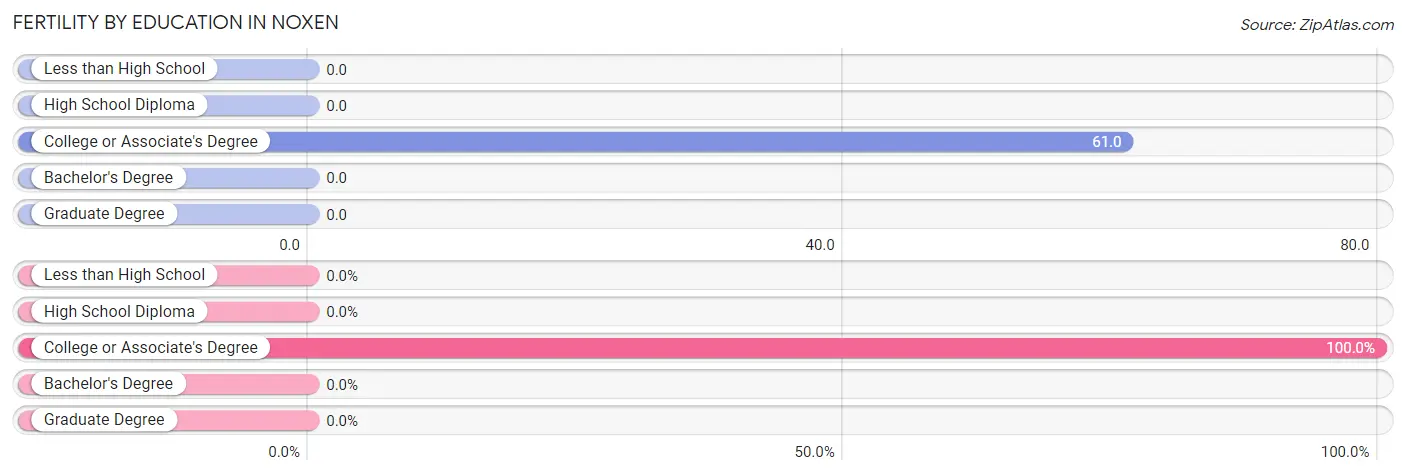
| Educational Attainment | Women with Births | Births / 1,000 Women |
| Less than High School | 0 (0.0%) | 0.0 |
| High School Diploma | 0 (0.0%) | 0.0 |
| College or Associate's Degree | 3 (100.0%) | 61.0 |
| Bachelor's Degree | 0 (0.0%) | 0.0 |
| Graduate Degree | 0 (0.0%) | 0.0 |
| Total | 3 (100.0%) | 24.0 |
Fertility by Education by Marriage Status in Noxen
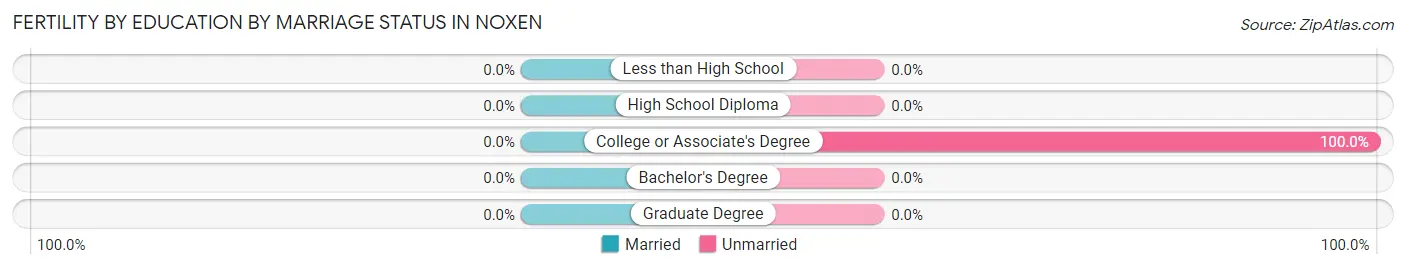
| Educational Attainment | Married | Unmarried |
| Less than High School | 0 (0.0%) | 0 (0.0%) |
| High School Diploma | 0 (0.0%) | 0 (0.0%) |
| College or Associate's Degree | 0 (0.0%) | 3 (100.0%) |
| Bachelor's Degree | 0 (0.0%) | 0 (0.0%) |
| Graduate Degree | 0 (0.0%) | 0 (0.0%) |
| Total | 0 (0.0%) | 3 (100.0%) |
Employment Characteristics in Noxen
Employment by Class of Employer in Noxen
Among the 224 employed individuals in Noxen, private company employees (179 | 79.9%), self-employed (not incorporated) (16 | 7.1%), and not-for-profit organizations (12 | 5.4%) make up the most common classes of employment.
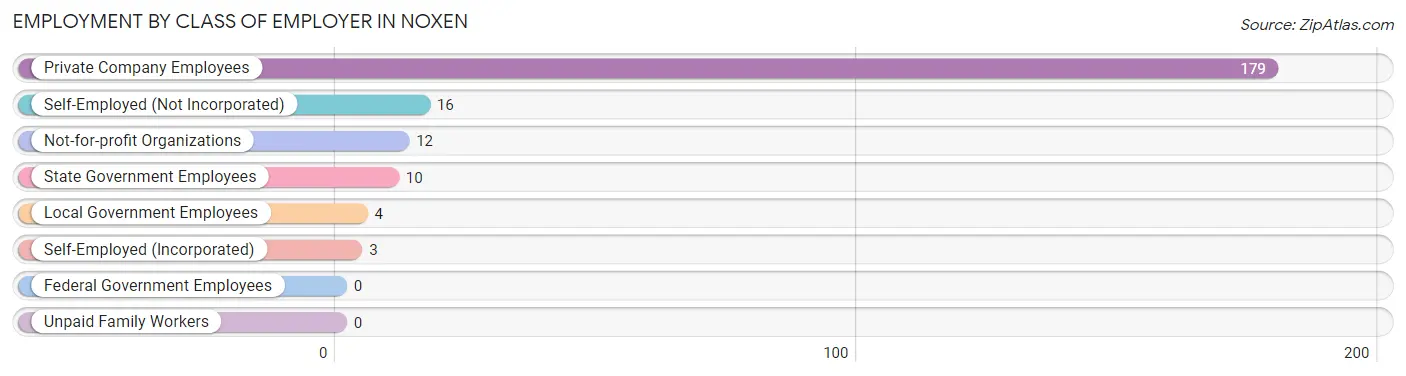
| Employer Class | # Employees | % Employees |
| Private Company Employees | 179 | 79.9% |
| Self-Employed (Incorporated) | 3 | 1.3% |
| Self-Employed (Not Incorporated) | 16 | 7.1% |
| Not-for-profit Organizations | 12 | 5.4% |
| Local Government Employees | 4 | 1.8% |
| State Government Employees | 10 | 4.5% |
| Federal Government Employees | 0 | 0.0% |
| Unpaid Family Workers | 0 | 0.0% |
| Total | 224 | 100.0% |
Employment Status by Age in Noxen
According to the labor force statistics for Noxen, out of the total population over 16 years of age (540), 51.3% or 277 individuals are in the labor force, with 17.3% or 48 of them unemployed. The age group with the highest labor force participation rate is 20 to 24 years, with 100.0% or 30 individuals in the labor force. Within the labor force, the 16 to 19 years age range has the highest percentage of unemployed individuals, with 39.4% or 13 of them being unemployed.
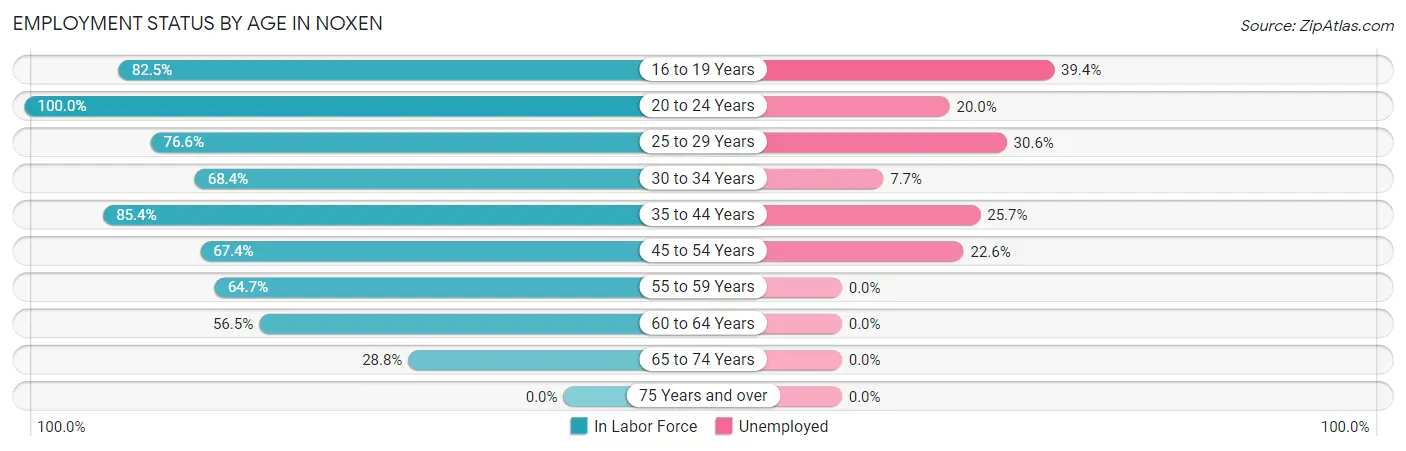
| Age Bracket | In Labor Force | Unemployed |
| 16 to 19 Years | 33 (82.5%) | 13 (39.4%) |
| 20 to 24 Years | 30 (100.0%) | 6 (20.0%) |
| 25 to 29 Years | 36 (76.6%) | 11 (30.6%) |
| 30 to 34 Years | 26 (68.4%) | 2 (7.7%) |
| 35 to 44 Years | 35 (85.4%) | 9 (25.7%) |
| 45 to 54 Years | 31 (67.4%) | 7 (22.6%) |
| 55 to 59 Years | 33 (64.7%) | 0 (0.0%) |
| 60 to 64 Years | 13 (56.5%) | 0 (0.0%) |
| 65 to 74 Years | 40 (28.8%) | 0 (0.0%) |
| 75 Years and over | 0 (0.0%) | 0 (0.0%) |
| Total | 277 (51.3%) | 48 (17.3%) |
Employment Status by Educational Attainment in Noxen
According to labor force statistics for Noxen, 70.7% of individuals (174) out of the total population between 25 and 64 years of age (246) are in the labor force, with 16.7% or 29 of them being unemployed. The group with the highest labor force participation rate are those with the educational attainment of bachelor's degree or higher, with 85.7% or 30 individuals in the labor force. Within the labor force, individuals with less than high school education have the highest percentage of unemployment, with 66.7% or 6 of them being unemployed.
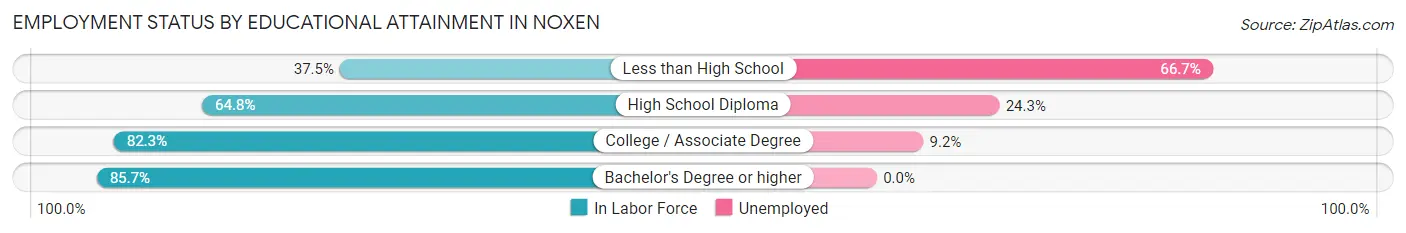
| Educational Attainment | In Labor Force | Unemployed |
| Less than High School | 9 (37.5%) | 16 (66.7%) |
| High School Diploma | 70 (64.8%) | 26 (24.3%) |
| College / Associate Degree | 65 (82.3%) | 7 (9.2%) |
| Bachelor's Degree or higher | 30 (85.7%) | 0 (0.0%) |
| Total | 174 (70.7%) | 41 (16.7%) |
Employment Occupations by Sex in Noxen
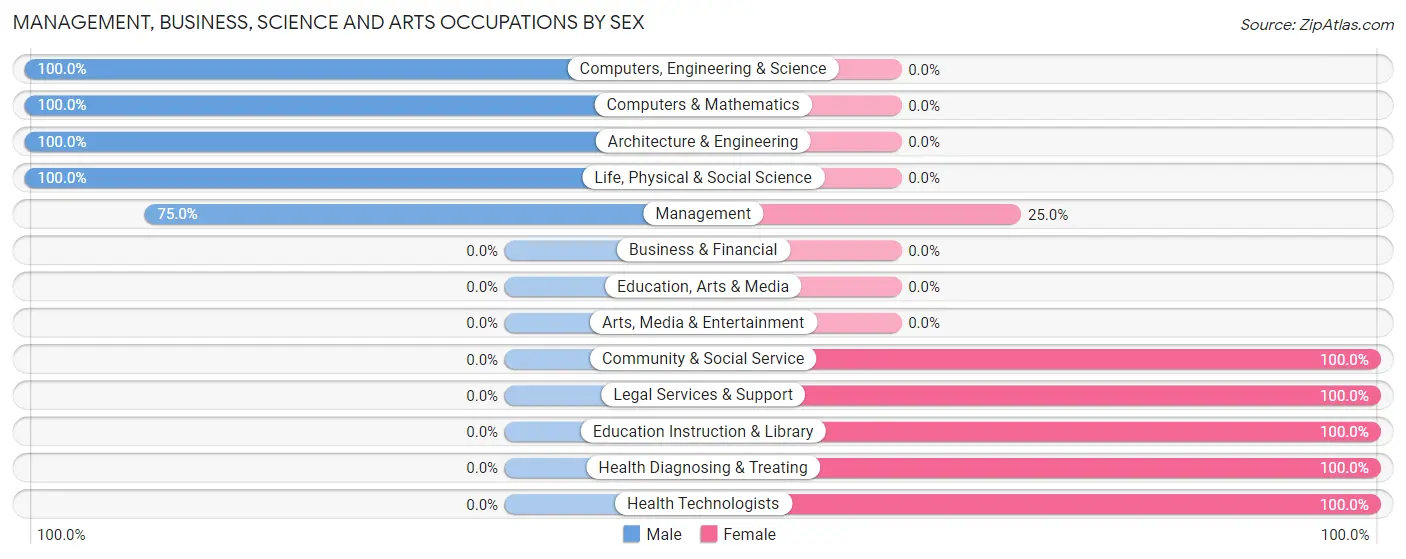
Management, Business, Science and Arts Occupations
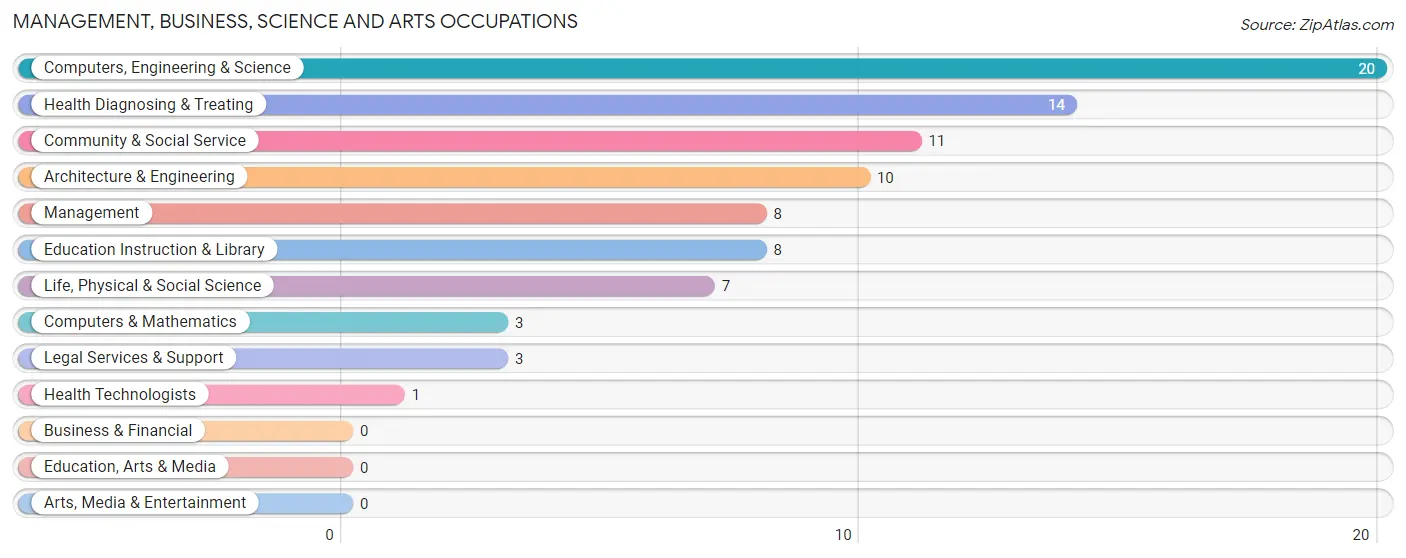
The most common Management, Business, Science and Arts occupations in Noxen are Computers, Engineering & Science (20 | 8.7%), Health Diagnosing & Treating (14 | 6.1%), Community & Social Service (11 | 4.8%), Architecture & Engineering (10 | 4.4%), and Management (8 | 3.5%).
Management, Business, Science and Arts Occupations by Sex
Within the Management, Business, Science and Arts occupations in Noxen, the most male-oriented occupations are Computers, Engineering & Science (100.0%), Computers & Mathematics (100.0%), and Architecture & Engineering (100.0%), while the most female-oriented occupations are Community & Social Service (100.0%), Legal Services & Support (100.0%), and Education Instruction & Library (100.0%).
| Occupation | Male | Female |
| Management | 6 (75.0%) | 2 (25.0%) |
| Business & Financial | 0 (0.0%) | 0 (0.0%) |
| Computers, Engineering & Science | 20 (100.0%) | 0 (0.0%) |
| Computers & Mathematics | 3 (100.0%) | 0 (0.0%) |
| Architecture & Engineering | 10 (100.0%) | 0 (0.0%) |
| Life, Physical & Social Science | 7 (100.0%) | 0 (0.0%) |
| Community & Social Service | 0 (0.0%) | 11 (100.0%) |
| Education, Arts & Media | 0 (0.0%) | 0 (0.0%) |
| Legal Services & Support | 0 (0.0%) | 3 (100.0%) |
| Education Instruction & Library | 0 (0.0%) | 8 (100.0%) |
| Arts, Media & Entertainment | 0 (0.0%) | 0 (0.0%) |
| Health Diagnosing & Treating | 0 (0.0%) | 14 (100.0%) |
| Health Technologists | 0 (0.0%) | 1 (100.0%) |
| Total (Category) | 26 (49.1%) | 27 (50.9%) |
| Total (Overall) | 136 (59.4%) | 93 (40.6%) |
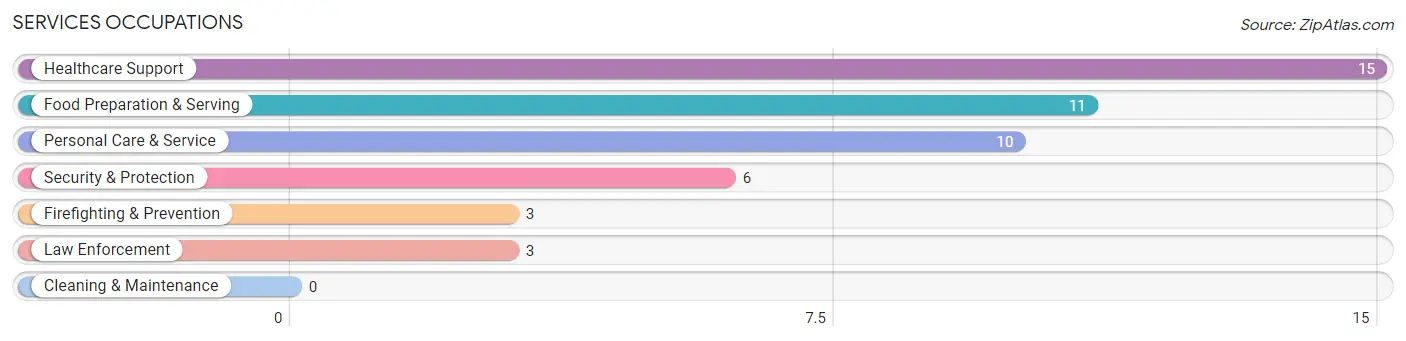
Services Occupations
The most common Services occupations in Noxen are Healthcare Support (15 | 6.6%), Food Preparation & Serving (11 | 4.8%), Personal Care & Service (10 | 4.4%), Security & Protection (6 | 2.6%), and Firefighting & Prevention (3 | 1.3%).
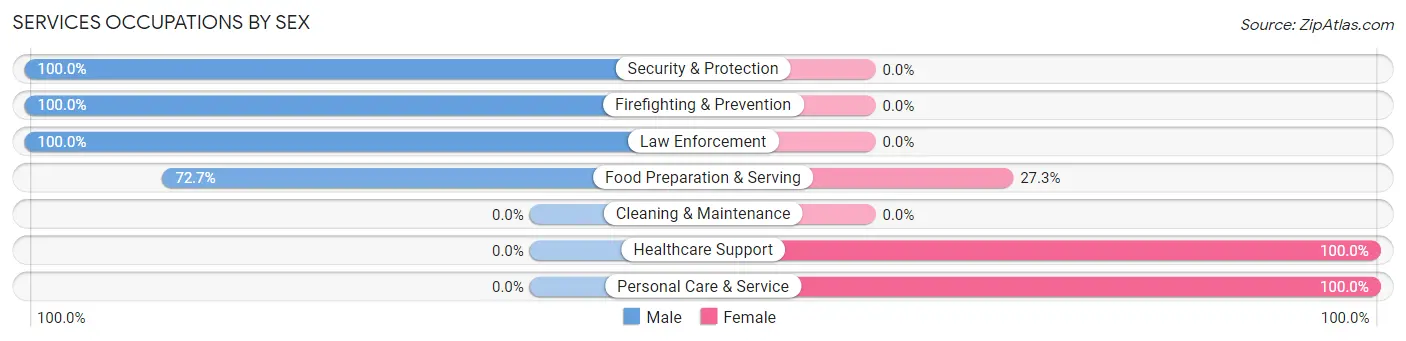
Services Occupations by Sex
Within the Services occupations in Noxen, the most male-oriented occupations are Security & Protection (100.0%), Firefighting & Prevention (100.0%), and Law Enforcement (100.0%), while the most female-oriented occupations are Healthcare Support (100.0%), Personal Care & Service (100.0%), and Food Preparation & Serving (27.3%).
| Occupation | Male | Female |
| Healthcare Support | 0 (0.0%) | 15 (100.0%) |
| Security & Protection | 6 (100.0%) | 0 (0.0%) |
| Firefighting & Prevention | 3 (100.0%) | 0 (0.0%) |
| Law Enforcement | 3 (100.0%) | 0 (0.0%) |
| Food Preparation & Serving | 8 (72.7%) | 3 (27.3%) |
| Cleaning & Maintenance | 0 (0.0%) | 0 (0.0%) |
| Personal Care & Service | 0 (0.0%) | 10 (100.0%) |
| Total (Category) | 14 (33.3%) | 28 (66.7%) |
| Total (Overall) | 136 (59.4%) | 93 (40.6%) |
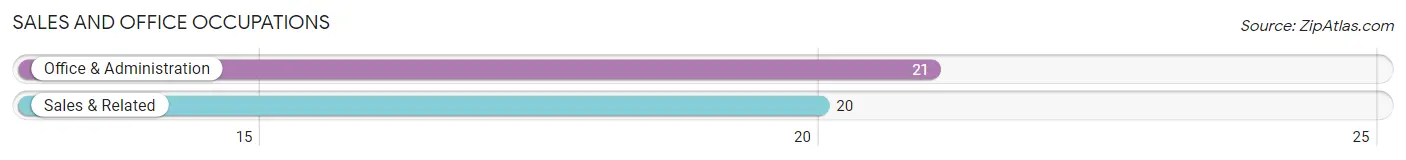
Sales and Office Occupations
The most common Sales and Office occupations in Noxen are Office & Administration (21 | 9.2%), and Sales & Related (20 | 8.7%).
Sales and Office Occupations by Sex
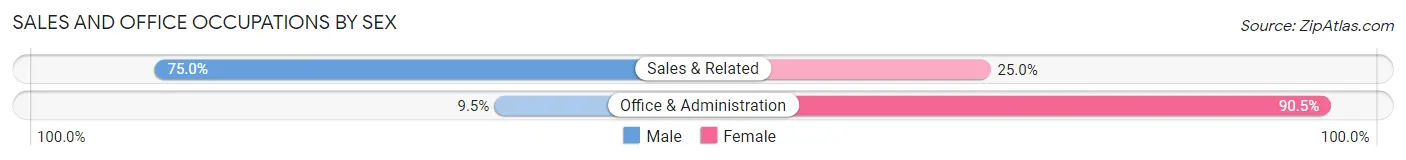
| Occupation | Male | Female |
| Sales & Related | 15 (75.0%) | 5 (25.0%) |
| Office & Administration | 2 (9.5%) | 19 (90.5%) |
| Total (Category) | 17 (41.5%) | 24 (58.5%) |
| Total (Overall) | 136 (59.4%) | 93 (40.6%) |
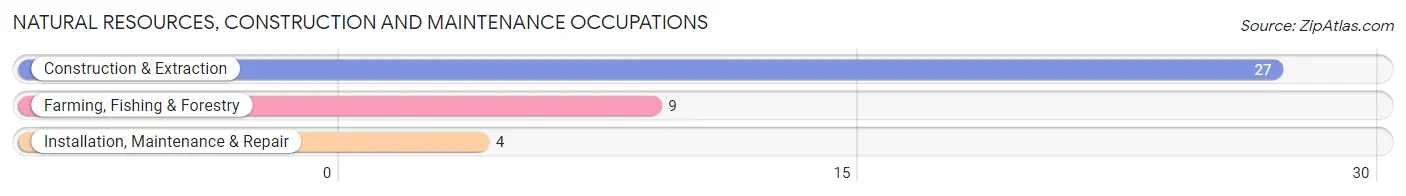
Natural Resources, Construction and Maintenance Occupations
The most common Natural Resources, Construction and Maintenance occupations in Noxen are Construction & Extraction (27 | 11.8%), Farming, Fishing & Forestry (9 | 3.9%), and Installation, Maintenance & Repair (4 | 1.8%).
Natural Resources, Construction and Maintenance Occupations by Sex
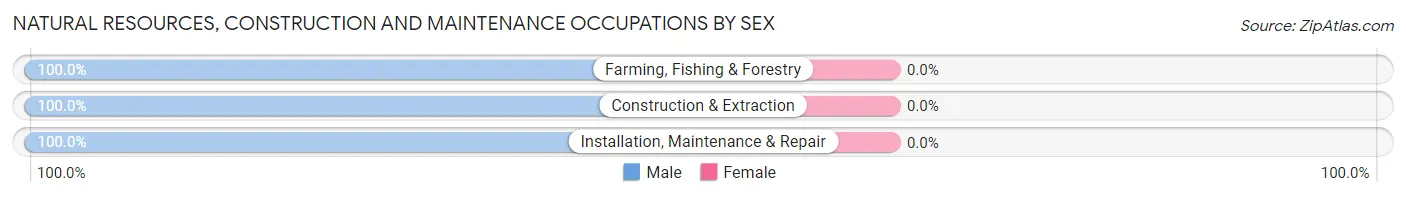
| Occupation | Male | Female |
| Farming, Fishing & Forestry | 9 (100.0%) | 0 (0.0%) |
| Construction & Extraction | 27 (100.0%) | 0 (0.0%) |
| Installation, Maintenance & Repair | 4 (100.0%) | 0 (0.0%) |
| Total (Category) | 40 (100.0%) | 0 (0.0%) |
| Total (Overall) | 136 (59.4%) | 93 (40.6%) |
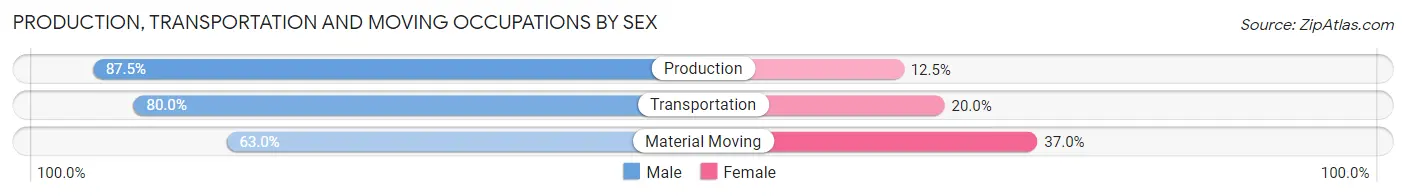
Production, Transportation and Moving Occupations
The most common Production, Transportation and Moving occupations in Noxen are Material Moving (27 | 11.8%), Production (16 | 7.0%), and Transportation (10 | 4.4%).
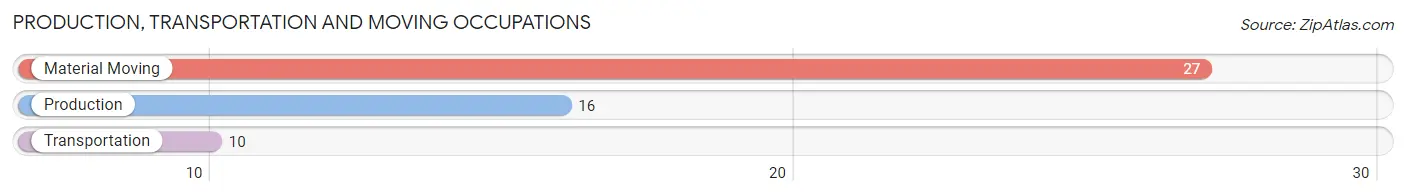
Production, Transportation and Moving Occupations by Sex
| Occupation | Male | Female |
| Production | 14 (87.5%) | 2 (12.5%) |
| Transportation | 8 (80.0%) | 2 (20.0%) |
| Material Moving | 17 (63.0%) | 10 (37.0%) |
| Total (Category) | 39 (73.6%) | 14 (26.4%) |
| Total (Overall) | 136 (59.4%) | 93 (40.6%) |
Employment Industries by Sex in Noxen
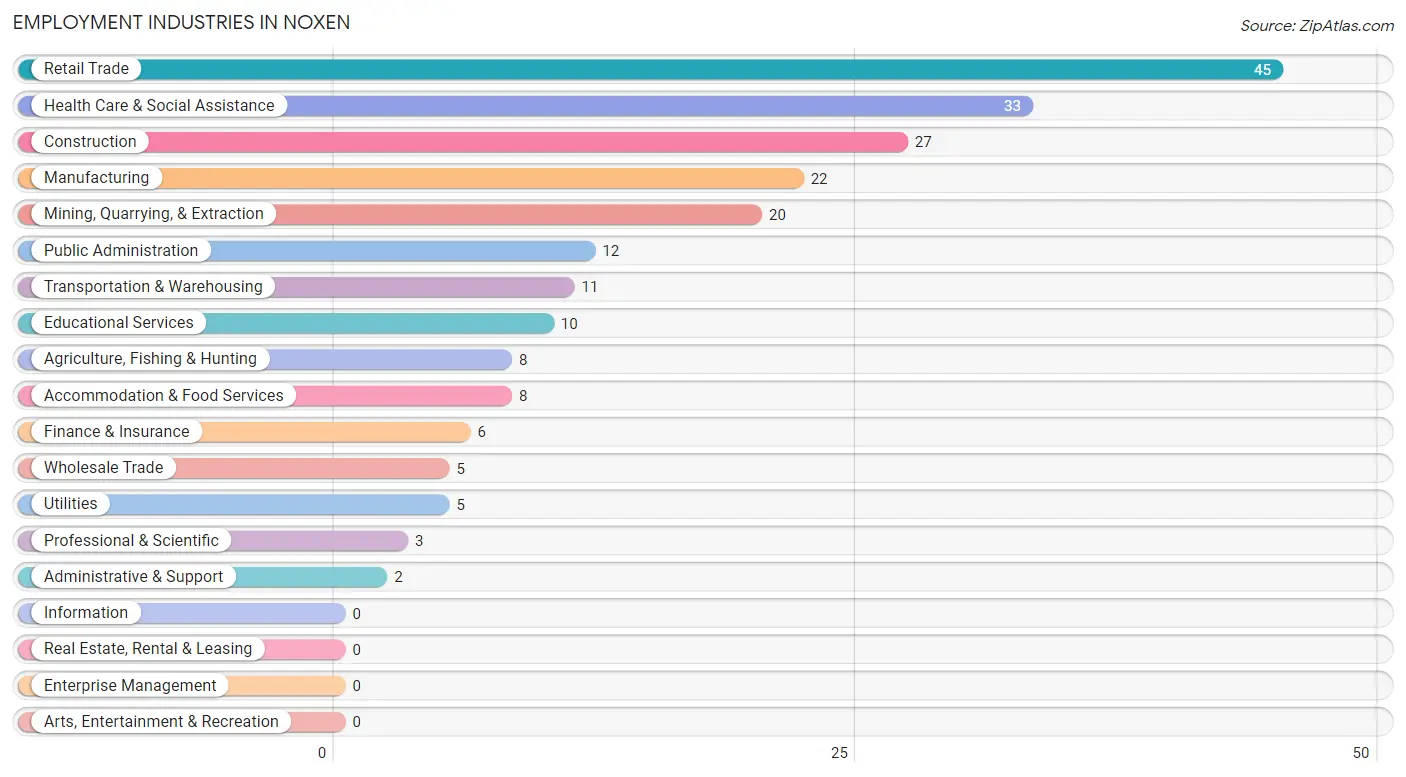
Employment Industries in Noxen
The major employment industries in Noxen include Retail Trade (45 | 19.7%), Health Care & Social Assistance (33 | 14.4%), Construction (27 | 11.8%), Manufacturing (22 | 9.6%), and Mining, Quarrying, & Extraction (20 | 8.7%).
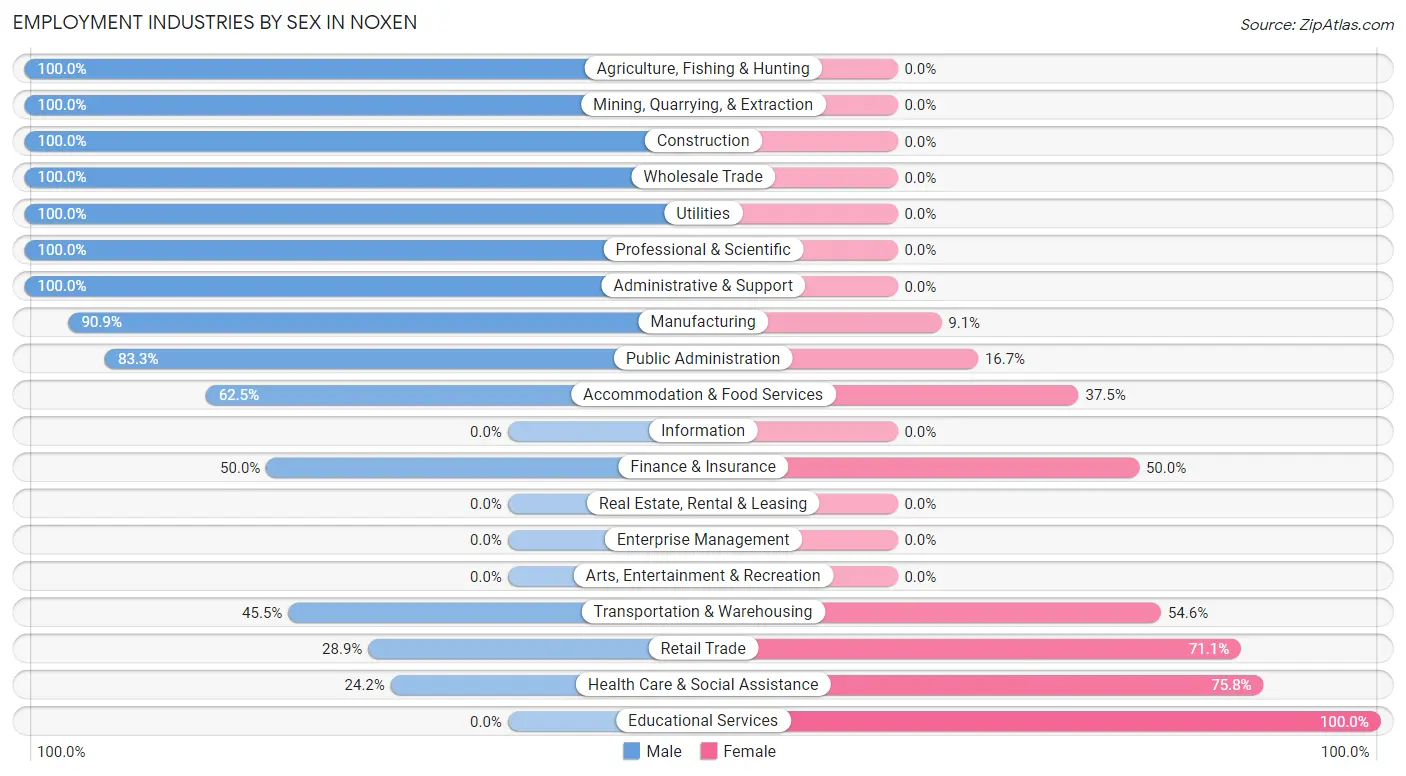
Employment Industries by Sex in Noxen
The Noxen industries that see more men than women are Agriculture, Fishing & Hunting (100.0%), Mining, Quarrying, & Extraction (100.0%), and Construction (100.0%), whereas the industries that tend to have a higher number of women are Educational Services (100.0%), Health Care & Social Assistance (75.8%), and Retail Trade (71.1%).
| Industry | Male | Female |
| Agriculture, Fishing & Hunting | 8 (100.0%) | 0 (0.0%) |
| Mining, Quarrying, & Extraction | 20 (100.0%) | 0 (0.0%) |
| Construction | 27 (100.0%) | 0 (0.0%) |
| Manufacturing | 20 (90.9%) | 2 (9.1%) |
| Wholesale Trade | 5 (100.0%) | 0 (0.0%) |
| Retail Trade | 13 (28.9%) | 32 (71.1%) |
| Transportation & Warehousing | 5 (45.5%) | 6 (54.5%) |
| Utilities | 5 (100.0%) | 0 (0.0%) |
| Information | 0 (0.0%) | 0 (0.0%) |
| Finance & Insurance | 3 (50.0%) | 3 (50.0%) |
| Real Estate, Rental & Leasing | 0 (0.0%) | 0 (0.0%) |
| Professional & Scientific | 3 (100.0%) | 0 (0.0%) |
| Enterprise Management | 0 (0.0%) | 0 (0.0%) |
| Administrative & Support | 2 (100.0%) | 0 (0.0%) |
| Educational Services | 0 (0.0%) | 10 (100.0%) |
| Health Care & Social Assistance | 8 (24.2%) | 25 (75.8%) |
| Arts, Entertainment & Recreation | 0 (0.0%) | 0 (0.0%) |
| Accommodation & Food Services | 5 (62.5%) | 3 (37.5%) |
| Public Administration | 10 (83.3%) | 2 (16.7%) |
| Total | 136 (59.4%) | 93 (40.6%) |
Education in Noxen
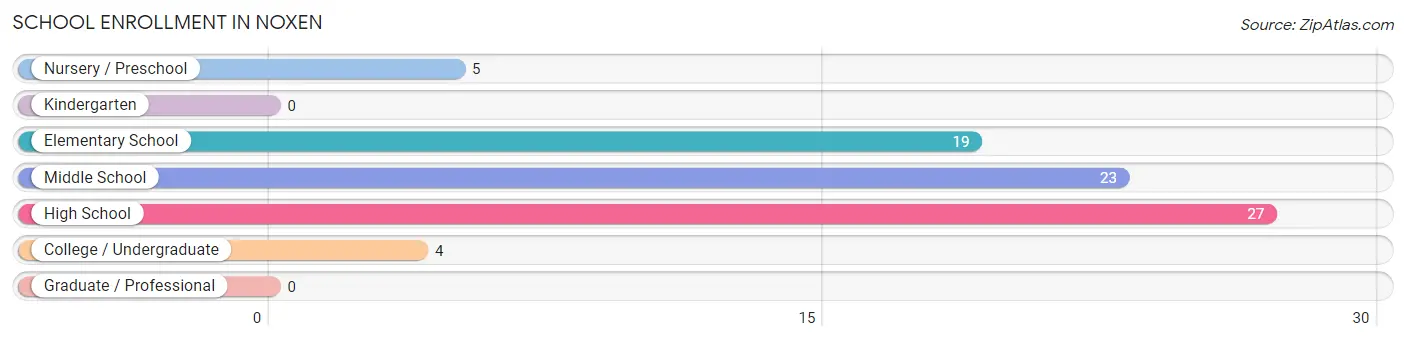
School Enrollment in Noxen
The most common levels of schooling among the 78 students in Noxen are high school (27 | 34.6%), middle school (23 | 29.5%), and elementary school (19 | 24.4%).
| School Level | # Students | % Students |
| Nursery / Preschool | 5 | 6.4% |
| Kindergarten | 0 | 0.0% |
| Elementary School | 19 | 24.4% |
| Middle School | 23 | 29.5% |
| High School | 27 | 34.6% |
| College / Undergraduate | 4 | 5.1% |
| Graduate / Professional | 0 | 0.0% |
| Total | 78 | 100.0% |
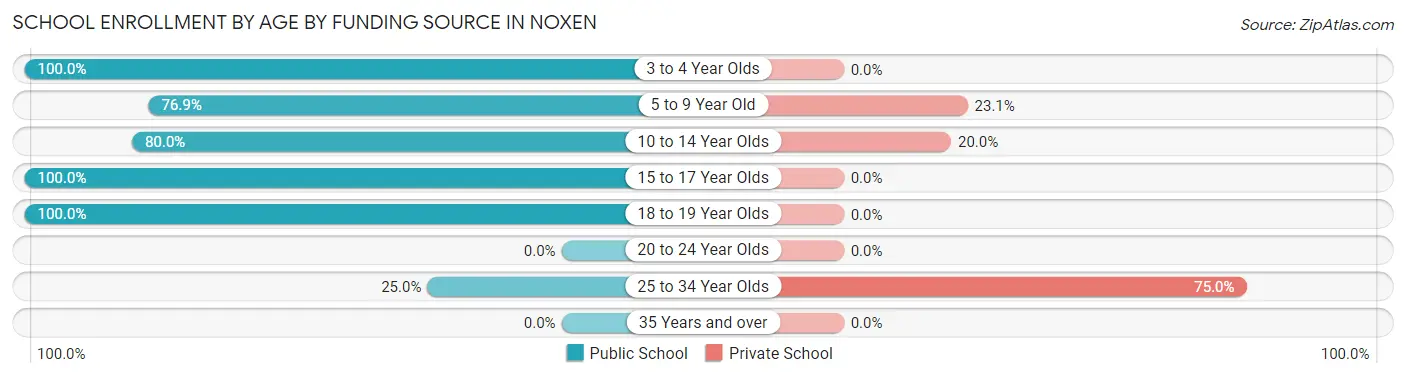
School Enrollment by Age by Funding Source in Noxen
Out of a total of 78 students who are enrolled in schools in Noxen, 11 (14.1%) attend a private institution, while the remaining 67 (85.9%) are enrolled in public schools. The age group of 25 to 34 year olds has the highest likelihood of being enrolled in private schools, with 3 (75.0% in the age bracket) enrolled. Conversely, the age group of 3 to 4 year olds has the lowest likelihood of being enrolled in a private school, with 5 (100.0% in the age bracket) attending a public institution.
| Age Bracket | Public School | Private School |
| 3 to 4 Year Olds | 5 (100.0%) | 0 (0.0%) |
| 5 to 9 Year Old | 10 (76.9%) | 3 (23.1%) |
| 10 to 14 Year Olds | 20 (80.0%) | 5 (20.0%) |
| 15 to 17 Year Olds | 26 (100.0%) | 0 (0.0%) |
| 18 to 19 Year Olds | 5 (100.0%) | 0 (0.0%) |
| 20 to 24 Year Olds | 0 (0.0%) | 0 (0.0%) |
| 25 to 34 Year Olds | 1 (25.0%) | 3 (75.0%) |
| 35 Years and over | 0 (0.0%) | 0 (0.0%) |
| Total | 67 (85.9%) | 11 (14.1%) |
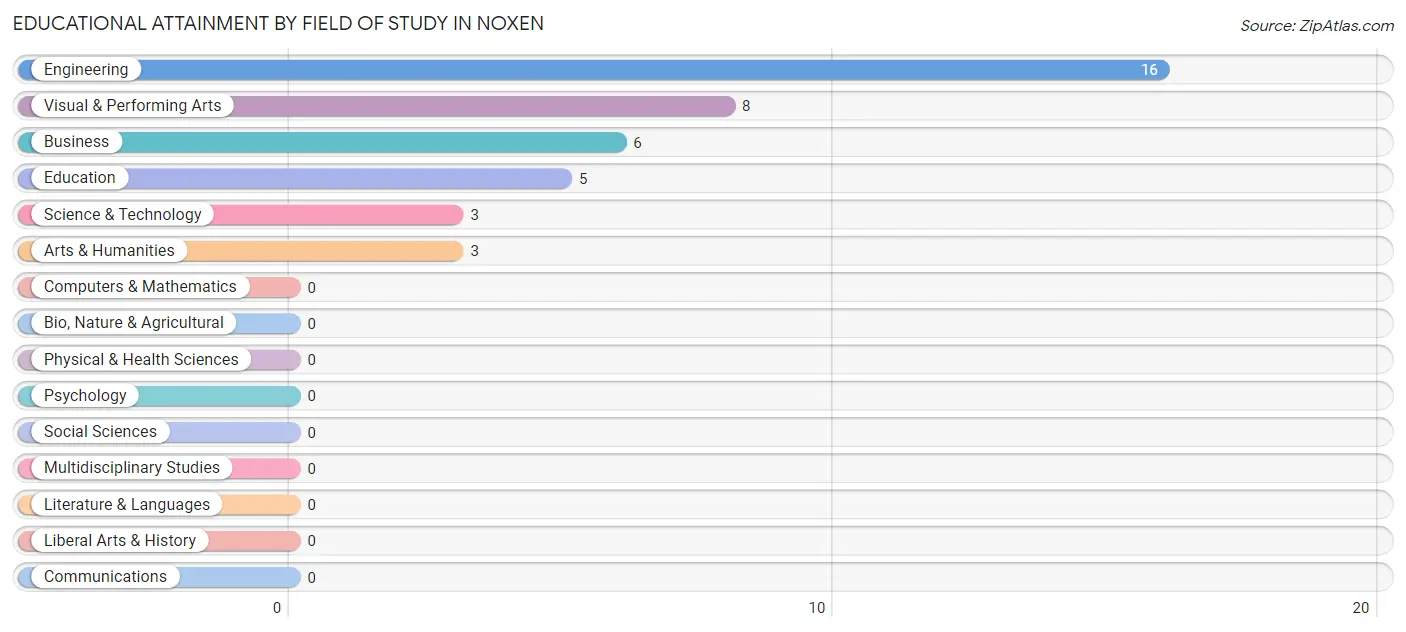
Educational Attainment by Field of Study in Noxen
Engineering (16 | 39.0%), visual & performing arts (8 | 19.5%), business (6 | 14.6%), education (5 | 12.2%), and science & technology (3 | 7.3%) are the most common fields of study among 41 individuals in Noxen who have obtained a bachelor's degree or higher.
| Field of Study | # Graduates | % Graduates |
| Computers & Mathematics | 0 | 0.0% |
| Bio, Nature & Agricultural | 0 | 0.0% |
| Physical & Health Sciences | 0 | 0.0% |
| Psychology | 0 | 0.0% |
| Social Sciences | 0 | 0.0% |
| Engineering | 16 | 39.0% |
| Multidisciplinary Studies | 0 | 0.0% |
| Science & Technology | 3 | 7.3% |
| Business | 6 | 14.6% |
| Education | 5 | 12.2% |
| Literature & Languages | 0 | 0.0% |
| Liberal Arts & History | 0 | 0.0% |
| Visual & Performing Arts | 8 | 19.5% |
| Communications | 0 | 0.0% |
| Arts & Humanities | 3 | 7.3% |
| Total | 41 | 100.0% |
Transportation & Commute in Noxen
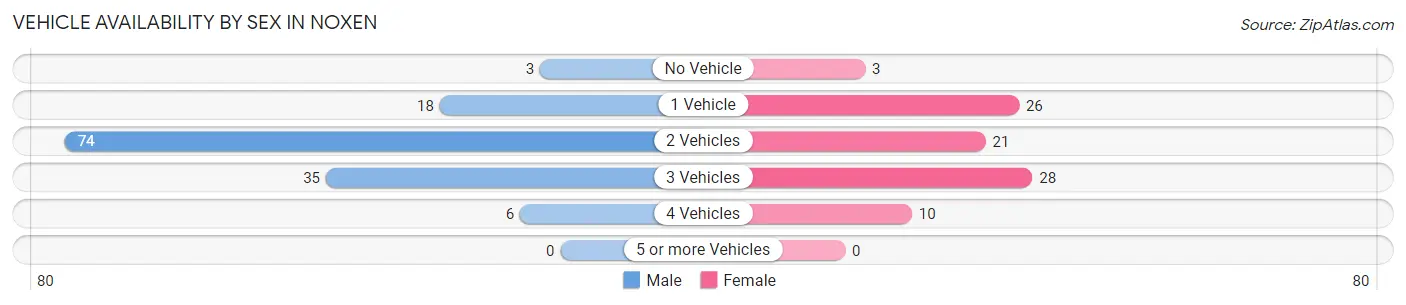
Vehicle Availability by Sex in Noxen
The most prevalent vehicle ownership categories in Noxen are males with 2 vehicles (74, accounting for 54.4%) and females with 2 vehicles (21, making up 84.1%).
| Vehicles Available | Male | Female |
| No Vehicle | 3 (2.2%) | 3 (3.4%) |
| 1 Vehicle | 18 (13.2%) | 26 (29.5%) |
| 2 Vehicles | 74 (54.4%) | 21 (23.9%) |
| 3 Vehicles | 35 (25.7%) | 28 (31.8%) |
| 4 Vehicles | 6 (4.4%) | 10 (11.4%) |
| 5 or more Vehicles | 0 (0.0%) | 0 (0.0%) |
| Total | 136 (100.0%) | 88 (100.0%) |
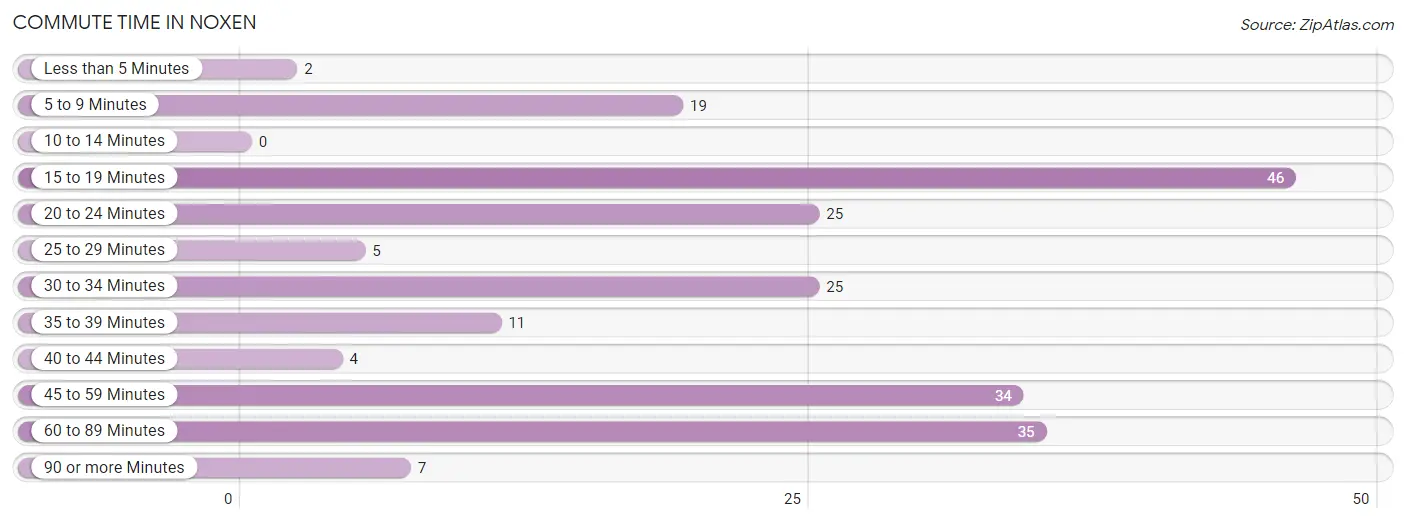
Commute Time in Noxen
The most frequently occuring commute durations in Noxen are 15 to 19 minutes (46 commuters, 21.6%), 60 to 89 minutes (35 commuters, 16.4%), and 45 to 59 minutes (34 commuters, 16.0%).
| Commute Time | # Commuters | % Commuters |
| Less than 5 Minutes | 2 | 0.9% |
| 5 to 9 Minutes | 19 | 8.9% |
| 10 to 14 Minutes | 0 | 0.0% |
| 15 to 19 Minutes | 46 | 21.6% |
| 20 to 24 Minutes | 25 | 11.7% |
| 25 to 29 Minutes | 5 | 2.4% |
| 30 to 34 Minutes | 25 | 11.7% |
| 35 to 39 Minutes | 11 | 5.2% |
| 40 to 44 Minutes | 4 | 1.9% |
| 45 to 59 Minutes | 34 | 16.0% |
| 60 to 89 Minutes | 35 | 16.4% |
| 90 or more Minutes | 7 | 3.3% |
Commute Time by Sex in Noxen
The most common commute times in Noxen are 15 to 19 minutes (38 commuters, 28.6%) for males and 20 to 24 minutes (19 commuters, 23.7%) for females.
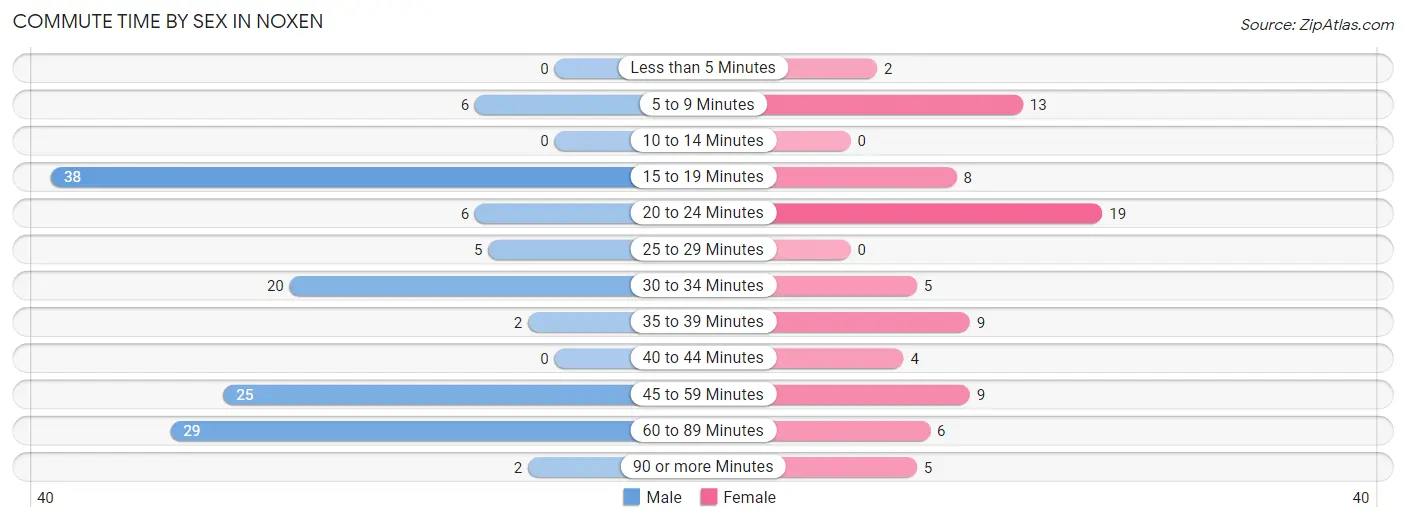
| Commute Time | Male | Female |
| Less than 5 Minutes | 0 (0.0%) | 2 (2.5%) |
| 5 to 9 Minutes | 6 (4.5%) | 13 (16.3%) |
| 10 to 14 Minutes | 0 (0.0%) | 0 (0.0%) |
| 15 to 19 Minutes | 38 (28.6%) | 8 (10.0%) |
| 20 to 24 Minutes | 6 (4.5%) | 19 (23.7%) |
| 25 to 29 Minutes | 5 (3.8%) | 0 (0.0%) |
| 30 to 34 Minutes | 20 (15.0%) | 5 (6.2%) |
| 35 to 39 Minutes | 2 (1.5%) | 9 (11.3%) |
| 40 to 44 Minutes | 0 (0.0%) | 4 (5.0%) |
| 45 to 59 Minutes | 25 (18.8%) | 9 (11.3%) |
| 60 to 89 Minutes | 29 (21.8%) | 6 (7.5%) |
| 90 or more Minutes | 2 (1.5%) | 5 (6.2%) |
Time of Departure to Work by Sex in Noxen
The most frequent times of departure to work in Noxen are 5:00 AM to 5:29 AM (38, 28.6%) for males and 5:00 AM to 5:29 AM (20, 25.0%) for females.
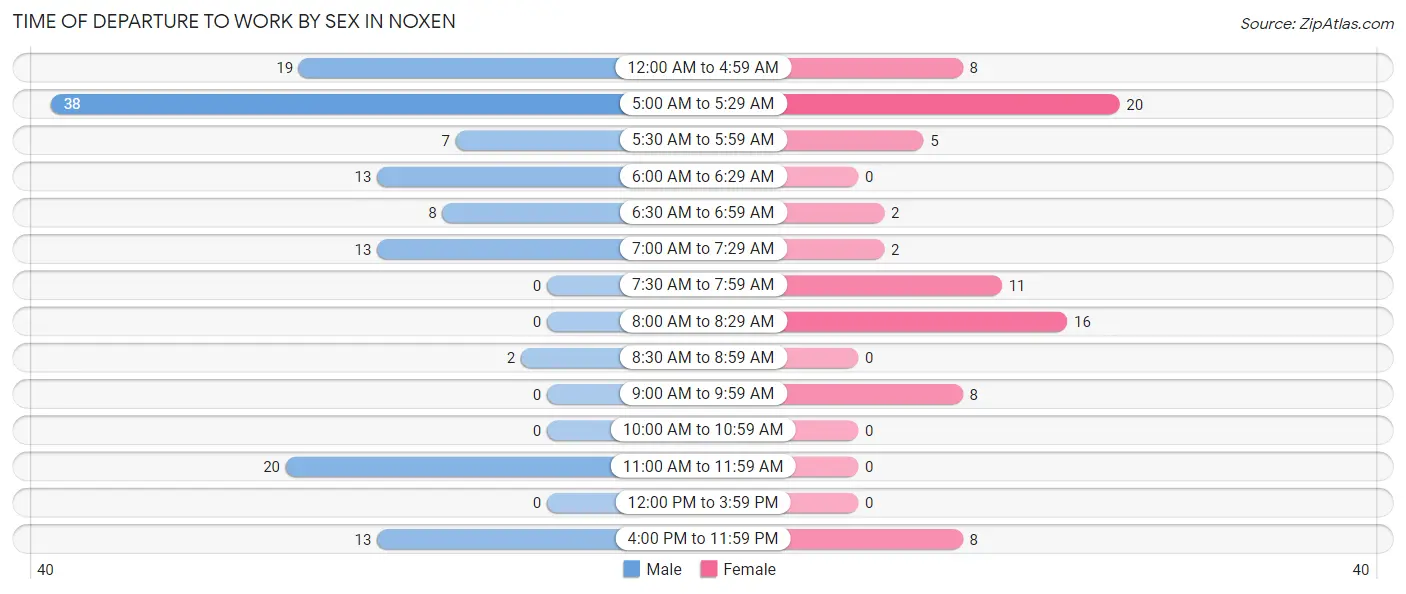
| Time of Departure | Male | Female |
| 12:00 AM to 4:59 AM | 19 (14.3%) | 8 (10.0%) |
| 5:00 AM to 5:29 AM | 38 (28.6%) | 20 (25.0%) |
| 5:30 AM to 5:59 AM | 7 (5.3%) | 5 (6.2%) |
| 6:00 AM to 6:29 AM | 13 (9.8%) | 0 (0.0%) |
| 6:30 AM to 6:59 AM | 8 (6.0%) | 2 (2.5%) |
| 7:00 AM to 7:29 AM | 13 (9.8%) | 2 (2.5%) |
| 7:30 AM to 7:59 AM | 0 (0.0%) | 11 (13.8%) |
| 8:00 AM to 8:29 AM | 0 (0.0%) | 16 (20.0%) |
| 8:30 AM to 8:59 AM | 2 (1.5%) | 0 (0.0%) |
| 9:00 AM to 9:59 AM | 0 (0.0%) | 8 (10.0%) |
| 10:00 AM to 10:59 AM | 0 (0.0%) | 0 (0.0%) |
| 11:00 AM to 11:59 AM | 20 (15.0%) | 0 (0.0%) |
| 12:00 PM to 3:59 PM | 0 (0.0%) | 0 (0.0%) |
| 4:00 PM to 11:59 PM | 13 (9.8%) | 8 (10.0%) |
| Total | 133 (100.0%) | 80 (100.0%) |
Housing Occupancy in Noxen
Occupancy by Ownership in Noxen
Of the total 267 dwellings in Noxen, owner-occupied units account for 209 (78.3%), while renter-occupied units make up 58 (21.7%).
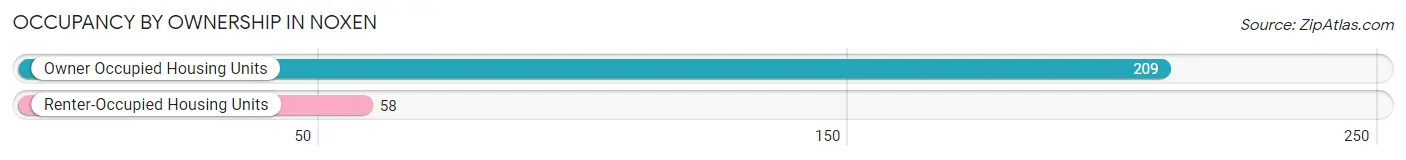
| Occupancy | # Housing Units | % Housing Units |
| Owner Occupied Housing Units | 209 | 78.3% |
| Renter-Occupied Housing Units | 58 | 21.7% |
| Total Occupied Housing Units | 267 | 100.0% |
Occupancy by Household Size in Noxen
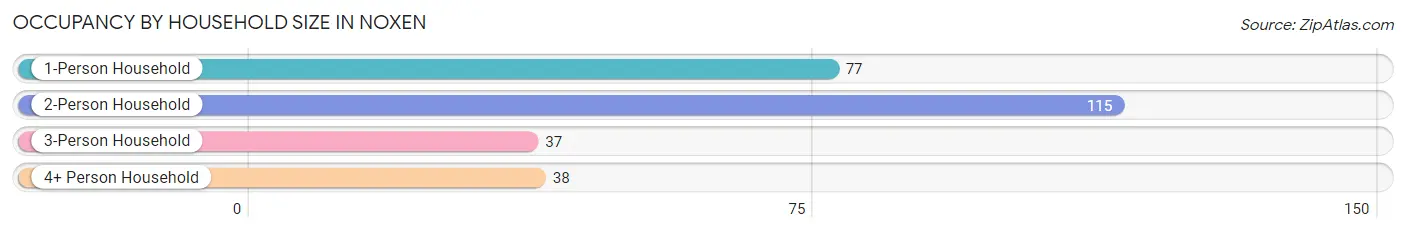
| Household Size | # Housing Units | % Housing Units |
| 1-Person Household | 77 | 28.8% |
| 2-Person Household | 115 | 43.1% |
| 3-Person Household | 37 | 13.9% |
| 4+ Person Household | 38 | 14.2% |
| Total Housing Units | 267 | 100.0% |
Occupancy by Ownership by Household Size in Noxen
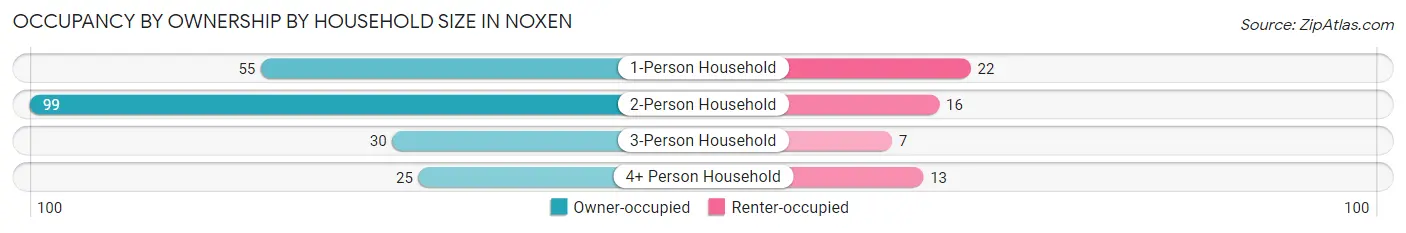
| Household Size | Owner-occupied | Renter-occupied |
| 1-Person Household | 55 (71.4%) | 22 (28.6%) |
| 2-Person Household | 99 (86.1%) | 16 (13.9%) |
| 3-Person Household | 30 (81.1%) | 7 (18.9%) |
| 4+ Person Household | 25 (65.8%) | 13 (34.2%) |
| Total Housing Units | 209 (78.3%) | 58 (21.7%) |
Occupancy by Educational Attainment in Noxen
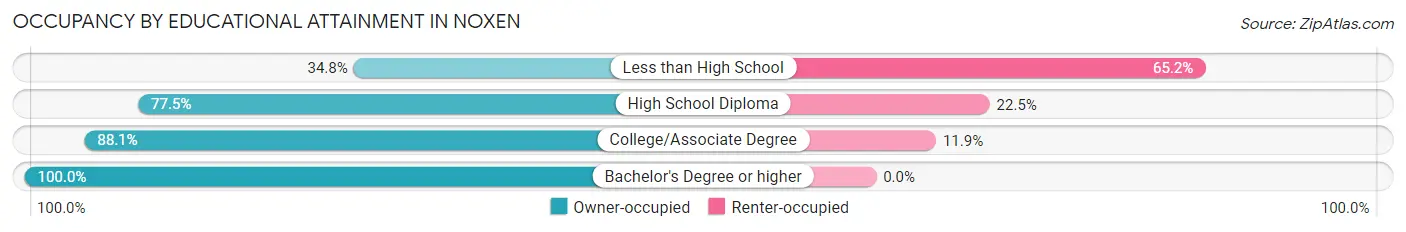
| Household Size | Owner-occupied | Renter-occupied |
| Less than High School | 8 (34.8%) | 15 (65.2%) |
| High School Diploma | 124 (77.5%) | 36 (22.5%) |
| College/Associate Degree | 52 (88.1%) | 7 (11.9%) |
| Bachelor's Degree or higher | 25 (100.0%) | 0 (0.0%) |
Occupancy by Age of Householder in Noxen
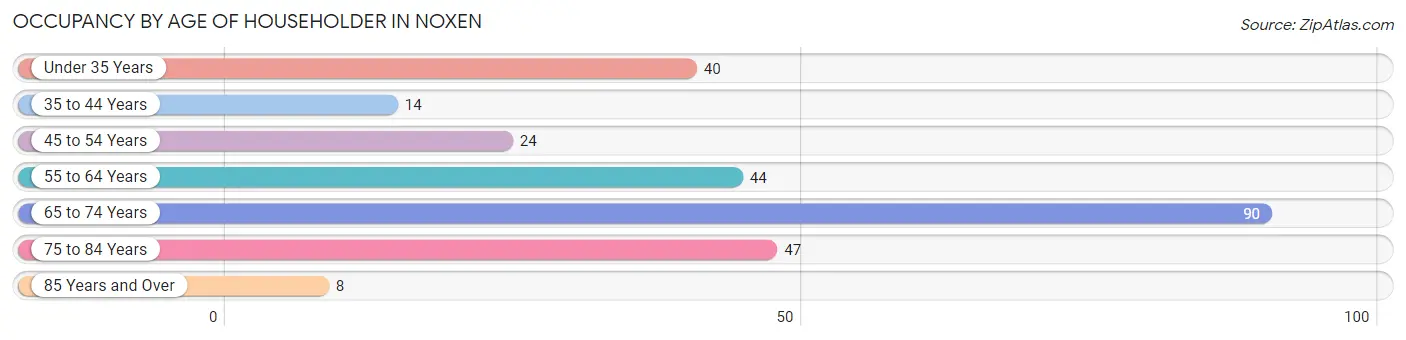
| Age Bracket | # Households | % Households |
| Under 35 Years | 40 | 15.0% |
| 35 to 44 Years | 14 | 5.2% |
| 45 to 54 Years | 24 | 9.0% |
| 55 to 64 Years | 44 | 16.5% |
| 65 to 74 Years | 90 | 33.7% |
| 75 to 84 Years | 47 | 17.6% |
| 85 Years and Over | 8 | 3.0% |
| Total | 267 | 100.0% |
Housing Finances in Noxen
Median Income by Occupancy in Noxen
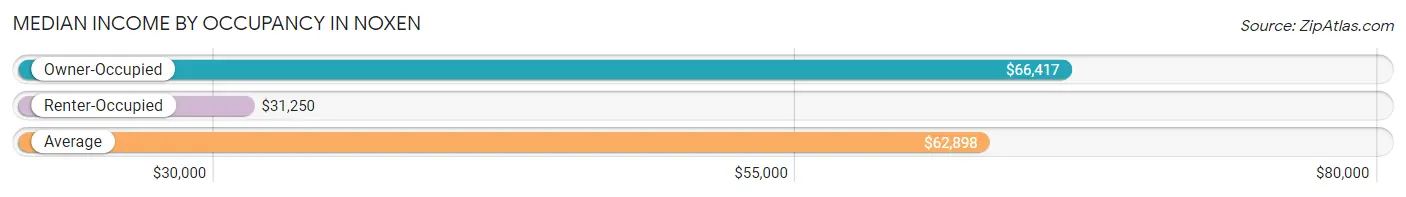
| Occupancy Type | # Households | Median Income |
| Owner-Occupied | 209 (78.3%) | $66,417 |
| Renter-Occupied | 58 (21.7%) | $31,250 |
| Average | 267 (100.0%) | $62,898 |
Occupancy by Householder Income Bracket in Noxen
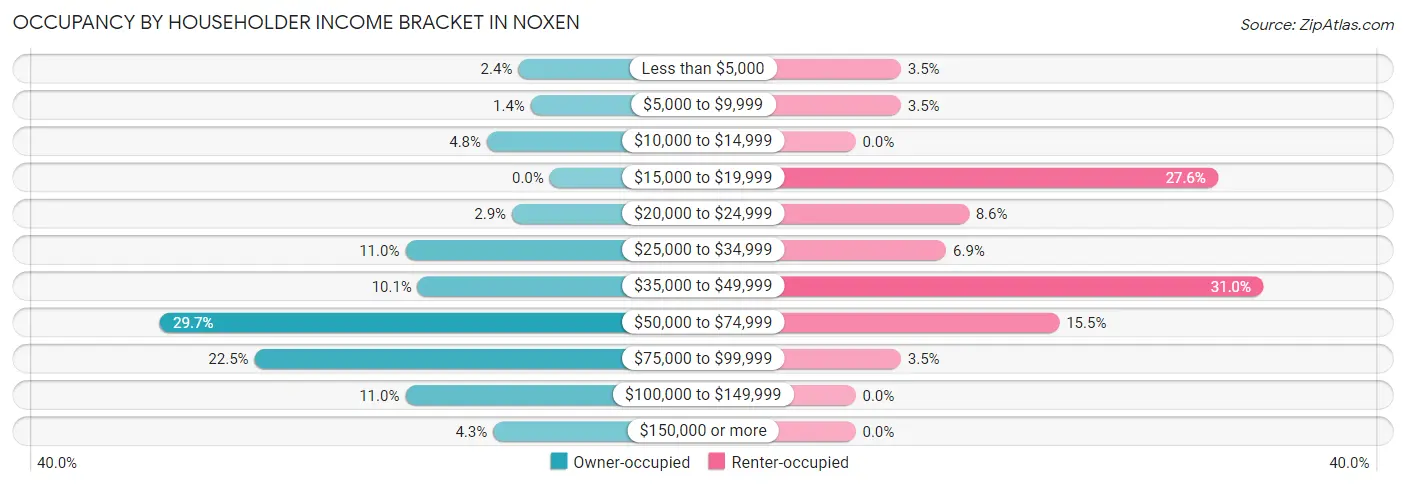
| Income Bracket | Owner-occupied | Renter-occupied |
| Less than $5,000 | 5 (2.4%) | 2 (3.5%) |
| $5,000 to $9,999 | 3 (1.4%) | 2 (3.5%) |
| $10,000 to $14,999 | 10 (4.8%) | 0 (0.0%) |
| $15,000 to $19,999 | 0 (0.0%) | 16 (27.6%) |
| $20,000 to $24,999 | 6 (2.9%) | 5 (8.6%) |
| $25,000 to $34,999 | 23 (11.0%) | 4 (6.9%) |
| $35,000 to $49,999 | 21 (10.1%) | 18 (31.0%) |
| $50,000 to $74,999 | 62 (29.7%) | 9 (15.5%) |
| $75,000 to $99,999 | 47 (22.5%) | 2 (3.5%) |
| $100,000 to $149,999 | 23 (11.0%) | 0 (0.0%) |
| $150,000 or more | 9 (4.3%) | 0 (0.0%) |
| Total | 209 (100.0%) | 58 (100.0%) |
Monthly Housing Cost Tiers in Noxen
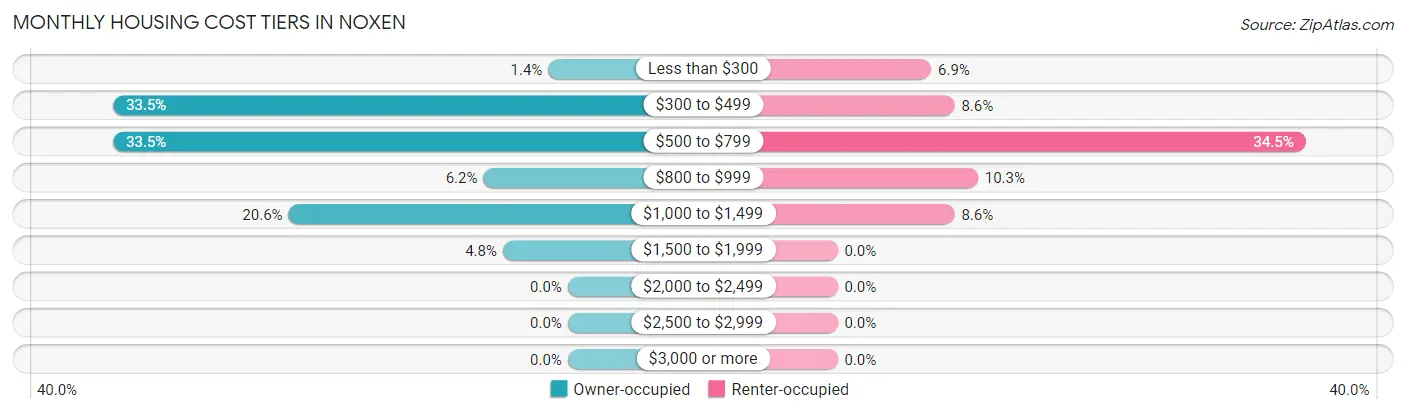
| Monthly Cost | Owner-occupied | Renter-occupied |
| Less than $300 | 3 (1.4%) | 4 (6.9%) |
| $300 to $499 | 70 (33.5%) | 5 (8.6%) |
| $500 to $799 | 70 (33.5%) | 20 (34.5%) |
| $800 to $999 | 13 (6.2%) | 6 (10.3%) |
| $1,000 to $1,499 | 43 (20.6%) | 5 (8.6%) |
| $1,500 to $1,999 | 10 (4.8%) | 0 (0.0%) |
| $2,000 to $2,499 | 0 (0.0%) | 0 (0.0%) |
| $2,500 to $2,999 | 0 (0.0%) | 0 (0.0%) |
| $3,000 or more | 0 (0.0%) | 0 (0.0%) |
| Total | 209 (100.0%) | 58 (100.0%) |
Physical Housing Characteristics in Noxen
Housing Structures in Noxen
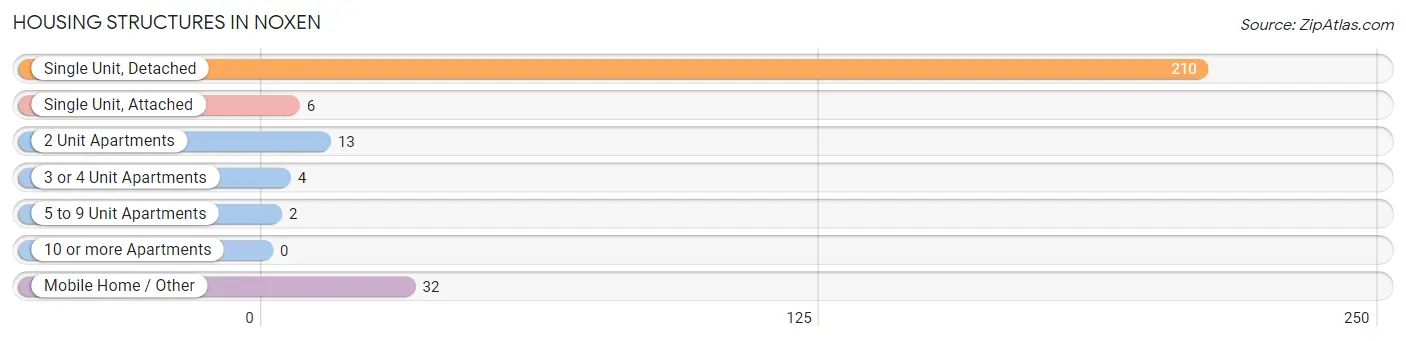
| Structure Type | # Housing Units | % Housing Units |
| Single Unit, Detached | 210 | 78.6% |
| Single Unit, Attached | 6 | 2.2% |
| 2 Unit Apartments | 13 | 4.9% |
| 3 or 4 Unit Apartments | 4 | 1.5% |
| 5 to 9 Unit Apartments | 2 | 0.7% |
| 10 or more Apartments | 0 | 0.0% |
| Mobile Home / Other | 32 | 12.0% |
| Total | 267 | 100.0% |
Housing Structures by Occupancy in Noxen
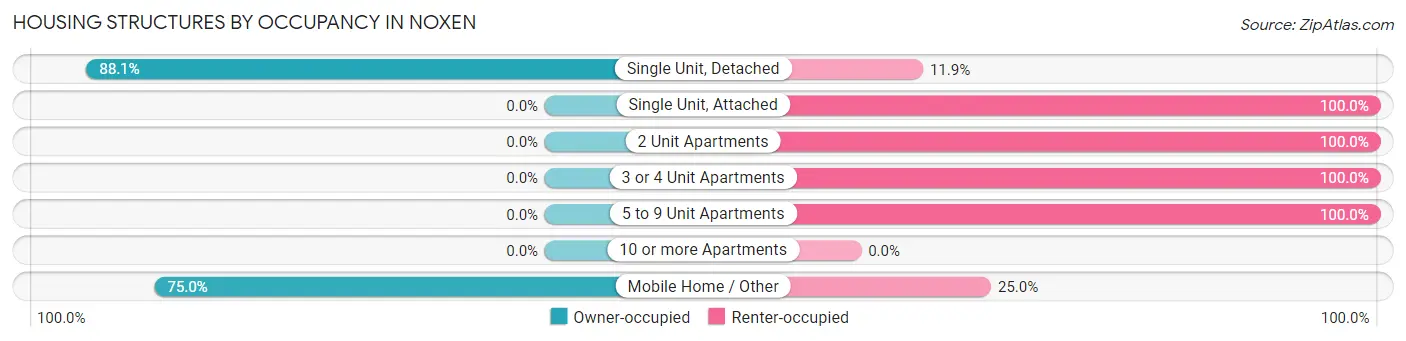
| Structure Type | Owner-occupied | Renter-occupied |
| Single Unit, Detached | 185 (88.1%) | 25 (11.9%) |
| Single Unit, Attached | 0 (0.0%) | 6 (100.0%) |
| 2 Unit Apartments | 0 (0.0%) | 13 (100.0%) |
| 3 or 4 Unit Apartments | 0 (0.0%) | 4 (100.0%) |
| 5 to 9 Unit Apartments | 0 (0.0%) | 2 (100.0%) |
| 10 or more Apartments | 0 (0.0%) | 0 (0.0%) |
| Mobile Home / Other | 24 (75.0%) | 8 (25.0%) |
| Total | 209 (78.3%) | 58 (21.7%) |
Housing Structures by Number of Rooms in Noxen
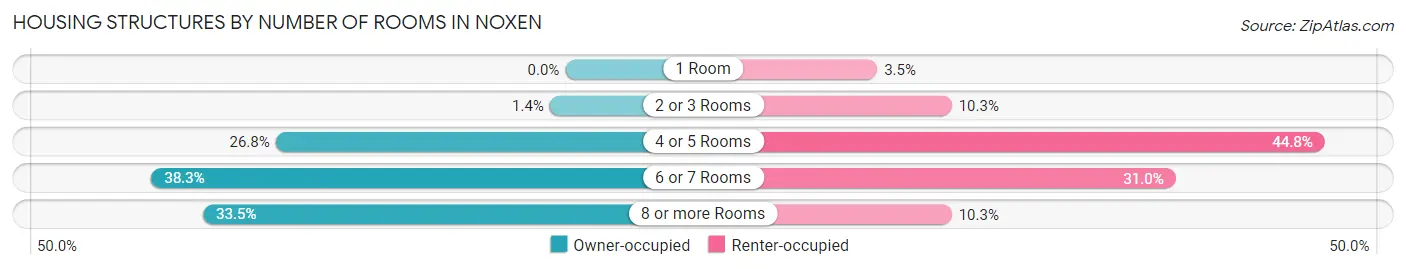
| Number of Rooms | Owner-occupied | Renter-occupied |
| 1 Room | 0 (0.0%) | 2 (3.5%) |
| 2 or 3 Rooms | 3 (1.4%) | 6 (10.3%) |
| 4 or 5 Rooms | 56 (26.8%) | 26 (44.8%) |
| 6 or 7 Rooms | 80 (38.3%) | 18 (31.0%) |
| 8 or more Rooms | 70 (33.5%) | 6 (10.3%) |
| Total | 209 (100.0%) | 58 (100.0%) |
Housing Structure by Heating Type in Noxen
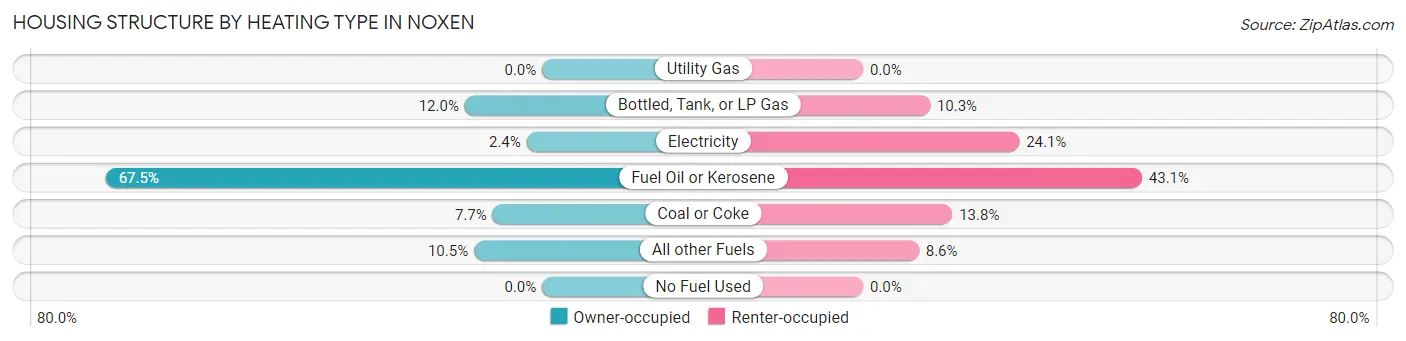
| Heating Type | Owner-occupied | Renter-occupied |
| Utility Gas | 0 (0.0%) | 0 (0.0%) |
| Bottled, Tank, or LP Gas | 25 (12.0%) | 6 (10.3%) |
| Electricity | 5 (2.4%) | 14 (24.1%) |
| Fuel Oil or Kerosene | 141 (67.5%) | 25 (43.1%) |
| Coal or Coke | 16 (7.7%) | 8 (13.8%) |
| All other Fuels | 22 (10.5%) | 5 (8.6%) |
| No Fuel Used | 0 (0.0%) | 0 (0.0%) |
| Total | 209 (100.0%) | 58 (100.0%) |
Household Vehicle Usage in Noxen
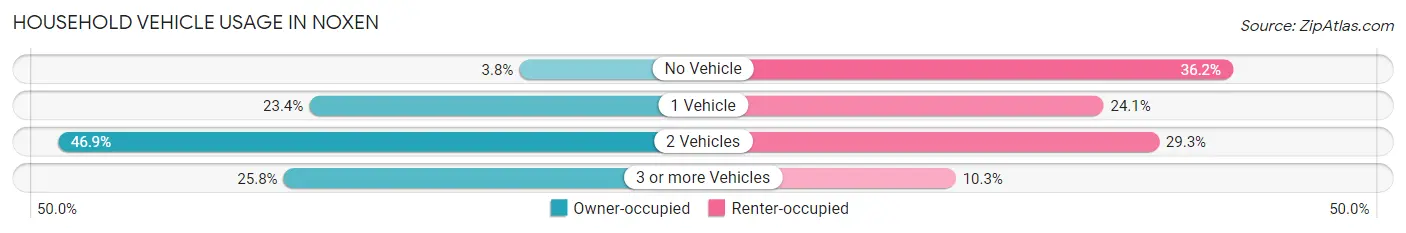
| Vehicles per Household | Owner-occupied | Renter-occupied |
| No Vehicle | 8 (3.8%) | 21 (36.2%) |
| 1 Vehicle | 49 (23.4%) | 14 (24.1%) |
| 2 Vehicles | 98 (46.9%) | 17 (29.3%) |
| 3 or more Vehicles | 54 (25.8%) | 6 (10.3%) |
| Total | 209 (100.0%) | 58 (100.0%) |
Real Estate & Mortgages in Noxen
Real Estate and Mortgage Overview in Noxen
| Characteristic | Without Mortgage | With Mortgage |
| Housing Units | 153 | 56 |
| Median Property Value | $154,200 | $121,400 |
| Median Household Income | $64,539 | $6 |
| Monthly Housing Costs | $513 | $0 |
| Real Estate Taxes | $1,779 | $0 |
Property Value by Mortgage Status in Noxen
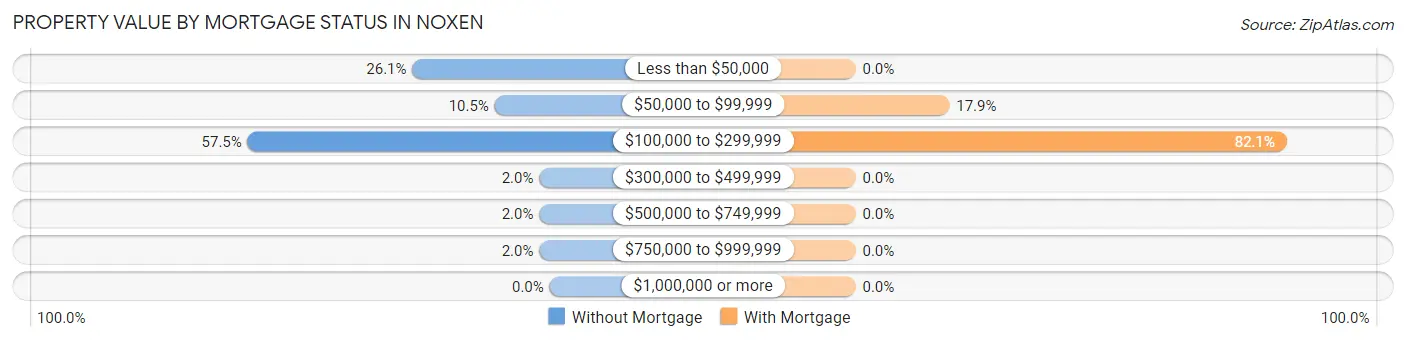
| Property Value | Without Mortgage | With Mortgage |
| Less than $50,000 | 40 (26.1%) | 0 (0.0%) |
| $50,000 to $99,999 | 16 (10.5%) | 10 (17.9%) |
| $100,000 to $299,999 | 88 (57.5%) | 46 (82.1%) |
| $300,000 to $499,999 | 3 (2.0%) | 0 (0.0%) |
| $500,000 to $749,999 | 3 (2.0%) | 0 (0.0%) |
| $750,000 to $999,999 | 3 (2.0%) | 0 (0.0%) |
| $1,000,000 or more | 0 (0.0%) | 0 (0.0%) |
| Total | 153 (100.0%) | 56 (100.0%) |
Household Income by Mortgage Status in Noxen
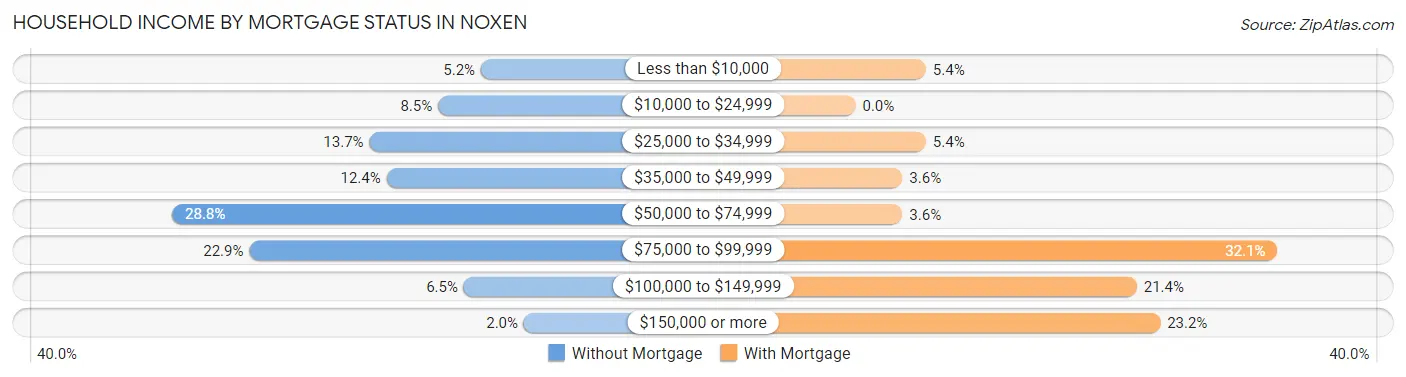
| Household Income | Without Mortgage | With Mortgage |
| Less than $10,000 | 8 (5.2%) | 3 (5.4%) |
| $10,000 to $24,999 | 13 (8.5%) | 0 (0.0%) |
| $25,000 to $34,999 | 21 (13.7%) | 3 (5.4%) |
| $35,000 to $49,999 | 19 (12.4%) | 2 (3.6%) |
| $50,000 to $74,999 | 44 (28.8%) | 2 (3.6%) |
| $75,000 to $99,999 | 35 (22.9%) | 18 (32.1%) |
| $100,000 to $149,999 | 10 (6.5%) | 12 (21.4%) |
| $150,000 or more | 3 (2.0%) | 13 (23.2%) |
| Total | 153 (100.0%) | 56 (100.0%) |
Property Value to Household Income Ratio in Noxen
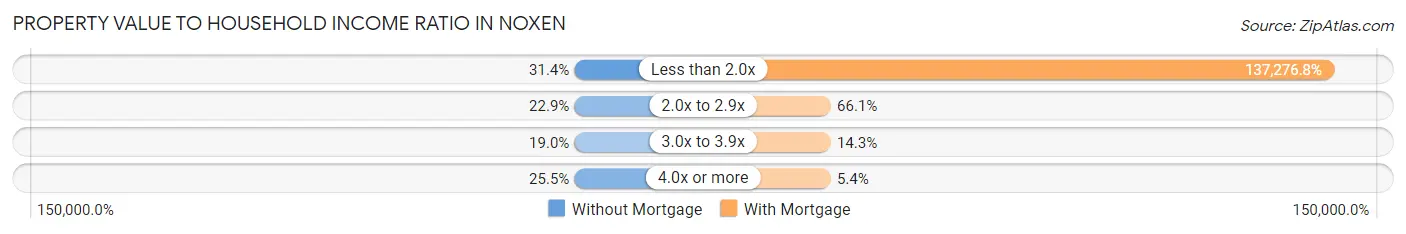
| Value-to-Income Ratio | Without Mortgage | With Mortgage |
| Less than 2.0x | 48 (31.4%) | 76,875 (137,276.8%) |
| 2.0x to 2.9x | 35 (22.9%) | 37 (66.1%) |
| 3.0x to 3.9x | 29 (19.0%) | 8 (14.3%) |
| 4.0x or more | 39 (25.5%) | 3 (5.4%) |
| Total | 153 (100.0%) | 56 (100.0%) |
Real Estate Taxes by Mortgage Status in Noxen
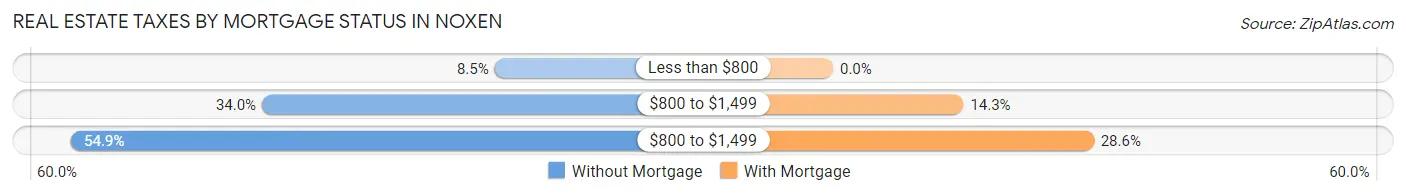
| Property Taxes | Without Mortgage | With Mortgage |
| Less than $800 | 13 (8.5%) | 0 (0.0%) |
| $800 to $1,499 | 52 (34.0%) | 8 (14.3%) |
| $800 to $1,499 | 84 (54.9%) | 16 (28.6%) |
| Total | 153 (100.0%) | 56 (100.0%) |
Health & Disability in Noxen
Health Insurance Coverage by Age in Noxen
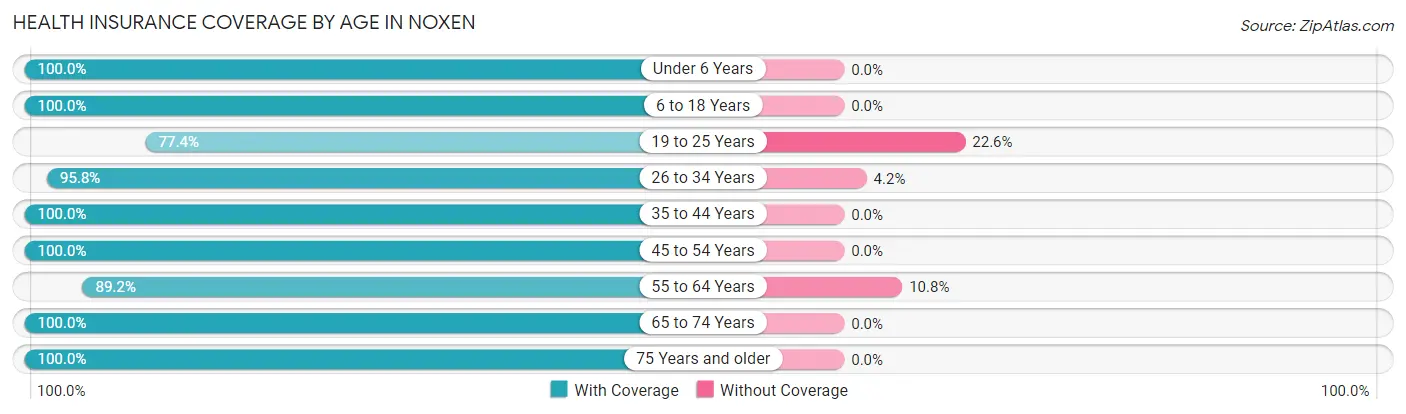
| Age Bracket | With Coverage | Without Coverage |
| Under 6 Years | 13 (100.0%) | 0 (0.0%) |
| 6 to 18 Years | 71 (100.0%) | 0 (0.0%) |
| 19 to 25 Years | 48 (77.4%) | 14 (22.6%) |
| 26 to 34 Years | 69 (95.8%) | 3 (4.2%) |
| 35 to 44 Years | 41 (100.0%) | 0 (0.0%) |
| 45 to 54 Years | 46 (100.0%) | 0 (0.0%) |
| 55 to 64 Years | 66 (89.2%) | 8 (10.8%) |
| 65 to 74 Years | 139 (100.0%) | 0 (0.0%) |
| 75 Years and older | 85 (100.0%) | 0 (0.0%) |
| Total | 578 (95.9%) | 25 (4.2%) |
Health Insurance Coverage by Citizenship Status in Noxen
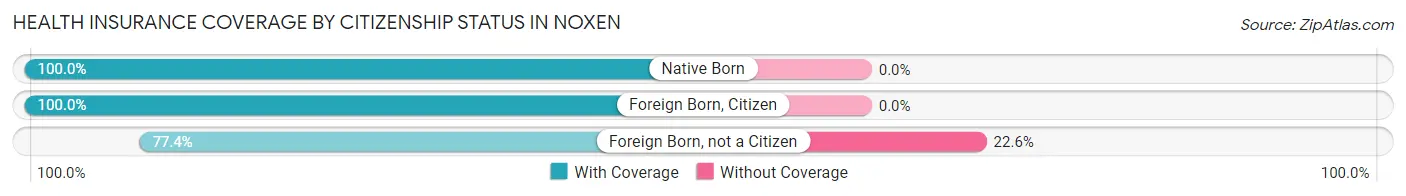
| Citizenship Status | With Coverage | Without Coverage |
| Native Born | 13 (100.0%) | 0 (0.0%) |
| Foreign Born, Citizen | 71 (100.0%) | 0 (0.0%) |
| Foreign Born, not a Citizen | 48 (77.4%) | 14 (22.6%) |
Health Insurance Coverage by Household Income in Noxen

| Household Income | With Coverage | Without Coverage |
| Under $25,000 | 61 (95.3%) | 3 (4.7%) |
| $25,000 to $49,999 | 132 (94.3%) | 8 (5.7%) |
| $50,000 to $74,999 | 164 (92.1%) | 14 (7.9%) |
| $75,000 to $99,999 | 147 (100.0%) | 0 (0.0%) |
| $100,000 and over | 74 (100.0%) | 0 (0.0%) |
Public vs Private Health Insurance Coverage by Age in Noxen
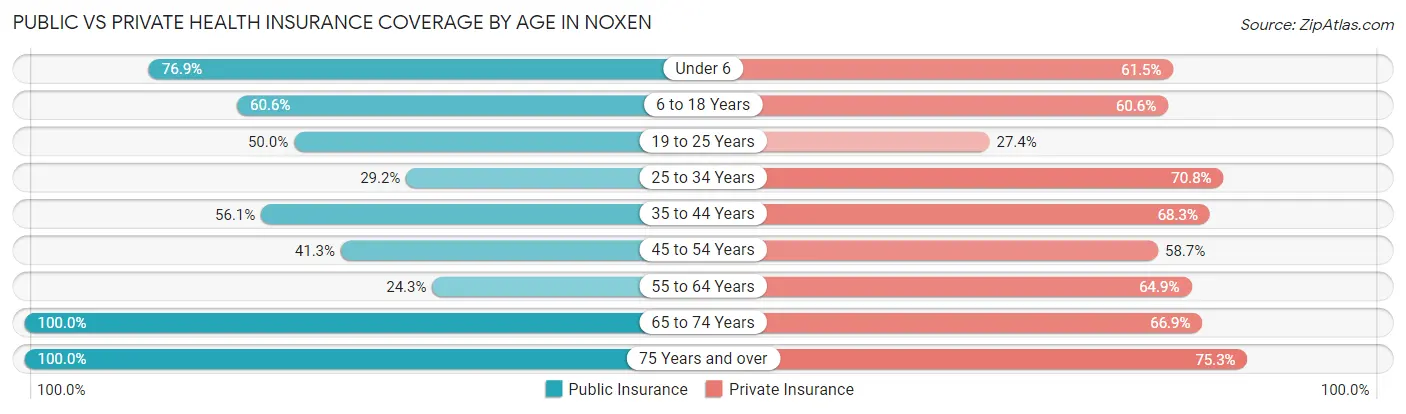
| Age Bracket | Public Insurance | Private Insurance |
| Under 6 | 10 (76.9%) | 8 (61.5%) |
| 6 to 18 Years | 43 (60.6%) | 43 (60.6%) |
| 19 to 25 Years | 31 (50.0%) | 17 (27.4%) |
| 25 to 34 Years | 21 (29.2%) | 51 (70.8%) |
| 35 to 44 Years | 23 (56.1%) | 28 (68.3%) |
| 45 to 54 Years | 19 (41.3%) | 27 (58.7%) |
| 55 to 64 Years | 18 (24.3%) | 48 (64.9%) |
| 65 to 74 Years | 139 (100.0%) | 93 (66.9%) |
| 75 Years and over | 85 (100.0%) | 64 (75.3%) |
| Total | 389 (64.5%) | 379 (62.8%) |
Disability Status by Sex by Age in Noxen
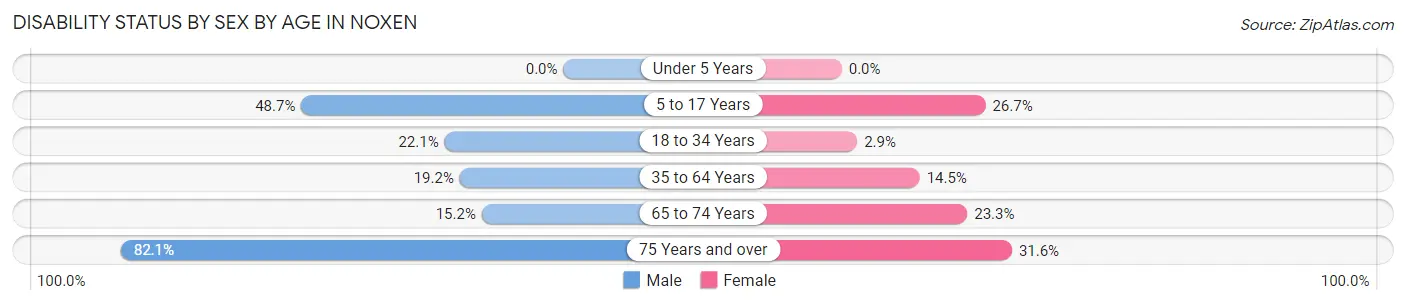
| Age Bracket | Male | Female |
| Under 5 Years | 0 (0.0%) | 0 (0.0%) |
| 5 to 17 Years | 18 (48.6%) | 8 (26.7%) |
| 18 to 34 Years | 15 (22.1%) | 2 (2.9%) |
| 35 to 64 Years | 15 (19.2%) | 12 (14.5%) |
| 65 to 74 Years | 10 (15.1%) | 17 (23.3%) |
| 75 Years and over | 23 (82.1%) | 18 (31.6%) |
Disability Class by Sex by Age in Noxen
Disability Class: Hearing Difficulty
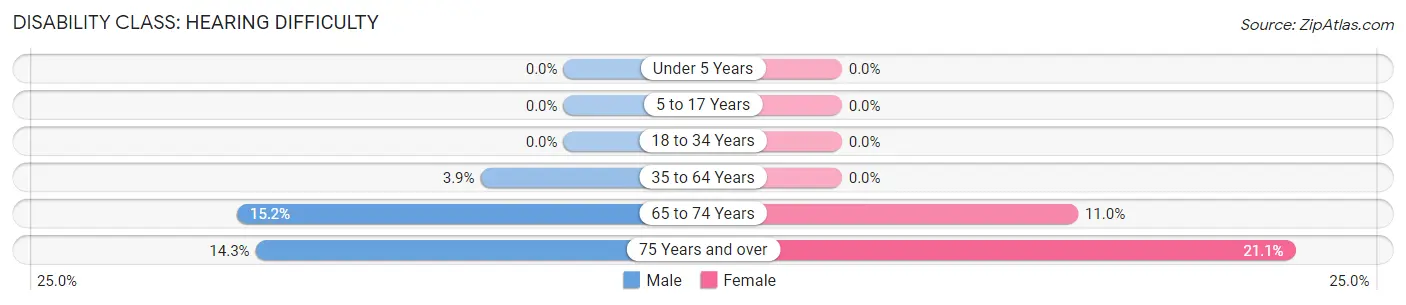
| Age Bracket | Male | Female |
| Under 5 Years | 0 (0.0%) | 0 (0.0%) |
| 5 to 17 Years | 0 (0.0%) | 0 (0.0%) |
| 18 to 34 Years | 0 (0.0%) | 0 (0.0%) |
| 35 to 64 Years | 3 (3.8%) | 0 (0.0%) |
| 65 to 74 Years | 10 (15.1%) | 8 (11.0%) |
| 75 Years and over | 4 (14.3%) | 12 (21.0%) |
Disability Class: Vision Difficulty
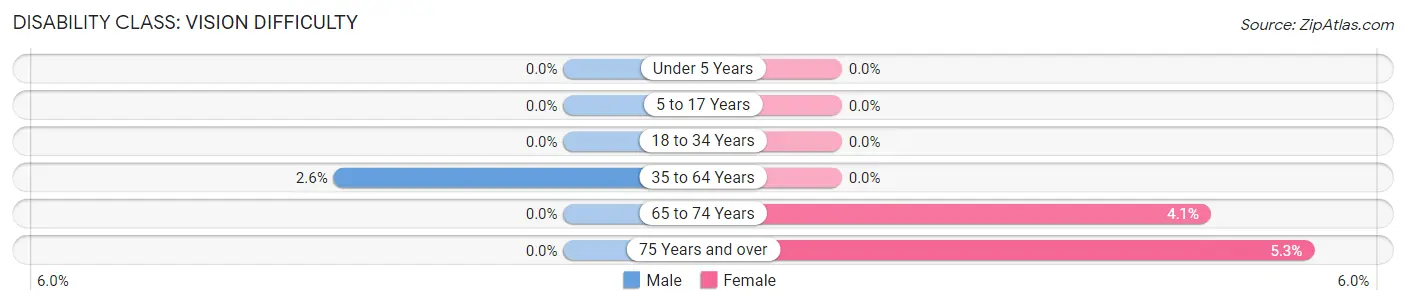
| Age Bracket | Male | Female |
| Under 5 Years | 0 (0.0%) | 0 (0.0%) |
| 5 to 17 Years | 0 (0.0%) | 0 (0.0%) |
| 18 to 34 Years | 0 (0.0%) | 0 (0.0%) |
| 35 to 64 Years | 2 (2.6%) | 0 (0.0%) |
| 65 to 74 Years | 0 (0.0%) | 3 (4.1%) |
| 75 Years and over | 0 (0.0%) | 3 (5.3%) |
Disability Class: Cognitive Difficulty
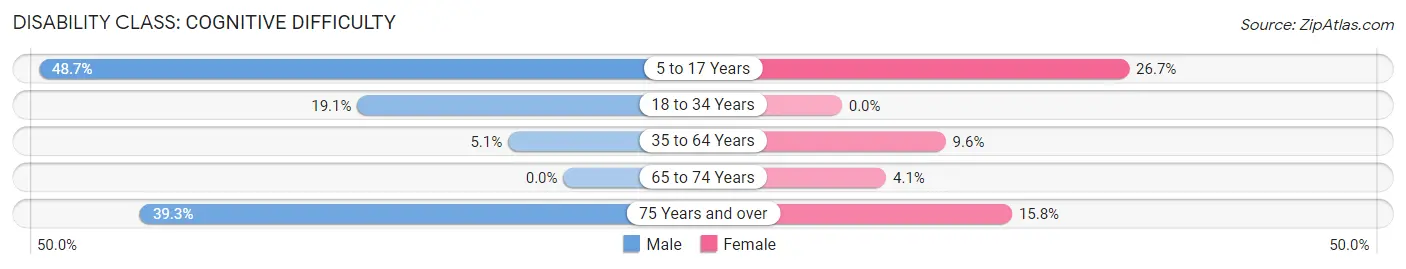
| Age Bracket | Male | Female |
| 5 to 17 Years | 18 (48.6%) | 8 (26.7%) |
| 18 to 34 Years | 13 (19.1%) | 0 (0.0%) |
| 35 to 64 Years | 4 (5.1%) | 8 (9.6%) |
| 65 to 74 Years | 0 (0.0%) | 3 (4.1%) |
| 75 Years and over | 11 (39.3%) | 9 (15.8%) |
Disability Class: Ambulatory Difficulty
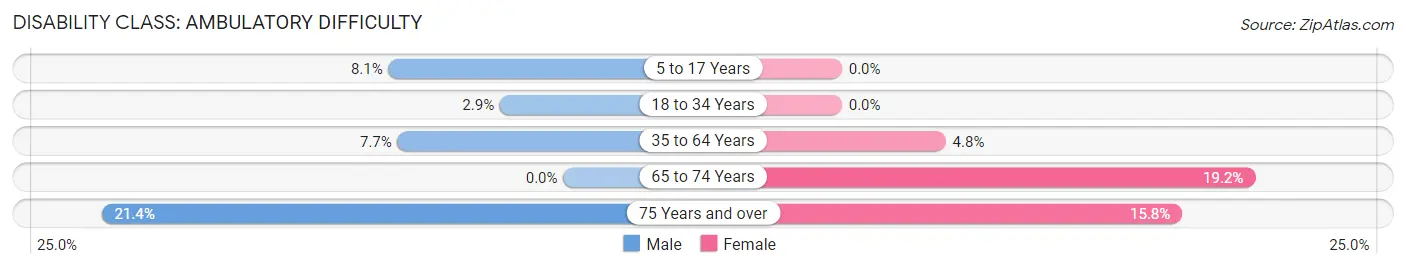
| Age Bracket | Male | Female |
| 5 to 17 Years | 3 (8.1%) | 0 (0.0%) |
| 18 to 34 Years | 2 (2.9%) | 0 (0.0%) |
| 35 to 64 Years | 6 (7.7%) | 4 (4.8%) |
| 65 to 74 Years | 0 (0.0%) | 14 (19.2%) |
| 75 Years and over | 6 (21.4%) | 9 (15.8%) |
Disability Class: Self-Care Difficulty
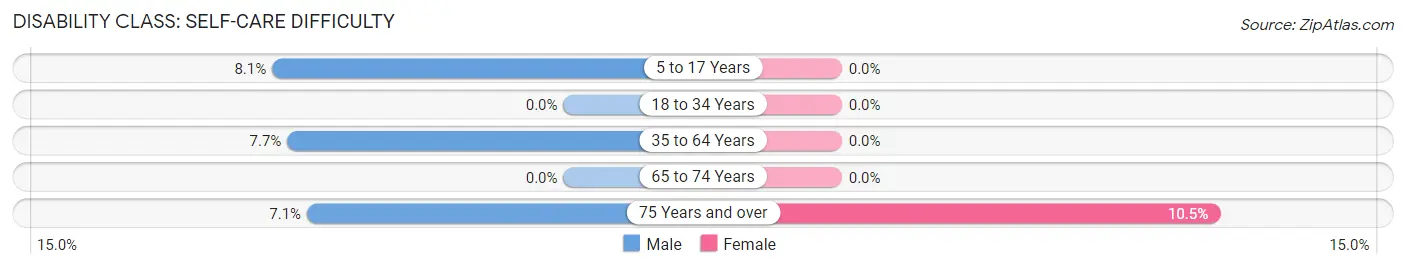
| Age Bracket | Male | Female |
| 5 to 17 Years | 3 (8.1%) | 0 (0.0%) |
| 18 to 34 Years | 0 (0.0%) | 0 (0.0%) |
| 35 to 64 Years | 6 (7.7%) | 0 (0.0%) |
| 65 to 74 Years | 0 (0.0%) | 0 (0.0%) |
| 75 Years and over | 2 (7.1%) | 6 (10.5%) |
Technology Access in Noxen
Computing Device Access in Noxen
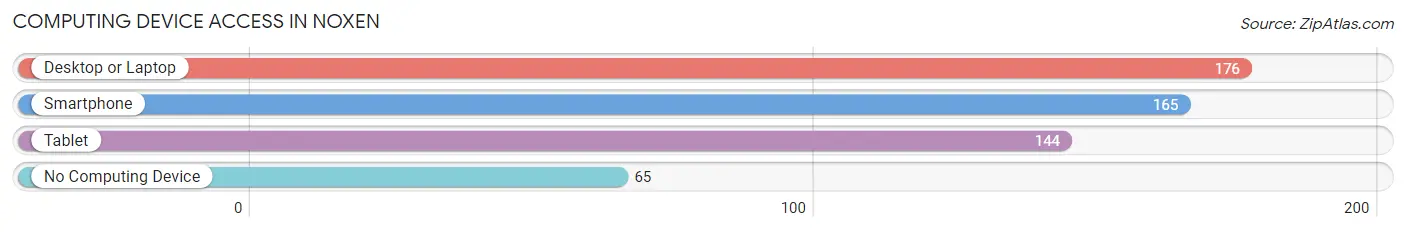
| Device Type | # Households | % Households |
| Desktop or Laptop | 176 | 65.9% |
| Smartphone | 165 | 61.8% |
| Tablet | 144 | 53.9% |
| No Computing Device | 65 | 24.3% |
| Total | 267 | 100.0% |
Internet Access in Noxen
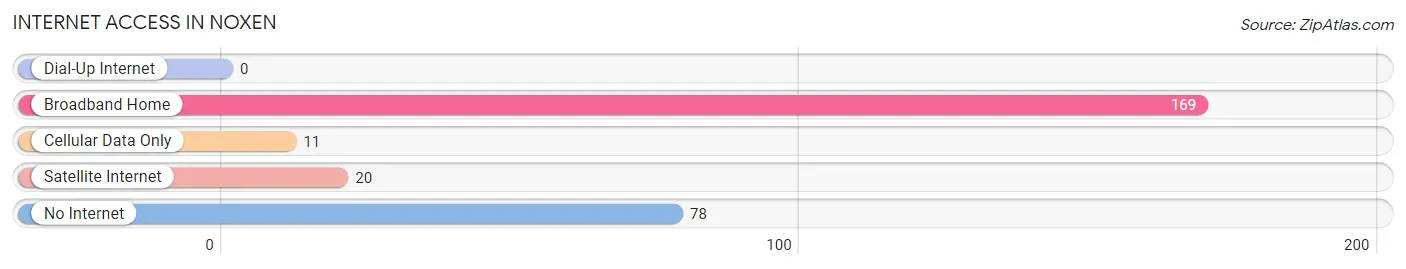
| Internet Type | # Households | % Households |
| Dial-Up Internet | 0 | 0.0% |
| Broadband Home | 169 | 63.3% |
| Cellular Data Only | 11 | 4.1% |
| Satellite Internet | 20 | 7.5% |
| No Internet | 78 | 29.2% |
| Total | 267 | 100.0% |
Noxen Summary
Noxen is a small unincorporated community located in Wyoming County, Pennsylvania. It is situated in the Endless Mountains region of the state, and is located approximately 10 miles south of Tunkhannock, the county seat. The population of Noxen was estimated to be around 500 in 2020.
History
Noxen was first settled in the late 1700s by a group of settlers from Connecticut. The town was originally known as "Noxen's Settlement" and was named after the Noxen family, who were among the first settlers. The town was officially incorporated in 1845.
In the late 1800s, Noxen was a thriving community with a variety of businesses, including a sawmill, gristmill, tannery, and a general store. The town also had a post office, a school, and several churches.
In the early 1900s, the town began to decline as the local economy shifted away from agriculture and industry. The population of Noxen decreased steadily throughout the 20th century, and by the 2000s, the town had become a small, rural community.
Geography
Noxen is located in the Endless Mountains region of Pennsylvania. The town is situated in the valley of the Noxen Creek, which flows through the town and empties into the Susquehanna River. The town is surrounded by rolling hills and forests, and is located approximately 10 miles south of Tunkhannock, the county seat.
Economy
The economy of Noxen is largely based on agriculture and tourism. The town is home to several farms, which produce a variety of crops, including corn, soybeans, hay, and wheat. The town also has several small businesses, including a general store, a gas station, and a few restaurants.
In recent years, Noxen has become a popular tourist destination. The town is home to several outdoor recreation areas, including Noxen State Park, which offers camping, fishing, and hiking. The town also hosts several annual events, including the Noxen Fall Festival and the Noxen Christmas Parade.
Demographics
As of the 2010 census, the population of Noxen was estimated to be around 500. The town is predominantly white, with a small minority population. The median household income in Noxen is around $45,000, and the median home value is around $150,000.
Conclusion
Noxen is a small, rural community located in Wyoming County, Pennsylvania. The town has a long history, and was once a thriving community with a variety of businesses. Today, the economy of Noxen is largely based on agriculture and tourism, and the town is home to several outdoor recreation areas. The population of Noxen is estimated to be around 500, and the town is predominantly white, with a small minority population.
Common Questions
What is Per Capita Income in Noxen?
Per Capita income in Noxen is $26,601.
What is the Median Family Income in Noxen?
Median Family Income in Noxen is $57,396.
What is the Median Household income in Noxen?
Median Household Income in Noxen is $62,898.
What is Income or Wage Gap in Noxen?
Income or Wage Gap in Noxen is 63.4%.
Women in Noxen earn 36.6 cents for every dollar earned by a man.
What is Inequality or Gini Index in Noxen?
Inequality or Gini Index in Noxen is 0.34.
What is the Total Population of Noxen?
Total Population of Noxen is 603.
What is the Total Male Population of Noxen?
Total Male Population of Noxen is 285.
What is the Total Female Population of Noxen?
Total Female Population of Noxen is 318.
What is the Ratio of Males per 100 Females in Noxen?
There are 89.62 Males per 100 Females in Noxen.
What is the Ratio of Females per 100 Males in Noxen?
There are 111.58 Females per 100 Males in Noxen.
What is the Median Population Age in Noxen?
Median Population Age in Noxen is 54.6 Years.
What is the Average Family Size in Noxen
Average Family Size in Noxen is 2.6 People.
What is the Average Household Size in Noxen
Average Household Size in Noxen is 2.3 People.
How Large is the Labor Force in Noxen?
There are 277 People in the Labor Forcein in Noxen.
What is the Percentage of People in the Labor Force in Noxen?
51.3% of People are in the Labor Force in Noxen.
What is the Unemployment Rate in Noxen?
Unemployment Rate in Noxen is 17.3%.