Donaldson, PA Map & Demographics
Donaldson Map
Donaldson Overview
$23,880
PER CAPITA INCOME
$72,500
AVG FAMILY INCOME
$57,500
AVG HOUSEHOLD INCOME
34.9%
WAGE / INCOME GAP [ % ]
65.1¢/ $1
WAGE / INCOME GAP [ $ ]
0.36
INEQUALITY / GINI INDEX
352
TOTAL POPULATION
205
MALE POPULATION
147
FEMALE POPULATION
139.46
MALES / 100 FEMALES
71.71
FEMALES / 100 MALES
35.8
MEDIAN AGE
3.3
AVG FAMILY SIZE
2.8
AVG HOUSEHOLD SIZE
185
LABOR FORCE [ PEOPLE ]
65.8%
PERCENT IN LABOR FORCE
4.9%
UNEMPLOYMENT RATE
Donaldson Area Codes
Income in Donaldson
Income Overview in Donaldson
Per Capita Income in Donaldson is $23,880, while median incomes of families and households are $72,500 and $57,500 respectively.
| Characteristic | Number | Measure |
| Per Capita Income | 352 | $23,880 |
| Median Family Income | 94 | $72,500 |
| Mean Family Income | 94 | $74,594 |
| Median Household Income | 124 | $57,500 |
| Mean Household Income | 124 | $67,955 |
| Income Deficit | 94 | $0 |
| Wage / Income Gap (%) | 352 | 34.90% |
| Wage / Income Gap ($) | 352 | 65.10¢ per $1 |
| Gini / Inequality Index | 352 | 0.36 |
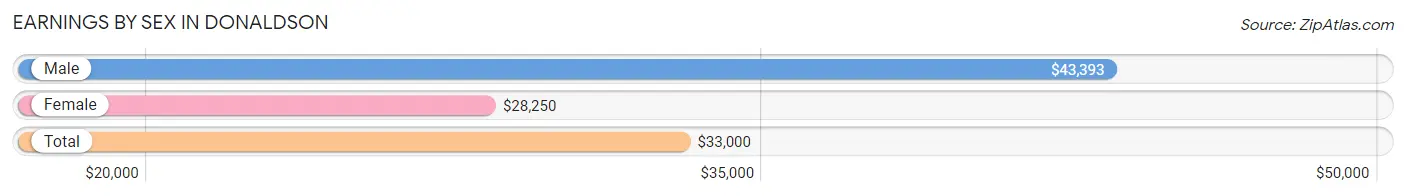
Earnings by Sex in Donaldson
Average Earnings in Donaldson are $33,000, $43,393 for men and $28,250 for women, a difference of 34.9%.
| Sex | Number | Average Earnings |
| Male | 103 (54.8%) | $43,393 |
| Female | 85 (45.2%) | $28,250 |
| Total | 188 (100.0%) | $33,000 |
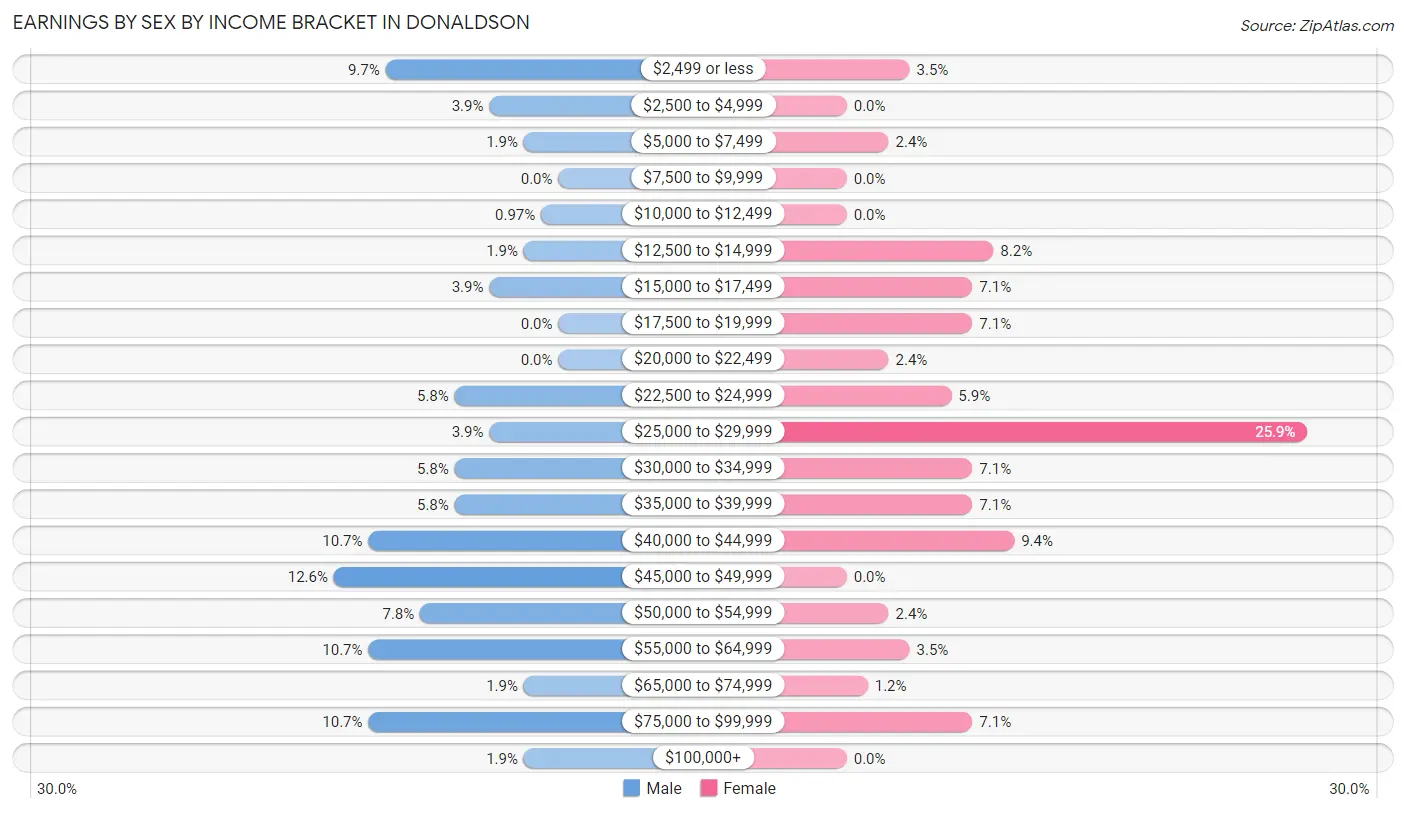
Earnings by Sex by Income Bracket in Donaldson
The most common earnings brackets in Donaldson are $45,000 to $49,999 for men (13 | 12.6%) and $25,000 to $29,999 for women (22 | 25.9%).
| Income | Male | Female |
| $2,499 or less | 10 (9.7%) | 3 (3.5%) |
| $2,500 to $4,999 | 4 (3.9%) | 0 (0.0%) |
| $5,000 to $7,499 | 2 (1.9%) | 2 (2.4%) |
| $7,500 to $9,999 | 0 (0.0%) | 0 (0.0%) |
| $10,000 to $12,499 | 1 (1.0%) | 0 (0.0%) |
| $12,500 to $14,999 | 2 (1.9%) | 7 (8.2%) |
| $15,000 to $17,499 | 4 (3.9%) | 6 (7.1%) |
| $17,500 to $19,999 | 0 (0.0%) | 6 (7.1%) |
| $20,000 to $22,499 | 0 (0.0%) | 2 (2.4%) |
| $22,500 to $24,999 | 6 (5.8%) | 5 (5.9%) |
| $25,000 to $29,999 | 4 (3.9%) | 22 (25.9%) |
| $30,000 to $34,999 | 6 (5.8%) | 6 (7.1%) |
| $35,000 to $39,999 | 6 (5.8%) | 6 (7.1%) |
| $40,000 to $44,999 | 11 (10.7%) | 8 (9.4%) |
| $45,000 to $49,999 | 13 (12.6%) | 0 (0.0%) |
| $50,000 to $54,999 | 8 (7.8%) | 2 (2.4%) |
| $55,000 to $64,999 | 11 (10.7%) | 3 (3.5%) |
| $65,000 to $74,999 | 2 (1.9%) | 1 (1.2%) |
| $75,000 to $99,999 | 11 (10.7%) | 6 (7.1%) |
| $100,000+ | 2 (1.9%) | 0 (0.0%) |
| Total | 103 (100.0%) | 85 (100.0%) |
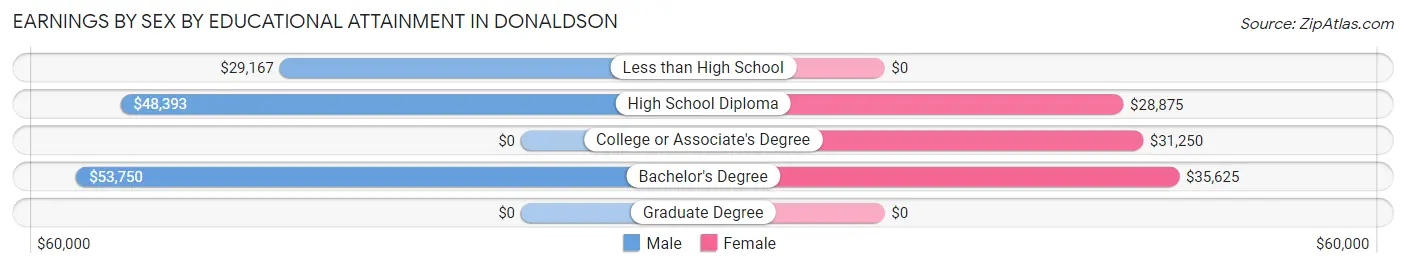
Earnings by Sex by Educational Attainment in Donaldson
Average earnings in Donaldson are $48,056 for men and $29,333 for women, a difference of 39.0%. Men with an educational attainment of bachelor's degree enjoy the highest average annual earnings of $53,750, while those with less than high school education earn the least with $29,167. Women with an educational attainment of bachelor's degree earn the most with the average annual earnings of $35,625, while those with high school diploma education have the smallest earnings of $28,875.
| Educational Attainment | Male Income | Female Income |
| Less than High School | $29,167 | $0 |
| High School Diploma | $48,393 | $28,875 |
| College or Associate's Degree | - | - |
| Bachelor's Degree | $53,750 | $35,625 |
| Graduate Degree | - | - |
| Total | $48,056 | $29,333 |
Family Income in Donaldson
Family Income Brackets in Donaldson
According to the Donaldson family income data, there are 26 families falling into the $100,000 to $149,999 income range, which is the most common income bracket and makes up 27.7% of all families.
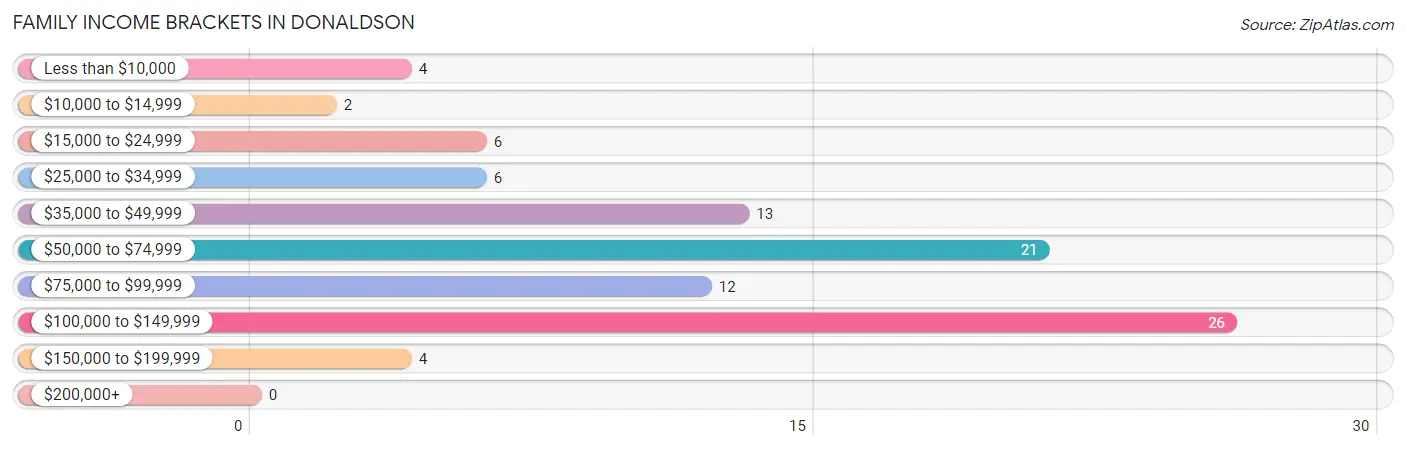
| Income Bracket | # Families | % Families |
| Less than $10,000 | 4 | 4.3% |
| $10,000 to $14,999 | 2 | 2.1% |
| $15,000 to $24,999 | 6 | 6.4% |
| $25,000 to $34,999 | 6 | 6.4% |
| $35,000 to $49,999 | 13 | 13.8% |
| $50,000 to $74,999 | 21 | 22.3% |
| $75,000 to $99,999 | 12 | 12.8% |
| $100,000 to $149,999 | 26 | 27.7% |
| $150,000 to $199,999 | 4 | 4.3% |
| $200,000+ | 0 | 0.0% |
Family Income by Famaliy Size in Donaldson
6-person families (10 | 10.6%) account for the highest median family income in Donaldson with $103,500 per family, while 3-person families (29 | 30.8%) have the highest median income of $30,885 per family member.
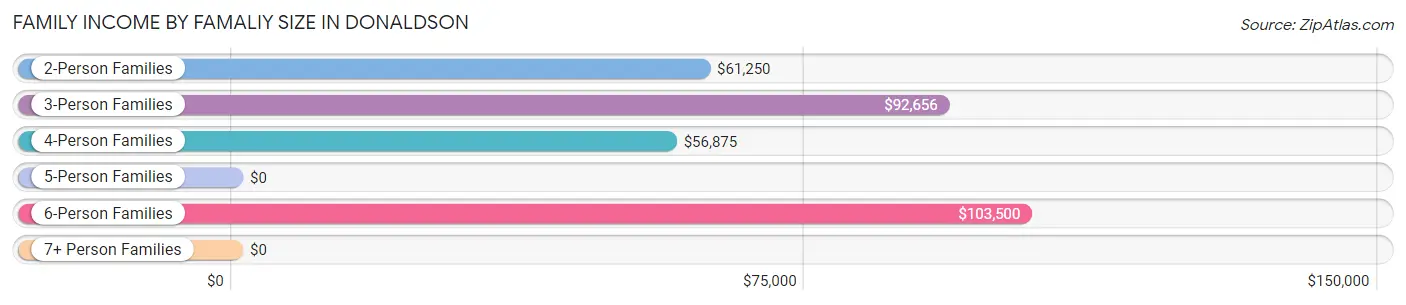
| Income Bracket | # Families | Median Income |
| 2-Person Families | 31 (33.0%) | $61,250 |
| 3-Person Families | 29 (30.8%) | $92,656 |
| 4-Person Families | 22 (23.4%) | $56,875 |
| 5-Person Families | 2 (2.1%) | $0 |
| 6-Person Families | 10 (10.6%) | $103,500 |
| 7+ Person Families | 0 (0.0%) | $0 |
| Total | 94 (100.0%) | $72,500 |
Family Income by Number of Earners in Donaldson
The median family income in Donaldson is $72,500, with families comprising 3+ earners (15) having the highest median family income of $104,750, while families with no earners (16) have the lowest median family income of $30,000, accounting for 16.0% and 17.0% of families, respectively.
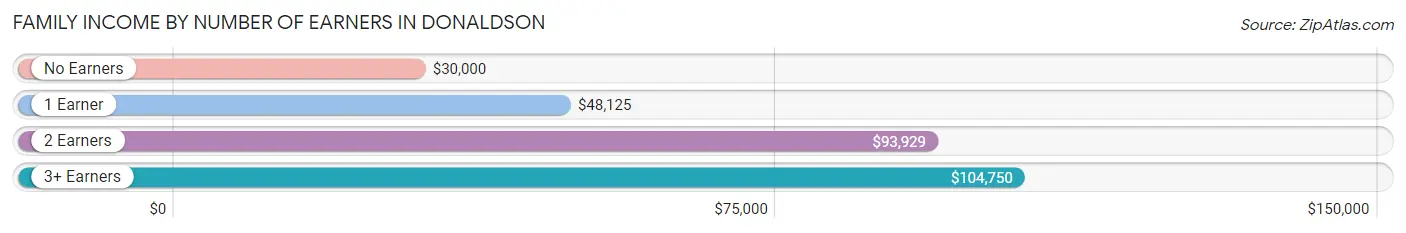
| Number of Earners | # Families | Median Income |
| No Earners | 16 (17.0%) | $30,000 |
| 1 Earner | 21 (22.3%) | $48,125 |
| 2 Earners | 42 (44.7%) | $93,929 |
| 3+ Earners | 15 (16.0%) | $104,750 |
| Total | 94 (100.0%) | $72,500 |
Household Income in Donaldson
Household Income Brackets in Donaldson
With 29 households falling in the category, the $100,000 to $149,999 income range is the most frequent in Donaldson, accounting for 23.4% of all households.
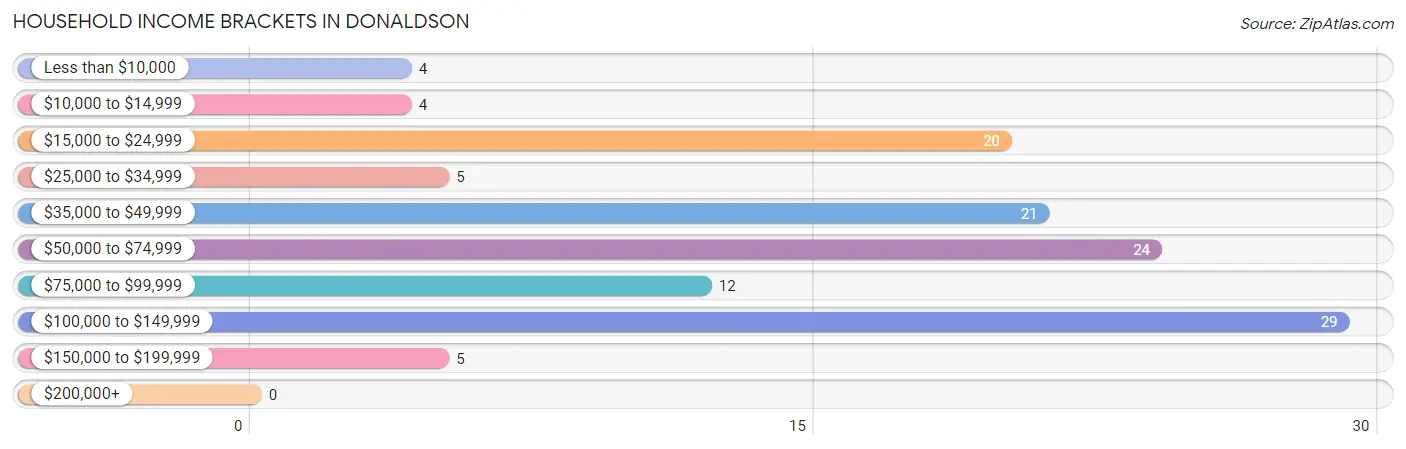
| Income Bracket | # Households | % Households |
| Less than $10,000 | 4 | 3.2% |
| $10,000 to $14,999 | 4 | 3.2% |
| $15,000 to $24,999 | 20 | 16.1% |
| $25,000 to $34,999 | 5 | 4.0% |
| $35,000 to $49,999 | 21 | 16.9% |
| $50,000 to $74,999 | 24 | 19.4% |
| $75,000 to $99,999 | 12 | 9.7% |
| $100,000 to $149,999 | 29 | 23.4% |
| $150,000 to $199,999 | 5 | 4.0% |
| $200,000+ | 0 | 0.0% |
Household Income by Householder Age in Donaldson
The median household income in Donaldson is $57,500, with the highest median household income of $70,625 found in the 25 to 44 years age bracket for the primary householder. A total of 27 households (21.8%) fall into this category. Meanwhile, the 15 to 24 years age bracket for the primary householder has the lowest median household income of $0, with 2 households (1.6%) in this group.
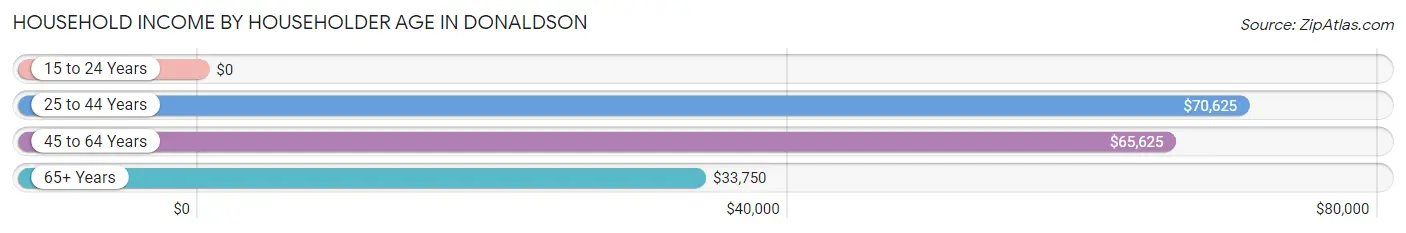
| Income Bracket | # Households | Median Income |
| 15 to 24 Years | 2 (1.6%) | $0 |
| 25 to 44 Years | 27 (21.8%) | $70,625 |
| 45 to 64 Years | 63 (50.8%) | $65,625 |
| 65+ Years | 32 (25.8%) | $33,750 |
| Total | 124 (100.0%) | $57,500 |
Poverty in Donaldson
Income Below Poverty by Sex and Age in Donaldson
With 9.8% poverty level for males and 11.6% for females among the residents of Donaldson, under 5 year old males and under 5 year old females are the most vulnerable to poverty, with 3 males (50.0%) and 1 females (50.0%) in their respective age groups living below the poverty level.
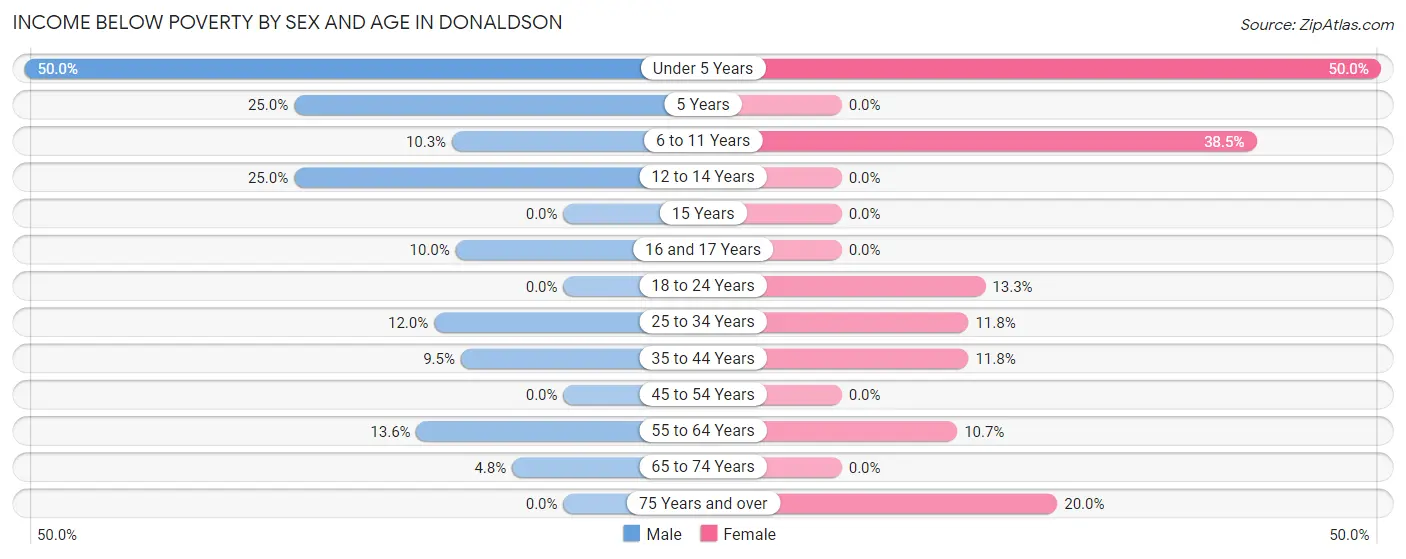
| Age Bracket | Male | Female |
| Under 5 Years | 3 (50.0%) | 1 (50.0%) |
| 5 Years | 1 (25.0%) | 0 (0.0%) |
| 6 to 11 Years | 3 (10.3%) | 5 (38.5%) |
| 12 to 14 Years | 3 (25.0%) | 0 (0.0%) |
| 15 Years | 0 (0.0%) | 0 (0.0%) |
| 16 and 17 Years | 1 (10.0%) | 0 (0.0%) |
| 18 to 24 Years | 0 (0.0%) | 2 (13.3%) |
| 25 to 34 Years | 3 (12.0%) | 2 (11.8%) |
| 35 to 44 Years | 2 (9.5%) | 2 (11.8%) |
| 45 to 54 Years | 0 (0.0%) | 0 (0.0%) |
| 55 to 64 Years | 3 (13.6%) | 3 (10.7%) |
| 65 to 74 Years | 1 (4.8%) | 0 (0.0%) |
| 75 Years and over | 0 (0.0%) | 2 (20.0%) |
| Total | 20 (9.8%) | 17 (11.6%) |
Income Above Poverty by Sex and Age in Donaldson
According to the poverty statistics in Donaldson, males aged 15 years and females aged 5 years are the age groups that are most secure financially, with 100.0% of males and 100.0% of females in these age groups living above the poverty line.
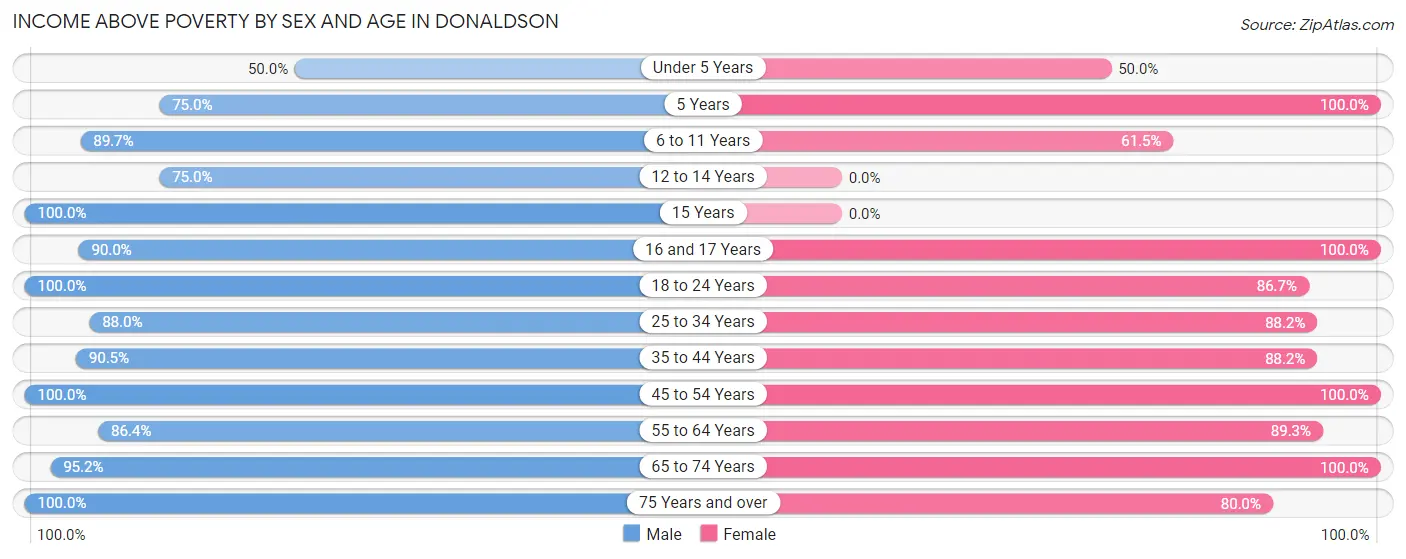
| Age Bracket | Male | Female |
| Under 5 Years | 3 (50.0%) | 1 (50.0%) |
| 5 Years | 3 (75.0%) | 4 (100.0%) |
| 6 to 11 Years | 26 (89.7%) | 8 (61.5%) |
| 12 to 14 Years | 9 (75.0%) | 0 (0.0%) |
| 15 Years | 1 (100.0%) | 0 (0.0%) |
| 16 and 17 Years | 9 (90.0%) | 7 (100.0%) |
| 18 to 24 Years | 27 (100.0%) | 13 (86.7%) |
| 25 to 34 Years | 22 (88.0%) | 15 (88.2%) |
| 35 to 44 Years | 19 (90.5%) | 15 (88.2%) |
| 45 to 54 Years | 22 (100.0%) | 21 (100.0%) |
| 55 to 64 Years | 19 (86.4%) | 25 (89.3%) |
| 65 to 74 Years | 20 (95.2%) | 13 (100.0%) |
| 75 Years and over | 5 (100.0%) | 8 (80.0%) |
| Total | 185 (90.2%) | 130 (88.4%) |
Income Below Poverty Among Married-Couple Families in Donaldson
The poverty statistics for married-couple families in Donaldson show that 2.9% or 2 of the total 70 families live below the poverty line. Families with no children have the highest poverty rate of 5.4%, comprising of 2 families. On the other hand, families with 1 or 2 children have the lowest poverty rate of 0.0%, which includes 0 families.
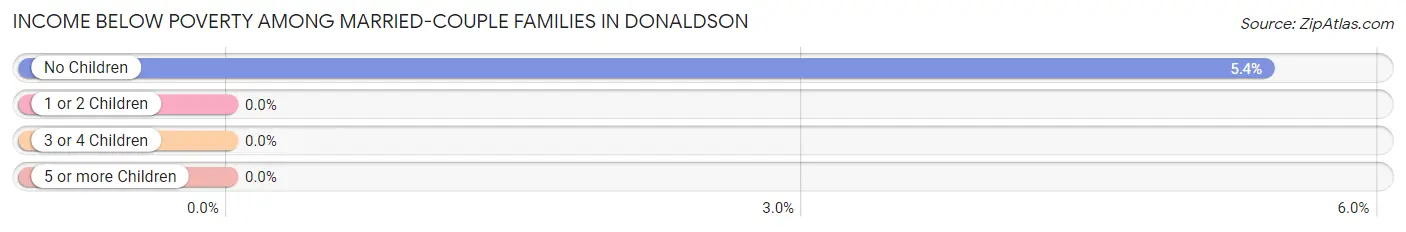
| Children | Above Poverty | Below Poverty |
| No Children | 35 (94.6%) | 2 (5.4%) |
| 1 or 2 Children | 29 (100.0%) | 0 (0.0%) |
| 3 or 4 Children | 4 (100.0%) | 0 (0.0%) |
| 5 or more Children | 0 (0.0%) | 0 (0.0%) |
| Total | 68 (97.1%) | 2 (2.9%) |
Income Below Poverty Among Single-Parent Households in Donaldson
According to the poverty data in Donaldson, 33.3% or 4 single-father households and 50.0% or 6 single-mother households are living below the poverty line. Among single-father households, those with 1 or 2 children have the highest poverty rate, with 3 households (100.0%) experiencing poverty. Likewise, among single-mother households, those with 3 or 4 children have the highest poverty rate, with 2 households (100.0%) falling below the poverty line.
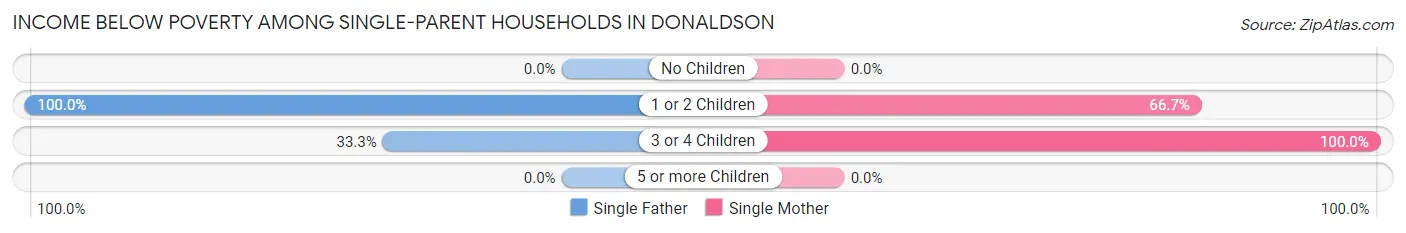
| Children | Single Father | Single Mother |
| No Children | 0 (0.0%) | 0 (0.0%) |
| 1 or 2 Children | 3 (100.0%) | 4 (66.7%) |
| 3 or 4 Children | 1 (33.3%) | 2 (100.0%) |
| 5 or more Children | 0 (0.0%) | 0 (0.0%) |
| Total | 4 (33.3%) | 6 (50.0%) |
Income Below Poverty Among Married-Couple vs Single-Parent Households in Donaldson
The poverty data for Donaldson shows that 2 of the married-couple family households (2.9%) and 10 of the single-parent households (41.7%) are living below the poverty level. Within the married-couple family households, those with no children have the highest poverty rate, with 2 households (5.4%) falling below the poverty line. Among the single-parent households, those with 1 or 2 children have the highest poverty rate, with 7 household (77.8%) living below poverty.
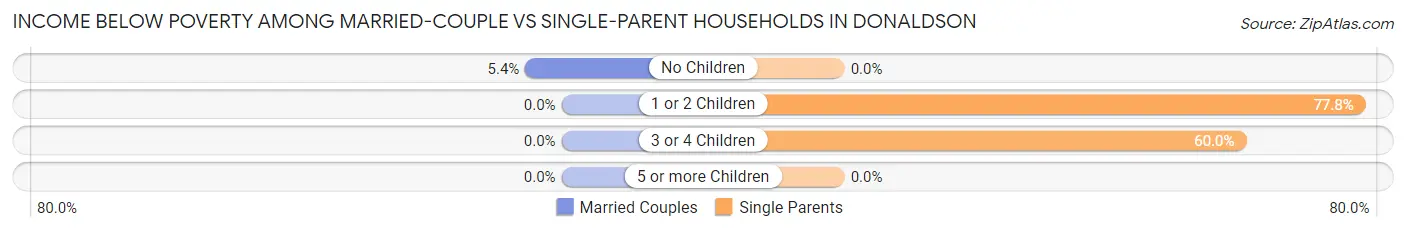
| Children | Married-Couple Families | Single-Parent Households |
| No Children | 2 (5.4%) | 0 (0.0%) |
| 1 or 2 Children | 0 (0.0%) | 7 (77.8%) |
| 3 or 4 Children | 0 (0.0%) | 3 (60.0%) |
| 5 or more Children | 0 (0.0%) | 0 (0.0%) |
| Total | 2 (2.9%) | 10 (41.7%) |
Race in Donaldson
The most populous races in Donaldson are White / Caucasian (334 | 94.9%), Two or more Races (18 | 5.1%), and Hispanic or Latino (5 | 1.4%).
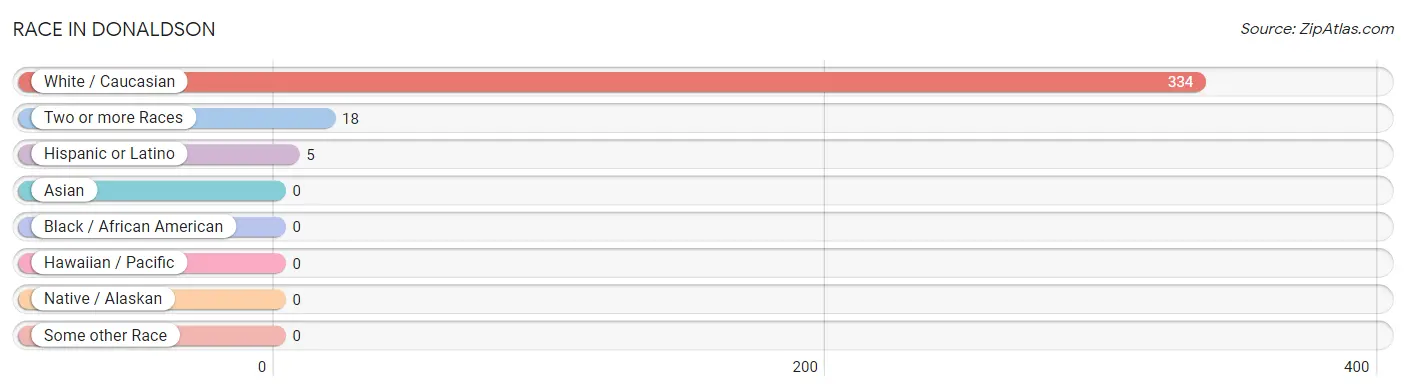
| Race | # Population | % Population |
| Asian | 0 | 0.0% |
| Black / African American | 0 | 0.0% |
| Hawaiian / Pacific | 0 | 0.0% |
| Hispanic or Latino | 5 | 1.4% |
| Native / Alaskan | 0 | 0.0% |
| White / Caucasian | 334 | 94.9% |
| Two or more Races | 18 | 5.1% |
| Some other Race | 0 | 0.0% |
| Total | 352 | 100.0% |
Ancestry in Donaldson
The most populous ancestries reported in Donaldson are German (120 | 34.1%), Irish (39 | 11.1%), Slovak (17 | 4.8%), English (13 | 3.7%), and Korean (13 | 3.7%), together accounting for 57.4% of all Donaldson residents.
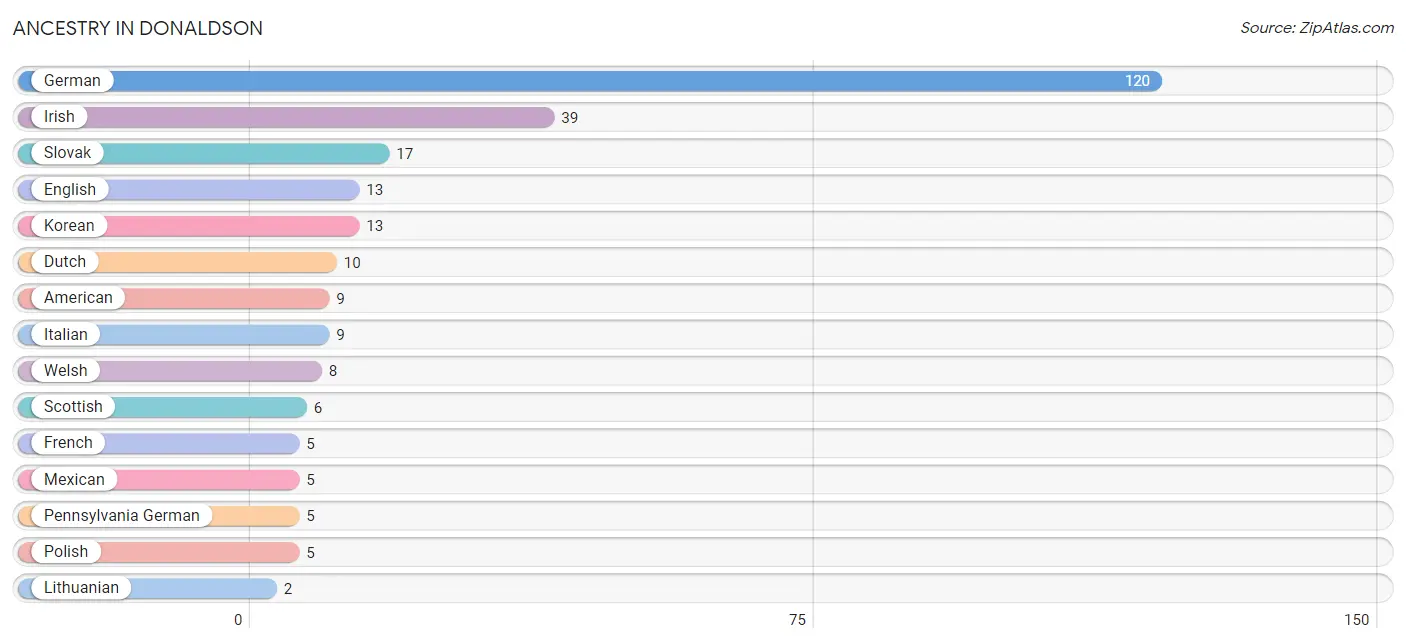
| Ancestry | # Population | % Population |
| American | 9 | 2.6% |
| Czechoslovakian | 1 | 0.3% |
| Dutch | 10 | 2.8% |
| Eastern European | 1 | 0.3% |
| English | 13 | 3.7% |
| French | 5 | 1.4% |
| German | 120 | 34.1% |
| Greek | 1 | 0.3% |
| Irish | 39 | 11.1% |
| Italian | 9 | 2.6% |
| Korean | 13 | 3.7% |
| Lithuanian | 2 | 0.6% |
| Mexican | 5 | 1.4% |
| Northern European | 2 | 0.6% |
| Pennsylvania German | 5 | 1.4% |
| Polish | 5 | 1.4% |
| Scottish | 6 | 1.7% |
| Slovak | 17 | 4.8% |
| Welsh | 8 | 2.3% | View All 19 Rows |
Immigrants in Donaldson
The most numerous immigrant groups reported in Donaldson came from Central America (5 | 1.4%), Latin America (5 | 1.4%), Mexico (5 | 1.4%), Asia (2 | 0.6%), and Philippines (2 | 0.6%), together accounting for 5.4% of all Donaldson residents.
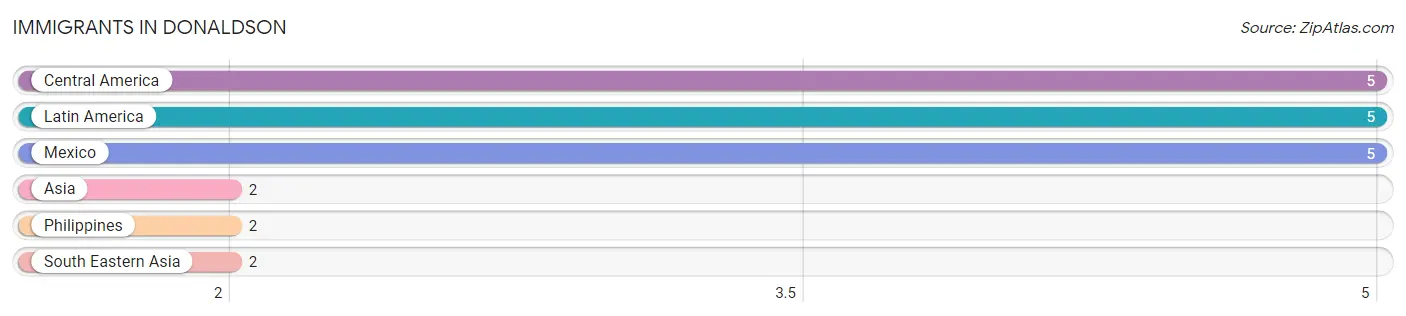
| Immigration Origin | # Population | % Population |
| Asia | 2 | 0.6% |
| Central America | 5 | 1.4% |
| Latin America | 5 | 1.4% |
| Mexico | 5 | 1.4% |
| Philippines | 2 | 0.6% |
| South Eastern Asia | 2 | 0.6% | View All 6 Rows |
Sex and Age in Donaldson
Sex and Age in Donaldson
The most populous age groups in Donaldson are 5 to 9 Years (31 | 15.1%) for men and 55 to 59 Years (20 | 13.6%) for women.
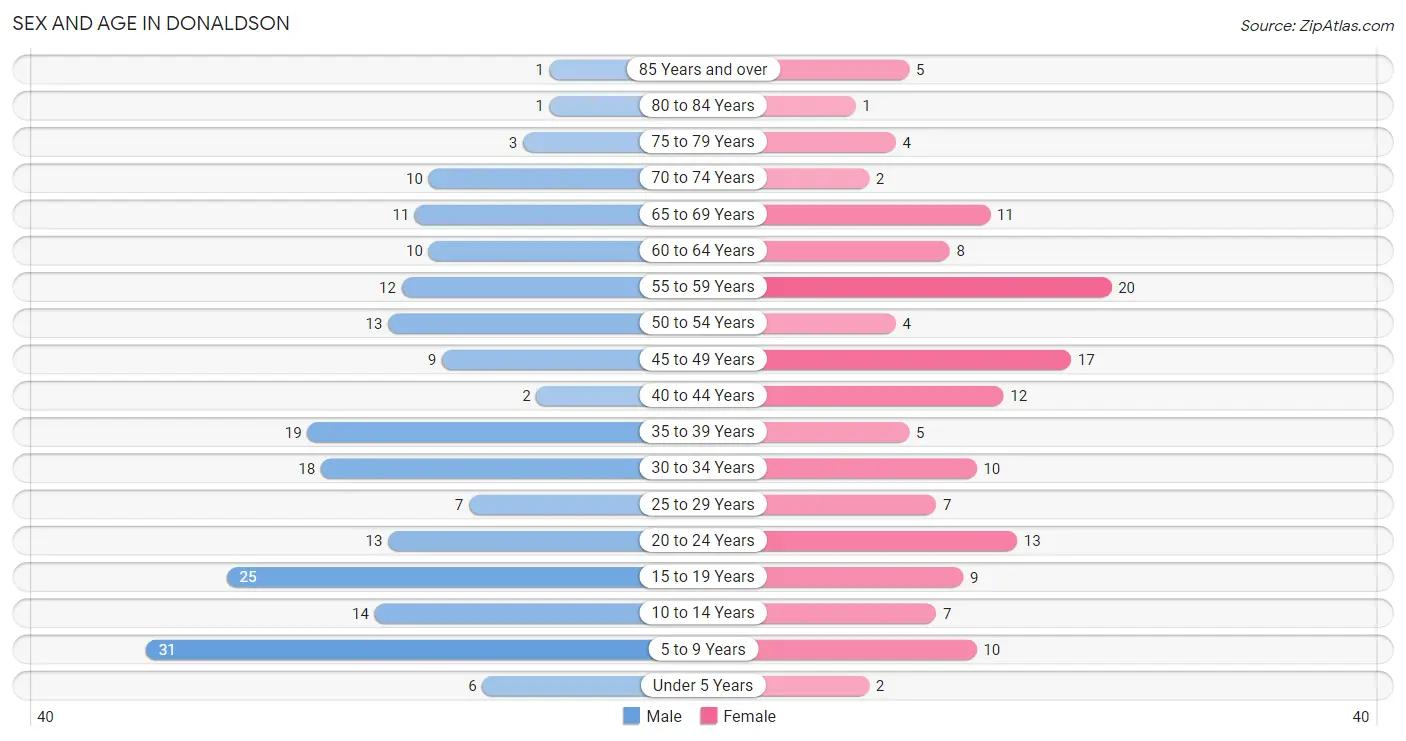
| Age Bracket | Male | Female |
| Under 5 Years | 6 (2.9%) | 2 (1.4%) |
| 5 to 9 Years | 31 (15.1%) | 10 (6.8%) |
| 10 to 14 Years | 14 (6.8%) | 7 (4.8%) |
| 15 to 19 Years | 25 (12.2%) | 9 (6.1%) |
| 20 to 24 Years | 13 (6.3%) | 13 (8.8%) |
| 25 to 29 Years | 7 (3.4%) | 7 (4.8%) |
| 30 to 34 Years | 18 (8.8%) | 10 (6.8%) |
| 35 to 39 Years | 19 (9.3%) | 5 (3.4%) |
| 40 to 44 Years | 2 (1.0%) | 12 (8.2%) |
| 45 to 49 Years | 9 (4.4%) | 17 (11.6%) |
| 50 to 54 Years | 13 (6.3%) | 4 (2.7%) |
| 55 to 59 Years | 12 (5.9%) | 20 (13.6%) |
| 60 to 64 Years | 10 (4.9%) | 8 (5.4%) |
| 65 to 69 Years | 11 (5.4%) | 11 (7.5%) |
| 70 to 74 Years | 10 (4.9%) | 2 (1.4%) |
| 75 to 79 Years | 3 (1.5%) | 4 (2.7%) |
| 80 to 84 Years | 1 (0.5%) | 1 (0.7%) |
| 85 Years and over | 1 (0.5%) | 5 (3.4%) |
| Total | 205 (100.0%) | 147 (100.0%) |
Families and Households in Donaldson
Median Family Size in Donaldson
The median family size in Donaldson is 3.33 persons per family, with married-couple families (70 | 74.5%) accounting for the largest median family size of 3.6 persons per family. On the other hand, single female/mother families (12 | 12.8%) represent the smallest median family size with 2.50 persons per family.
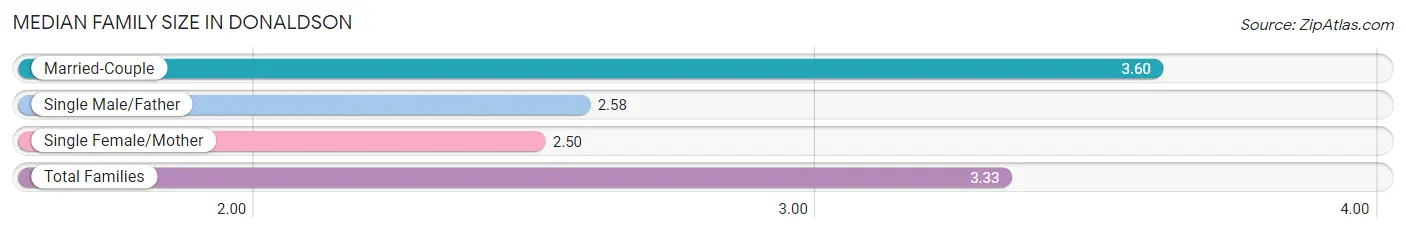
| Family Type | # Families | Family Size |
| Married-Couple | 70 (74.5%) | 3.60 |
| Single Male/Father | 12 (12.8%) | 2.58 |
| Single Female/Mother | 12 (12.8%) | 2.50 |
| Total Families | 94 (100.0%) | 3.33 |
Median Household Size in Donaldson
The median household size in Donaldson is 2.84 persons per household, with married-couple households (70 | 56.5%) accounting for the largest median household size of 3.63 persons per household. non-family households (30 | 24.2%) represent the smallest median household size with 1.07 persons per household.
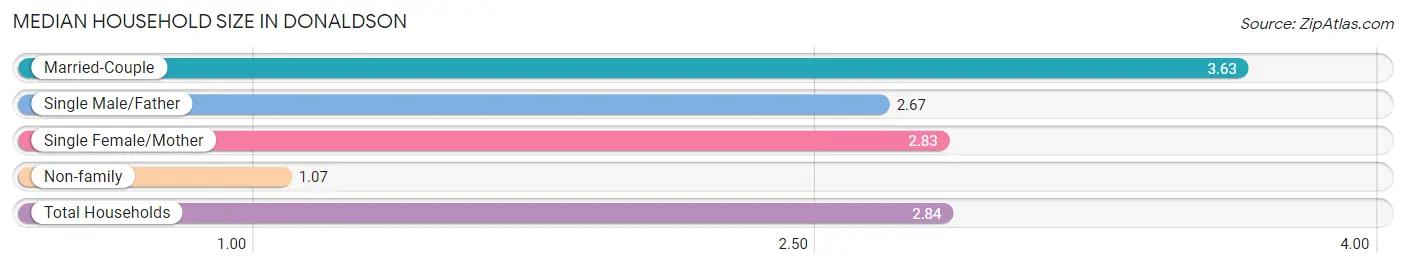
| Household Type | # Households | Household Size |
| Married-Couple | 70 (56.5%) | 3.63 |
| Single Male/Father | 12 (9.7%) | 2.67 |
| Single Female/Mother | 12 (9.7%) | 2.83 |
| Non-family | 30 (24.2%) | 1.07 |
| Total Households | 124 (100.0%) | 2.84 |
Household Size by Marriage Status in Donaldson
Out of a total of 124 households in Donaldson, 94 (75.8%) are family households, while 30 (24.2%) are nonfamily households. The most numerous type of family households are 2-person households, comprising 30, and the most common type of nonfamily households are 1-person households, comprising 28.
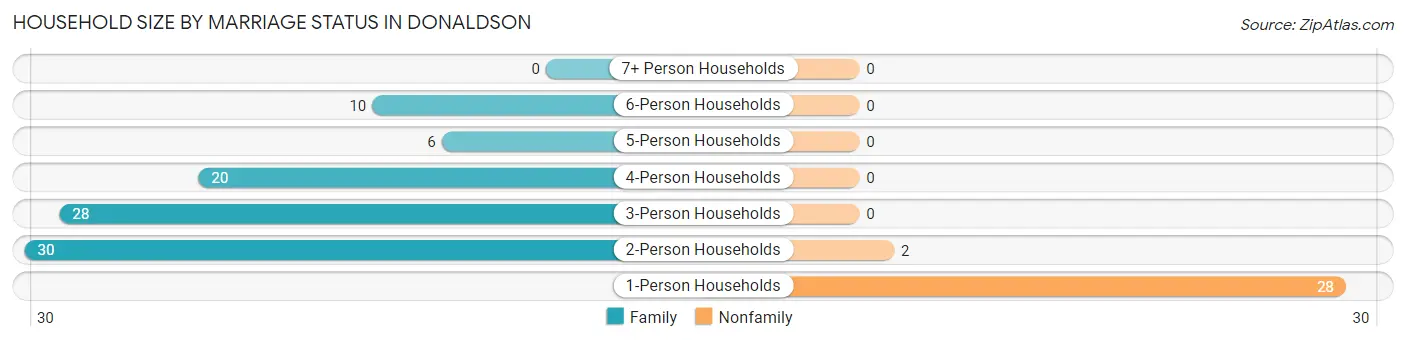
| Household Size | Family Households | Nonfamily Households |
| 1-Person Households | - | 28 (22.6%) |
| 2-Person Households | 30 (24.2%) | 2 (1.6%) |
| 3-Person Households | 28 (22.6%) | 0 (0.0%) |
| 4-Person Households | 20 (16.1%) | 0 (0.0%) |
| 5-Person Households | 6 (4.8%) | 0 (0.0%) |
| 6-Person Households | 10 (8.1%) | 0 (0.0%) |
| 7+ Person Households | 0 (0.0%) | 0 (0.0%) |
| Total | 94 (75.8%) | 30 (24.2%) |
Female Fertility in Donaldson
Fertility by Age in Donaldson
Average fertility rate in Donaldson is 27.0 births per 1,000 women. Women in the age bracket of 20 to 34 years have the highest fertility rate with 67.0 births per 1,000 women. Women in the age bracket of 20 to 34 years acount for 100.0% of all women with births.
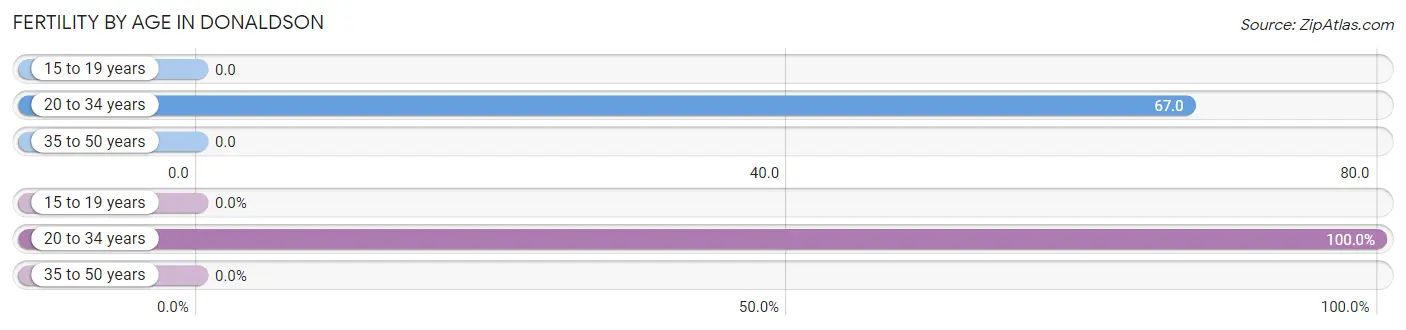
| Age Bracket | Women with Births | Births / 1,000 Women |
| 15 to 19 years | 0 (0.0%) | 0.0 |
| 20 to 34 years | 2 (100.0%) | 67.0 |
| 35 to 50 years | 0 (0.0%) | 0.0 |
| Total | 2 (100.0%) | 27.0 |
Fertility by Age by Marriage Status in Donaldson
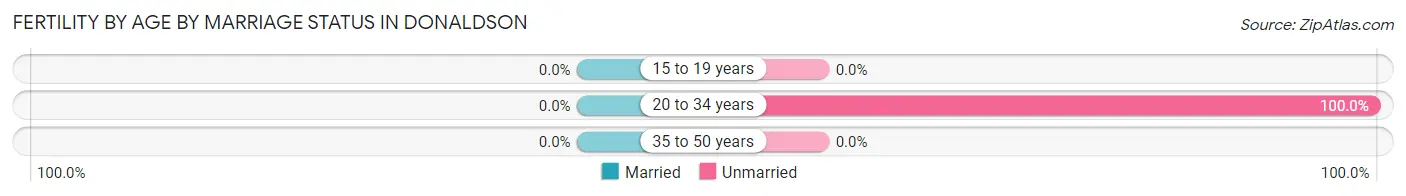
| Age Bracket | Married | Unmarried |
| 15 to 19 years | 0 (0.0%) | 0 (0.0%) |
| 20 to 34 years | 0 (0.0%) | 2 (100.0%) |
| 35 to 50 years | 0 (0.0%) | 0 (0.0%) |
| Total | 0 (0.0%) | 2 (100.0%) |
Fertility by Education in Donaldson
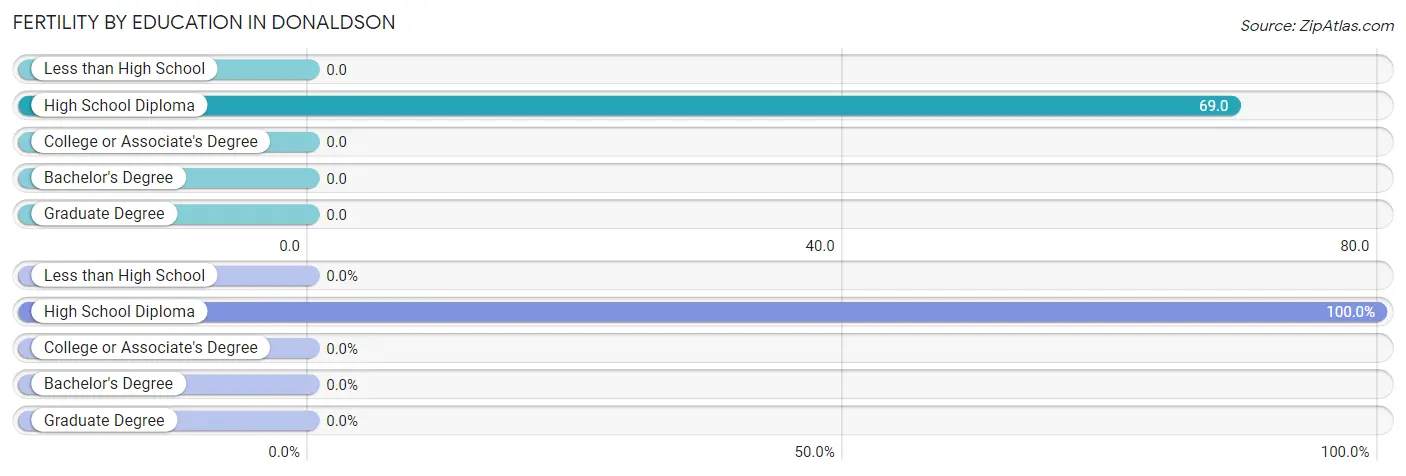
| Educational Attainment | Women with Births | Births / 1,000 Women |
| Less than High School | 0 (0.0%) | 0.0 |
| High School Diploma | 2 (100.0%) | 69.0 |
| College or Associate's Degree | 0 (0.0%) | 0.0 |
| Bachelor's Degree | 0 (0.0%) | 0.0 |
| Graduate Degree | 0 (0.0%) | 0.0 |
| Total | 2 (100.0%) | 27.0 |
Fertility by Education by Marriage Status in Donaldson
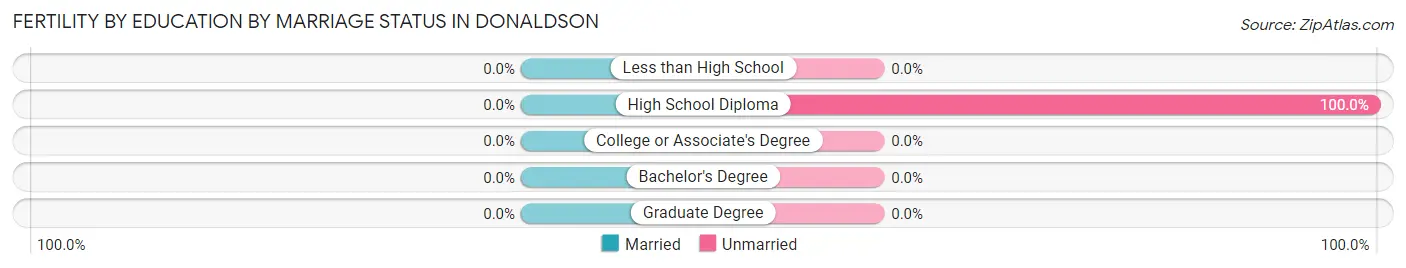
| Educational Attainment | Married | Unmarried |
| Less than High School | 0 (0.0%) | 0 (0.0%) |
| High School Diploma | 0 (0.0%) | 2 (100.0%) |
| College or Associate's Degree | 0 (0.0%) | 0 (0.0%) |
| Bachelor's Degree | 0 (0.0%) | 0 (0.0%) |
| Graduate Degree | 0 (0.0%) | 0 (0.0%) |
| Total | 0 (0.0%) | 2 (100.0%) |
Employment Characteristics in Donaldson
Employment by Class of Employer in Donaldson
Among the 176 employed individuals in Donaldson, private company employees (150 | 85.2%), not-for-profit organizations (8 | 4.5%), and self-employed (not incorporated) (5 | 2.8%) make up the most common classes of employment.
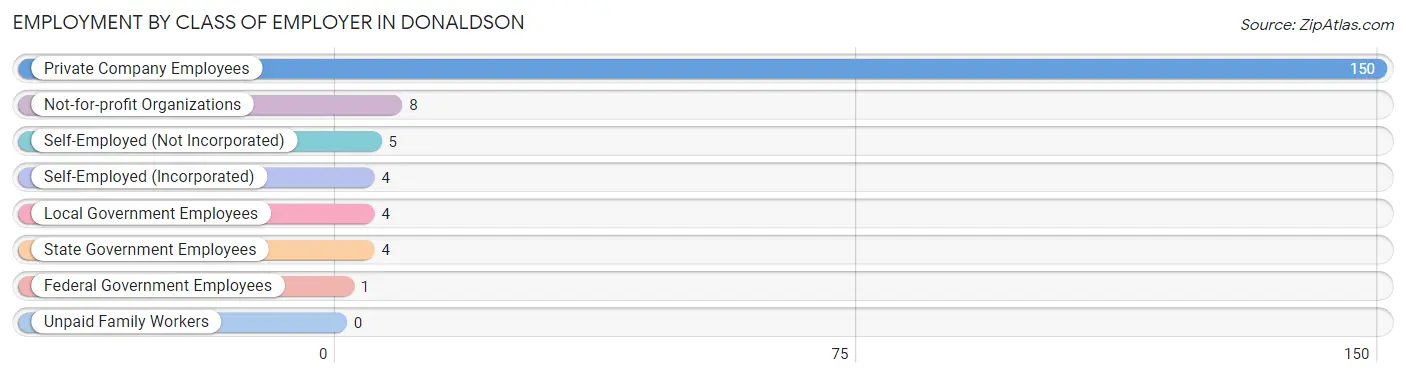
| Employer Class | # Employees | % Employees |
| Private Company Employees | 150 | 85.2% |
| Self-Employed (Incorporated) | 4 | 2.3% |
| Self-Employed (Not Incorporated) | 5 | 2.8% |
| Not-for-profit Organizations | 8 | 4.5% |
| Local Government Employees | 4 | 2.3% |
| State Government Employees | 4 | 2.3% |
| Federal Government Employees | 1 | 0.6% |
| Unpaid Family Workers | 0 | 0.0% |
| Total | 176 | 100.0% |
Employment Status by Age in Donaldson
According to the labor force statistics for Donaldson, out of the total population over 16 years of age (281), 65.8% or 185 individuals are in the labor force, with 4.9% or 9 of them unemployed. The age group with the highest labor force participation rate is 30 to 34 years, with 100.0% or 28 individuals in the labor force. Within the labor force, the 20 to 24 years age range has the highest percentage of unemployed individuals, with 15.8% or 3 of them being unemployed.
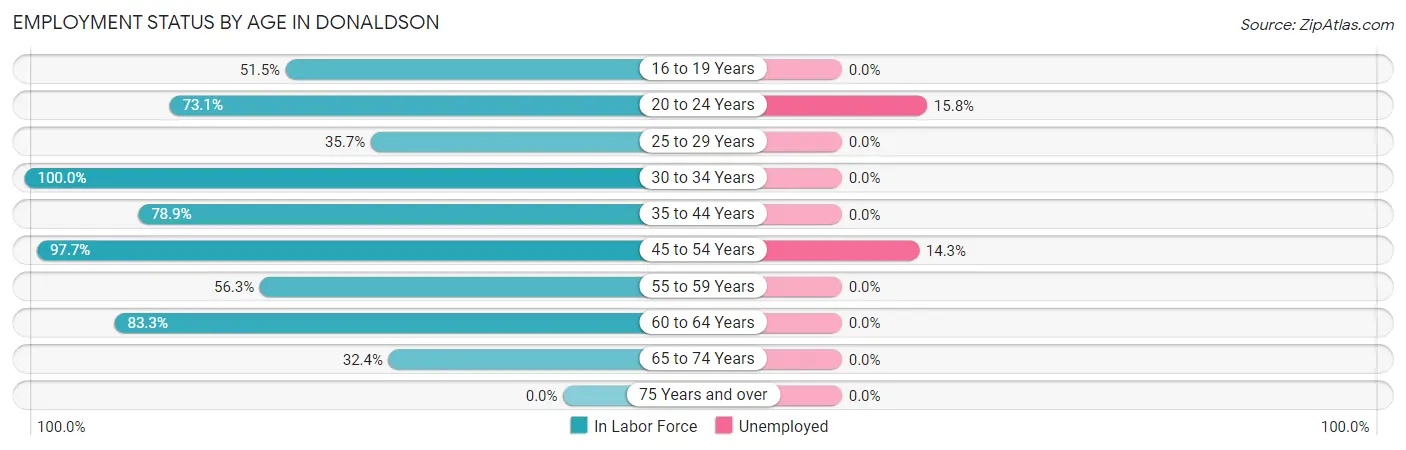
| Age Bracket | In Labor Force | Unemployed |
| 16 to 19 Years | 17 (51.5%) | 0 (0.0%) |
| 20 to 24 Years | 19 (73.1%) | 3 (15.8%) |
| 25 to 29 Years | 5 (35.7%) | 0 (0.0%) |
| 30 to 34 Years | 28 (100.0%) | 0 (0.0%) |
| 35 to 44 Years | 30 (78.9%) | 0 (0.0%) |
| 45 to 54 Years | 42 (97.7%) | 6 (14.3%) |
| 55 to 59 Years | 18 (56.3%) | 0 (0.0%) |
| 60 to 64 Years | 15 (83.3%) | 0 (0.0%) |
| 65 to 74 Years | 11 (32.4%) | 0 (0.0%) |
| 75 Years and over | 0 (0.0%) | 0 (0.0%) |
| Total | 185 (65.8%) | 9 (4.9%) |
Employment Status by Educational Attainment in Donaldson
According to labor force statistics for Donaldson, 79.8% of individuals (138) out of the total population between 25 and 64 years of age (173) are in the labor force, with 4.3% or 6 of them being unemployed. The group with the highest labor force participation rate are those with the educational attainment of college / associate degree, with 96.4% or 27 individuals in the labor force. Within the labor force, individuals with high school diploma education have the highest percentage of unemployment, with 7.3% or 6 of them being unemployed.
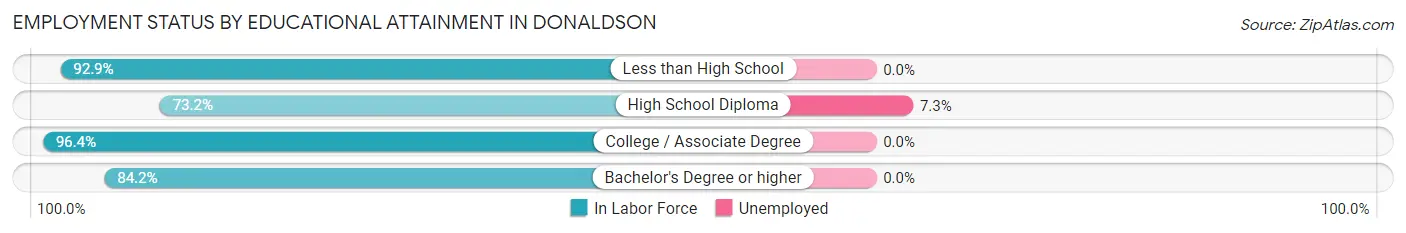
| Educational Attainment | In Labor Force | Unemployed |
| Less than High School | 13 (92.9%) | 0 (0.0%) |
| High School Diploma | 82 (73.2%) | 8 (7.3%) |
| College / Associate Degree | 27 (96.4%) | 0 (0.0%) |
| Bachelor's Degree or higher | 16 (84.2%) | 0 (0.0%) |
| Total | 138 (79.8%) | 7 (4.3%) |
Employment Occupations by Sex in Donaldson
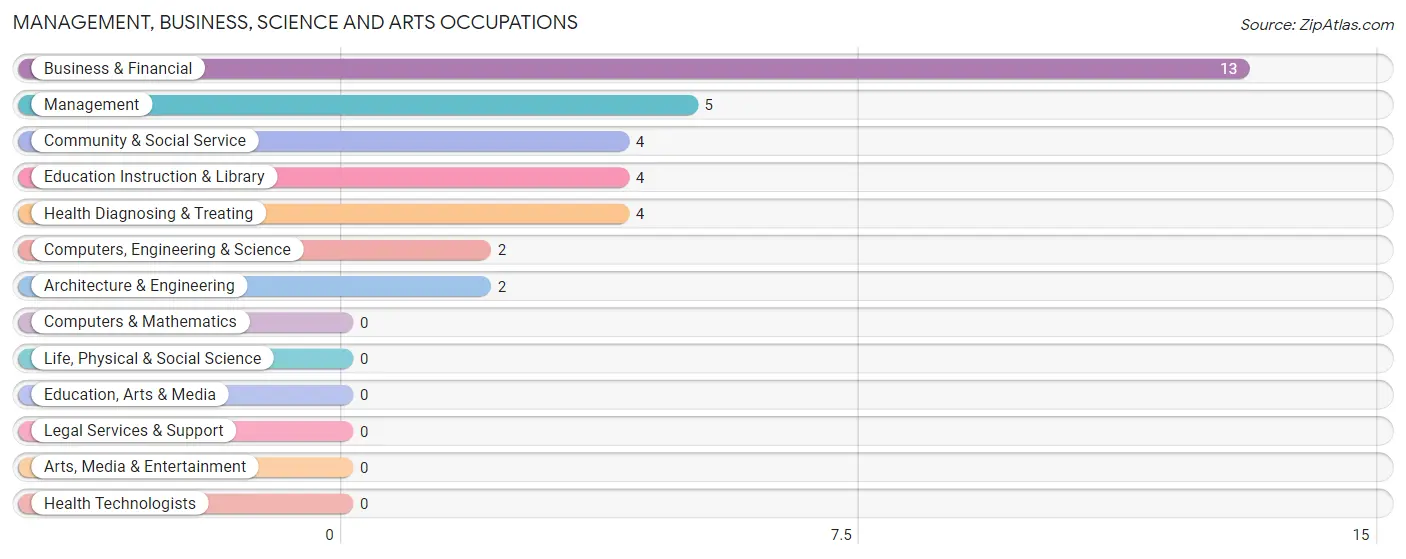
Management, Business, Science and Arts Occupations
The most common Management, Business, Science and Arts occupations in Donaldson are Business & Financial (13 | 7.4%), Management (5 | 2.8%), Community & Social Service (4 | 2.3%), Education Instruction & Library (4 | 2.3%), and Health Diagnosing & Treating (4 | 2.3%).
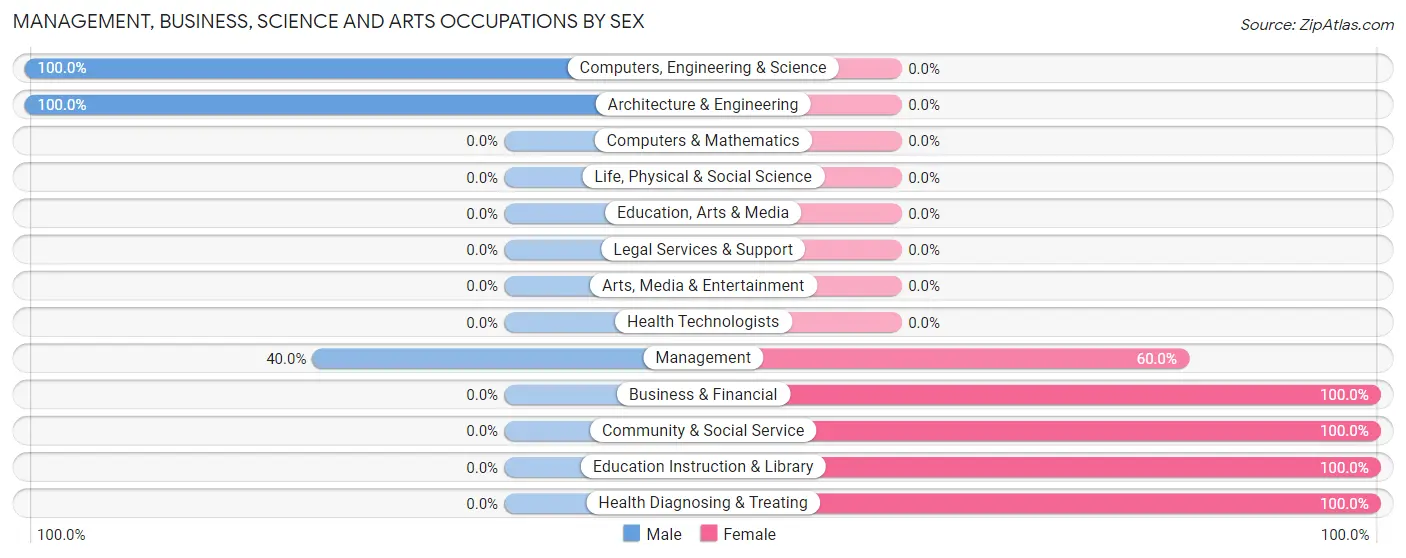
Management, Business, Science and Arts Occupations by Sex
Within the Management, Business, Science and Arts occupations in Donaldson, the most male-oriented occupations are Computers, Engineering & Science (100.0%), Architecture & Engineering (100.0%), and Management (40.0%), while the most female-oriented occupations are Business & Financial (100.0%), Community & Social Service (100.0%), and Education Instruction & Library (100.0%).
| Occupation | Male | Female |
| Management | 2 (40.0%) | 3 (60.0%) |
| Business & Financial | 0 (0.0%) | 13 (100.0%) |
| Computers, Engineering & Science | 2 (100.0%) | 0 (0.0%) |
| Computers & Mathematics | 0 (0.0%) | 0 (0.0%) |
| Architecture & Engineering | 2 (100.0%) | 0 (0.0%) |
| Life, Physical & Social Science | 0 (0.0%) | 0 (0.0%) |
| Community & Social Service | 0 (0.0%) | 4 (100.0%) |
| Education, Arts & Media | 0 (0.0%) | 0 (0.0%) |
| Legal Services & Support | 0 (0.0%) | 0 (0.0%) |
| Education Instruction & Library | 0 (0.0%) | 4 (100.0%) |
| Arts, Media & Entertainment | 0 (0.0%) | 0 (0.0%) |
| Health Diagnosing & Treating | 0 (0.0%) | 4 (100.0%) |
| Health Technologists | 0 (0.0%) | 0 (0.0%) |
| Total (Category) | 4 (14.3%) | 24 (85.7%) |
| Total (Overall) | 97 (55.1%) | 79 (44.9%) |
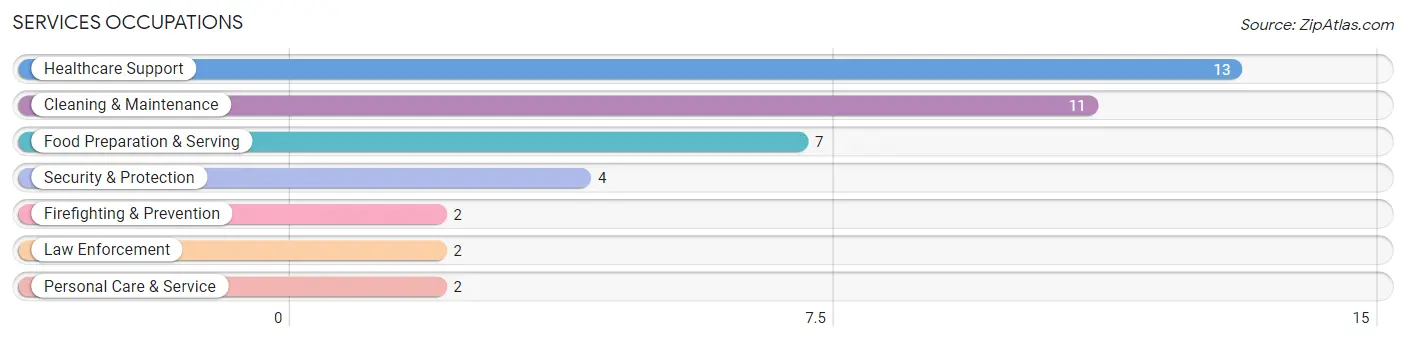
Services Occupations
The most common Services occupations in Donaldson are Healthcare Support (13 | 7.4%), Cleaning & Maintenance (11 | 6.2%), Food Preparation & Serving (7 | 4.0%), Security & Protection (4 | 2.3%), and Firefighting & Prevention (2 | 1.1%).
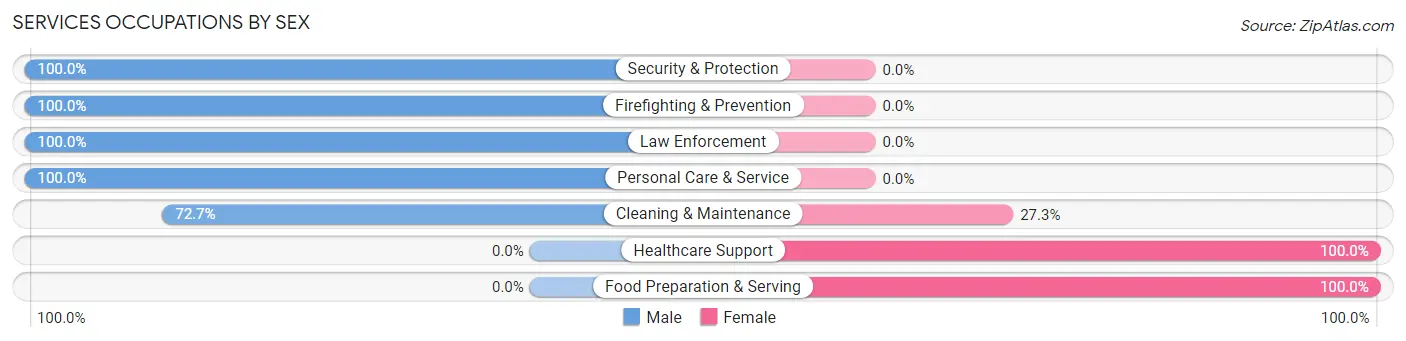
Services Occupations by Sex
Within the Services occupations in Donaldson, the most male-oriented occupations are Security & Protection (100.0%), Firefighting & Prevention (100.0%), and Law Enforcement (100.0%), while the most female-oriented occupations are Healthcare Support (100.0%), Food Preparation & Serving (100.0%), and Cleaning & Maintenance (27.3%).
| Occupation | Male | Female |
| Healthcare Support | 0 (0.0%) | 13 (100.0%) |
| Security & Protection | 4 (100.0%) | 0 (0.0%) |
| Firefighting & Prevention | 2 (100.0%) | 0 (0.0%) |
| Law Enforcement | 2 (100.0%) | 0 (0.0%) |
| Food Preparation & Serving | 0 (0.0%) | 7 (100.0%) |
| Cleaning & Maintenance | 8 (72.7%) | 3 (27.3%) |
| Personal Care & Service | 2 (100.0%) | 0 (0.0%) |
| Total (Category) | 14 (37.8%) | 23 (62.2%) |
| Total (Overall) | 97 (55.1%) | 79 (44.9%) |
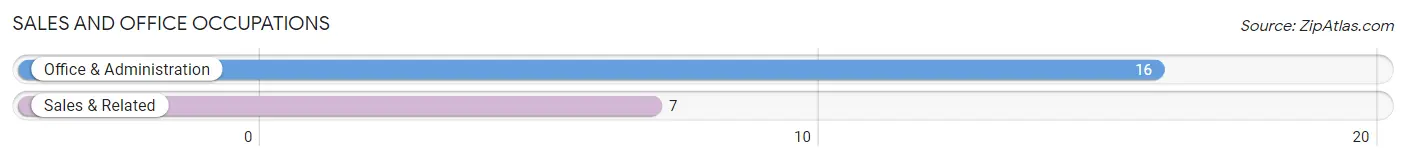
Sales and Office Occupations
The most common Sales and Office occupations in Donaldson are Office & Administration (16 | 9.1%), and Sales & Related (7 | 4.0%).
Sales and Office Occupations by Sex
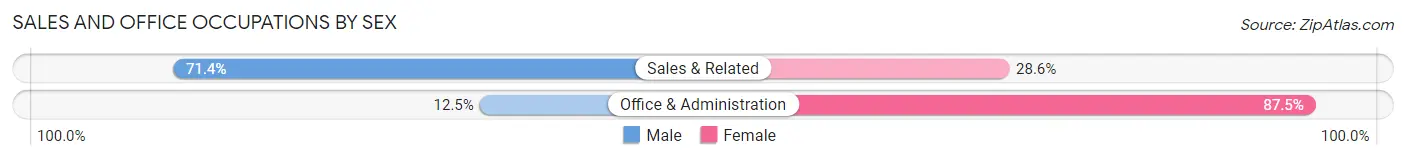
| Occupation | Male | Female |
| Sales & Related | 5 (71.4%) | 2 (28.6%) |
| Office & Administration | 2 (12.5%) | 14 (87.5%) |
| Total (Category) | 7 (30.4%) | 16 (69.6%) |
| Total (Overall) | 97 (55.1%) | 79 (44.9%) |
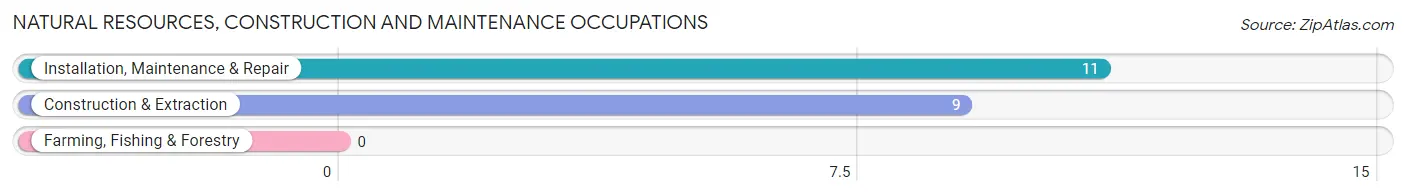
Natural Resources, Construction and Maintenance Occupations
The most common Natural Resources, Construction and Maintenance occupations in Donaldson are Installation, Maintenance & Repair (11 | 6.2%), and Construction & Extraction (9 | 5.1%).
Natural Resources, Construction and Maintenance Occupations by Sex
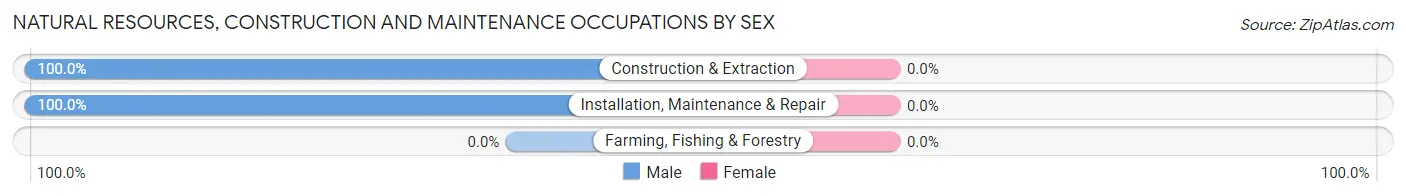
| Occupation | Male | Female |
| Farming, Fishing & Forestry | 0 (0.0%) | 0 (0.0%) |
| Construction & Extraction | 9 (100.0%) | 0 (0.0%) |
| Installation, Maintenance & Repair | 11 (100.0%) | 0 (0.0%) |
| Total (Category) | 20 (100.0%) | 0 (0.0%) |
| Total (Overall) | 97 (55.1%) | 79 (44.9%) |
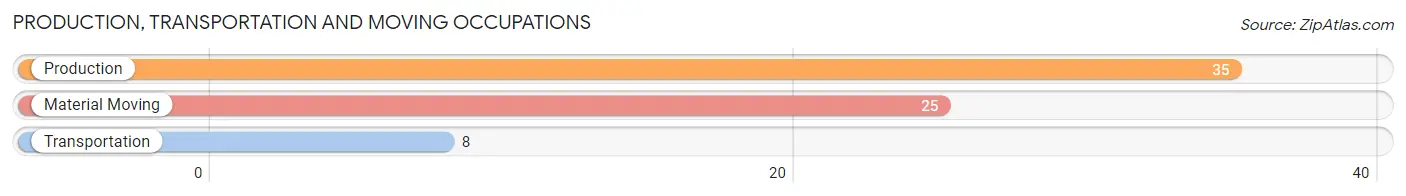
Production, Transportation and Moving Occupations
The most common Production, Transportation and Moving occupations in Donaldson are Production (35 | 19.9%), Material Moving (25 | 14.2%), and Transportation (8 | 4.5%).
Production, Transportation and Moving Occupations by Sex
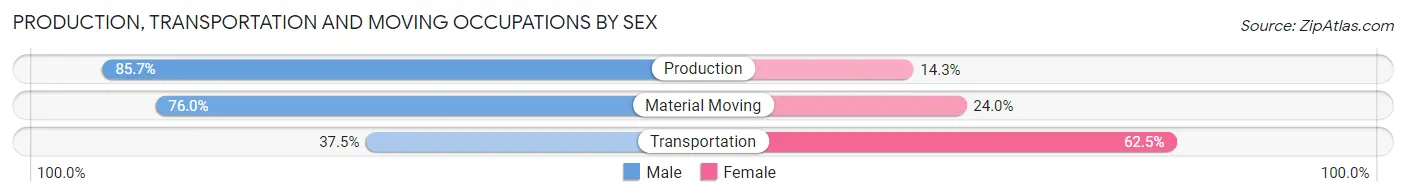
| Occupation | Male | Female |
| Production | 30 (85.7%) | 5 (14.3%) |
| Transportation | 3 (37.5%) | 5 (62.5%) |
| Material Moving | 19 (76.0%) | 6 (24.0%) |
| Total (Category) | 52 (76.5%) | 16 (23.5%) |
| Total (Overall) | 97 (55.1%) | 79 (44.9%) |
Employment Industries by Sex in Donaldson
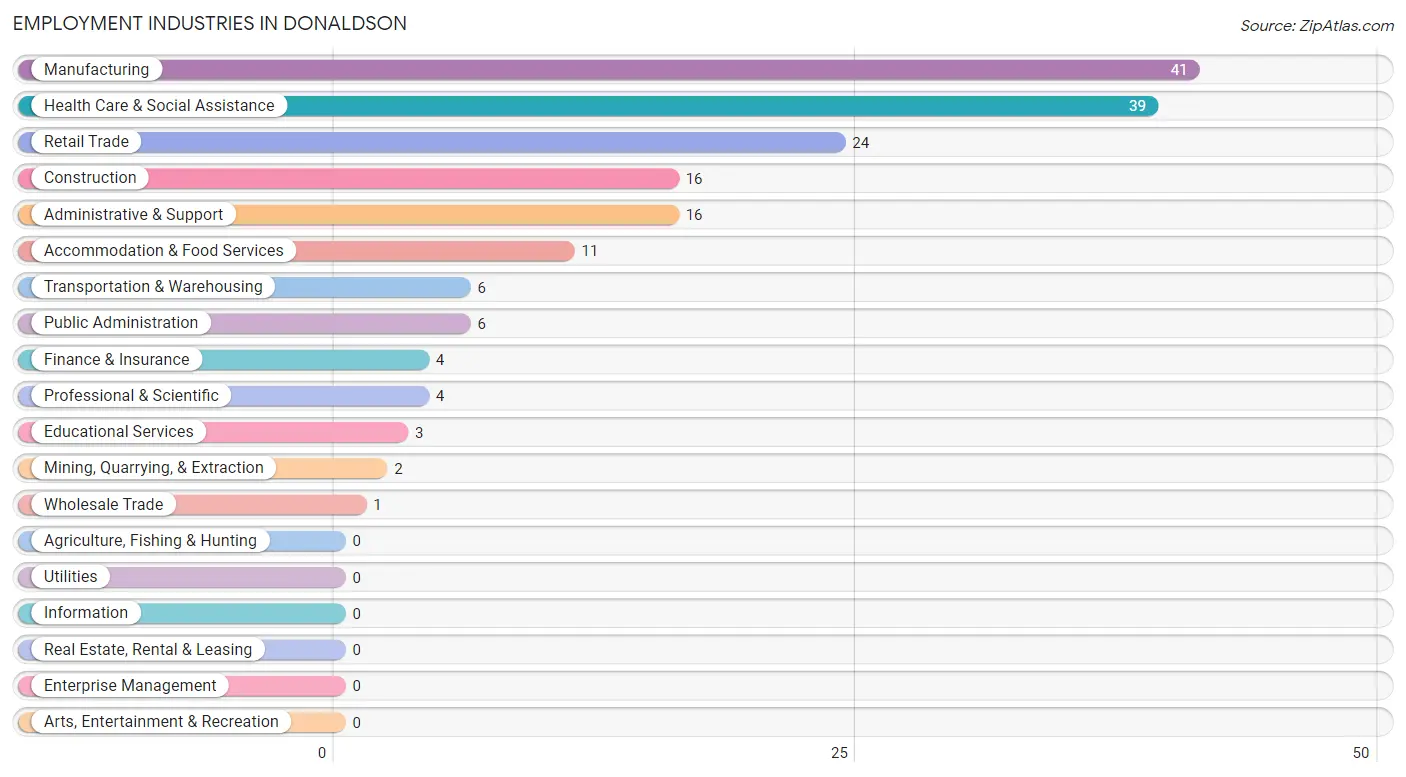
Employment Industries in Donaldson
The major employment industries in Donaldson include Manufacturing (41 | 23.3%), Health Care & Social Assistance (39 | 22.2%), Retail Trade (24 | 13.6%), Construction (16 | 9.1%), and Administrative & Support (16 | 9.1%).
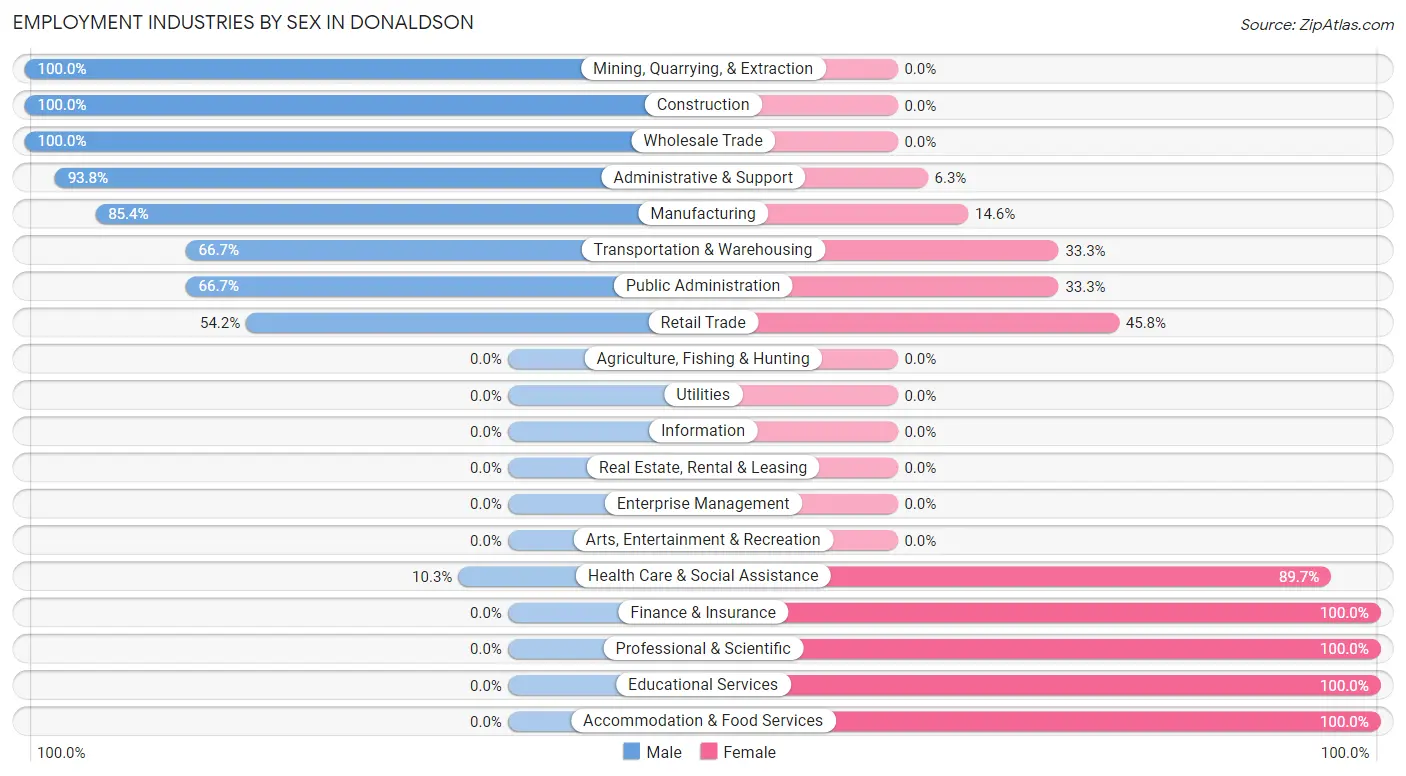
Employment Industries by Sex in Donaldson
The Donaldson industries that see more men than women are Mining, Quarrying, & Extraction (100.0%), Construction (100.0%), and Wholesale Trade (100.0%), whereas the industries that tend to have a higher number of women are Finance & Insurance (100.0%), Professional & Scientific (100.0%), and Educational Services (100.0%).
| Industry | Male | Female |
| Agriculture, Fishing & Hunting | 0 (0.0%) | 0 (0.0%) |
| Mining, Quarrying, & Extraction | 2 (100.0%) | 0 (0.0%) |
| Construction | 16 (100.0%) | 0 (0.0%) |
| Manufacturing | 35 (85.4%) | 6 (14.6%) |
| Wholesale Trade | 1 (100.0%) | 0 (0.0%) |
| Retail Trade | 13 (54.2%) | 11 (45.8%) |
| Transportation & Warehousing | 4 (66.7%) | 2 (33.3%) |
| Utilities | 0 (0.0%) | 0 (0.0%) |
| Information | 0 (0.0%) | 0 (0.0%) |
| Finance & Insurance | 0 (0.0%) | 4 (100.0%) |
| Real Estate, Rental & Leasing | 0 (0.0%) | 0 (0.0%) |
| Professional & Scientific | 0 (0.0%) | 4 (100.0%) |
| Enterprise Management | 0 (0.0%) | 0 (0.0%) |
| Administrative & Support | 15 (93.8%) | 1 (6.2%) |
| Educational Services | 0 (0.0%) | 3 (100.0%) |
| Health Care & Social Assistance | 4 (10.3%) | 35 (89.7%) |
| Arts, Entertainment & Recreation | 0 (0.0%) | 0 (0.0%) |
| Accommodation & Food Services | 0 (0.0%) | 11 (100.0%) |
| Public Administration | 4 (66.7%) | 2 (33.3%) |
| Total | 97 (55.1%) | 79 (44.9%) |
Education in Donaldson
School Enrollment in Donaldson
The most common levels of schooling among the 90 students in Donaldson are elementary school (32 | 35.6%), high school (26 | 28.9%), and middle school (18 | 20.0%).
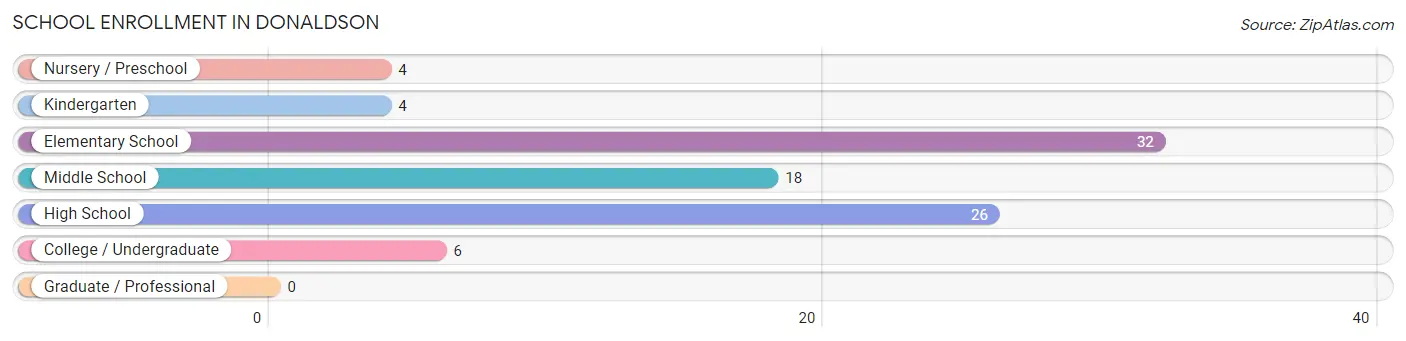
| School Level | # Students | % Students |
| Nursery / Preschool | 4 | 4.4% |
| Kindergarten | 4 | 4.4% |
| Elementary School | 32 | 35.6% |
| Middle School | 18 | 20.0% |
| High School | 26 | 28.9% |
| College / Undergraduate | 6 | 6.7% |
| Graduate / Professional | 0 | 0.0% |
| Total | 90 | 100.0% |
School Enrollment by Age by Funding Source in Donaldson
Out of a total of 90 students who are enrolled in schools in Donaldson, 7 (7.8%) attend a private institution, while the remaining 83 (92.2%) are enrolled in public schools. The age group of 20 to 24 year olds has the highest likelihood of being enrolled in private schools, with 4 (100.0% in the age bracket) enrolled. Conversely, the age group of 15 to 17 year olds has the lowest likelihood of being enrolled in a private school, with 18 (100.0% in the age bracket) attending a public institution.
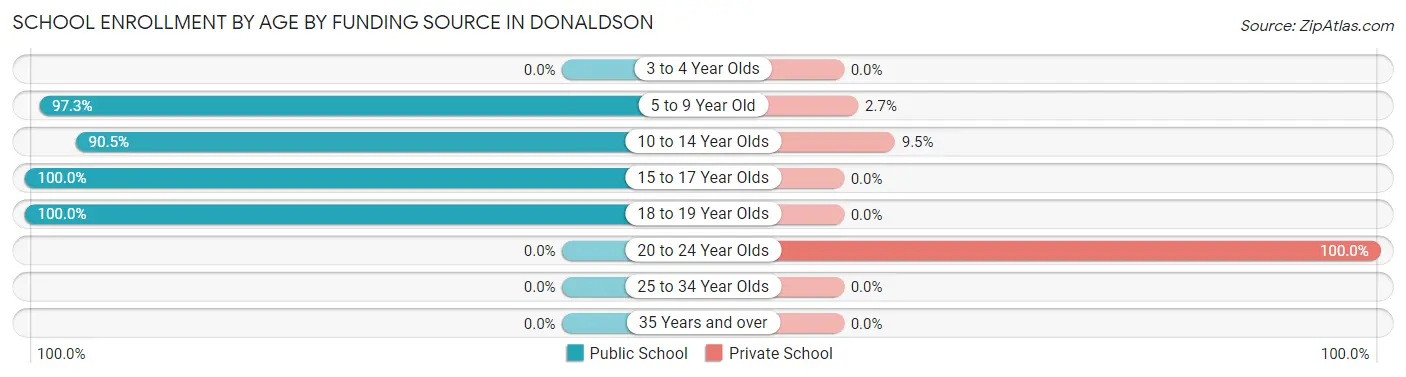
| Age Bracket | Public School | Private School |
| 3 to 4 Year Olds | 0 (0.0%) | 0 (0.0%) |
| 5 to 9 Year Old | 36 (97.3%) | 1 (2.7%) |
| 10 to 14 Year Olds | 19 (90.5%) | 2 (9.5%) |
| 15 to 17 Year Olds | 18 (100.0%) | 0 (0.0%) |
| 18 to 19 Year Olds | 10 (100.0%) | 0 (0.0%) |
| 20 to 24 Year Olds | 0 (0.0%) | 4 (100.0%) |
| 25 to 34 Year Olds | 0 (0.0%) | 0 (0.0%) |
| 35 Years and over | 0 (0.0%) | 0 (0.0%) |
| Total | 83 (92.2%) | 7 (7.8%) |
Educational Attainment by Field of Study in Donaldson
Bio, nature & agricultural (6 | 27.3%), engineering (4 | 18.2%), science & technology (4 | 18.2%), business (2 | 9.1%), and education (2 | 9.1%) are the most common fields of study among 22 individuals in Donaldson who have obtained a bachelor's degree or higher.
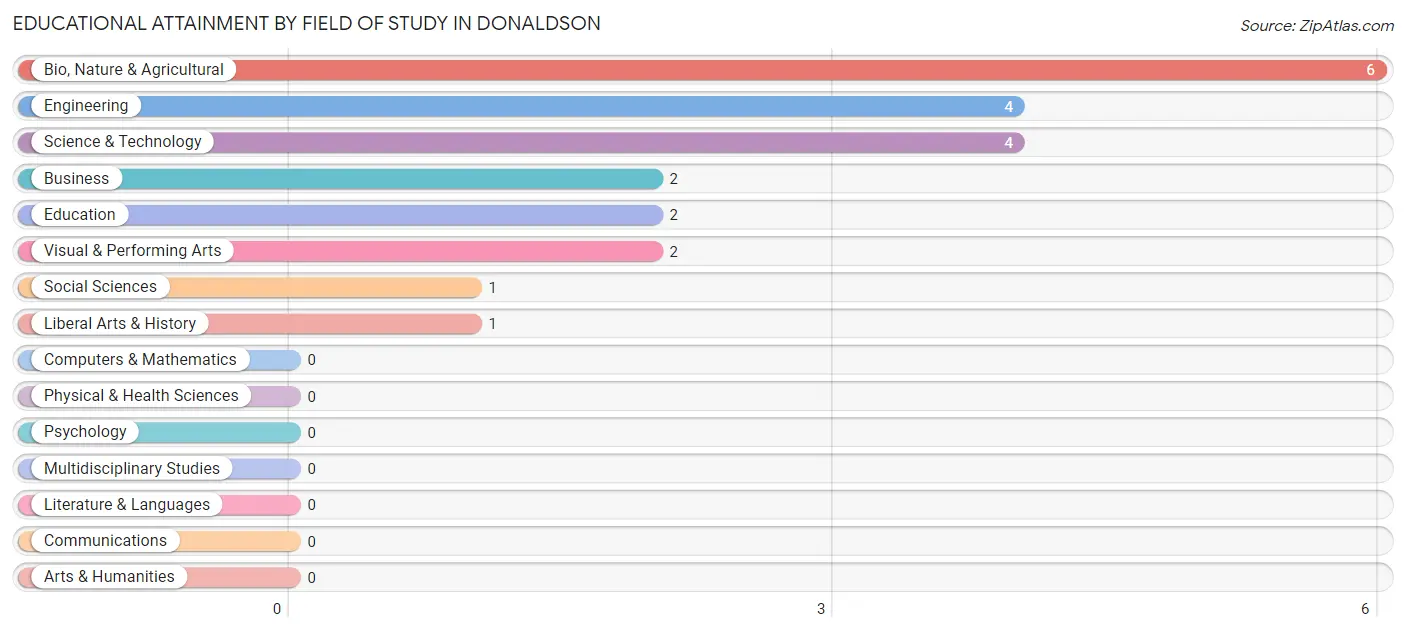
| Field of Study | # Graduates | % Graduates |
| Computers & Mathematics | 0 | 0.0% |
| Bio, Nature & Agricultural | 6 | 27.3% |
| Physical & Health Sciences | 0 | 0.0% |
| Psychology | 0 | 0.0% |
| Social Sciences | 1 | 4.5% |
| Engineering | 4 | 18.2% |
| Multidisciplinary Studies | 0 | 0.0% |
| Science & Technology | 4 | 18.2% |
| Business | 2 | 9.1% |
| Education | 2 | 9.1% |
| Literature & Languages | 0 | 0.0% |
| Liberal Arts & History | 1 | 4.5% |
| Visual & Performing Arts | 2 | 9.1% |
| Communications | 0 | 0.0% |
| Arts & Humanities | 0 | 0.0% |
| Total | 22 | 100.0% |
Transportation & Commute in Donaldson
Vehicle Availability by Sex in Donaldson
The most prevalent vehicle ownership categories in Donaldson are males with 2 vehicles (27, accounting for 27.8%) and females with 2 vehicles (24, making up 34.2%).
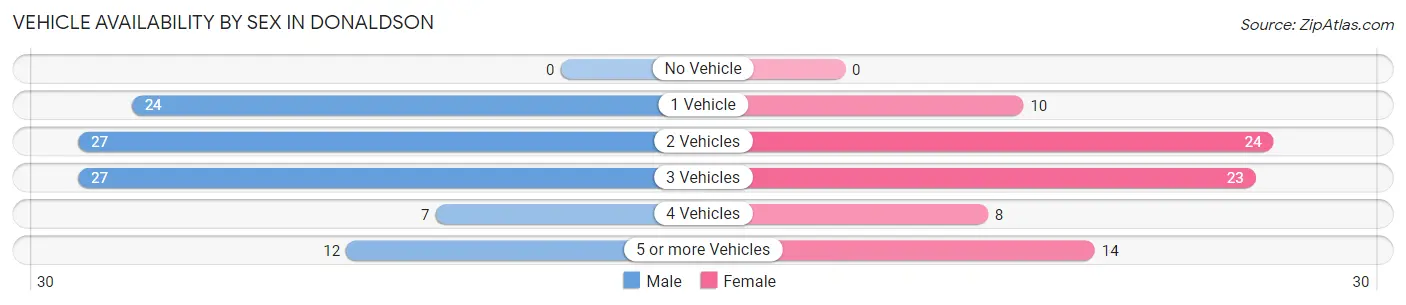
| Vehicles Available | Male | Female |
| No Vehicle | 0 (0.0%) | 0 (0.0%) |
| 1 Vehicle | 24 (24.7%) | 10 (12.7%) |
| 2 Vehicles | 27 (27.8%) | 24 (30.4%) |
| 3 Vehicles | 27 (27.8%) | 23 (29.1%) |
| 4 Vehicles | 7 (7.2%) | 8 (10.1%) |
| 5 or more Vehicles | 12 (12.4%) | 14 (17.7%) |
| Total | 97 (100.0%) | 79 (100.0%) |
Commute Time in Donaldson
The most frequently occuring commute durations in Donaldson are 15 to 19 minutes (41 commuters, 24.0%), 10 to 14 minutes (27 commuters, 15.8%), and 60 to 89 minutes (23 commuters, 13.5%).
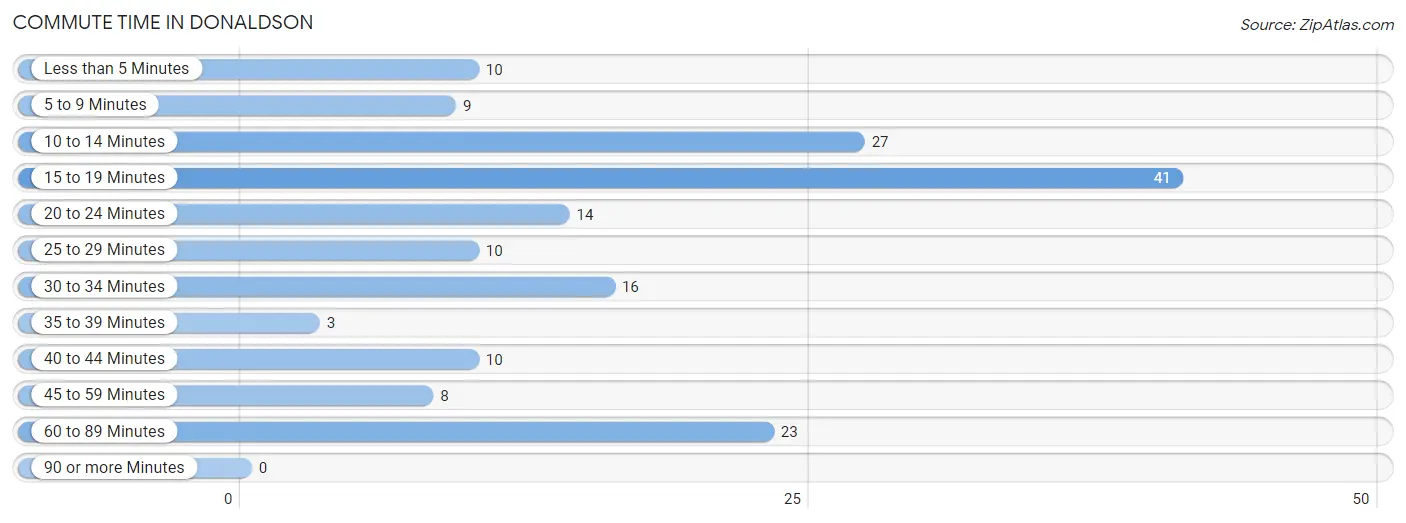
| Commute Time | # Commuters | % Commuters |
| Less than 5 Minutes | 10 | 5.9% |
| 5 to 9 Minutes | 9 | 5.3% |
| 10 to 14 Minutes | 27 | 15.8% |
| 15 to 19 Minutes | 41 | 24.0% |
| 20 to 24 Minutes | 14 | 8.2% |
| 25 to 29 Minutes | 10 | 5.9% |
| 30 to 34 Minutes | 16 | 9.4% |
| 35 to 39 Minutes | 3 | 1.8% |
| 40 to 44 Minutes | 10 | 5.9% |
| 45 to 59 Minutes | 8 | 4.7% |
| 60 to 89 Minutes | 23 | 13.5% |
| 90 or more Minutes | 0 | 0.0% |
Commute Time by Sex in Donaldson
The most common commute times in Donaldson are 60 to 89 minutes (21 commuters, 22.3%) for males and 15 to 19 minutes (21 commuters, 27.3%) for females.
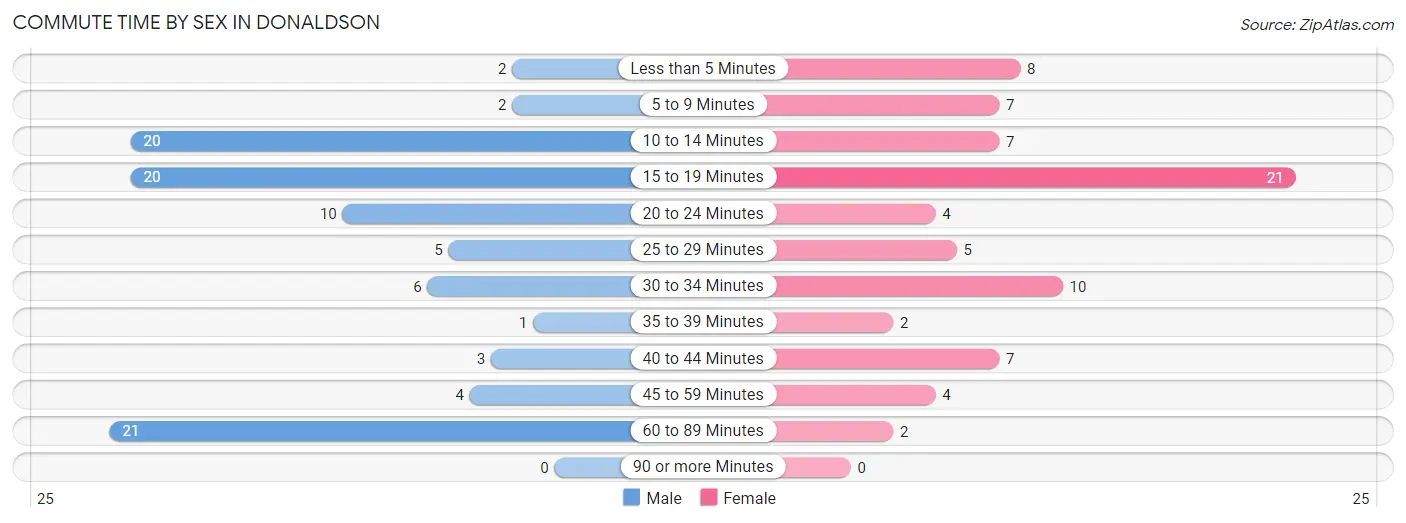
| Commute Time | Male | Female |
| Less than 5 Minutes | 2 (2.1%) | 8 (10.4%) |
| 5 to 9 Minutes | 2 (2.1%) | 7 (9.1%) |
| 10 to 14 Minutes | 20 (21.3%) | 7 (9.1%) |
| 15 to 19 Minutes | 20 (21.3%) | 21 (27.3%) |
| 20 to 24 Minutes | 10 (10.6%) | 4 (5.2%) |
| 25 to 29 Minutes | 5 (5.3%) | 5 (6.5%) |
| 30 to 34 Minutes | 6 (6.4%) | 10 (13.0%) |
| 35 to 39 Minutes | 1 (1.1%) | 2 (2.6%) |
| 40 to 44 Minutes | 3 (3.2%) | 7 (9.1%) |
| 45 to 59 Minutes | 4 (4.3%) | 4 (5.2%) |
| 60 to 89 Minutes | 21 (22.3%) | 2 (2.6%) |
| 90 or more Minutes | 0 (0.0%) | 0 (0.0%) |
Time of Departure to Work by Sex in Donaldson
The most frequent times of departure to work in Donaldson are 7:30 AM to 7:59 AM (16, 17.0%) for males and 9:00 AM to 9:59 AM (14, 18.2%) for females.
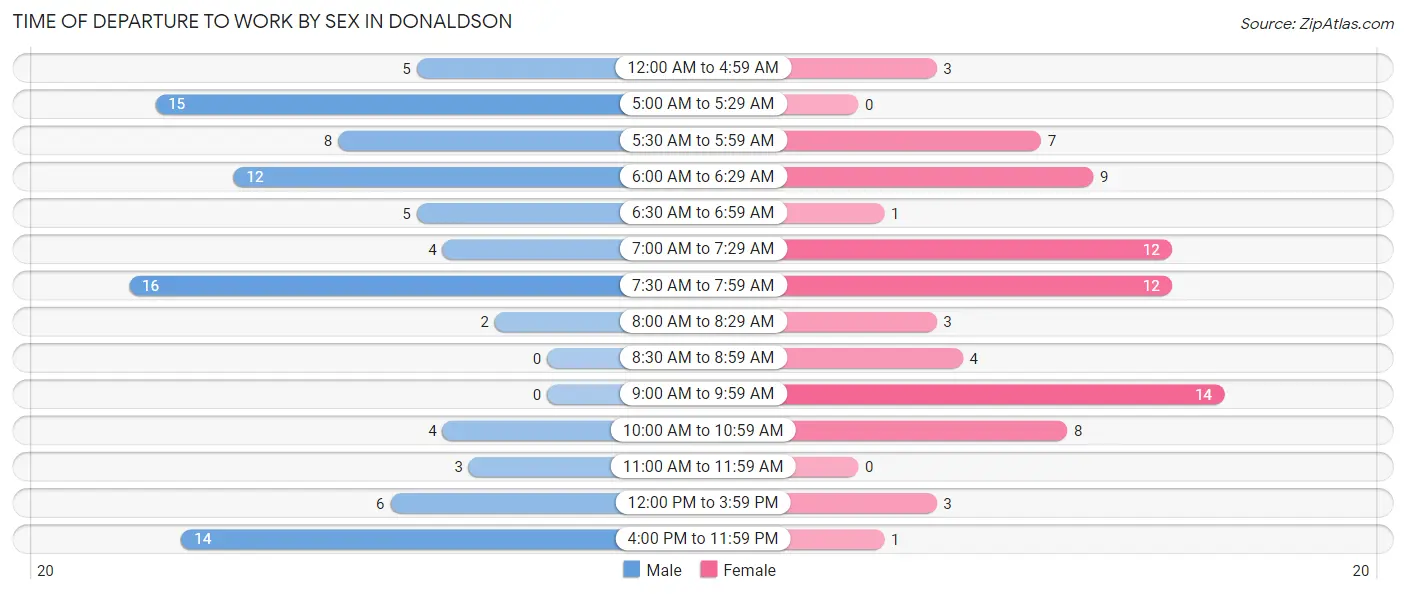
| Time of Departure | Male | Female |
| 12:00 AM to 4:59 AM | 5 (5.3%) | 3 (3.9%) |
| 5:00 AM to 5:29 AM | 15 (16.0%) | 0 (0.0%) |
| 5:30 AM to 5:59 AM | 8 (8.5%) | 7 (9.1%) |
| 6:00 AM to 6:29 AM | 12 (12.8%) | 9 (11.7%) |
| 6:30 AM to 6:59 AM | 5 (5.3%) | 1 (1.3%) |
| 7:00 AM to 7:29 AM | 4 (4.3%) | 12 (15.6%) |
| 7:30 AM to 7:59 AM | 16 (17.0%) | 12 (15.6%) |
| 8:00 AM to 8:29 AM | 2 (2.1%) | 3 (3.9%) |
| 8:30 AM to 8:59 AM | 0 (0.0%) | 4 (5.2%) |
| 9:00 AM to 9:59 AM | 0 (0.0%) | 14 (18.2%) |
| 10:00 AM to 10:59 AM | 4 (4.3%) | 8 (10.4%) |
| 11:00 AM to 11:59 AM | 3 (3.2%) | 0 (0.0%) |
| 12:00 PM to 3:59 PM | 6 (6.4%) | 3 (3.9%) |
| 4:00 PM to 11:59 PM | 14 (14.9%) | 1 (1.3%) |
| Total | 94 (100.0%) | 77 (100.0%) |
Housing Occupancy in Donaldson
Occupancy by Ownership in Donaldson
Of the total 124 dwellings in Donaldson, owner-occupied units account for 97 (78.2%), while renter-occupied units make up 27 (21.8%).
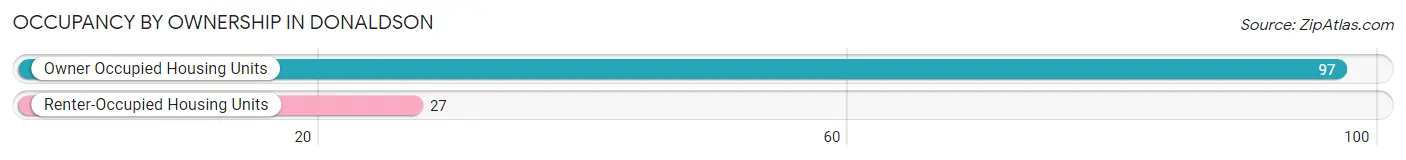
| Occupancy | # Housing Units | % Housing Units |
| Owner Occupied Housing Units | 97 | 78.2% |
| Renter-Occupied Housing Units | 27 | 21.8% |
| Total Occupied Housing Units | 124 | 100.0% |
Occupancy by Household Size in Donaldson
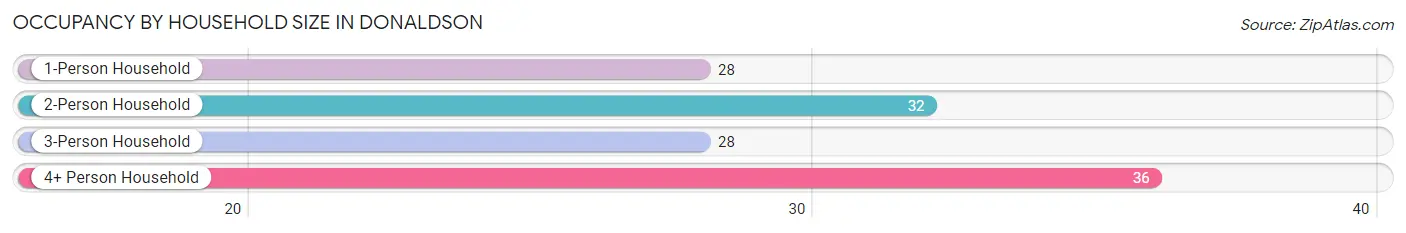
| Household Size | # Housing Units | % Housing Units |
| 1-Person Household | 28 | 22.6% |
| 2-Person Household | 32 | 25.8% |
| 3-Person Household | 28 | 22.6% |
| 4+ Person Household | 36 | 29.0% |
| Total Housing Units | 124 | 100.0% |
Occupancy by Ownership by Household Size in Donaldson
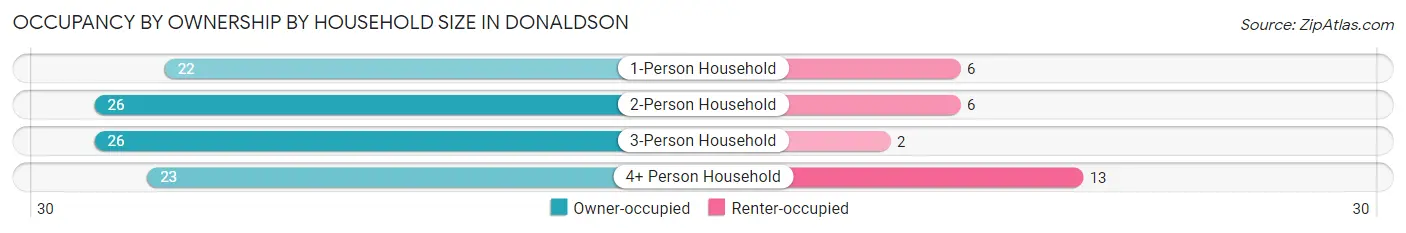
| Household Size | Owner-occupied | Renter-occupied |
| 1-Person Household | 22 (78.6%) | 6 (21.4%) |
| 2-Person Household | 26 (81.2%) | 6 (18.8%) |
| 3-Person Household | 26 (92.9%) | 2 (7.1%) |
| 4+ Person Household | 23 (63.9%) | 13 (36.1%) |
| Total Housing Units | 97 (78.2%) | 27 (21.8%) |
Occupancy by Educational Attainment in Donaldson
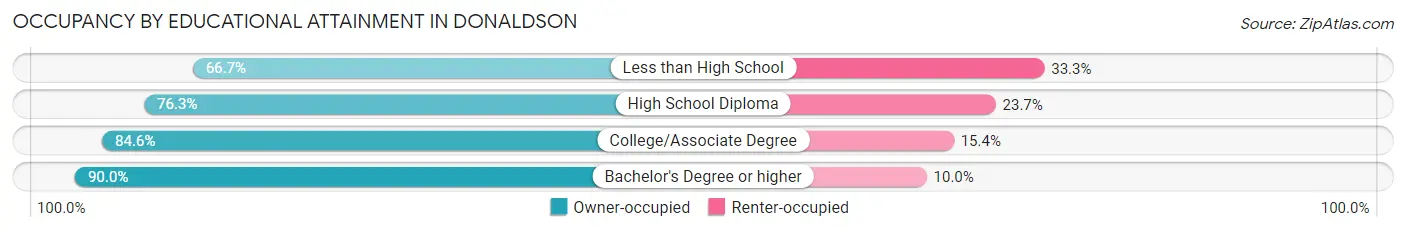
| Household Size | Owner-occupied | Renter-occupied |
| Less than High School | 8 (66.7%) | 4 (33.3%) |
| High School Diploma | 58 (76.3%) | 18 (23.7%) |
| College/Associate Degree | 22 (84.6%) | 4 (15.4%) |
| Bachelor's Degree or higher | 9 (90.0%) | 1 (10.0%) |
Occupancy by Age of Householder in Donaldson
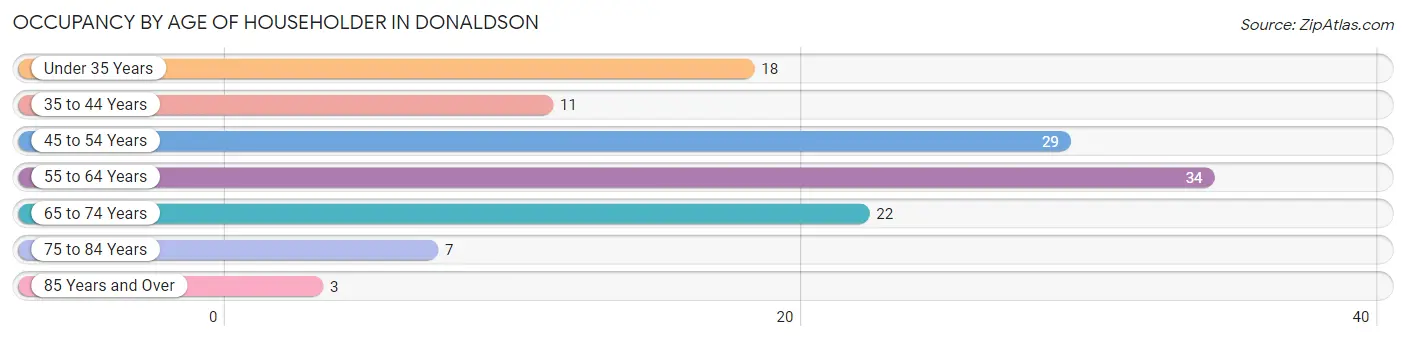
| Age Bracket | # Households | % Households |
| Under 35 Years | 18 | 14.5% |
| 35 to 44 Years | 11 | 8.9% |
| 45 to 54 Years | 29 | 23.4% |
| 55 to 64 Years | 34 | 27.4% |
| 65 to 74 Years | 22 | 17.7% |
| 75 to 84 Years | 7 | 5.7% |
| 85 Years and Over | 3 | 2.4% |
| Total | 124 | 100.0% |
Housing Finances in Donaldson
Median Income by Occupancy in Donaldson
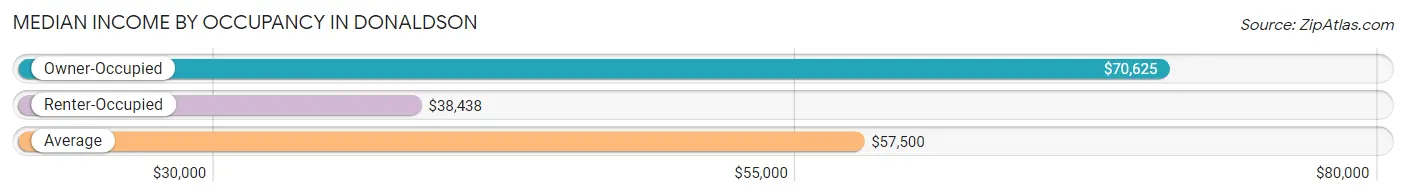
| Occupancy Type | # Households | Median Income |
| Owner-Occupied | 97 (78.2%) | $70,625 |
| Renter-Occupied | 27 (21.8%) | $38,438 |
| Average | 124 (100.0%) | $57,500 |
Occupancy by Householder Income Bracket in Donaldson
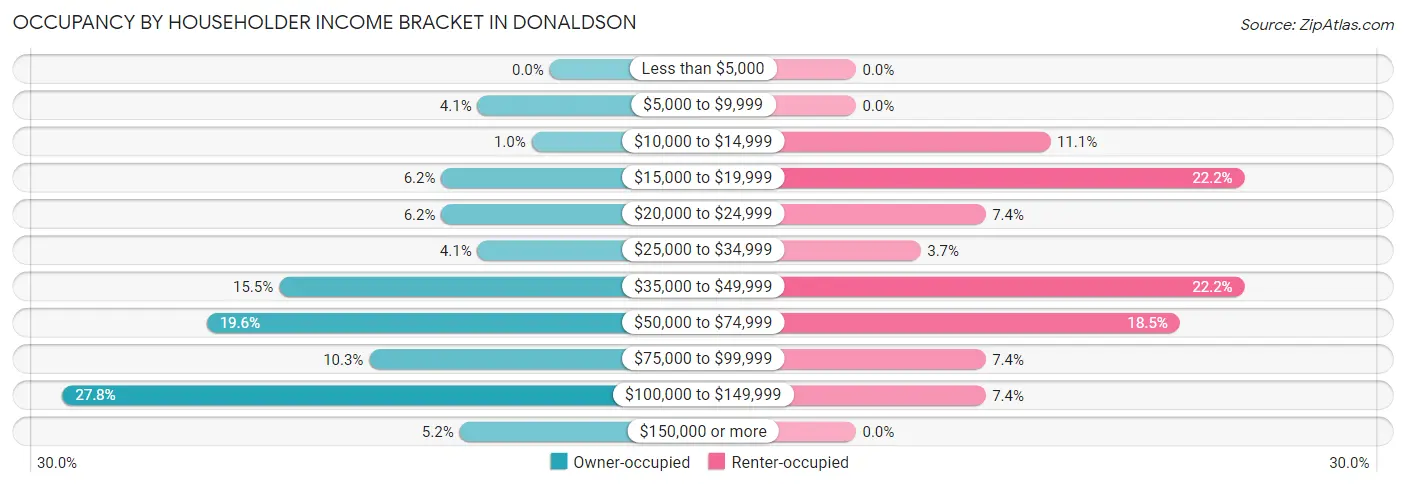
| Income Bracket | Owner-occupied | Renter-occupied |
| Less than $5,000 | 0 (0.0%) | 0 (0.0%) |
| $5,000 to $9,999 | 4 (4.1%) | 0 (0.0%) |
| $10,000 to $14,999 | 1 (1.0%) | 3 (11.1%) |
| $15,000 to $19,999 | 6 (6.2%) | 6 (22.2%) |
| $20,000 to $24,999 | 6 (6.2%) | 2 (7.4%) |
| $25,000 to $34,999 | 4 (4.1%) | 1 (3.7%) |
| $35,000 to $49,999 | 15 (15.5%) | 6 (22.2%) |
| $50,000 to $74,999 | 19 (19.6%) | 5 (18.5%) |
| $75,000 to $99,999 | 10 (10.3%) | 2 (7.4%) |
| $100,000 to $149,999 | 27 (27.8%) | 2 (7.4%) |
| $150,000 or more | 5 (5.1%) | 0 (0.0%) |
| Total | 97 (100.0%) | 27 (100.0%) |
Monthly Housing Cost Tiers in Donaldson
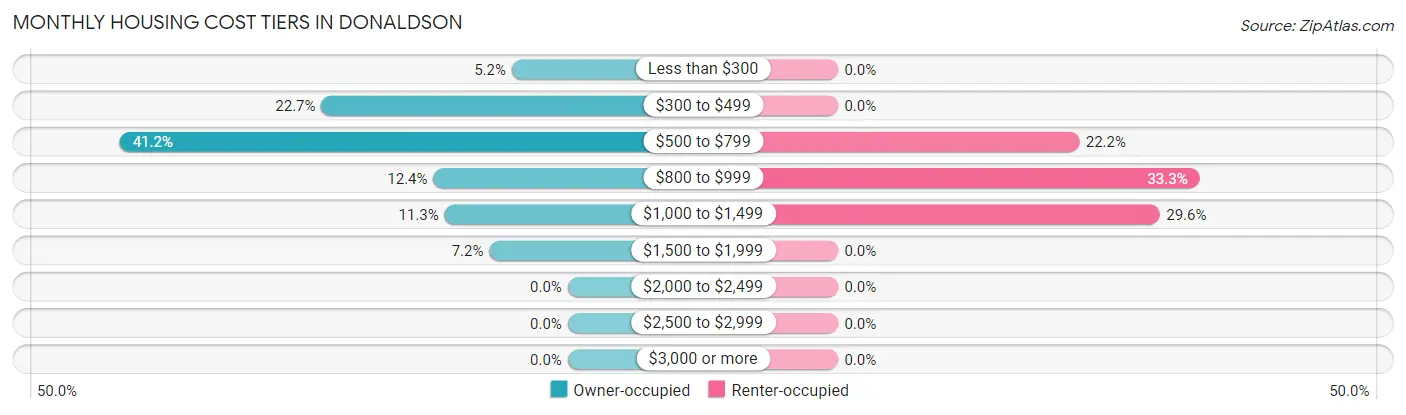
| Monthly Cost | Owner-occupied | Renter-occupied |
| Less than $300 | 5 (5.1%) | 0 (0.0%) |
| $300 to $499 | 22 (22.7%) | 0 (0.0%) |
| $500 to $799 | 40 (41.2%) | 6 (22.2%) |
| $800 to $999 | 12 (12.4%) | 9 (33.3%) |
| $1,000 to $1,499 | 11 (11.3%) | 8 (29.6%) |
| $1,500 to $1,999 | 7 (7.2%) | 0 (0.0%) |
| $2,000 to $2,499 | 0 (0.0%) | 0 (0.0%) |
| $2,500 to $2,999 | 0 (0.0%) | 0 (0.0%) |
| $3,000 or more | 0 (0.0%) | 0 (0.0%) |
| Total | 97 (100.0%) | 27 (100.0%) |
Physical Housing Characteristics in Donaldson
Housing Structures in Donaldson
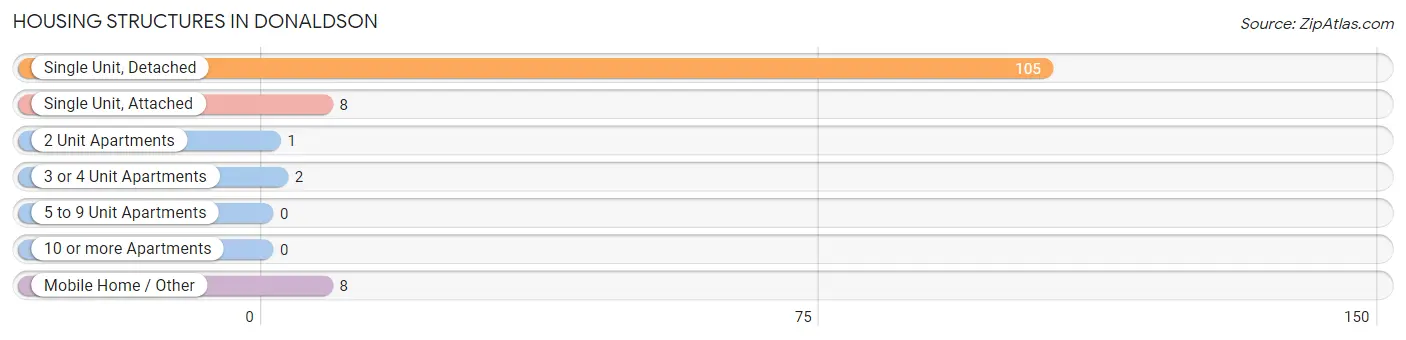
| Structure Type | # Housing Units | % Housing Units |
| Single Unit, Detached | 105 | 84.7% |
| Single Unit, Attached | 8 | 6.5% |
| 2 Unit Apartments | 1 | 0.8% |
| 3 or 4 Unit Apartments | 2 | 1.6% |
| 5 to 9 Unit Apartments | 0 | 0.0% |
| 10 or more Apartments | 0 | 0.0% |
| Mobile Home / Other | 8 | 6.5% |
| Total | 124 | 100.0% |
Housing Structures by Occupancy in Donaldson
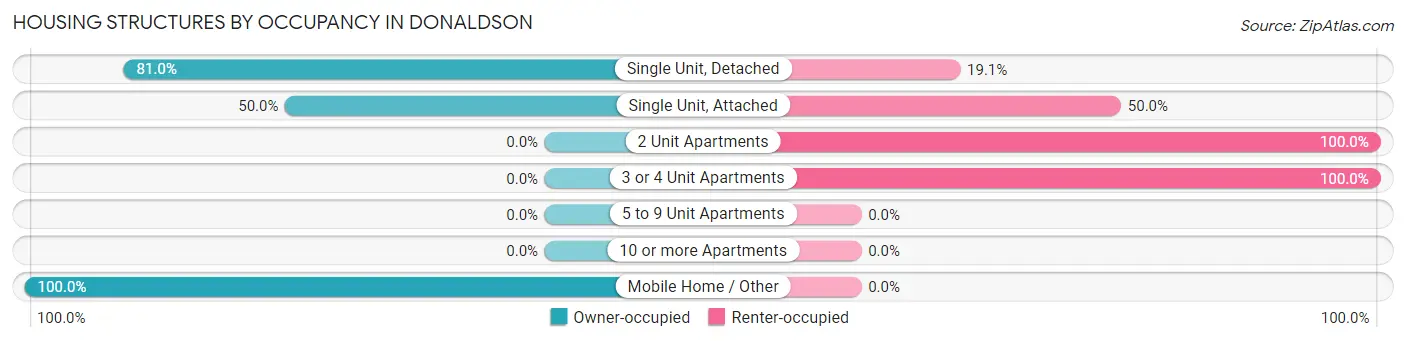
| Structure Type | Owner-occupied | Renter-occupied |
| Single Unit, Detached | 85 (80.9%) | 20 (19.1%) |
| Single Unit, Attached | 4 (50.0%) | 4 (50.0%) |
| 2 Unit Apartments | 0 (0.0%) | 1 (100.0%) |
| 3 or 4 Unit Apartments | 0 (0.0%) | 2 (100.0%) |
| 5 to 9 Unit Apartments | 0 (0.0%) | 0 (0.0%) |
| 10 or more Apartments | 0 (0.0%) | 0 (0.0%) |
| Mobile Home / Other | 8 (100.0%) | 0 (0.0%) |
| Total | 97 (78.2%) | 27 (21.8%) |
Housing Structures by Number of Rooms in Donaldson
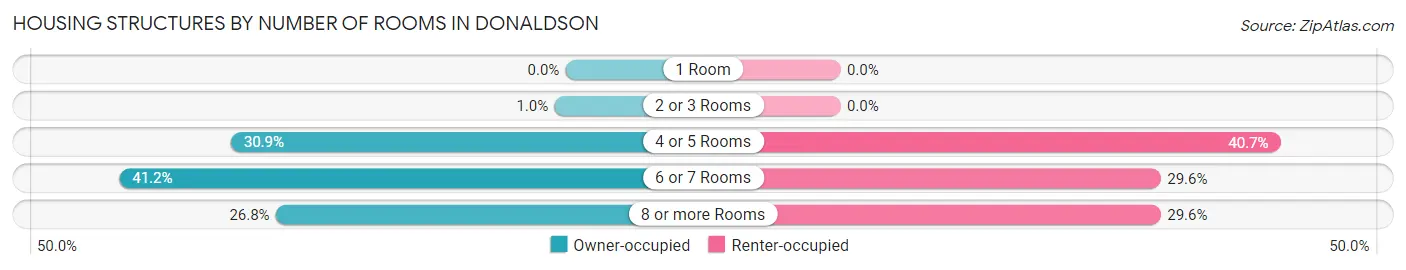
| Number of Rooms | Owner-occupied | Renter-occupied |
| 1 Room | 0 (0.0%) | 0 (0.0%) |
| 2 or 3 Rooms | 1 (1.0%) | 0 (0.0%) |
| 4 or 5 Rooms | 30 (30.9%) | 11 (40.7%) |
| 6 or 7 Rooms | 40 (41.2%) | 8 (29.6%) |
| 8 or more Rooms | 26 (26.8%) | 8 (29.6%) |
| Total | 97 (100.0%) | 27 (100.0%) |
Housing Structure by Heating Type in Donaldson
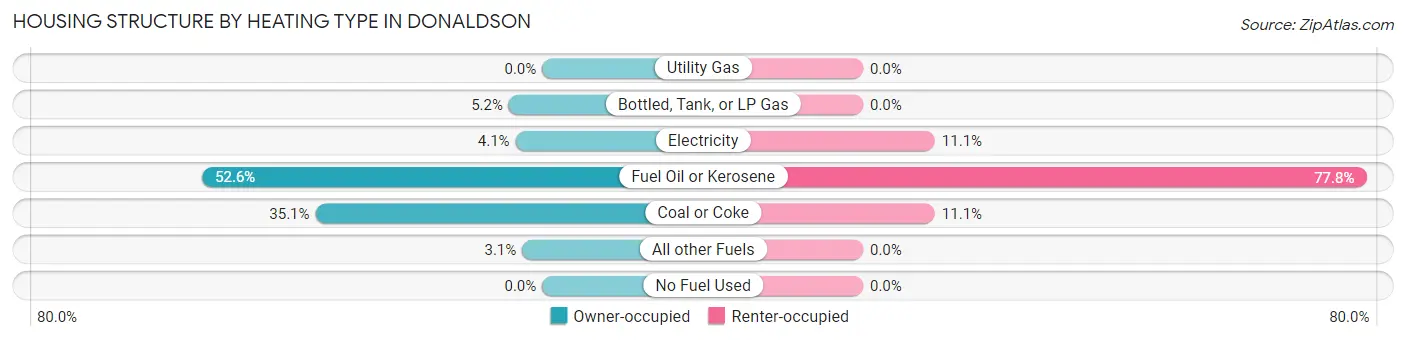
| Heating Type | Owner-occupied | Renter-occupied |
| Utility Gas | 0 (0.0%) | 0 (0.0%) |
| Bottled, Tank, or LP Gas | 5 (5.1%) | 0 (0.0%) |
| Electricity | 4 (4.1%) | 3 (11.1%) |
| Fuel Oil or Kerosene | 51 (52.6%) | 21 (77.8%) |
| Coal or Coke | 34 (35.0%) | 3 (11.1%) |
| All other Fuels | 3 (3.1%) | 0 (0.0%) |
| No Fuel Used | 0 (0.0%) | 0 (0.0%) |
| Total | 97 (100.0%) | 27 (100.0%) |
Household Vehicle Usage in Donaldson
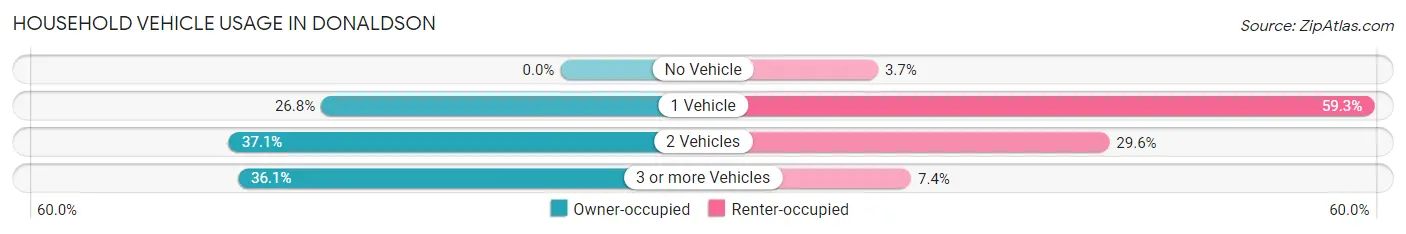
| Vehicles per Household | Owner-occupied | Renter-occupied |
| No Vehicle | 0 (0.0%) | 1 (3.7%) |
| 1 Vehicle | 26 (26.8%) | 16 (59.3%) |
| 2 Vehicles | 36 (37.1%) | 8 (29.6%) |
| 3 or more Vehicles | 35 (36.1%) | 2 (7.4%) |
| Total | 97 (100.0%) | 27 (100.0%) |
Real Estate & Mortgages in Donaldson
Real Estate and Mortgage Overview in Donaldson
| Characteristic | Without Mortgage | With Mortgage |
| Housing Units | 57 | 40 |
| Median Property Value | $77,500 | $98,000 |
| Median Household Income | $61,250 | $4 |
| Monthly Housing Costs | $529 | $0 |
| Real Estate Taxes | $975 | $0 |
Property Value by Mortgage Status in Donaldson
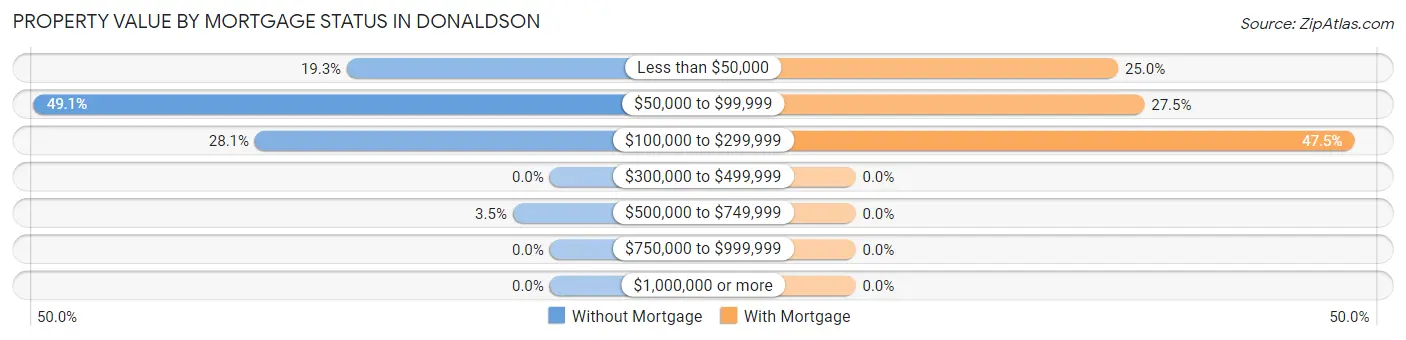
| Property Value | Without Mortgage | With Mortgage |
| Less than $50,000 | 11 (19.3%) | 10 (25.0%) |
| $50,000 to $99,999 | 28 (49.1%) | 11 (27.5%) |
| $100,000 to $299,999 | 16 (28.1%) | 19 (47.5%) |
| $300,000 to $499,999 | 0 (0.0%) | 0 (0.0%) |
| $500,000 to $749,999 | 2 (3.5%) | 0 (0.0%) |
| $750,000 to $999,999 | 0 (0.0%) | 0 (0.0%) |
| $1,000,000 or more | 0 (0.0%) | 0 (0.0%) |
| Total | 57 (100.0%) | 40 (100.0%) |
Household Income by Mortgage Status in Donaldson
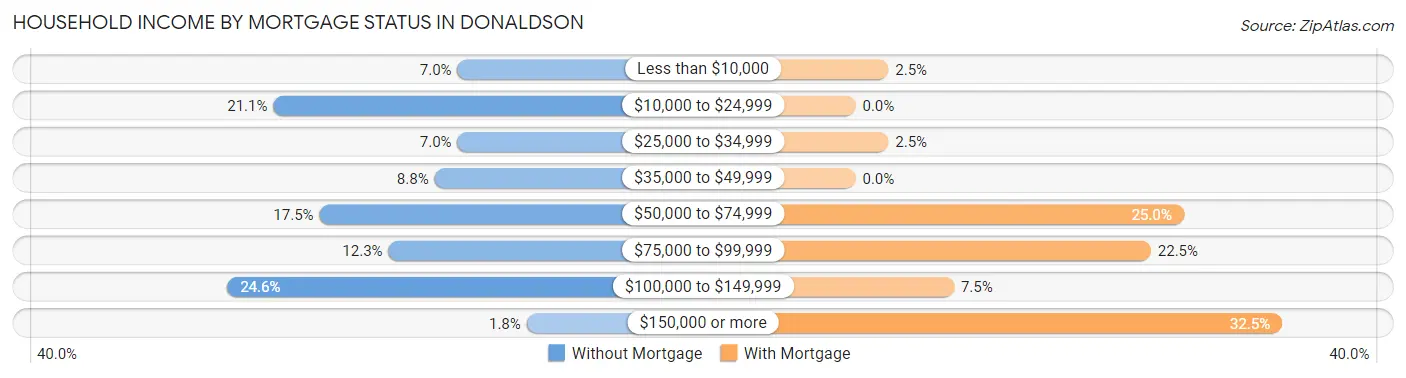
| Household Income | Without Mortgage | With Mortgage |
| Less than $10,000 | 4 (7.0%) | 1 (2.5%) |
| $10,000 to $24,999 | 12 (21.0%) | 0 (0.0%) |
| $25,000 to $34,999 | 4 (7.0%) | 1 (2.5%) |
| $35,000 to $49,999 | 5 (8.8%) | 0 (0.0%) |
| $50,000 to $74,999 | 10 (17.5%) | 10 (25.0%) |
| $75,000 to $99,999 | 7 (12.3%) | 9 (22.5%) |
| $100,000 to $149,999 | 14 (24.6%) | 3 (7.5%) |
| $150,000 or more | 1 (1.8%) | 13 (32.5%) |
| Total | 57 (100.0%) | 40 (100.0%) |
Property Value to Household Income Ratio in Donaldson
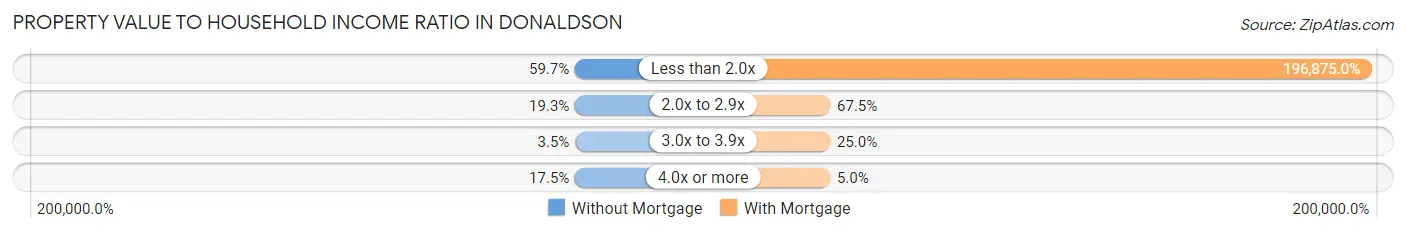
| Value-to-Income Ratio | Without Mortgage | With Mortgage |
| Less than 2.0x | 34 (59.7%) | 78,750 (196,875.0%) |
| 2.0x to 2.9x | 11 (19.3%) | 27 (67.5%) |
| 3.0x to 3.9x | 2 (3.5%) | 10 (25.0%) |
| 4.0x or more | 10 (17.5%) | 2 (5.0%) |
| Total | 57 (100.0%) | 40 (100.0%) |
Real Estate Taxes by Mortgage Status in Donaldson
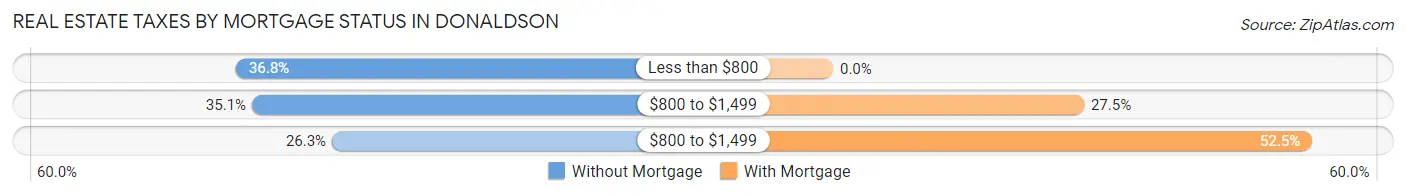
| Property Taxes | Without Mortgage | With Mortgage |
| Less than $800 | 21 (36.8%) | 0 (0.0%) |
| $800 to $1,499 | 20 (35.1%) | 11 (27.5%) |
| $800 to $1,499 | 15 (26.3%) | 21 (52.5%) |
| Total | 57 (100.0%) | 40 (100.0%) |
Health & Disability in Donaldson
Health Insurance Coverage by Age in Donaldson
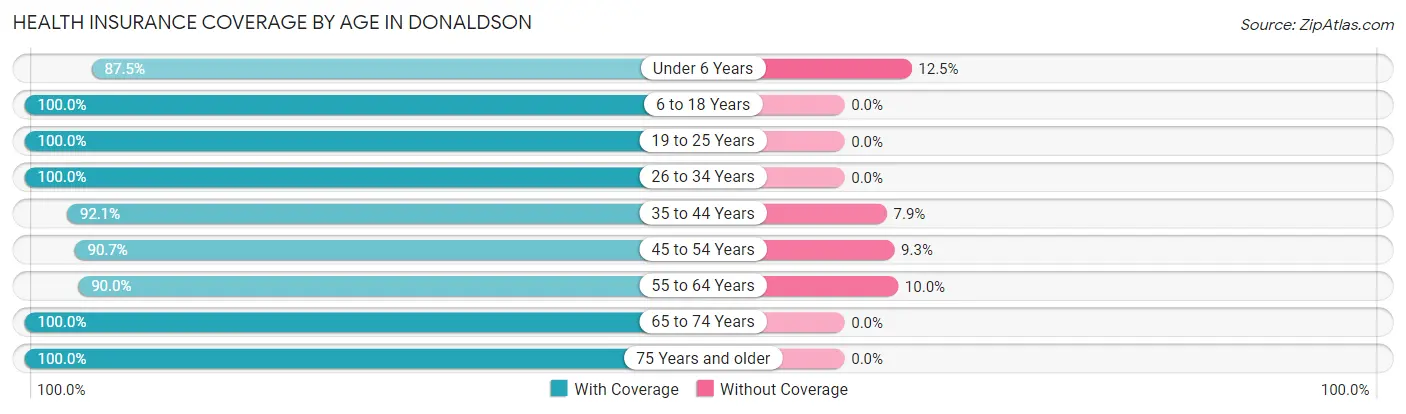
| Age Bracket | With Coverage | Without Coverage |
| Under 6 Years | 14 (87.5%) | 2 (12.5%) |
| 6 to 18 Years | 82 (100.0%) | 0 (0.0%) |
| 19 to 25 Years | 37 (100.0%) | 0 (0.0%) |
| 26 to 34 Years | 37 (100.0%) | 0 (0.0%) |
| 35 to 44 Years | 35 (92.1%) | 3 (7.9%) |
| 45 to 54 Years | 39 (90.7%) | 4 (9.3%) |
| 55 to 64 Years | 45 (90.0%) | 5 (10.0%) |
| 65 to 74 Years | 34 (100.0%) | 0 (0.0%) |
| 75 Years and older | 15 (100.0%) | 0 (0.0%) |
| Total | 338 (96.0%) | 14 (4.0%) |
Health Insurance Coverage by Citizenship Status in Donaldson
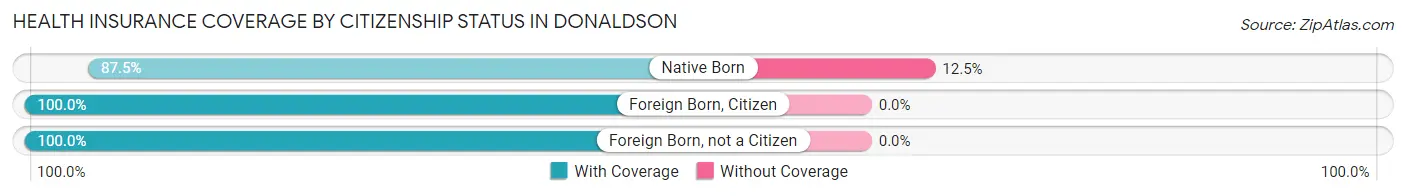
| Citizenship Status | With Coverage | Without Coverage |
| Native Born | 14 (87.5%) | 2 (12.5%) |
| Foreign Born, Citizen | 82 (100.0%) | 0 (0.0%) |
| Foreign Born, not a Citizen | 37 (100.0%) | 0 (0.0%) |
Health Insurance Coverage by Household Income in Donaldson
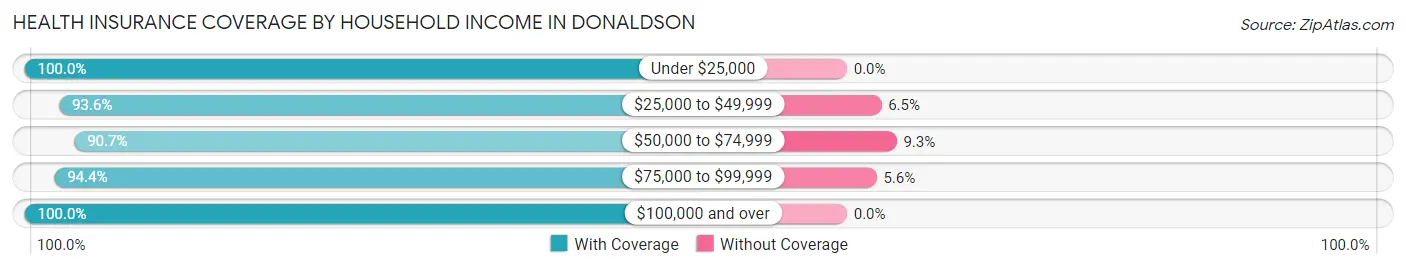
| Household Income | With Coverage | Without Coverage |
| Under $25,000 | 40 (100.0%) | 0 (0.0%) |
| $25,000 to $49,999 | 58 (93.5%) | 4 (6.5%) |
| $50,000 to $74,999 | 78 (90.7%) | 8 (9.3%) |
| $75,000 to $99,999 | 34 (94.4%) | 2 (5.6%) |
| $100,000 and over | 128 (100.0%) | 0 (0.0%) |
Public vs Private Health Insurance Coverage by Age in Donaldson
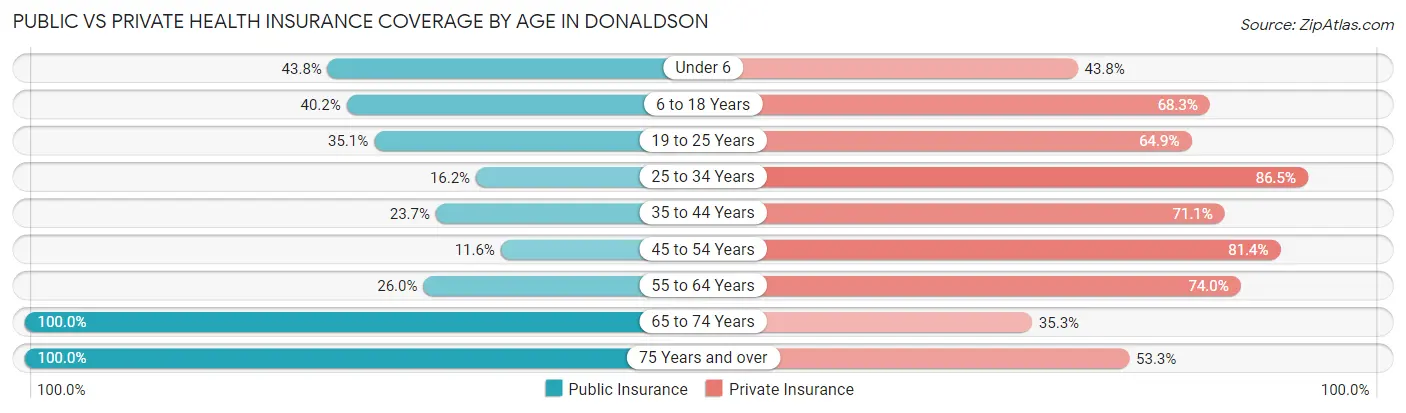
| Age Bracket | Public Insurance | Private Insurance |
| Under 6 | 7 (43.8%) | 7 (43.8%) |
| 6 to 18 Years | 33 (40.2%) | 56 (68.3%) |
| 19 to 25 Years | 13 (35.1%) | 24 (64.9%) |
| 25 to 34 Years | 6 (16.2%) | 32 (86.5%) |
| 35 to 44 Years | 9 (23.7%) | 27 (71.1%) |
| 45 to 54 Years | 5 (11.6%) | 35 (81.4%) |
| 55 to 64 Years | 13 (26.0%) | 37 (74.0%) |
| 65 to 74 Years | 34 (100.0%) | 12 (35.3%) |
| 75 Years and over | 15 (100.0%) | 8 (53.3%) |
| Total | 135 (38.4%) | 238 (67.6%) |
Disability Status by Sex by Age in Donaldson
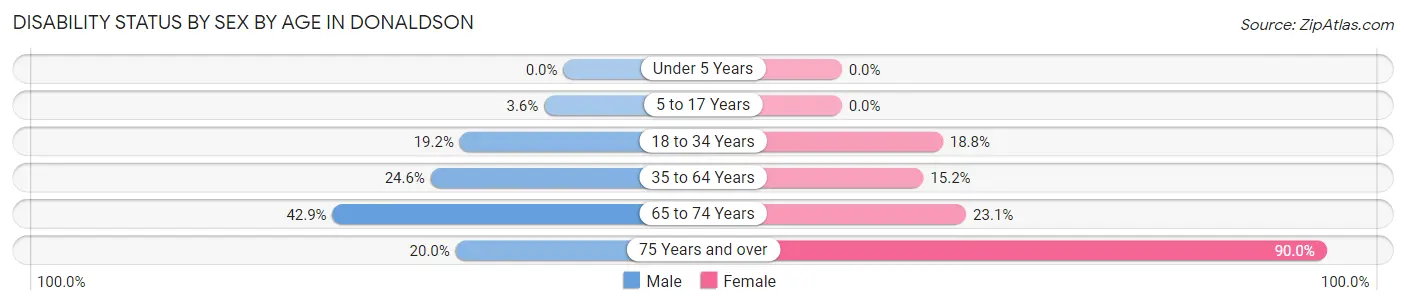
| Age Bracket | Male | Female |
| Under 5 Years | 0 (0.0%) | 0 (0.0%) |
| 5 to 17 Years | 2 (3.6%) | 0 (0.0%) |
| 18 to 34 Years | 10 (19.2%) | 6 (18.8%) |
| 35 to 64 Years | 16 (24.6%) | 10 (15.1%) |
| 65 to 74 Years | 9 (42.9%) | 3 (23.1%) |
| 75 Years and over | 1 (20.0%) | 9 (90.0%) |
Disability Class by Sex by Age in Donaldson
Disability Class: Hearing Difficulty
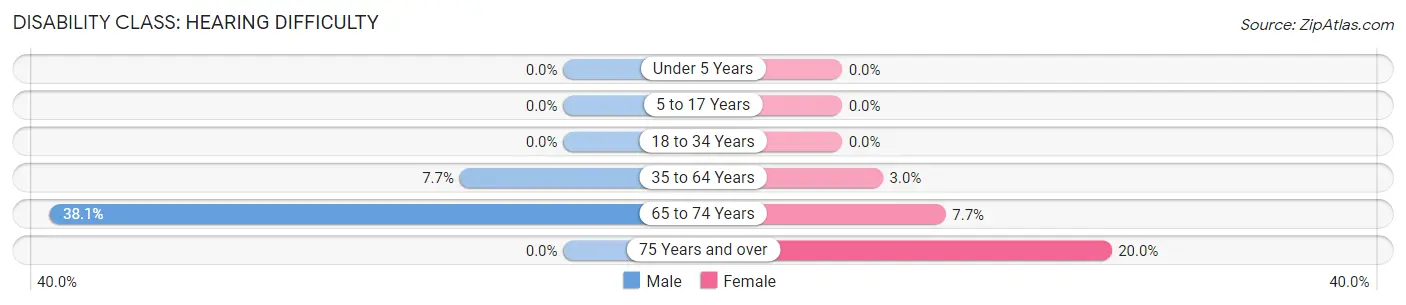
| Age Bracket | Male | Female |
| Under 5 Years | 0 (0.0%) | 0 (0.0%) |
| 5 to 17 Years | 0 (0.0%) | 0 (0.0%) |
| 18 to 34 Years | 0 (0.0%) | 0 (0.0%) |
| 35 to 64 Years | 5 (7.7%) | 2 (3.0%) |
| 65 to 74 Years | 8 (38.1%) | 1 (7.7%) |
| 75 Years and over | 0 (0.0%) | 2 (20.0%) |
Disability Class: Vision Difficulty
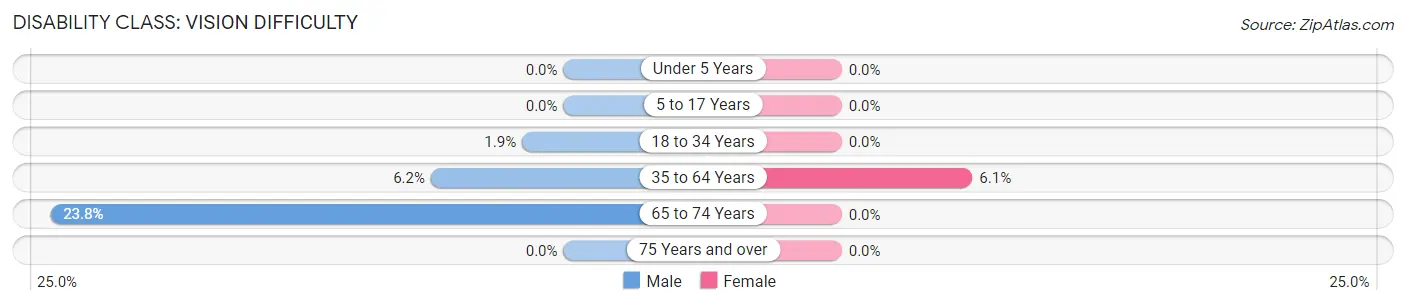
| Age Bracket | Male | Female |
| Under 5 Years | 0 (0.0%) | 0 (0.0%) |
| 5 to 17 Years | 0 (0.0%) | 0 (0.0%) |
| 18 to 34 Years | 1 (1.9%) | 0 (0.0%) |
| 35 to 64 Years | 4 (6.1%) | 4 (6.1%) |
| 65 to 74 Years | 5 (23.8%) | 0 (0.0%) |
| 75 Years and over | 0 (0.0%) | 0 (0.0%) |
Disability Class: Cognitive Difficulty
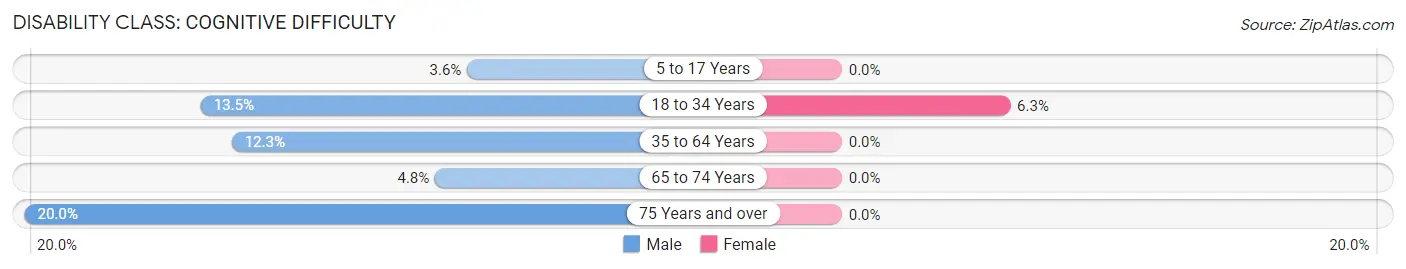
| Age Bracket | Male | Female |
| 5 to 17 Years | 2 (3.6%) | 0 (0.0%) |
| 18 to 34 Years | 7 (13.5%) | 2 (6.2%) |
| 35 to 64 Years | 8 (12.3%) | 0 (0.0%) |
| 65 to 74 Years | 1 (4.8%) | 0 (0.0%) |
| 75 Years and over | 1 (20.0%) | 0 (0.0%) |
Disability Class: Ambulatory Difficulty
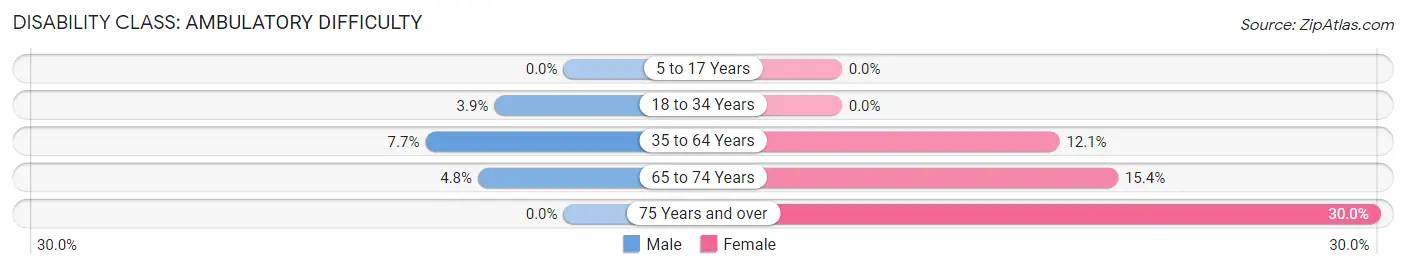
| Age Bracket | Male | Female |
| 5 to 17 Years | 0 (0.0%) | 0 (0.0%) |
| 18 to 34 Years | 2 (3.8%) | 0 (0.0%) |
| 35 to 64 Years | 5 (7.7%) | 8 (12.1%) |
| 65 to 74 Years | 1 (4.8%) | 2 (15.4%) |
| 75 Years and over | 0 (0.0%) | 3 (30.0%) |
Disability Class: Self-Care Difficulty
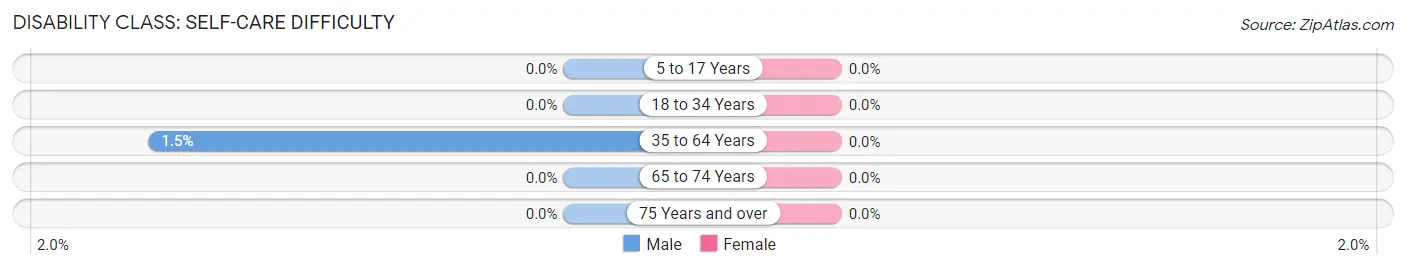
| Age Bracket | Male | Female |
| 5 to 17 Years | 0 (0.0%) | 0 (0.0%) |
| 18 to 34 Years | 0 (0.0%) | 0 (0.0%) |
| 35 to 64 Years | 1 (1.5%) | 0 (0.0%) |
| 65 to 74 Years | 0 (0.0%) | 0 (0.0%) |
| 75 Years and over | 0 (0.0%) | 0 (0.0%) |
Technology Access in Donaldson
Computing Device Access in Donaldson
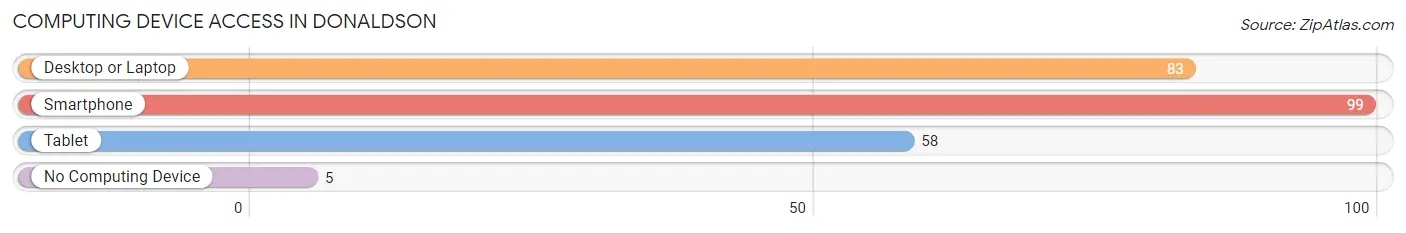
| Device Type | # Households | % Households |
| Desktop or Laptop | 83 | 66.9% |
| Smartphone | 99 | 79.8% |
| Tablet | 58 | 46.8% |
| No Computing Device | 5 | 4.0% |
| Total | 124 | 100.0% |
Internet Access in Donaldson
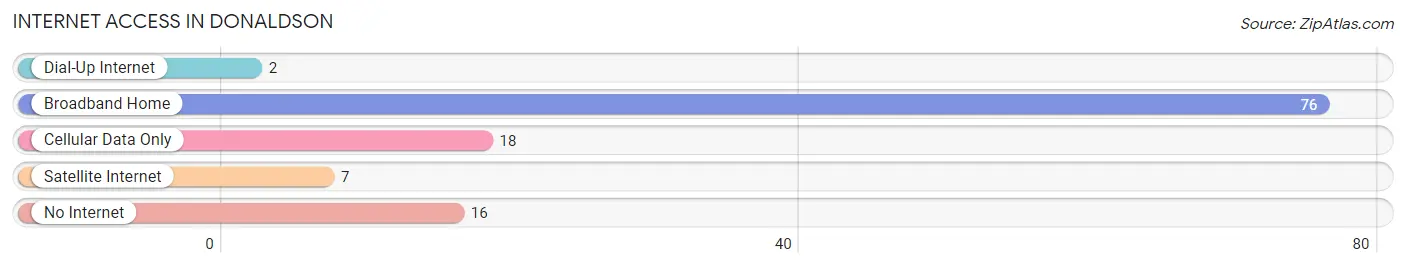
| Internet Type | # Households | % Households |
| Dial-Up Internet | 2 | 1.6% |
| Broadband Home | 76 | 61.3% |
| Cellular Data Only | 18 | 14.5% |
| Satellite Internet | 7 | 5.7% |
| No Internet | 16 | 12.9% |
| Total | 124 | 100.0% |
Donaldson Summary
Donaldson is a small borough located in Schuylkill County, Pennsylvania. It is situated in the southern part of the county, approximately five miles south of the county seat of Pottsville. The borough is located in the heart of the anthracite coal region of Pennsylvania, and has a population of approximately 1,000 people.
History
Donaldson was founded in 1867 by a group of miners from the nearby town of Mahanoy City. The miners were looking for a place to call home and found the area to be ideal for their needs. The town was named after the first miner to settle in the area, John Donaldson. The town quickly grew and by the early 1900s, it had become a thriving coal mining community. The town was home to several coal mines, including the Donaldson Colliery, which was the largest in the area.
The town was also home to a number of other businesses, including a hotel, a general store, a post office, and a number of churches. The town was also home to a number of social clubs, including the Donaldson Social Club, which was founded in 1891.
Geography
Donaldson is located in the southern part of Schuylkill County, approximately five miles south of the county seat of Pottsville. The borough is situated in the heart of the anthracite coal region of Pennsylvania. The town is located in a valley surrounded by hills and mountains. The town is located along the Little Schuylkill River, which flows through the town.
The town is located in a temperate climate, with hot summers and cold winters. The average temperature in the summer is around 75 degrees Fahrenheit, while the average temperature in the winter is around 30 degrees Fahrenheit. The town receives an average of 40 inches of precipitation per year.
Economy
The economy of Donaldson is largely based on the coal mining industry. The town was home to several coal mines, including the Donaldson Colliery, which was the largest in the area. The town was also home to a number of other businesses, including a hotel, a general store, a post office, and a number of churches.
The town is also home to a number of small businesses, including a number of restaurants, bars, and shops. The town is also home to a number of small manufacturing businesses, including a number of machine shops and metalworking businesses.
Demographics
As of the 2010 census, the population of Donaldson was 1,000 people. The town is predominantly white, with approximately 95% of the population being white. The town is also home to a small Hispanic population, with approximately 4% of the population being Hispanic. The town is also home to a small African American population, with approximately 1% of the population being African American.
The median household income in Donaldson is approximately $35,000 per year. The town has a poverty rate of approximately 15%, which is slightly higher than the national average. The town also has a high unemployment rate, with approximately 10% of the population being unemployed.
Conclusion
Donaldson is a small borough located in Schuylkill County, Pennsylvania. It is situated in the southern part of the county, approximately five miles south of the county seat of Pottsville. The borough is located in the heart of the anthracite coal region of Pennsylvania, and has a population of approximately 1,000 people. The economy of Donaldson is largely based on the coal mining industry, and the town is also home to a number of small businesses. The town is predominantly white, with approximately 95% of the population being white. The median household income in Donaldson is approximately $35,000 per year, and the town has a poverty rate of approximately 15%.
Common Questions
What is Per Capita Income in Donaldson?
Per Capita income in Donaldson is $23,880.
What is the Median Family Income in Donaldson?
Median Family Income in Donaldson is $72,500.
What is the Median Household income in Donaldson?
Median Household Income in Donaldson is $57,500.
What is Income or Wage Gap in Donaldson?
Income or Wage Gap in Donaldson is 34.9%.
Women in Donaldson earn 65.1 cents for every dollar earned by a man.
What is Inequality or Gini Index in Donaldson?
Inequality or Gini Index in Donaldson is 0.36.
What is the Total Population of Donaldson?
Total Population of Donaldson is 352.
What is the Total Male Population of Donaldson?
Total Male Population of Donaldson is 205.
What is the Total Female Population of Donaldson?
Total Female Population of Donaldson is 147.
What is the Ratio of Males per 100 Females in Donaldson?
There are 139.46 Males per 100 Females in Donaldson.
What is the Ratio of Females per 100 Males in Donaldson?
There are 71.71 Females per 100 Males in Donaldson.
What is the Median Population Age in Donaldson?
Median Population Age in Donaldson is 35.8 Years.
What is the Average Family Size in Donaldson
Average Family Size in Donaldson is 3.3 People.
What is the Average Household Size in Donaldson
Average Household Size in Donaldson is 2.8 People.
How Large is the Labor Force in Donaldson?
There are 185 People in the Labor Forcein in Donaldson.
What is the Percentage of People in the Labor Force in Donaldson?
65.8% of People are in the Labor Force in Donaldson.
What is the Unemployment Rate in Donaldson?
Unemployment Rate in Donaldson is 4.9%.