Glen Hope borough, PA Map & Demographics
Glen Hope borough Overview
$27,858
PER CAPITA INCOME
$85,069
AVG FAMILY INCOME
$60,833
AVG HOUSEHOLD INCOME
0.31
INEQUALITY / GINI INDEX
190
TOTAL POPULATION
100
MALE POPULATION
90
FEMALE POPULATION
111.11
MALES / 100 FEMALES
90.00
FEMALES / 100 MALES
51.6
MEDIAN AGE
2.8
AVG FAMILY SIZE
2.3
AVG HOUSEHOLD SIZE
77
LABOR FORCE [ PEOPLE ]
41.8%
PERCENT IN LABOR FORCE
Income in Glen Hope borough
Income Overview in Glen Hope borough
Per Capita Income in Glen Hope borough is $27,858, while median incomes of families and households are $85,069 and $60,833 respectively.
| Characteristic | Number | Measure |
| Per Capita Income | 190 | $27,858 |
| Median Family Income | 55 | $85,069 |
| Mean Family Income | 55 | $73,116 |
| Median Household Income | 82 | $60,833 |
| Mean Household Income | 82 | $60,389 |
| Income Deficit | 55 | $0 |
| Wage / Income Gap (%) | 190 | 0.00% |
| Wage / Income Gap ($) | 190 | 100.00¢ per $1 |
| Gini / Inequality Index | 190 | 0.31 |
Earnings by Sex in Glen Hope borough
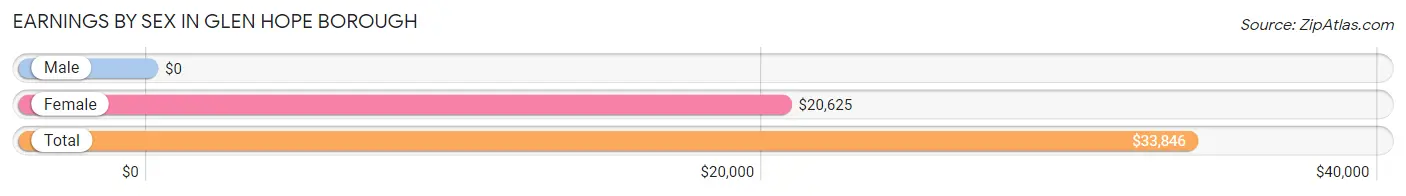
| Sex | Number | Average Earnings |
| Male | 52 (46.4%) | $0 |
| Female | 60 (53.6%) | $20,625 |
| Total | 112 (100.0%) | $33,846 |
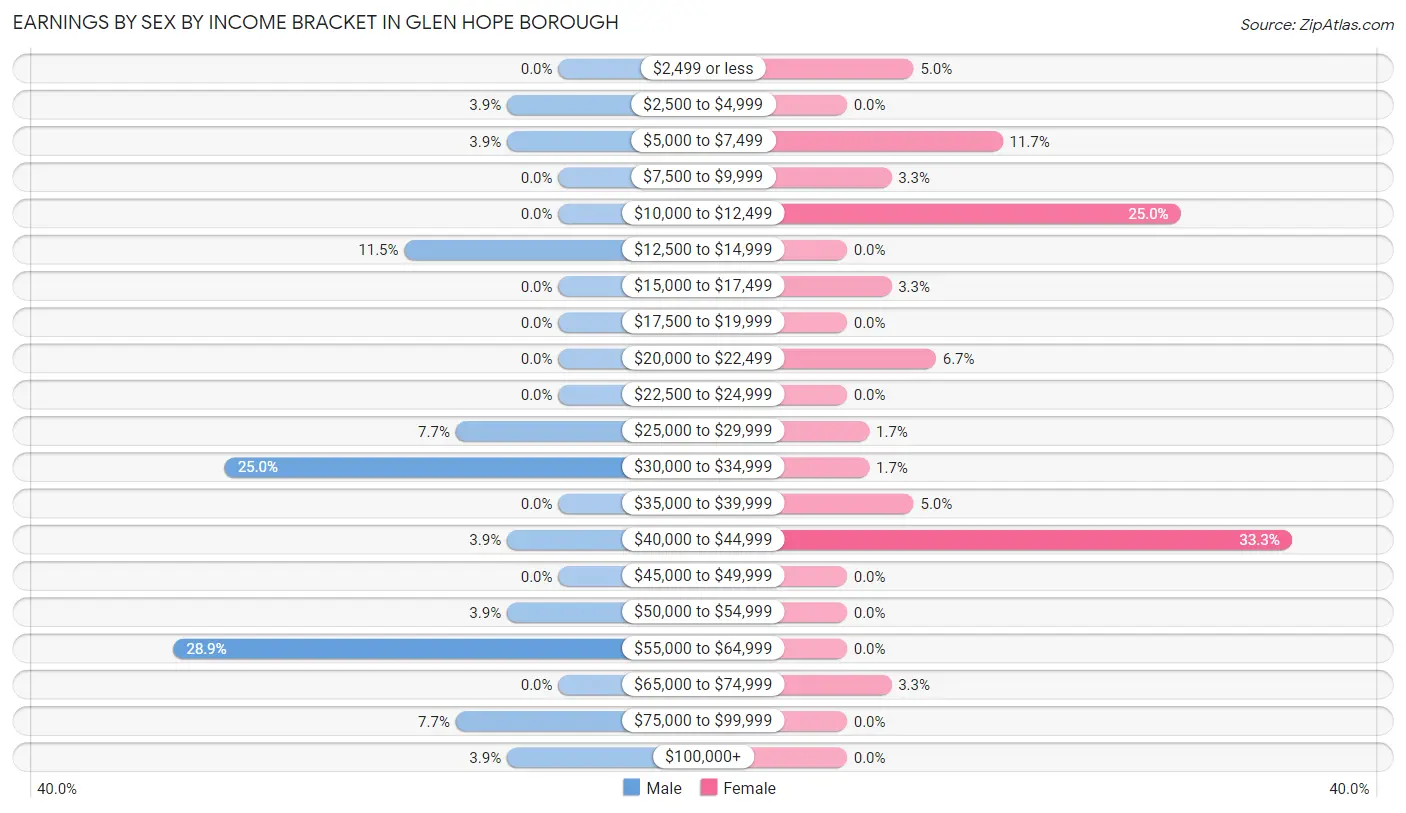
Earnings by Sex by Income Bracket in Glen Hope borough
The most common earnings brackets in Glen Hope borough are $55,000 to $64,999 for men (15 | 28.8%) and $40,000 to $44,999 for women (20 | 33.3%).
| Income | Male | Female |
| $2,499 or less | 0 (0.0%) | 3 (5.0%) |
| $2,500 to $4,999 | 2 (3.8%) | 0 (0.0%) |
| $5,000 to $7,499 | 2 (3.8%) | 7 (11.7%) |
| $7,500 to $9,999 | 0 (0.0%) | 2 (3.3%) |
| $10,000 to $12,499 | 0 (0.0%) | 15 (25.0%) |
| $12,500 to $14,999 | 6 (11.5%) | 0 (0.0%) |
| $15,000 to $17,499 | 0 (0.0%) | 2 (3.3%) |
| $17,500 to $19,999 | 0 (0.0%) | 0 (0.0%) |
| $20,000 to $22,499 | 0 (0.0%) | 4 (6.7%) |
| $22,500 to $24,999 | 0 (0.0%) | 0 (0.0%) |
| $25,000 to $29,999 | 4 (7.7%) | 1 (1.7%) |
| $30,000 to $34,999 | 13 (25.0%) | 1 (1.7%) |
| $35,000 to $39,999 | 0 (0.0%) | 3 (5.0%) |
| $40,000 to $44,999 | 2 (3.8%) | 20 (33.3%) |
| $45,000 to $49,999 | 0 (0.0%) | 0 (0.0%) |
| $50,000 to $54,999 | 2 (3.8%) | 0 (0.0%) |
| $55,000 to $64,999 | 15 (28.8%) | 0 (0.0%) |
| $65,000 to $74,999 | 0 (0.0%) | 2 (3.3%) |
| $75,000 to $99,999 | 4 (7.7%) | 0 (0.0%) |
| $100,000+ | 2 (3.8%) | 0 (0.0%) |
| Total | 52 (100.0%) | 60 (100.0%) |
Earnings by Sex by Educational Attainment in Glen Hope borough
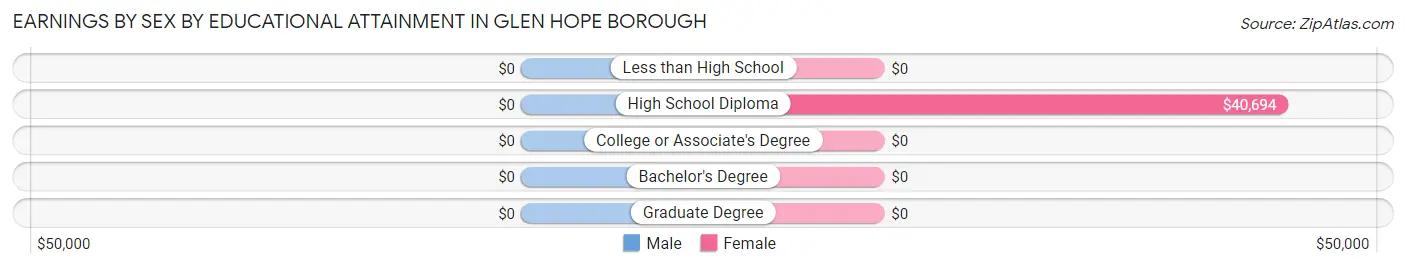
| Educational Attainment | Male Income | Female Income |
| Less than High School | - | - |
| High School Diploma | - | - |
| College or Associate's Degree | - | - |
| Bachelor's Degree | - | - |
| Graduate Degree | - | - |
| Total | $55,000 | $40,063 |
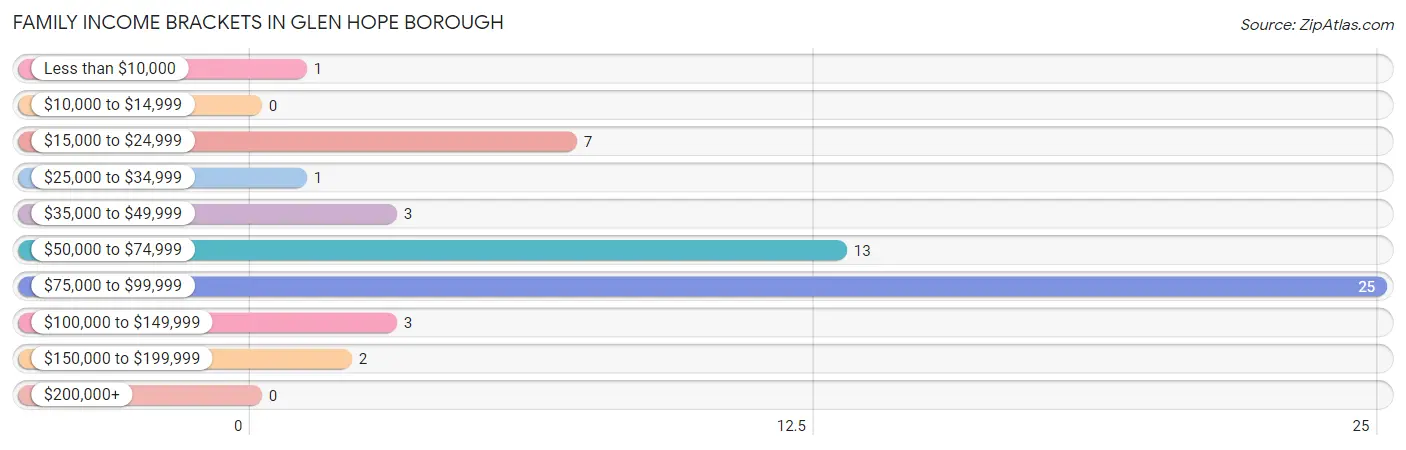
Family Income in Glen Hope borough
Family Income Brackets in Glen Hope borough
According to the Glen Hope borough family income data, there are 25 families falling into the $75,000 to $99,999 income range, which is the most common income bracket and makes up 45.5% of all families.
| Income Bracket | # Families | % Families |
| Less than $10,000 | 1 | 1.8% |
| $10,000 to $14,999 | 0 | 0.0% |
| $15,000 to $24,999 | 7 | 12.7% |
| $25,000 to $34,999 | 1 | 1.8% |
| $35,000 to $49,999 | 3 | 5.5% |
| $50,000 to $74,999 | 13 | 23.6% |
| $75,000 to $99,999 | 25 | 45.5% |
| $100,000 to $149,999 | 3 | 5.5% |
| $150,000 to $199,999 | 2 | 3.6% |
| $200,000+ | 0 | 0.0% |
Family Income by Famaliy Size in Glen Hope borough
4-person families (21 | 38.2%) account for the highest median family income in Glen Hope borough with $86,181 per family, while 2-person families (23 | 41.8%) have the highest median income of $32,812 per family member.
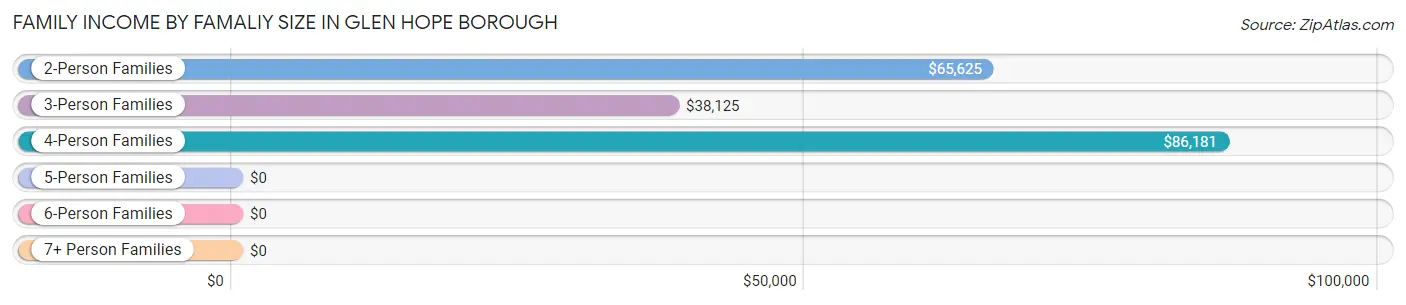
| Income Bracket | # Families | Median Income |
| 2-Person Families | 23 (41.8%) | $65,625 |
| 3-Person Families | 11 (20.0%) | $38,125 |
| 4-Person Families | 21 (38.2%) | $86,181 |
| 5-Person Families | 0 (0.0%) | $0 |
| 6-Person Families | 0 (0.0%) | $0 |
| 7+ Person Families | 0 (0.0%) | $0 |
| Total | 55 (100.0%) | $85,069 |
Family Income by Number of Earners in Glen Hope borough
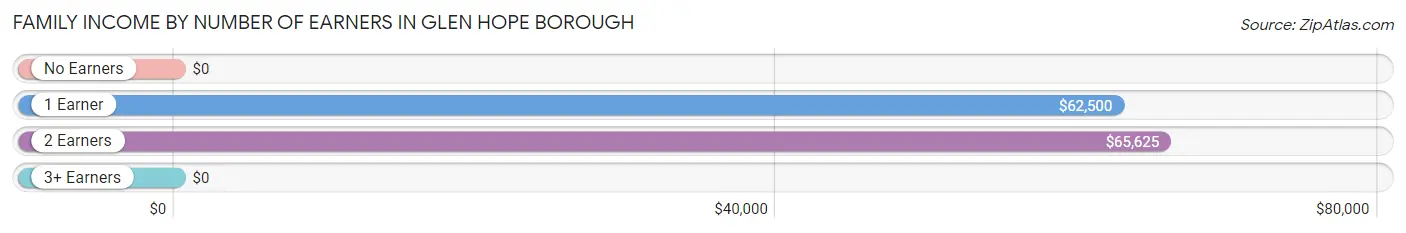
| Number of Earners | # Families | Median Income |
| No Earners | 6 (10.9%) | $0 |
| 1 Earner | 12 (21.8%) | $62,500 |
| 2 Earners | 19 (34.5%) | $65,625 |
| 3+ Earners | 18 (32.7%) | $0 |
| Total | 55 (100.0%) | $85,069 |
Household Income in Glen Hope borough
Household Income Brackets in Glen Hope borough
With 27 households falling in the category, the $75,000 to $99,999 income range is the most frequent in Glen Hope borough, accounting for 32.9% of all households.
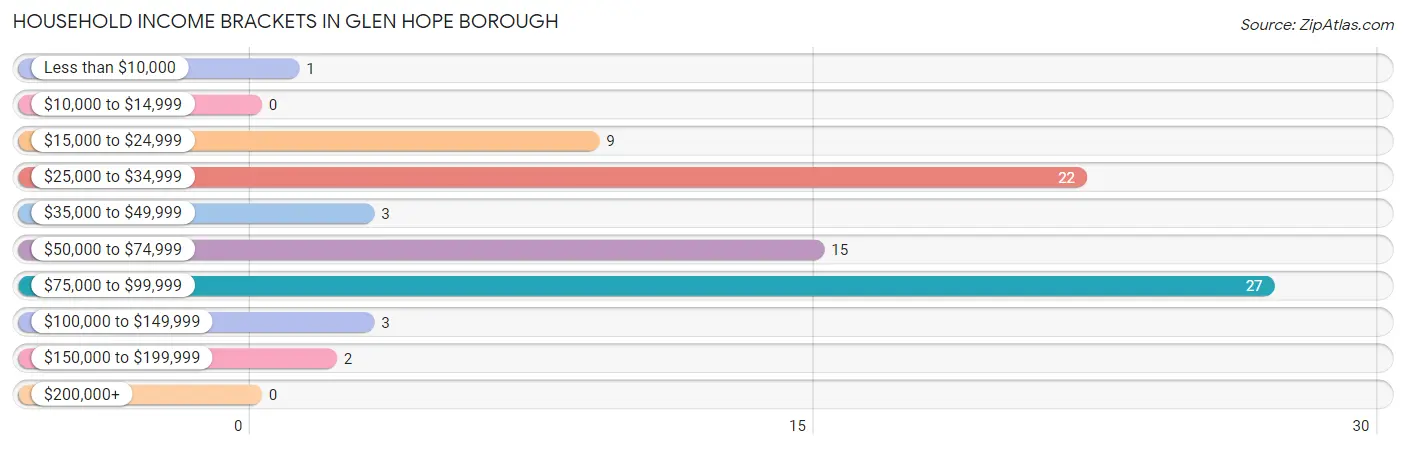
| Income Bracket | # Households | % Households |
| Less than $10,000 | 1 | 1.2% |
| $10,000 to $14,999 | 0 | 0.0% |
| $15,000 to $24,999 | 9 | 11.0% |
| $25,000 to $34,999 | 22 | 26.8% |
| $35,000 to $49,999 | 3 | 3.7% |
| $50,000 to $74,999 | 15 | 18.3% |
| $75,000 to $99,999 | 27 | 32.9% |
| $100,000 to $149,999 | 3 | 3.7% |
| $150,000 to $199,999 | 2 | 2.4% |
| $200,000+ | 0 | 0.0% |
Household Income by Householder Age in Glen Hope borough
The median household income in Glen Hope borough is $60,833, with the highest median household income of $88,750 found in the 25 to 44 years age bracket for the primary householder. A total of 5 households (6.1%) fall into this category.
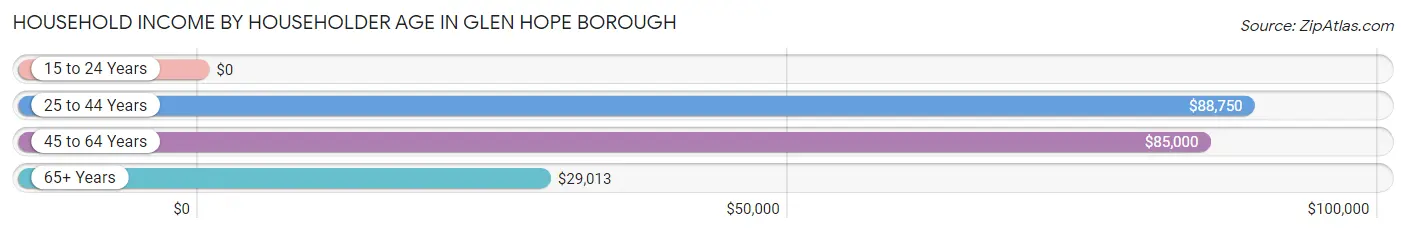
| Income Bracket | # Households | Median Income |
| 15 to 24 Years | 0 (0.0%) | $0 |
| 25 to 44 Years | 5 (6.1%) | $88,750 |
| 45 to 64 Years | 46 (56.1%) | $85,000 |
| 65+ Years | 31 (37.8%) | $29,013 |
| Total | 82 (100.0%) | $60,833 |
Poverty in Glen Hope borough
Income Below Poverty by Sex and Age in Glen Hope borough
With 1.0% poverty level for males and 3.3% for females among the residents of Glen Hope borough, 75 year old and over males and 75 year old and over females are the most vulnerable to poverty, with 1 males (4.2%) and 2 females (20.0%) in their respective age groups living below the poverty level.
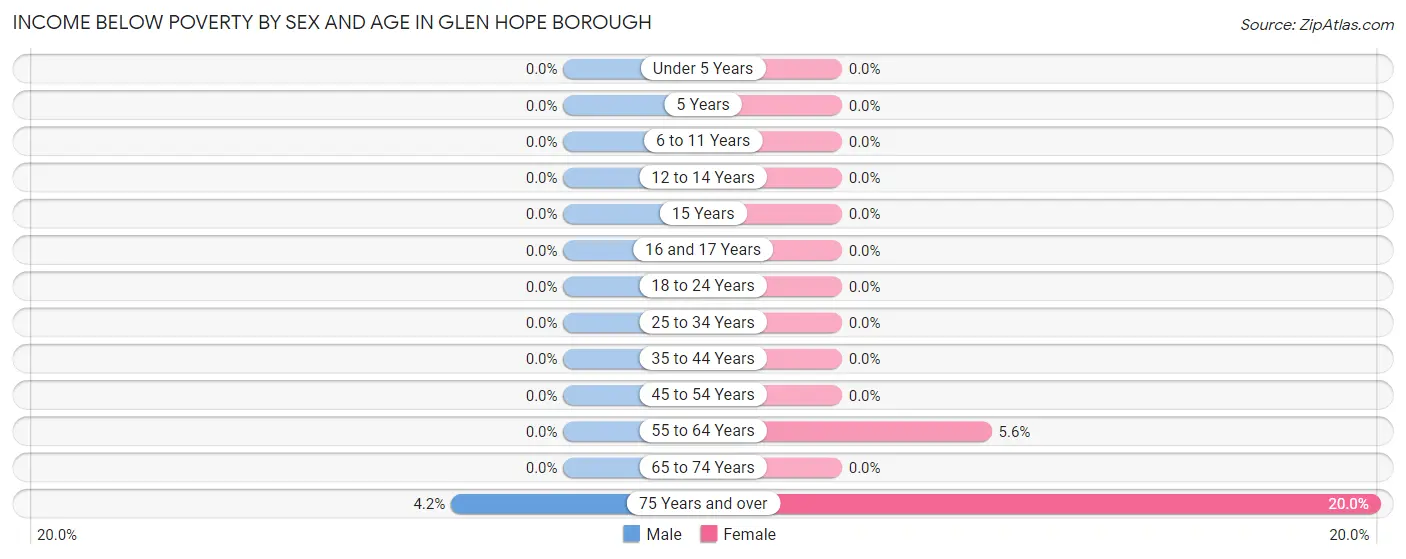
| Age Bracket | Male | Female |
| Under 5 Years | 0 (0.0%) | 0 (0.0%) |
| 5 Years | 0 (0.0%) | 0 (0.0%) |
| 6 to 11 Years | 0 (0.0%) | 0 (0.0%) |
| 12 to 14 Years | 0 (0.0%) | 0 (0.0%) |
| 15 Years | 0 (0.0%) | 0 (0.0%) |
| 16 and 17 Years | 0 (0.0%) | 0 (0.0%) |
| 18 to 24 Years | 0 (0.0%) | 0 (0.0%) |
| 25 to 34 Years | 0 (0.0%) | 0 (0.0%) |
| 35 to 44 Years | 0 (0.0%) | 0 (0.0%) |
| 45 to 54 Years | 0 (0.0%) | 0 (0.0%) |
| 55 to 64 Years | 0 (0.0%) | 1 (5.6%) |
| 65 to 74 Years | 0 (0.0%) | 0 (0.0%) |
| 75 Years and over | 1 (4.2%) | 2 (20.0%) |
| Total | 1 (1.0%) | 3 (3.3%) |
Income Above Poverty by Sex and Age in Glen Hope borough
According to the poverty statistics in Glen Hope borough, males aged under 5 years and females aged 6 to 11 years are the age groups that are most secure financially, with 100.0% of males and 100.0% of females in these age groups living above the poverty line.
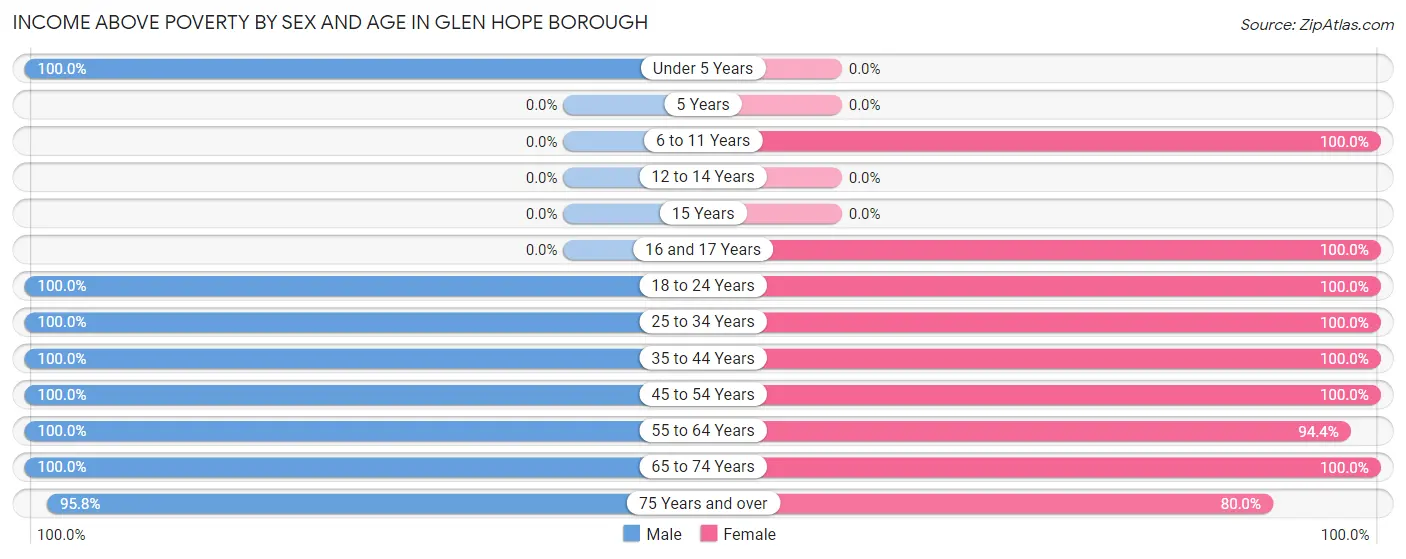
| Age Bracket | Male | Female |
| Under 5 Years | 2 (100.0%) | 0 (0.0%) |
| 5 Years | 0 (0.0%) | 0 (0.0%) |
| 6 to 11 Years | 0 (0.0%) | 4 (100.0%) |
| 12 to 14 Years | 0 (0.0%) | 0 (0.0%) |
| 15 Years | 0 (0.0%) | 0 (0.0%) |
| 16 and 17 Years | 0 (0.0%) | 1 (100.0%) |
| 18 to 24 Years | 26 (100.0%) | 19 (100.0%) |
| 25 to 34 Years | 1 (100.0%) | 3 (100.0%) |
| 35 to 44 Years | 13 (100.0%) | 4 (100.0%) |
| 45 to 54 Years | 11 (100.0%) | 26 (100.0%) |
| 55 to 64 Years | 17 (100.0%) | 17 (94.4%) |
| 65 to 74 Years | 6 (100.0%) | 5 (100.0%) |
| 75 Years and over | 23 (95.8%) | 8 (80.0%) |
| Total | 99 (99.0%) | 87 (96.7%) |
Income Below Poverty Among Married-Couple Families in Glen Hope borough
The poverty statistics for married-couple families in Glen Hope borough show that 3.1% or 1 of the total 32 families live below the poverty line. Families with no children have the highest poverty rate of 3.6%, comprising of 1 families. On the other hand, families with 1 or 2 children have the lowest poverty rate of 0.0%, which includes 0 families.
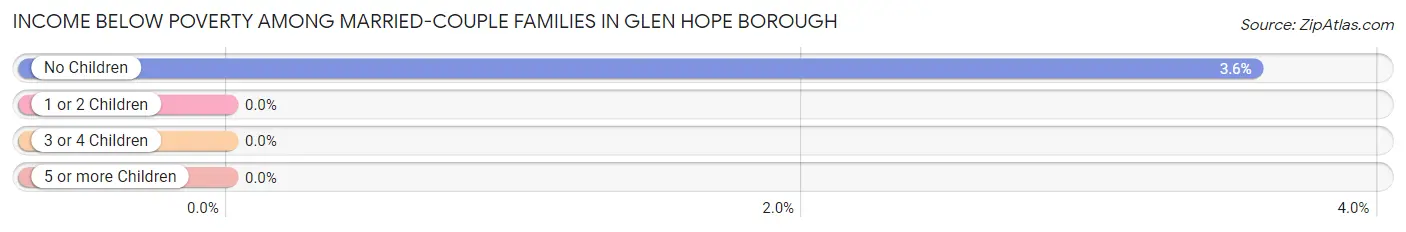
| Children | Above Poverty | Below Poverty |
| No Children | 27 (96.4%) | 1 (3.6%) |
| 1 or 2 Children | 4 (100.0%) | 0 (0.0%) |
| 3 or 4 Children | 0 (0.0%) | 0 (0.0%) |
| 5 or more Children | 0 (0.0%) | 0 (0.0%) |
| Total | 31 (96.9%) | 1 (3.1%) |
Income Below Poverty Among Single-Parent Households in Glen Hope borough
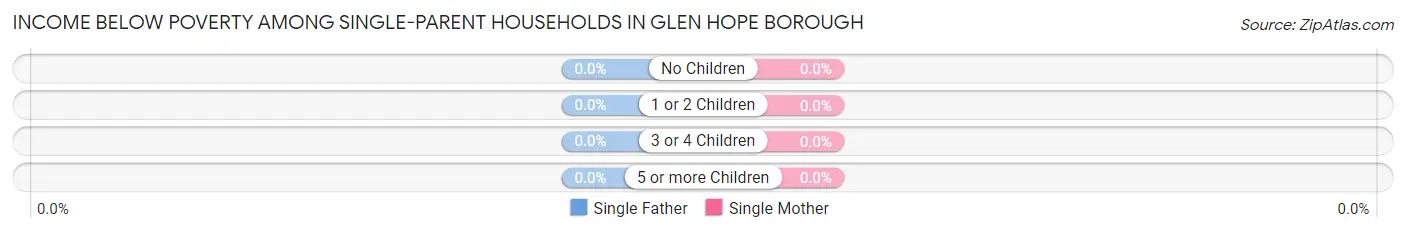
| Children | Single Father | Single Mother |
| No Children | 0 (0.0%) | 0 (0.0%) |
| 1 or 2 Children | 0 (0.0%) | 0 (0.0%) |
| 3 or 4 Children | 0 (0.0%) | 0 (0.0%) |
| 5 or more Children | 0 (0.0%) | 0 (0.0%) |
| Total | 0 (0.0%) | 0 (0.0%) |
Income Below Poverty Among Married-Couple vs Single-Parent Households in Glen Hope borough
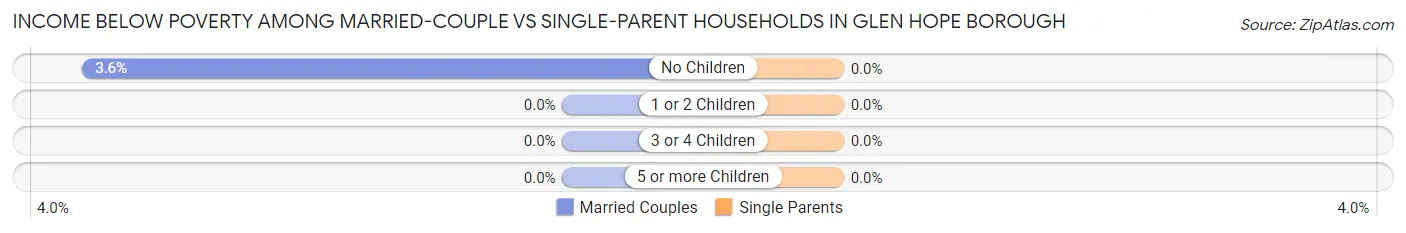
| Children | Married-Couple Families | Single-Parent Households |
| No Children | 1 (3.6%) | 0 (0.0%) |
| 1 or 2 Children | 0 (0.0%) | 0 (0.0%) |
| 3 or 4 Children | 0 (0.0%) | 0 (0.0%) |
| 5 or more Children | 0 (0.0%) | 0 (0.0%) |
| Total | 1 (3.1%) | 0 (0.0%) |
Race in Glen Hope borough
The most populous races in Glen Hope borough are White / Caucasian (190 | 100.0%), and Hispanic or Latino (2 | 1.1%).
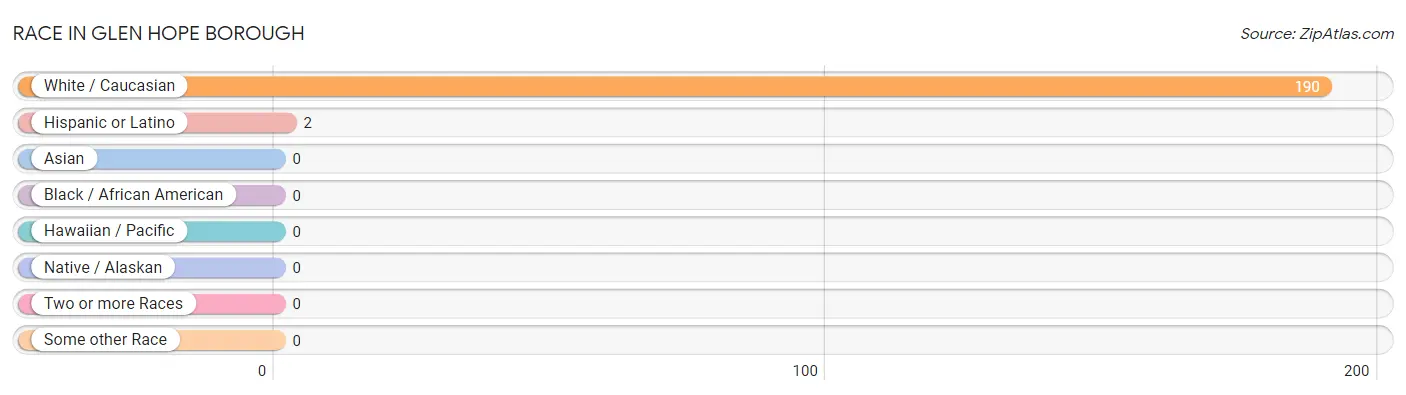
| Race | # Population | % Population |
| Asian | 0 | 0.0% |
| Black / African American | 0 | 0.0% |
| Hawaiian / Pacific | 0 | 0.0% |
| Hispanic or Latino | 2 | 1.1% |
| Native / Alaskan | 0 | 0.0% |
| White / Caucasian | 190 | 100.0% |
| Two or more Races | 0 | 0.0% |
| Some other Race | 0 | 0.0% |
| Total | 190 | 100.0% |
Ancestry in Glen Hope borough
The most populous ancestries reported in Glen Hope borough are Russian (31 | 16.3%), English (22 | 11.6%), Polish (20 | 10.5%), German (16 | 8.4%), and Irish (14 | 7.4%), together accounting for 54.2% of all Glen Hope borough residents.
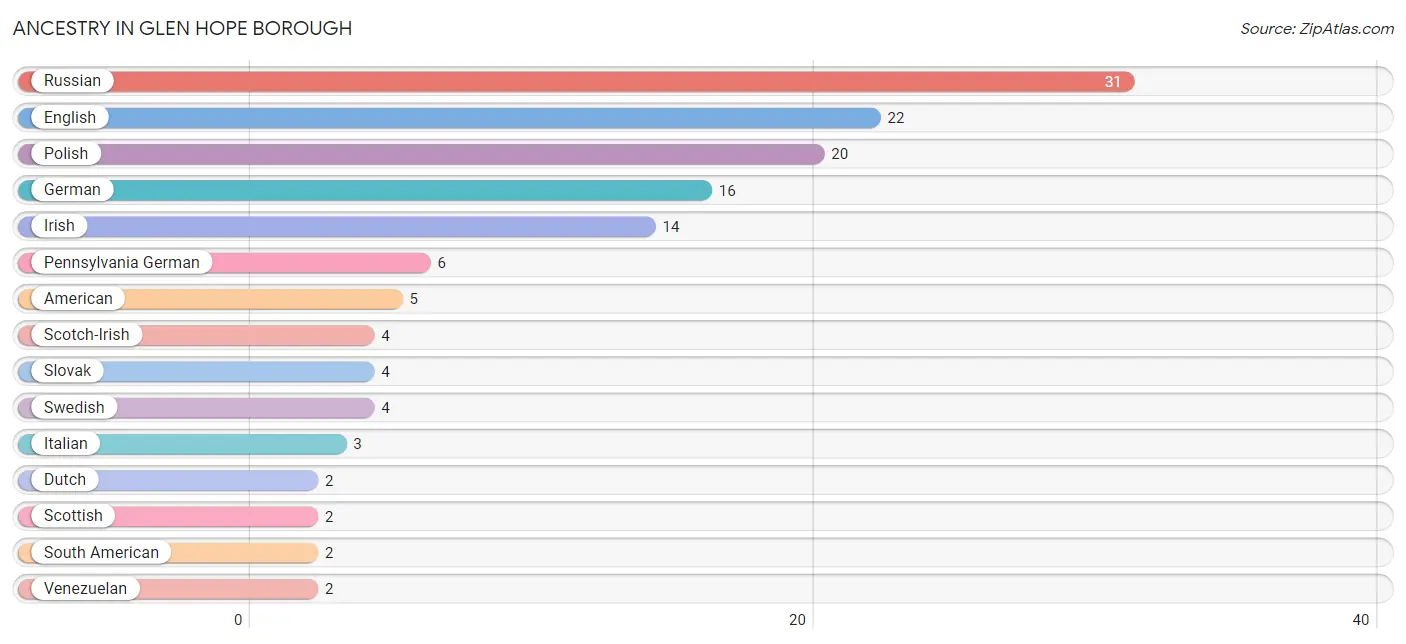
| Ancestry | # Population | % Population |
| American | 5 | 2.6% |
| Dutch | 2 | 1.1% |
| English | 22 | 11.6% |
| German | 16 | 8.4% |
| Irish | 14 | 7.4% |
| Italian | 3 | 1.6% |
| Pennsylvania German | 6 | 3.2% |
| Polish | 20 | 10.5% |
| Russian | 31 | 16.3% |
| Scotch-Irish | 4 | 2.1% |
| Scottish | 2 | 1.1% |
| Slovak | 4 | 2.1% |
| South American | 2 | 1.1% |
| Swedish | 4 | 2.1% |
| Venezuelan | 2 | 1.1% | View All 15 Rows |
Immigrants in Glen Hope borough

| Immigration Origin | # Population | % Population | View All 0 Rows |
Sex and Age in Glen Hope borough
Sex and Age in Glen Hope borough
The most populous age groups in Glen Hope borough are 80 to 84 Years (20 | 20.0%) for men and 50 to 54 Years (24 | 26.7%) for women.
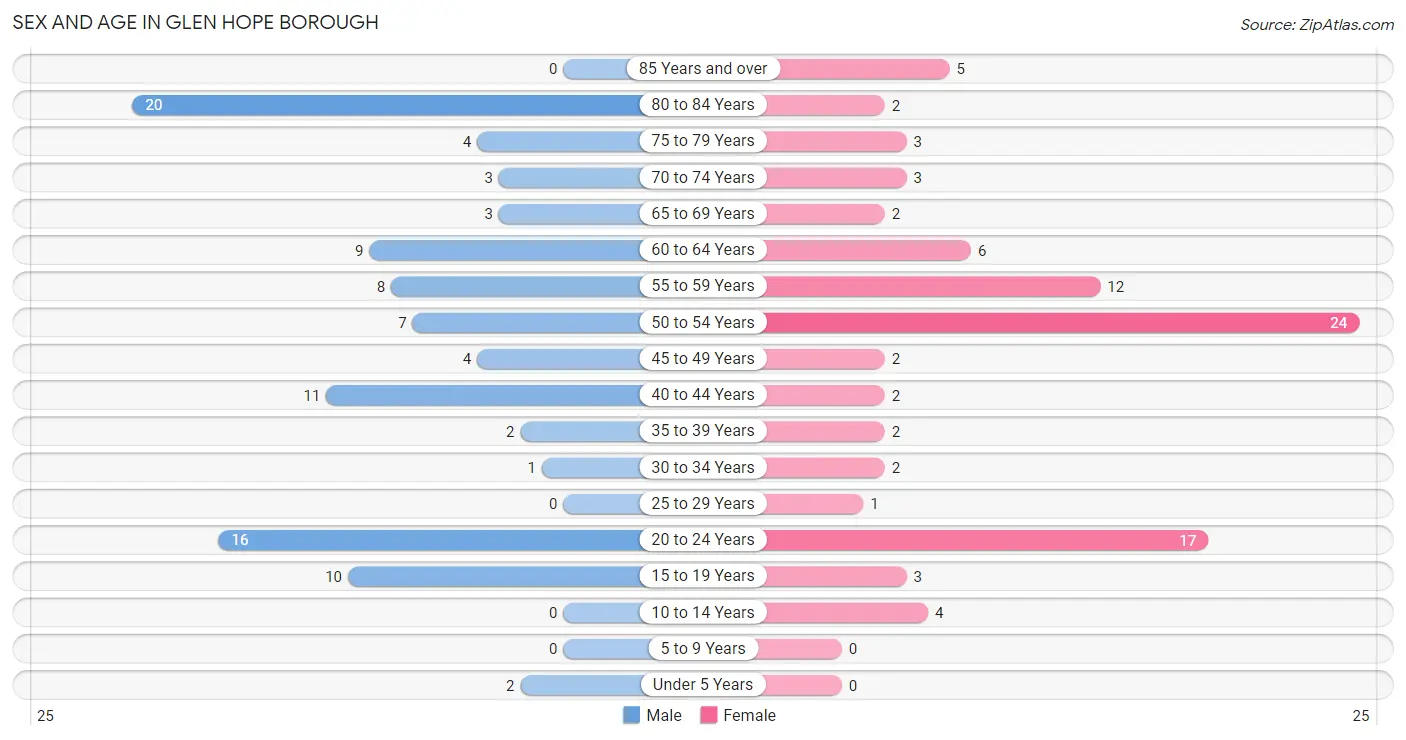
| Age Bracket | Male | Female |
| Under 5 Years | 2 (2.0%) | 0 (0.0%) |
| 5 to 9 Years | 0 (0.0%) | 0 (0.0%) |
| 10 to 14 Years | 0 (0.0%) | 4 (4.4%) |
| 15 to 19 Years | 10 (10.0%) | 3 (3.3%) |
| 20 to 24 Years | 16 (16.0%) | 17 (18.9%) |
| 25 to 29 Years | 0 (0.0%) | 1 (1.1%) |
| 30 to 34 Years | 1 (1.0%) | 2 (2.2%) |
| 35 to 39 Years | 2 (2.0%) | 2 (2.2%) |
| 40 to 44 Years | 11 (11.0%) | 2 (2.2%) |
| 45 to 49 Years | 4 (4.0%) | 2 (2.2%) |
| 50 to 54 Years | 7 (7.0%) | 24 (26.7%) |
| 55 to 59 Years | 8 (8.0%) | 12 (13.3%) |
| 60 to 64 Years | 9 (9.0%) | 6 (6.7%) |
| 65 to 69 Years | 3 (3.0%) | 2 (2.2%) |
| 70 to 74 Years | 3 (3.0%) | 3 (3.3%) |
| 75 to 79 Years | 4 (4.0%) | 3 (3.3%) |
| 80 to 84 Years | 20 (20.0%) | 2 (2.2%) |
| 85 Years and over | 0 (0.0%) | 5 (5.6%) |
| Total | 100 (100.0%) | 90 (100.0%) |
Families and Households in Glen Hope borough
Median Family Size in Glen Hope borough
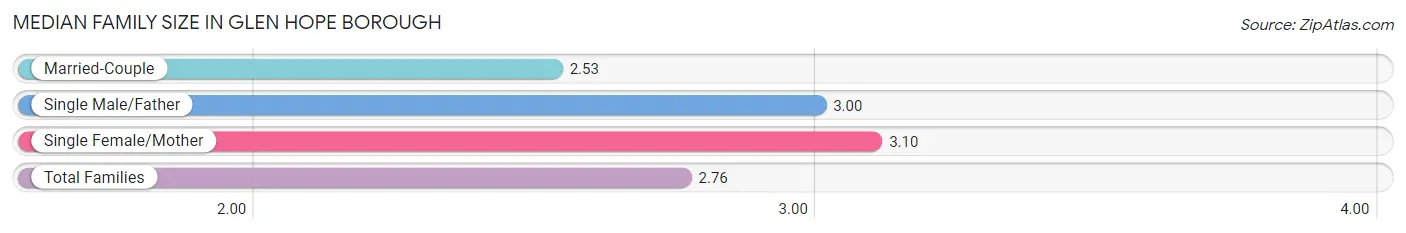
The median family size in Glen Hope borough is 2.76 persons per family, with single female/mother families (20 | 36.4%) accounting for the largest median family size of 3.1 persons per family. On the other hand, married-couple families (32 | 58.2%) represent the smallest median family size with 2.53 persons per family.
| Family Type | # Families | Family Size |
| Married-Couple | 32 (58.2%) | 2.53 |
| Single Male/Father | 3 (5.4%) | 3.00 |
| Single Female/Mother | 20 (36.4%) | 3.10 |
| Total Families | 55 (100.0%) | 2.76 |
Median Household Size in Glen Hope borough
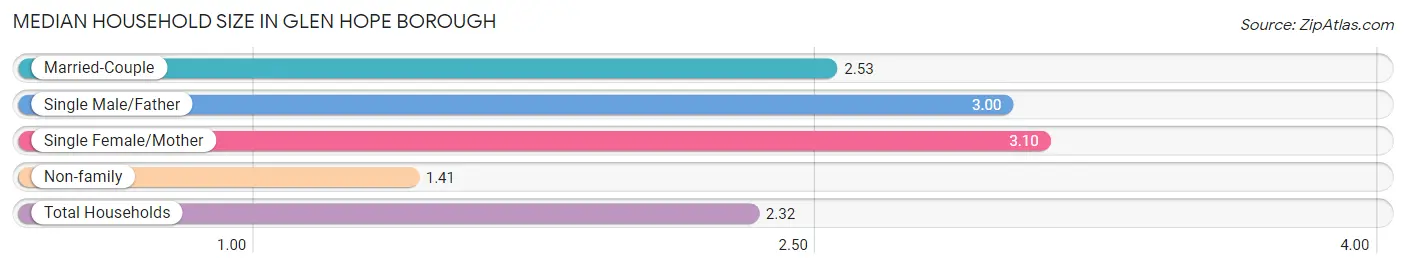
The median household size in Glen Hope borough is 2.32 persons per household, with single female/mother households (20 | 24.4%) accounting for the largest median household size of 3.1 persons per household. non-family households (27 | 32.9%) represent the smallest median household size with 1.41 persons per household.
| Household Type | # Households | Household Size |
| Married-Couple | 32 (39.0%) | 2.53 |
| Single Male/Father | 3 (3.7%) | 3.00 |
| Single Female/Mother | 20 (24.4%) | 3.10 |
| Non-family | 27 (32.9%) | 1.41 |
| Total Households | 82 (100.0%) | 2.32 |
Household Size by Marriage Status in Glen Hope borough
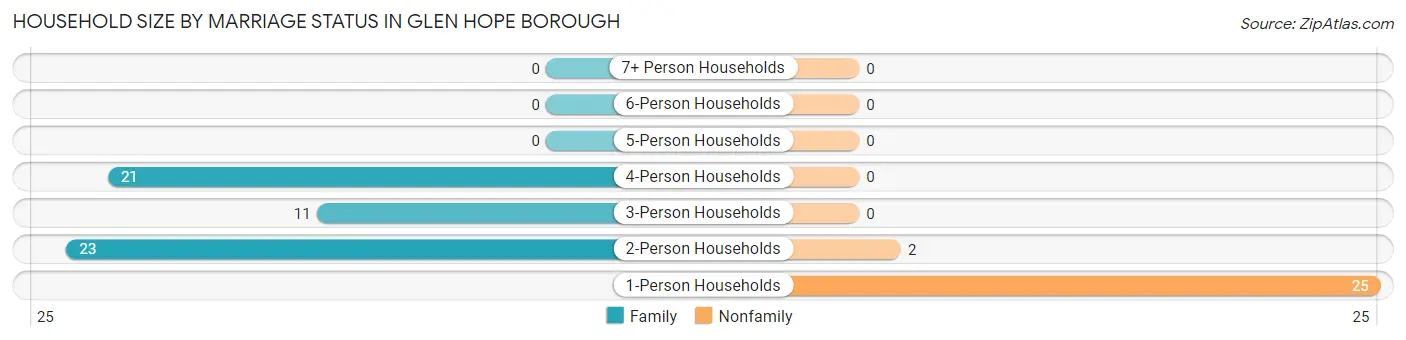
Out of a total of 82 households in Glen Hope borough, 55 (67.1%) are family households, while 27 (32.9%) are nonfamily households. The most numerous type of family households are 2-person households, comprising 23, and the most common type of nonfamily households are 1-person households, comprising 25.
| Household Size | Family Households | Nonfamily Households |
| 1-Person Households | - | 25 (30.5%) |
| 2-Person Households | 23 (28.1%) | 2 (2.4%) |
| 3-Person Households | 11 (13.4%) | 0 (0.0%) |
| 4-Person Households | 21 (25.6%) | 0 (0.0%) |
| 5-Person Households | 0 (0.0%) | 0 (0.0%) |
| 6-Person Households | 0 (0.0%) | 0 (0.0%) |
| 7+ Person Households | 0 (0.0%) | 0 (0.0%) |
| Total | 55 (67.1%) | 27 (32.9%) |
Female Fertility in Glen Hope borough
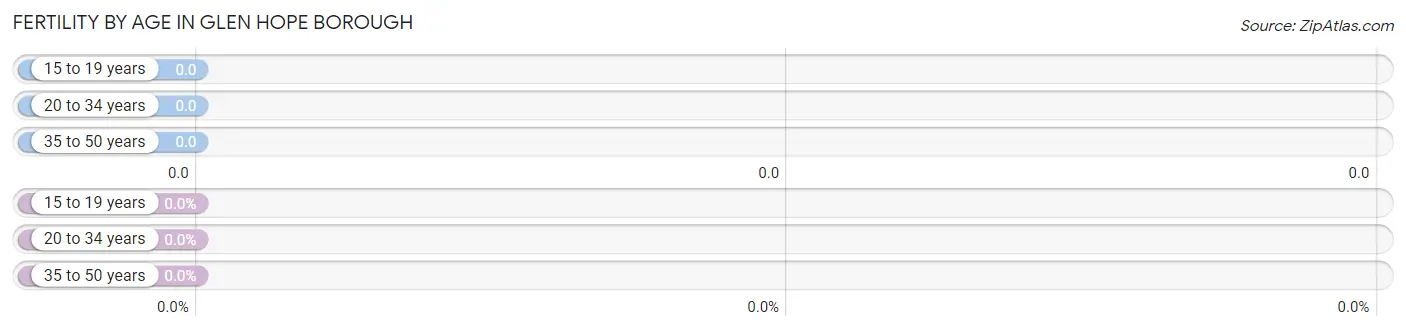
Fertility by Age in Glen Hope borough
| Age Bracket | Women with Births | Births / 1,000 Women |
| 15 to 19 years | 0 (0.0%) | 0.0 |
| 20 to 34 years | 0 (0.0%) | 0.0 |
| 35 to 50 years | 0 (0.0%) | 0.0 |
| Total | 0 (0.0%) | 0.0 |
Fertility by Age by Marriage Status in Glen Hope borough
| Age Bracket | Married | Unmarried |
| 15 to 19 years | 0 (0.0%) | 0 (0.0%) |
| 20 to 34 years | 0 (0.0%) | 0 (0.0%) |
| 35 to 50 years | 0 (0.0%) | 0 (0.0%) |
| Total | 0 (0.0%) | 0 (0.0%) |
Fertility by Education in Glen Hope borough
| Educational Attainment | Women with Births | Births / 1,000 Women |
| Less than High School | 0 (0.0%) | 0.0 |
| High School Diploma | 0 (0.0%) | 0.0 |
| College or Associate's Degree | 0 (0.0%) | 0.0 |
| Bachelor's Degree | 0 (0.0%) | 0.0 |
| Graduate Degree | 0 (0.0%) | 0.0 |
| Total | 0 (0.0%) | 0.0 |
Fertility by Education by Marriage Status in Glen Hope borough
| Educational Attainment | Married | Unmarried |
| Less than High School | 0 (0.0%) | 0 (0.0%) |
| High School Diploma | 0 (0.0%) | 0 (0.0%) |
| College or Associate's Degree | 0 (0.0%) | 0 (0.0%) |
| Bachelor's Degree | 0 (0.0%) | 0 (0.0%) |
| Graduate Degree | 0 (0.0%) | 0 (0.0%) |
| Total | 0 (0.0%) | 0 (0.0%) |
Employment Characteristics in Glen Hope borough
Employment by Class of Employer in Glen Hope borough
Among the 75 employed individuals in Glen Hope borough, private company employees (52 | 69.3%), local government employees (13 | 17.3%), and state government employees (6 | 8.0%) make up the most common classes of employment.
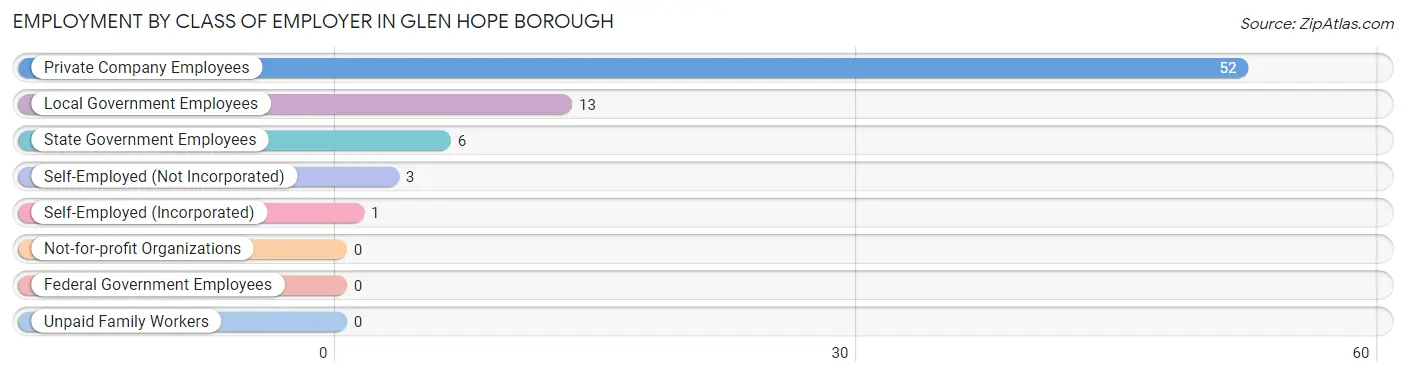
| Employer Class | # Employees | % Employees |
| Private Company Employees | 52 | 69.3% |
| Self-Employed (Incorporated) | 1 | 1.3% |
| Self-Employed (Not Incorporated) | 3 | 4.0% |
| Not-for-profit Organizations | 0 | 0.0% |
| Local Government Employees | 13 | 17.3% |
| State Government Employees | 6 | 8.0% |
| Federal Government Employees | 0 | 0.0% |
| Unpaid Family Workers | 0 | 0.0% |
| Total | 75 | 100.0% |
Employment Status by Age in Glen Hope borough
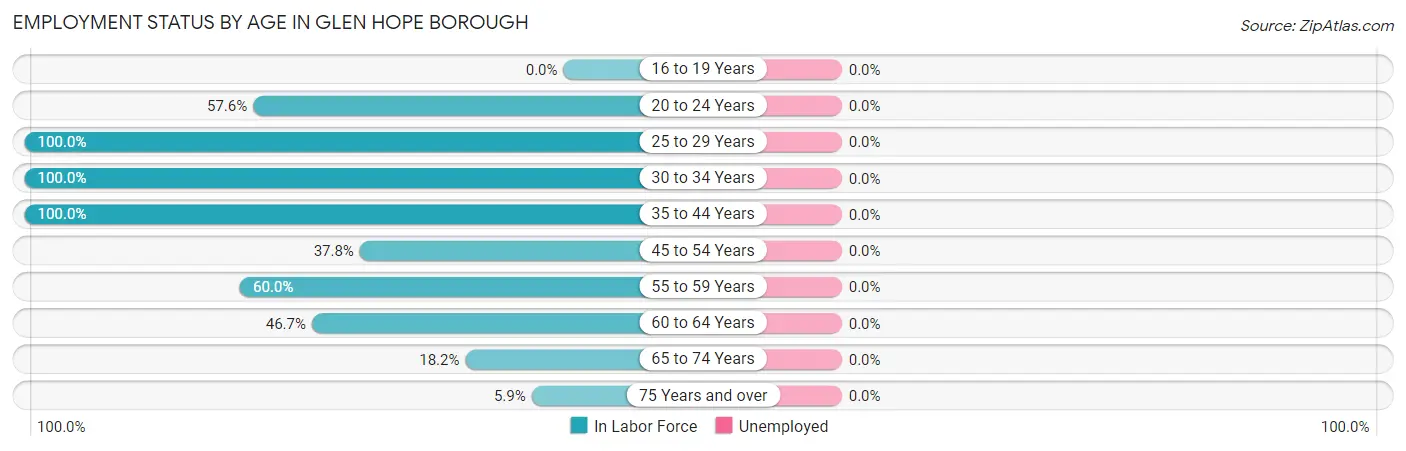
| Age Bracket | In Labor Force | Unemployed |
| 16 to 19 Years | 0 (0.0%) | 0 (0.0%) |
| 20 to 24 Years | 19 (57.6%) | 0 (0.0%) |
| 25 to 29 Years | 1 (100.0%) | 0 (0.0%) |
| 30 to 34 Years | 3 (100.0%) | 0 (0.0%) |
| 35 to 44 Years | 17 (100.0%) | 0 (0.0%) |
| 45 to 54 Years | 14 (37.8%) | 0 (0.0%) |
| 55 to 59 Years | 12 (60.0%) | 0 (0.0%) |
| 60 to 64 Years | 7 (46.7%) | 0 (0.0%) |
| 65 to 74 Years | 2 (18.2%) | 0 (0.0%) |
| 75 Years and over | 2 (5.9%) | 0 (0.0%) |
| Total | 77 (41.8%) | 0 (0.0%) |
Employment Status by Educational Attainment in Glen Hope borough
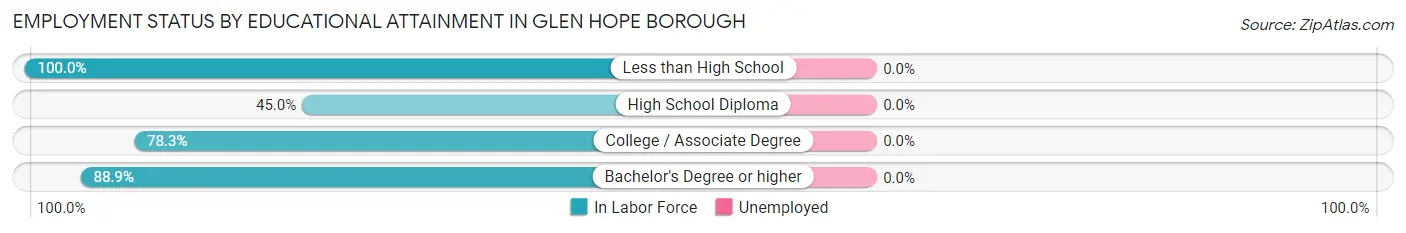
| Educational Attainment | In Labor Force | Unemployed |
| Less than High School | 1 (100.0%) | 0 (0.0%) |
| High School Diploma | 27 (45.0%) | 0 (0.0%) |
| College / Associate Degree | 18 (78.3%) | 0 (0.0%) |
| Bachelor's Degree or higher | 8 (88.9%) | 0 (0.0%) |
| Total | 54 (58.1%) | 0 (0.0%) |
Employment Occupations by Sex in Glen Hope borough
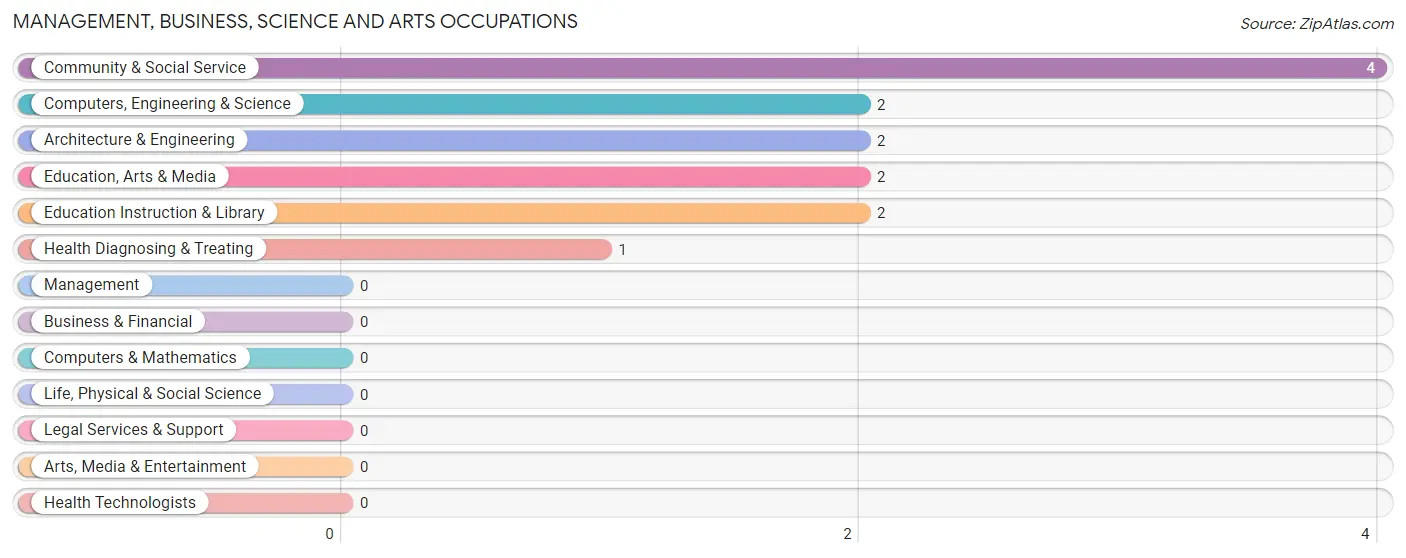
Management, Business, Science and Arts Occupations
The most common Management, Business, Science and Arts occupations in Glen Hope borough are Community & Social Service (4 | 5.2%), Computers, Engineering & Science (2 | 2.6%), Architecture & Engineering (2 | 2.6%), Education, Arts & Media (2 | 2.6%), and Education Instruction & Library (2 | 2.6%).
Management, Business, Science and Arts Occupations by Sex
Within the Management, Business, Science and Arts occupations in Glen Hope borough, the most male-oriented occupations are Computers, Engineering & Science (100.0%), and Architecture & Engineering (100.0%), while the most female-oriented occupations are Community & Social Service (100.0%), Education, Arts & Media (100.0%), and Education Instruction & Library (100.0%).
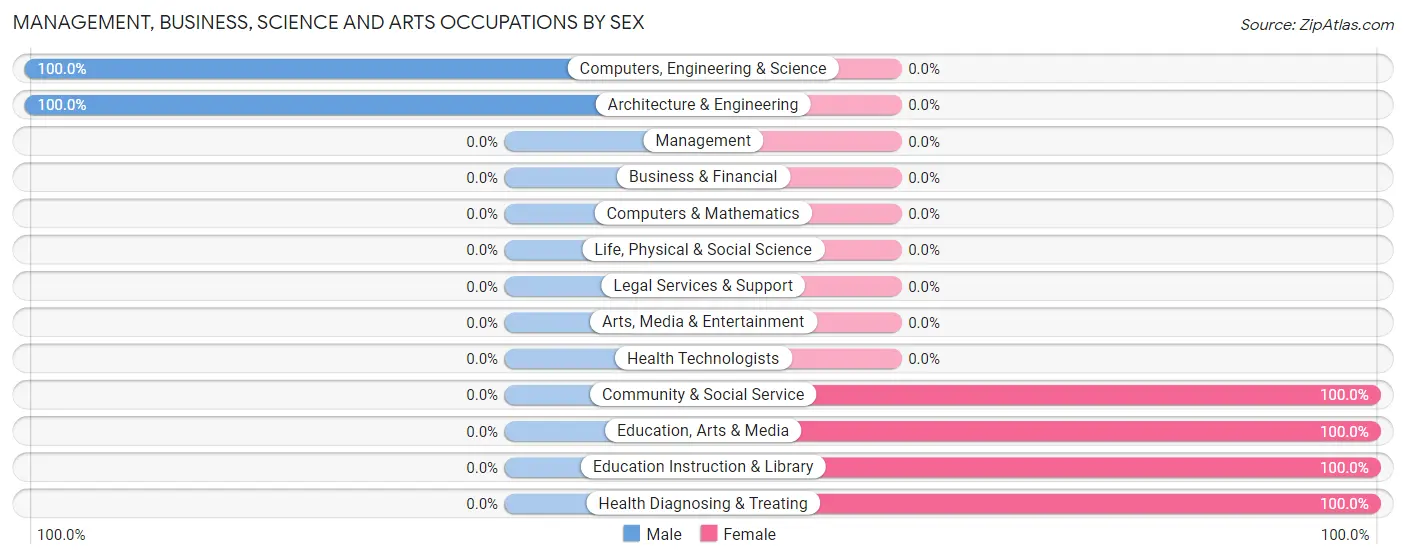
| Occupation | Male | Female |
| Management | 0 (0.0%) | 0 (0.0%) |
| Business & Financial | 0 (0.0%) | 0 (0.0%) |
| Computers, Engineering & Science | 2 (100.0%) | 0 (0.0%) |
| Computers & Mathematics | 0 (0.0%) | 0 (0.0%) |
| Architecture & Engineering | 2 (100.0%) | 0 (0.0%) |
| Life, Physical & Social Science | 0 (0.0%) | 0 (0.0%) |
| Community & Social Service | 0 (0.0%) | 4 (100.0%) |
| Education, Arts & Media | 0 (0.0%) | 2 (100.0%) |
| Legal Services & Support | 0 (0.0%) | 0 (0.0%) |
| Education Instruction & Library | 0 (0.0%) | 2 (100.0%) |
| Arts, Media & Entertainment | 0 (0.0%) | 0 (0.0%) |
| Health Diagnosing & Treating | 0 (0.0%) | 1 (100.0%) |
| Health Technologists | 0 (0.0%) | 0 (0.0%) |
| Total (Category) | 2 (28.6%) | 5 (71.4%) |
| Total (Overall) | 49 (63.6%) | 28 (36.4%) |
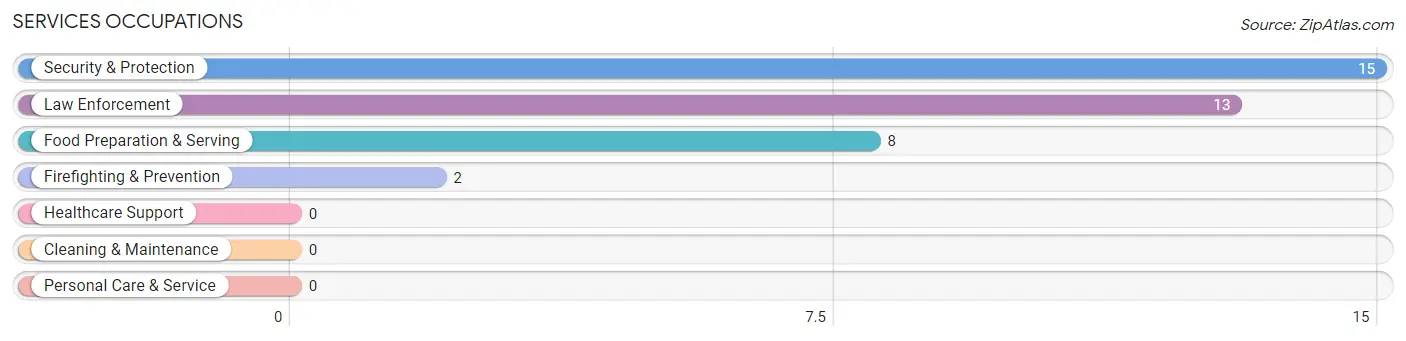
Services Occupations
The most common Services occupations in Glen Hope borough are Security & Protection (15 | 19.5%), Law Enforcement (13 | 16.9%), Food Preparation & Serving (8 | 10.4%), and Firefighting & Prevention (2 | 2.6%).
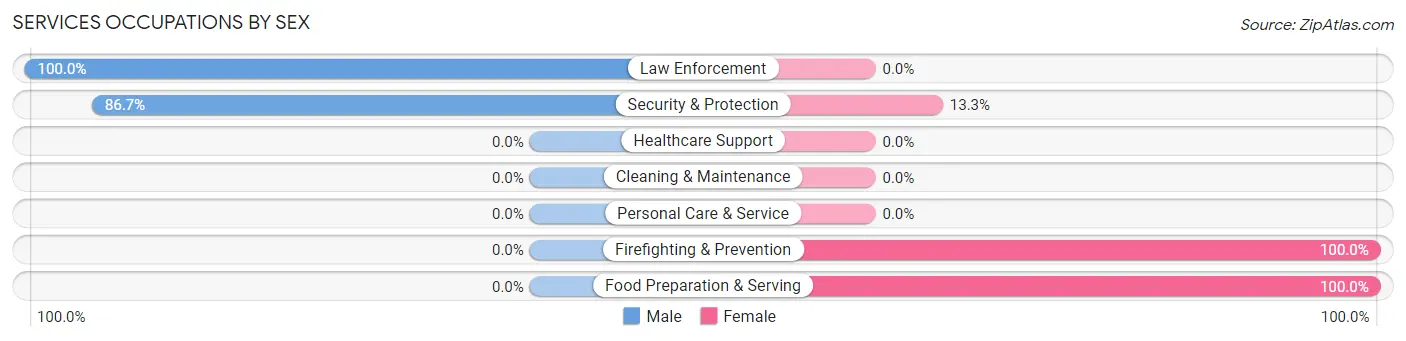
Services Occupations by Sex
Within the Services occupations in Glen Hope borough, the most male-oriented occupations are Law Enforcement (100.0%), and Security & Protection (86.7%), while the most female-oriented occupations are Firefighting & Prevention (100.0%), Food Preparation & Serving (100.0%), and Security & Protection (13.3%).
| Occupation | Male | Female |
| Healthcare Support | 0 (0.0%) | 0 (0.0%) |
| Security & Protection | 13 (86.7%) | 2 (13.3%) |
| Firefighting & Prevention | 0 (0.0%) | 2 (100.0%) |
| Law Enforcement | 13 (100.0%) | 0 (0.0%) |
| Food Preparation & Serving | 0 (0.0%) | 8 (100.0%) |
| Cleaning & Maintenance | 0 (0.0%) | 0 (0.0%) |
| Personal Care & Service | 0 (0.0%) | 0 (0.0%) |
| Total (Category) | 13 (56.5%) | 10 (43.5%) |
| Total (Overall) | 49 (63.6%) | 28 (36.4%) |
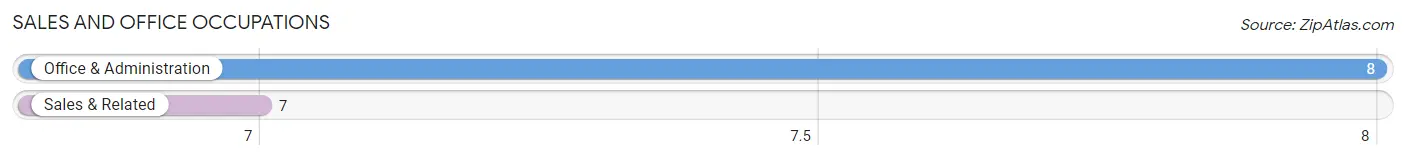
Sales and Office Occupations
The most common Sales and Office occupations in Glen Hope borough are Office & Administration (8 | 10.4%), and Sales & Related (7 | 9.1%).
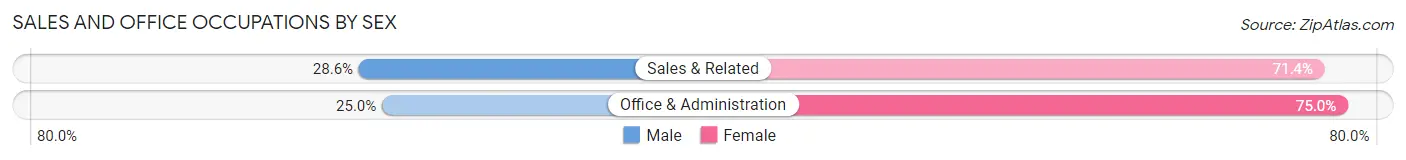
Sales and Office Occupations by Sex
| Occupation | Male | Female |
| Sales & Related | 2 (28.6%) | 5 (71.4%) |
| Office & Administration | 2 (25.0%) | 6 (75.0%) |
| Total (Category) | 4 (26.7%) | 11 (73.3%) |
| Total (Overall) | 49 (63.6%) | 28 (36.4%) |
Natural Resources, Construction and Maintenance Occupations
The most common Natural Resources, Construction and Maintenance occupations in Glen Hope borough are , and Construction & Extraction (17 | 22.1%).
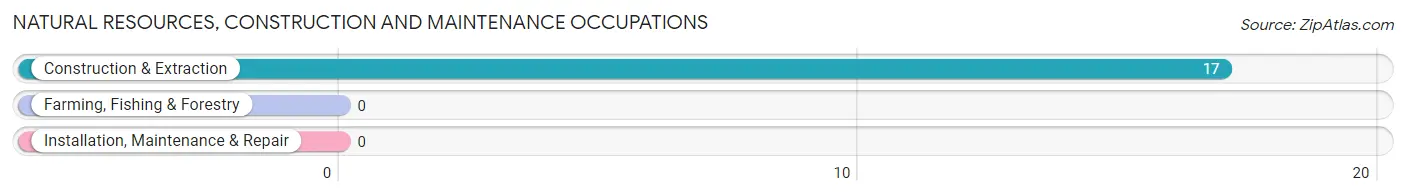
Natural Resources, Construction and Maintenance Occupations by Sex
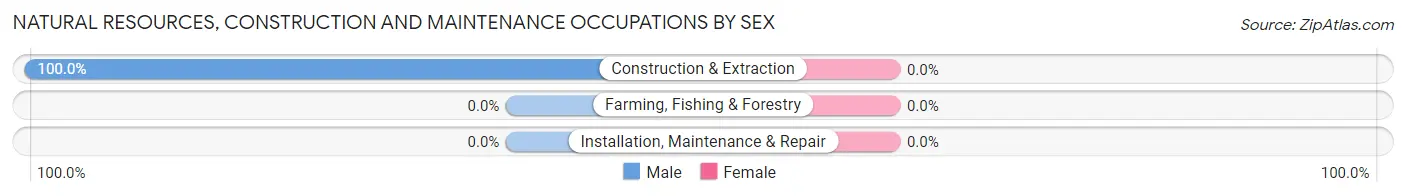
| Occupation | Male | Female |
| Farming, Fishing & Forestry | 0 (0.0%) | 0 (0.0%) |
| Construction & Extraction | 17 (100.0%) | 0 (0.0%) |
| Installation, Maintenance & Repair | 0 (0.0%) | 0 (0.0%) |
| Total (Category) | 17 (100.0%) | 0 (0.0%) |
| Total (Overall) | 49 (63.6%) | 28 (36.4%) |
Production, Transportation and Moving Occupations
The most common Production, Transportation and Moving occupations in Glen Hope borough are Transportation (10 | 13.0%), Production (3 | 3.9%), and Material Moving (2 | 2.6%).
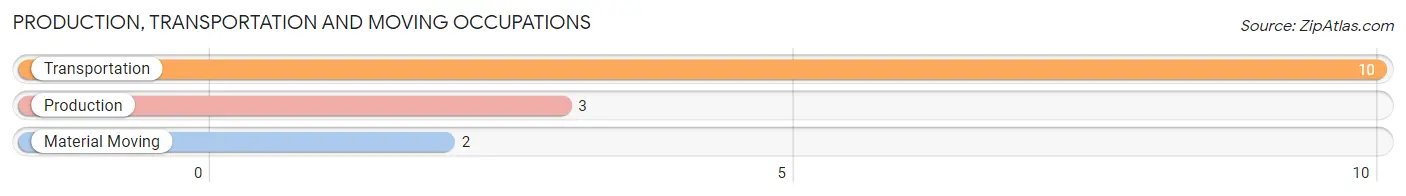
Production, Transportation and Moving Occupations by Sex
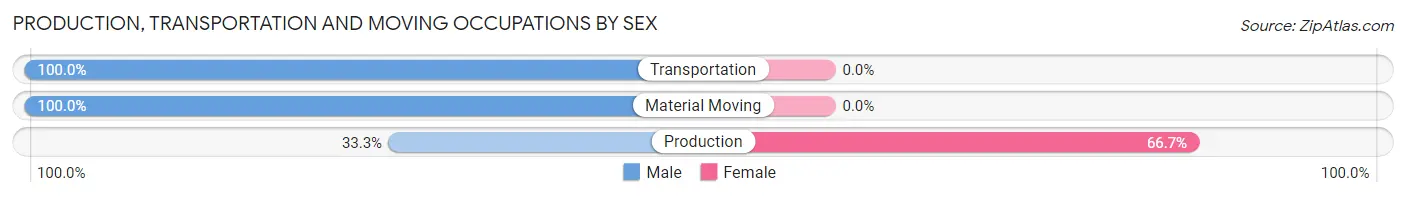
| Occupation | Male | Female |
| Production | 1 (33.3%) | 2 (66.7%) |
| Transportation | 10 (100.0%) | 0 (0.0%) |
| Material Moving | 2 (100.0%) | 0 (0.0%) |
| Total (Category) | 13 (86.7%) | 2 (13.3%) |
| Total (Overall) | 49 (63.6%) | 28 (36.4%) |
Employment Industries by Sex in Glen Hope borough
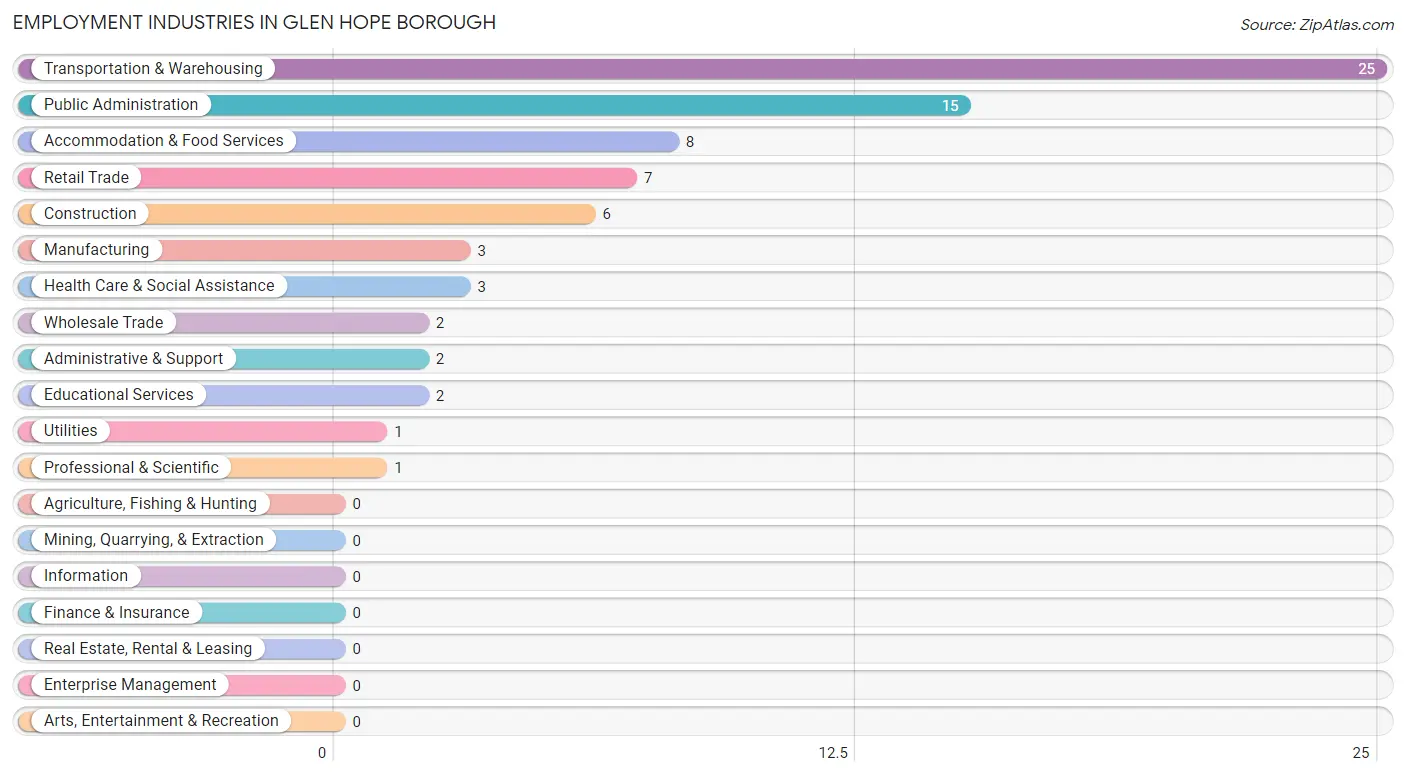
Employment Industries in Glen Hope borough
The major employment industries in Glen Hope borough include Transportation & Warehousing (25 | 32.5%), Public Administration (15 | 19.5%), Accommodation & Food Services (8 | 10.4%), Retail Trade (7 | 9.1%), and Construction (6 | 7.8%).
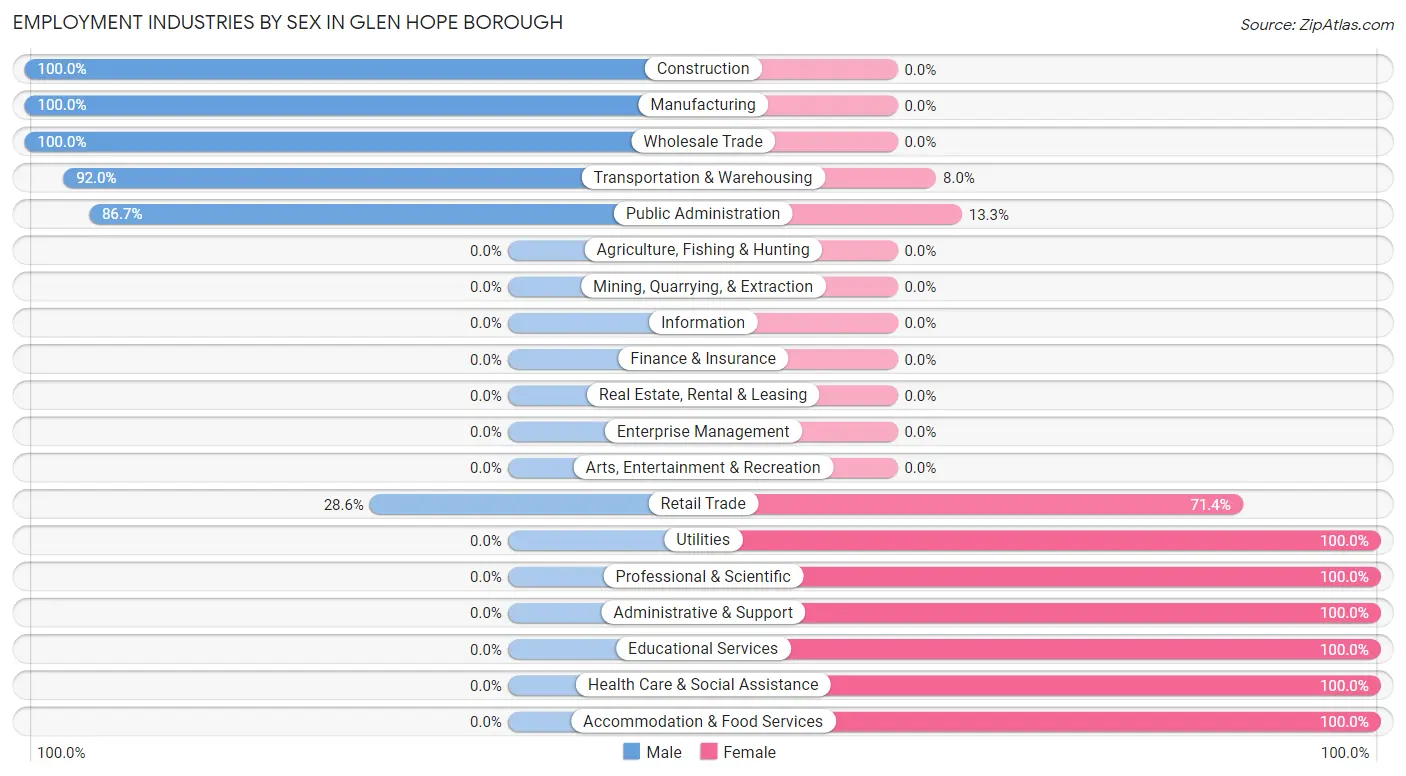
Employment Industries by Sex in Glen Hope borough
The Glen Hope borough industries that see more men than women are Construction (100.0%), Manufacturing (100.0%), and Wholesale Trade (100.0%), whereas the industries that tend to have a higher number of women are Utilities (100.0%), Professional & Scientific (100.0%), and Administrative & Support (100.0%).
| Industry | Male | Female |
| Agriculture, Fishing & Hunting | 0 (0.0%) | 0 (0.0%) |
| Mining, Quarrying, & Extraction | 0 (0.0%) | 0 (0.0%) |
| Construction | 6 (100.0%) | 0 (0.0%) |
| Manufacturing | 3 (100.0%) | 0 (0.0%) |
| Wholesale Trade | 2 (100.0%) | 0 (0.0%) |
| Retail Trade | 2 (28.6%) | 5 (71.4%) |
| Transportation & Warehousing | 23 (92.0%) | 2 (8.0%) |
| Utilities | 0 (0.0%) | 1 (100.0%) |
| Information | 0 (0.0%) | 0 (0.0%) |
| Finance & Insurance | 0 (0.0%) | 0 (0.0%) |
| Real Estate, Rental & Leasing | 0 (0.0%) | 0 (0.0%) |
| Professional & Scientific | 0 (0.0%) | 1 (100.0%) |
| Enterprise Management | 0 (0.0%) | 0 (0.0%) |
| Administrative & Support | 0 (0.0%) | 2 (100.0%) |
| Educational Services | 0 (0.0%) | 2 (100.0%) |
| Health Care & Social Assistance | 0 (0.0%) | 3 (100.0%) |
| Arts, Entertainment & Recreation | 0 (0.0%) | 0 (0.0%) |
| Accommodation & Food Services | 0 (0.0%) | 8 (100.0%) |
| Public Administration | 13 (86.7%) | 2 (13.3%) |
| Total | 49 (63.6%) | 28 (36.4%) |
Education in Glen Hope borough
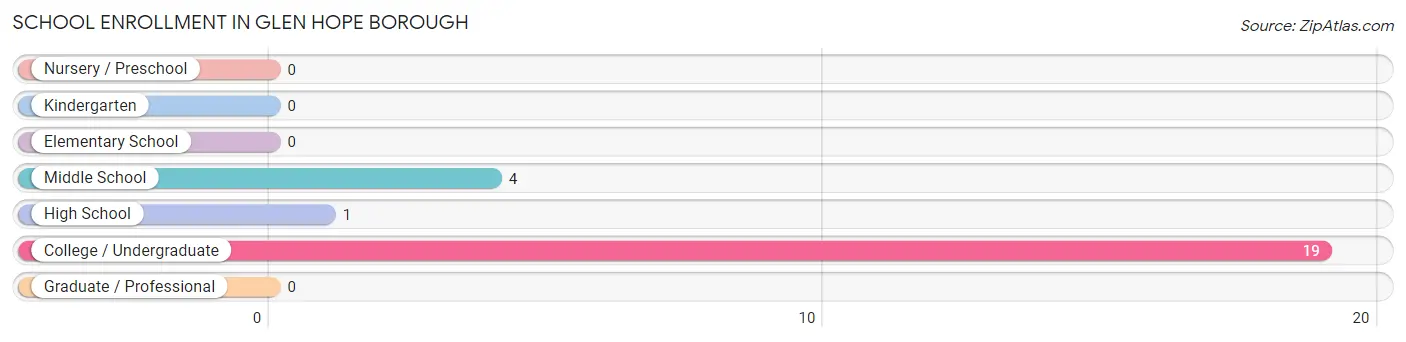
School Enrollment in Glen Hope borough
The most common levels of schooling among the 24 students in Glen Hope borough are college / undergraduate (19 | 79.2%), middle school (4 | 16.7%), and high school (1 | 4.2%).
| School Level | # Students | % Students |
| Nursery / Preschool | 0 | 0.0% |
| Kindergarten | 0 | 0.0% |
| Elementary School | 0 | 0.0% |
| Middle School | 4 | 16.7% |
| High School | 1 | 4.2% |
| College / Undergraduate | 19 | 79.2% |
| Graduate / Professional | 0 | 0.0% |
| Total | 24 | 100.0% |
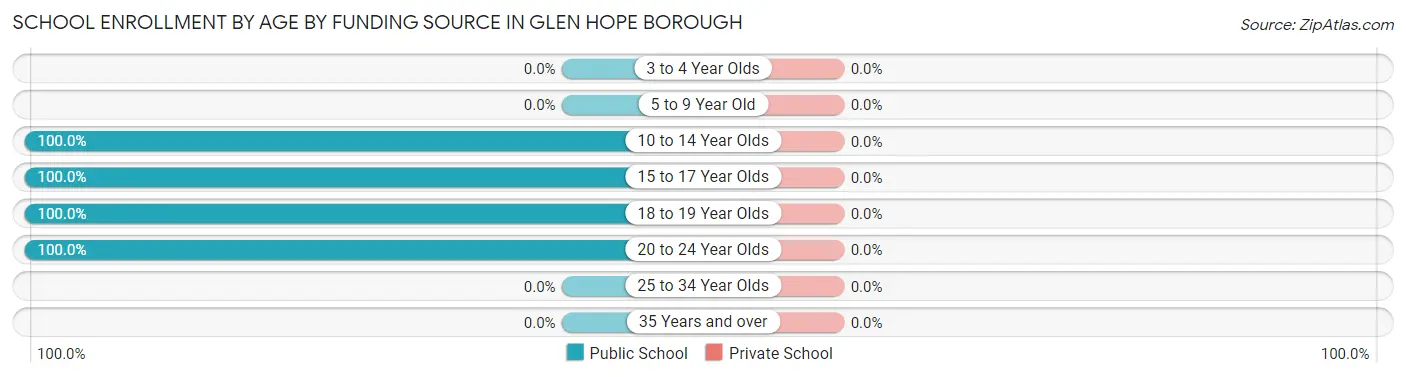
School Enrollment by Age by Funding Source in Glen Hope borough
| Age Bracket | Public School | Private School |
| 3 to 4 Year Olds | 0 (0.0%) | 0 (0.0%) |
| 5 to 9 Year Old | 0 (0.0%) | 0 (0.0%) |
| 10 to 14 Year Olds | 4 (100.0%) | 0 (0.0%) |
| 15 to 17 Year Olds | 1 (100.0%) | 0 (0.0%) |
| 18 to 19 Year Olds | 2 (100.0%) | 0 (0.0%) |
| 20 to 24 Year Olds | 17 (100.0%) | 0 (0.0%) |
| 25 to 34 Year Olds | 0 (0.0%) | 0 (0.0%) |
| 35 Years and over | 0 (0.0%) | 0 (0.0%) |
| Total | 24 (100.0%) | 0 (0.0%) |
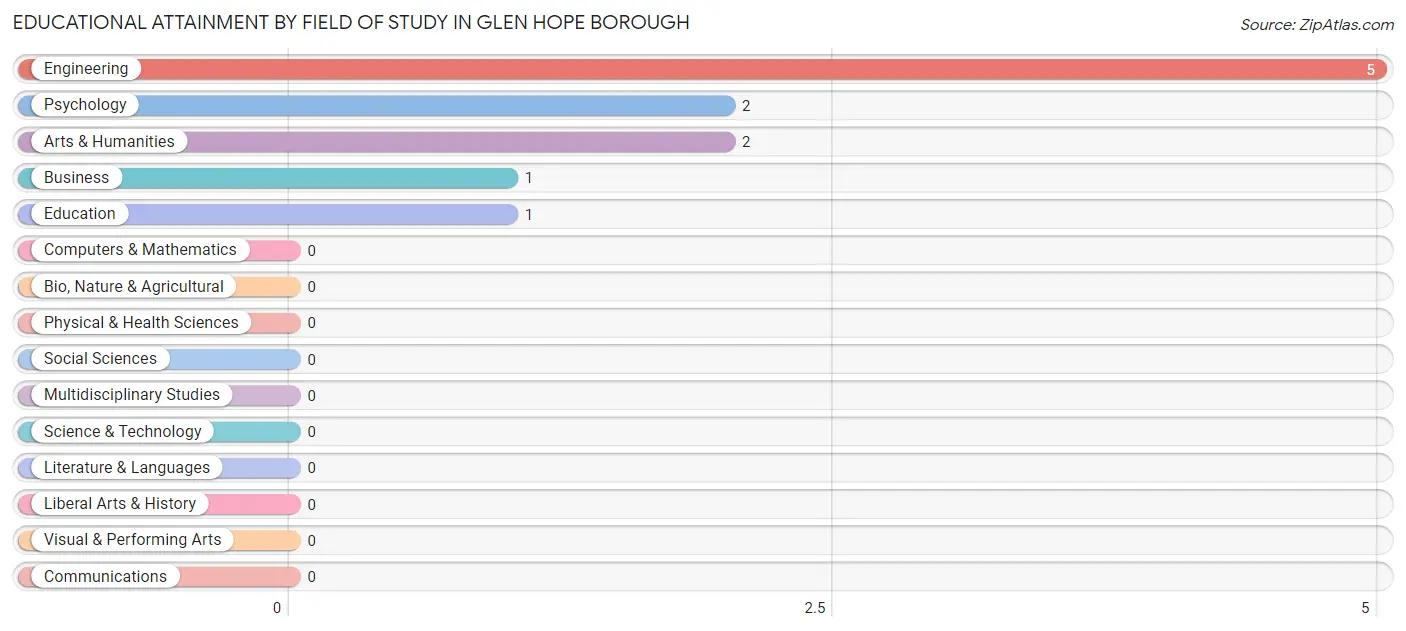
Educational Attainment by Field of Study in Glen Hope borough
Engineering (5 | 45.5%), psychology (2 | 18.2%), arts & humanities (2 | 18.2%), business (1 | 9.1%), and education (1 | 9.1%) are the most common fields of study among 11 individuals in Glen Hope borough who have obtained a bachelor's degree or higher.
| Field of Study | # Graduates | % Graduates |
| Computers & Mathematics | 0 | 0.0% |
| Bio, Nature & Agricultural | 0 | 0.0% |
| Physical & Health Sciences | 0 | 0.0% |
| Psychology | 2 | 18.2% |
| Social Sciences | 0 | 0.0% |
| Engineering | 5 | 45.5% |
| Multidisciplinary Studies | 0 | 0.0% |
| Science & Technology | 0 | 0.0% |
| Business | 1 | 9.1% |
| Education | 1 | 9.1% |
| Literature & Languages | 0 | 0.0% |
| Liberal Arts & History | 0 | 0.0% |
| Visual & Performing Arts | 0 | 0.0% |
| Communications | 0 | 0.0% |
| Arts & Humanities | 2 | 18.2% |
| Total | 11 | 100.0% |
Transportation & Commute in Glen Hope borough
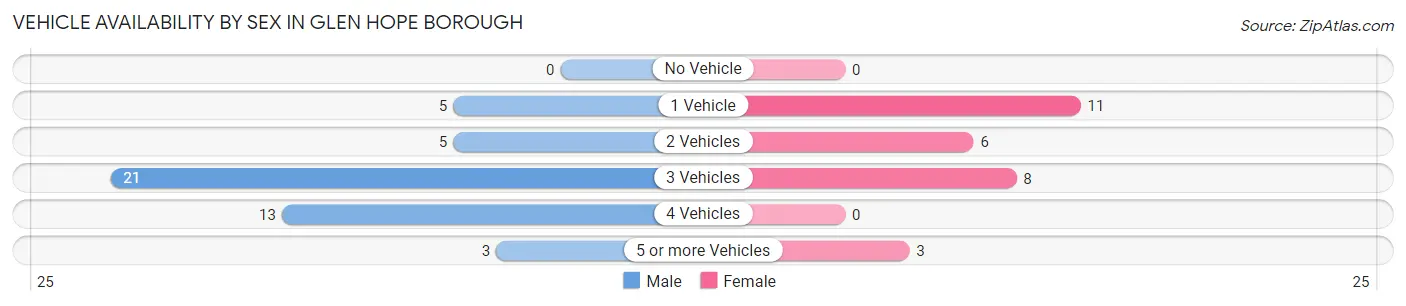
Vehicle Availability by Sex in Glen Hope borough
The most prevalent vehicle ownership categories in Glen Hope borough are males with 3 vehicles (21, accounting for 44.7%) and females with 3 vehicles (8, making up 75.0%).
| Vehicles Available | Male | Female |
| No Vehicle | 0 (0.0%) | 0 (0.0%) |
| 1 Vehicle | 5 (10.6%) | 11 (39.3%) |
| 2 Vehicles | 5 (10.6%) | 6 (21.4%) |
| 3 Vehicles | 21 (44.7%) | 8 (28.6%) |
| 4 Vehicles | 13 (27.7%) | 0 (0.0%) |
| 5 or more Vehicles | 3 (6.4%) | 3 (10.7%) |
| Total | 47 (100.0%) | 28 (100.0%) |
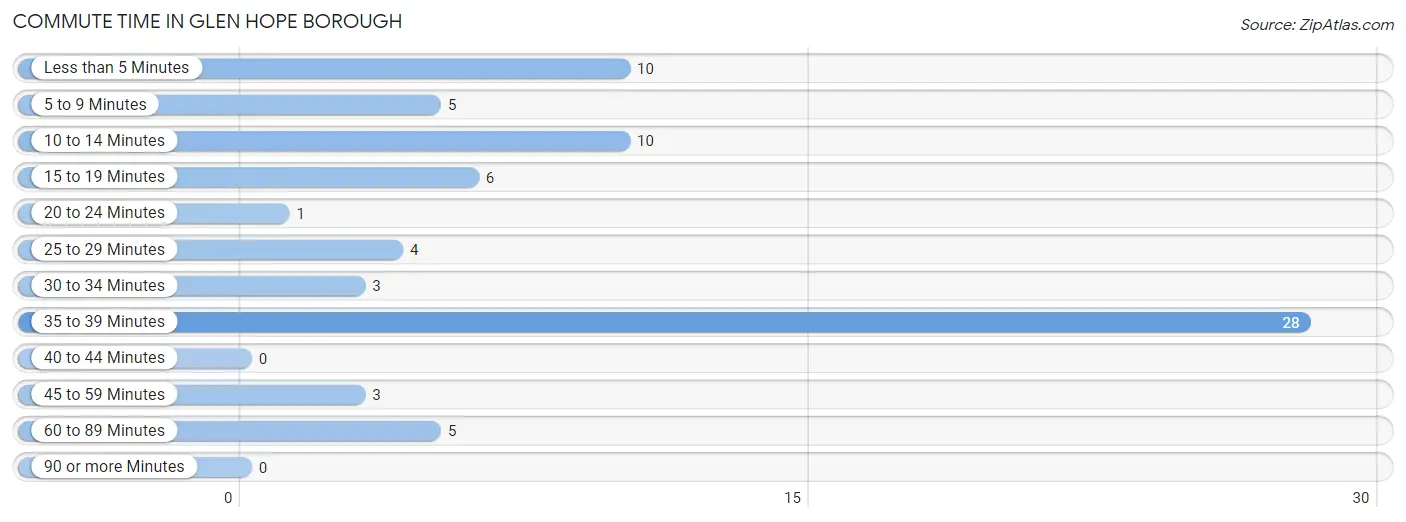
Commute Time in Glen Hope borough
The most frequently occuring commute durations in Glen Hope borough are 35 to 39 minutes (28 commuters, 37.3%), less than 5 minutes (10 commuters, 13.3%), and 10 to 14 minutes (10 commuters, 13.3%).
| Commute Time | # Commuters | % Commuters |
| Less than 5 Minutes | 10 | 13.3% |
| 5 to 9 Minutes | 5 | 6.7% |
| 10 to 14 Minutes | 10 | 13.3% |
| 15 to 19 Minutes | 6 | 8.0% |
| 20 to 24 Minutes | 1 | 1.3% |
| 25 to 29 Minutes | 4 | 5.3% |
| 30 to 34 Minutes | 3 | 4.0% |
| 35 to 39 Minutes | 28 | 37.3% |
| 40 to 44 Minutes | 0 | 0.0% |
| 45 to 59 Minutes | 3 | 4.0% |
| 60 to 89 Minutes | 5 | 6.7% |
| 90 or more Minutes | 0 | 0.0% |
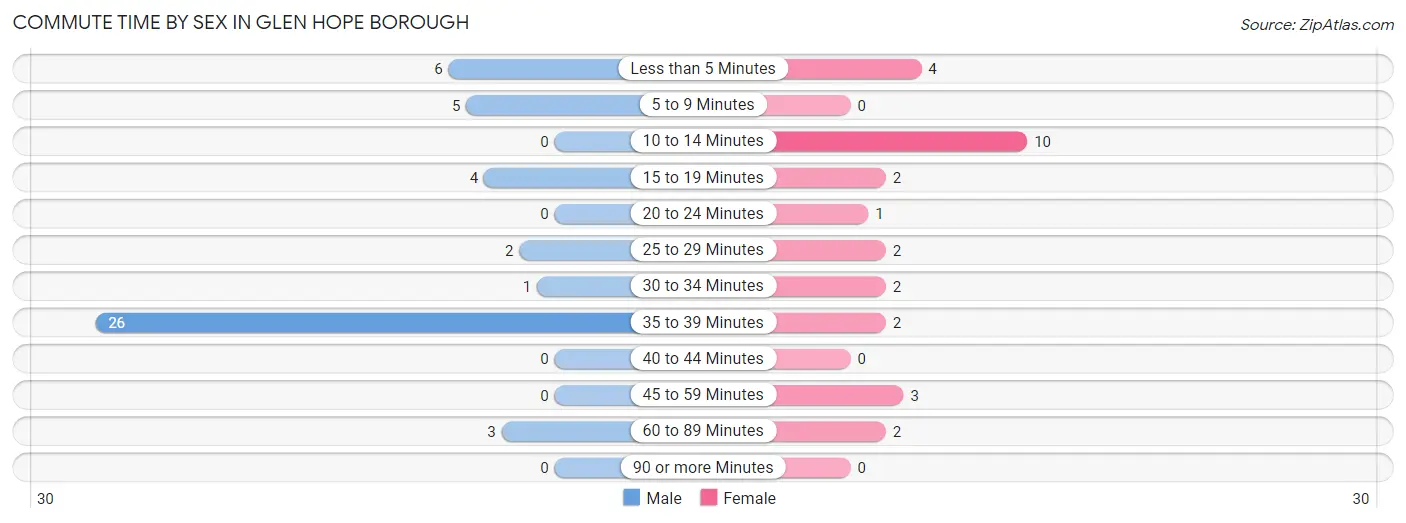
Commute Time by Sex in Glen Hope borough
The most common commute times in Glen Hope borough are 35 to 39 minutes (26 commuters, 55.3%) for males and 10 to 14 minutes (10 commuters, 35.7%) for females.
| Commute Time | Male | Female |
| Less than 5 Minutes | 6 (12.8%) | 4 (14.3%) |
| 5 to 9 Minutes | 5 (10.6%) | 0 (0.0%) |
| 10 to 14 Minutes | 0 (0.0%) | 10 (35.7%) |
| 15 to 19 Minutes | 4 (8.5%) | 2 (7.1%) |
| 20 to 24 Minutes | 0 (0.0%) | 1 (3.6%) |
| 25 to 29 Minutes | 2 (4.3%) | 2 (7.1%) |
| 30 to 34 Minutes | 1 (2.1%) | 2 (7.1%) |
| 35 to 39 Minutes | 26 (55.3%) | 2 (7.1%) |
| 40 to 44 Minutes | 0 (0.0%) | 0 (0.0%) |
| 45 to 59 Minutes | 0 (0.0%) | 3 (10.7%) |
| 60 to 89 Minutes | 3 (6.4%) | 2 (7.1%) |
| 90 or more Minutes | 0 (0.0%) | 0 (0.0%) |
Time of Departure to Work by Sex in Glen Hope borough
The most frequent times of departure to work in Glen Hope borough are 12:00 AM to 4:59 AM (14, 29.8%) for males and 8:30 AM to 8:59 AM (8, 28.6%) for females.
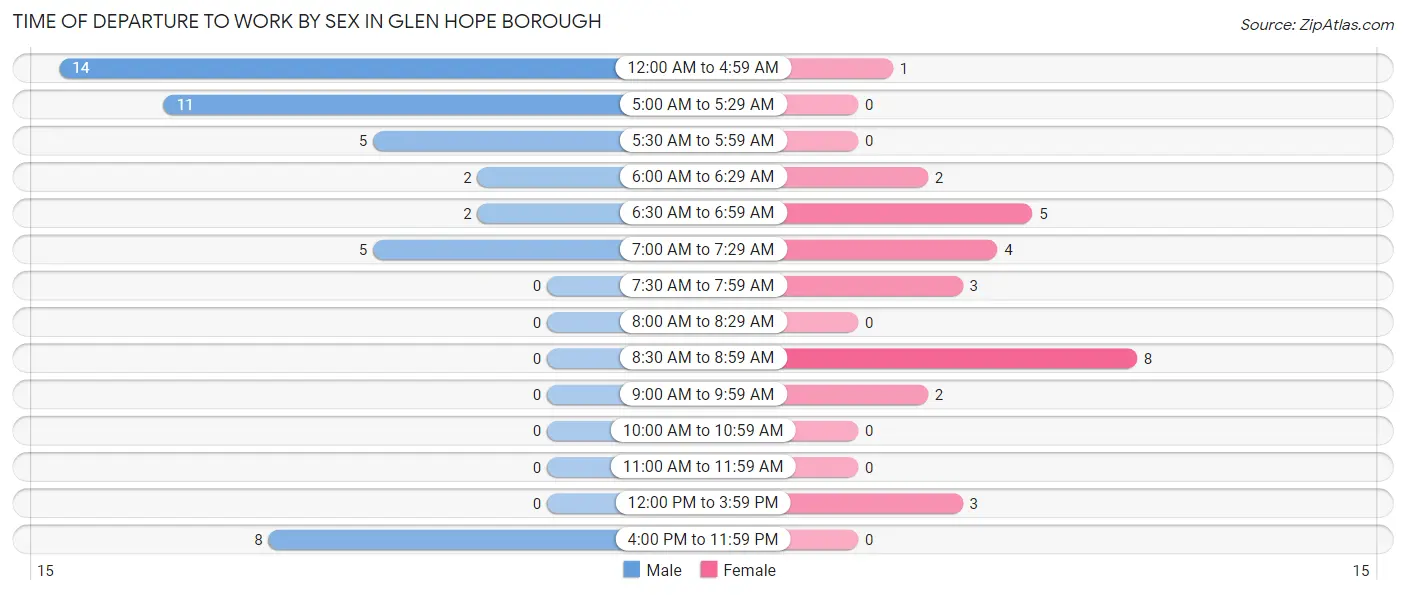
| Time of Departure | Male | Female |
| 12:00 AM to 4:59 AM | 14 (29.8%) | 1 (3.6%) |
| 5:00 AM to 5:29 AM | 11 (23.4%) | 0 (0.0%) |
| 5:30 AM to 5:59 AM | 5 (10.6%) | 0 (0.0%) |
| 6:00 AM to 6:29 AM | 2 (4.3%) | 2 (7.1%) |
| 6:30 AM to 6:59 AM | 2 (4.3%) | 5 (17.9%) |
| 7:00 AM to 7:29 AM | 5 (10.6%) | 4 (14.3%) |
| 7:30 AM to 7:59 AM | 0 (0.0%) | 3 (10.7%) |
| 8:00 AM to 8:29 AM | 0 (0.0%) | 0 (0.0%) |
| 8:30 AM to 8:59 AM | 0 (0.0%) | 8 (28.6%) |
| 9:00 AM to 9:59 AM | 0 (0.0%) | 2 (7.1%) |
| 10:00 AM to 10:59 AM | 0 (0.0%) | 0 (0.0%) |
| 11:00 AM to 11:59 AM | 0 (0.0%) | 0 (0.0%) |
| 12:00 PM to 3:59 PM | 0 (0.0%) | 3 (10.7%) |
| 4:00 PM to 11:59 PM | 8 (17.0%) | 0 (0.0%) |
| Total | 47 (100.0%) | 28 (100.0%) |
Housing Occupancy in Glen Hope borough
Occupancy by Ownership in Glen Hope borough
Of the total 82 dwellings in Glen Hope borough, owner-occupied units account for 80 (97.6%), while renter-occupied units make up 2 (2.4%).
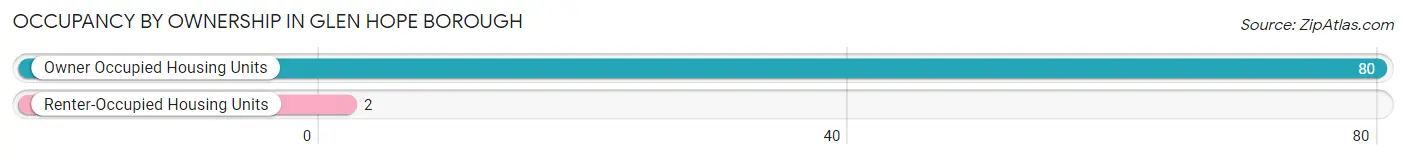
| Occupancy | # Housing Units | % Housing Units |
| Owner Occupied Housing Units | 80 | 97.6% |
| Renter-Occupied Housing Units | 2 | 2.4% |
| Total Occupied Housing Units | 82 | 100.0% |
Occupancy by Household Size in Glen Hope borough
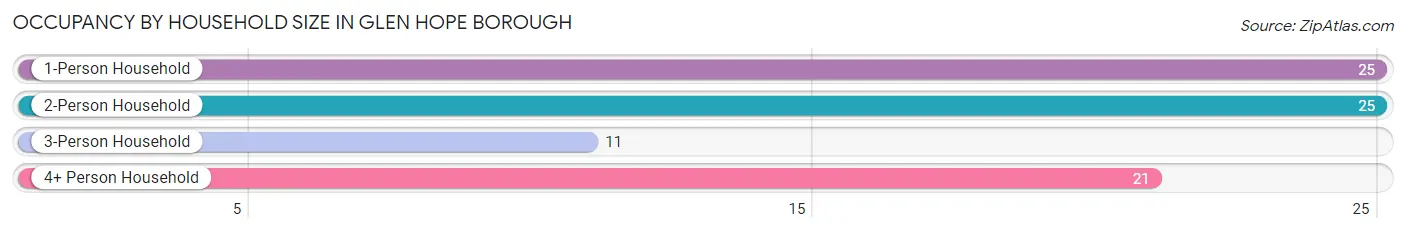
| Household Size | # Housing Units | % Housing Units |
| 1-Person Household | 25 | 30.5% |
| 2-Person Household | 25 | 30.5% |
| 3-Person Household | 11 | 13.4% |
| 4+ Person Household | 21 | 25.6% |
| Total Housing Units | 82 | 100.0% |
Occupancy by Ownership by Household Size in Glen Hope borough
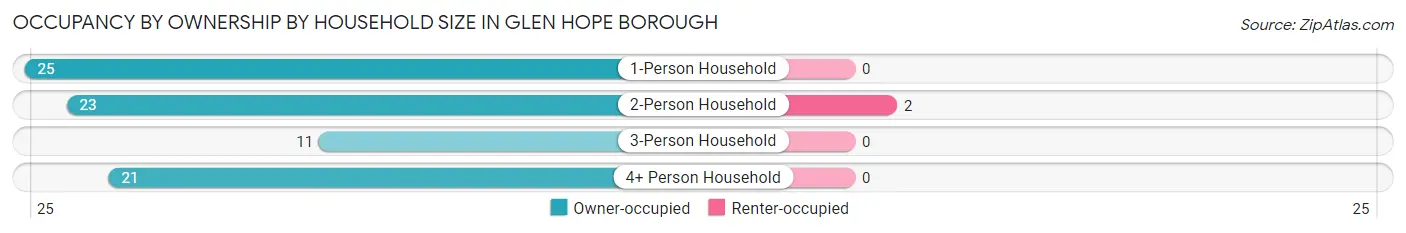
| Household Size | Owner-occupied | Renter-occupied |
| 1-Person Household | 25 (100.0%) | 0 (0.0%) |
| 2-Person Household | 23 (92.0%) | 2 (8.0%) |
| 3-Person Household | 11 (100.0%) | 0 (0.0%) |
| 4+ Person Household | 21 (100.0%) | 0 (0.0%) |
| Total Housing Units | 80 (97.6%) | 2 (2.4%) |
Occupancy by Educational Attainment in Glen Hope borough
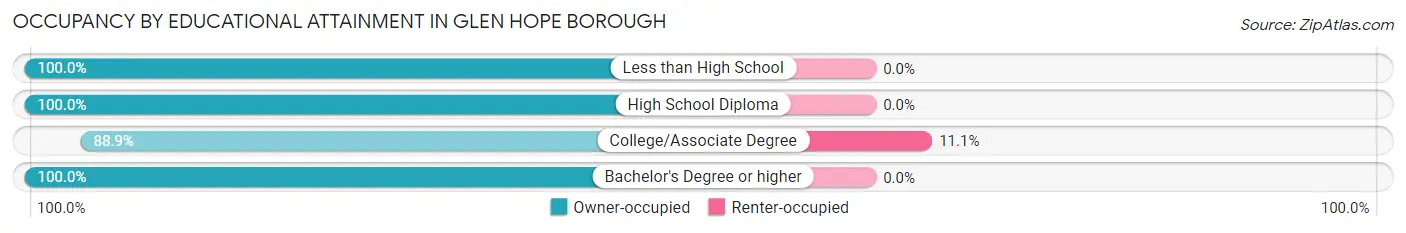
| Household Size | Owner-occupied | Renter-occupied |
| Less than High School | 2 (100.0%) | 0 (0.0%) |
| High School Diploma | 59 (100.0%) | 0 (0.0%) |
| College/Associate Degree | 16 (88.9%) | 2 (11.1%) |
| Bachelor's Degree or higher | 3 (100.0%) | 0 (0.0%) |
Occupancy by Age of Householder in Glen Hope borough
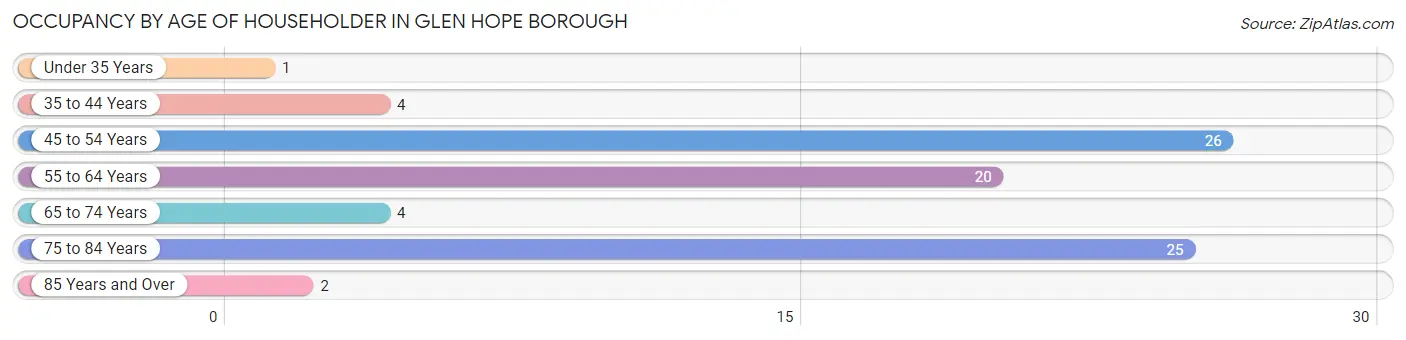
| Age Bracket | # Households | % Households |
| Under 35 Years | 1 | 1.2% |
| 35 to 44 Years | 4 | 4.9% |
| 45 to 54 Years | 26 | 31.7% |
| 55 to 64 Years | 20 | 24.4% |
| 65 to 74 Years | 4 | 4.9% |
| 75 to 84 Years | 25 | 30.5% |
| 85 Years and Over | 2 | 2.4% |
| Total | 82 | 100.0% |
Housing Finances in Glen Hope borough
Median Income by Occupancy in Glen Hope borough
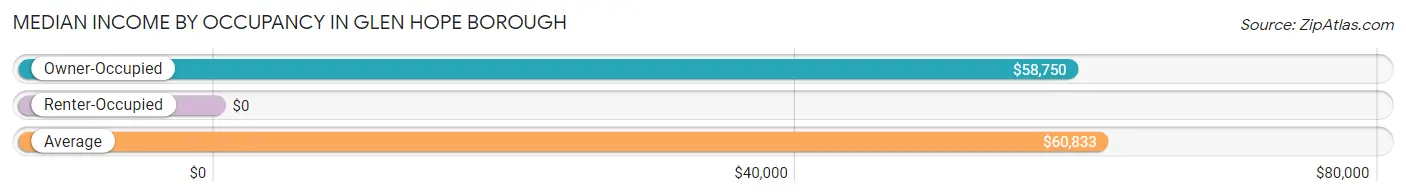
| Occupancy Type | # Households | Median Income |
| Owner-Occupied | 80 (97.6%) | $58,750 |
| Renter-Occupied | 2 (2.4%) | $0 |
| Average | 82 (100.0%) | $60,833 |
Occupancy by Householder Income Bracket in Glen Hope borough
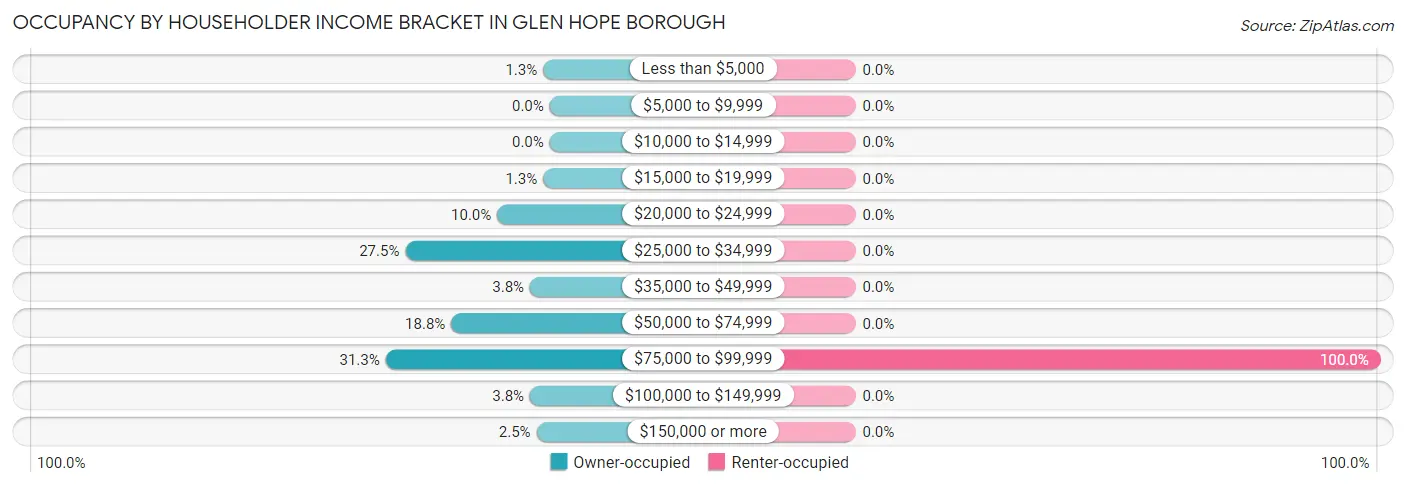
| Income Bracket | Owner-occupied | Renter-occupied |
| Less than $5,000 | 1 (1.3%) | 0 (0.0%) |
| $5,000 to $9,999 | 0 (0.0%) | 0 (0.0%) |
| $10,000 to $14,999 | 0 (0.0%) | 0 (0.0%) |
| $15,000 to $19,999 | 1 (1.3%) | 0 (0.0%) |
| $20,000 to $24,999 | 8 (10.0%) | 0 (0.0%) |
| $25,000 to $34,999 | 22 (27.5%) | 0 (0.0%) |
| $35,000 to $49,999 | 3 (3.7%) | 0 (0.0%) |
| $50,000 to $74,999 | 15 (18.8%) | 0 (0.0%) |
| $75,000 to $99,999 | 25 (31.2%) | 2 (100.0%) |
| $100,000 to $149,999 | 3 (3.7%) | 0 (0.0%) |
| $150,000 or more | 2 (2.5%) | 0 (0.0%) |
| Total | 80 (100.0%) | 2 (100.0%) |
Monthly Housing Cost Tiers in Glen Hope borough
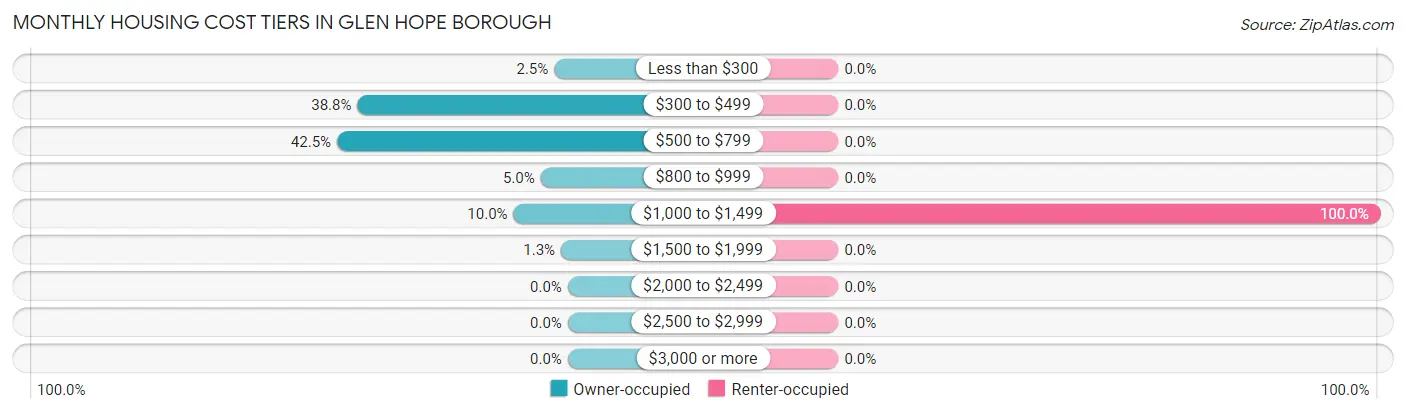
| Monthly Cost | Owner-occupied | Renter-occupied |
| Less than $300 | 2 (2.5%) | 0 (0.0%) |
| $300 to $499 | 31 (38.8%) | 0 (0.0%) |
| $500 to $799 | 34 (42.5%) | 0 (0.0%) |
| $800 to $999 | 4 (5.0%) | 0 (0.0%) |
| $1,000 to $1,499 | 8 (10.0%) | 2 (100.0%) |
| $1,500 to $1,999 | 1 (1.3%) | 0 (0.0%) |
| $2,000 to $2,499 | 0 (0.0%) | 0 (0.0%) |
| $2,500 to $2,999 | 0 (0.0%) | 0 (0.0%) |
| $3,000 or more | 0 (0.0%) | 0 (0.0%) |
| Total | 80 (100.0%) | 2 (100.0%) |
Physical Housing Characteristics in Glen Hope borough
Housing Structures in Glen Hope borough
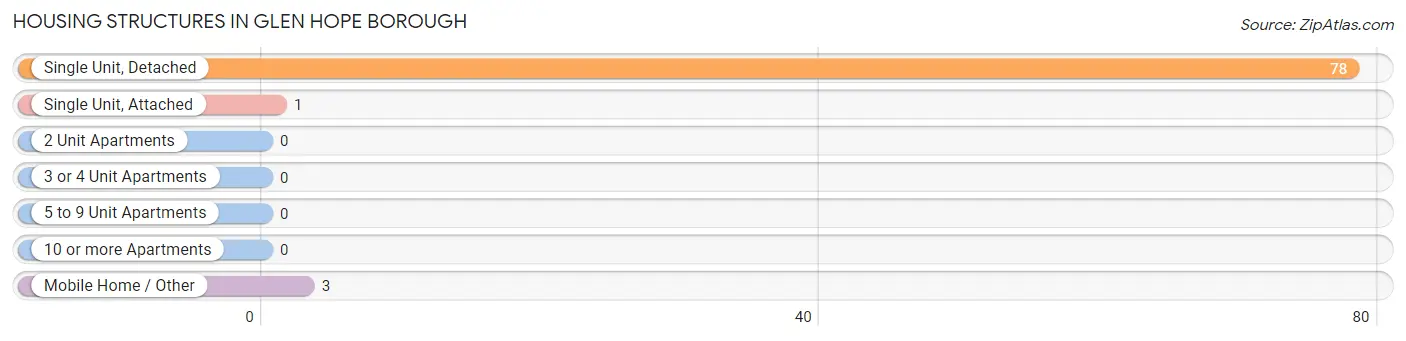
| Structure Type | # Housing Units | % Housing Units |
| Single Unit, Detached | 78 | 95.1% |
| Single Unit, Attached | 1 | 1.2% |
| 2 Unit Apartments | 0 | 0.0% |
| 3 or 4 Unit Apartments | 0 | 0.0% |
| 5 to 9 Unit Apartments | 0 | 0.0% |
| 10 or more Apartments | 0 | 0.0% |
| Mobile Home / Other | 3 | 3.7% |
| Total | 82 | 100.0% |
Housing Structures by Occupancy in Glen Hope borough
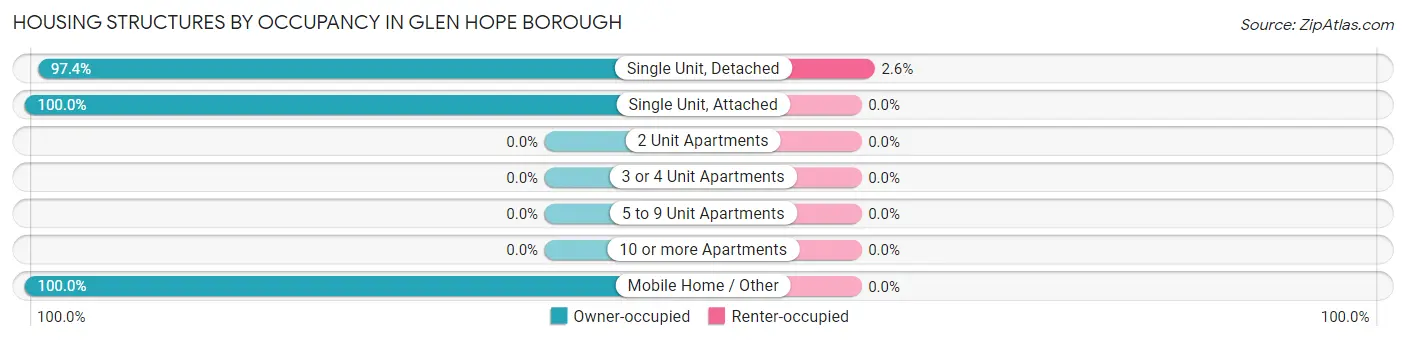
| Structure Type | Owner-occupied | Renter-occupied |
| Single Unit, Detached | 76 (97.4%) | 2 (2.6%) |
| Single Unit, Attached | 1 (100.0%) | 0 (0.0%) |
| 2 Unit Apartments | 0 (0.0%) | 0 (0.0%) |
| 3 or 4 Unit Apartments | 0 (0.0%) | 0 (0.0%) |
| 5 to 9 Unit Apartments | 0 (0.0%) | 0 (0.0%) |
| 10 or more Apartments | 0 (0.0%) | 0 (0.0%) |
| Mobile Home / Other | 3 (100.0%) | 0 (0.0%) |
| Total | 80 (97.6%) | 2 (2.4%) |
Housing Structures by Number of Rooms in Glen Hope borough
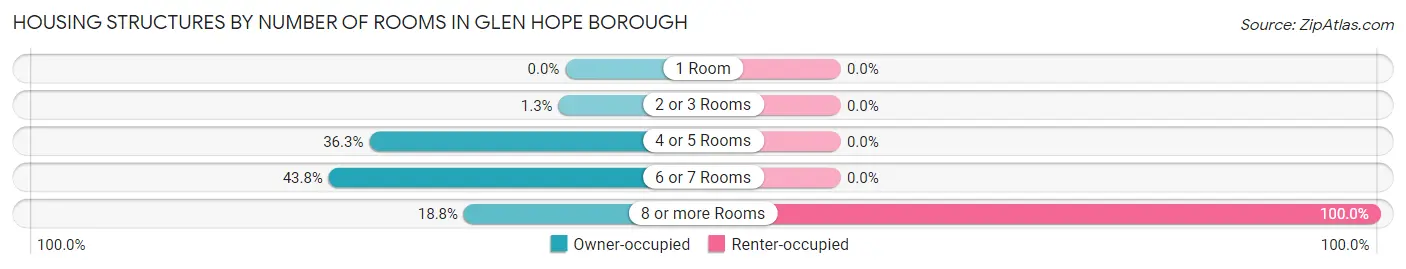
| Number of Rooms | Owner-occupied | Renter-occupied |
| 1 Room | 0 (0.0%) | 0 (0.0%) |
| 2 or 3 Rooms | 1 (1.3%) | 0 (0.0%) |
| 4 or 5 Rooms | 29 (36.2%) | 0 (0.0%) |
| 6 or 7 Rooms | 35 (43.8%) | 0 (0.0%) |
| 8 or more Rooms | 15 (18.8%) | 2 (100.0%) |
| Total | 80 (100.0%) | 2 (100.0%) |
Housing Structure by Heating Type in Glen Hope borough
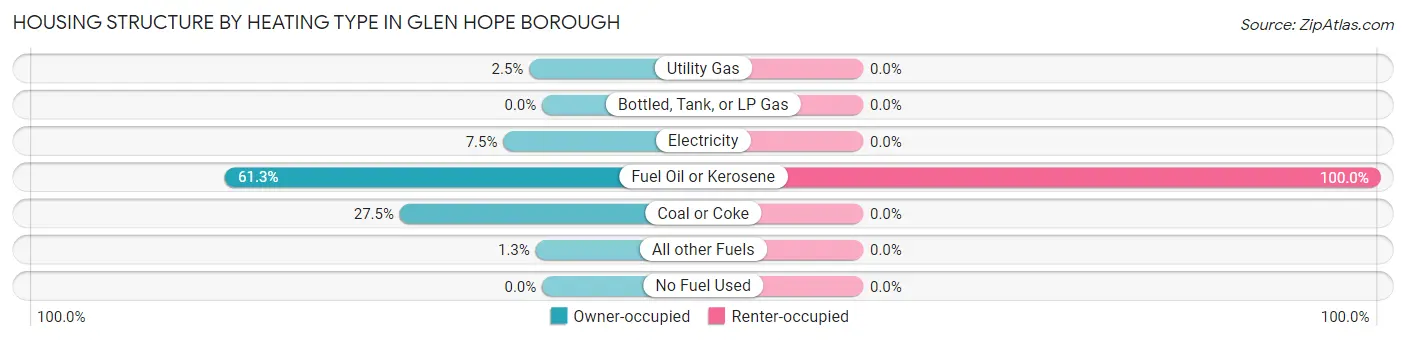
| Heating Type | Owner-occupied | Renter-occupied |
| Utility Gas | 2 (2.5%) | 0 (0.0%) |
| Bottled, Tank, or LP Gas | 0 (0.0%) | 0 (0.0%) |
| Electricity | 6 (7.5%) | 0 (0.0%) |
| Fuel Oil or Kerosene | 49 (61.3%) | 2 (100.0%) |
| Coal or Coke | 22 (27.5%) | 0 (0.0%) |
| All other Fuels | 1 (1.3%) | 0 (0.0%) |
| No Fuel Used | 0 (0.0%) | 0 (0.0%) |
| Total | 80 (100.0%) | 2 (100.0%) |
Household Vehicle Usage in Glen Hope borough
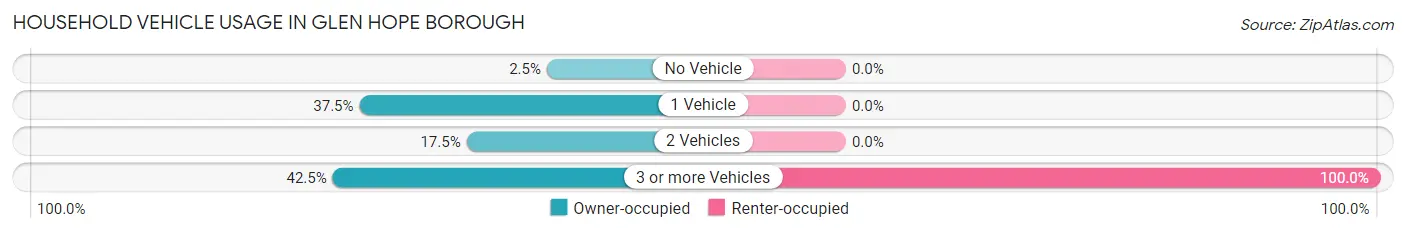
| Vehicles per Household | Owner-occupied | Renter-occupied |
| No Vehicle | 2 (2.5%) | 0 (0.0%) |
| 1 Vehicle | 30 (37.5%) | 0 (0.0%) |
| 2 Vehicles | 14 (17.5%) | 0 (0.0%) |
| 3 or more Vehicles | 34 (42.5%) | 2 (100.0%) |
| Total | 80 (100.0%) | 2 (100.0%) |
Real Estate & Mortgages in Glen Hope borough
Real Estate and Mortgage Overview in Glen Hope borough
| Characteristic | Without Mortgage | With Mortgage |
| Housing Units | 66 | 14 |
| Median Property Value | - | - |
| Median Household Income | - | - |
| Monthly Housing Costs | $500 | $0 |
| Real Estate Taxes | $852 | $0 |
Property Value by Mortgage Status in Glen Hope borough
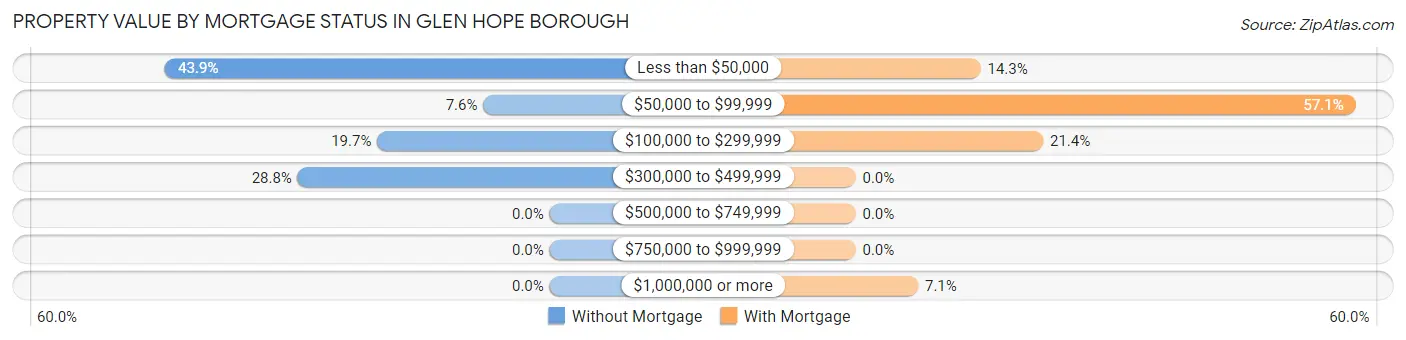
| Property Value | Without Mortgage | With Mortgage |
| Less than $50,000 | 29 (43.9%) | 2 (14.3%) |
| $50,000 to $99,999 | 5 (7.6%) | 8 (57.1%) |
| $100,000 to $299,999 | 13 (19.7%) | 3 (21.4%) |
| $300,000 to $499,999 | 19 (28.8%) | 0 (0.0%) |
| $500,000 to $749,999 | 0 (0.0%) | 0 (0.0%) |
| $750,000 to $999,999 | 0 (0.0%) | 0 (0.0%) |
| $1,000,000 or more | 0 (0.0%) | 1 (7.1%) |
| Total | 66 (100.0%) | 14 (100.0%) |
Household Income by Mortgage Status in Glen Hope borough
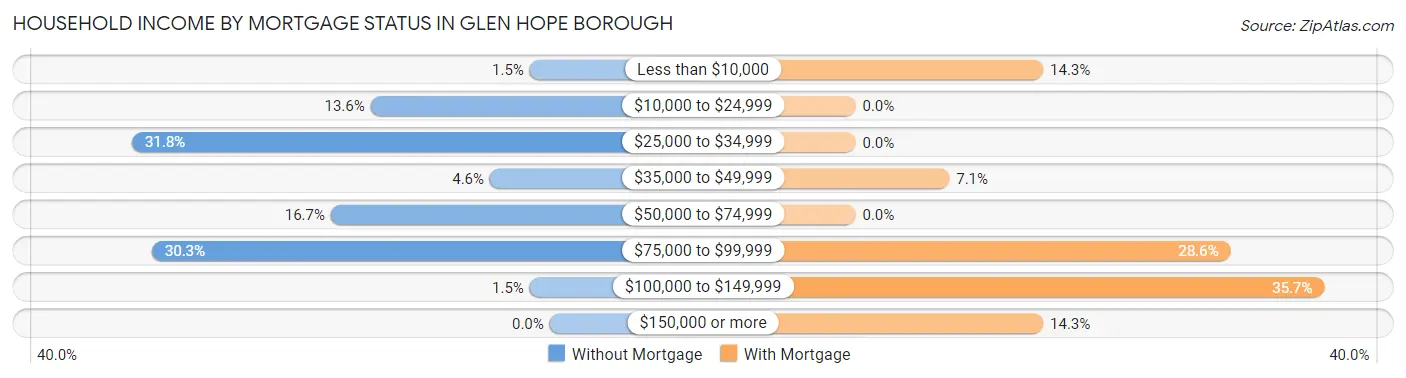
| Household Income | Without Mortgage | With Mortgage |
| Less than $10,000 | 1 (1.5%) | 2 (14.3%) |
| $10,000 to $24,999 | 9 (13.6%) | 0 (0.0%) |
| $25,000 to $34,999 | 21 (31.8%) | 0 (0.0%) |
| $35,000 to $49,999 | 3 (4.5%) | 1 (7.1%) |
| $50,000 to $74,999 | 11 (16.7%) | 0 (0.0%) |
| $75,000 to $99,999 | 20 (30.3%) | 4 (28.6%) |
| $100,000 to $149,999 | 1 (1.5%) | 5 (35.7%) |
| $150,000 or more | 0 (0.0%) | 2 (14.3%) |
| Total | 66 (100.0%) | 14 (100.0%) |
Property Value to Household Income Ratio in Glen Hope borough
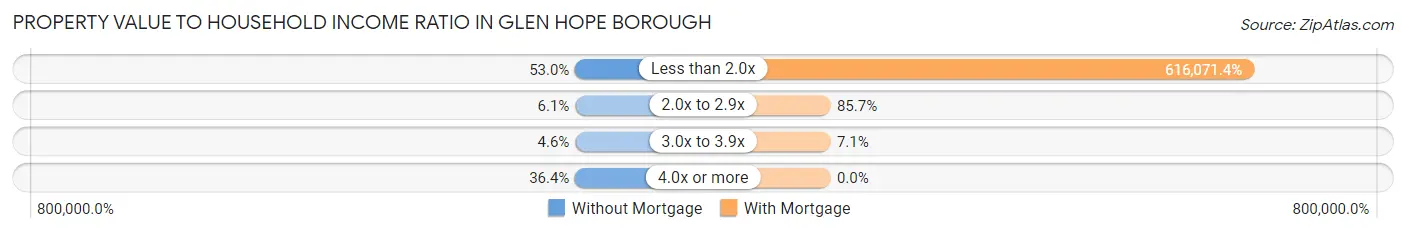
| Value-to-Income Ratio | Without Mortgage | With Mortgage |
| Less than 2.0x | 35 (53.0%) | 86,250 (616,071.4%) |
| 2.0x to 2.9x | 4 (6.1%) | 12 (85.7%) |
| 3.0x to 3.9x | 3 (4.5%) | 1 (7.1%) |
| 4.0x or more | 24 (36.4%) | 0 (0.0%) |
| Total | 66 (100.0%) | 14 (100.0%) |
Real Estate Taxes by Mortgage Status in Glen Hope borough
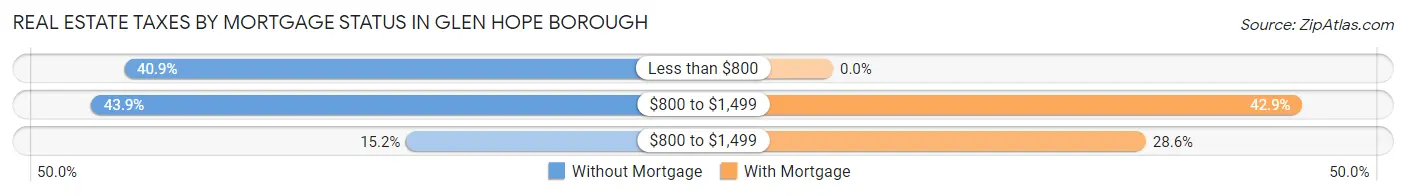
| Property Taxes | Without Mortgage | With Mortgage |
| Less than $800 | 27 (40.9%) | 0 (0.0%) |
| $800 to $1,499 | 29 (43.9%) | 6 (42.9%) |
| $800 to $1,499 | 10 (15.1%) | 4 (28.6%) |
| Total | 66 (100.0%) | 14 (100.0%) |
Health & Disability in Glen Hope borough
Health Insurance Coverage by Age in Glen Hope borough
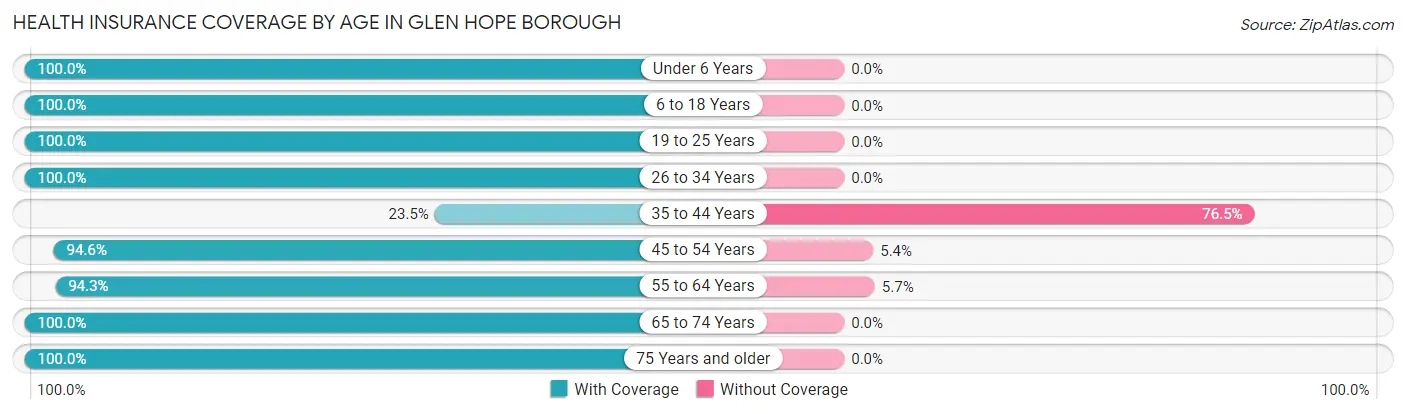
| Age Bracket | With Coverage | Without Coverage |
| Under 6 Years | 2 (100.0%) | 0 (0.0%) |
| 6 to 18 Years | 7 (100.0%) | 0 (0.0%) |
| 19 to 25 Years | 43 (100.0%) | 0 (0.0%) |
| 26 to 34 Years | 4 (100.0%) | 0 (0.0%) |
| 35 to 44 Years | 4 (23.5%) | 13 (76.5%) |
| 45 to 54 Years | 35 (94.6%) | 2 (5.4%) |
| 55 to 64 Years | 33 (94.3%) | 2 (5.7%) |
| 65 to 74 Years | 11 (100.0%) | 0 (0.0%) |
| 75 Years and older | 34 (100.0%) | 0 (0.0%) |
| Total | 173 (91.0%) | 17 (8.9%) |
Health Insurance Coverage by Citizenship Status in Glen Hope borough
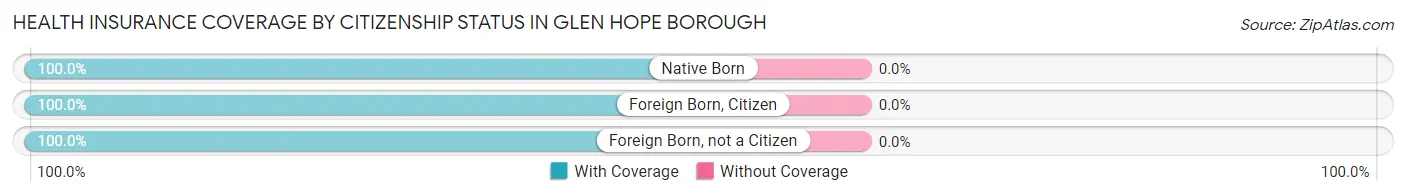
| Citizenship Status | With Coverage | Without Coverage |
| Native Born | 2 (100.0%) | 0 (0.0%) |
| Foreign Born, Citizen | 7 (100.0%) | 0 (0.0%) |
| Foreign Born, not a Citizen | 43 (100.0%) | 0 (0.0%) |
Health Insurance Coverage by Household Income in Glen Hope borough
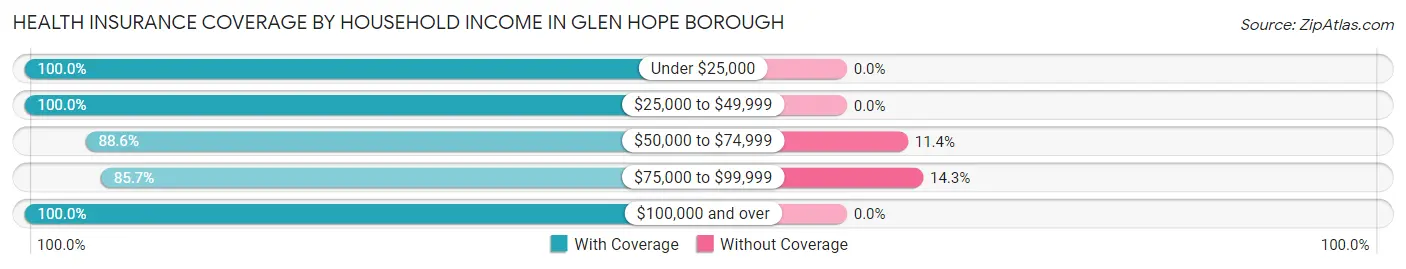
| Household Income | With Coverage | Without Coverage |
| Under $25,000 | 21 (100.0%) | 0 (0.0%) |
| $25,000 to $49,999 | 33 (100.0%) | 0 (0.0%) |
| $50,000 to $74,999 | 31 (88.6%) | 4 (11.4%) |
| $75,000 to $99,999 | 78 (85.7%) | 13 (14.3%) |
| $100,000 and over | 10 (100.0%) | 0 (0.0%) |
Public vs Private Health Insurance Coverage by Age in Glen Hope borough
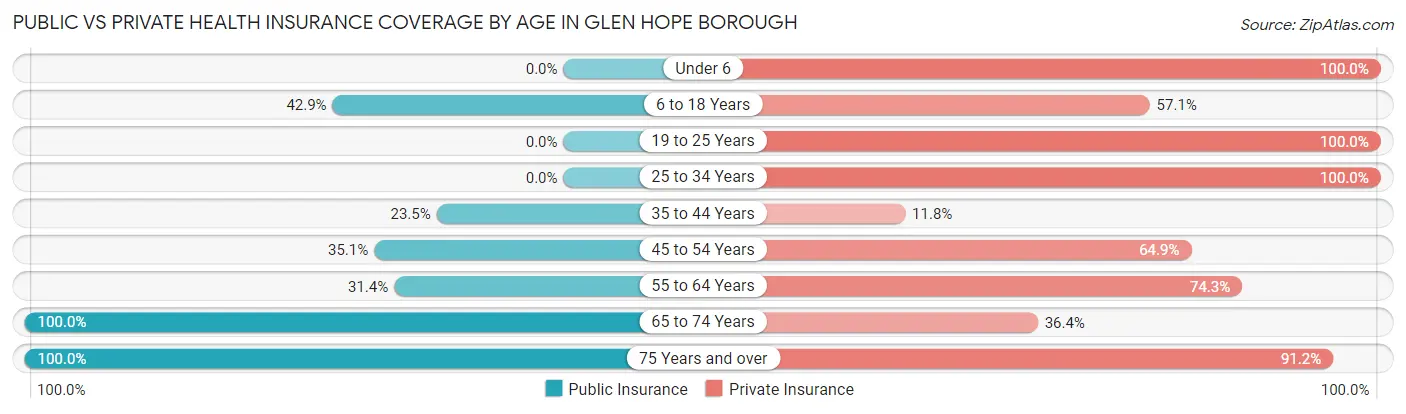
| Age Bracket | Public Insurance | Private Insurance |
| Under 6 | 0 (0.0%) | 2 (100.0%) |
| 6 to 18 Years | 3 (42.9%) | 4 (57.1%) |
| 19 to 25 Years | 0 (0.0%) | 43 (100.0%) |
| 25 to 34 Years | 0 (0.0%) | 4 (100.0%) |
| 35 to 44 Years | 4 (23.5%) | 2 (11.8%) |
| 45 to 54 Years | 13 (35.1%) | 24 (64.9%) |
| 55 to 64 Years | 11 (31.4%) | 26 (74.3%) |
| 65 to 74 Years | 11 (100.0%) | 4 (36.4%) |
| 75 Years and over | 34 (100.0%) | 31 (91.2%) |
| Total | 76 (40.0%) | 140 (73.7%) |
Disability Status by Sex by Age in Glen Hope borough
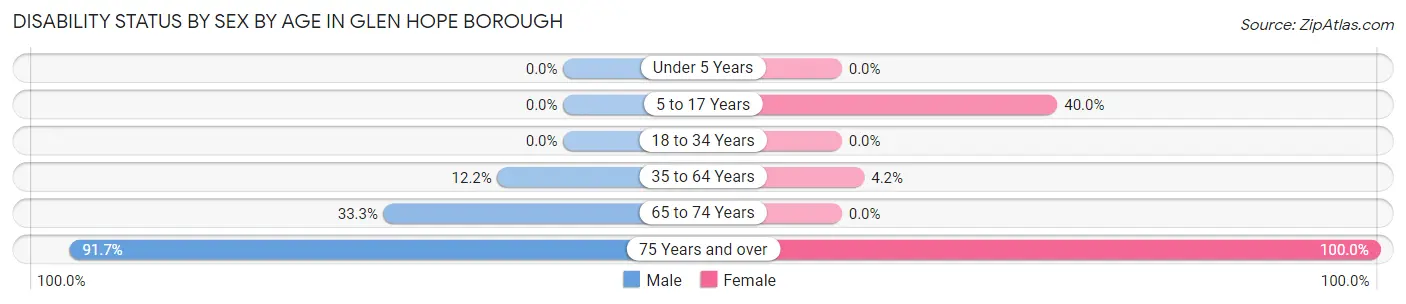
| Age Bracket | Male | Female |
| Under 5 Years | 0 (0.0%) | 0 (0.0%) |
| 5 to 17 Years | 0 (0.0%) | 2 (40.0%) |
| 18 to 34 Years | 0 (0.0%) | 0 (0.0%) |
| 35 to 64 Years | 5 (12.2%) | 2 (4.2%) |
| 65 to 74 Years | 2 (33.3%) | 0 (0.0%) |
| 75 Years and over | 22 (91.7%) | 10 (100.0%) |
Disability Class by Sex by Age in Glen Hope borough
Disability Class: Hearing Difficulty
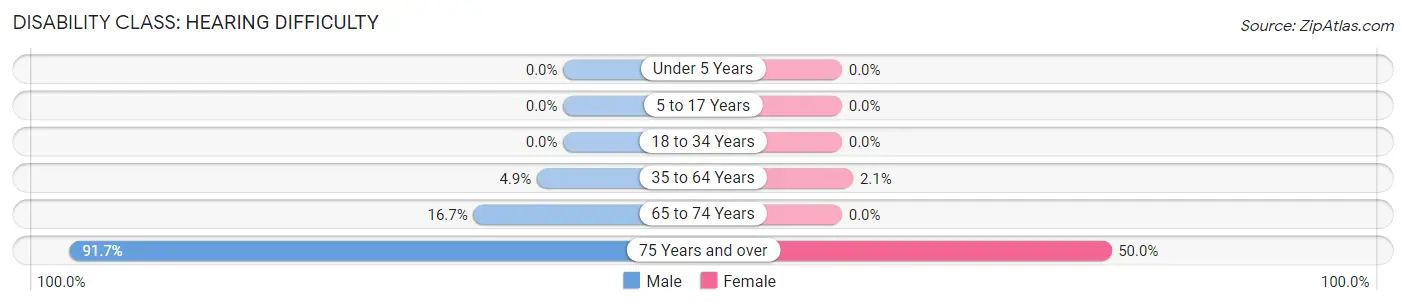
| Age Bracket | Male | Female |
| Under 5 Years | 0 (0.0%) | 0 (0.0%) |
| 5 to 17 Years | 0 (0.0%) | 0 (0.0%) |
| 18 to 34 Years | 0 (0.0%) | 0 (0.0%) |
| 35 to 64 Years | 2 (4.9%) | 1 (2.1%) |
| 65 to 74 Years | 1 (16.7%) | 0 (0.0%) |
| 75 Years and over | 22 (91.7%) | 5 (50.0%) |
Disability Class: Vision Difficulty
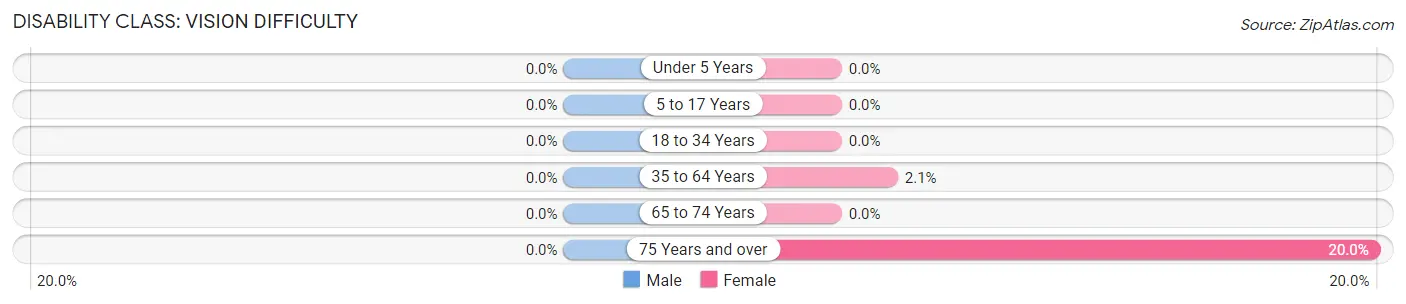
| Age Bracket | Male | Female |
| Under 5 Years | 0 (0.0%) | 0 (0.0%) |
| 5 to 17 Years | 0 (0.0%) | 0 (0.0%) |
| 18 to 34 Years | 0 (0.0%) | 0 (0.0%) |
| 35 to 64 Years | 0 (0.0%) | 1 (2.1%) |
| 65 to 74 Years | 0 (0.0%) | 0 (0.0%) |
| 75 Years and over | 0 (0.0%) | 2 (20.0%) |
Disability Class: Cognitive Difficulty
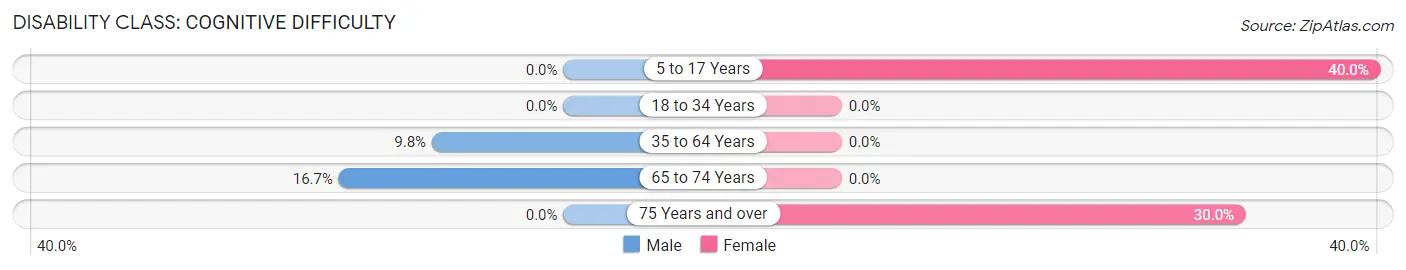
| Age Bracket | Male | Female |
| 5 to 17 Years | 0 (0.0%) | 2 (40.0%) |
| 18 to 34 Years | 0 (0.0%) | 0 (0.0%) |
| 35 to 64 Years | 4 (9.8%) | 0 (0.0%) |
| 65 to 74 Years | 1 (16.7%) | 0 (0.0%) |
| 75 Years and over | 0 (0.0%) | 3 (30.0%) |
Disability Class: Ambulatory Difficulty
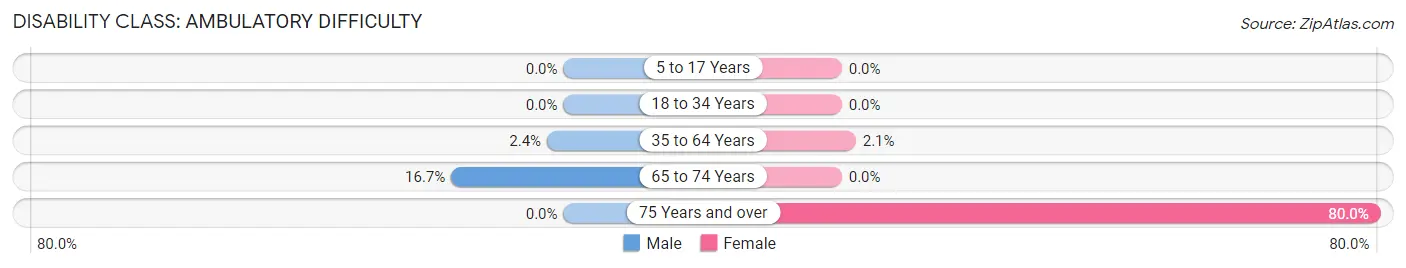
| Age Bracket | Male | Female |
| 5 to 17 Years | 0 (0.0%) | 0 (0.0%) |
| 18 to 34 Years | 0 (0.0%) | 0 (0.0%) |
| 35 to 64 Years | 1 (2.4%) | 1 (2.1%) |
| 65 to 74 Years | 1 (16.7%) | 0 (0.0%) |
| 75 Years and over | 0 (0.0%) | 8 (80.0%) |
Disability Class: Self-Care Difficulty
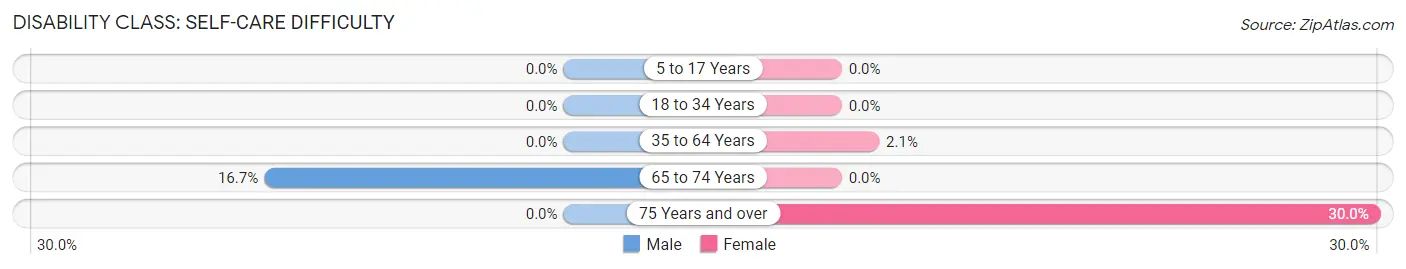
| Age Bracket | Male | Female |
| 5 to 17 Years | 0 (0.0%) | 0 (0.0%) |
| 18 to 34 Years | 0 (0.0%) | 0 (0.0%) |
| 35 to 64 Years | 0 (0.0%) | 1 (2.1%) |
| 65 to 74 Years | 1 (16.7%) | 0 (0.0%) |
| 75 Years and over | 0 (0.0%) | 3 (30.0%) |
Technology Access in Glen Hope borough
Computing Device Access in Glen Hope borough
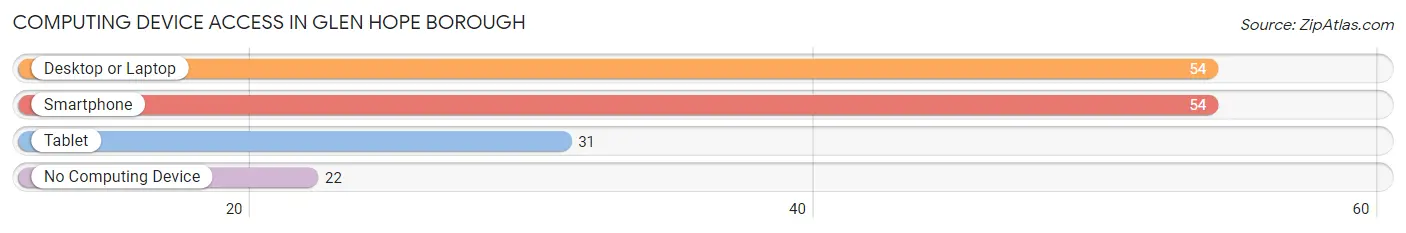
| Device Type | # Households | % Households |
| Desktop or Laptop | 54 | 65.8% |
| Smartphone | 54 | 65.8% |
| Tablet | 31 | 37.8% |
| No Computing Device | 22 | 26.8% |
| Total | 82 | 100.0% |
Internet Access in Glen Hope borough
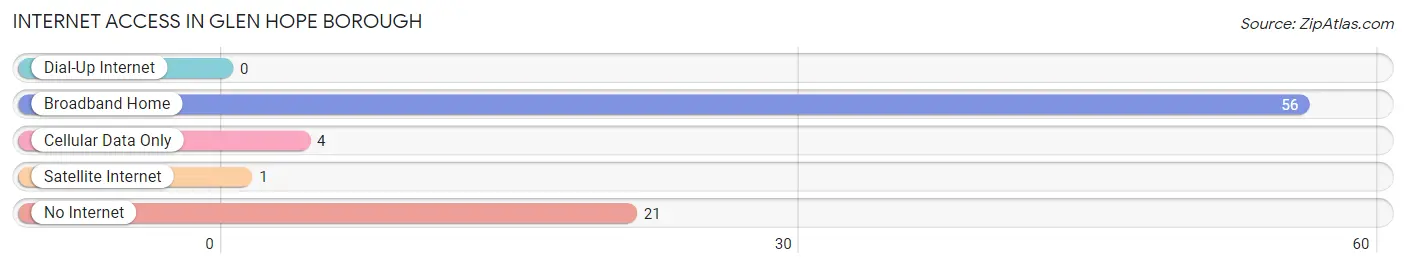
| Internet Type | # Households | % Households |
| Dial-Up Internet | 0 | 0.0% |
| Broadband Home | 56 | 68.3% |
| Cellular Data Only | 4 | 4.9% |
| Satellite Internet | 1 | 1.2% |
| No Internet | 21 | 25.6% |
| Total | 82 | 100.0% |
Glen Hope borough Summary
Glen Hope Borough is a small borough located in Clearfield County, Pennsylvania. It is situated in the western part of the state, approximately 70 miles northeast of Pittsburgh. The borough is bordered by the townships of Brady, Beccaria, and Decatur. As of the 2010 census, the population of Glen Hope was 517.
History
Glen Hope was founded in 1872 by a group of settlers from the nearby town of Beccaria. The settlers chose the name “Glen Hope” because of the beautiful scenery in the area. The first post office was established in 1873, and the borough was officially incorporated in 1876.
In the early 1900s, the borough was a thriving coal mining community. The coal industry provided employment for many of the residents and helped to fuel the local economy. The coal mines eventually closed in the 1950s, and the borough has since shifted to a more residential focus.
Geography
Glen Hope is located in western Pennsylvania at 40°51'N, 78°37'W. It is situated in the Allegheny Plateau region of the state, and is surrounded by rolling hills and forests. The borough is located approximately 70 miles northeast of Pittsburgh and is bordered by the townships of Brady, Beccaria, and Decatur.
The climate in Glen Hope is classified as humid continental, with cold winters and warm summers. The average annual temperature is around 50°F, and the average annual precipitation is around 40 inches.
Economy
The economy of Glen Hope is largely based on the service industry. The borough is home to several small businesses, including restaurants, retail stores, and professional services. The local government also provides employment for many of the residents.
The borough is also home to several small farms, which produce a variety of crops and livestock. The farms provide employment for some of the residents and help to support the local economy.
Demographics
As of the 2010 census, the population of Glen Hope was 517. The racial makeup of the borough was 97.3% White, 0.6% African American, 0.2% Native American, 0.2% Asian, and 1.7% from other races. The median household income was $37,500, and the median family income was $41,250.
The population of Glen Hope is largely Christian, with the majority of residents belonging to the Roman Catholic Church. There is also a small population of non-religious residents.
Conclusion
Glen Hope is a small borough located in Clearfield County, Pennsylvania. It was founded in 1872 by a group of settlers from the nearby town of Beccaria, and was once a thriving coal mining community. The economy of the borough is largely based on the service industry, and the population is largely Christian. The borough is home to several small businesses and farms, which help to support the local economy.
Common Questions
What is Per Capita Income in Glen Hope borough?
Per Capita income in Glen Hope borough is $27,858.
What is the Median Family Income in Glen Hope borough?
Median Family Income in Glen Hope borough is $85,069.
What is the Median Household income in Glen Hope borough?
Median Household Income in Glen Hope borough is $60,833.
What is Inequality or Gini Index in Glen Hope borough?
Inequality or Gini Index in Glen Hope borough is 0.31.
What is the Total Population of Glen Hope borough?
Total Population of Glen Hope borough is 190.
What is the Total Male Population of Glen Hope borough?
Total Male Population of Glen Hope borough is 100.
What is the Total Female Population of Glen Hope borough?
Total Female Population of Glen Hope borough is 90.
What is the Ratio of Males per 100 Females in Glen Hope borough?
There are 111.11 Males per 100 Females in Glen Hope borough.
What is the Ratio of Females per 100 Males in Glen Hope borough?
There are 90.00 Females per 100 Males in Glen Hope borough.
What is the Median Population Age in Glen Hope borough?
Median Population Age in Glen Hope borough is 51.6 Years.
What is the Average Family Size in Glen Hope borough
Average Family Size in Glen Hope borough is 2.8 People.
What is the Average Household Size in Glen Hope borough
Average Household Size in Glen Hope borough is 2.3 People.
How Large is the Labor Force in Glen Hope borough?
There are 77 People in the Labor Forcein in Glen Hope borough.
What is the Percentage of People in the Labor Force in Glen Hope borough?
41.8% of People are in the Labor Force in Glen Hope borough.