Mill Creek borough, PA Map & Demographics
Mill Creek borough Overview
$24,040
PER CAPITA INCOME
$90,417
AVG FAMILY INCOME
$39,250
AVG HOUSEHOLD INCOME
45.6%
WAGE / INCOME GAP [ % ]
54.4¢/ $1
WAGE / INCOME GAP [ $ ]
0.42
INEQUALITY / GINI INDEX
314
TOTAL POPULATION
161
MALE POPULATION
153
FEMALE POPULATION
105.23
MALES / 100 FEMALES
95.03
FEMALES / 100 MALES
33.5
MEDIAN AGE
3.9
AVG FAMILY SIZE
2.8
AVG HOUSEHOLD SIZE
156
LABOR FORCE [ PEOPLE ]
64.5%
PERCENT IN LABOR FORCE
3.8%
UNEMPLOYMENT RATE
Income in Mill Creek borough
Income Overview in Mill Creek borough
Per Capita Income in Mill Creek borough is $24,040, while median incomes of families and households are $90,417 and $39,250 respectively.
| Characteristic | Number | Measure |
| Per Capita Income | 314 | $24,040 |
| Median Family Income | 61 | $90,417 |
| Mean Family Income | 61 | $80,549 |
| Median Household Income | 114 | $39,250 |
| Mean Household Income | 114 | $60,392 |
| Income Deficit | 61 | $0 |
| Wage / Income Gap (%) | 314 | 45.60% |
| Wage / Income Gap ($) | 314 | 54.40¢ per $1 |
| Gini / Inequality Index | 314 | 0.42 |
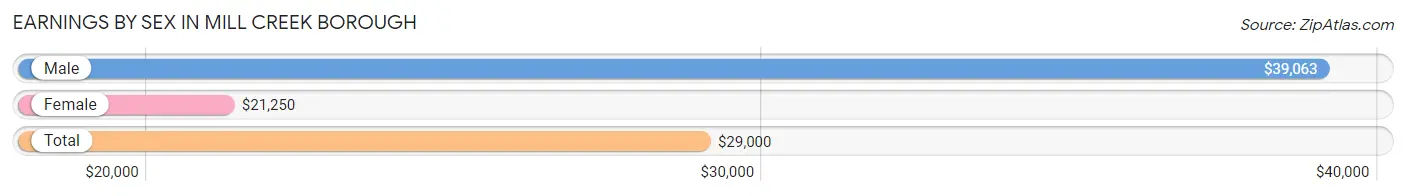
Earnings by Sex in Mill Creek borough
Average Earnings in Mill Creek borough are $29,000, $39,063 for men and $21,250 for women, a difference of 45.6%.
| Sex | Number | Average Earnings |
| Male | 83 (47.2%) | $39,063 |
| Female | 93 (52.8%) | $21,250 |
| Total | 176 (100.0%) | $29,000 |
Earnings by Sex by Income Bracket in Mill Creek borough
The most common earnings brackets in Mill Creek borough are $50,000 to $54,999 for men (10 | 12.0%) and $7,500 to $9,999 for women (16 | 17.2%).

| Income | Male | Female |
| $2,499 or less | 1 (1.2%) | 7 (7.5%) |
| $2,500 to $4,999 | 0 (0.0%) | 8 (8.6%) |
| $5,000 to $7,499 | 5 (6.0%) | 2 (2.1%) |
| $7,500 to $9,999 | 0 (0.0%) | 16 (17.2%) |
| $10,000 to $12,499 | 8 (9.6%) | 2 (2.1%) |
| $12,500 to $14,999 | 0 (0.0%) | 2 (2.1%) |
| $15,000 to $17,499 | 0 (0.0%) | 6 (6.5%) |
| $17,500 to $19,999 | 6 (7.2%) | 2 (2.1%) |
| $20,000 to $22,499 | 1 (1.2%) | 3 (3.2%) |
| $22,500 to $24,999 | 8 (9.6%) | 3 (3.2%) |
| $25,000 to $29,999 | 3 (3.6%) | 7 (7.5%) |
| $30,000 to $34,999 | 7 (8.4%) | 9 (9.7%) |
| $35,000 to $39,999 | 4 (4.8%) | 5 (5.4%) |
| $40,000 to $44,999 | 4 (4.8%) | 0 (0.0%) |
| $45,000 to $49,999 | 4 (4.8%) | 10 (10.7%) |
| $50,000 to $54,999 | 10 (12.0%) | 4 (4.3%) |
| $55,000 to $64,999 | 8 (9.6%) | 7 (7.5%) |
| $65,000 to $74,999 | 5 (6.0%) | 0 (0.0%) |
| $75,000 to $99,999 | 6 (7.2%) | 0 (0.0%) |
| $100,000+ | 3 (3.6%) | 0 (0.0%) |
| Total | 83 (100.0%) | 93 (100.0%) |
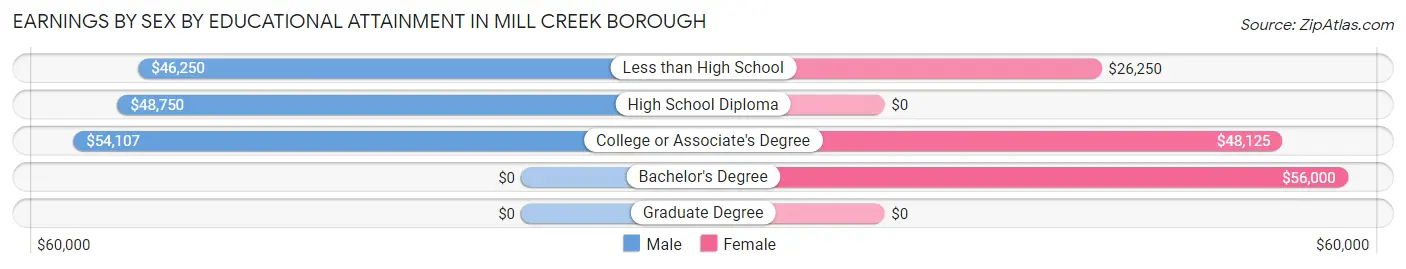
Earnings by Sex by Educational Attainment in Mill Creek borough
Average earnings in Mill Creek borough are $52,857 for men and $25,625 for women, a difference of 51.5%. Men with an educational attainment of college or associate's degree enjoy the highest average annual earnings of $54,107, while those with less than high school education earn the least with $46,250. Women with an educational attainment of bachelor's degree earn the most with the average annual earnings of $56,000, while those with less than high school education have the smallest earnings of $26,250.
| Educational Attainment | Male Income | Female Income |
| Less than High School | $46,250 | $26,250 |
| High School Diploma | $48,750 | $0 |
| College or Associate's Degree | $54,107 | $48,125 |
| Bachelor's Degree | - | - |
| Graduate Degree | - | - |
| Total | $52,857 | $25,625 |
Family Income in Mill Creek borough
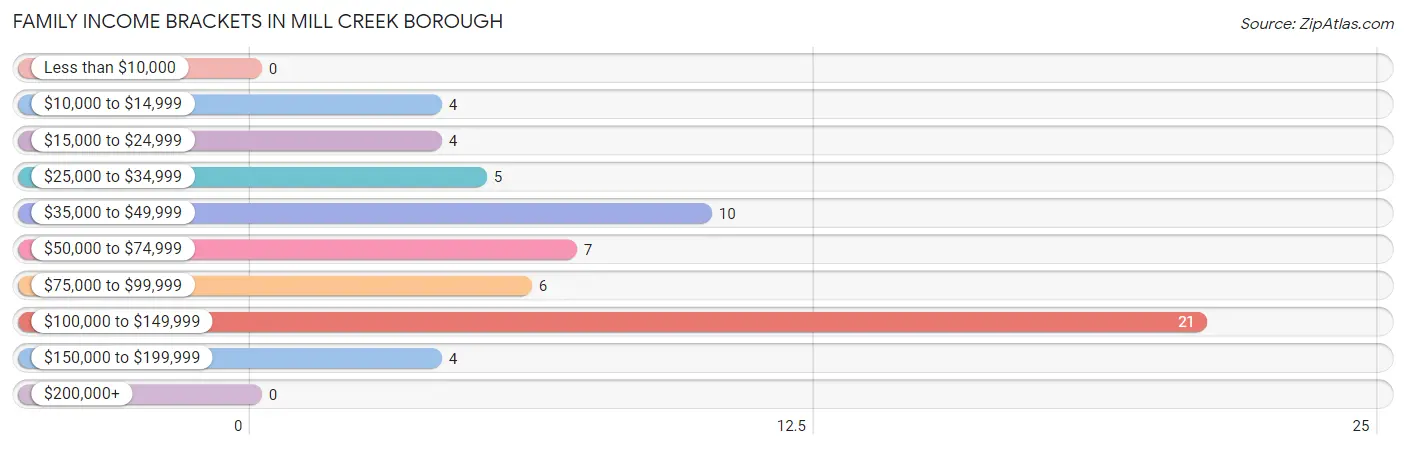
Family Income Brackets in Mill Creek borough
According to the Mill Creek borough family income data, there are 21 families falling into the $100,000 to $149,999 income range, which is the most common income bracket and makes up 34.4% of all families.
| Income Bracket | # Families | % Families |
| Less than $10,000 | 0 | 0.0% |
| $10,000 to $14,999 | 4 | 6.6% |
| $15,000 to $24,999 | 4 | 6.6% |
| $25,000 to $34,999 | 5 | 8.2% |
| $35,000 to $49,999 | 10 | 16.4% |
| $50,000 to $74,999 | 7 | 11.5% |
| $75,000 to $99,999 | 6 | 9.8% |
| $100,000 to $149,999 | 21 | 34.4% |
| $150,000 to $199,999 | 4 | 6.6% |
| $200,000+ | 0 | 0.0% |
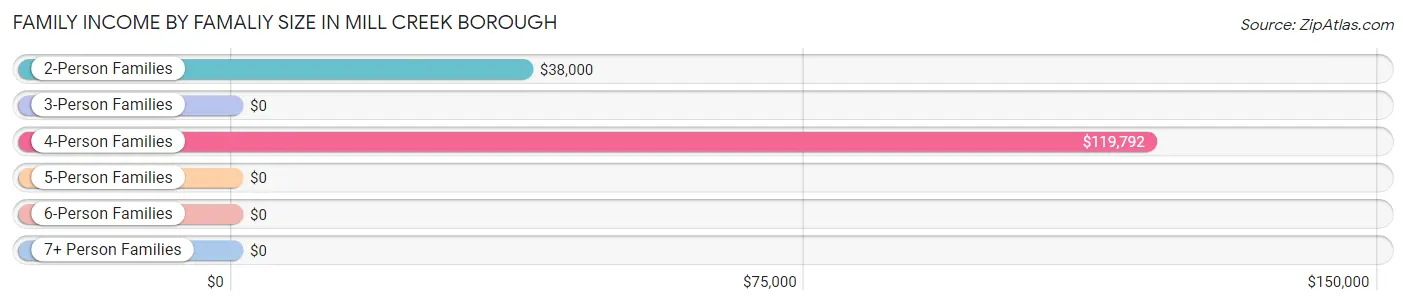
Family Income by Famaliy Size in Mill Creek borough
4-person families (17 | 27.9%) account for the highest median family income in Mill Creek borough with $119,792 per family, while 4-person families (17 | 27.9%) have the highest median income of $29,948 per family member.
| Income Bracket | # Families | Median Income |
| 2-Person Families | 28 (45.9%) | $38,000 |
| 3-Person Families | 6 (9.8%) | $0 |
| 4-Person Families | 17 (27.9%) | $119,792 |
| 5-Person Families | 3 (4.9%) | $0 |
| 6-Person Families | 4 (6.6%) | $0 |
| 7+ Person Families | 3 (4.9%) | $0 |
| Total | 61 (100.0%) | $90,417 |
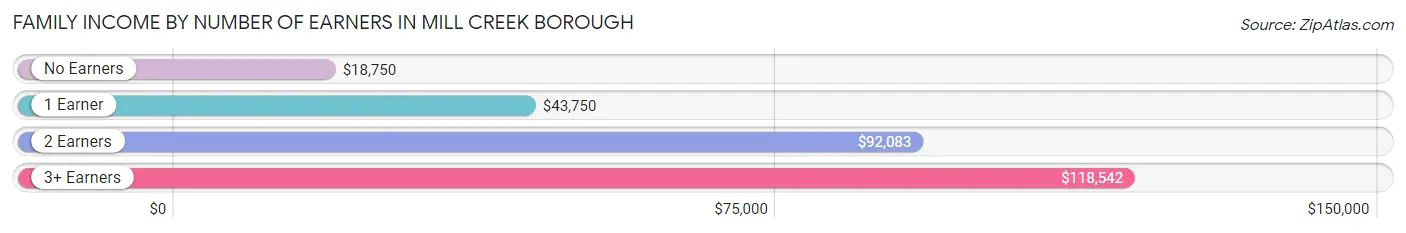
Family Income by Number of Earners in Mill Creek borough
The median family income in Mill Creek borough is $90,417, with families comprising 3+ earners (21) having the highest median family income of $118,542, while families with no earners (8) have the lowest median family income of $18,750, accounting for 34.4% and 13.1% of families, respectively.
| Number of Earners | # Families | Median Income |
| No Earners | 8 (13.1%) | $18,750 |
| 1 Earner | 11 (18.0%) | $43,750 |
| 2 Earners | 21 (34.4%) | $92,083 |
| 3+ Earners | 21 (34.4%) | $118,542 |
| Total | 61 (100.0%) | $90,417 |
Household Income in Mill Creek borough
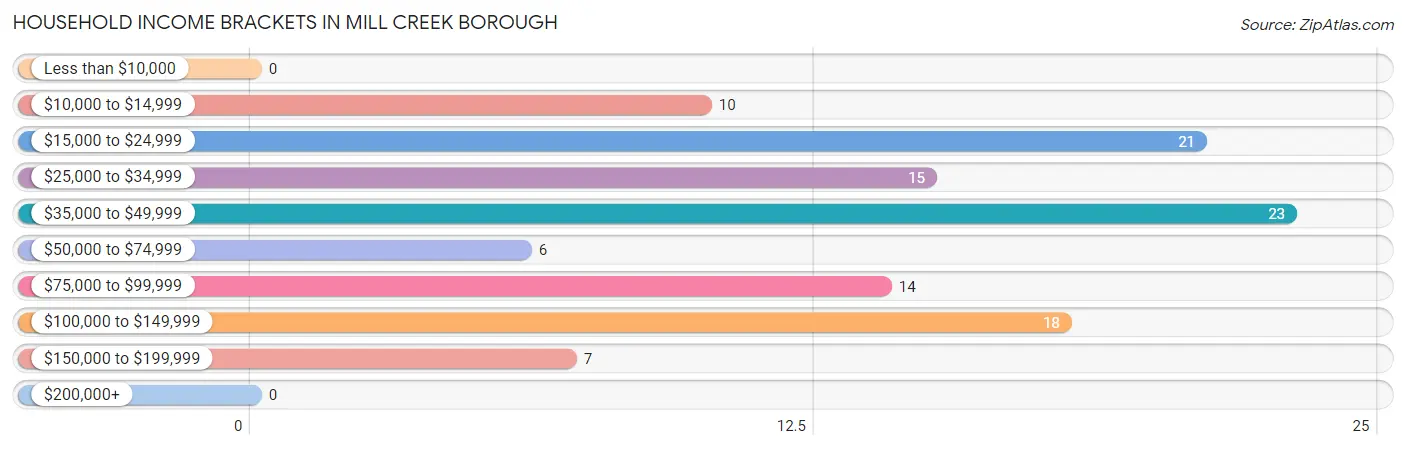
Household Income Brackets in Mill Creek borough
With 23 households falling in the category, the $35,000 to $49,999 income range is the most frequent in Mill Creek borough, accounting for 20.2% of all households.
| Income Bracket | # Households | % Households |
| Less than $10,000 | 0 | 0.0% |
| $10,000 to $14,999 | 10 | 8.8% |
| $15,000 to $24,999 | 21 | 18.4% |
| $25,000 to $34,999 | 15 | 13.2% |
| $35,000 to $49,999 | 23 | 20.2% |
| $50,000 to $74,999 | 6 | 5.3% |
| $75,000 to $99,999 | 14 | 12.3% |
| $100,000 to $149,999 | 18 | 15.8% |
| $150,000 to $199,999 | 7 | 6.1% |
| $200,000+ | 0 | 0.0% |
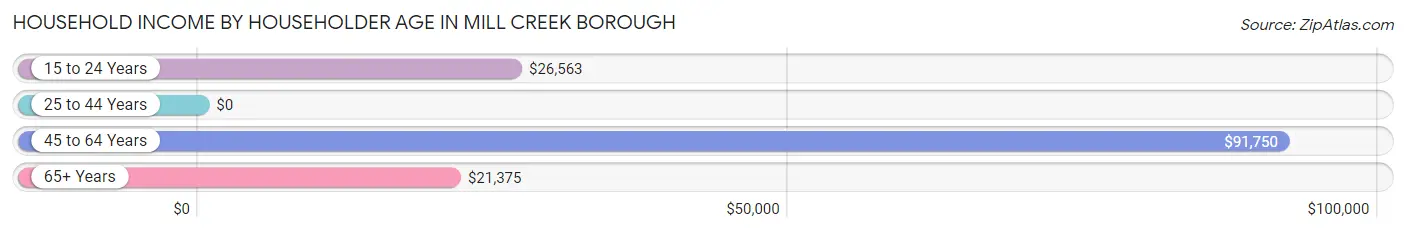
Household Income by Householder Age in Mill Creek borough
The median household income in Mill Creek borough is $39,250, with the highest median household income of $91,750 found in the 45 to 64 years age bracket for the primary householder. A total of 31 households (27.2%) fall into this category. Meanwhile, the 25 to 44 years age bracket for the primary householder has the lowest median household income of $0, with 31 households (27.2%) in this group.
| Income Bracket | # Households | Median Income |
| 15 to 24 Years | 9 (7.9%) | $26,563 |
| 25 to 44 Years | 31 (27.2%) | $0 |
| 45 to 64 Years | 31 (27.2%) | $91,750 |
| 65+ Years | 43 (37.7%) | $21,375 |
| Total | 114 (100.0%) | $39,250 |
Poverty in Mill Creek borough
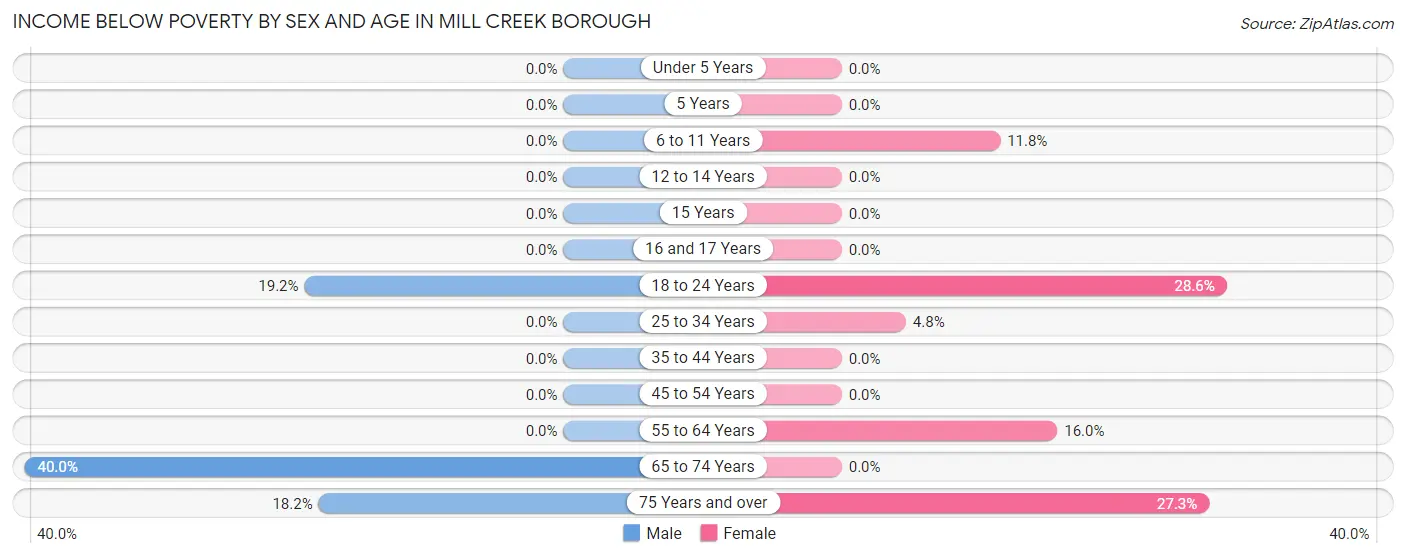
Income Below Poverty by Sex and Age in Mill Creek borough
With 6.8% poverty level for males and 10.9% for females among the residents of Mill Creek borough, 65 to 74 year old males and 18 to 24 year old females are the most vulnerable to poverty, with 4 males (40.0%) and 2 females (28.6%) in their respective age groups living below the poverty level.
| Age Bracket | Male | Female |
| Under 5 Years | 0 (0.0%) | 0 (0.0%) |
| 5 Years | 0 (0.0%) | 0 (0.0%) |
| 6 to 11 Years | 0 (0.0%) | 2 (11.8%) |
| 12 to 14 Years | 0 (0.0%) | 0 (0.0%) |
| 15 Years | 0 (0.0%) | 0 (0.0%) |
| 16 and 17 Years | 0 (0.0%) | 0 (0.0%) |
| 18 to 24 Years | 5 (19.2%) | 2 (28.6%) |
| 25 to 34 Years | 0 (0.0%) | 2 (4.8%) |
| 35 to 44 Years | 0 (0.0%) | 0 (0.0%) |
| 45 to 54 Years | 0 (0.0%) | 0 (0.0%) |
| 55 to 64 Years | 0 (0.0%) | 4 (16.0%) |
| 65 to 74 Years | 4 (40.0%) | 0 (0.0%) |
| 75 Years and over | 2 (18.2%) | 6 (27.3%) |
| Total | 11 (6.8%) | 16 (10.9%) |
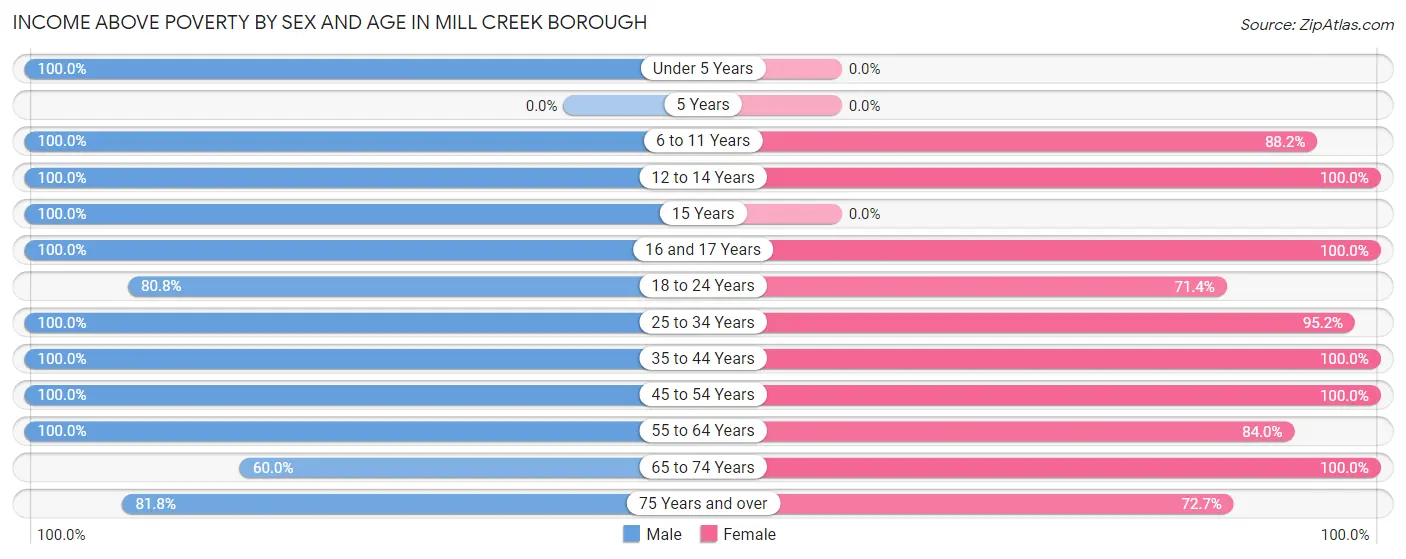
Income Above Poverty by Sex and Age in Mill Creek borough
According to the poverty statistics in Mill Creek borough, males aged under 5 years and females aged 12 to 14 years are the age groups that are most secure financially, with 100.0% of males and 100.0% of females in these age groups living above the poverty line.
| Age Bracket | Male | Female |
| Under 5 Years | 9 (100.0%) | 0 (0.0%) |
| 5 Years | 0 (0.0%) | 0 (0.0%) |
| 6 to 11 Years | 23 (100.0%) | 15 (88.2%) |
| 12 to 14 Years | 9 (100.0%) | 3 (100.0%) |
| 15 Years | 5 (100.0%) | 0 (0.0%) |
| 16 and 17 Years | 1 (100.0%) | 4 (100.0%) |
| 18 to 24 Years | 21 (80.8%) | 5 (71.4%) |
| 25 to 34 Years | 16 (100.0%) | 40 (95.2%) |
| 35 to 44 Years | 18 (100.0%) | 13 (100.0%) |
| 45 to 54 Years | 12 (100.0%) | 10 (100.0%) |
| 55 to 64 Years | 21 (100.0%) | 21 (84.0%) |
| 65 to 74 Years | 6 (60.0%) | 4 (100.0%) |
| 75 Years and over | 9 (81.8%) | 16 (72.7%) |
| Total | 150 (93.2%) | 131 (89.1%) |
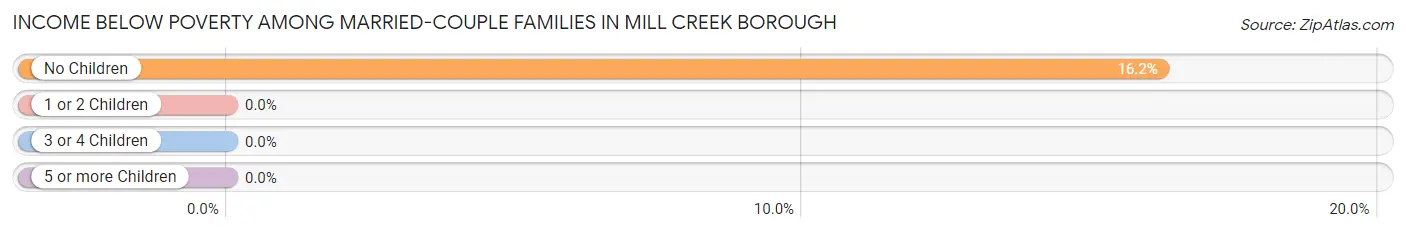
Income Below Poverty Among Married-Couple Families in Mill Creek borough
The poverty statistics for married-couple families in Mill Creek borough show that 11.1% or 6 of the total 54 families live below the poverty line. Families with no children have the highest poverty rate of 16.2%, comprising of 6 families. On the other hand, families with 1 or 2 children have the lowest poverty rate of 0.0%, which includes 0 families.
| Children | Above Poverty | Below Poverty |
| No Children | 31 (83.8%) | 6 (16.2%) |
| 1 or 2 Children | 10 (100.0%) | 0 (0.0%) |
| 3 or 4 Children | 7 (100.0%) | 0 (0.0%) |
| 5 or more Children | 0 (0.0%) | 0 (0.0%) |
| Total | 48 (88.9%) | 6 (11.1%) |
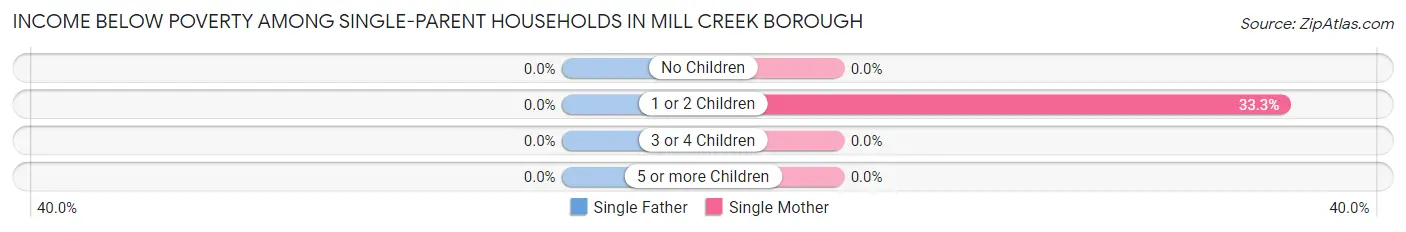
Income Below Poverty Among Single-Parent Households in Mill Creek borough
| Children | Single Father | Single Mother |
| No Children | 0 (0.0%) | 0 (0.0%) |
| 1 or 2 Children | 0 (0.0%) | 2 (33.3%) |
| 3 or 4 Children | 0 (0.0%) | 0 (0.0%) |
| 5 or more Children | 0 (0.0%) | 0 (0.0%) |
| Total | 0 (0.0%) | 2 (33.3%) |
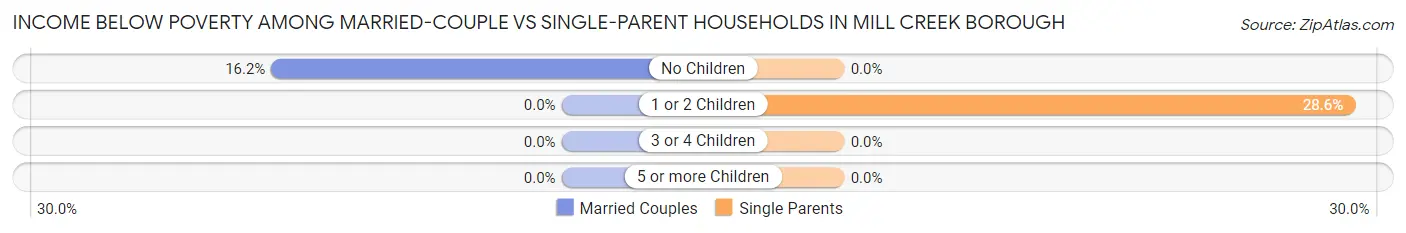
Income Below Poverty Among Married-Couple vs Single-Parent Households in Mill Creek borough
The poverty data for Mill Creek borough shows that 6 of the married-couple family households (11.1%) and 2 of the single-parent households (28.6%) are living below the poverty level. Within the married-couple family households, those with no children have the highest poverty rate, with 6 households (16.2%) falling below the poverty line. Among the single-parent households, those with 1 or 2 children have the highest poverty rate, with 2 household (28.6%) living below poverty.
| Children | Married-Couple Families | Single-Parent Households |
| No Children | 6 (16.2%) | 0 (0.0%) |
| 1 or 2 Children | 0 (0.0%) | 2 (28.6%) |
| 3 or 4 Children | 0 (0.0%) | 0 (0.0%) |
| 5 or more Children | 0 (0.0%) | 0 (0.0%) |
| Total | 6 (11.1%) | 2 (28.6%) |
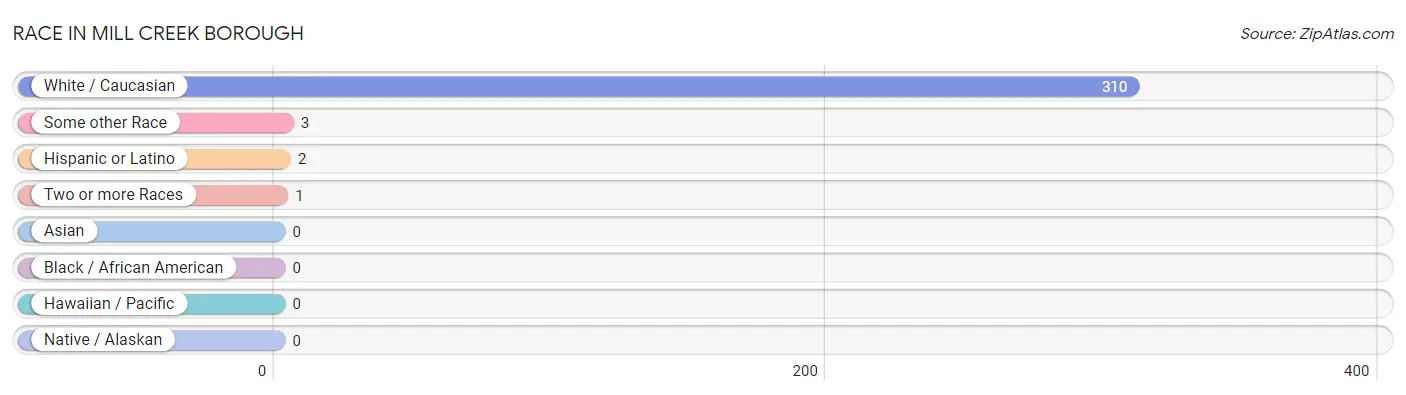
Race in Mill Creek borough
The most populous races in Mill Creek borough are White / Caucasian (310 | 98.7%), Some other Race (3 | 1.0%), and Hispanic or Latino (2 | 0.6%).
| Race | # Population | % Population |
| Asian | 0 | 0.0% |
| Black / African American | 0 | 0.0% |
| Hawaiian / Pacific | 0 | 0.0% |
| Hispanic or Latino | 2 | 0.6% |
| Native / Alaskan | 0 | 0.0% |
| White / Caucasian | 310 | 98.7% |
| Two or more Races | 1 | 0.3% |
| Some other Race | 3 | 1.0% |
| Total | 314 | 100.0% |
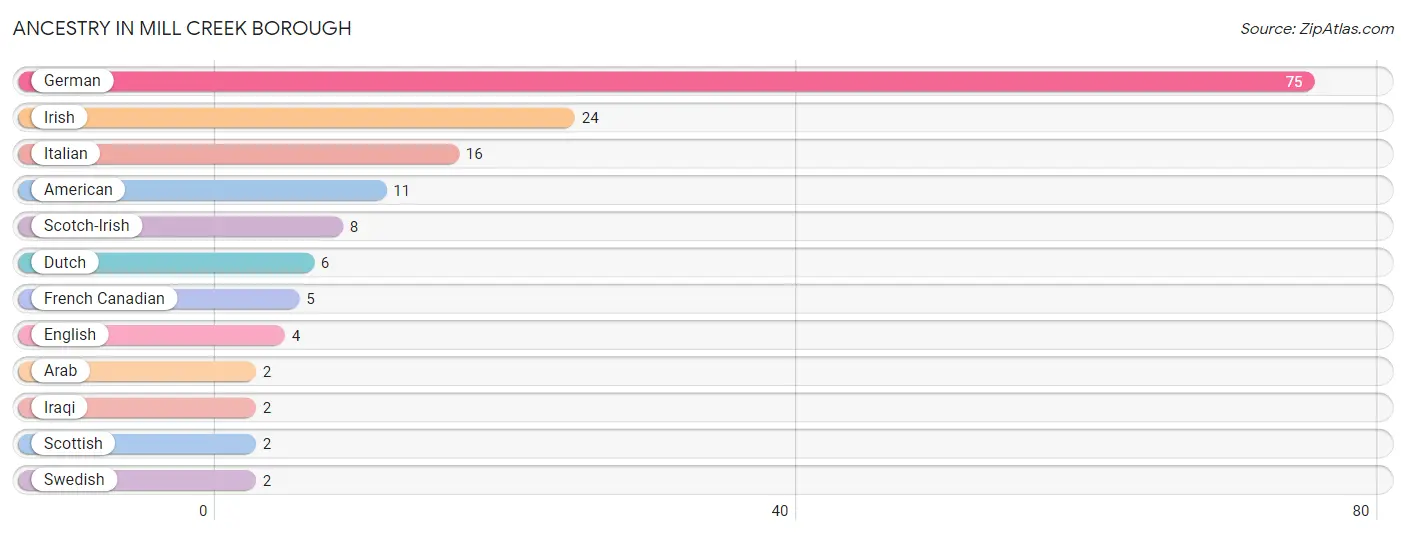
Ancestry in Mill Creek borough
The most populous ancestries reported in Mill Creek borough are German (75 | 23.9%), Irish (24 | 7.6%), Italian (16 | 5.1%), American (11 | 3.5%), and Scotch-Irish (8 | 2.5%), together accounting for 42.7% of all Mill Creek borough residents.
| Ancestry | # Population | % Population |
| American | 11 | 3.5% |
| Arab | 2 | 0.6% |
| Dutch | 6 | 1.9% |
| English | 4 | 1.3% |
| French Canadian | 5 | 1.6% |
| German | 75 | 23.9% |
| Iraqi | 2 | 0.6% |
| Irish | 24 | 7.6% |
| Italian | 16 | 5.1% |
| Scotch-Irish | 8 | 2.5% |
| Scottish | 2 | 0.6% |
| Swedish | 2 | 0.6% | View All 12 Rows |
Immigrants in Mill Creek borough

| Immigration Origin | # Population | % Population | View All 0 Rows |
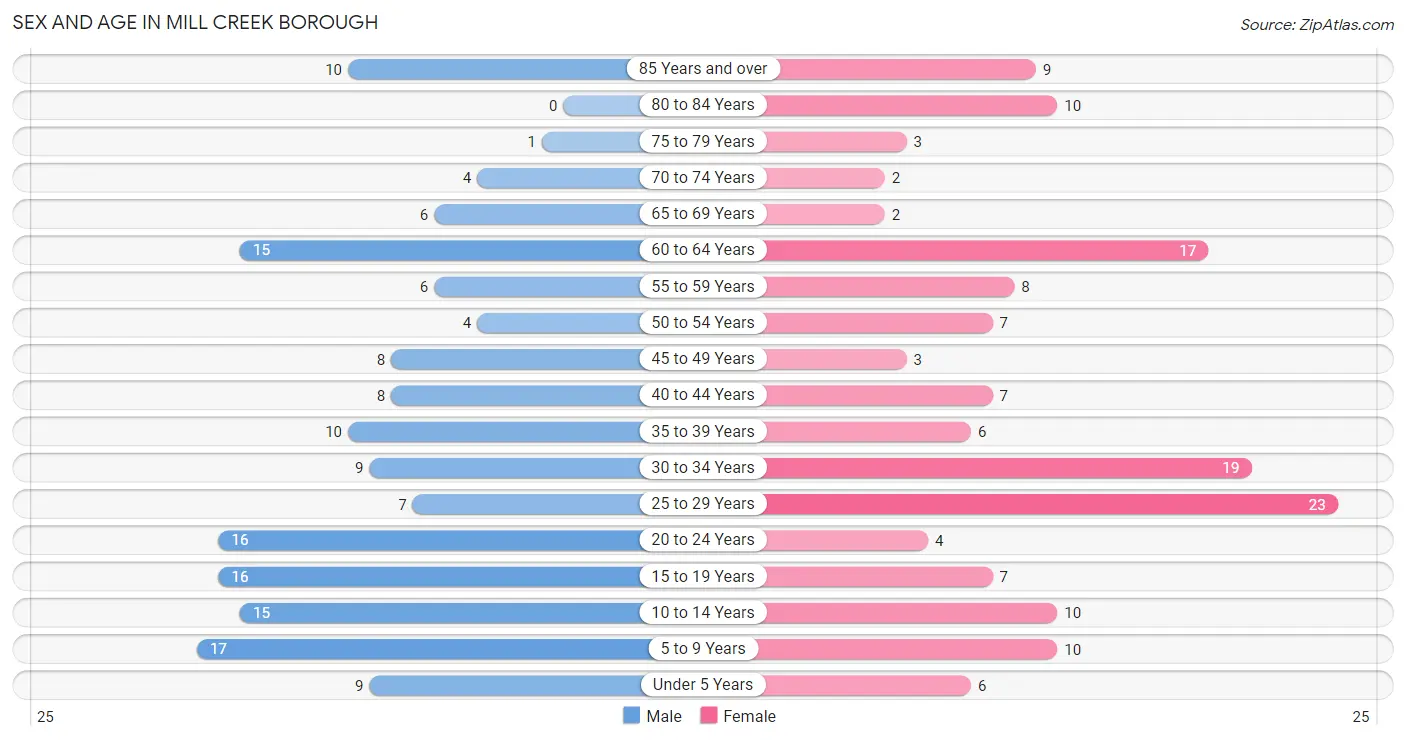
Sex and Age in Mill Creek borough
Sex and Age in Mill Creek borough
The most populous age groups in Mill Creek borough are 5 to 9 Years (17 | 10.6%) for men and 25 to 29 Years (23 | 15.0%) for women.
| Age Bracket | Male | Female |
| Under 5 Years | 9 (5.6%) | 6 (3.9%) |
| 5 to 9 Years | 17 (10.6%) | 10 (6.5%) |
| 10 to 14 Years | 15 (9.3%) | 10 (6.5%) |
| 15 to 19 Years | 16 (9.9%) | 7 (4.6%) |
| 20 to 24 Years | 16 (9.9%) | 4 (2.6%) |
| 25 to 29 Years | 7 (4.3%) | 23 (15.0%) |
| 30 to 34 Years | 9 (5.6%) | 19 (12.4%) |
| 35 to 39 Years | 10 (6.2%) | 6 (3.9%) |
| 40 to 44 Years | 8 (5.0%) | 7 (4.6%) |
| 45 to 49 Years | 8 (5.0%) | 3 (2.0%) |
| 50 to 54 Years | 4 (2.5%) | 7 (4.6%) |
| 55 to 59 Years | 6 (3.7%) | 8 (5.2%) |
| 60 to 64 Years | 15 (9.3%) | 17 (11.1%) |
| 65 to 69 Years | 6 (3.7%) | 2 (1.3%) |
| 70 to 74 Years | 4 (2.5%) | 2 (1.3%) |
| 75 to 79 Years | 1 (0.6%) | 3 (2.0%) |
| 80 to 84 Years | 0 (0.0%) | 10 (6.5%) |
| 85 Years and over | 10 (6.2%) | 9 (5.9%) |
| Total | 161 (100.0%) | 153 (100.0%) |
Families and Households in Mill Creek borough
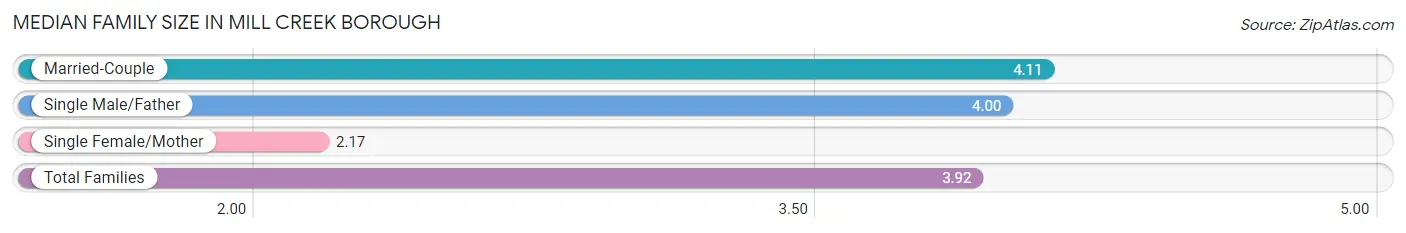
Median Family Size in Mill Creek borough
The median family size in Mill Creek borough is 3.92 persons per family, with married-couple families (54 | 88.5%) accounting for the largest median family size of 4.11 persons per family. On the other hand, single female/mother families (6 | 9.8%) represent the smallest median family size with 2.17 persons per family.
| Family Type | # Families | Family Size |
| Married-Couple | 54 (88.5%) | 4.11 |
| Single Male/Father | 1 (1.6%) | 4.00 |
| Single Female/Mother | 6 (9.8%) | 2.17 |
| Total Families | 61 (100.0%) | 3.92 |
Median Household Size in Mill Creek borough
The median household size in Mill Creek borough is 2.75 persons per household, with married-couple households (54 | 47.4%) accounting for the largest median household size of 4.39 persons per household. non-family households (53 | 46.5%) represent the smallest median household size with 1.13 persons per household.
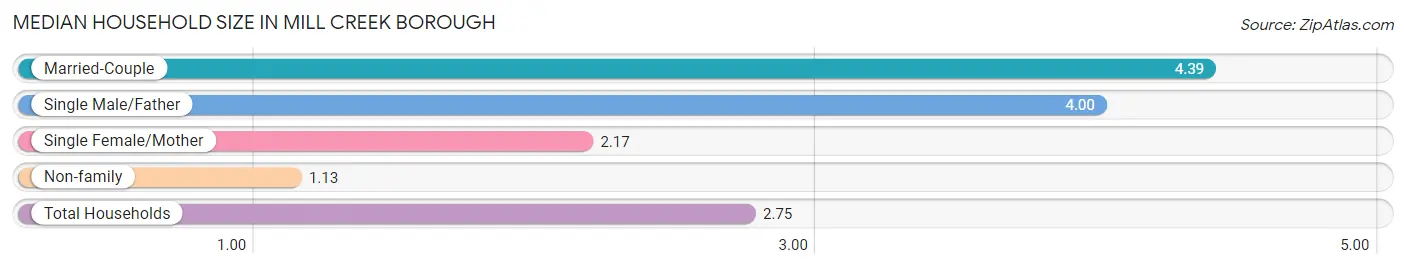
| Household Type | # Households | Household Size |
| Married-Couple | 54 (47.4%) | 4.39 |
| Single Male/Father | 1 (0.9%) | 4.00 |
| Single Female/Mother | 6 (5.3%) | 2.17 |
| Non-family | 53 (46.5%) | 1.13 |
| Total Households | 114 (100.0%) | 2.75 |
Household Size by Marriage Status in Mill Creek borough
Out of a total of 114 households in Mill Creek borough, 61 (53.5%) are family households, while 53 (46.5%) are nonfamily households. The most numerous type of family households are 2-person households, comprising 28, and the most common type of nonfamily households are 1-person households, comprising 46.
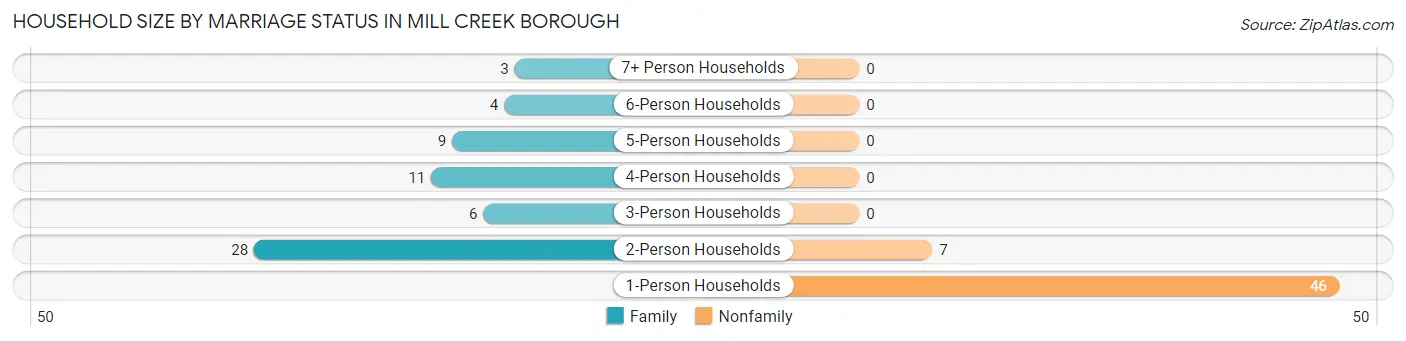
| Household Size | Family Households | Nonfamily Households |
| 1-Person Households | - | 46 (40.4%) |
| 2-Person Households | 28 (24.6%) | 7 (6.1%) |
| 3-Person Households | 6 (5.3%) | 0 (0.0%) |
| 4-Person Households | 11 (9.7%) | 0 (0.0%) |
| 5-Person Households | 9 (7.9%) | 0 (0.0%) |
| 6-Person Households | 4 (3.5%) | 0 (0.0%) |
| 7+ Person Households | 3 (2.6%) | 0 (0.0%) |
| Total | 61 (53.5%) | 53 (46.5%) |
Female Fertility in Mill Creek borough
Fertility by Age in Mill Creek borough
| Age Bracket | Women with Births | Births / 1,000 Women |
| 15 to 19 years | 0 (0.0%) | 0.0 |
| 20 to 34 years | 0 (0.0%) | 0.0 |
| 35 to 50 years | 0 (0.0%) | 0.0 |
| Total | 0 (0.0%) | 0.0 |
Fertility by Age by Marriage Status in Mill Creek borough
| Age Bracket | Married | Unmarried |
| 15 to 19 years | 0 (0.0%) | 0 (0.0%) |
| 20 to 34 years | 0 (0.0%) | 0 (0.0%) |
| 35 to 50 years | 0 (0.0%) | 0 (0.0%) |
| Total | 0 (0.0%) | 0 (0.0%) |
Fertility by Education in Mill Creek borough
| Educational Attainment | Women with Births | Births / 1,000 Women |
| Less than High School | 0 (0.0%) | 0.0 |
| High School Diploma | 0 (0.0%) | 0.0 |
| College or Associate's Degree | 0 (0.0%) | 0.0 |
| Bachelor's Degree | 0 (0.0%) | 0.0 |
| Graduate Degree | 0 (0.0%) | 0.0 |
| Total | 0 (0.0%) | 0.0 |
Fertility by Education by Marriage Status in Mill Creek borough
| Educational Attainment | Married | Unmarried |
| Less than High School | 0 (0.0%) | 0 (0.0%) |
| High School Diploma | 0 (0.0%) | 0 (0.0%) |
| College or Associate's Degree | 0 (0.0%) | 0 (0.0%) |
| Bachelor's Degree | 0 (0.0%) | 0 (0.0%) |
| Graduate Degree | 0 (0.0%) | 0 (0.0%) |
| Total | 0 (0.0%) | 0 (0.0%) |
Employment Characteristics in Mill Creek borough
Employment by Class of Employer in Mill Creek borough
Among the 141 employed individuals in Mill Creek borough, private company employees (101 | 71.6%), state government employees (13 | 9.2%), and local government employees (10 | 7.1%) make up the most common classes of employment.
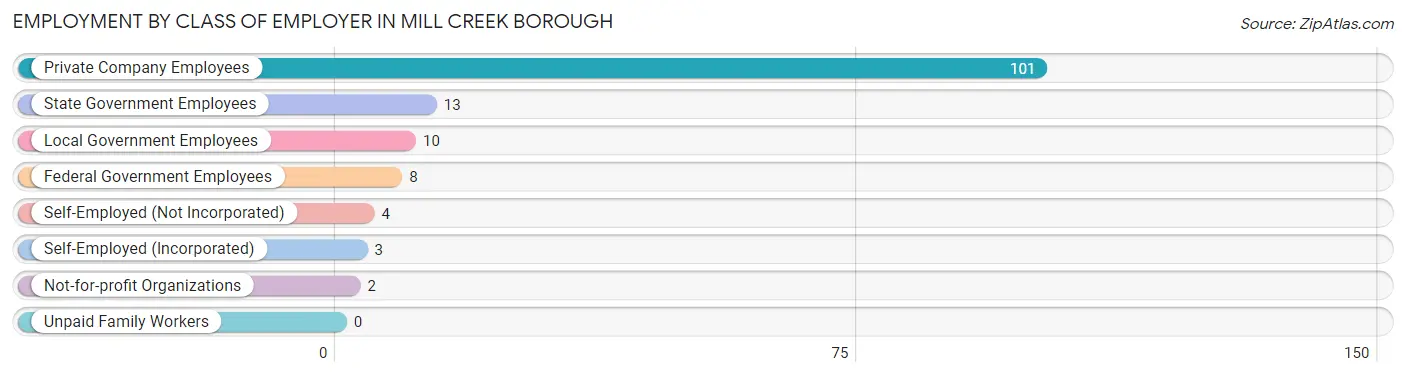
| Employer Class | # Employees | % Employees |
| Private Company Employees | 101 | 71.6% |
| Self-Employed (Incorporated) | 3 | 2.1% |
| Self-Employed (Not Incorporated) | 4 | 2.8% |
| Not-for-profit Organizations | 2 | 1.4% |
| Local Government Employees | 10 | 7.1% |
| State Government Employees | 13 | 9.2% |
| Federal Government Employees | 8 | 5.7% |
| Unpaid Family Workers | 0 | 0.0% |
| Total | 141 | 100.0% |
Employment Status by Age in Mill Creek borough
According to the labor force statistics for Mill Creek borough, out of the total population over 16 years of age (242), 64.5% or 156 individuals are in the labor force, with 3.8% or 6 of them unemployed. The age group with the highest labor force participation rate is 16 to 19 years, with 100.0% or 18 individuals in the labor force. Within the labor force, the 20 to 24 years age range has the highest percentage of unemployed individuals, with 20.0% or 4 of them being unemployed.
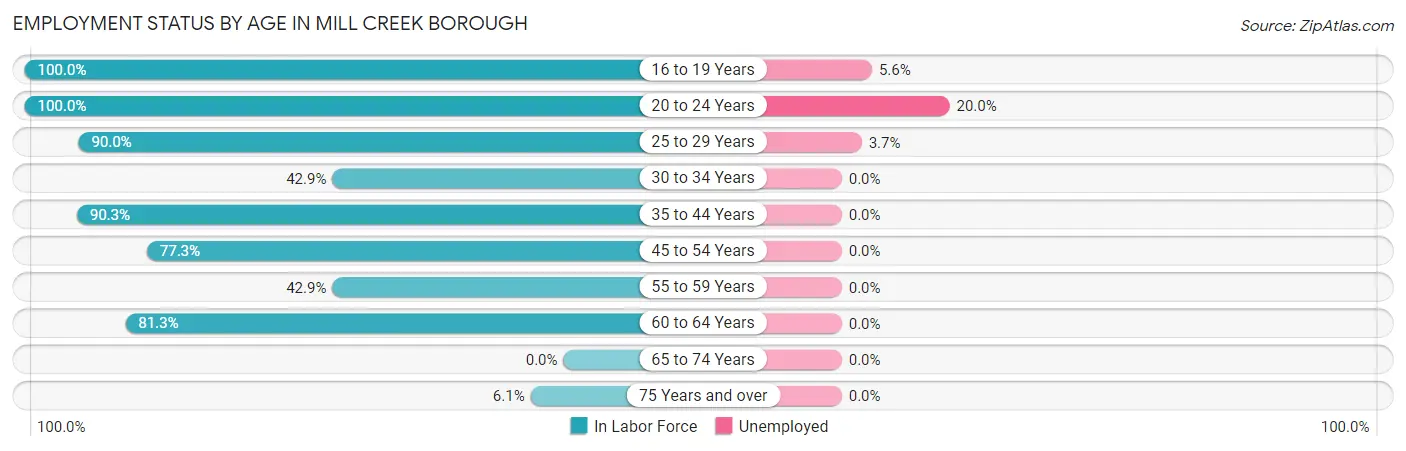
| Age Bracket | In Labor Force | Unemployed |
| 16 to 19 Years | 18 (100.0%) | 1 (5.6%) |
| 20 to 24 Years | 20 (100.0%) | 4 (20.0%) |
| 25 to 29 Years | 27 (90.0%) | 1 (3.7%) |
| 30 to 34 Years | 12 (42.9%) | 0 (0.0%) |
| 35 to 44 Years | 28 (90.3%) | 0 (0.0%) |
| 45 to 54 Years | 17 (77.3%) | 0 (0.0%) |
| 55 to 59 Years | 6 (42.9%) | 0 (0.0%) |
| 60 to 64 Years | 26 (81.3%) | 0 (0.0%) |
| 65 to 74 Years | 0 (0.0%) | 0 (0.0%) |
| 75 Years and over | 2 (6.1%) | 0 (0.0%) |
| Total | 156 (64.5%) | 6 (3.8%) |
Employment Status by Educational Attainment in Mill Creek borough
According to labor force statistics for Mill Creek borough, 73.9% of individuals (116) out of the total population between 25 and 64 years of age (157) are in the labor force, with 0.9% or 1 of them being unemployed. The group with the highest labor force participation rate are those with the educational attainment of college / associate degree, with 100.0% or 37 individuals in the labor force. Within the labor force, individuals with high school diploma education have the highest percentage of unemployment, with 1.7% or 1 of them being unemployed.
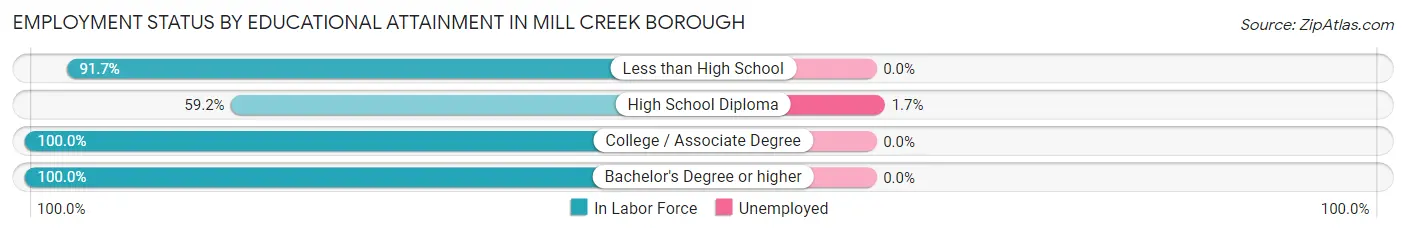
| Educational Attainment | In Labor Force | Unemployed |
| Less than High School | 11 (91.7%) | 0 (0.0%) |
| High School Diploma | 58 (59.2%) | 2 (1.7%) |
| College / Associate Degree | 37 (100.0%) | 0 (0.0%) |
| Bachelor's Degree or higher | 10 (100.0%) | 0 (0.0%) |
| Total | 116 (73.9%) | 1 (0.9%) |
Employment Occupations by Sex in Mill Creek borough
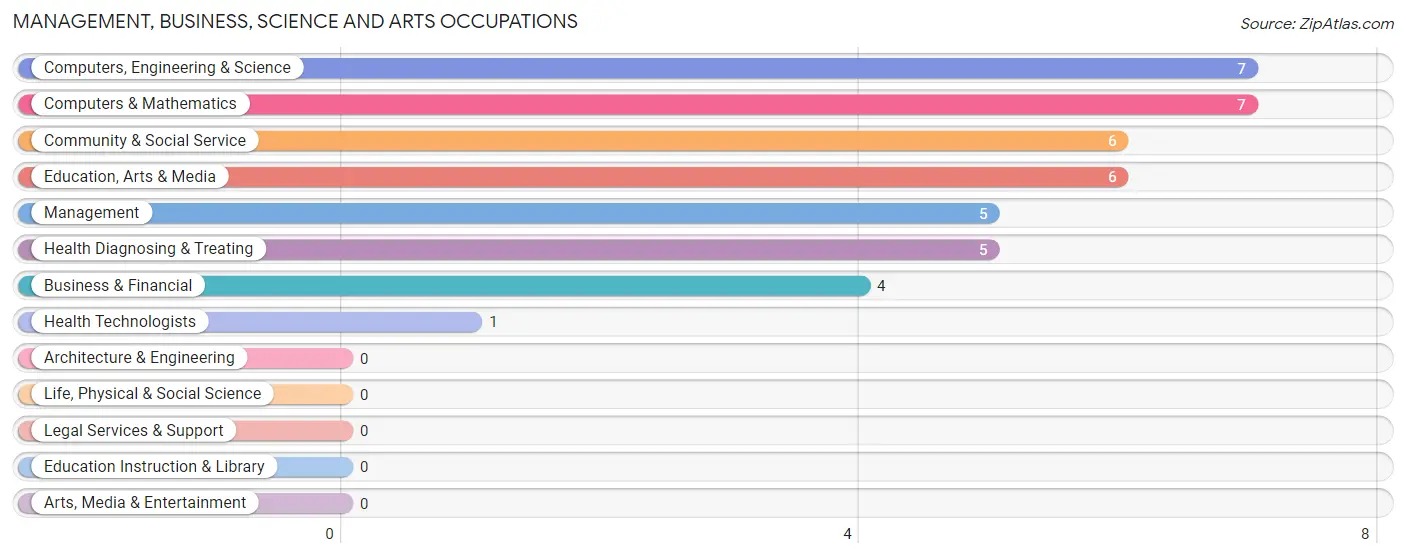
Management, Business, Science and Arts Occupations
The most common Management, Business, Science and Arts occupations in Mill Creek borough are Computers, Engineering & Science (7 | 4.7%), Computers & Mathematics (7 | 4.7%), Community & Social Service (6 | 4.0%), Education, Arts & Media (6 | 4.0%), and Management (5 | 3.3%).
Management, Business, Science and Arts Occupations by Sex
Within the Management, Business, Science and Arts occupations in Mill Creek borough, the most male-oriented occupations are Computers, Engineering & Science (100.0%), and Computers & Mathematics (100.0%), while the most female-oriented occupations are Management (100.0%), Business & Financial (100.0%), and Community & Social Service (100.0%).
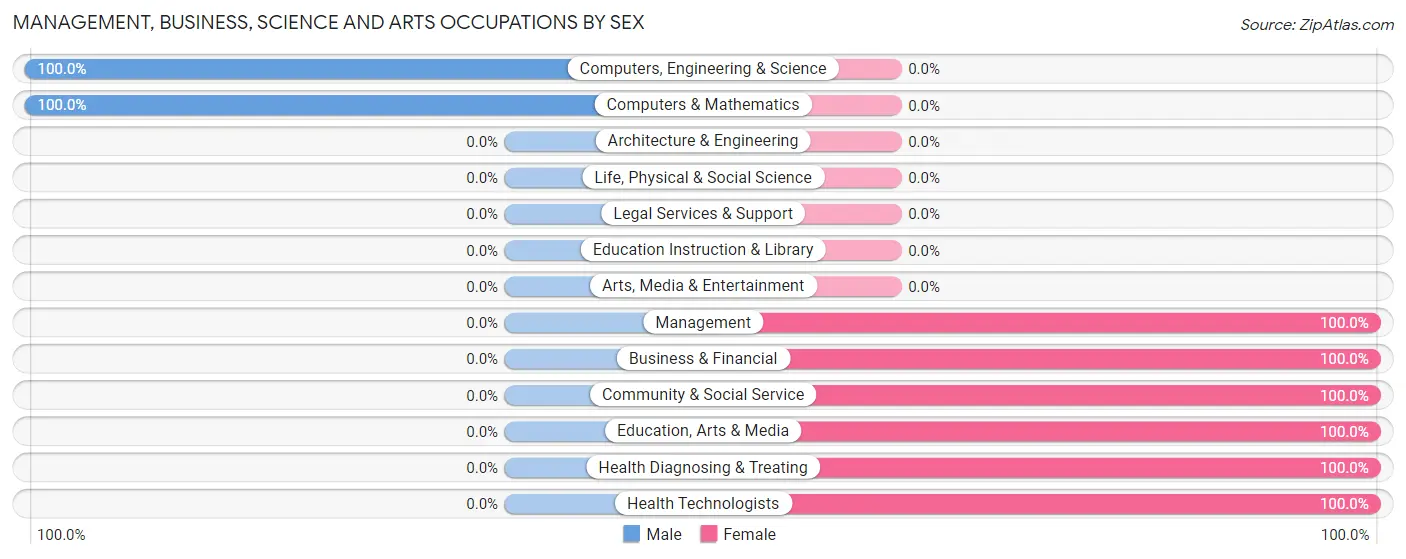
| Occupation | Male | Female |
| Management | 0 (0.0%) | 5 (100.0%) |
| Business & Financial | 0 (0.0%) | 4 (100.0%) |
| Computers, Engineering & Science | 7 (100.0%) | 0 (0.0%) |
| Computers & Mathematics | 7 (100.0%) | 0 (0.0%) |
| Architecture & Engineering | 0 (0.0%) | 0 (0.0%) |
| Life, Physical & Social Science | 0 (0.0%) | 0 (0.0%) |
| Community & Social Service | 0 (0.0%) | 6 (100.0%) |
| Education, Arts & Media | 0 (0.0%) | 6 (100.0%) |
| Legal Services & Support | 0 (0.0%) | 0 (0.0%) |
| Education Instruction & Library | 0 (0.0%) | 0 (0.0%) |
| Arts, Media & Entertainment | 0 (0.0%) | 0 (0.0%) |
| Health Diagnosing & Treating | 0 (0.0%) | 5 (100.0%) |
| Health Technologists | 0 (0.0%) | 1 (100.0%) |
| Total (Category) | 7 (25.9%) | 20 (74.1%) |
| Total (Overall) | 75 (50.0%) | 75 (50.0%) |
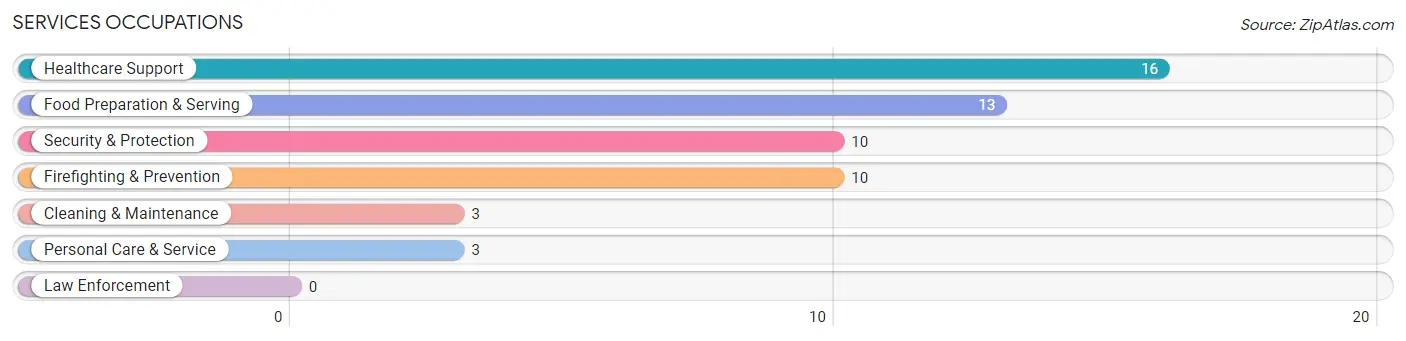
Services Occupations
The most common Services occupations in Mill Creek borough are Healthcare Support (16 | 10.7%), Food Preparation & Serving (13 | 8.7%), Security & Protection (10 | 6.7%), Firefighting & Prevention (10 | 6.7%), and Cleaning & Maintenance (3 | 2.0%).
Services Occupations by Sex
Within the Services occupations in Mill Creek borough, the most male-oriented occupations are Cleaning & Maintenance (100.0%), Security & Protection (20.0%), and Firefighting & Prevention (20.0%), while the most female-oriented occupations are Healthcare Support (100.0%), Food Preparation & Serving (100.0%), and Personal Care & Service (100.0%).
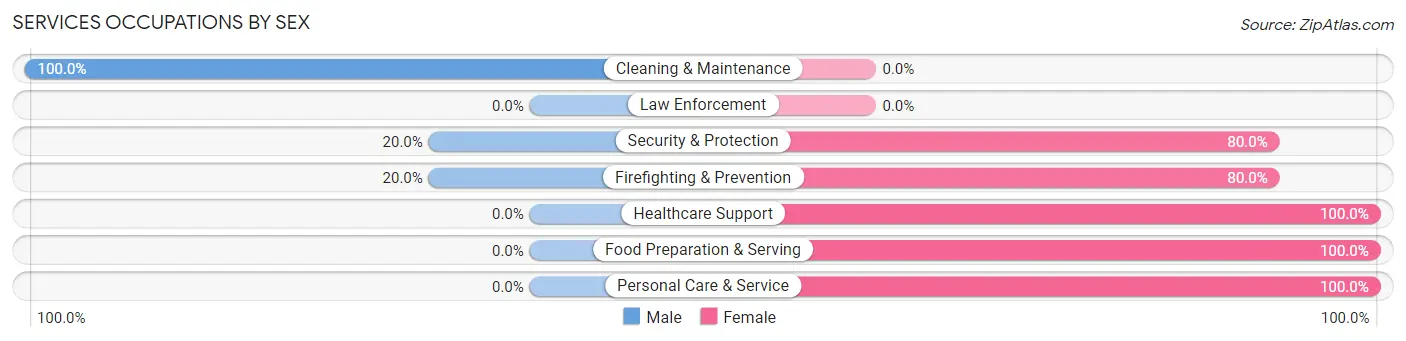
| Occupation | Male | Female |
| Healthcare Support | 0 (0.0%) | 16 (100.0%) |
| Security & Protection | 2 (20.0%) | 8 (80.0%) |
| Firefighting & Prevention | 2 (20.0%) | 8 (80.0%) |
| Law Enforcement | 0 (0.0%) | 0 (0.0%) |
| Food Preparation & Serving | 0 (0.0%) | 13 (100.0%) |
| Cleaning & Maintenance | 3 (100.0%) | 0 (0.0%) |
| Personal Care & Service | 0 (0.0%) | 3 (100.0%) |
| Total (Category) | 5 (11.1%) | 40 (88.9%) |
| Total (Overall) | 75 (50.0%) | 75 (50.0%) |
Sales and Office Occupations
The most common Sales and Office occupations in Mill Creek borough are Sales & Related (14 | 9.3%), and Office & Administration (6 | 4.0%).
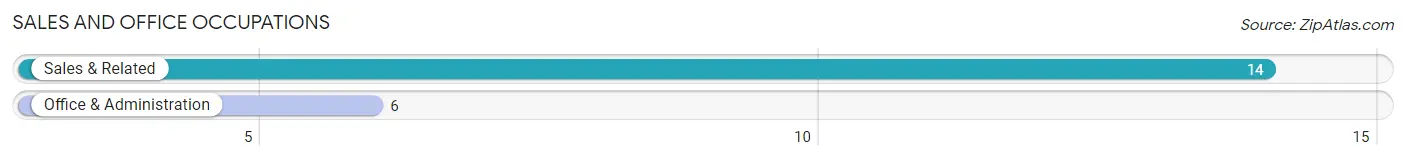
Sales and Office Occupations by Sex

| Occupation | Male | Female |
| Sales & Related | 5 (35.7%) | 9 (64.3%) |
| Office & Administration | 0 (0.0%) | 6 (100.0%) |
| Total (Category) | 5 (25.0%) | 15 (75.0%) |
| Total (Overall) | 75 (50.0%) | 75 (50.0%) |
Natural Resources, Construction and Maintenance Occupations
The most common Natural Resources, Construction and Maintenance occupations in Mill Creek borough are Construction & Extraction (13 | 8.7%), Installation, Maintenance & Repair (8 | 5.3%), and Farming, Fishing & Forestry (2 | 1.3%).

Natural Resources, Construction and Maintenance Occupations by Sex

| Occupation | Male | Female |
| Farming, Fishing & Forestry | 2 (100.0%) | 0 (0.0%) |
| Construction & Extraction | 13 (100.0%) | 0 (0.0%) |
| Installation, Maintenance & Repair | 8 (100.0%) | 0 (0.0%) |
| Total (Category) | 23 (100.0%) | 0 (0.0%) |
| Total (Overall) | 75 (50.0%) | 75 (50.0%) |
Production, Transportation and Moving Occupations
The most common Production, Transportation and Moving occupations in Mill Creek borough are Material Moving (26 | 17.3%), and Transportation (9 | 6.0%).
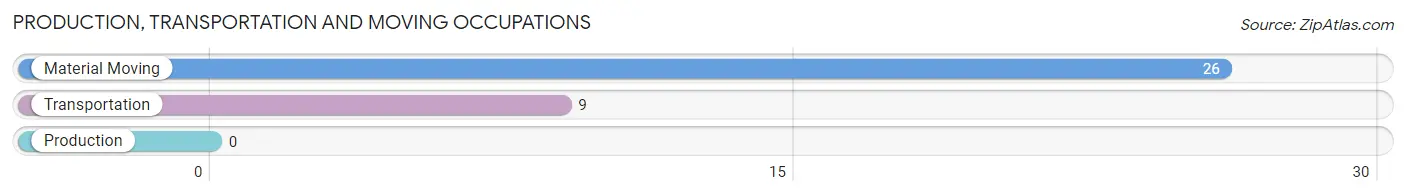
Production, Transportation and Moving Occupations by Sex
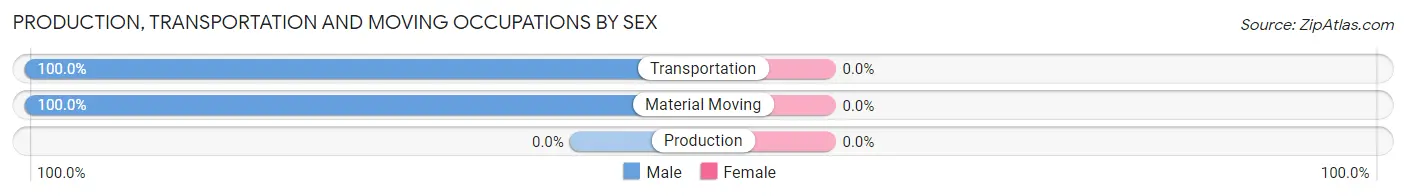
| Occupation | Male | Female |
| Production | 0 (0.0%) | 0 (0.0%) |
| Transportation | 9 (100.0%) | 0 (0.0%) |
| Material Moving | 26 (100.0%) | 0 (0.0%) |
| Total (Category) | 35 (100.0%) | 0 (0.0%) |
| Total (Overall) | 75 (50.0%) | 75 (50.0%) |
Employment Industries by Sex in Mill Creek borough
Employment Industries in Mill Creek borough
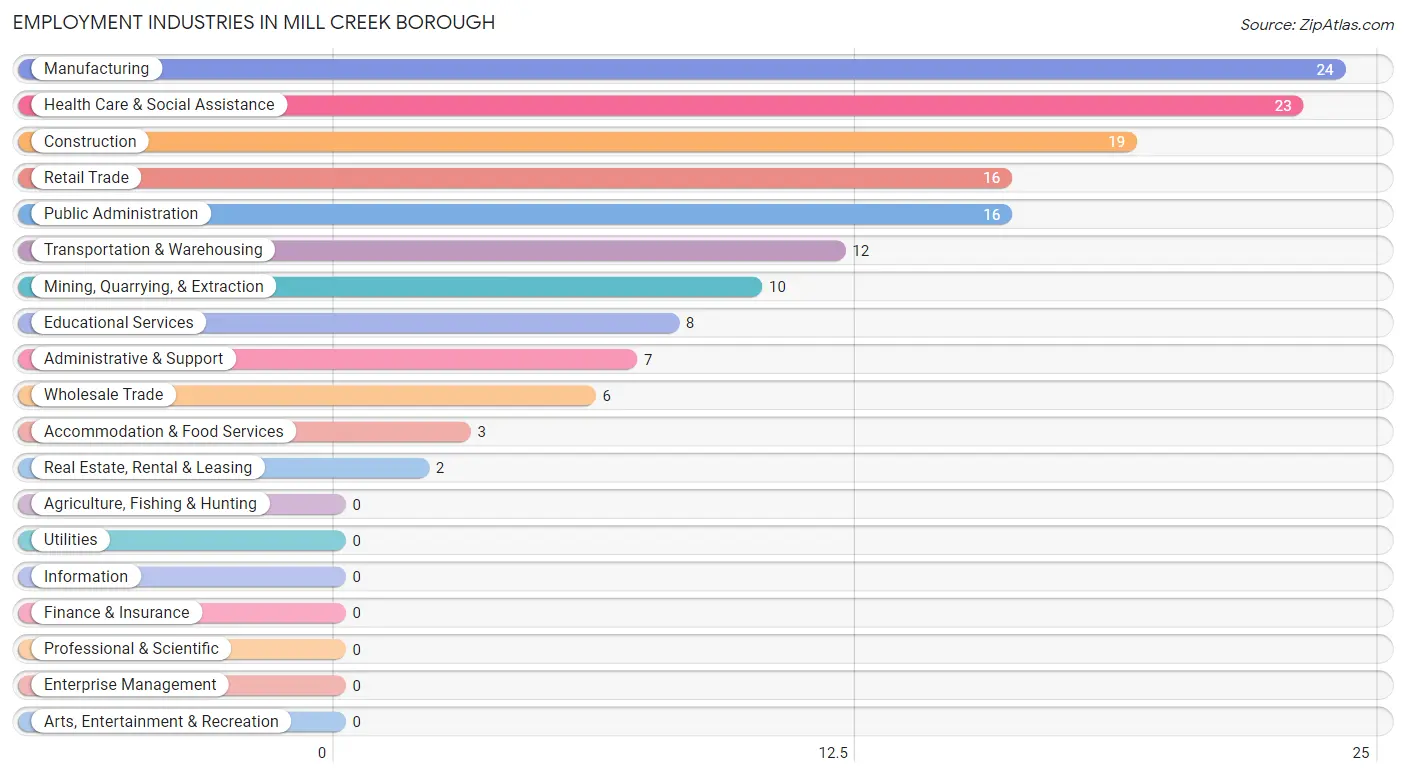
The major employment industries in Mill Creek borough include Manufacturing (24 | 16.0%), Health Care & Social Assistance (23 | 15.3%), Construction (19 | 12.7%), Retail Trade (16 | 10.7%), and Public Administration (16 | 10.7%).
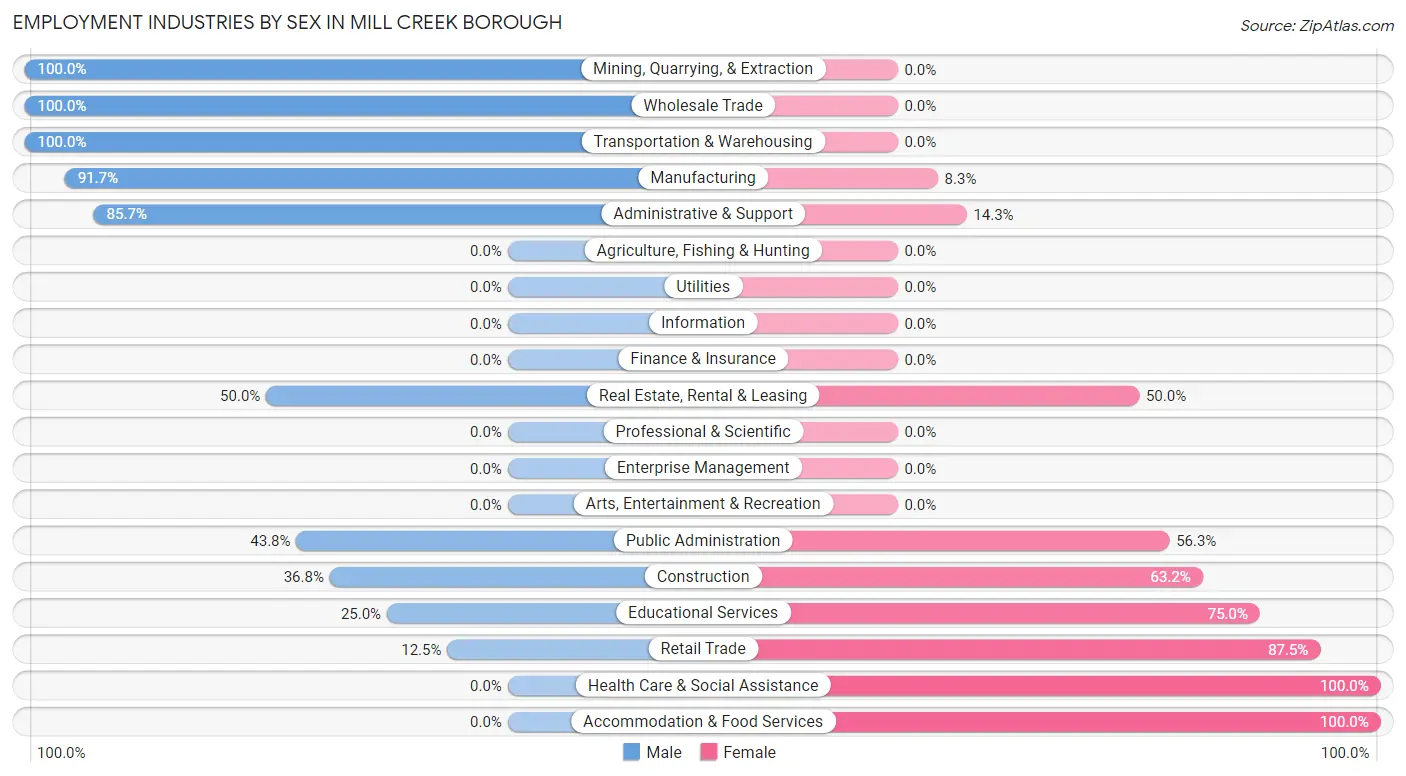
Employment Industries by Sex in Mill Creek borough
The Mill Creek borough industries that see more men than women are Mining, Quarrying, & Extraction (100.0%), Wholesale Trade (100.0%), and Transportation & Warehousing (100.0%), whereas the industries that tend to have a higher number of women are Health Care & Social Assistance (100.0%), Accommodation & Food Services (100.0%), and Retail Trade (87.5%).
| Industry | Male | Female |
| Agriculture, Fishing & Hunting | 0 (0.0%) | 0 (0.0%) |
| Mining, Quarrying, & Extraction | 10 (100.0%) | 0 (0.0%) |
| Construction | 7 (36.8%) | 12 (63.2%) |
| Manufacturing | 22 (91.7%) | 2 (8.3%) |
| Wholesale Trade | 6 (100.0%) | 0 (0.0%) |
| Retail Trade | 2 (12.5%) | 14 (87.5%) |
| Transportation & Warehousing | 12 (100.0%) | 0 (0.0%) |
| Utilities | 0 (0.0%) | 0 (0.0%) |
| Information | 0 (0.0%) | 0 (0.0%) |
| Finance & Insurance | 0 (0.0%) | 0 (0.0%) |
| Real Estate, Rental & Leasing | 1 (50.0%) | 1 (50.0%) |
| Professional & Scientific | 0 (0.0%) | 0 (0.0%) |
| Enterprise Management | 0 (0.0%) | 0 (0.0%) |
| Administrative & Support | 6 (85.7%) | 1 (14.3%) |
| Educational Services | 2 (25.0%) | 6 (75.0%) |
| Health Care & Social Assistance | 0 (0.0%) | 23 (100.0%) |
| Arts, Entertainment & Recreation | 0 (0.0%) | 0 (0.0%) |
| Accommodation & Food Services | 0 (0.0%) | 3 (100.0%) |
| Public Administration | 7 (43.8%) | 9 (56.2%) |
| Total | 75 (50.0%) | 75 (50.0%) |
Education in Mill Creek borough
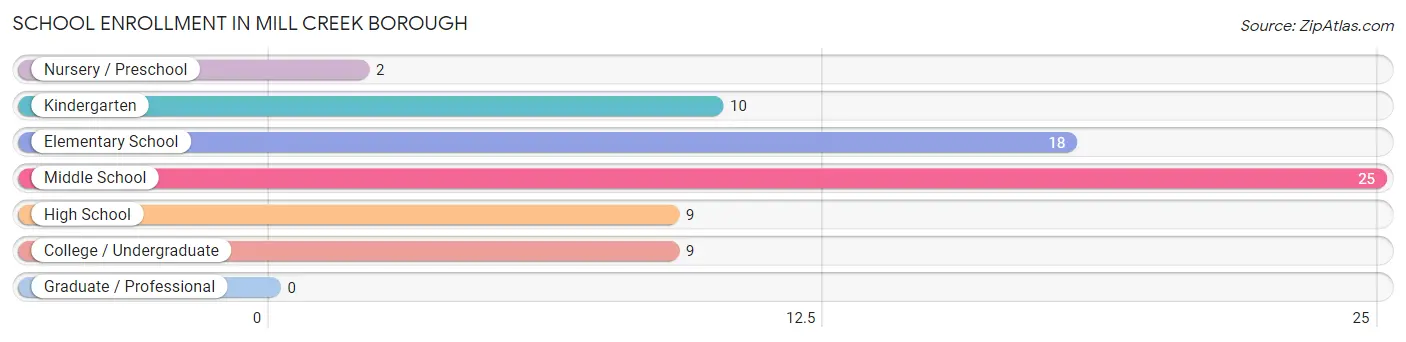
School Enrollment in Mill Creek borough
The most common levels of schooling among the 73 students in Mill Creek borough are middle school (25 | 34.3%), elementary school (18 | 24.7%), and kindergarten (10 | 13.7%).
| School Level | # Students | % Students |
| Nursery / Preschool | 2 | 2.7% |
| Kindergarten | 10 | 13.7% |
| Elementary School | 18 | 24.7% |
| Middle School | 25 | 34.3% |
| High School | 9 | 12.3% |
| College / Undergraduate | 9 | 12.3% |
| Graduate / Professional | 0 | 0.0% |
| Total | 73 | 100.0% |
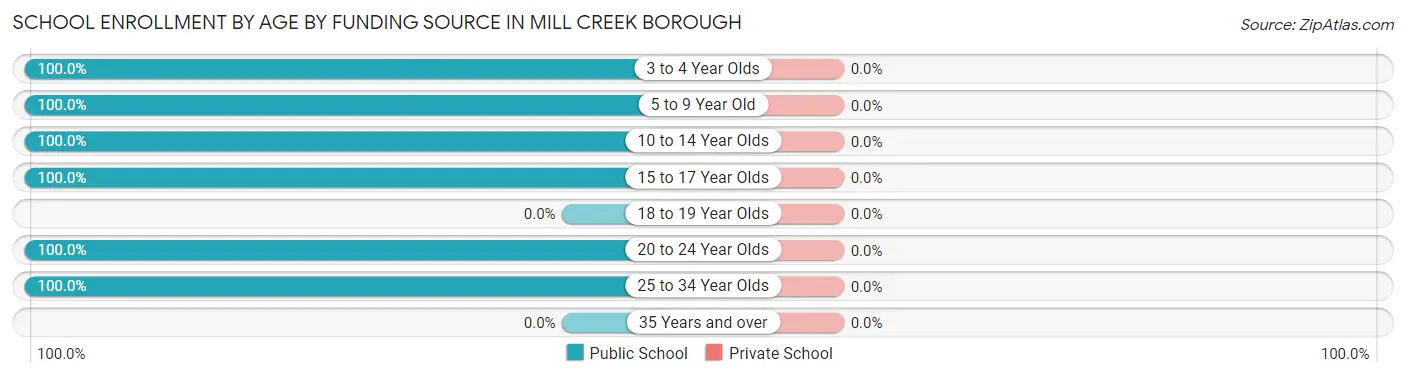
School Enrollment by Age by Funding Source in Mill Creek borough
| Age Bracket | Public School | Private School |
| 3 to 4 Year Olds | 2 (100.0%) | 0 (0.0%) |
| 5 to 9 Year Old | 27 (100.0%) | 0 (0.0%) |
| 10 to 14 Year Olds | 25 (100.0%) | 0 (0.0%) |
| 15 to 17 Year Olds | 10 (100.0%) | 0 (0.0%) |
| 18 to 19 Year Olds | 0 (0.0%) | 0 (0.0%) |
| 20 to 24 Year Olds | 4 (100.0%) | 0 (0.0%) |
| 25 to 34 Year Olds | 5 (100.0%) | 0 (0.0%) |
| 35 Years and over | 0 (0.0%) | 0 (0.0%) |
| Total | 73 (100.0%) | 0 (0.0%) |
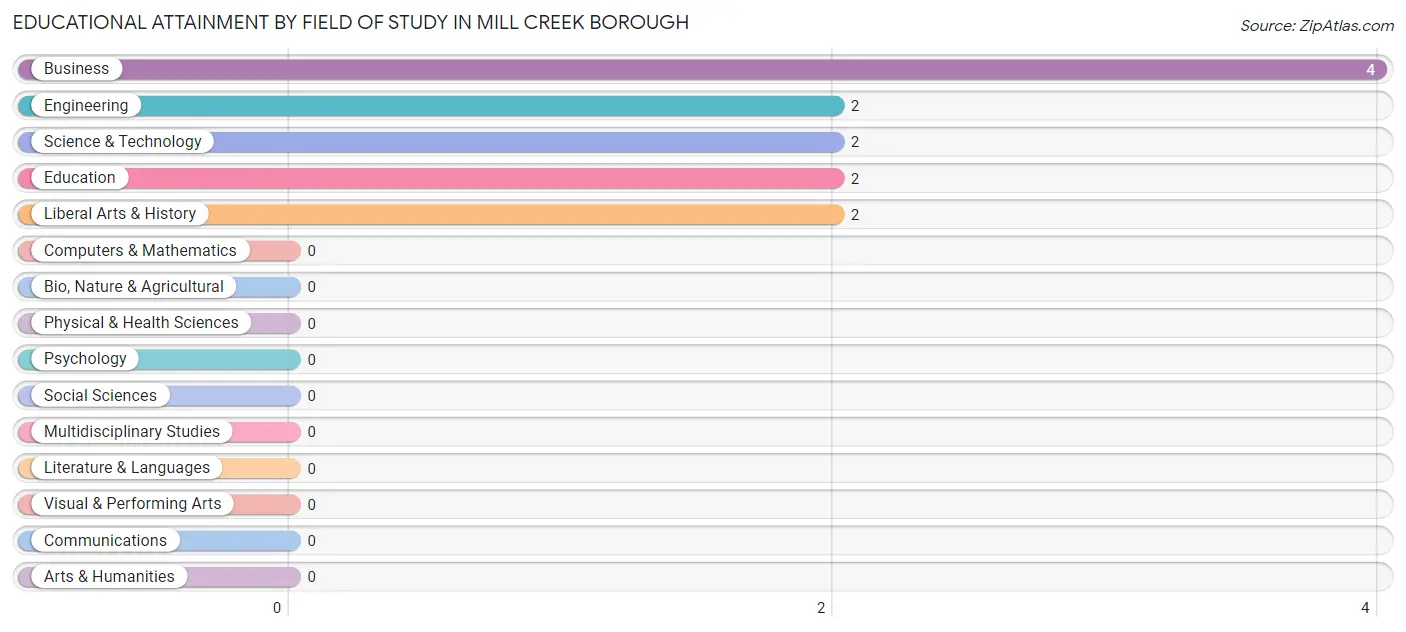
Educational Attainment by Field of Study in Mill Creek borough
Business (4 | 33.3%), engineering (2 | 16.7%), science & technology (2 | 16.7%), education (2 | 16.7%), and liberal arts & history (2 | 16.7%) are the most common fields of study among 12 individuals in Mill Creek borough who have obtained a bachelor's degree or higher.
| Field of Study | # Graduates | % Graduates |
| Computers & Mathematics | 0 | 0.0% |
| Bio, Nature & Agricultural | 0 | 0.0% |
| Physical & Health Sciences | 0 | 0.0% |
| Psychology | 0 | 0.0% |
| Social Sciences | 0 | 0.0% |
| Engineering | 2 | 16.7% |
| Multidisciplinary Studies | 0 | 0.0% |
| Science & Technology | 2 | 16.7% |
| Business | 4 | 33.3% |
| Education | 2 | 16.7% |
| Literature & Languages | 0 | 0.0% |
| Liberal Arts & History | 2 | 16.7% |
| Visual & Performing Arts | 0 | 0.0% |
| Communications | 0 | 0.0% |
| Arts & Humanities | 0 | 0.0% |
| Total | 12 | 100.0% |
Transportation & Commute in Mill Creek borough
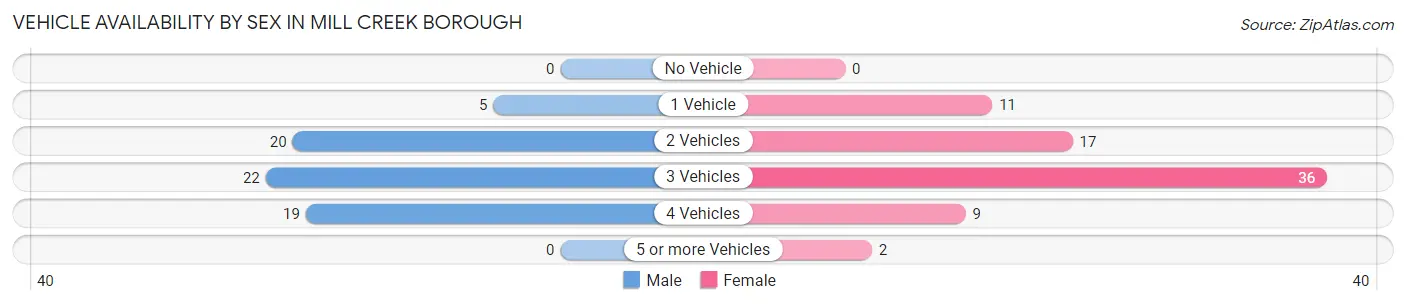
Vehicle Availability by Sex in Mill Creek borough
The most prevalent vehicle ownership categories in Mill Creek borough are males with 3 vehicles (22, accounting for 33.3%) and females with 3 vehicles (36, making up 29.3%).
| Vehicles Available | Male | Female |
| No Vehicle | 0 (0.0%) | 0 (0.0%) |
| 1 Vehicle | 5 (7.6%) | 11 (14.7%) |
| 2 Vehicles | 20 (30.3%) | 17 (22.7%) |
| 3 Vehicles | 22 (33.3%) | 36 (48.0%) |
| 4 Vehicles | 19 (28.8%) | 9 (12.0%) |
| 5 or more Vehicles | 0 (0.0%) | 2 (2.7%) |
| Total | 66 (100.0%) | 75 (100.0%) |
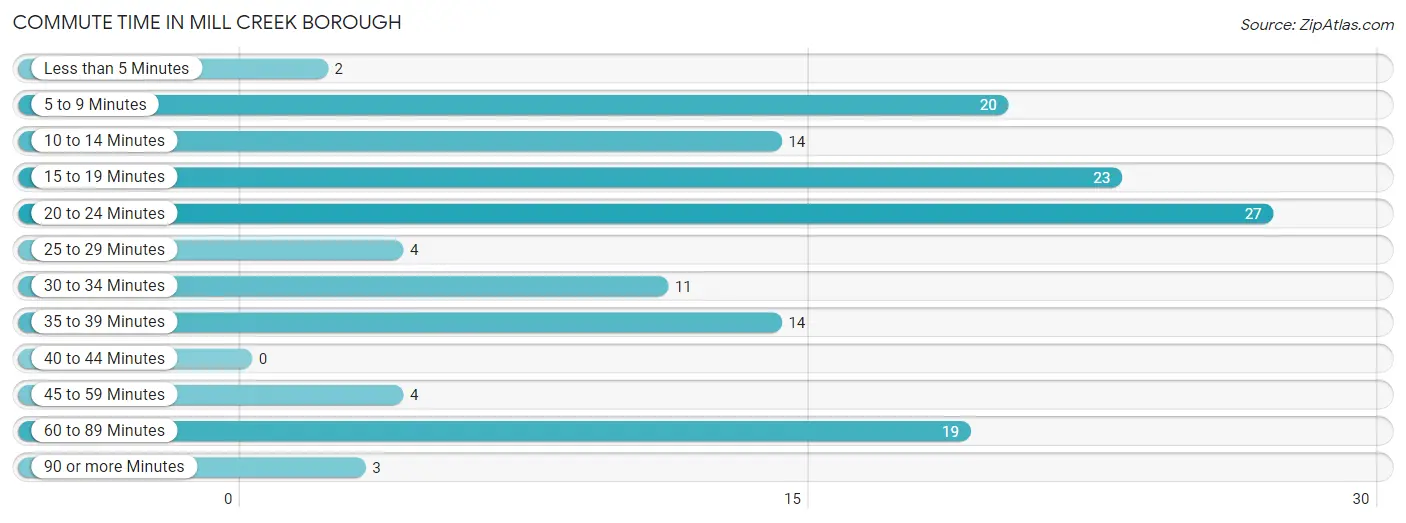
Commute Time in Mill Creek borough
The most frequently occuring commute durations in Mill Creek borough are 20 to 24 minutes (27 commuters, 19.2%), 15 to 19 minutes (23 commuters, 16.3%), and 5 to 9 minutes (20 commuters, 14.2%).
| Commute Time | # Commuters | % Commuters |
| Less than 5 Minutes | 2 | 1.4% |
| 5 to 9 Minutes | 20 | 14.2% |
| 10 to 14 Minutes | 14 | 9.9% |
| 15 to 19 Minutes | 23 | 16.3% |
| 20 to 24 Minutes | 27 | 19.2% |
| 25 to 29 Minutes | 4 | 2.8% |
| 30 to 34 Minutes | 11 | 7.8% |
| 35 to 39 Minutes | 14 | 9.9% |
| 40 to 44 Minutes | 0 | 0.0% |
| 45 to 59 Minutes | 4 | 2.8% |
| 60 to 89 Minutes | 19 | 13.5% |
| 90 or more Minutes | 3 | 2.1% |
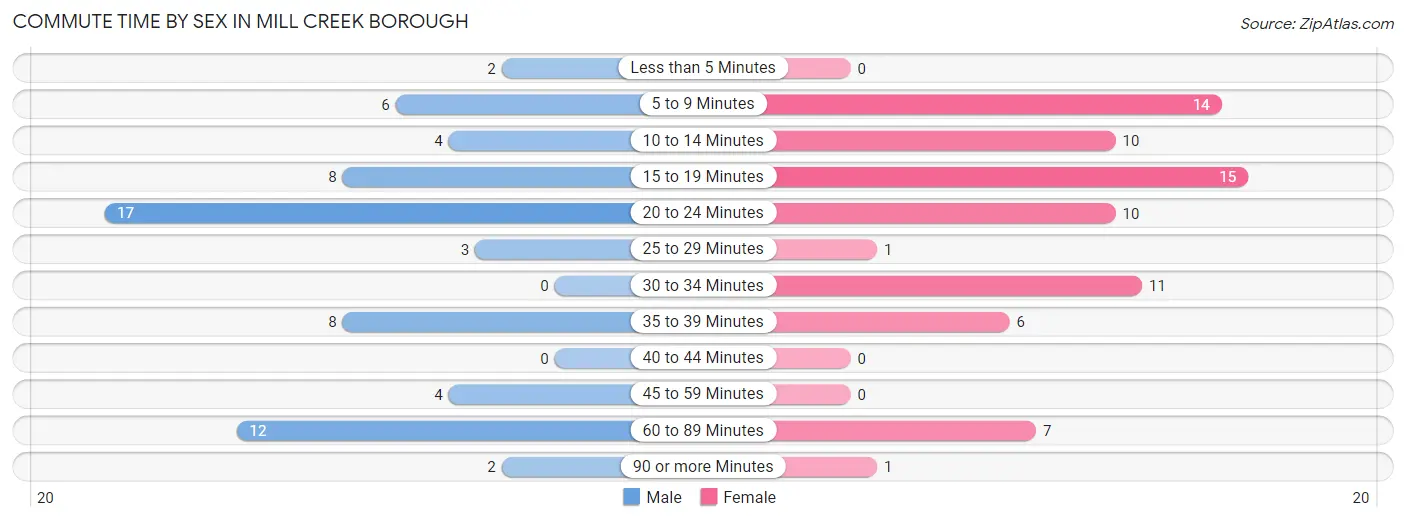
Commute Time by Sex in Mill Creek borough
The most common commute times in Mill Creek borough are 20 to 24 minutes (17 commuters, 25.8%) for males and 15 to 19 minutes (15 commuters, 20.0%) for females.
| Commute Time | Male | Female |
| Less than 5 Minutes | 2 (3.0%) | 0 (0.0%) |
| 5 to 9 Minutes | 6 (9.1%) | 14 (18.7%) |
| 10 to 14 Minutes | 4 (6.1%) | 10 (13.3%) |
| 15 to 19 Minutes | 8 (12.1%) | 15 (20.0%) |
| 20 to 24 Minutes | 17 (25.8%) | 10 (13.3%) |
| 25 to 29 Minutes | 3 (4.5%) | 1 (1.3%) |
| 30 to 34 Minutes | 0 (0.0%) | 11 (14.7%) |
| 35 to 39 Minutes | 8 (12.1%) | 6 (8.0%) |
| 40 to 44 Minutes | 0 (0.0%) | 0 (0.0%) |
| 45 to 59 Minutes | 4 (6.1%) | 0 (0.0%) |
| 60 to 89 Minutes | 12 (18.2%) | 7 (9.3%) |
| 90 or more Minutes | 2 (3.0%) | 1 (1.3%) |
Time of Departure to Work by Sex in Mill Creek borough
The most frequent times of departure to work in Mill Creek borough are 12:00 AM to 4:59 AM (18, 27.3%) for males and 8:00 AM to 8:29 AM (17, 22.7%) for females.
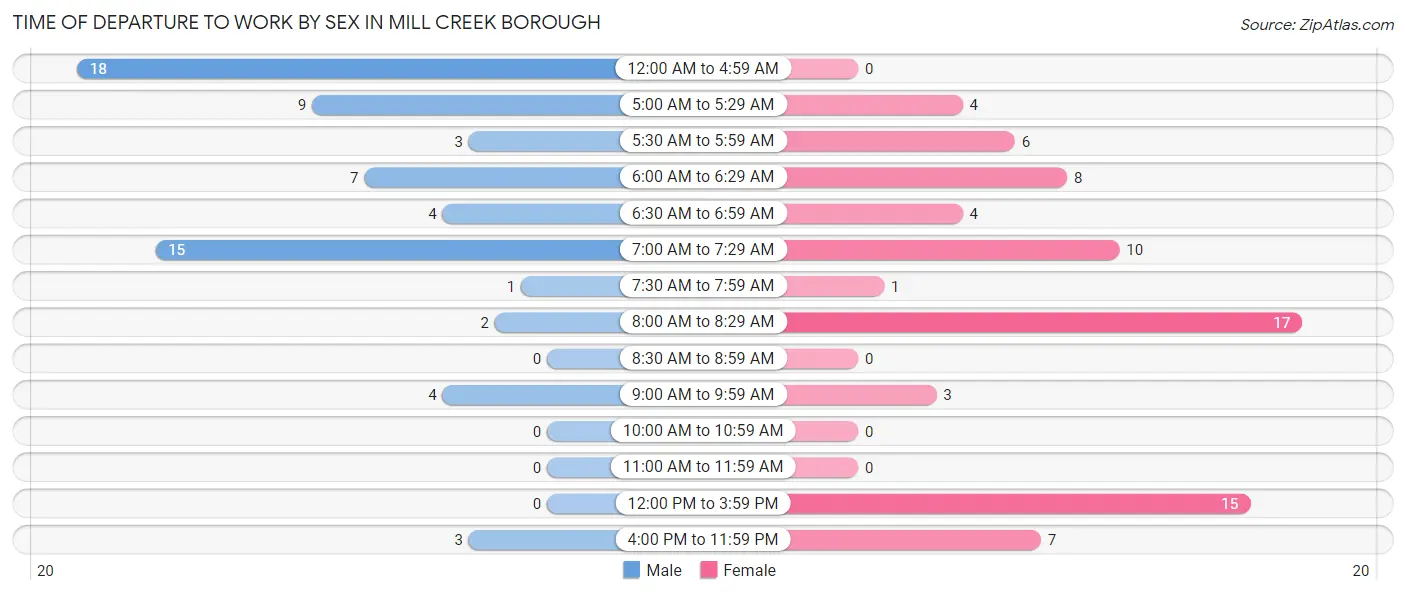
| Time of Departure | Male | Female |
| 12:00 AM to 4:59 AM | 18 (27.3%) | 0 (0.0%) |
| 5:00 AM to 5:29 AM | 9 (13.6%) | 4 (5.3%) |
| 5:30 AM to 5:59 AM | 3 (4.5%) | 6 (8.0%) |
| 6:00 AM to 6:29 AM | 7 (10.6%) | 8 (10.7%) |
| 6:30 AM to 6:59 AM | 4 (6.1%) | 4 (5.3%) |
| 7:00 AM to 7:29 AM | 15 (22.7%) | 10 (13.3%) |
| 7:30 AM to 7:59 AM | 1 (1.5%) | 1 (1.3%) |
| 8:00 AM to 8:29 AM | 2 (3.0%) | 17 (22.7%) |
| 8:30 AM to 8:59 AM | 0 (0.0%) | 0 (0.0%) |
| 9:00 AM to 9:59 AM | 4 (6.1%) | 3 (4.0%) |
| 10:00 AM to 10:59 AM | 0 (0.0%) | 0 (0.0%) |
| 11:00 AM to 11:59 AM | 0 (0.0%) | 0 (0.0%) |
| 12:00 PM to 3:59 PM | 0 (0.0%) | 15 (20.0%) |
| 4:00 PM to 11:59 PM | 3 (4.5%) | 7 (9.3%) |
| Total | 66 (100.0%) | 75 (100.0%) |
Housing Occupancy in Mill Creek borough
Occupancy by Ownership in Mill Creek borough
Of the total 114 dwellings in Mill Creek borough, owner-occupied units account for 85 (74.6%), while renter-occupied units make up 29 (25.4%).
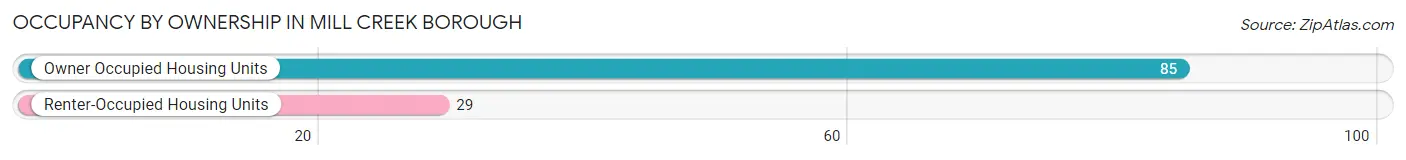
| Occupancy | # Housing Units | % Housing Units |
| Owner Occupied Housing Units | 85 | 74.6% |
| Renter-Occupied Housing Units | 29 | 25.4% |
| Total Occupied Housing Units | 114 | 100.0% |
Occupancy by Household Size in Mill Creek borough
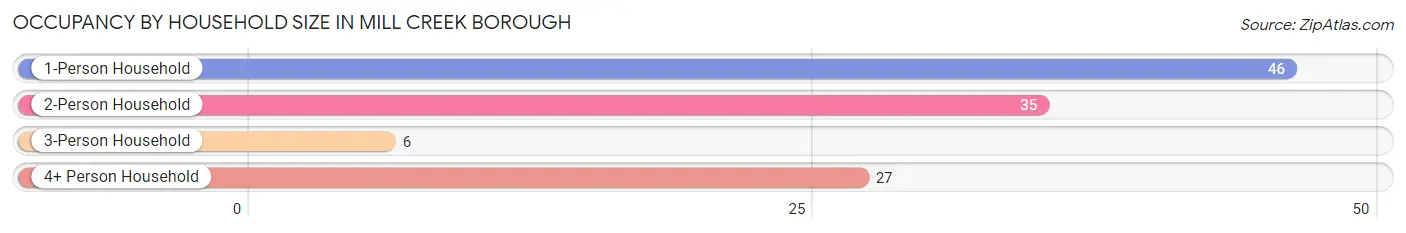
| Household Size | # Housing Units | % Housing Units |
| 1-Person Household | 46 | 40.4% |
| 2-Person Household | 35 | 30.7% |
| 3-Person Household | 6 | 5.3% |
| 4+ Person Household | 27 | 23.7% |
| Total Housing Units | 114 | 100.0% |
Occupancy by Ownership by Household Size in Mill Creek borough
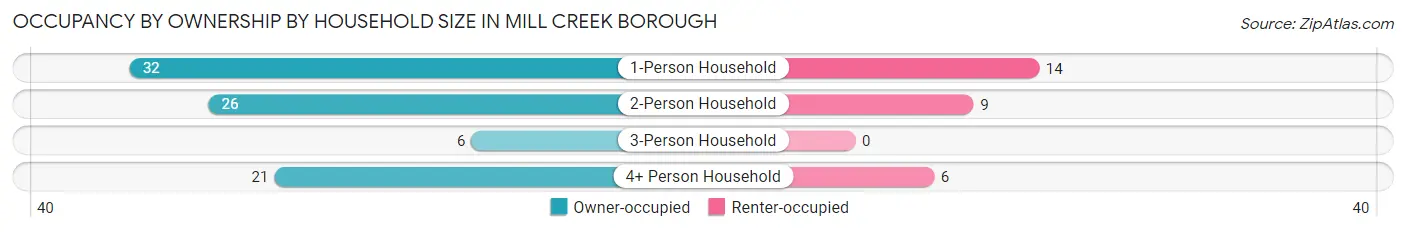
| Household Size | Owner-occupied | Renter-occupied |
| 1-Person Household | 32 (69.6%) | 14 (30.4%) |
| 2-Person Household | 26 (74.3%) | 9 (25.7%) |
| 3-Person Household | 6 (100.0%) | 0 (0.0%) |
| 4+ Person Household | 21 (77.8%) | 6 (22.2%) |
| Total Housing Units | 85 (74.6%) | 29 (25.4%) |
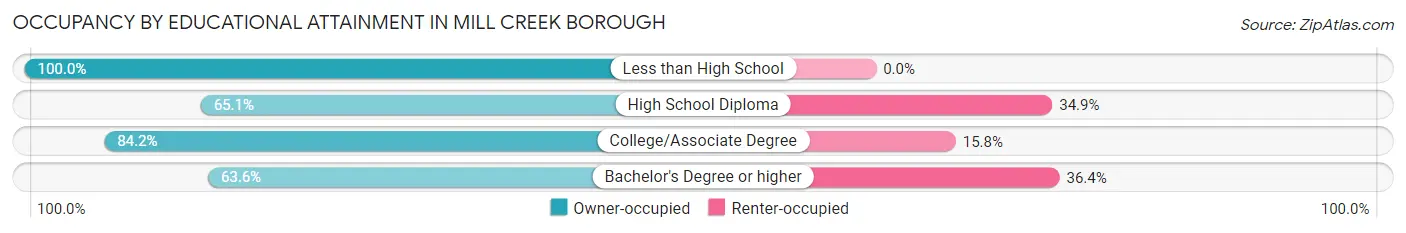
Occupancy by Educational Attainment in Mill Creek borough
| Household Size | Owner-occupied | Renter-occupied |
| Less than High School | 21 (100.0%) | 0 (0.0%) |
| High School Diploma | 41 (65.1%) | 22 (34.9%) |
| College/Associate Degree | 16 (84.2%) | 3 (15.8%) |
| Bachelor's Degree or higher | 7 (63.6%) | 4 (36.4%) |
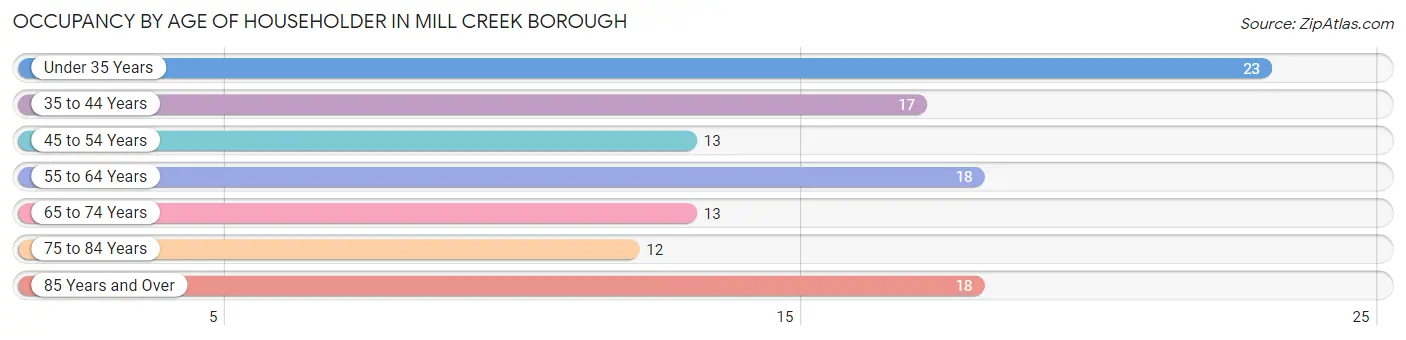
Occupancy by Age of Householder in Mill Creek borough
| Age Bracket | # Households | % Households |
| Under 35 Years | 23 | 20.2% |
| 35 to 44 Years | 17 | 14.9% |
| 45 to 54 Years | 13 | 11.4% |
| 55 to 64 Years | 18 | 15.8% |
| 65 to 74 Years | 13 | 11.4% |
| 75 to 84 Years | 12 | 10.5% |
| 85 Years and Over | 18 | 15.8% |
| Total | 114 | 100.0% |
Housing Finances in Mill Creek borough
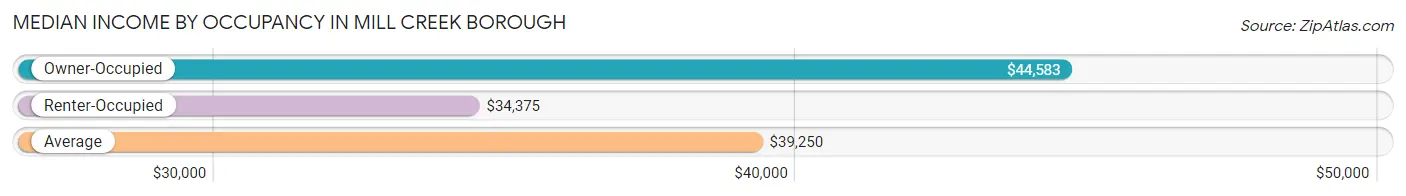
Median Income by Occupancy in Mill Creek borough
| Occupancy Type | # Households | Median Income |
| Owner-Occupied | 85 (74.6%) | $44,583 |
| Renter-Occupied | 29 (25.4%) | $34,375 |
| Average | 114 (100.0%) | $39,250 |
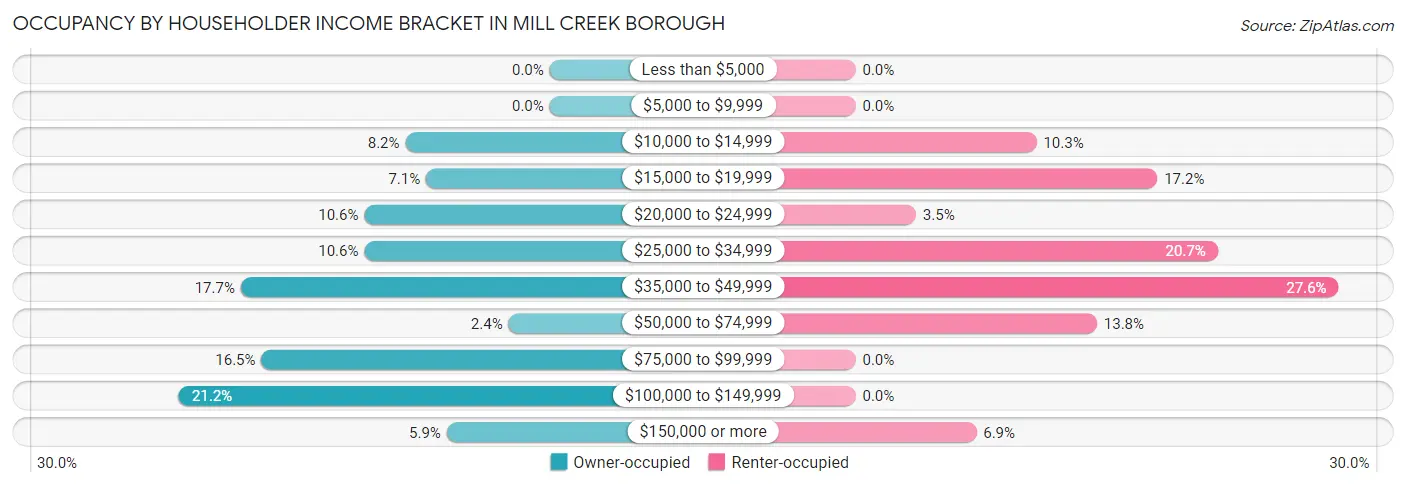
Occupancy by Householder Income Bracket in Mill Creek borough
| Income Bracket | Owner-occupied | Renter-occupied |
| Less than $5,000 | 0 (0.0%) | 0 (0.0%) |
| $5,000 to $9,999 | 0 (0.0%) | 0 (0.0%) |
| $10,000 to $14,999 | 7 (8.2%) | 3 (10.3%) |
| $15,000 to $19,999 | 6 (7.1%) | 5 (17.2%) |
| $20,000 to $24,999 | 9 (10.6%) | 1 (3.5%) |
| $25,000 to $34,999 | 9 (10.6%) | 6 (20.7%) |
| $35,000 to $49,999 | 15 (17.6%) | 8 (27.6%) |
| $50,000 to $74,999 | 2 (2.4%) | 4 (13.8%) |
| $75,000 to $99,999 | 14 (16.5%) | 0 (0.0%) |
| $100,000 to $149,999 | 18 (21.2%) | 0 (0.0%) |
| $150,000 or more | 5 (5.9%) | 2 (6.9%) |
| Total | 85 (100.0%) | 29 (100.0%) |
Monthly Housing Cost Tiers in Mill Creek borough
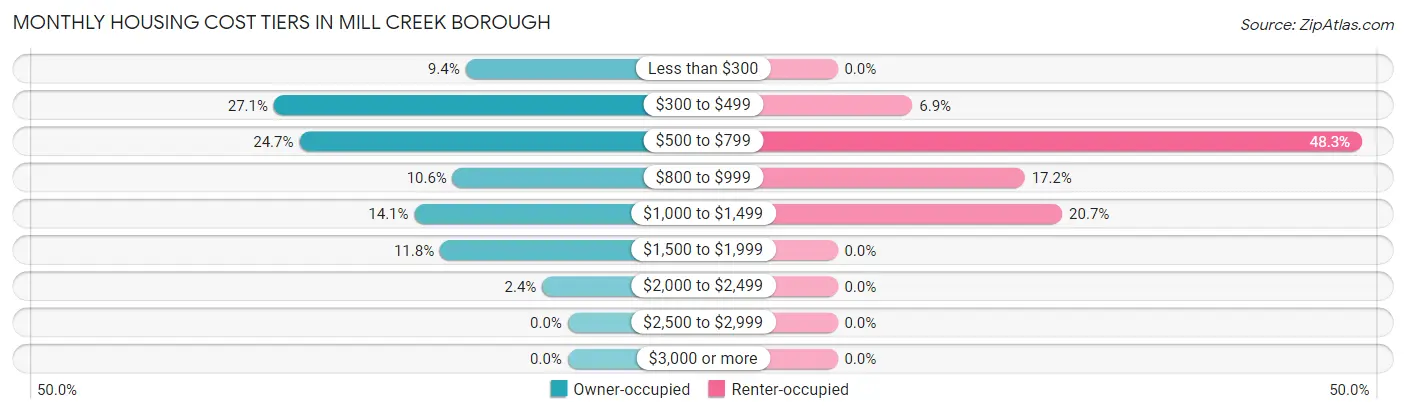
| Monthly Cost | Owner-occupied | Renter-occupied |
| Less than $300 | 8 (9.4%) | 0 (0.0%) |
| $300 to $499 | 23 (27.1%) | 2 (6.9%) |
| $500 to $799 | 21 (24.7%) | 14 (48.3%) |
| $800 to $999 | 9 (10.6%) | 5 (17.2%) |
| $1,000 to $1,499 | 12 (14.1%) | 6 (20.7%) |
| $1,500 to $1,999 | 10 (11.8%) | 0 (0.0%) |
| $2,000 to $2,499 | 2 (2.4%) | 0 (0.0%) |
| $2,500 to $2,999 | 0 (0.0%) | 0 (0.0%) |
| $3,000 or more | 0 (0.0%) | 0 (0.0%) |
| Total | 85 (100.0%) | 29 (100.0%) |
Physical Housing Characteristics in Mill Creek borough
Housing Structures in Mill Creek borough
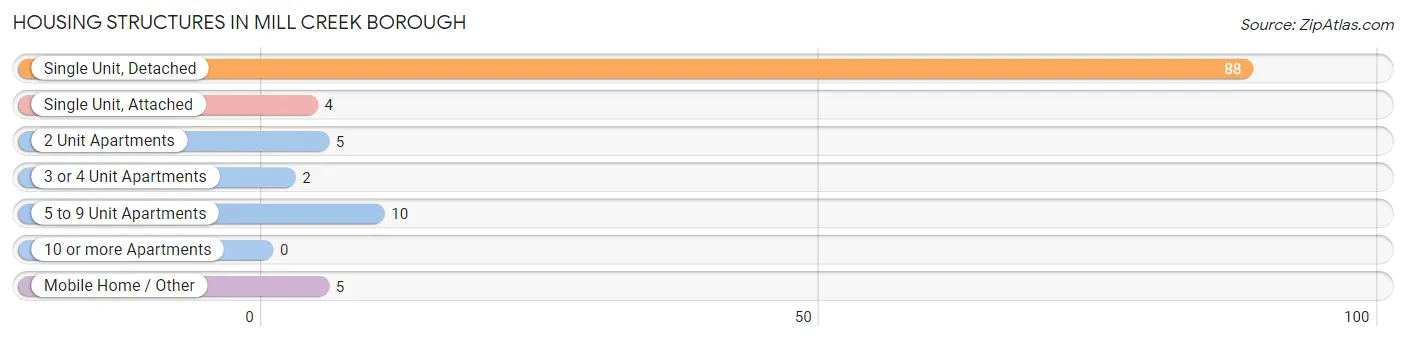
| Structure Type | # Housing Units | % Housing Units |
| Single Unit, Detached | 88 | 77.2% |
| Single Unit, Attached | 4 | 3.5% |
| 2 Unit Apartments | 5 | 4.4% |
| 3 or 4 Unit Apartments | 2 | 1.8% |
| 5 to 9 Unit Apartments | 10 | 8.8% |
| 10 or more Apartments | 0 | 0.0% |
| Mobile Home / Other | 5 | 4.4% |
| Total | 114 | 100.0% |
Housing Structures by Occupancy in Mill Creek borough
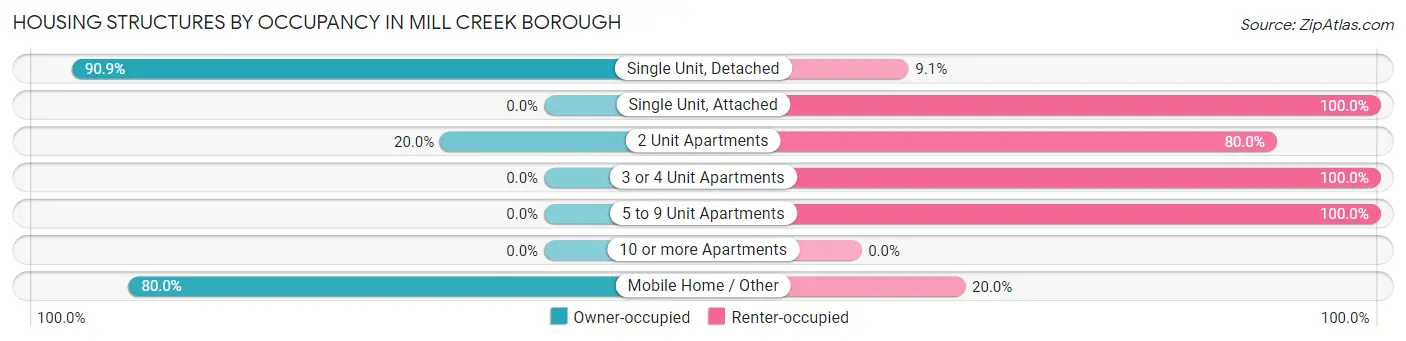
| Structure Type | Owner-occupied | Renter-occupied |
| Single Unit, Detached | 80 (90.9%) | 8 (9.1%) |
| Single Unit, Attached | 0 (0.0%) | 4 (100.0%) |
| 2 Unit Apartments | 1 (20.0%) | 4 (80.0%) |
| 3 or 4 Unit Apartments | 0 (0.0%) | 2 (100.0%) |
| 5 to 9 Unit Apartments | 0 (0.0%) | 10 (100.0%) |
| 10 or more Apartments | 0 (0.0%) | 0 (0.0%) |
| Mobile Home / Other | 4 (80.0%) | 1 (20.0%) |
| Total | 85 (74.6%) | 29 (25.4%) |
Housing Structures by Number of Rooms in Mill Creek borough
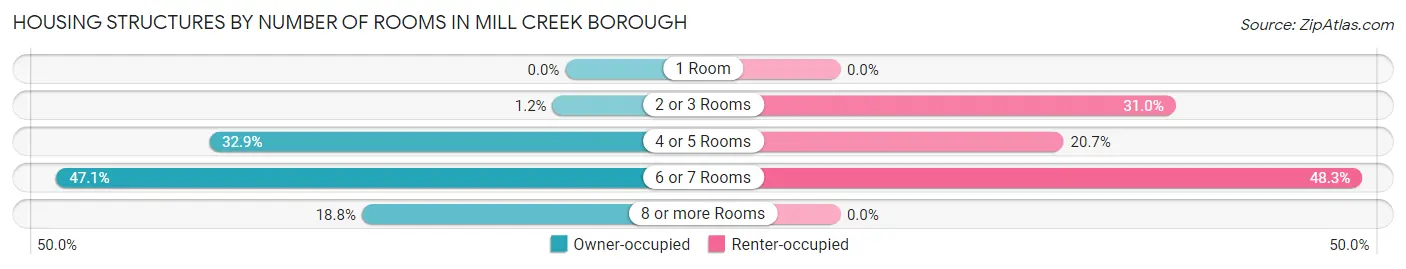
| Number of Rooms | Owner-occupied | Renter-occupied |
| 1 Room | 0 (0.0%) | 0 (0.0%) |
| 2 or 3 Rooms | 1 (1.2%) | 9 (31.0%) |
| 4 or 5 Rooms | 28 (32.9%) | 6 (20.7%) |
| 6 or 7 Rooms | 40 (47.1%) | 14 (48.3%) |
| 8 or more Rooms | 16 (18.8%) | 0 (0.0%) |
| Total | 85 (100.0%) | 29 (100.0%) |
Housing Structure by Heating Type in Mill Creek borough
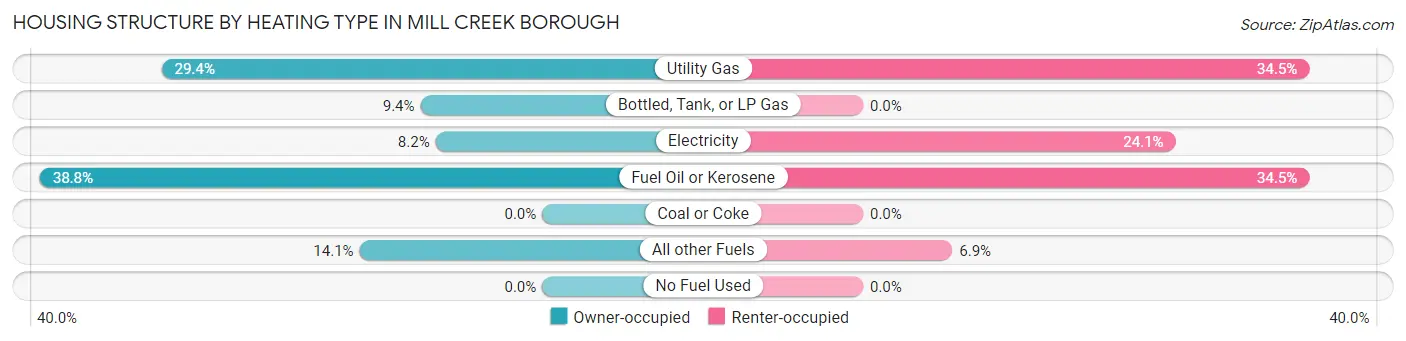
| Heating Type | Owner-occupied | Renter-occupied |
| Utility Gas | 25 (29.4%) | 10 (34.5%) |
| Bottled, Tank, or LP Gas | 8 (9.4%) | 0 (0.0%) |
| Electricity | 7 (8.2%) | 7 (24.1%) |
| Fuel Oil or Kerosene | 33 (38.8%) | 10 (34.5%) |
| Coal or Coke | 0 (0.0%) | 0 (0.0%) |
| All other Fuels | 12 (14.1%) | 2 (6.9%) |
| No Fuel Used | 0 (0.0%) | 0 (0.0%) |
| Total | 85 (100.0%) | 29 (100.0%) |
Household Vehicle Usage in Mill Creek borough
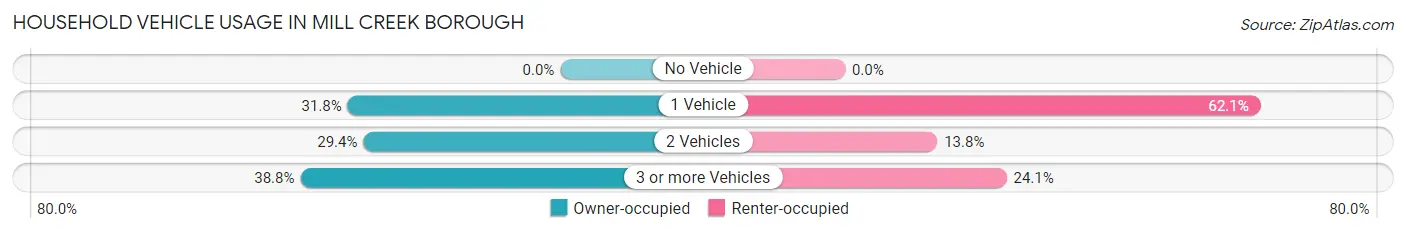
| Vehicles per Household | Owner-occupied | Renter-occupied |
| No Vehicle | 0 (0.0%) | 0 (0.0%) |
| 1 Vehicle | 27 (31.8%) | 18 (62.1%) |
| 2 Vehicles | 25 (29.4%) | 4 (13.8%) |
| 3 or more Vehicles | 33 (38.8%) | 7 (24.1%) |
| Total | 85 (100.0%) | 29 (100.0%) |
Real Estate & Mortgages in Mill Creek borough
Real Estate and Mortgage Overview in Mill Creek borough
| Characteristic | Without Mortgage | With Mortgage |
| Housing Units | 46 | 39 |
| Median Property Value | $97,700 | $121,600 |
| Median Household Income | - | - |
| Monthly Housing Costs | $436 | $0 |
| Real Estate Taxes | $800 | $0 |
Property Value by Mortgage Status in Mill Creek borough
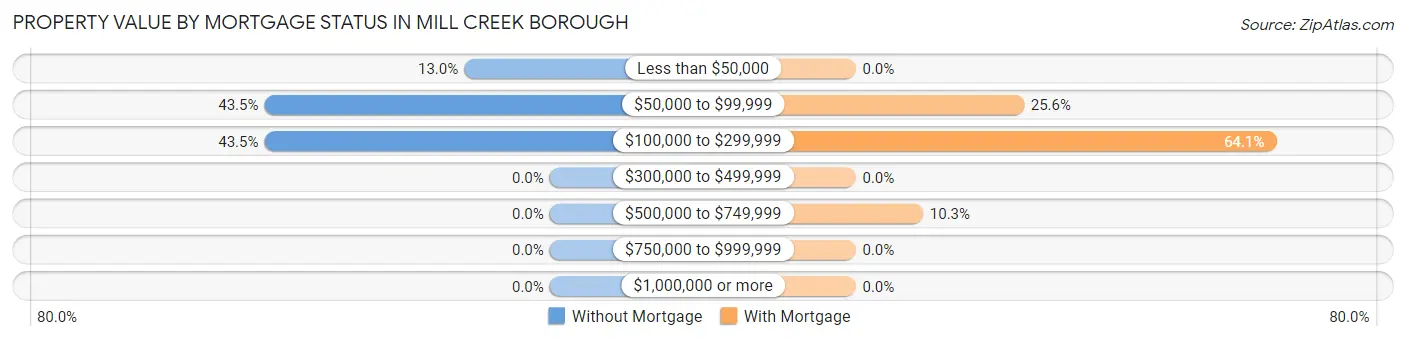
| Property Value | Without Mortgage | With Mortgage |
| Less than $50,000 | 6 (13.0%) | 0 (0.0%) |
| $50,000 to $99,999 | 20 (43.5%) | 10 (25.6%) |
| $100,000 to $299,999 | 20 (43.5%) | 25 (64.1%) |
| $300,000 to $499,999 | 0 (0.0%) | 0 (0.0%) |
| $500,000 to $749,999 | 0 (0.0%) | 4 (10.3%) |
| $750,000 to $999,999 | 0 (0.0%) | 0 (0.0%) |
| $1,000,000 or more | 0 (0.0%) | 0 (0.0%) |
| Total | 46 (100.0%) | 39 (100.0%) |
Household Income by Mortgage Status in Mill Creek borough
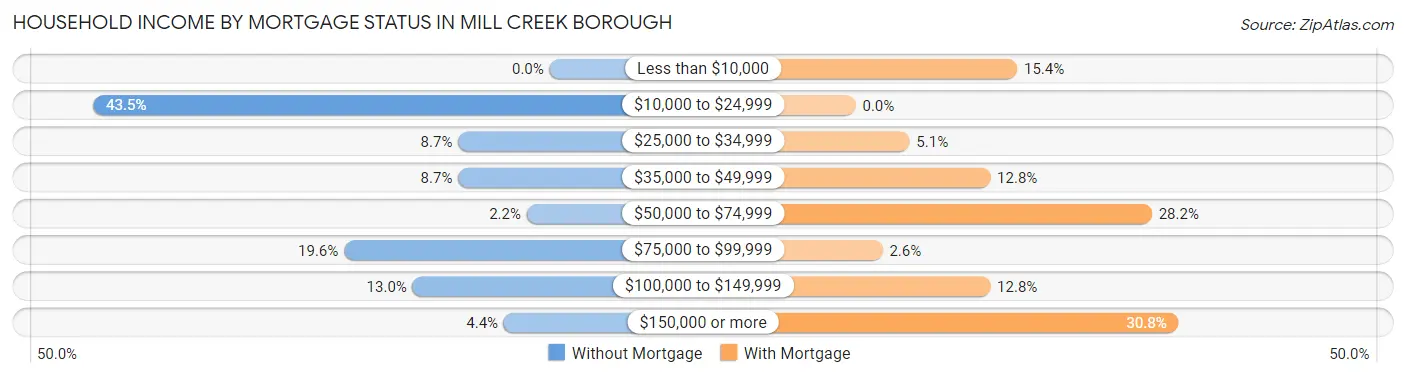
| Household Income | Without Mortgage | With Mortgage |
| Less than $10,000 | 0 (0.0%) | 6 (15.4%) |
| $10,000 to $24,999 | 20 (43.5%) | 0 (0.0%) |
| $25,000 to $34,999 | 4 (8.7%) | 2 (5.1%) |
| $35,000 to $49,999 | 4 (8.7%) | 5 (12.8%) |
| $50,000 to $74,999 | 1 (2.2%) | 11 (28.2%) |
| $75,000 to $99,999 | 9 (19.6%) | 1 (2.6%) |
| $100,000 to $149,999 | 6 (13.0%) | 5 (12.8%) |
| $150,000 or more | 2 (4.3%) | 12 (30.8%) |
| Total | 46 (100.0%) | 39 (100.0%) |
Property Value to Household Income Ratio in Mill Creek borough
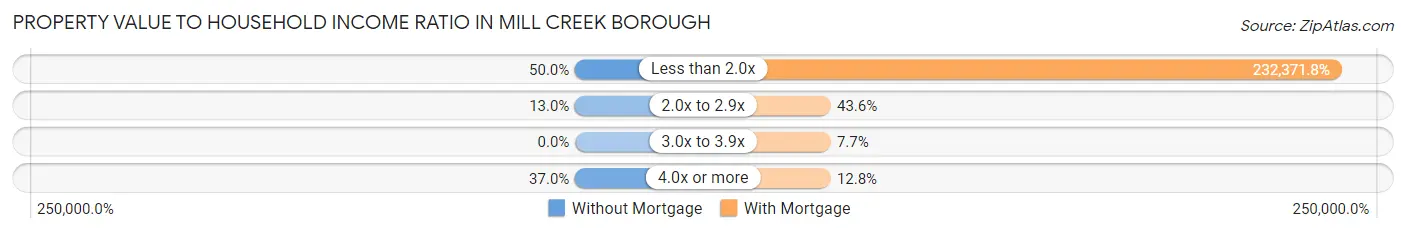
| Value-to-Income Ratio | Without Mortgage | With Mortgage |
| Less than 2.0x | 23 (50.0%) | 90,625 (232,371.8%) |
| 2.0x to 2.9x | 6 (13.0%) | 17 (43.6%) |
| 3.0x to 3.9x | 0 (0.0%) | 3 (7.7%) |
| 4.0x or more | 17 (37.0%) | 5 (12.8%) |
| Total | 46 (100.0%) | 39 (100.0%) |
Real Estate Taxes by Mortgage Status in Mill Creek borough
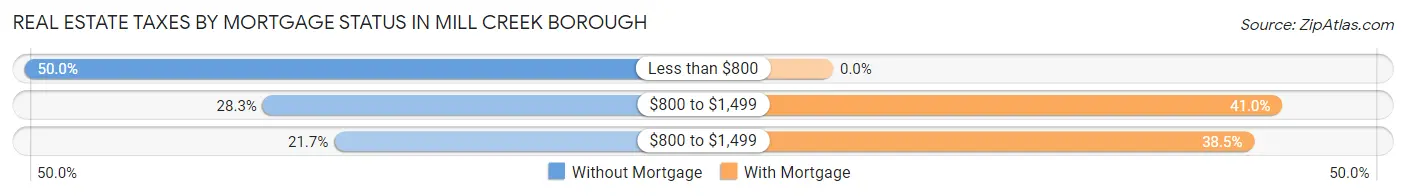
| Property Taxes | Without Mortgage | With Mortgage |
| Less than $800 | 23 (50.0%) | 0 (0.0%) |
| $800 to $1,499 | 13 (28.3%) | 16 (41.0%) |
| $800 to $1,499 | 10 (21.7%) | 15 (38.5%) |
| Total | 46 (100.0%) | 39 (100.0%) |
Health & Disability in Mill Creek borough
Health Insurance Coverage by Age in Mill Creek borough
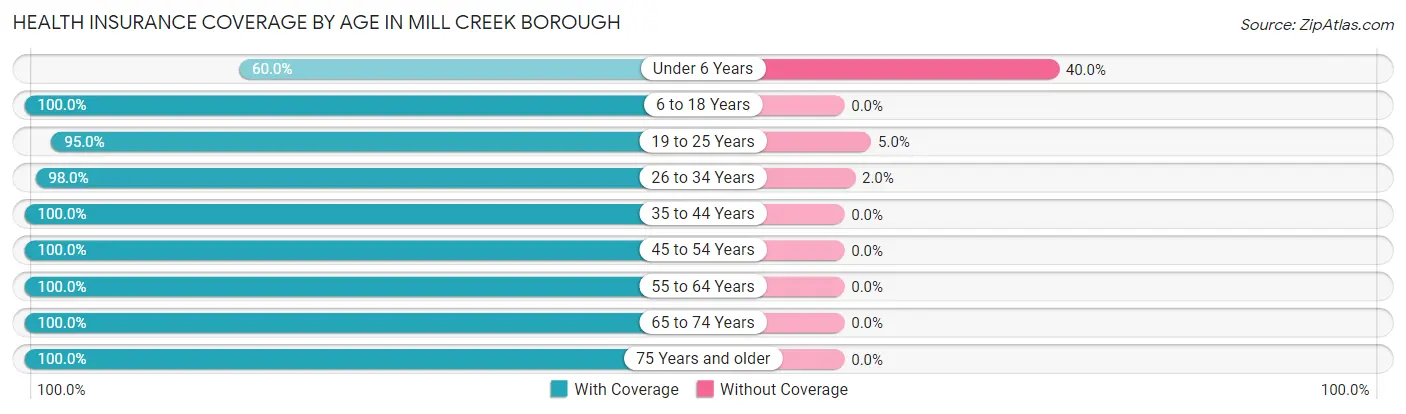
| Age Bracket | With Coverage | Without Coverage |
| Under 6 Years | 9 (60.0%) | 6 (40.0%) |
| 6 to 18 Years | 63 (100.0%) | 0 (0.0%) |
| 19 to 25 Years | 38 (95.0%) | 2 (5.0%) |
| 26 to 34 Years | 49 (98.0%) | 1 (2.0%) |
| 35 to 44 Years | 31 (100.0%) | 0 (0.0%) |
| 45 to 54 Years | 22 (100.0%) | 0 (0.0%) |
| 55 to 64 Years | 46 (100.0%) | 0 (0.0%) |
| 65 to 74 Years | 14 (100.0%) | 0 (0.0%) |
| 75 Years and older | 33 (100.0%) | 0 (0.0%) |
| Total | 305 (97.1%) | 9 (2.9%) |
Health Insurance Coverage by Citizenship Status in Mill Creek borough
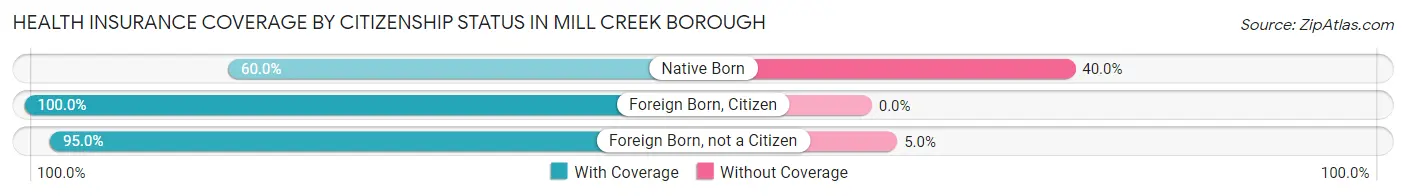
| Citizenship Status | With Coverage | Without Coverage |
| Native Born | 9 (60.0%) | 6 (40.0%) |
| Foreign Born, Citizen | 63 (100.0%) | 0 (0.0%) |
| Foreign Born, not a Citizen | 38 (95.0%) | 2 (5.0%) |
Health Insurance Coverage by Household Income in Mill Creek borough
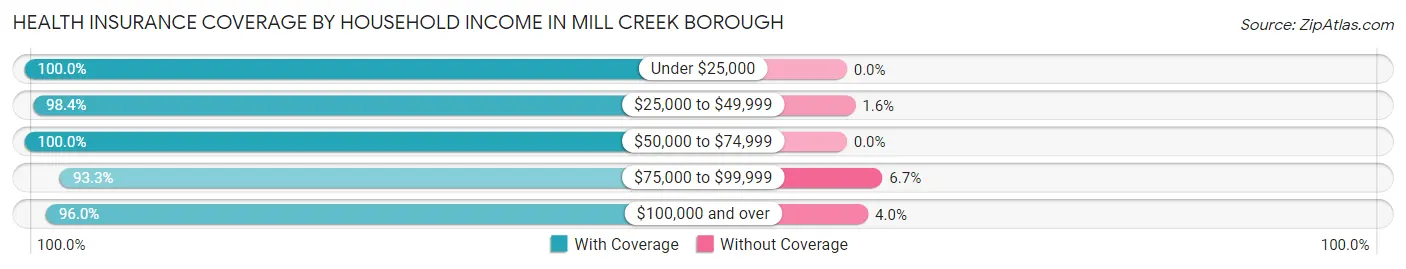
| Household Income | With Coverage | Without Coverage |
| Under $25,000 | 40 (100.0%) | 0 (0.0%) |
| $25,000 to $49,999 | 61 (98.4%) | 1 (1.6%) |
| $50,000 to $74,999 | 32 (100.0%) | 0 (0.0%) |
| $75,000 to $99,999 | 28 (93.3%) | 2 (6.7%) |
| $100,000 and over | 144 (96.0%) | 6 (4.0%) |
Public vs Private Health Insurance Coverage by Age in Mill Creek borough
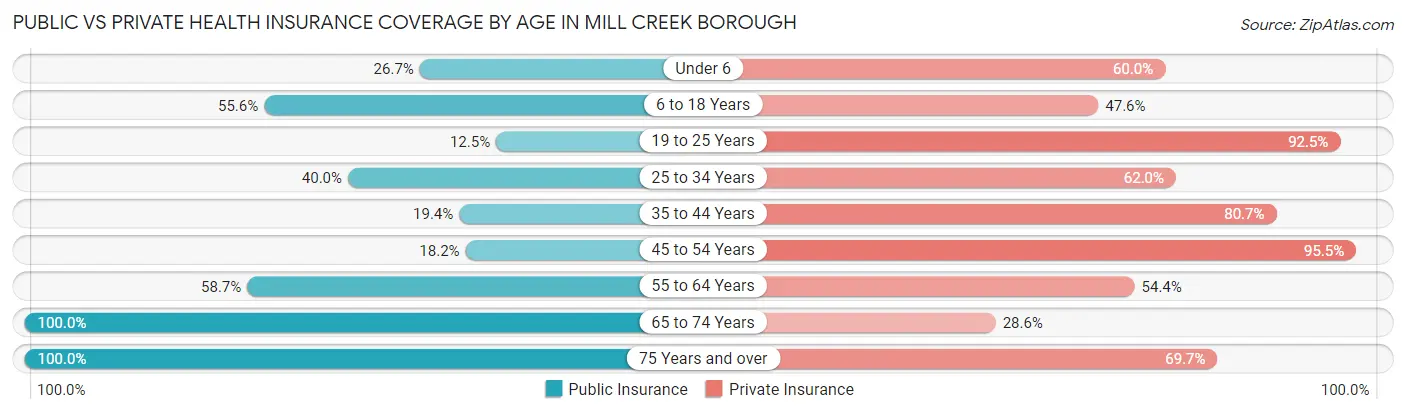
| Age Bracket | Public Insurance | Private Insurance |
| Under 6 | 4 (26.7%) | 9 (60.0%) |
| 6 to 18 Years | 35 (55.6%) | 30 (47.6%) |
| 19 to 25 Years | 5 (12.5%) | 37 (92.5%) |
| 25 to 34 Years | 20 (40.0%) | 31 (62.0%) |
| 35 to 44 Years | 6 (19.4%) | 25 (80.6%) |
| 45 to 54 Years | 4 (18.2%) | 21 (95.5%) |
| 55 to 64 Years | 27 (58.7%) | 25 (54.3%) |
| 65 to 74 Years | 14 (100.0%) | 4 (28.6%) |
| 75 Years and over | 33 (100.0%) | 23 (69.7%) |
| Total | 148 (47.1%) | 205 (65.3%) |
Disability Status by Sex by Age in Mill Creek borough
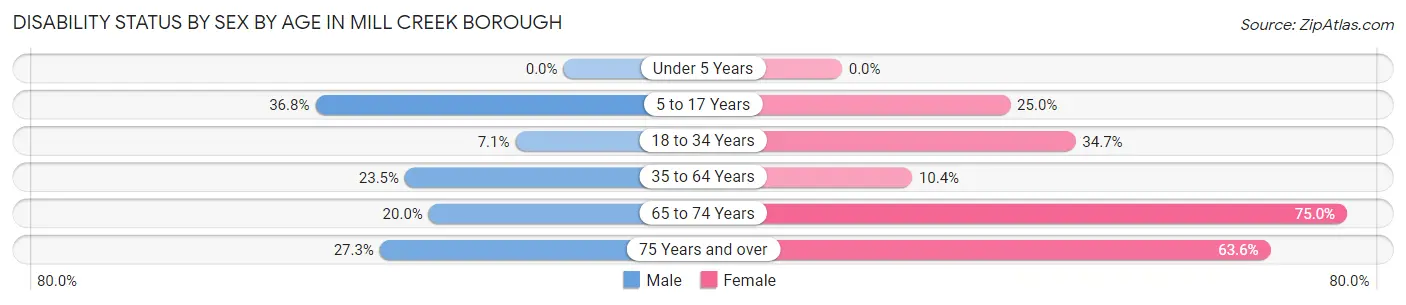
| Age Bracket | Male | Female |
| Under 5 Years | 0 (0.0%) | 0 (0.0%) |
| 5 to 17 Years | 14 (36.8%) | 6 (25.0%) |
| 18 to 34 Years | 3 (7.1%) | 17 (34.7%) |
| 35 to 64 Years | 12 (23.5%) | 5 (10.4%) |
| 65 to 74 Years | 2 (20.0%) | 3 (75.0%) |
| 75 Years and over | 3 (27.3%) | 14 (63.6%) |
Disability Class by Sex by Age in Mill Creek borough
Disability Class: Hearing Difficulty
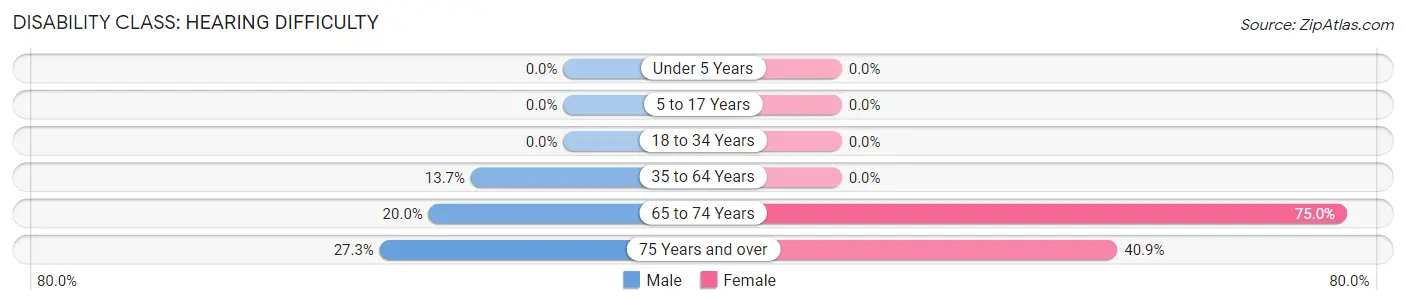
| Age Bracket | Male | Female |
| Under 5 Years | 0 (0.0%) | 0 (0.0%) |
| 5 to 17 Years | 0 (0.0%) | 0 (0.0%) |
| 18 to 34 Years | 0 (0.0%) | 0 (0.0%) |
| 35 to 64 Years | 7 (13.7%) | 0 (0.0%) |
| 65 to 74 Years | 2 (20.0%) | 3 (75.0%) |
| 75 Years and over | 3 (27.3%) | 9 (40.9%) |
Disability Class: Vision Difficulty
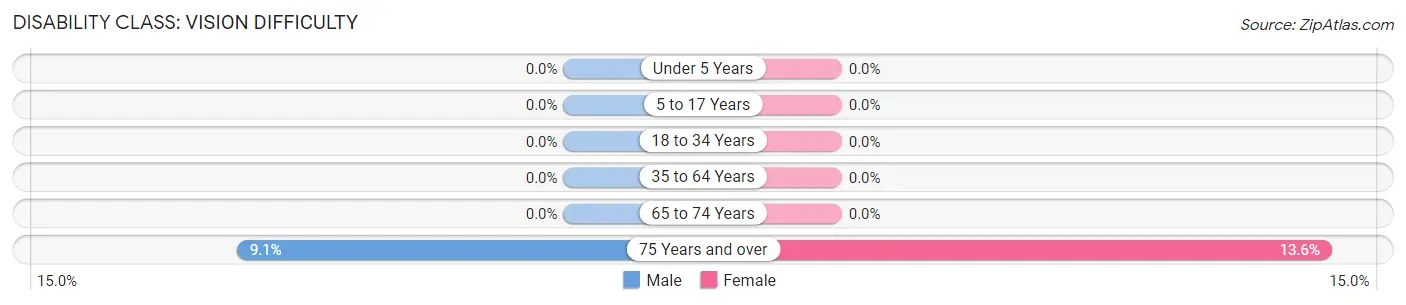
| Age Bracket | Male | Female |
| Under 5 Years | 0 (0.0%) | 0 (0.0%) |
| 5 to 17 Years | 0 (0.0%) | 0 (0.0%) |
| 18 to 34 Years | 0 (0.0%) | 0 (0.0%) |
| 35 to 64 Years | 0 (0.0%) | 0 (0.0%) |
| 65 to 74 Years | 0 (0.0%) | 0 (0.0%) |
| 75 Years and over | 1 (9.1%) | 3 (13.6%) |
Disability Class: Cognitive Difficulty
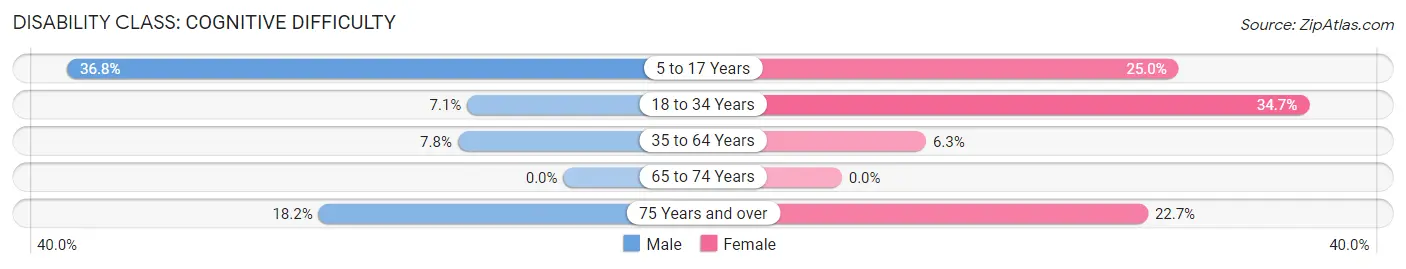
| Age Bracket | Male | Female |
| 5 to 17 Years | 14 (36.8%) | 6 (25.0%) |
| 18 to 34 Years | 3 (7.1%) | 17 (34.7%) |
| 35 to 64 Years | 4 (7.8%) | 3 (6.2%) |
| 65 to 74 Years | 0 (0.0%) | 0 (0.0%) |
| 75 Years and over | 2 (18.2%) | 5 (22.7%) |
Disability Class: Ambulatory Difficulty
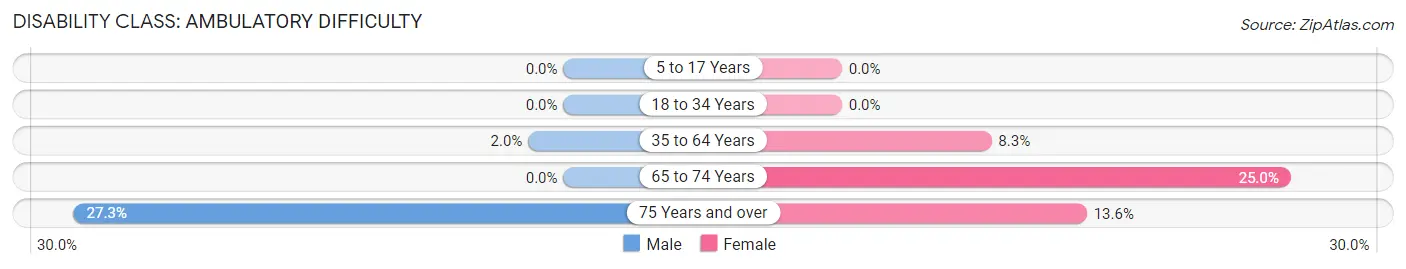
| Age Bracket | Male | Female |
| 5 to 17 Years | 0 (0.0%) | 0 (0.0%) |
| 18 to 34 Years | 0 (0.0%) | 0 (0.0%) |
| 35 to 64 Years | 1 (2.0%) | 4 (8.3%) |
| 65 to 74 Years | 0 (0.0%) | 1 (25.0%) |
| 75 Years and over | 3 (27.3%) | 3 (13.6%) |
Disability Class: Self-Care Difficulty
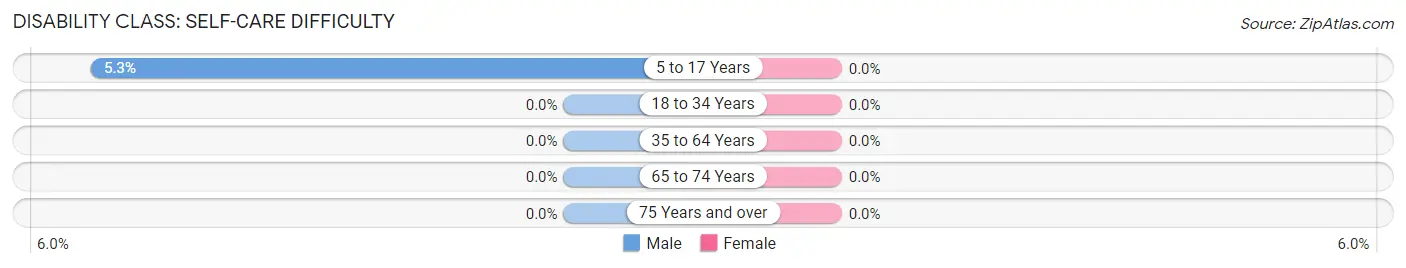
| Age Bracket | Male | Female |
| 5 to 17 Years | 2 (5.3%) | 0 (0.0%) |
| 18 to 34 Years | 0 (0.0%) | 0 (0.0%) |
| 35 to 64 Years | 0 (0.0%) | 0 (0.0%) |
| 65 to 74 Years | 0 (0.0%) | 0 (0.0%) |
| 75 Years and over | 0 (0.0%) | 0 (0.0%) |
Technology Access in Mill Creek borough
Computing Device Access in Mill Creek borough
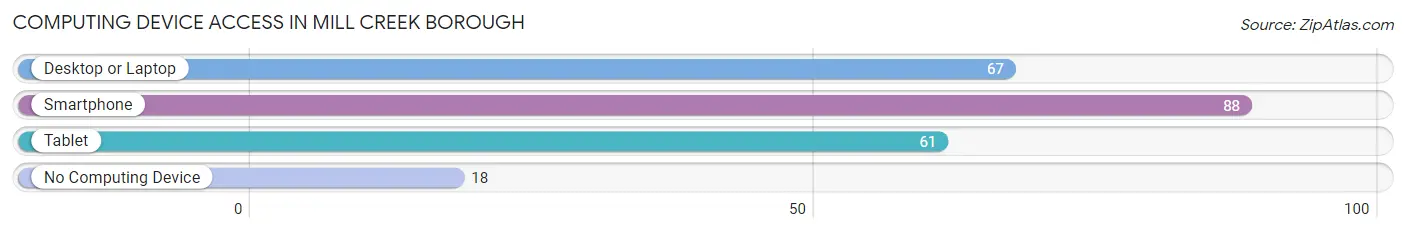
| Device Type | # Households | % Households |
| Desktop or Laptop | 67 | 58.8% |
| Smartphone | 88 | 77.2% |
| Tablet | 61 | 53.5% |
| No Computing Device | 18 | 15.8% |
| Total | 114 | 100.0% |
Internet Access in Mill Creek borough
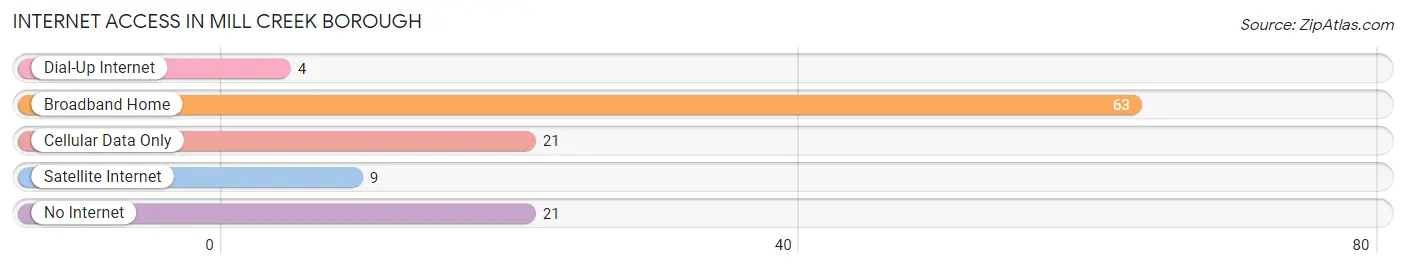
| Internet Type | # Households | % Households |
| Dial-Up Internet | 4 | 3.5% |
| Broadband Home | 63 | 55.3% |
| Cellular Data Only | 21 | 18.4% |
| Satellite Internet | 9 | 7.9% |
| No Internet | 21 | 18.4% |
| Total | 114 | 100.0% |
Mill Creek borough Summary
Introduction
Mill Creek Borough is a small borough located in Berks County, Pennsylvania. It is situated in the southeastern corner of the county, and is bordered by the Schuylkill River to the east and the Lehigh River to the south. The borough is home to a population of approximately 1,500 people, and is part of the Reading, PA Metropolitan Statistical Area. The borough is known for its rich history, diverse geography, and vibrant economy. This paper will explore the history, geography, economy, and demographics of Mill Creek Borough in 2000 words.
History
Mill Creek Borough was first settled in 1737 by a group of German immigrants. The area was originally known as “Mill Creek” due to the numerous mills that were built along the Schuylkill River. The borough was officially incorporated in 1845, and was named after the creek that ran through the area.
The borough was an important center of industry during the 19th century. The numerous mills along the Schuylkill River provided employment for many of the borough’s residents. The borough was also home to several coal mines, which provided fuel for the mills and other industries in the area.
The borough experienced a period of growth and prosperity during the early 20th century. The population of the borough increased from 1,000 in 1900 to 1,500 in 1930. The borough also experienced a period of industrial growth, with several new factories being built in the area.
The borough experienced a period of decline during the mid-20th century. The population of the borough decreased from 1,500 in 1930 to 1,200 in 1970. The decline was due to the closure of several of the borough’s factories and the decline of the coal industry.
The borough has experienced a period of revitalization since the late 20th century. The population of the borough has increased from 1,200 in 1970 to 1,500 in 2020. The borough has also experienced a period of economic growth, with several new businesses opening in the area.
Geography
Mill Creek Borough is located in southeastern Berks County, Pennsylvania. The borough is bordered by the Schuylkill River to the east and the Lehigh River to the south. The borough is located approximately 25 miles northwest of Philadelphia and 60 miles east of Harrisburg.
The borough is located in the Piedmont region of Pennsylvania. The terrain of the borough is mostly flat, with some rolling hills in the northern part of the borough. The borough is located in a temperate climate zone, with hot summers and cold winters.
The borough is home to several parks and recreational areas. The most popular park in the borough is Mill Creek Park, which features a playground, picnic area, and walking trails. The borough is also home to several historic sites, including the Mill Creek Historic District and the Mill Creek Covered Bridge.
Economy
Mill Creek Borough is home to a diverse economy. The borough is home to several manufacturing companies, including a paper mill, a printing company, and a plastics factory. The borough is also home to several retail stores, restaurants, and other businesses.
The borough is home to several educational institutions, including Mill Creek Elementary School and Mill Creek High School. The borough is also home to several churches, including the Mill Creek United Methodist Church and the Mill Creek Presbyterian Church.
The borough is home to several transportation options, including the Reading Area Transit Authority bus system and the Reading Regional Airport. The borough is also home to several major highways, including Interstate 78 and US Route 222.
Demographics
Mill Creek Borough is home to a population of approximately 1,500 people. The population is predominantly white (94.7%), with small percentages of African American (2.3%), Asian (1.3%), and Hispanic (1.7%) residents. The median household income in the borough is $50,000, and the median home value is $150,000.
Conclusion
Mill Creek Borough is a small borough located in Berks County, Pennsylvania. The borough is known for its rich history, diverse geography, and vibrant economy. The borough is home to a population of approximately 1,500 people, and is part of the Reading, PA Metropolitan Statistical Area. The borough is home to several manufacturing companies, educational institutions, churches, and transportation options. The population of the borough is predominantly white, with small percentages of African American, Asian, and Hispanic residents. The median household income in the borough is $50,000, and the median home value is $150,000.
Common Questions
What is Per Capita Income in Mill Creek borough?
Per Capita income in Mill Creek borough is $24,040.
What is the Median Family Income in Mill Creek borough?
Median Family Income in Mill Creek borough is $90,417.
What is the Median Household income in Mill Creek borough?
Median Household Income in Mill Creek borough is $39,250.
What is Income or Wage Gap in Mill Creek borough?
Income or Wage Gap in Mill Creek borough is 45.6%.
Women in Mill Creek borough earn 54.4 cents for every dollar earned by a man.
What is Inequality or Gini Index in Mill Creek borough?
Inequality or Gini Index in Mill Creek borough is 0.42.
What is the Total Population of Mill Creek borough?
Total Population of Mill Creek borough is 314.
What is the Total Male Population of Mill Creek borough?
Total Male Population of Mill Creek borough is 161.
What is the Total Female Population of Mill Creek borough?
Total Female Population of Mill Creek borough is 153.
What is the Ratio of Males per 100 Females in Mill Creek borough?
There are 105.23 Males per 100 Females in Mill Creek borough.
What is the Ratio of Females per 100 Males in Mill Creek borough?
There are 95.03 Females per 100 Males in Mill Creek borough.
What is the Median Population Age in Mill Creek borough?
Median Population Age in Mill Creek borough is 33.5 Years.
What is the Average Family Size in Mill Creek borough
Average Family Size in Mill Creek borough is 3.9 People.
What is the Average Household Size in Mill Creek borough
Average Household Size in Mill Creek borough is 2.8 People.
How Large is the Labor Force in Mill Creek borough?
There are 156 People in the Labor Forcein in Mill Creek borough.
What is the Percentage of People in the Labor Force in Mill Creek borough?
64.5% of People are in the Labor Force in Mill Creek borough.
What is the Unemployment Rate in Mill Creek borough?
Unemployment Rate in Mill Creek borough is 3.8%.