Allensville, PA Map & Demographics
Allensville Map
Allensville Overview
$25,903
PER CAPITA INCOME
$61,667
AVG FAMILY INCOME
$61,667
AVG HOUSEHOLD INCOME
46.2%
WAGE / INCOME GAP [ % ]
53.8¢/ $1
WAGE / INCOME GAP [ $ ]
0.47
INEQUALITY / GINI INDEX
392
TOTAL POPULATION
214
MALE POPULATION
178
FEMALE POPULATION
120.22
MALES / 100 FEMALES
83.18
FEMALES / 100 MALES
34.0
MEDIAN AGE
3.7
AVG FAMILY SIZE
3.4
AVG HOUSEHOLD SIZE
170
LABOR FORCE [ PEOPLE ]
63.0%
PERCENT IN LABOR FORCE
3.5%
UNEMPLOYMENT RATE
Allensville Zip Codes
Income in Allensville
Income Overview in Allensville
Per Capita Income in Allensville is $25,903, while median incomes of families and households are $61,667 and $61,667 respectively.
| Characteristic | Number | Measure |
| Per Capita Income | 392 | $25,903 |
| Median Family Income | 102 | $61,667 |
| Mean Family Income | 102 | $89,392 |
| Median Household Income | 116 | $61,667 |
| Mean Household Income | 116 | $86,752 |
| Income Deficit | 102 | $0 |
| Wage / Income Gap (%) | 392 | 46.21% |
| Wage / Income Gap ($) | 392 | 53.79¢ per $1 |
| Gini / Inequality Index | 392 | 0.47 |
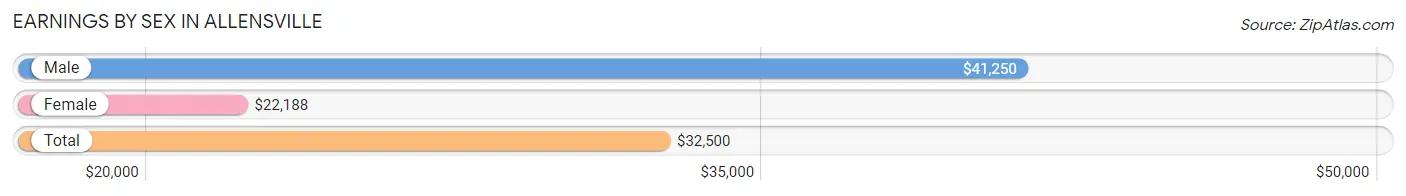
Earnings by Sex in Allensville
Average Earnings in Allensville are $32,500, $41,250 for men and $22,188 for women, a difference of 46.2%.
| Sex | Number | Average Earnings |
| Male | 107 (58.8%) | $41,250 |
| Female | 75 (41.2%) | $22,188 |
| Total | 182 (100.0%) | $32,500 |
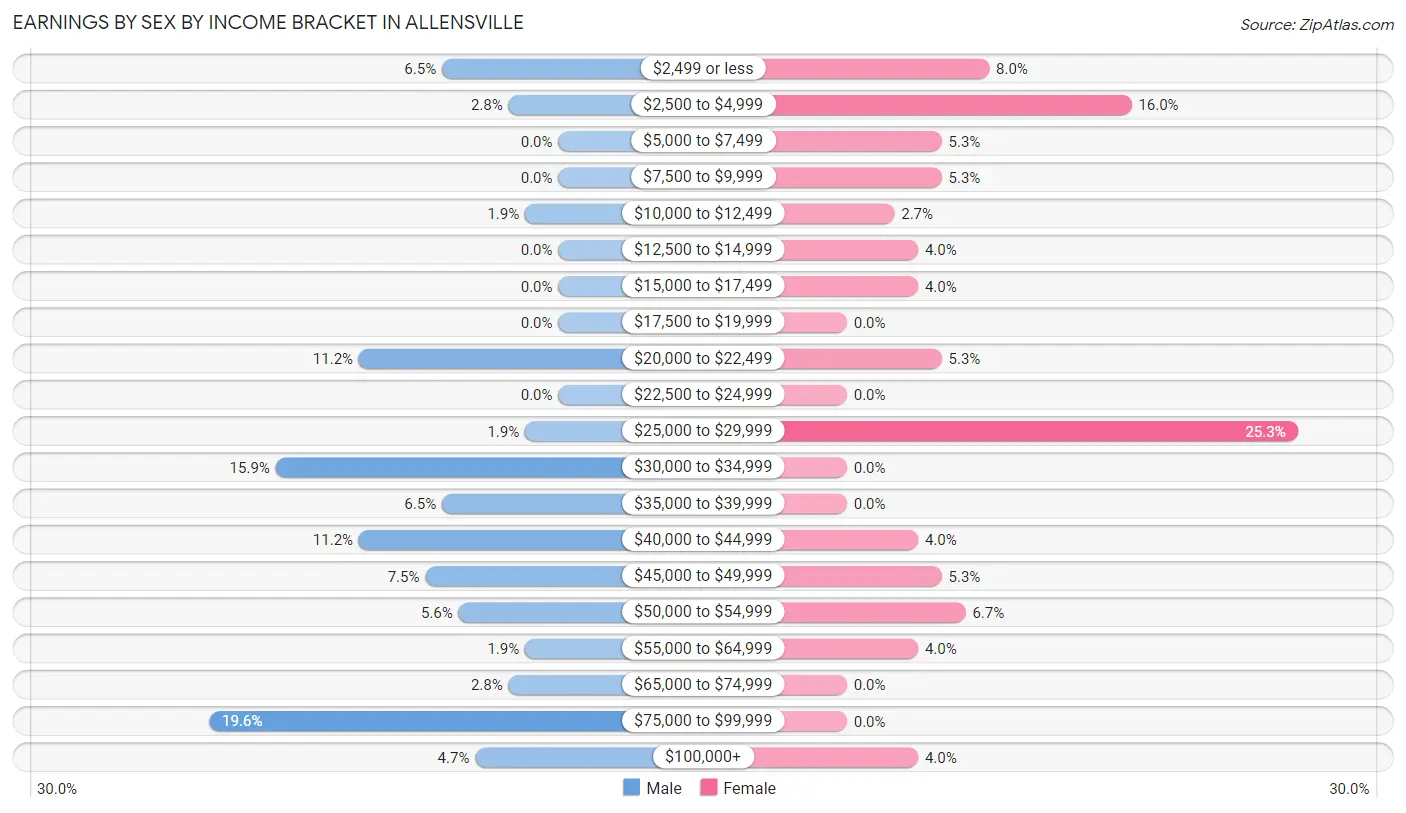
Earnings by Sex by Income Bracket in Allensville
The most common earnings brackets in Allensville are $75,000 to $99,999 for men (21 | 19.6%) and $25,000 to $29,999 for women (19 | 25.3%).
| Income | Male | Female |
| $2,499 or less | 7 (6.5%) | 6 (8.0%) |
| $2,500 to $4,999 | 3 (2.8%) | 12 (16.0%) |
| $5,000 to $7,499 | 0 (0.0%) | 4 (5.3%) |
| $7,500 to $9,999 | 0 (0.0%) | 4 (5.3%) |
| $10,000 to $12,499 | 2 (1.9%) | 2 (2.7%) |
| $12,500 to $14,999 | 0 (0.0%) | 3 (4.0%) |
| $15,000 to $17,499 | 0 (0.0%) | 3 (4.0%) |
| $17,500 to $19,999 | 0 (0.0%) | 0 (0.0%) |
| $20,000 to $22,499 | 12 (11.2%) | 4 (5.3%) |
| $22,500 to $24,999 | 0 (0.0%) | 0 (0.0%) |
| $25,000 to $29,999 | 2 (1.9%) | 19 (25.3%) |
| $30,000 to $34,999 | 17 (15.9%) | 0 (0.0%) |
| $35,000 to $39,999 | 7 (6.5%) | 0 (0.0%) |
| $40,000 to $44,999 | 12 (11.2%) | 3 (4.0%) |
| $45,000 to $49,999 | 8 (7.5%) | 4 (5.3%) |
| $50,000 to $54,999 | 6 (5.6%) | 5 (6.7%) |
| $55,000 to $64,999 | 2 (1.9%) | 3 (4.0%) |
| $65,000 to $74,999 | 3 (2.8%) | 0 (0.0%) |
| $75,000 to $99,999 | 21 (19.6%) | 0 (0.0%) |
| $100,000+ | 5 (4.7%) | 3 (4.0%) |
| Total | 107 (100.0%) | 75 (100.0%) |
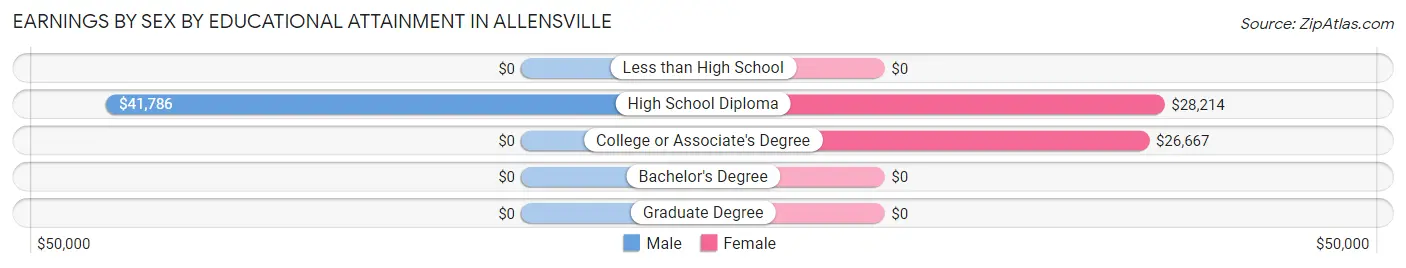
Earnings by Sex by Educational Attainment in Allensville
Average earnings in Allensville are $45,000 for men and $25,278 for women, a difference of 43.8%. Men with an educational attainment of high school diploma enjoy the highest average annual earnings of $41,786, while those with high school diploma education earn the least with $41,786. Women with an educational attainment of high school diploma earn the most with the average annual earnings of $28,214, while those with college or associate's degree education have the smallest earnings of $26,667.
| Educational Attainment | Male Income | Female Income |
| Less than High School | - | - |
| High School Diploma | $41,786 | $28,214 |
| College or Associate's Degree | - | - |
| Bachelor's Degree | - | - |
| Graduate Degree | - | - |
| Total | $45,000 | $25,278 |
Family Income in Allensville
Family Income Brackets in Allensville
According to the Allensville family income data, there are 25 families falling into the $50,000 to $74,999 income range, which is the most common income bracket and makes up 24.5% of all families.
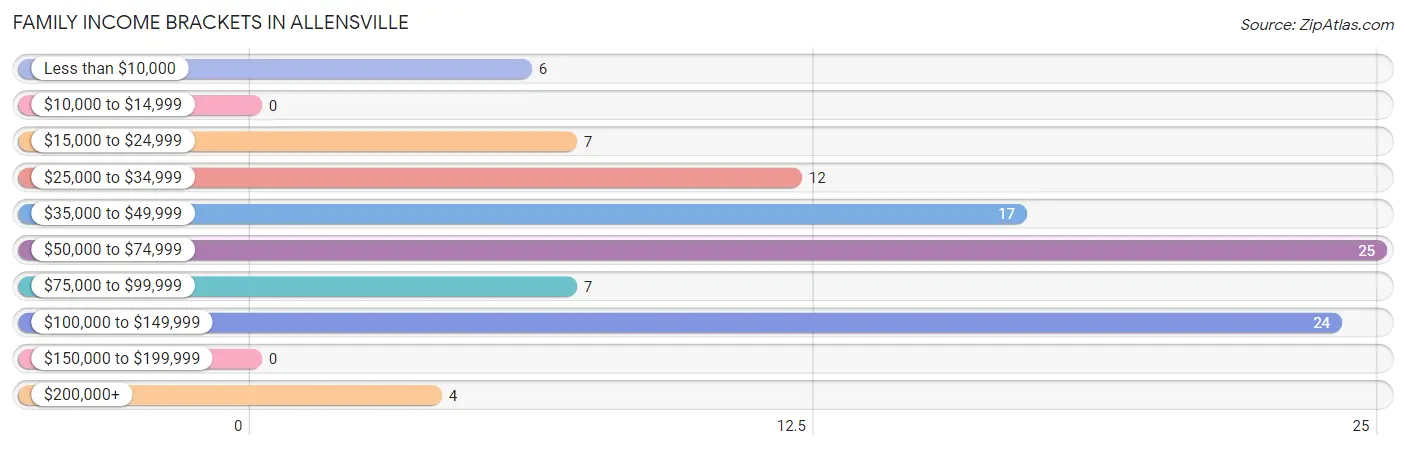
| Income Bracket | # Families | % Families |
| Less than $10,000 | 6 | 5.9% |
| $10,000 to $14,999 | 0 | 0.0% |
| $15,000 to $24,999 | 7 | 6.9% |
| $25,000 to $34,999 | 12 | 11.8% |
| $35,000 to $49,999 | 17 | 16.7% |
| $50,000 to $74,999 | 25 | 24.5% |
| $75,000 to $99,999 | 7 | 6.9% |
| $100,000 to $149,999 | 24 | 23.5% |
| $150,000 to $199,999 | 0 | 0.0% |
| $200,000+ | 4 | 3.9% |
Family Income by Famaliy Size in Allensville
3-person families (13 | 12.8%) account for the highest median family income in Allensville with $118,438 per family, while 3-person families (13 | 12.8%) have the highest median income of $39,479 per family member.
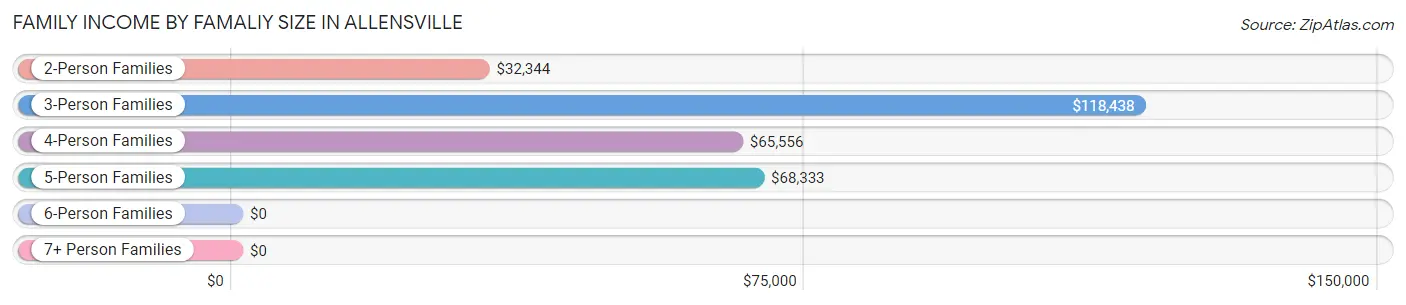
| Income Bracket | # Families | Median Income |
| 2-Person Families | 29 (28.4%) | $32,344 |
| 3-Person Families | 13 (12.8%) | $118,438 |
| 4-Person Families | 38 (37.2%) | $65,556 |
| 5-Person Families | 10 (9.8%) | $68,333 |
| 6-Person Families | 12 (11.8%) | $0 |
| 7+ Person Families | 0 (0.0%) | $0 |
| Total | 102 (100.0%) | $61,667 |
Family Income by Number of Earners in Allensville
The median family income in Allensville is $61,667, with families comprising 3+ earners (21) having the highest median family income of $85,938, while families with 1 earner (31) have the lowest median family income of $27,188, accounting for 20.6% and 30.4% of families, respectively.
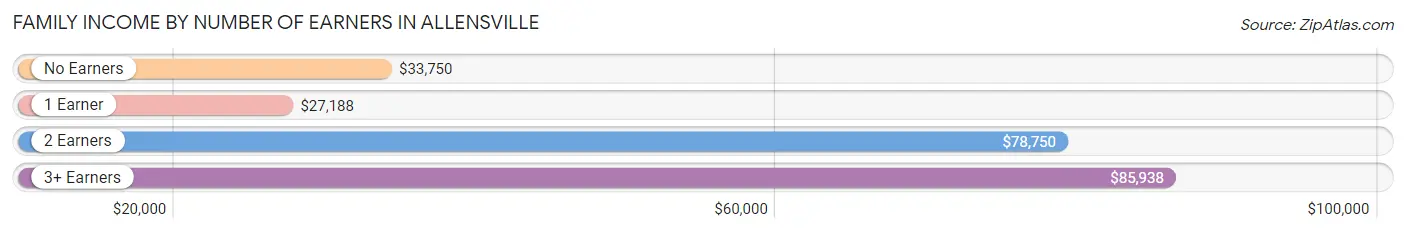
| Number of Earners | # Families | Median Income |
| No Earners | 14 (13.7%) | $33,750 |
| 1 Earner | 31 (30.4%) | $27,188 |
| 2 Earners | 36 (35.3%) | $78,750 |
| 3+ Earners | 21 (20.6%) | $85,938 |
| Total | 102 (100.0%) | $61,667 |
Household Income in Allensville
Household Income Brackets in Allensville
With 27 households falling in the category, the $50,000 to $74,999 income range is the most frequent in Allensville, accounting for 23.3% of all households.
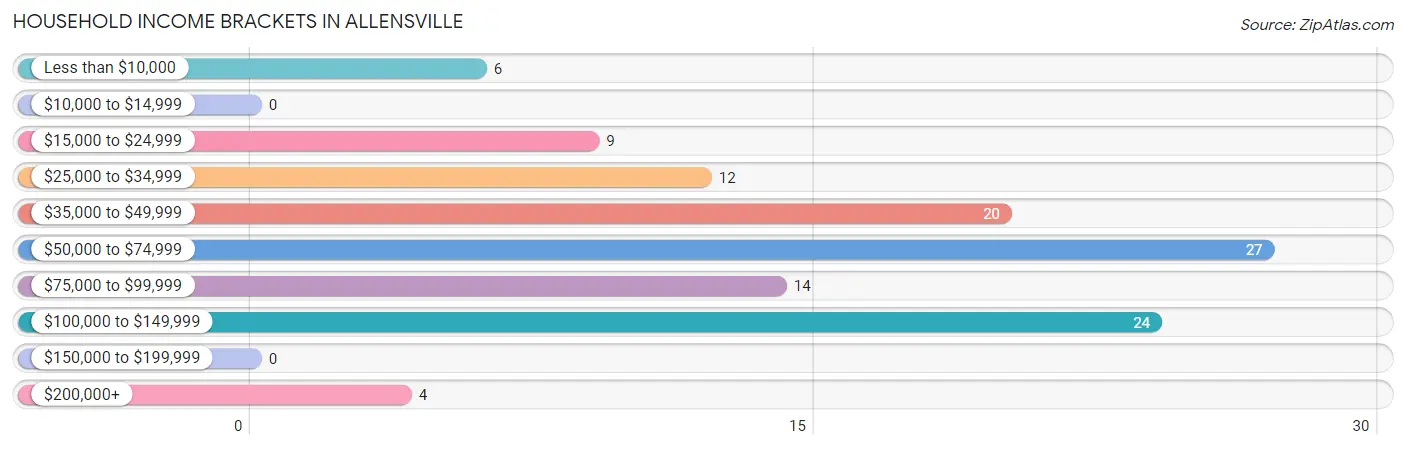
| Income Bracket | # Households | % Households |
| Less than $10,000 | 6 | 5.2% |
| $10,000 to $14,999 | 0 | 0.0% |
| $15,000 to $24,999 | 9 | 7.8% |
| $25,000 to $34,999 | 12 | 10.3% |
| $35,000 to $49,999 | 20 | 17.2% |
| $50,000 to $74,999 | 27 | 23.3% |
| $75,000 to $99,999 | 14 | 12.1% |
| $100,000 to $149,999 | 24 | 20.7% |
| $150,000 to $199,999 | 0 | 0.0% |
| $200,000+ | 4 | 3.4% |
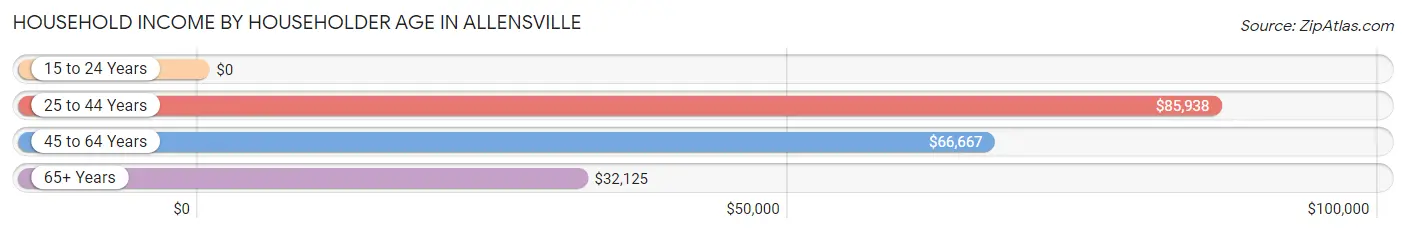
Household Income by Householder Age in Allensville
The median household income in Allensville is $61,667, with the highest median household income of $85,938 found in the 25 to 44 years age bracket for the primary householder. A total of 55 households (47.4%) fall into this category.
| Income Bracket | # Households | Median Income |
| 15 to 24 Years | 0 (0.0%) | $0 |
| 25 to 44 Years | 55 (47.4%) | $85,938 |
| 45 to 64 Years | 34 (29.3%) | $66,667 |
| 65+ Years | 27 (23.3%) | $32,125 |
| Total | 116 (100.0%) | $61,667 |
Poverty in Allensville
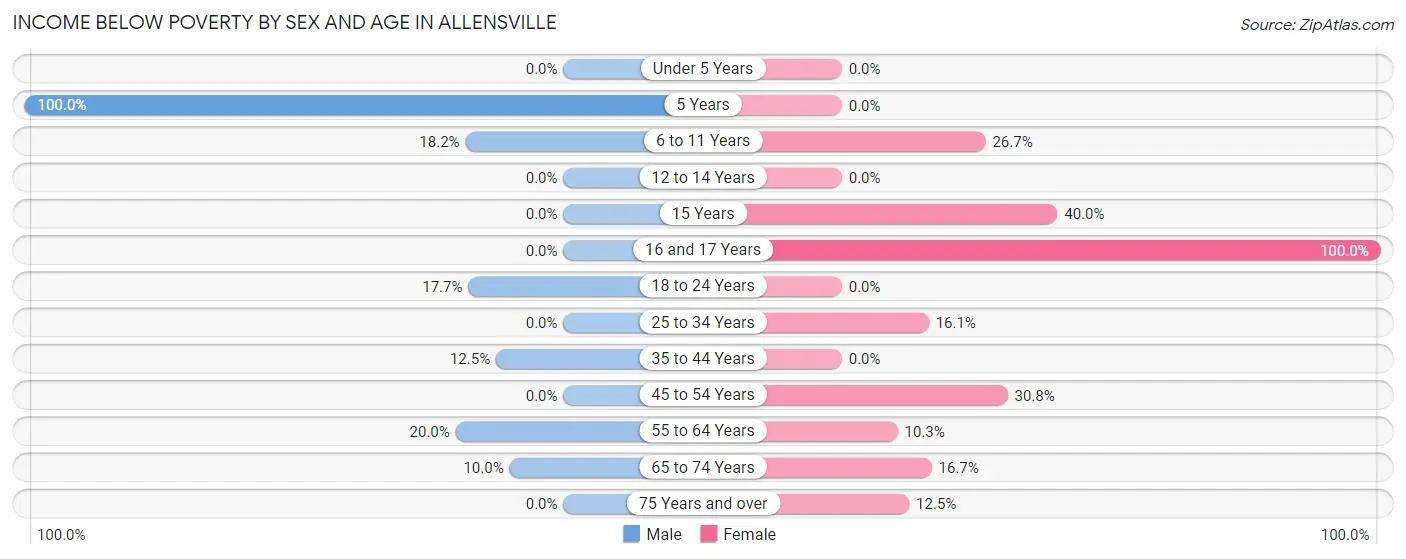
Income Below Poverty by Sex and Age in Allensville
With 11.2% poverty level for males and 13.5% for females among the residents of Allensville, 5 year old males and 16 and 17 year old females are the most vulnerable to poverty, with 4 males (100.0%) and 2 females (100.0%) in their respective age groups living below the poverty level.
| Age Bracket | Male | Female |
| Under 5 Years | 0 (0.0%) | 0 (0.0%) |
| 5 Years | 4 (100.0%) | 0 (0.0%) |
| 6 to 11 Years | 8 (18.2%) | 4 (26.7%) |
| 12 to 14 Years | 0 (0.0%) | 0 (0.0%) |
| 15 Years | 0 (0.0%) | 2 (40.0%) |
| 16 and 17 Years | 0 (0.0%) | 2 (100.0%) |
| 18 to 24 Years | 3 (17.6%) | 0 (0.0%) |
| 25 to 34 Years | 0 (0.0%) | 5 (16.1%) |
| 35 to 44 Years | 4 (12.5%) | 0 (0.0%) |
| 45 to 54 Years | 0 (0.0%) | 4 (30.8%) |
| 55 to 64 Years | 4 (20.0%) | 3 (10.3%) |
| 65 to 74 Years | 1 (10.0%) | 2 (16.7%) |
| 75 Years and over | 0 (0.0%) | 2 (12.5%) |
| Total | 24 (11.2%) | 24 (13.5%) |
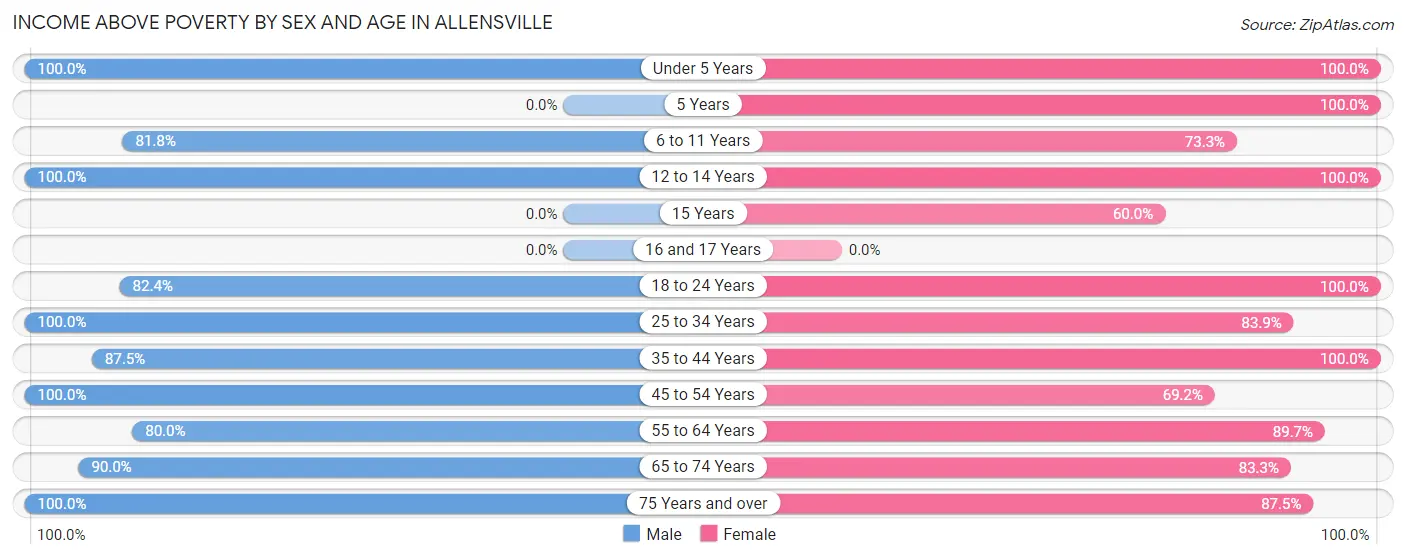
Income Above Poverty by Sex and Age in Allensville
According to the poverty statistics in Allensville, males aged under 5 years and females aged under 5 years are the age groups that are most secure financially, with 100.0% of males and 100.0% of females in these age groups living above the poverty line.
| Age Bracket | Male | Female |
| Under 5 Years | 27 (100.0%) | 7 (100.0%) |
| 5 Years | 0 (0.0%) | 11 (100.0%) |
| 6 to 11 Years | 36 (81.8%) | 11 (73.3%) |
| 12 to 14 Years | 5 (100.0%) | 4 (100.0%) |
| 15 Years | 0 (0.0%) | 3 (60.0%) |
| 16 and 17 Years | 0 (0.0%) | 0 (0.0%) |
| 18 to 24 Years | 14 (82.4%) | 7 (100.0%) |
| 25 to 34 Years | 37 (100.0%) | 26 (83.9%) |
| 35 to 44 Years | 28 (87.5%) | 26 (100.0%) |
| 45 to 54 Years | 8 (100.0%) | 9 (69.2%) |
| 55 to 64 Years | 16 (80.0%) | 26 (89.7%) |
| 65 to 74 Years | 9 (90.0%) | 10 (83.3%) |
| 75 Years and over | 10 (100.0%) | 14 (87.5%) |
| Total | 190 (88.8%) | 154 (86.5%) |
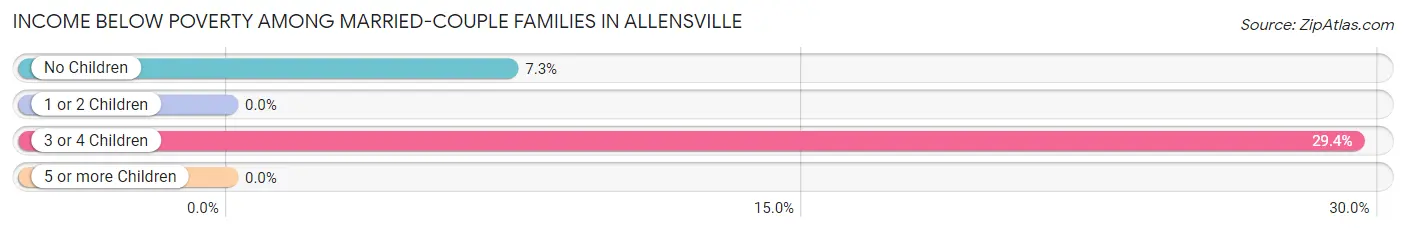
Income Below Poverty Among Married-Couple Families in Allensville
The poverty statistics for married-couple families in Allensville show that 8.9% or 8 of the total 90 families live below the poverty line. Families with 3 or 4 children have the highest poverty rate of 29.4%, comprising of 5 families. On the other hand, families with 1 or 2 children have the lowest poverty rate of 0.0%, which includes 0 families.
| Children | Above Poverty | Below Poverty |
| No Children | 38 (92.7%) | 3 (7.3%) |
| 1 or 2 Children | 32 (100.0%) | 0 (0.0%) |
| 3 or 4 Children | 12 (70.6%) | 5 (29.4%) |
| 5 or more Children | 0 (0.0%) | 0 (0.0%) |
| Total | 82 (91.1%) | 8 (8.9%) |
Income Below Poverty Among Single-Parent Households in Allensville
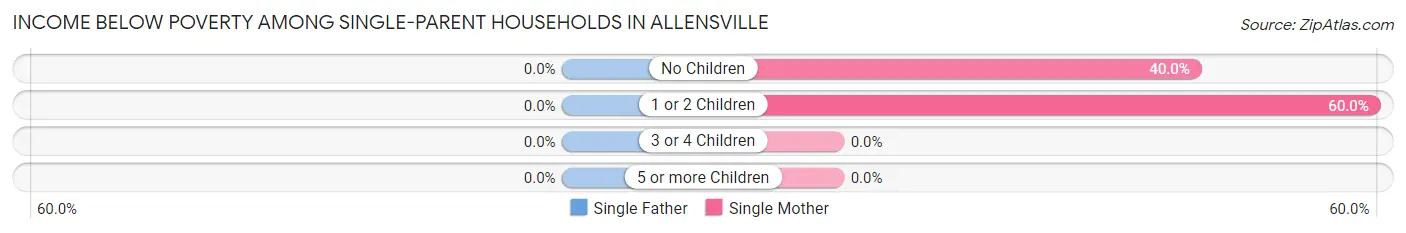
| Children | Single Father | Single Mother |
| No Children | 0 (0.0%) | 2 (40.0%) |
| 1 or 2 Children | 0 (0.0%) | 3 (60.0%) |
| 3 or 4 Children | 0 (0.0%) | 0 (0.0%) |
| 5 or more Children | 0 (0.0%) | 0 (0.0%) |
| Total | 0 (0.0%) | 5 (50.0%) |
Income Below Poverty Among Married-Couple vs Single-Parent Households in Allensville
The poverty data for Allensville shows that 8 of the married-couple family households (8.9%) and 5 of the single-parent households (41.7%) are living below the poverty level. Within the married-couple family households, those with 3 or 4 children have the highest poverty rate, with 5 households (29.4%) falling below the poverty line. Among the single-parent households, those with 1 or 2 children have the highest poverty rate, with 3 household (60.0%) living below poverty.
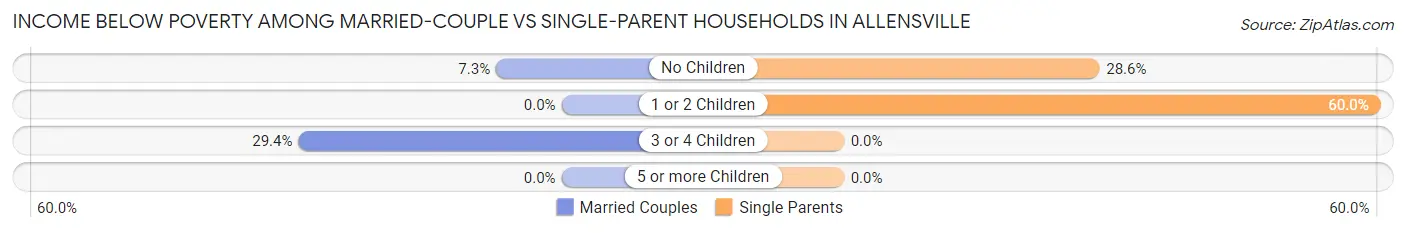
| Children | Married-Couple Families | Single-Parent Households |
| No Children | 3 (7.3%) | 2 (28.6%) |
| 1 or 2 Children | 0 (0.0%) | 3 (60.0%) |
| 3 or 4 Children | 5 (29.4%) | 0 (0.0%) |
| 5 or more Children | 0 (0.0%) | 0 (0.0%) |
| Total | 8 (8.9%) | 5 (41.7%) |
Race in Allensville
The most populous races in Allensville are White / Caucasian (371 | 94.6%), Hispanic or Latino (13 | 3.3%), and Two or more Races (13 | 3.3%).
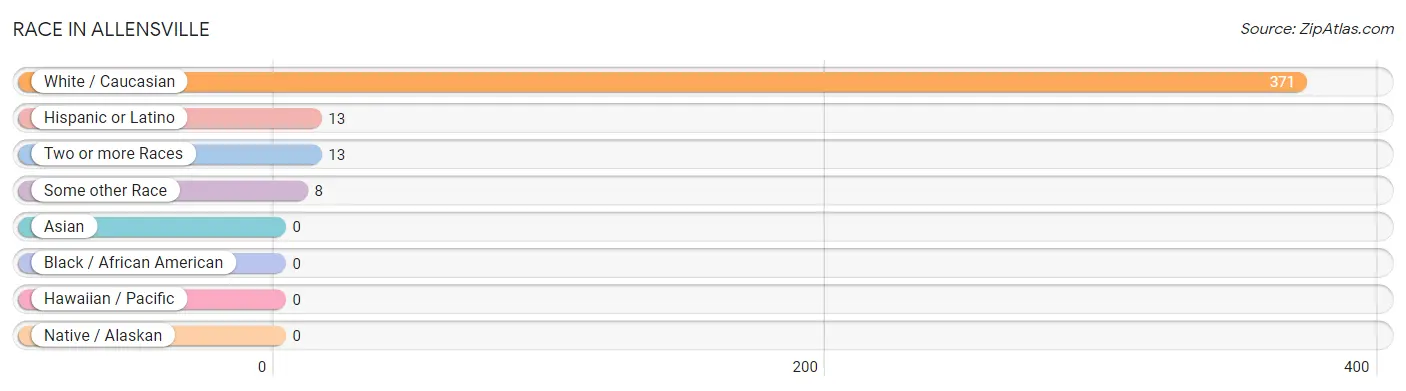
| Race | # Population | % Population |
| Asian | 0 | 0.0% |
| Black / African American | 0 | 0.0% |
| Hawaiian / Pacific | 0 | 0.0% |
| Hispanic or Latino | 13 | 3.3% |
| Native / Alaskan | 0 | 0.0% |
| White / Caucasian | 371 | 94.6% |
| Two or more Races | 13 | 3.3% |
| Some other Race | 8 | 2.0% |
| Total | 392 | 100.0% |
Ancestry in Allensville
The most populous ancestries reported in Allensville are German (83 | 21.2%), Pennsylvania German (83 | 21.2%), Swiss (44 | 11.2%), American (24 | 6.1%), and English (17 | 4.3%), together accounting for 64.0% of all Allensville residents.
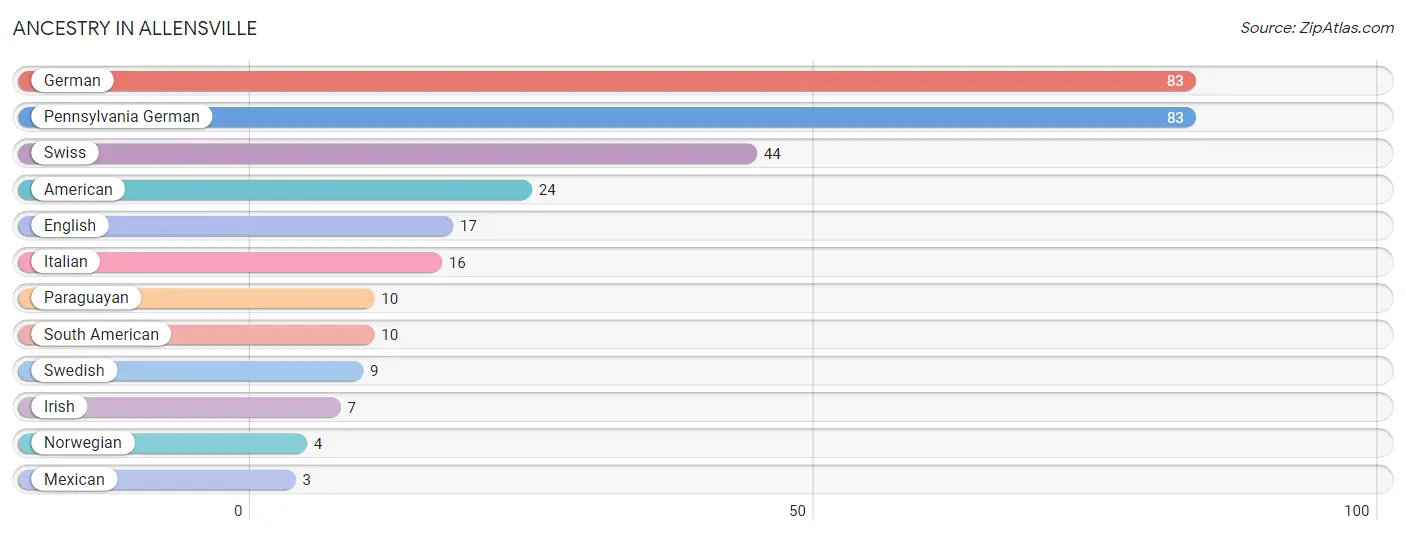
| Ancestry | # Population | % Population |
| American | 24 | 6.1% |
| English | 17 | 4.3% |
| German | 83 | 21.2% |
| Irish | 7 | 1.8% |
| Italian | 16 | 4.1% |
| Mexican | 3 | 0.8% |
| Norwegian | 4 | 1.0% |
| Paraguayan | 10 | 2.5% |
| Pennsylvania German | 83 | 21.2% |
| South American | 10 | 2.5% |
| Swedish | 9 | 2.3% |
| Swiss | 44 | 11.2% | View All 12 Rows |
Immigrants in Allensville
The most numerous immigrant groups reported in Allensville came from Latin America (10 | 2.5%), and South America (10 | 2.5%), together accounting for 5.1% of all Allensville residents.
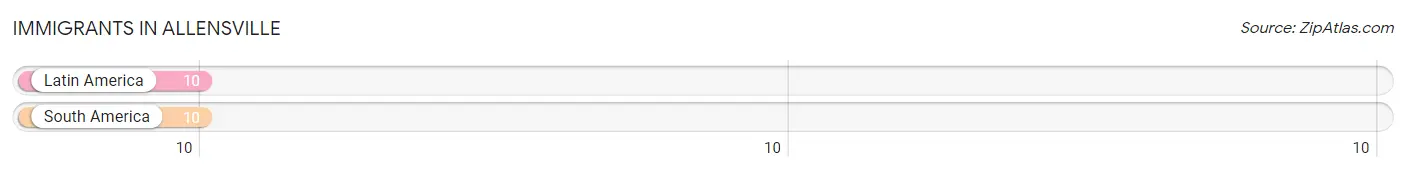
| Immigration Origin | # Population | % Population |
| Latin America | 10 | 2.5% |
| South America | 10 | 2.5% | View All 2 Rows |
Sex and Age in Allensville
Sex and Age in Allensville
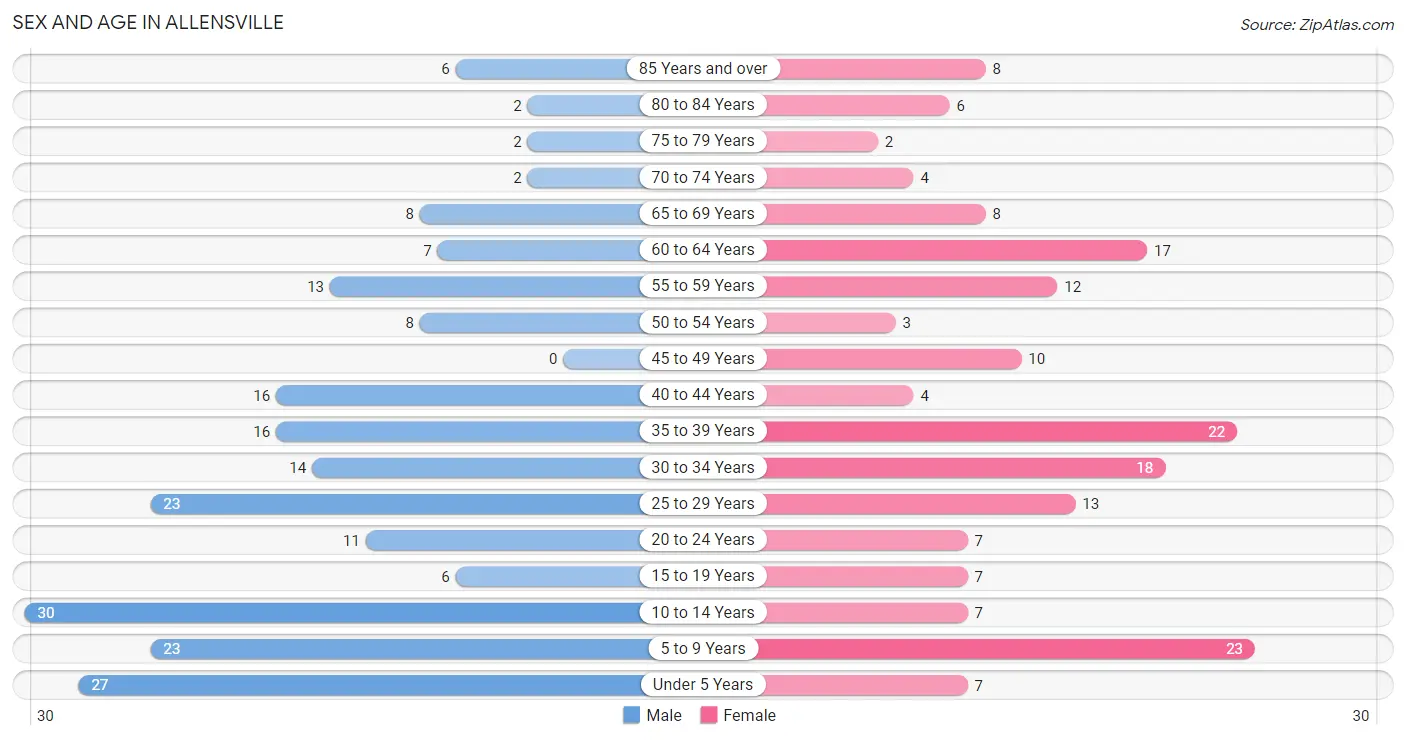
The most populous age groups in Allensville are 10 to 14 Years (30 | 14.0%) for men and 5 to 9 Years (23 | 12.9%) for women.
| Age Bracket | Male | Female |
| Under 5 Years | 27 (12.6%) | 7 (3.9%) |
| 5 to 9 Years | 23 (10.7%) | 23 (12.9%) |
| 10 to 14 Years | 30 (14.0%) | 7 (3.9%) |
| 15 to 19 Years | 6 (2.8%) | 7 (3.9%) |
| 20 to 24 Years | 11 (5.1%) | 7 (3.9%) |
| 25 to 29 Years | 23 (10.7%) | 13 (7.3%) |
| 30 to 34 Years | 14 (6.5%) | 18 (10.1%) |
| 35 to 39 Years | 16 (7.5%) | 22 (12.4%) |
| 40 to 44 Years | 16 (7.5%) | 4 (2.2%) |
| 45 to 49 Years | 0 (0.0%) | 10 (5.6%) |
| 50 to 54 Years | 8 (3.7%) | 3 (1.7%) |
| 55 to 59 Years | 13 (6.1%) | 12 (6.7%) |
| 60 to 64 Years | 7 (3.3%) | 17 (9.6%) |
| 65 to 69 Years | 8 (3.7%) | 8 (4.5%) |
| 70 to 74 Years | 2 (0.9%) | 4 (2.2%) |
| 75 to 79 Years | 2 (0.9%) | 2 (1.1%) |
| 80 to 84 Years | 2 (0.9%) | 6 (3.4%) |
| 85 Years and over | 6 (2.8%) | 8 (4.5%) |
| Total | 214 (100.0%) | 178 (100.0%) |
Families and Households in Allensville
Median Family Size in Allensville
The median family size in Allensville is 3.69 persons per family, with married-couple families (90 | 88.2%) accounting for the largest median family size of 3.89 persons per family. On the other hand, single female/mother families (10 | 9.8%) represent the smallest median family size with 2.10 persons per family.
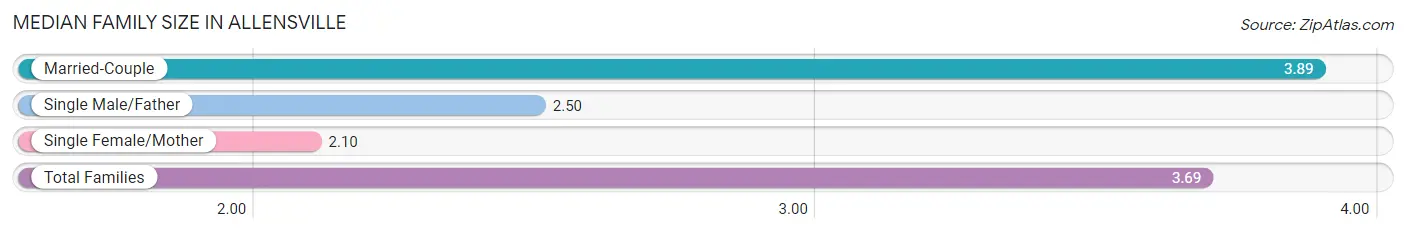
| Family Type | # Families | Family Size |
| Married-Couple | 90 (88.2%) | 3.89 |
| Single Male/Father | 2 (2.0%) | 2.50 |
| Single Female/Mother | 10 (9.8%) | 2.10 |
| Total Families | 102 (100.0%) | 3.69 |
Median Household Size in Allensville
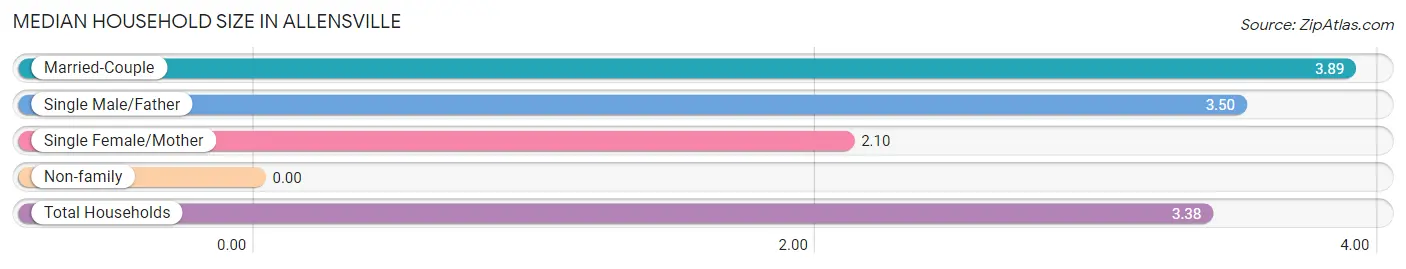
| Household Type | # Households | Household Size |
| Married-Couple | 90 (77.6%) | 3.89 |
| Single Male/Father | 2 (1.7%) | 3.50 |
| Single Female/Mother | 10 (8.6%) | 2.10 |
| Non-family | 14 (12.1%) | - |
| Total Households | 116 (100.0%) | 3.38 |
Household Size by Marriage Status in Allensville
Out of a total of 116 households in Allensville, 102 (87.9%) are family households, while 14 (12.1%) are nonfamily households. The most numerous type of family households are 4-person households, comprising 38, and the most common type of nonfamily households are 1-person households, comprising 14.
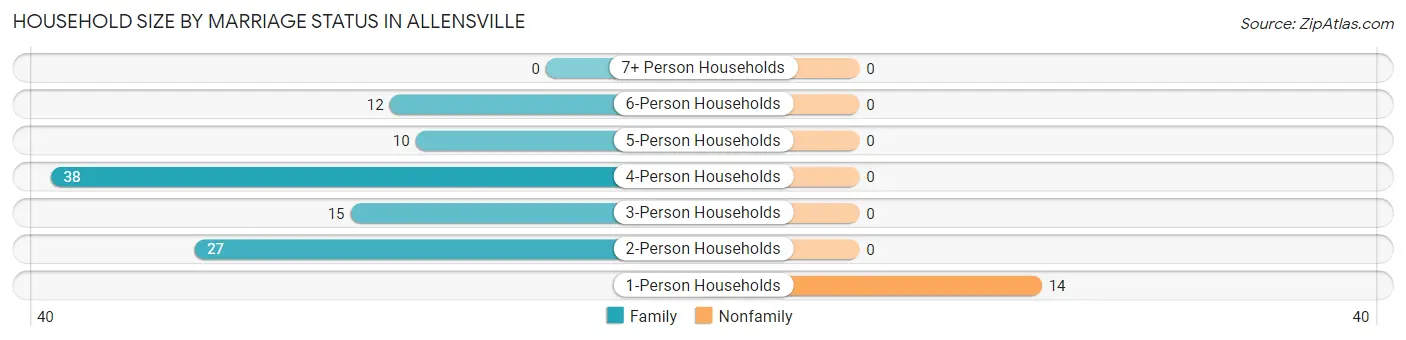
| Household Size | Family Households | Nonfamily Households |
| 1-Person Households | - | 14 (12.1%) |
| 2-Person Households | 27 (23.3%) | 0 (0.0%) |
| 3-Person Households | 15 (12.9%) | 0 (0.0%) |
| 4-Person Households | 38 (32.8%) | 0 (0.0%) |
| 5-Person Households | 10 (8.6%) | 0 (0.0%) |
| 6-Person Households | 12 (10.3%) | 0 (0.0%) |
| 7+ Person Households | 0 (0.0%) | 0 (0.0%) |
| Total | 102 (87.9%) | 14 (12.1%) |
Female Fertility in Allensville
Fertility by Age in Allensville
Average fertility rate in Allensville is 48.0 births per 1,000 women. Women in the age bracket of 20 to 34 years have the highest fertility rate with 105.0 births per 1,000 women. Women in the age bracket of 20 to 34 years acount for 100.0% of all women with births.
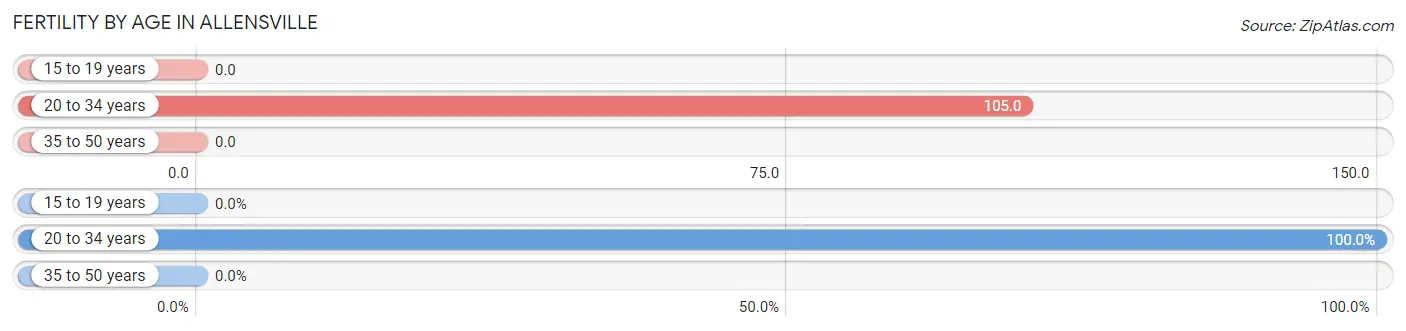
| Age Bracket | Women with Births | Births / 1,000 Women |
| 15 to 19 years | 0 (0.0%) | 0.0 |
| 20 to 34 years | 4 (100.0%) | 105.0 |
| 35 to 50 years | 0 (0.0%) | 0.0 |
| Total | 4 (100.0%) | 48.0 |
Fertility by Age by Marriage Status in Allensville

| Age Bracket | Married | Unmarried |
| 15 to 19 years | 0 (0.0%) | 0 (0.0%) |
| 20 to 34 years | 4 (100.0%) | 0 (0.0%) |
| 35 to 50 years | 0 (0.0%) | 0 (0.0%) |
| Total | 4 (100.0%) | 0 (0.0%) |
Fertility by Education in Allensville
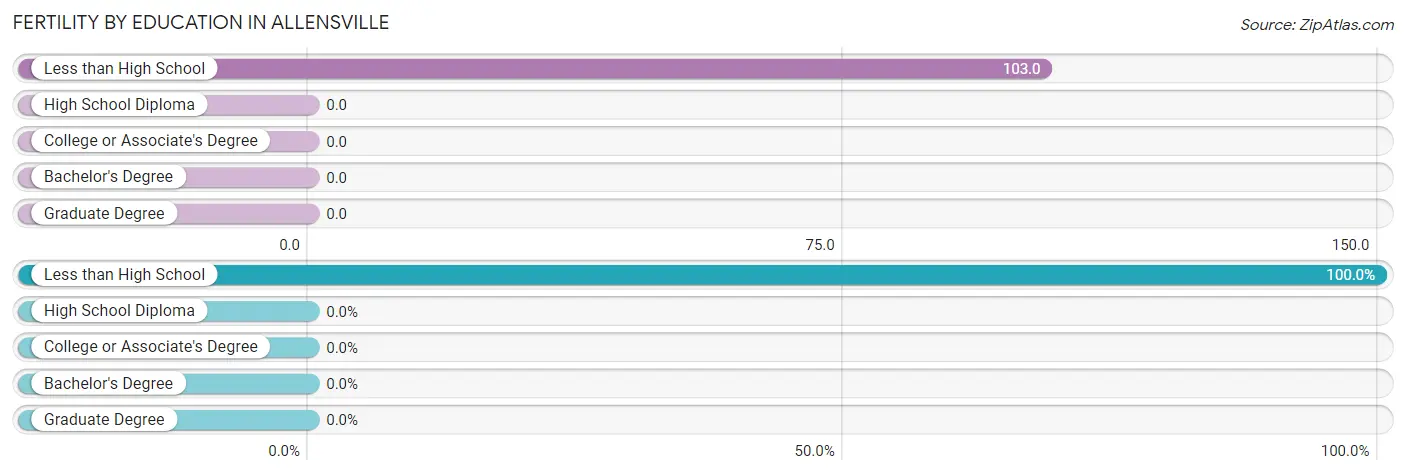
| Educational Attainment | Women with Births | Births / 1,000 Women |
| Less than High School | 4 (100.0%) | 103.0 |
| High School Diploma | 0 (0.0%) | 0.0 |
| College or Associate's Degree | 0 (0.0%) | 0.0 |
| Bachelor's Degree | 0 (0.0%) | 0.0 |
| Graduate Degree | 0 (0.0%) | 0.0 |
| Total | 4 (100.0%) | 48.0 |
Fertility by Education by Marriage Status in Allensville
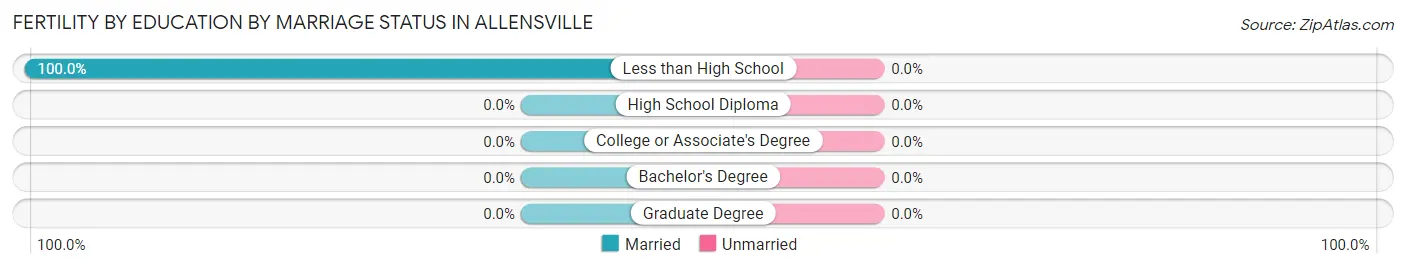
| Educational Attainment | Married | Unmarried |
| Less than High School | 4 (100.0%) | 0 (0.0%) |
| High School Diploma | 0 (0.0%) | 0 (0.0%) |
| College or Associate's Degree | 0 (0.0%) | 0 (0.0%) |
| Bachelor's Degree | 0 (0.0%) | 0 (0.0%) |
| Graduate Degree | 0 (0.0%) | 0 (0.0%) |
| Total | 4 (100.0%) | 0 (0.0%) |
Employment Characteristics in Allensville
Employment by Class of Employer in Allensville
Among the 159 employed individuals in Allensville, private company employees (113 | 71.1%), self-employed (not incorporated) (22 | 13.8%), and self-employed (incorporated) (13 | 8.2%) make up the most common classes of employment.
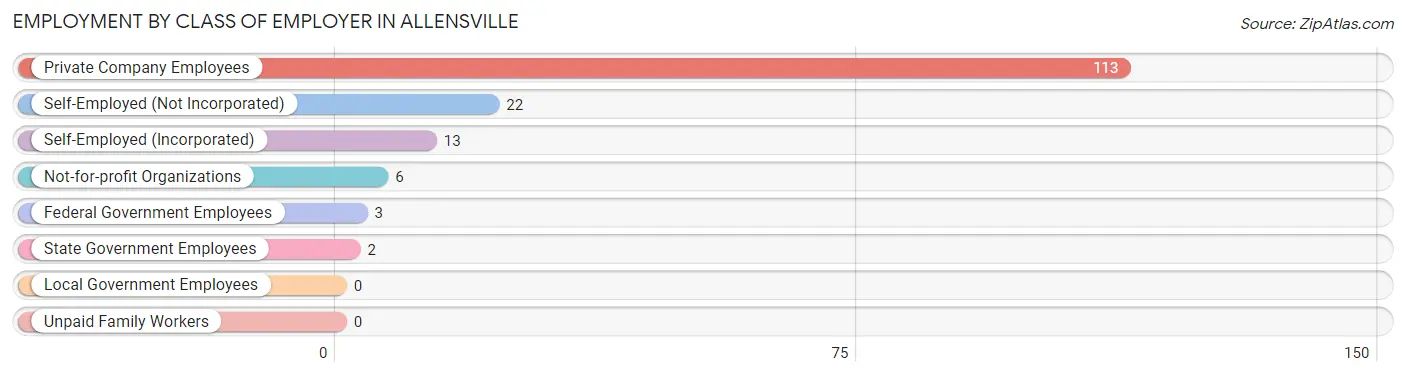
| Employer Class | # Employees | % Employees |
| Private Company Employees | 113 | 71.1% |
| Self-Employed (Incorporated) | 13 | 8.2% |
| Self-Employed (Not Incorporated) | 22 | 13.8% |
| Not-for-profit Organizations | 6 | 3.8% |
| Local Government Employees | 0 | 0.0% |
| State Government Employees | 2 | 1.3% |
| Federal Government Employees | 3 | 1.9% |
| Unpaid Family Workers | 0 | 0.0% |
| Total | 159 | 100.0% |
Employment Status by Age in Allensville
According to the labor force statistics for Allensville, out of the total population over 16 years of age (270), 63.0% or 170 individuals are in the labor force, with 3.5% or 6 of them unemployed. The age group with the highest labor force participation rate is 45 to 54 years, with 100.0% or 21 individuals in the labor force. Within the labor force, the 20 to 24 years age range has the highest percentage of unemployed individuals, with 27.3% or 3 of them being unemployed.
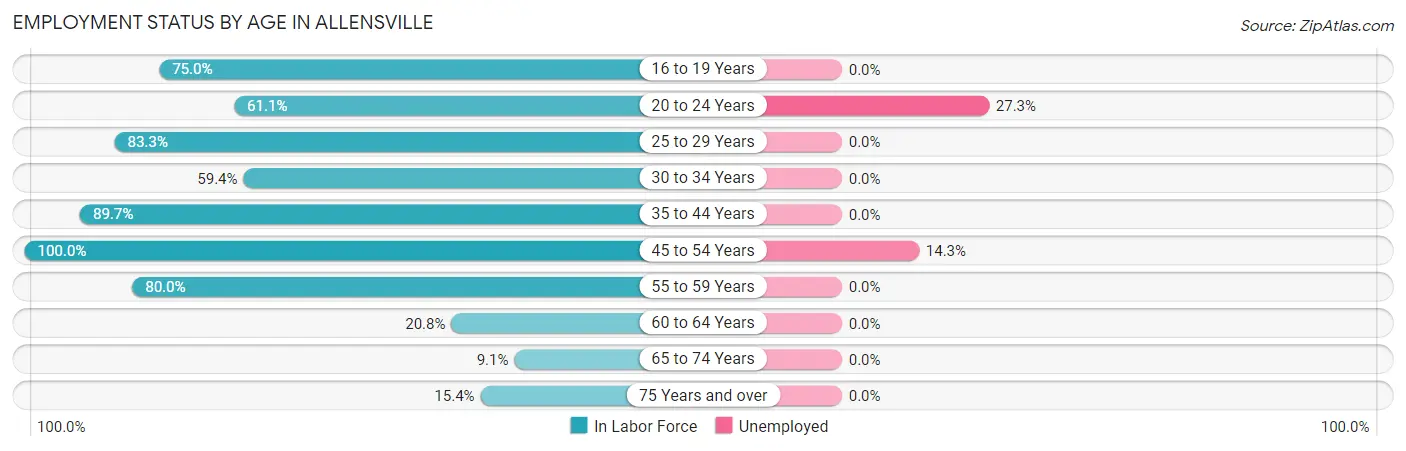
| Age Bracket | In Labor Force | Unemployed |
| 16 to 19 Years | 6 (75.0%) | 0 (0.0%) |
| 20 to 24 Years | 11 (61.1%) | 3 (27.3%) |
| 25 to 29 Years | 30 (83.3%) | 0 (0.0%) |
| 30 to 34 Years | 19 (59.4%) | 0 (0.0%) |
| 35 to 44 Years | 52 (89.7%) | 0 (0.0%) |
| 45 to 54 Years | 21 (100.0%) | 3 (14.3%) |
| 55 to 59 Years | 20 (80.0%) | 0 (0.0%) |
| 60 to 64 Years | 5 (20.8%) | 0 (0.0%) |
| 65 to 74 Years | 2 (9.1%) | 0 (0.0%) |
| 75 Years and over | 4 (15.4%) | 0 (0.0%) |
| Total | 170 (63.0%) | 6 (3.5%) |
Employment Status by Educational Attainment in Allensville
According to labor force statistics for Allensville, 75.0% of individuals (147) out of the total population between 25 and 64 years of age (196) are in the labor force, with 2.0% or 3 of them being unemployed. The group with the highest labor force participation rate are those with the educational attainment of high school diploma, with 79.7% or 59 individuals in the labor force. Within the labor force, individuals with college / associate degree education have the highest percentage of unemployment, with 15.0% or 3 of them being unemployed.
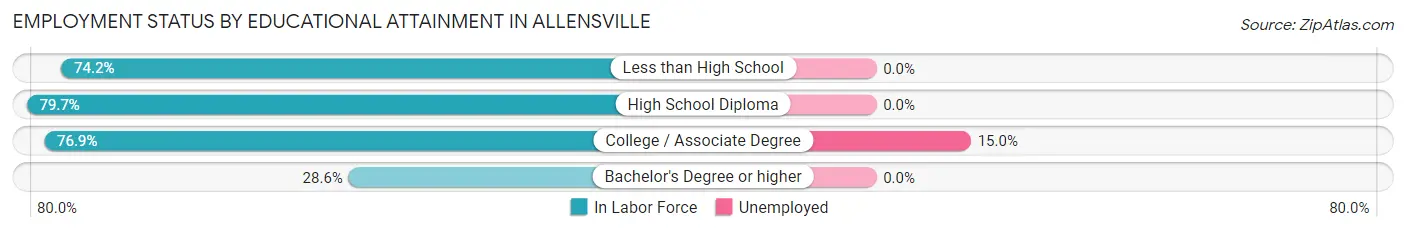
| Educational Attainment | In Labor Force | Unemployed |
| Less than High School | 66 (74.2%) | 0 (0.0%) |
| High School Diploma | 59 (79.7%) | 0 (0.0%) |
| College / Associate Degree | 20 (76.9%) | 4 (15.0%) |
| Bachelor's Degree or higher | 2 (28.6%) | 0 (0.0%) |
| Total | 147 (75.0%) | 4 (2.0%) |
Employment Occupations by Sex in Allensville
Management, Business, Science and Arts Occupations
The most common Management, Business, Science and Arts occupations in Allensville are Management (17 | 10.4%), Community & Social Service (6 | 3.7%), and Education Instruction & Library (6 | 3.7%).
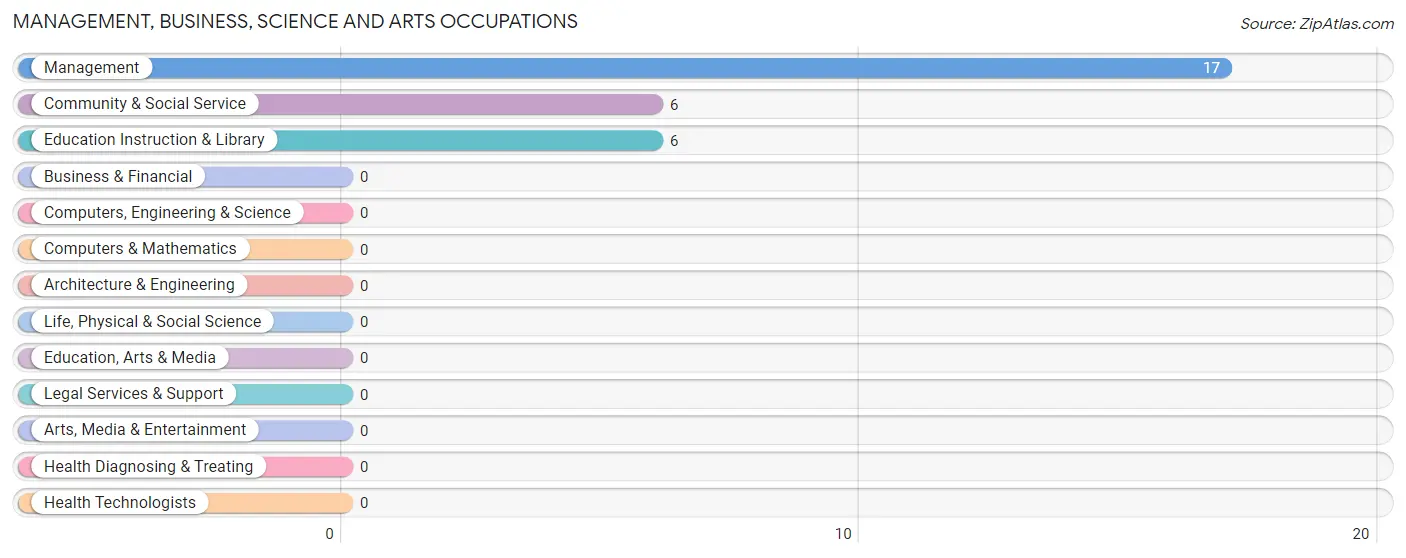
Management, Business, Science and Arts Occupations by Sex
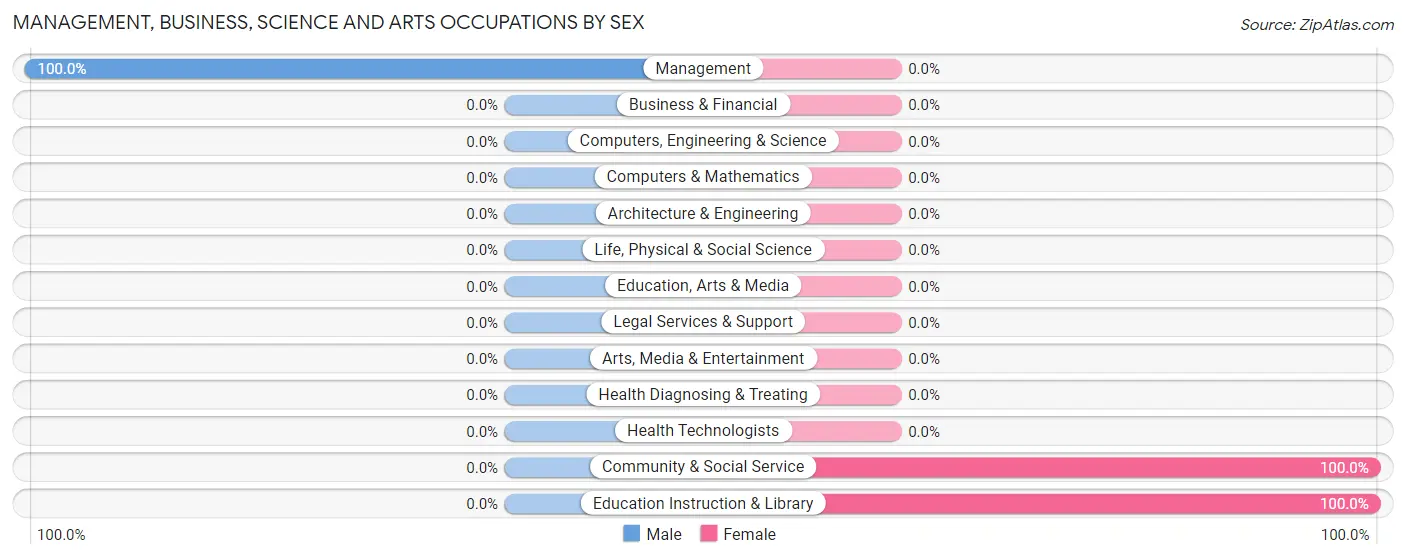
| Occupation | Male | Female |
| Management | 17 (100.0%) | 0 (0.0%) |
| Business & Financial | 0 (0.0%) | 0 (0.0%) |
| Computers, Engineering & Science | 0 (0.0%) | 0 (0.0%) |
| Computers & Mathematics | 0 (0.0%) | 0 (0.0%) |
| Architecture & Engineering | 0 (0.0%) | 0 (0.0%) |
| Life, Physical & Social Science | 0 (0.0%) | 0 (0.0%) |
| Community & Social Service | 0 (0.0%) | 6 (100.0%) |
| Education, Arts & Media | 0 (0.0%) | 0 (0.0%) |
| Legal Services & Support | 0 (0.0%) | 0 (0.0%) |
| Education Instruction & Library | 0 (0.0%) | 6 (100.0%) |
| Arts, Media & Entertainment | 0 (0.0%) | 0 (0.0%) |
| Health Diagnosing & Treating | 0 (0.0%) | 0 (0.0%) |
| Health Technologists | 0 (0.0%) | 0 (0.0%) |
| Total (Category) | 17 (73.9%) | 6 (26.1%) |
| Total (Overall) | 103 (62.8%) | 61 (37.2%) |
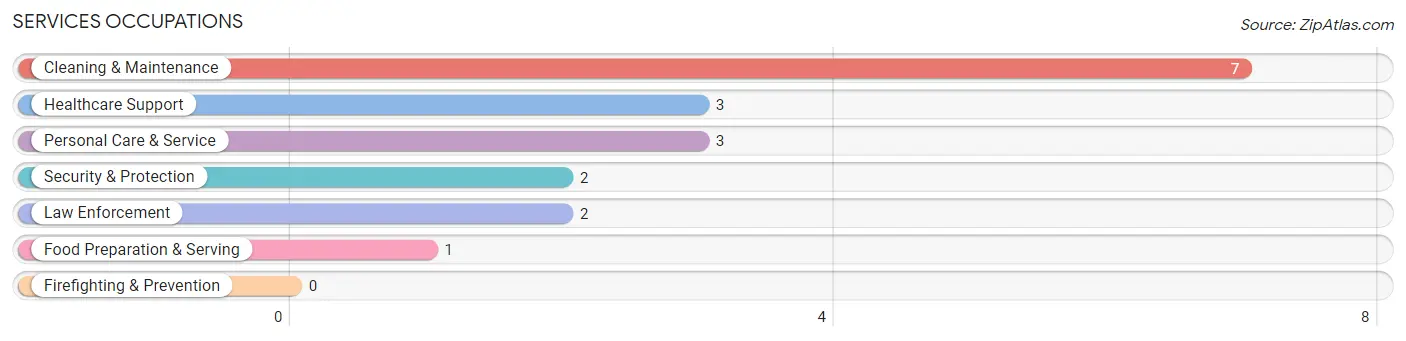
Services Occupations
The most common Services occupations in Allensville are Cleaning & Maintenance (7 | 4.3%), Healthcare Support (3 | 1.8%), Personal Care & Service (3 | 1.8%), Security & Protection (2 | 1.2%), and Law Enforcement (2 | 1.2%).
Services Occupations by Sex
Within the Services occupations in Allensville, the most male-oriented occupations are Security & Protection (100.0%), Law Enforcement (100.0%), and Cleaning & Maintenance (42.9%), while the most female-oriented occupations are Healthcare Support (100.0%), Food Preparation & Serving (100.0%), and Personal Care & Service (100.0%).
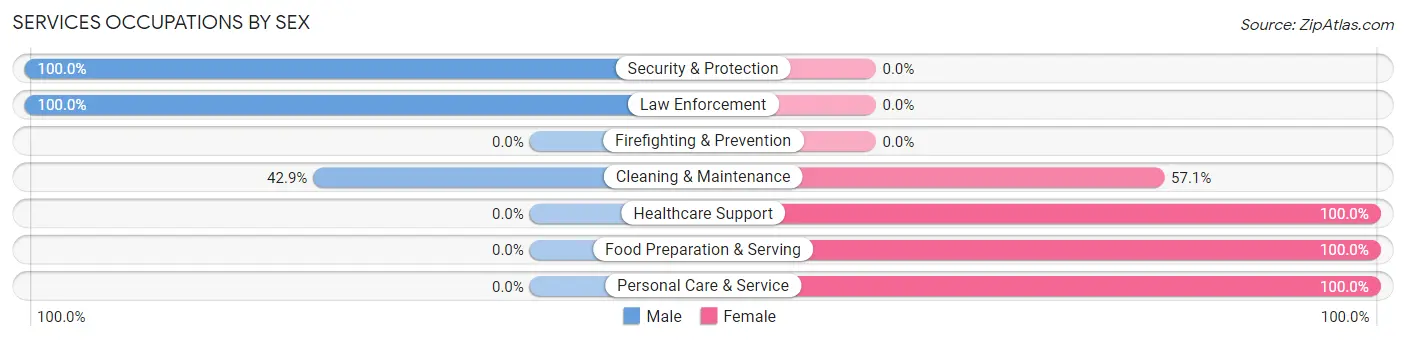
| Occupation | Male | Female |
| Healthcare Support | 0 (0.0%) | 3 (100.0%) |
| Security & Protection | 2 (100.0%) | 0 (0.0%) |
| Firefighting & Prevention | 0 (0.0%) | 0 (0.0%) |
| Law Enforcement | 2 (100.0%) | 0 (0.0%) |
| Food Preparation & Serving | 0 (0.0%) | 1 (100.0%) |
| Cleaning & Maintenance | 3 (42.9%) | 4 (57.1%) |
| Personal Care & Service | 0 (0.0%) | 3 (100.0%) |
| Total (Category) | 5 (31.2%) | 11 (68.8%) |
| Total (Overall) | 103 (62.8%) | 61 (37.2%) |
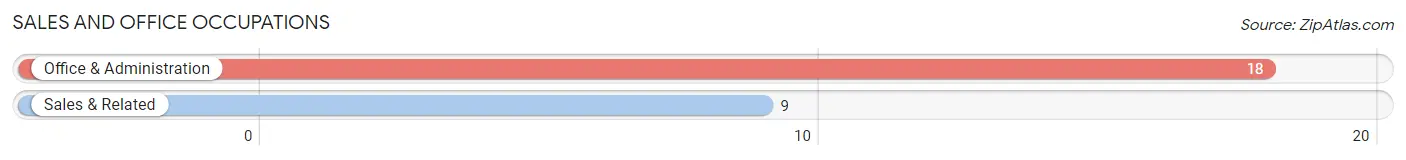
Sales and Office Occupations
The most common Sales and Office occupations in Allensville are Office & Administration (18 | 11.0%), and Sales & Related (9 | 5.5%).
Sales and Office Occupations by Sex

| Occupation | Male | Female |
| Sales & Related | 0 (0.0%) | 9 (100.0%) |
| Office & Administration | 6 (33.3%) | 12 (66.7%) |
| Total (Category) | 6 (22.2%) | 21 (77.8%) |
| Total (Overall) | 103 (62.8%) | 61 (37.2%) |
Natural Resources, Construction and Maintenance Occupations
The most common Natural Resources, Construction and Maintenance occupations in Allensville are Construction & Extraction (18 | 11.0%), Installation, Maintenance & Repair (14 | 8.5%), and Farming, Fishing & Forestry (11 | 6.7%).

Natural Resources, Construction and Maintenance Occupations by Sex

| Occupation | Male | Female |
| Farming, Fishing & Forestry | 3 (27.3%) | 8 (72.7%) |
| Construction & Extraction | 18 (100.0%) | 0 (0.0%) |
| Installation, Maintenance & Repair | 14 (100.0%) | 0 (0.0%) |
| Total (Category) | 35 (81.4%) | 8 (18.6%) |
| Total (Overall) | 103 (62.8%) | 61 (37.2%) |
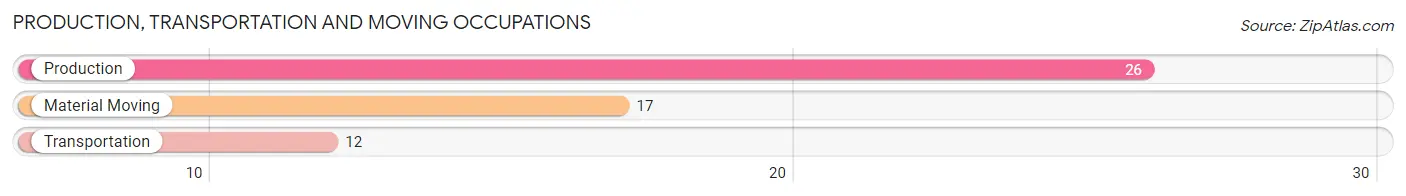
Production, Transportation and Moving Occupations
The most common Production, Transportation and Moving occupations in Allensville are Production (26 | 15.9%), Material Moving (17 | 10.4%), and Transportation (12 | 7.3%).
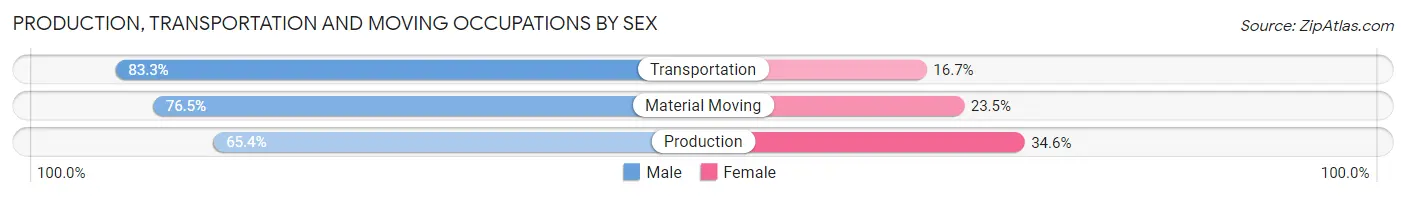
Production, Transportation and Moving Occupations by Sex
| Occupation | Male | Female |
| Production | 17 (65.4%) | 9 (34.6%) |
| Transportation | 10 (83.3%) | 2 (16.7%) |
| Material Moving | 13 (76.5%) | 4 (23.5%) |
| Total (Category) | 40 (72.7%) | 15 (27.3%) |
| Total (Overall) | 103 (62.8%) | 61 (37.2%) |
Employment Industries by Sex in Allensville
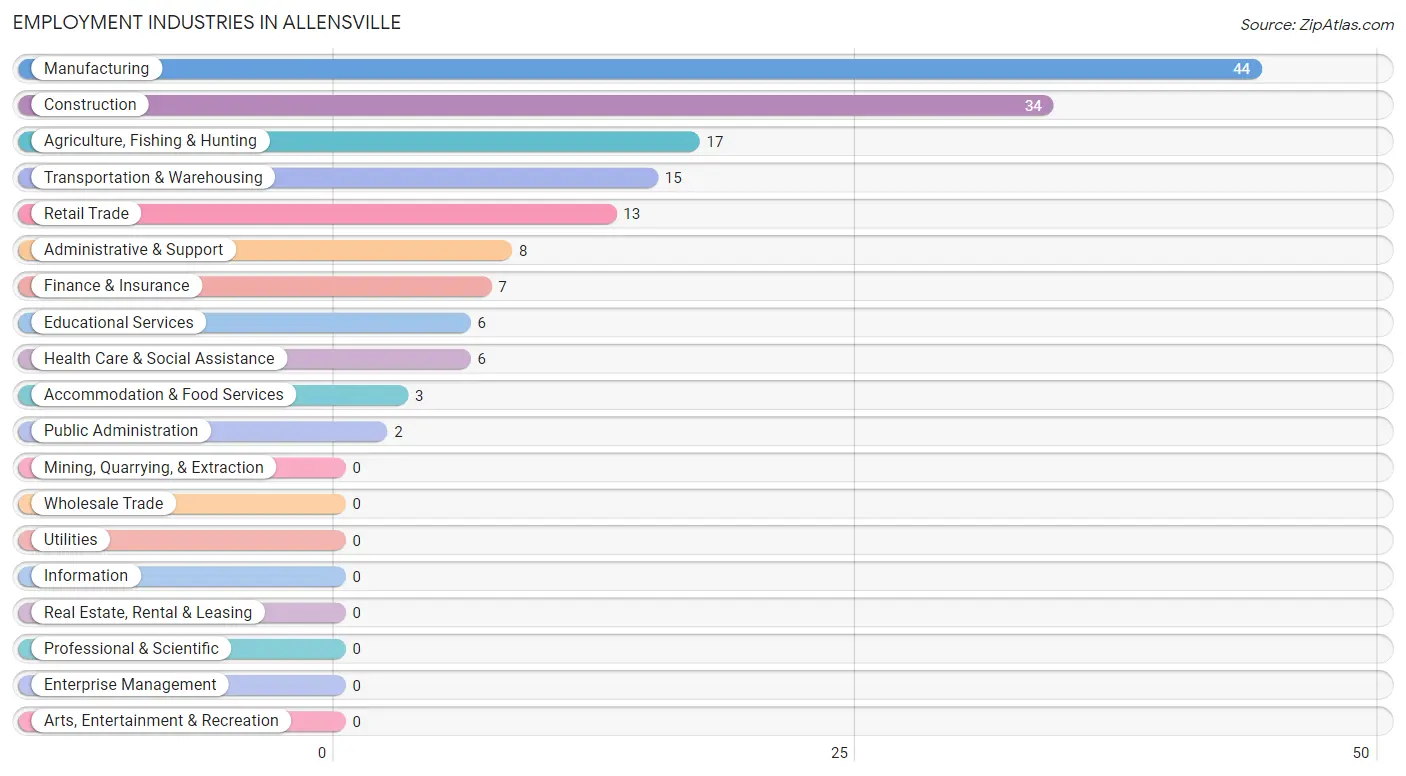
Employment Industries in Allensville
The major employment industries in Allensville include Manufacturing (44 | 26.8%), Construction (34 | 20.7%), Agriculture, Fishing & Hunting (17 | 10.4%), Transportation & Warehousing (15 | 9.1%), and Retail Trade (13 | 7.9%).
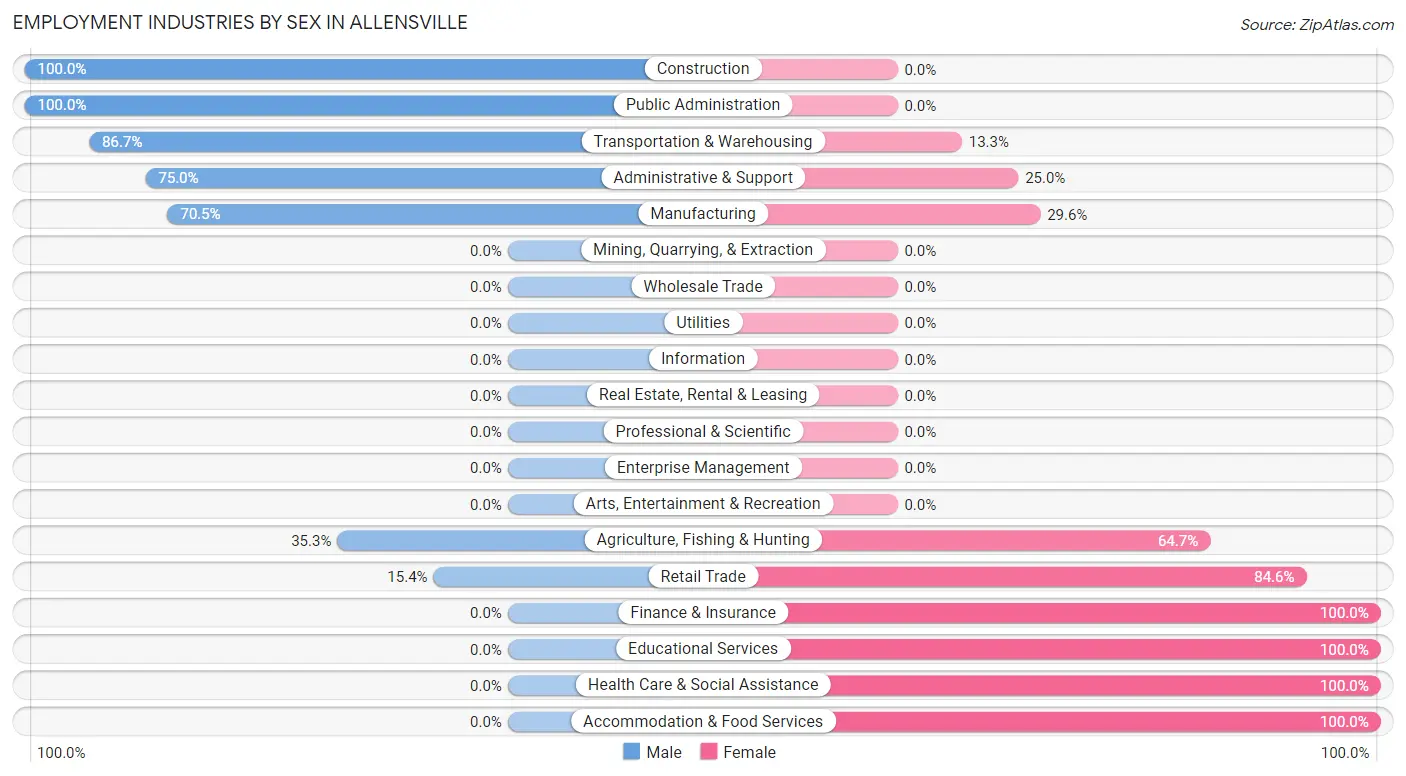
Employment Industries by Sex in Allensville
The Allensville industries that see more men than women are Construction (100.0%), Public Administration (100.0%), and Transportation & Warehousing (86.7%), whereas the industries that tend to have a higher number of women are Finance & Insurance (100.0%), Educational Services (100.0%), and Health Care & Social Assistance (100.0%).
| Industry | Male | Female |
| Agriculture, Fishing & Hunting | 6 (35.3%) | 11 (64.7%) |
| Mining, Quarrying, & Extraction | 0 (0.0%) | 0 (0.0%) |
| Construction | 34 (100.0%) | 0 (0.0%) |
| Manufacturing | 31 (70.5%) | 13 (29.5%) |
| Wholesale Trade | 0 (0.0%) | 0 (0.0%) |
| Retail Trade | 2 (15.4%) | 11 (84.6%) |
| Transportation & Warehousing | 13 (86.7%) | 2 (13.3%) |
| Utilities | 0 (0.0%) | 0 (0.0%) |
| Information | 0 (0.0%) | 0 (0.0%) |
| Finance & Insurance | 0 (0.0%) | 7 (100.0%) |
| Real Estate, Rental & Leasing | 0 (0.0%) | 0 (0.0%) |
| Professional & Scientific | 0 (0.0%) | 0 (0.0%) |
| Enterprise Management | 0 (0.0%) | 0 (0.0%) |
| Administrative & Support | 6 (75.0%) | 2 (25.0%) |
| Educational Services | 0 (0.0%) | 6 (100.0%) |
| Health Care & Social Assistance | 0 (0.0%) | 6 (100.0%) |
| Arts, Entertainment & Recreation | 0 (0.0%) | 0 (0.0%) |
| Accommodation & Food Services | 0 (0.0%) | 3 (100.0%) |
| Public Administration | 2 (100.0%) | 0 (0.0%) |
| Total | 103 (62.8%) | 61 (37.2%) |
Education in Allensville
School Enrollment in Allensville
The most common levels of schooling among the 92 students in Allensville are middle school (31 | 33.7%), elementary school (30 | 32.6%), and nursery / preschool (11 | 12.0%).
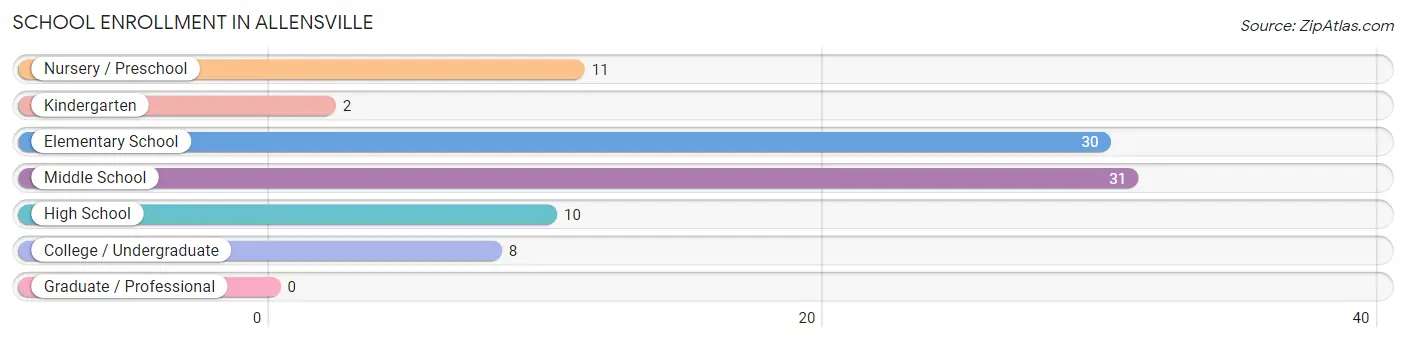
| School Level | # Students | % Students |
| Nursery / Preschool | 11 | 12.0% |
| Kindergarten | 2 | 2.2% |
| Elementary School | 30 | 32.6% |
| Middle School | 31 | 33.7% |
| High School | 10 | 10.9% |
| College / Undergraduate | 8 | 8.7% |
| Graduate / Professional | 0 | 0.0% |
| Total | 92 | 100.0% |
School Enrollment by Age by Funding Source in Allensville
Out of a total of 92 students who are enrolled in schools in Allensville, 49 (53.3%) attend a private institution, while the remaining 43 (46.7%) are enrolled in public schools. The age group of 3 to 4 year olds has the highest likelihood of being enrolled in private schools, with 5 (100.0% in the age bracket) enrolled. Conversely, the age group of 15 to 17 year olds has the lowest likelihood of being enrolled in a private school, with 7 (100.0% in the age bracket) attending a public institution.
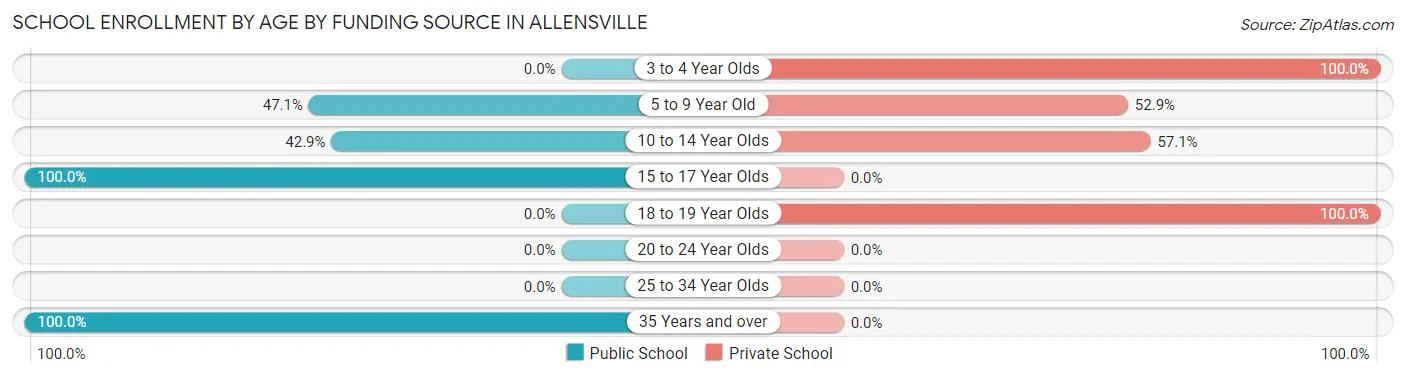
| Age Bracket | Public School | Private School |
| 3 to 4 Year Olds | 0 (0.0%) | 5 (100.0%) |
| 5 to 9 Year Old | 16 (47.1%) | 18 (52.9%) |
| 10 to 14 Year Olds | 15 (42.9%) | 20 (57.1%) |
| 15 to 17 Year Olds | 7 (100.0%) | 0 (0.0%) |
| 18 to 19 Year Olds | 0 (0.0%) | 6 (100.0%) |
| 20 to 24 Year Olds | 0 (0.0%) | 0 (0.0%) |
| 25 to 34 Year Olds | 0 (0.0%) | 0 (0.0%) |
| 35 Years and over | 5 (100.0%) | 0 (0.0%) |
| Total | 43 (46.7%) | 49 (53.3%) |
Educational Attainment by Field of Study in Allensville
Bio, nature & agricultural (7 | 63.6%), engineering (2 | 18.2%), and literature & languages (2 | 18.2%) are the most common fields of study among 11 individuals in Allensville who have obtained a bachelor's degree or higher.
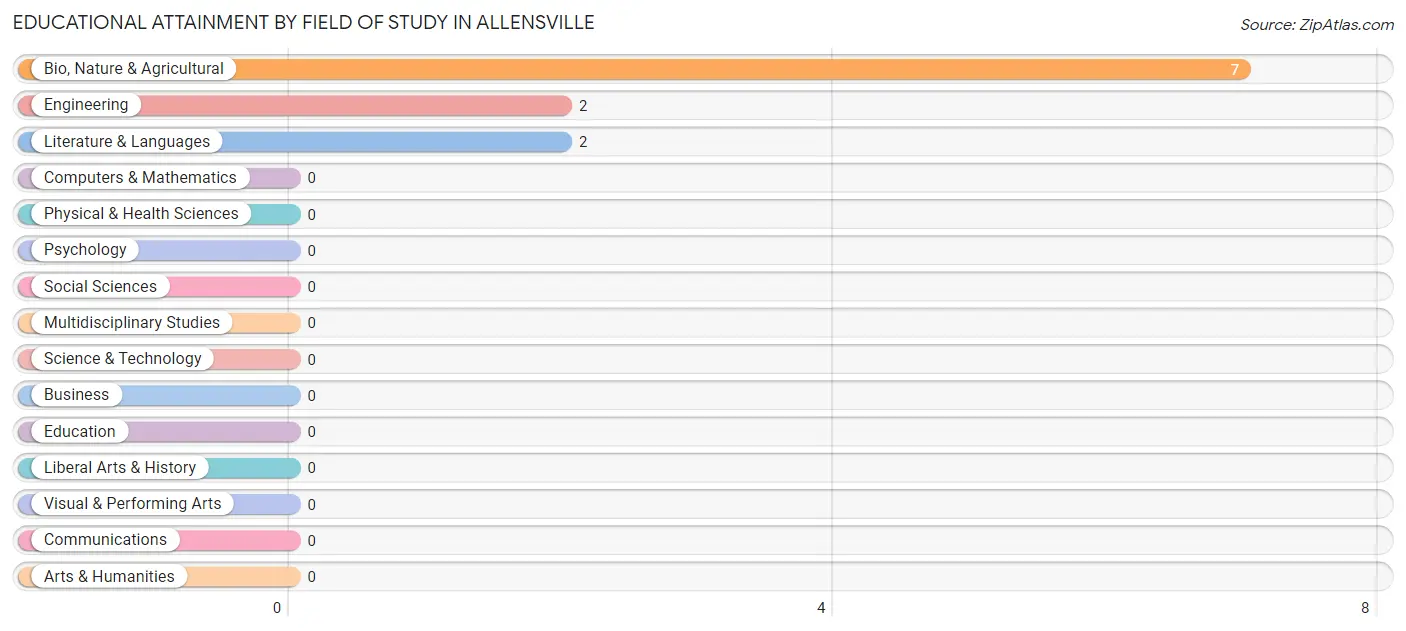
| Field of Study | # Graduates | % Graduates |
| Computers & Mathematics | 0 | 0.0% |
| Bio, Nature & Agricultural | 7 | 63.6% |
| Physical & Health Sciences | 0 | 0.0% |
| Psychology | 0 | 0.0% |
| Social Sciences | 0 | 0.0% |
| Engineering | 2 | 18.2% |
| Multidisciplinary Studies | 0 | 0.0% |
| Science & Technology | 0 | 0.0% |
| Business | 0 | 0.0% |
| Education | 0 | 0.0% |
| Literature & Languages | 2 | 18.2% |
| Liberal Arts & History | 0 | 0.0% |
| Visual & Performing Arts | 0 | 0.0% |
| Communications | 0 | 0.0% |
| Arts & Humanities | 0 | 0.0% |
| Total | 11 | 100.0% |
Transportation & Commute in Allensville
Vehicle Availability by Sex in Allensville
The most prevalent vehicle ownership categories in Allensville are males with 2 vehicles (49, accounting for 49.0%) and females with 2 vehicles (24, making up 83.1%).
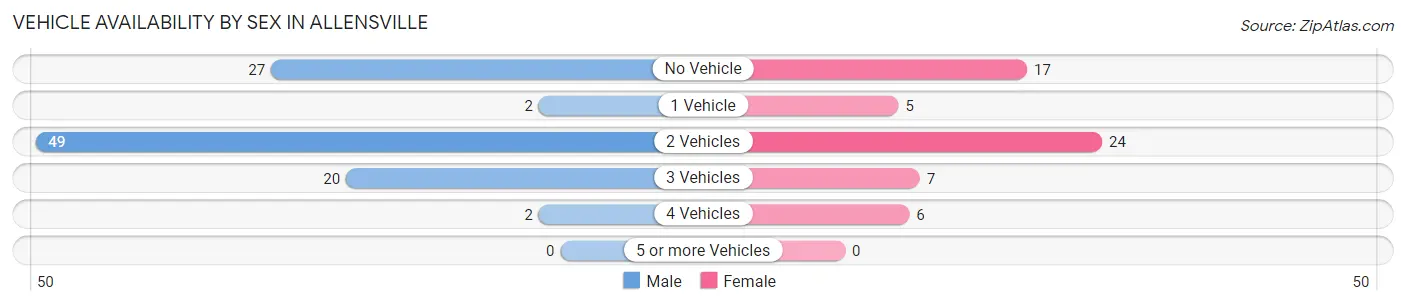
| Vehicles Available | Male | Female |
| No Vehicle | 27 (27.0%) | 17 (28.8%) |
| 1 Vehicle | 2 (2.0%) | 5 (8.5%) |
| 2 Vehicles | 49 (49.0%) | 24 (40.7%) |
| 3 Vehicles | 20 (20.0%) | 7 (11.9%) |
| 4 Vehicles | 2 (2.0%) | 6 (10.2%) |
| 5 or more Vehicles | 0 (0.0%) | 0 (0.0%) |
| Total | 100 (100.0%) | 59 (100.0%) |
Commute Time in Allensville
The most frequently occuring commute durations in Allensville are 10 to 14 minutes (32 commuters, 22.9%), less than 5 minutes (26 commuters, 18.6%), and 5 to 9 minutes (25 commuters, 17.9%).
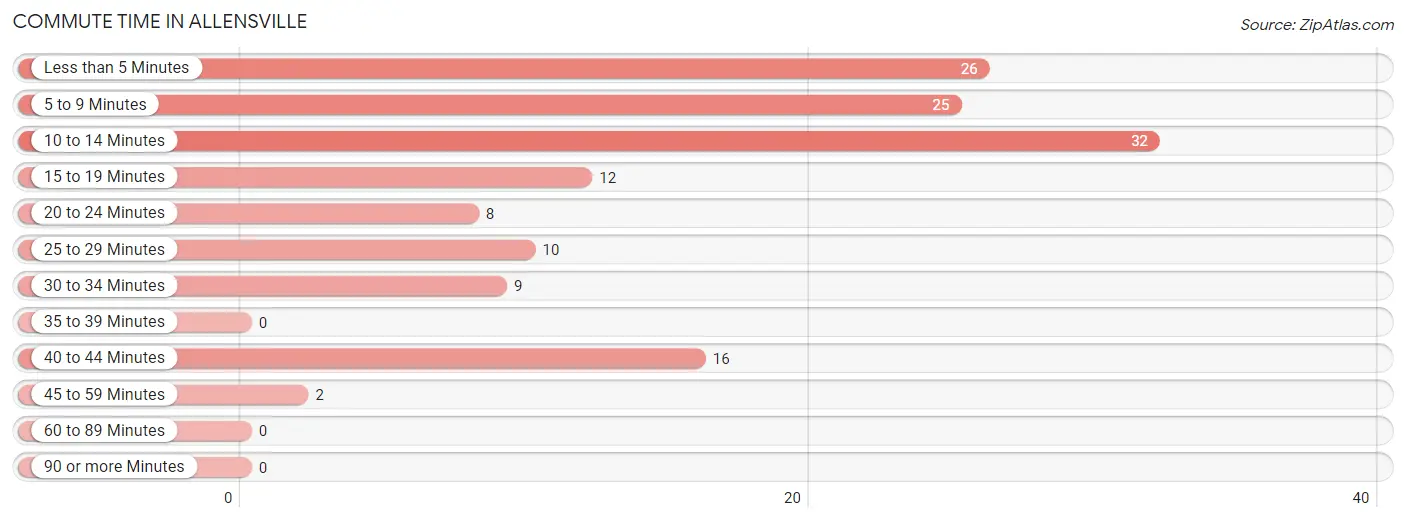
| Commute Time | # Commuters | % Commuters |
| Less than 5 Minutes | 26 | 18.6% |
| 5 to 9 Minutes | 25 | 17.9% |
| 10 to 14 Minutes | 32 | 22.9% |
| 15 to 19 Minutes | 12 | 8.6% |
| 20 to 24 Minutes | 8 | 5.7% |
| 25 to 29 Minutes | 10 | 7.1% |
| 30 to 34 Minutes | 9 | 6.4% |
| 35 to 39 Minutes | 0 | 0.0% |
| 40 to 44 Minutes | 16 | 11.4% |
| 45 to 59 Minutes | 2 | 1.4% |
| 60 to 89 Minutes | 0 | 0.0% |
| 90 or more Minutes | 0 | 0.0% |
Commute Time by Sex in Allensville
The most common commute times in Allensville are less than 5 minutes (21 commuters, 23.1%) for males and 10 to 14 minutes (15 commuters, 30.6%) for females.
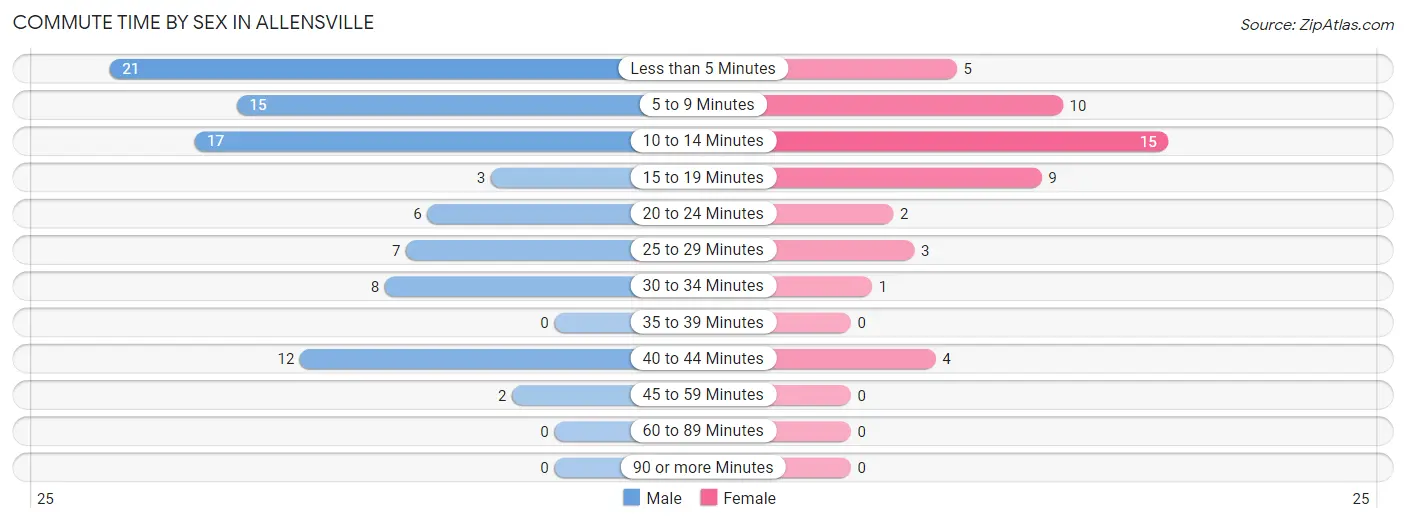
| Commute Time | Male | Female |
| Less than 5 Minutes | 21 (23.1%) | 5 (10.2%) |
| 5 to 9 Minutes | 15 (16.5%) | 10 (20.4%) |
| 10 to 14 Minutes | 17 (18.7%) | 15 (30.6%) |
| 15 to 19 Minutes | 3 (3.3%) | 9 (18.4%) |
| 20 to 24 Minutes | 6 (6.6%) | 2 (4.1%) |
| 25 to 29 Minutes | 7 (7.7%) | 3 (6.1%) |
| 30 to 34 Minutes | 8 (8.8%) | 1 (2.0%) |
| 35 to 39 Minutes | 0 (0.0%) | 0 (0.0%) |
| 40 to 44 Minutes | 12 (13.2%) | 4 (8.2%) |
| 45 to 59 Minutes | 2 (2.2%) | 0 (0.0%) |
| 60 to 89 Minutes | 0 (0.0%) | 0 (0.0%) |
| 90 or more Minutes | 0 (0.0%) | 0 (0.0%) |
Time of Departure to Work by Sex in Allensville
The most frequent times of departure to work in Allensville are 5:00 AM to 5:29 AM (20, 22.0%) for males and 7:30 AM to 7:59 AM (31, 63.3%) for females.
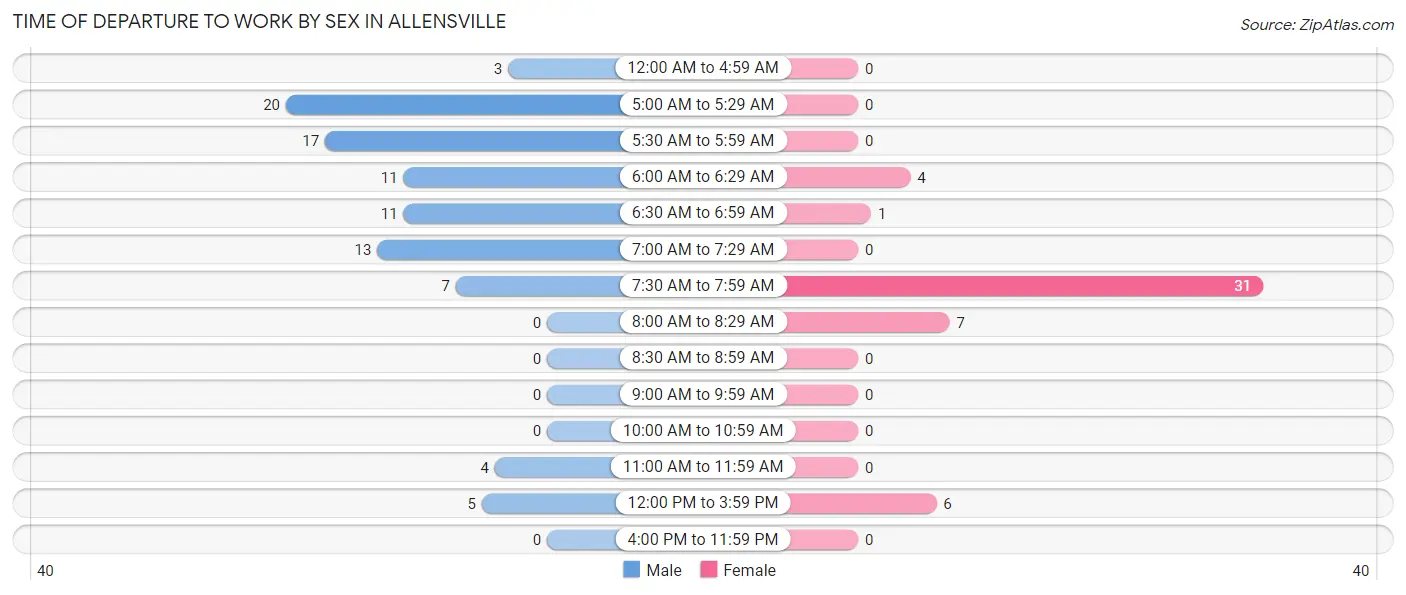
| Time of Departure | Male | Female |
| 12:00 AM to 4:59 AM | 3 (3.3%) | 0 (0.0%) |
| 5:00 AM to 5:29 AM | 20 (22.0%) | 0 (0.0%) |
| 5:30 AM to 5:59 AM | 17 (18.7%) | 0 (0.0%) |
| 6:00 AM to 6:29 AM | 11 (12.1%) | 4 (8.2%) |
| 6:30 AM to 6:59 AM | 11 (12.1%) | 1 (2.0%) |
| 7:00 AM to 7:29 AM | 13 (14.3%) | 0 (0.0%) |
| 7:30 AM to 7:59 AM | 7 (7.7%) | 31 (63.3%) |
| 8:00 AM to 8:29 AM | 0 (0.0%) | 7 (14.3%) |
| 8:30 AM to 8:59 AM | 0 (0.0%) | 0 (0.0%) |
| 9:00 AM to 9:59 AM | 0 (0.0%) | 0 (0.0%) |
| 10:00 AM to 10:59 AM | 0 (0.0%) | 0 (0.0%) |
| 11:00 AM to 11:59 AM | 4 (4.4%) | 0 (0.0%) |
| 12:00 PM to 3:59 PM | 5 (5.5%) | 6 (12.2%) |
| 4:00 PM to 11:59 PM | 0 (0.0%) | 0 (0.0%) |
| Total | 91 (100.0%) | 49 (100.0%) |
Housing Occupancy in Allensville
Occupancy by Ownership in Allensville
Of the total 116 dwellings in Allensville, owner-occupied units account for 90 (77.6%), while renter-occupied units make up 26 (22.4%).
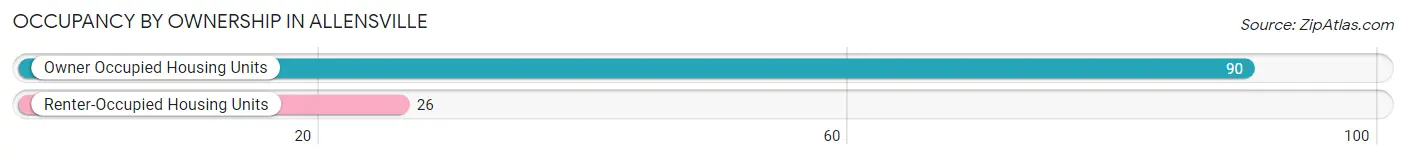
| Occupancy | # Housing Units | % Housing Units |
| Owner Occupied Housing Units | 90 | 77.6% |
| Renter-Occupied Housing Units | 26 | 22.4% |
| Total Occupied Housing Units | 116 | 100.0% |
Occupancy by Household Size in Allensville
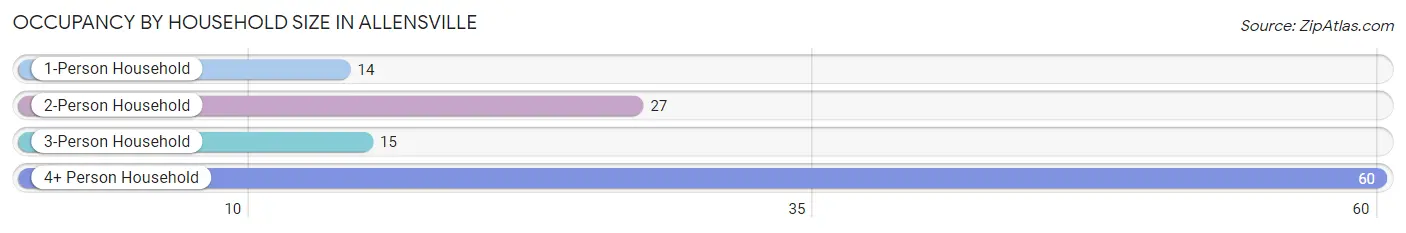
| Household Size | # Housing Units | % Housing Units |
| 1-Person Household | 14 | 12.1% |
| 2-Person Household | 27 | 23.3% |
| 3-Person Household | 15 | 12.9% |
| 4+ Person Household | 60 | 51.7% |
| Total Housing Units | 116 | 100.0% |
Occupancy by Ownership by Household Size in Allensville
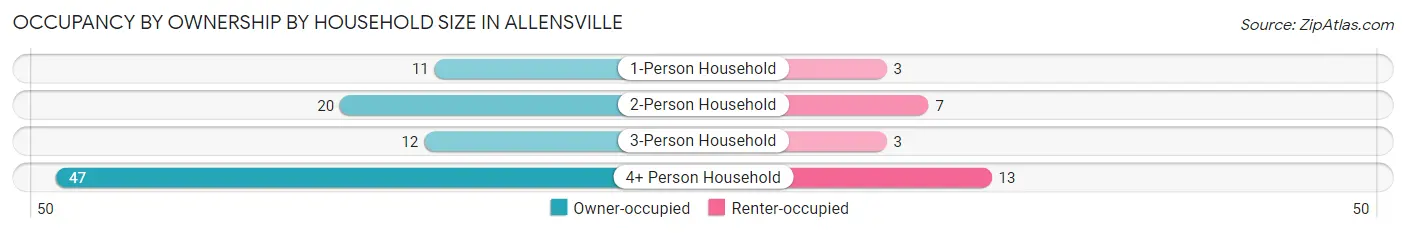
| Household Size | Owner-occupied | Renter-occupied |
| 1-Person Household | 11 (78.6%) | 3 (21.4%) |
| 2-Person Household | 20 (74.1%) | 7 (25.9%) |
| 3-Person Household | 12 (80.0%) | 3 (20.0%) |
| 4+ Person Household | 47 (78.3%) | 13 (21.7%) |
| Total Housing Units | 90 (77.6%) | 26 (22.4%) |
Occupancy by Educational Attainment in Allensville
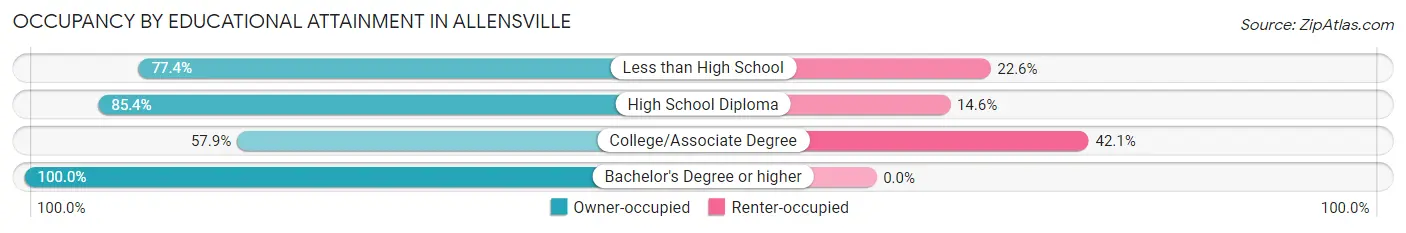
| Household Size | Owner-occupied | Renter-occupied |
| Less than High School | 41 (77.4%) | 12 (22.6%) |
| High School Diploma | 35 (85.4%) | 6 (14.6%) |
| College/Associate Degree | 11 (57.9%) | 8 (42.1%) |
| Bachelor's Degree or higher | 3 (100.0%) | 0 (0.0%) |
Occupancy by Age of Householder in Allensville
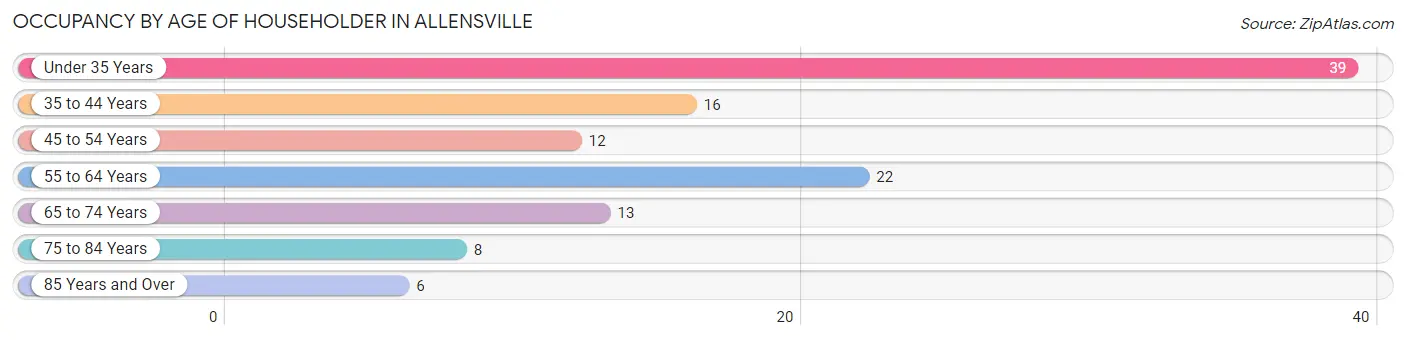
| Age Bracket | # Households | % Households |
| Under 35 Years | 39 | 33.6% |
| 35 to 44 Years | 16 | 13.8% |
| 45 to 54 Years | 12 | 10.3% |
| 55 to 64 Years | 22 | 19.0% |
| 65 to 74 Years | 13 | 11.2% |
| 75 to 84 Years | 8 | 6.9% |
| 85 Years and Over | 6 | 5.2% |
| Total | 116 | 100.0% |
Housing Finances in Allensville
Median Income by Occupancy in Allensville
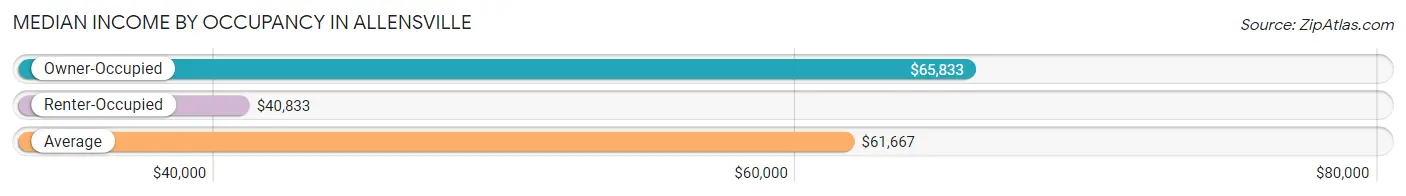
| Occupancy Type | # Households | Median Income |
| Owner-Occupied | 90 (77.6%) | $65,833 |
| Renter-Occupied | 26 (22.4%) | $40,833 |
| Average | 116 (100.0%) | $61,667 |
Occupancy by Householder Income Bracket in Allensville
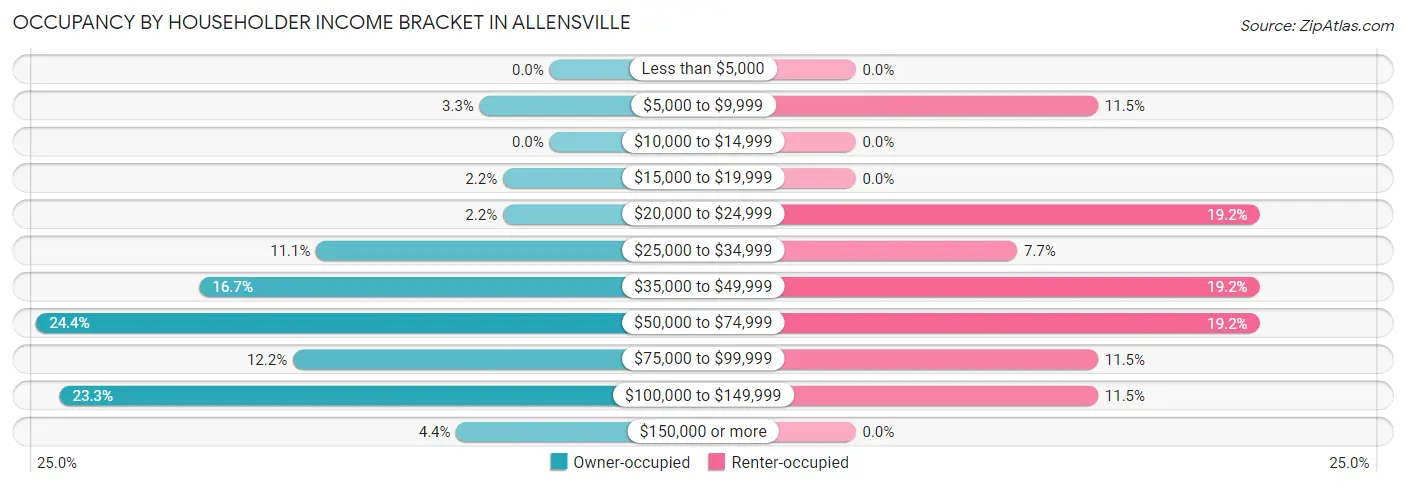
| Income Bracket | Owner-occupied | Renter-occupied |
| Less than $5,000 | 0 (0.0%) | 0 (0.0%) |
| $5,000 to $9,999 | 3 (3.3%) | 3 (11.5%) |
| $10,000 to $14,999 | 0 (0.0%) | 0 (0.0%) |
| $15,000 to $19,999 | 2 (2.2%) | 0 (0.0%) |
| $20,000 to $24,999 | 2 (2.2%) | 5 (19.2%) |
| $25,000 to $34,999 | 10 (11.1%) | 2 (7.7%) |
| $35,000 to $49,999 | 15 (16.7%) | 5 (19.2%) |
| $50,000 to $74,999 | 22 (24.4%) | 5 (19.2%) |
| $75,000 to $99,999 | 11 (12.2%) | 3 (11.5%) |
| $100,000 to $149,999 | 21 (23.3%) | 3 (11.5%) |
| $150,000 or more | 4 (4.4%) | 0 (0.0%) |
| Total | 90 (100.0%) | 26 (100.0%) |
Monthly Housing Cost Tiers in Allensville
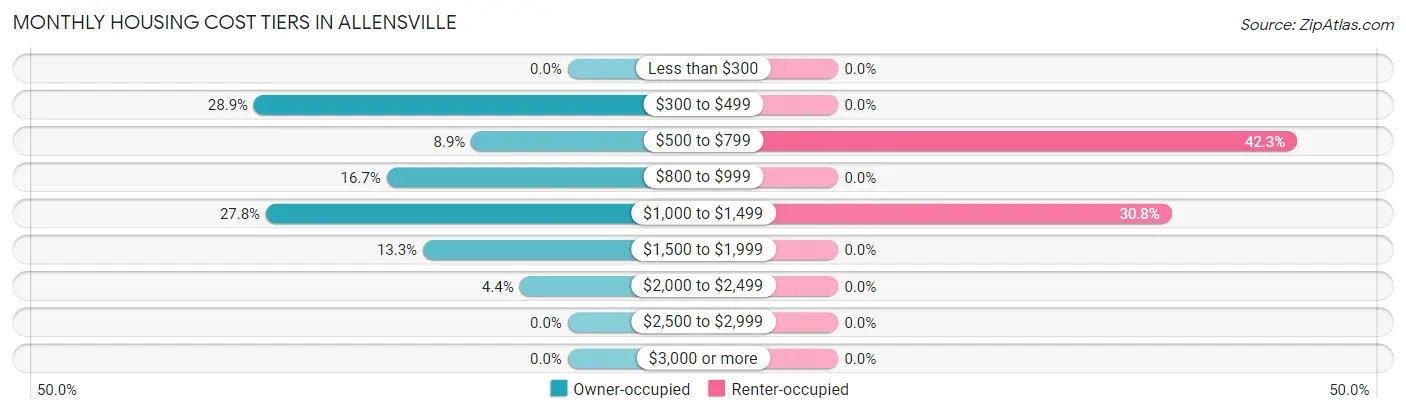
| Monthly Cost | Owner-occupied | Renter-occupied |
| Less than $300 | 0 (0.0%) | 0 (0.0%) |
| $300 to $499 | 26 (28.9%) | 0 (0.0%) |
| $500 to $799 | 8 (8.9%) | 11 (42.3%) |
| $800 to $999 | 15 (16.7%) | 0 (0.0%) |
| $1,000 to $1,499 | 25 (27.8%) | 8 (30.8%) |
| $1,500 to $1,999 | 12 (13.3%) | 0 (0.0%) |
| $2,000 to $2,499 | 4 (4.4%) | 0 (0.0%) |
| $2,500 to $2,999 | 0 (0.0%) | 0 (0.0%) |
| $3,000 or more | 0 (0.0%) | 0 (0.0%) |
| Total | 90 (100.0%) | 26 (100.0%) |
Physical Housing Characteristics in Allensville
Housing Structures in Allensville
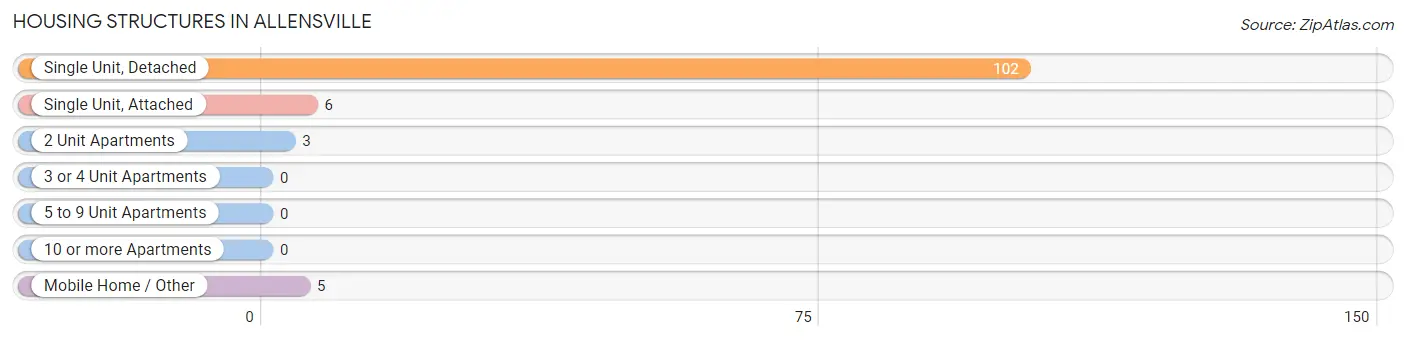
| Structure Type | # Housing Units | % Housing Units |
| Single Unit, Detached | 102 | 87.9% |
| Single Unit, Attached | 6 | 5.2% |
| 2 Unit Apartments | 3 | 2.6% |
| 3 or 4 Unit Apartments | 0 | 0.0% |
| 5 to 9 Unit Apartments | 0 | 0.0% |
| 10 or more Apartments | 0 | 0.0% |
| Mobile Home / Other | 5 | 4.3% |
| Total | 116 | 100.0% |
Housing Structures by Occupancy in Allensville
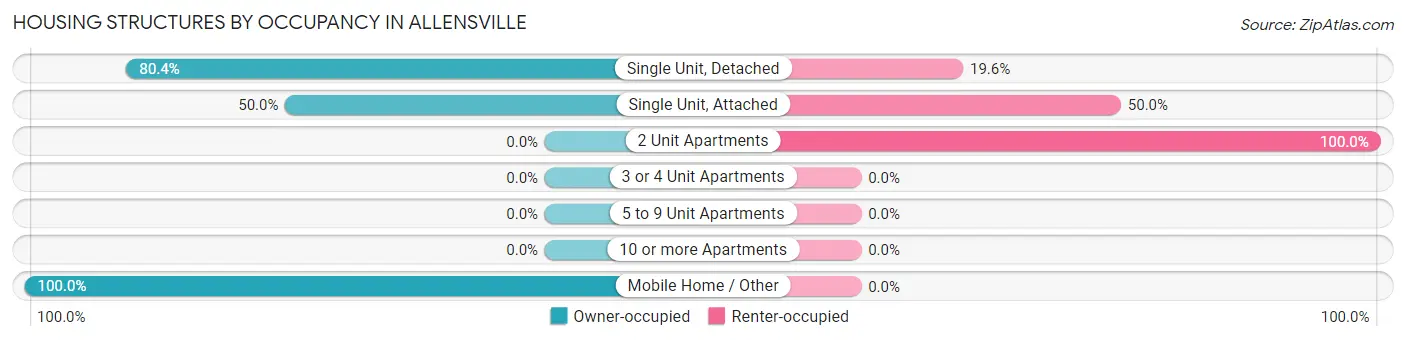
| Structure Type | Owner-occupied | Renter-occupied |
| Single Unit, Detached | 82 (80.4%) | 20 (19.6%) |
| Single Unit, Attached | 3 (50.0%) | 3 (50.0%) |
| 2 Unit Apartments | 0 (0.0%) | 3 (100.0%) |
| 3 or 4 Unit Apartments | 0 (0.0%) | 0 (0.0%) |
| 5 to 9 Unit Apartments | 0 (0.0%) | 0 (0.0%) |
| 10 or more Apartments | 0 (0.0%) | 0 (0.0%) |
| Mobile Home / Other | 5 (100.0%) | 0 (0.0%) |
| Total | 90 (77.6%) | 26 (22.4%) |
Housing Structures by Number of Rooms in Allensville
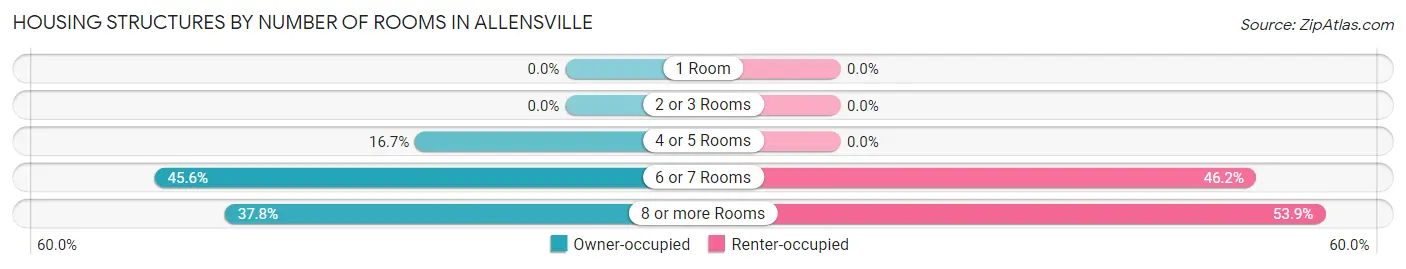
| Number of Rooms | Owner-occupied | Renter-occupied |
| 1 Room | 0 (0.0%) | 0 (0.0%) |
| 2 or 3 Rooms | 0 (0.0%) | 0 (0.0%) |
| 4 or 5 Rooms | 15 (16.7%) | 0 (0.0%) |
| 6 or 7 Rooms | 41 (45.6%) | 12 (46.2%) |
| 8 or more Rooms | 34 (37.8%) | 14 (53.8%) |
| Total | 90 (100.0%) | 26 (100.0%) |
Housing Structure by Heating Type in Allensville
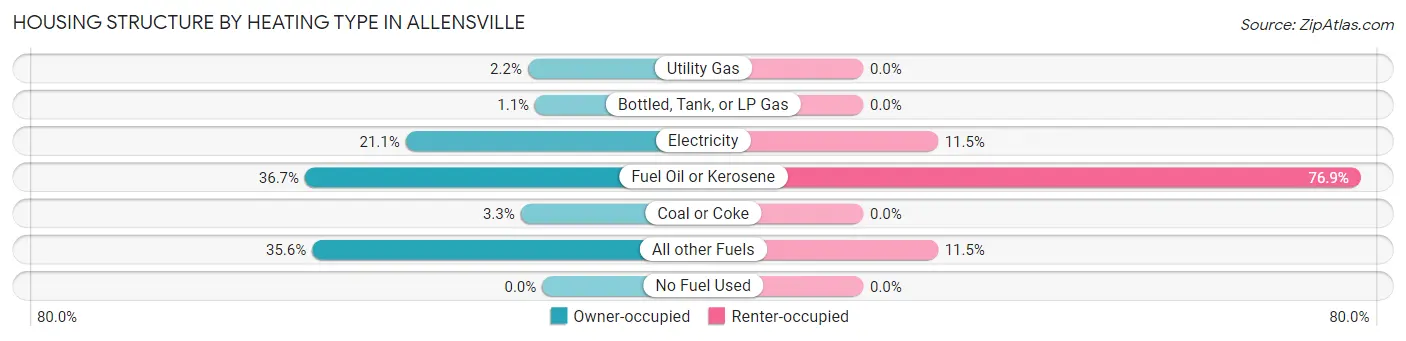
| Heating Type | Owner-occupied | Renter-occupied |
| Utility Gas | 2 (2.2%) | 0 (0.0%) |
| Bottled, Tank, or LP Gas | 1 (1.1%) | 0 (0.0%) |
| Electricity | 19 (21.1%) | 3 (11.5%) |
| Fuel Oil or Kerosene | 33 (36.7%) | 20 (76.9%) |
| Coal or Coke | 3 (3.3%) | 0 (0.0%) |
| All other Fuels | 32 (35.6%) | 3 (11.5%) |
| No Fuel Used | 0 (0.0%) | 0 (0.0%) |
| Total | 90 (100.0%) | 26 (100.0%) |
Household Vehicle Usage in Allensville
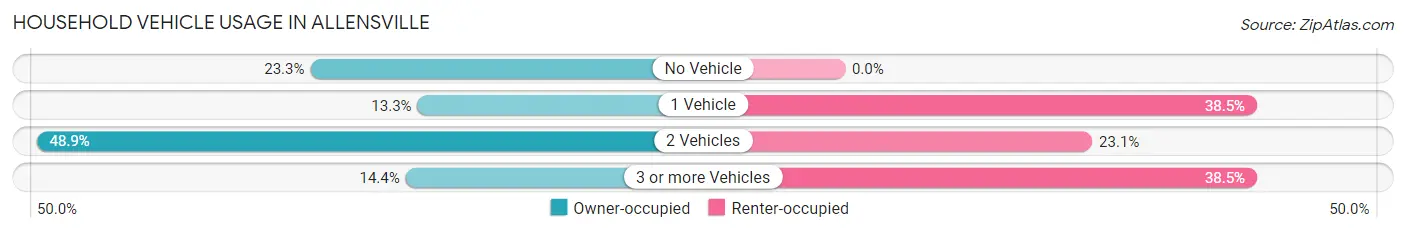
| Vehicles per Household | Owner-occupied | Renter-occupied |
| No Vehicle | 21 (23.3%) | 0 (0.0%) |
| 1 Vehicle | 12 (13.3%) | 10 (38.5%) |
| 2 Vehicles | 44 (48.9%) | 6 (23.1%) |
| 3 or more Vehicles | 13 (14.4%) | 10 (38.5%) |
| Total | 90 (100.0%) | 26 (100.0%) |
Real Estate & Mortgages in Allensville
Real Estate and Mortgage Overview in Allensville
| Characteristic | Without Mortgage | With Mortgage |
| Housing Units | 34 | 56 |
| Median Property Value | $166,700 | $137,500 |
| Median Household Income | $35,000 | $4 |
| Monthly Housing Costs | $418 | $0 |
| Real Estate Taxes | $2,154 | $0 |
Property Value by Mortgage Status in Allensville
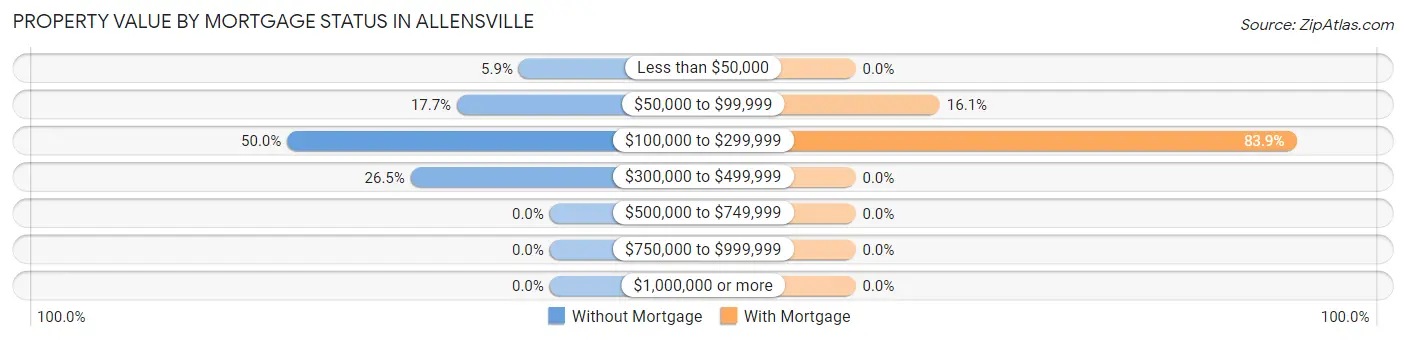
| Property Value | Without Mortgage | With Mortgage |
| Less than $50,000 | 2 (5.9%) | 0 (0.0%) |
| $50,000 to $99,999 | 6 (17.6%) | 9 (16.1%) |
| $100,000 to $299,999 | 17 (50.0%) | 47 (83.9%) |
| $300,000 to $499,999 | 9 (26.5%) | 0 (0.0%) |
| $500,000 to $749,999 | 0 (0.0%) | 0 (0.0%) |
| $750,000 to $999,999 | 0 (0.0%) | 0 (0.0%) |
| $1,000,000 or more | 0 (0.0%) | 0 (0.0%) |
| Total | 34 (100.0%) | 56 (100.0%) |
Household Income by Mortgage Status in Allensville
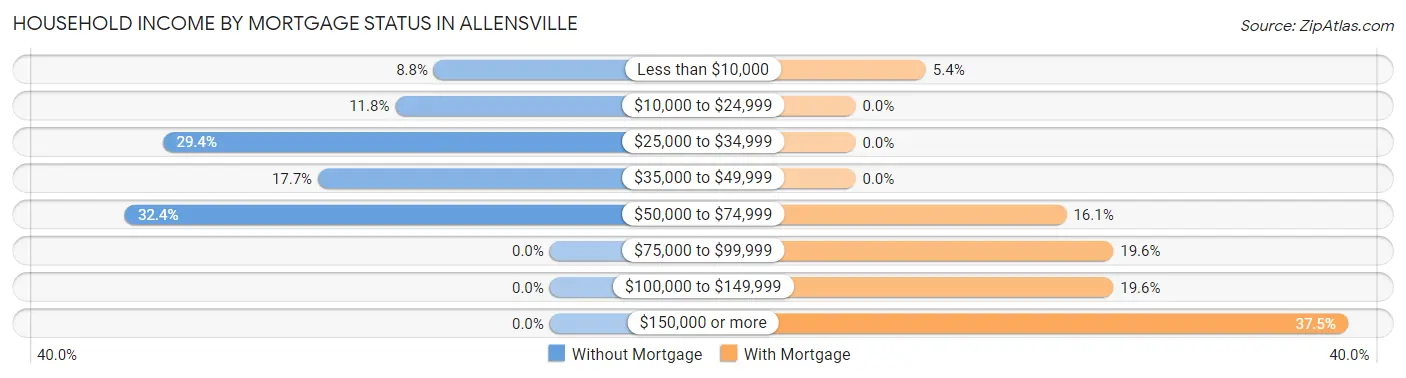
| Household Income | Without Mortgage | With Mortgage |
| Less than $10,000 | 3 (8.8%) | 3 (5.4%) |
| $10,000 to $24,999 | 4 (11.8%) | 0 (0.0%) |
| $25,000 to $34,999 | 10 (29.4%) | 0 (0.0%) |
| $35,000 to $49,999 | 6 (17.6%) | 0 (0.0%) |
| $50,000 to $74,999 | 11 (32.4%) | 9 (16.1%) |
| $75,000 to $99,999 | 0 (0.0%) | 11 (19.6%) |
| $100,000 to $149,999 | 0 (0.0%) | 11 (19.6%) |
| $150,000 or more | 0 (0.0%) | 21 (37.5%) |
| Total | 34 (100.0%) | 56 (100.0%) |
Property Value to Household Income Ratio in Allensville
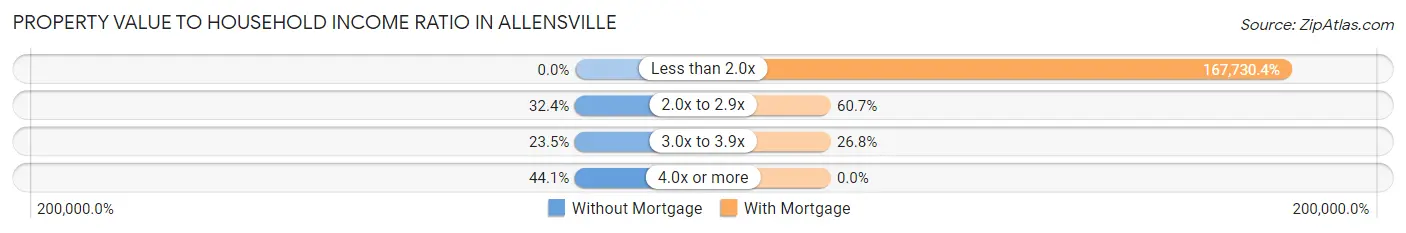
| Value-to-Income Ratio | Without Mortgage | With Mortgage |
| Less than 2.0x | 0 (0.0%) | 93,929 (167,730.4%) |
| 2.0x to 2.9x | 11 (32.4%) | 34 (60.7%) |
| 3.0x to 3.9x | 8 (23.5%) | 15 (26.8%) |
| 4.0x or more | 15 (44.1%) | 0 (0.0%) |
| Total | 34 (100.0%) | 56 (100.0%) |
Real Estate Taxes by Mortgage Status in Allensville
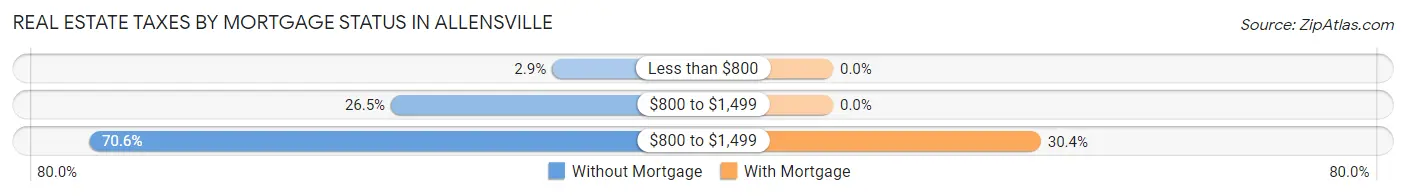
| Property Taxes | Without Mortgage | With Mortgage |
| Less than $800 | 1 (2.9%) | 0 (0.0%) |
| $800 to $1,499 | 9 (26.5%) | 0 (0.0%) |
| $800 to $1,499 | 24 (70.6%) | 17 (30.4%) |
| Total | 34 (100.0%) | 56 (100.0%) |
Health & Disability in Allensville
Health Insurance Coverage by Age in Allensville
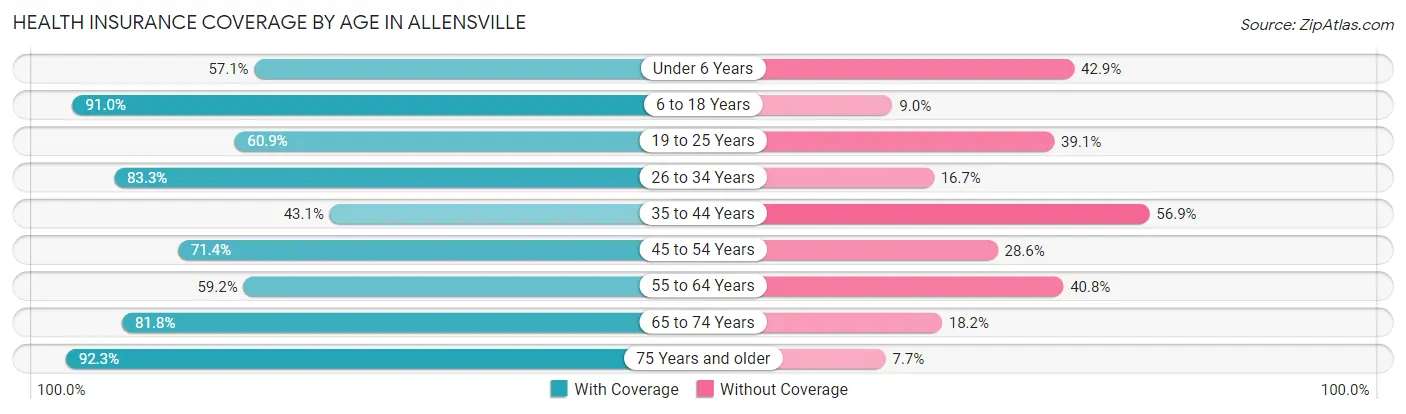
| Age Bracket | With Coverage | Without Coverage |
| Under 6 Years | 28 (57.1%) | 21 (42.9%) |
| 6 to 18 Years | 71 (91.0%) | 7 (9.0%) |
| 19 to 25 Years | 14 (60.9%) | 9 (39.1%) |
| 26 to 34 Years | 55 (83.3%) | 11 (16.7%) |
| 35 to 44 Years | 25 (43.1%) | 33 (56.9%) |
| 45 to 54 Years | 15 (71.4%) | 6 (28.6%) |
| 55 to 64 Years | 29 (59.2%) | 20 (40.8%) |
| 65 to 74 Years | 18 (81.8%) | 4 (18.2%) |
| 75 Years and older | 24 (92.3%) | 2 (7.7%) |
| Total | 279 (71.2%) | 113 (28.8%) |
Health Insurance Coverage by Citizenship Status in Allensville

| Citizenship Status | With Coverage | Without Coverage |
| Native Born | 28 (57.1%) | 21 (42.9%) |
| Foreign Born, Citizen | 71 (91.0%) | 7 (9.0%) |
| Foreign Born, not a Citizen | 14 (60.9%) | 9 (39.1%) |
Health Insurance Coverage by Household Income in Allensville
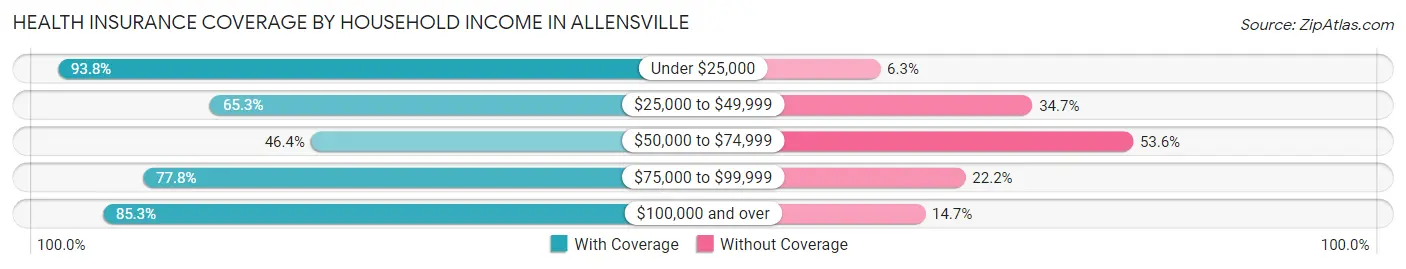
| Household Income | With Coverage | Without Coverage |
| Under $25,000 | 45 (93.8%) | 3 (6.2%) |
| $25,000 to $49,999 | 62 (65.3%) | 33 (34.7%) |
| $50,000 to $74,999 | 45 (46.4%) | 52 (53.6%) |
| $75,000 to $99,999 | 28 (77.8%) | 8 (22.2%) |
| $100,000 and over | 99 (85.3%) | 17 (14.7%) |
Public vs Private Health Insurance Coverage by Age in Allensville
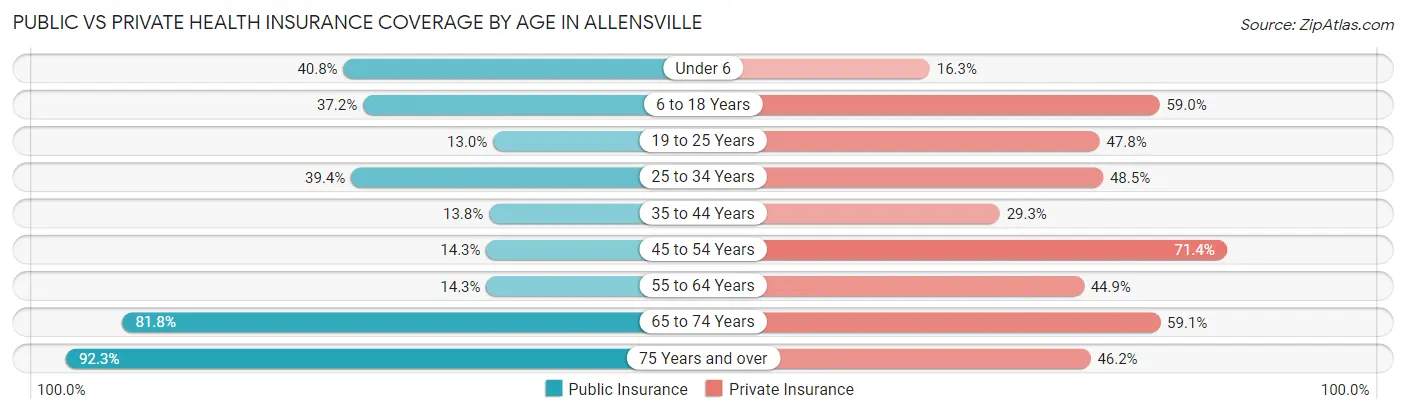
| Age Bracket | Public Insurance | Private Insurance |
| Under 6 | 20 (40.8%) | 8 (16.3%) |
| 6 to 18 Years | 29 (37.2%) | 46 (59.0%) |
| 19 to 25 Years | 3 (13.0%) | 11 (47.8%) |
| 25 to 34 Years | 26 (39.4%) | 32 (48.5%) |
| 35 to 44 Years | 8 (13.8%) | 17 (29.3%) |
| 45 to 54 Years | 3 (14.3%) | 15 (71.4%) |
| 55 to 64 Years | 7 (14.3%) | 22 (44.9%) |
| 65 to 74 Years | 18 (81.8%) | 13 (59.1%) |
| 75 Years and over | 24 (92.3%) | 12 (46.2%) |
| Total | 138 (35.2%) | 176 (44.9%) |
Disability Status by Sex by Age in Allensville
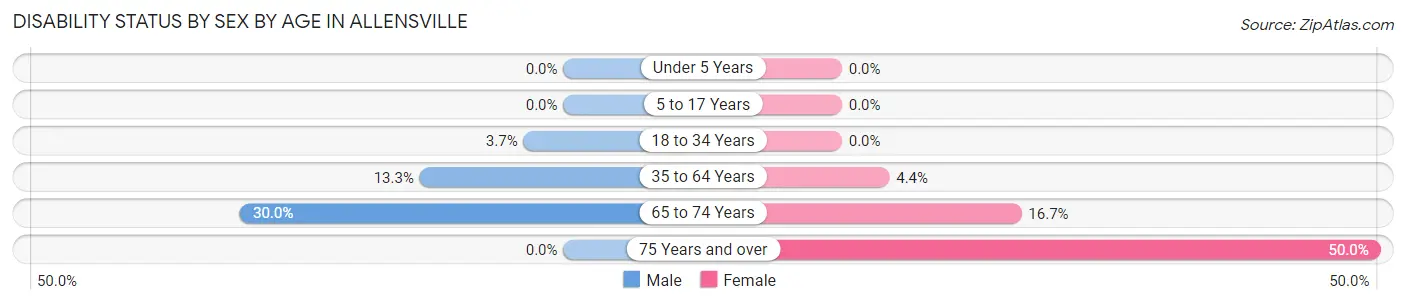
| Age Bracket | Male | Female |
| Under 5 Years | 0 (0.0%) | 0 (0.0%) |
| 5 to 17 Years | 0 (0.0%) | 0 (0.0%) |
| 18 to 34 Years | 2 (3.7%) | 0 (0.0%) |
| 35 to 64 Years | 8 (13.3%) | 3 (4.4%) |
| 65 to 74 Years | 3 (30.0%) | 2 (16.7%) |
| 75 Years and over | 0 (0.0%) | 8 (50.0%) |
Disability Class by Sex by Age in Allensville
Disability Class: Hearing Difficulty
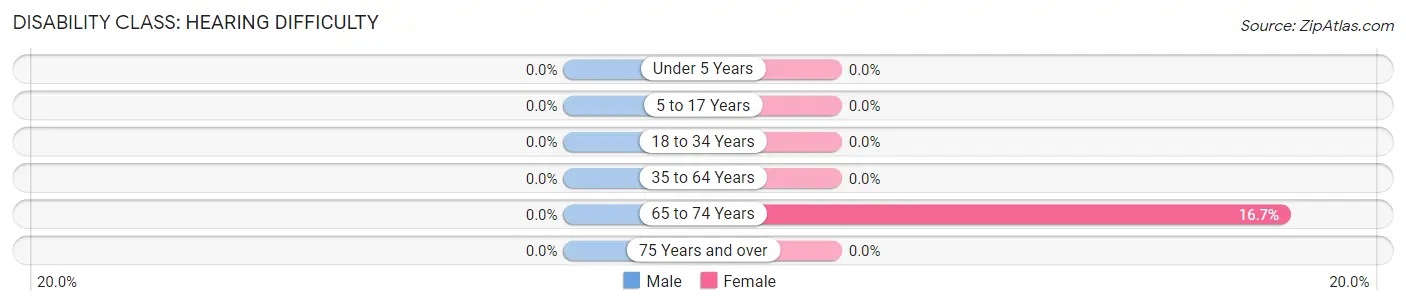
| Age Bracket | Male | Female |
| Under 5 Years | 0 (0.0%) | 0 (0.0%) |
| 5 to 17 Years | 0 (0.0%) | 0 (0.0%) |
| 18 to 34 Years | 0 (0.0%) | 0 (0.0%) |
| 35 to 64 Years | 0 (0.0%) | 0 (0.0%) |
| 65 to 74 Years | 0 (0.0%) | 2 (16.7%) |
| 75 Years and over | 0 (0.0%) | 0 (0.0%) |
Disability Class: Vision Difficulty
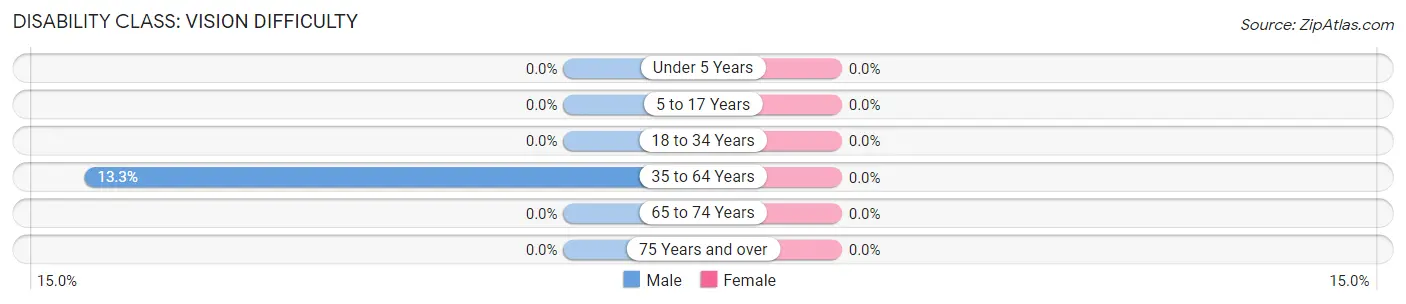
| Age Bracket | Male | Female |
| Under 5 Years | 0 (0.0%) | 0 (0.0%) |
| 5 to 17 Years | 0 (0.0%) | 0 (0.0%) |
| 18 to 34 Years | 0 (0.0%) | 0 (0.0%) |
| 35 to 64 Years | 8 (13.3%) | 0 (0.0%) |
| 65 to 74 Years | 0 (0.0%) | 0 (0.0%) |
| 75 Years and over | 0 (0.0%) | 0 (0.0%) |
Disability Class: Cognitive Difficulty
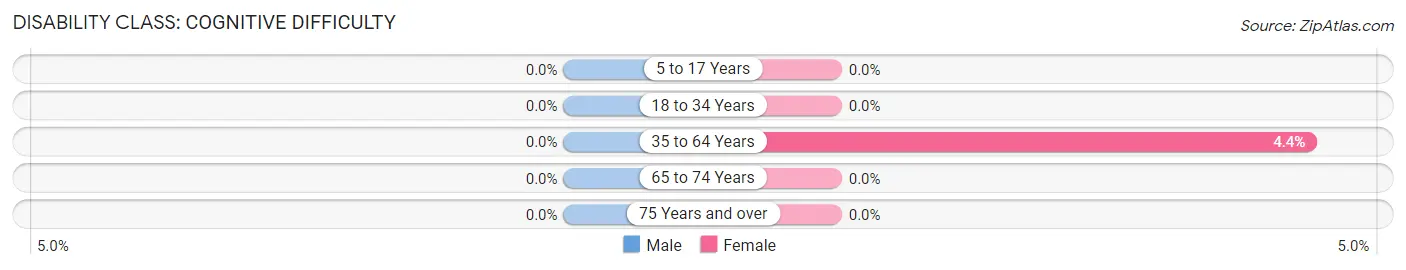
| Age Bracket | Male | Female |
| 5 to 17 Years | 0 (0.0%) | 0 (0.0%) |
| 18 to 34 Years | 0 (0.0%) | 0 (0.0%) |
| 35 to 64 Years | 0 (0.0%) | 3 (4.4%) |
| 65 to 74 Years | 0 (0.0%) | 0 (0.0%) |
| 75 Years and over | 0 (0.0%) | 0 (0.0%) |
Disability Class: Ambulatory Difficulty
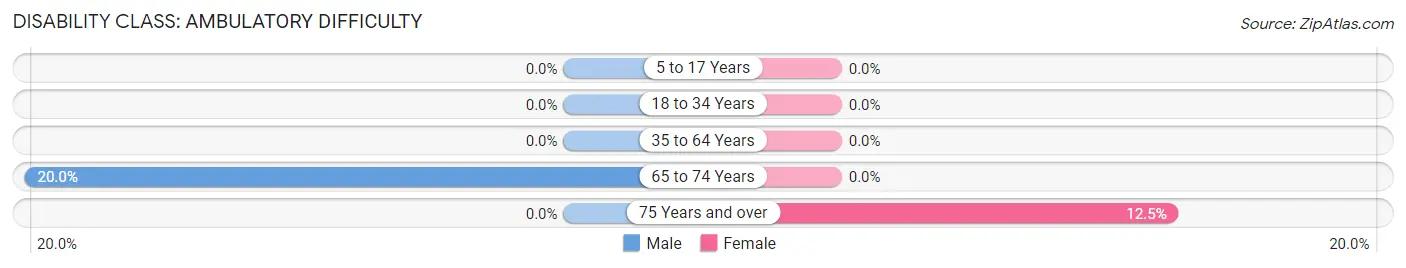
| Age Bracket | Male | Female |
| 5 to 17 Years | 0 (0.0%) | 0 (0.0%) |
| 18 to 34 Years | 0 (0.0%) | 0 (0.0%) |
| 35 to 64 Years | 0 (0.0%) | 0 (0.0%) |
| 65 to 74 Years | 2 (20.0%) | 0 (0.0%) |
| 75 Years and over | 0 (0.0%) | 2 (12.5%) |
Disability Class: Self-Care Difficulty

| Age Bracket | Male | Female |
| 5 to 17 Years | 0 (0.0%) | 0 (0.0%) |
| 18 to 34 Years | 0 (0.0%) | 0 (0.0%) |
| 35 to 64 Years | 0 (0.0%) | 0 (0.0%) |
| 65 to 74 Years | 3 (30.0%) | 0 (0.0%) |
| 75 Years and over | 0 (0.0%) | 2 (12.5%) |
Technology Access in Allensville
Computing Device Access in Allensville
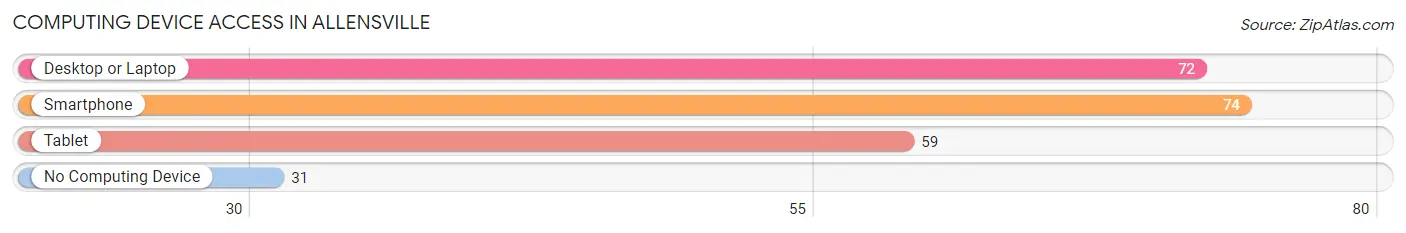
| Device Type | # Households | % Households |
| Desktop or Laptop | 72 | 62.1% |
| Smartphone | 74 | 63.8% |
| Tablet | 59 | 50.9% |
| No Computing Device | 31 | 26.7% |
| Total | 116 | 100.0% |
Internet Access in Allensville
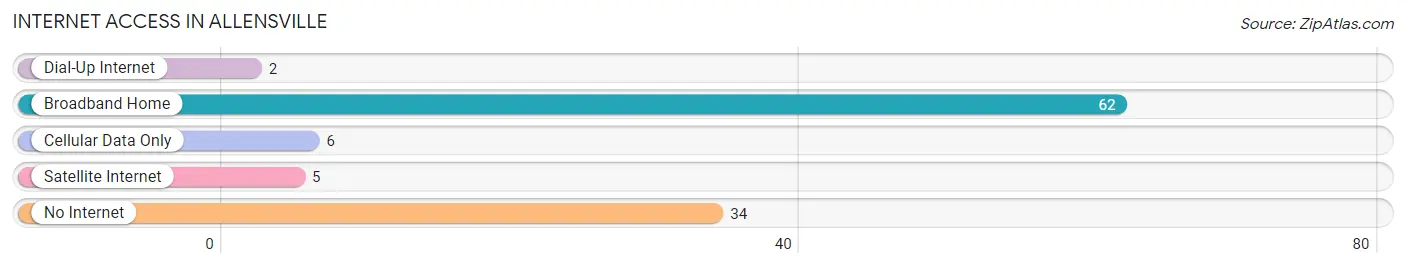
| Internet Type | # Households | % Households |
| Dial-Up Internet | 2 | 1.7% |
| Broadband Home | 62 | 53.4% |
| Cellular Data Only | 6 | 5.2% |
| Satellite Internet | 5 | 4.3% |
| No Internet | 34 | 29.3% |
| Total | 116 | 100.0% |
Allensville Summary
Allenville is a small borough located in Mifflin County, Pennsylvania. It is situated in the Appalachian Mountains and is part of the Altoona Metropolitan Statistical Area. The population of Allenville was 1,093 at the 2010 census.
History
Allenville was founded in 1845 by John Allen, a local farmer. The town was originally known as Allensville, but the name was changed to Allenville in 1875. The town was incorporated in 1887.
The town was originally a farming community, but in the late 19th century, the town began to develop into a small industrial center. The first industry to locate in Allenville was a sawmill, which was built in 1887. This was followed by a grist mill, a tannery, and a brickyard.
Geography
Allenville is located at 40°37'17" North, 77°45'45" West (40.6214, -77.7625). It is situated in the Appalachian Mountains and is part of the Altoona Metropolitan Statistical Area.
The borough is located in the Juniata River Valley, and is surrounded by rolling hills and mountains. The Juniata River flows through the town, and the town is located near the Tuscarora State Forest.
Economy
The economy of Allenville is largely based on agriculture and tourism. The town is home to several small farms, and the surrounding area is known for its apple orchards. The town also has several small businesses, including a grocery store, a hardware store, and a restaurant.
Tourism is an important part of the local economy. The town is home to several historic sites, including the Allenville Historic District, which is listed on the National Register of Historic Places. The town also has several parks and recreational areas, including the Juniata River Trail and the Tuscarora State Forest.
Demographics
As of the 2010 census, the population of Allenville was 1,093. The racial makeup of the town was 97.2% White, 0.7% African American, 0.2% Native American, 0.2% Asian, 0.2% from other races, and 1.7% from two or more races. Hispanic or Latino of any race were 0.7% of the population.
The median income for a household in Allenville was $37,500, and the median income for a family was $45,000. The per capita income for the town was $17,845. About 11.2% of families and 14.2% of the population were below the poverty line, including 18.2% of those under age 18 and 8.3% of those age 65 or over.
Common Questions
What is Per Capita Income in Allensville?
Per Capita income in Allensville is $25,903.
What is the Median Family Income in Allensville?
Median Family Income in Allensville is $61,667.
What is the Median Household income in Allensville?
Median Household Income in Allensville is $61,667.
What is Income or Wage Gap in Allensville?
Income or Wage Gap in Allensville is 46.2%.
Women in Allensville earn 53.8 cents for every dollar earned by a man.
What is Inequality or Gini Index in Allensville?
Inequality or Gini Index in Allensville is 0.47.
What is the Total Population of Allensville?
Total Population of Allensville is 392.
What is the Total Male Population of Allensville?
Total Male Population of Allensville is 214.
What is the Total Female Population of Allensville?
Total Female Population of Allensville is 178.
What is the Ratio of Males per 100 Females in Allensville?
There are 120.22 Males per 100 Females in Allensville.
What is the Ratio of Females per 100 Males in Allensville?
There are 83.18 Females per 100 Males in Allensville.
What is the Median Population Age in Allensville?
Median Population Age in Allensville is 34.0 Years.
What is the Average Family Size in Allensville
Average Family Size in Allensville is 3.7 People.
What is the Average Household Size in Allensville
Average Household Size in Allensville is 3.4 People.
How Large is the Labor Force in Allensville?
There are 170 People in the Labor Forcein in Allensville.
What is the Percentage of People in the Labor Force in Allensville?
63.0% of People are in the Labor Force in Allensville.
What is the Unemployment Rate in Allensville?
Unemployment Rate in Allensville is 3.5%.