Hannasville, PA Map & Demographics
Hannasville Map
Hannasville Overview
$34,558
PER CAPITA INCOME
$99,318
AVG FAMILY INCOME
$98,636
AVG HOUSEHOLD INCOME
32.4%
WAGE / INCOME GAP [ % ]
67.6¢/ $1
WAGE / INCOME GAP [ $ ]
0.30
INEQUALITY / GINI INDEX
113
TOTAL POPULATION
57
MALE POPULATION
56
FEMALE POPULATION
101.79
MALES / 100 FEMALES
98.25
FEMALES / 100 MALES
42.0
MEDIAN AGE
2.6
AVG FAMILY SIZE
2.5
AVG HOUSEHOLD SIZE
67
LABOR FORCE [ PEOPLE ]
68.4%
PERCENT IN LABOR FORCE
Income in Hannasville
Income Overview in Hannasville
Per Capita Income in Hannasville is $34,558, while median incomes of families and households are $99,318 and $98,636 respectively.
| Characteristic | Number | Measure |
| Per Capita Income | 113 | $34,558 |
| Median Family Income | 34 | $99,318 |
| Mean Family Income | 34 | $96,024 |
| Median Household Income | 46 | $98,636 |
| Mean Household Income | 46 | $84,720 |
| Income Deficit | 34 | $0 |
| Wage / Income Gap (%) | 113 | 32.42% |
| Wage / Income Gap ($) | 113 | 67.58¢ per $1 |
| Gini / Inequality Index | 113 | 0.30 |
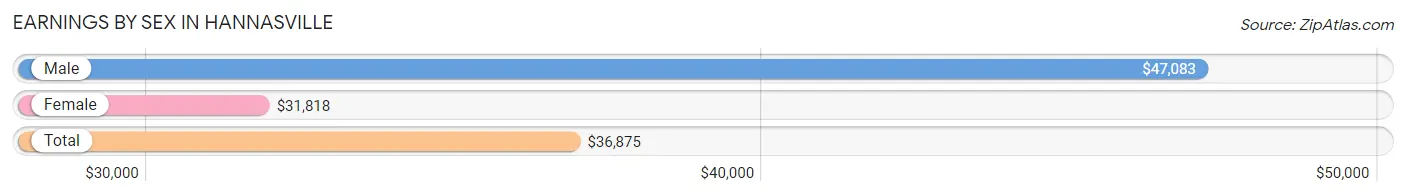
Earnings by Sex in Hannasville
Average Earnings in Hannasville are $36,875, $47,083 for men and $31,818 for women, a difference of 32.4%.
| Sex | Number | Average Earnings |
| Male | 37 (55.2%) | $47,083 |
| Female | 30 (44.8%) | $31,818 |
| Total | 67 (100.0%) | $36,875 |
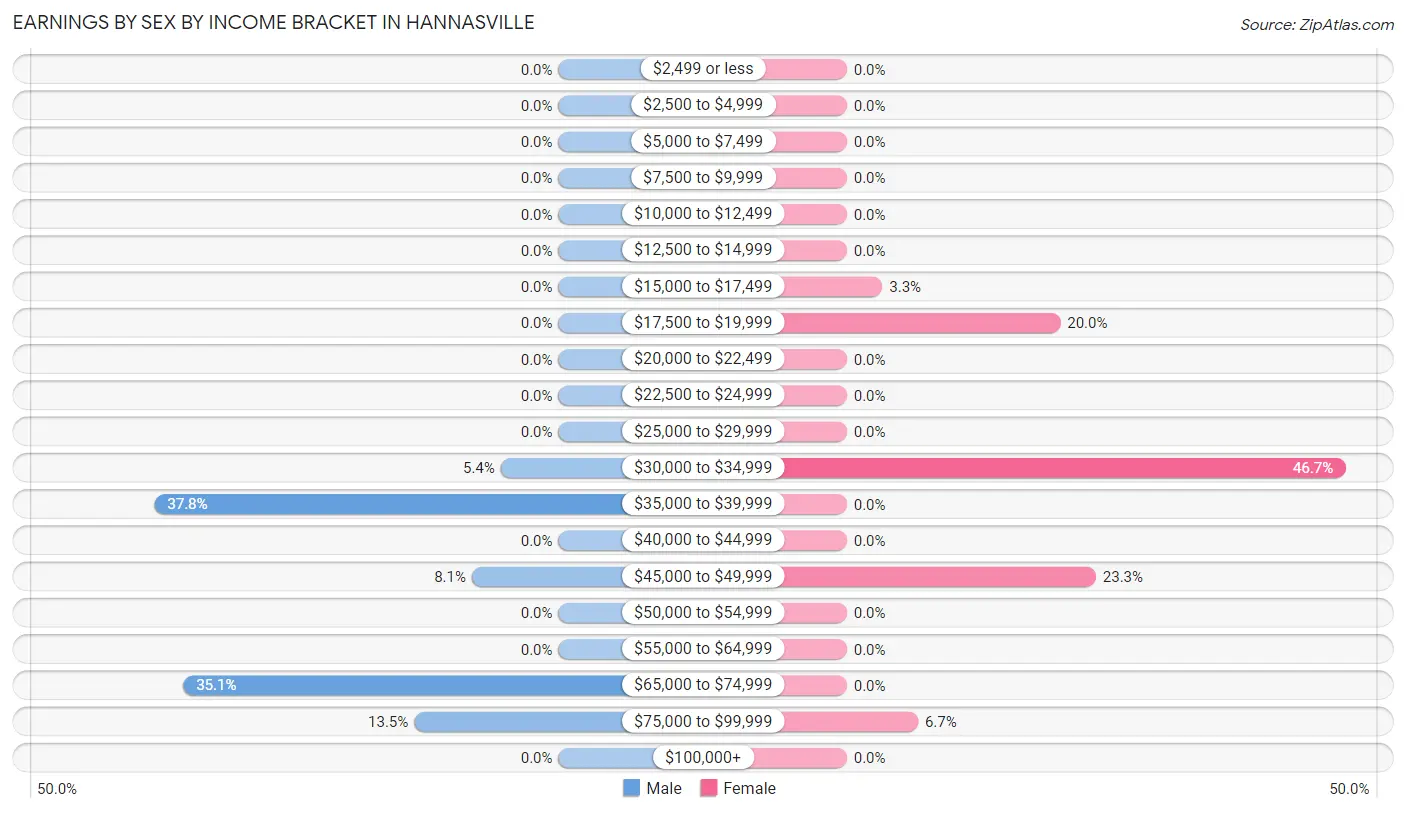
Earnings by Sex by Income Bracket in Hannasville
The most common earnings brackets in Hannasville are $35,000 to $39,999 for men (14 | 37.8%) and $30,000 to $34,999 for women (14 | 46.7%).
| Income | Male | Female |
| $2,499 or less | 0 (0.0%) | 0 (0.0%) |
| $2,500 to $4,999 | 0 (0.0%) | 0 (0.0%) |
| $5,000 to $7,499 | 0 (0.0%) | 0 (0.0%) |
| $7,500 to $9,999 | 0 (0.0%) | 0 (0.0%) |
| $10,000 to $12,499 | 0 (0.0%) | 0 (0.0%) |
| $12,500 to $14,999 | 0 (0.0%) | 0 (0.0%) |
| $15,000 to $17,499 | 0 (0.0%) | 1 (3.3%) |
| $17,500 to $19,999 | 0 (0.0%) | 6 (20.0%) |
| $20,000 to $22,499 | 0 (0.0%) | 0 (0.0%) |
| $22,500 to $24,999 | 0 (0.0%) | 0 (0.0%) |
| $25,000 to $29,999 | 0 (0.0%) | 0 (0.0%) |
| $30,000 to $34,999 | 2 (5.4%) | 14 (46.7%) |
| $35,000 to $39,999 | 14 (37.8%) | 0 (0.0%) |
| $40,000 to $44,999 | 0 (0.0%) | 0 (0.0%) |
| $45,000 to $49,999 | 3 (8.1%) | 7 (23.3%) |
| $50,000 to $54,999 | 0 (0.0%) | 0 (0.0%) |
| $55,000 to $64,999 | 0 (0.0%) | 0 (0.0%) |
| $65,000 to $74,999 | 13 (35.1%) | 0 (0.0%) |
| $75,000 to $99,999 | 5 (13.5%) | 2 (6.7%) |
| $100,000+ | 0 (0.0%) | 0 (0.0%) |
| Total | 37 (100.0%) | 30 (100.0%) |
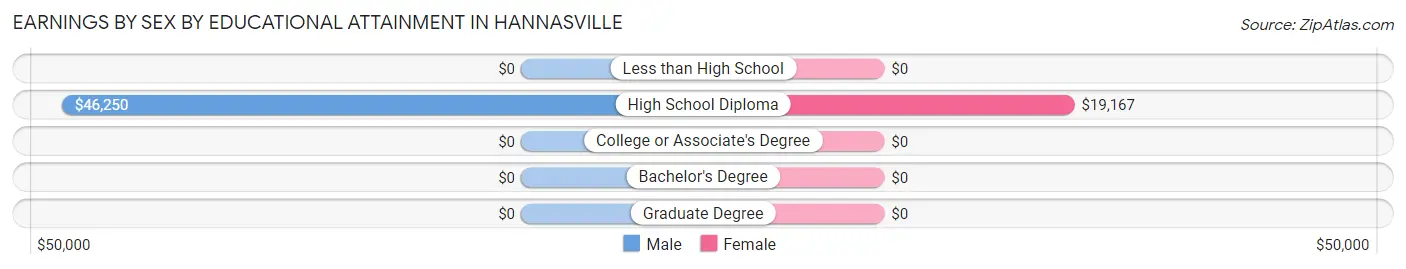
Earnings by Sex by Educational Attainment in Hannasville
Average earnings in Hannasville are $67,788 for men and $31,818 for women, a difference of 53.1%. Men with an educational attainment of high school diploma enjoy the highest average annual earnings of $46,250, while those with high school diploma education earn the least with $46,250. Women with an educational attainment of high school diploma earn the most with the average annual earnings of $19,167, while those with high school diploma education have the smallest earnings of $19,167.
| Educational Attainment | Male Income | Female Income |
| Less than High School | - | - |
| High School Diploma | $46,250 | $19,167 |
| College or Associate's Degree | - | - |
| Bachelor's Degree | - | - |
| Graduate Degree | - | - |
| Total | $67,788 | $31,818 |
Family Income in Hannasville
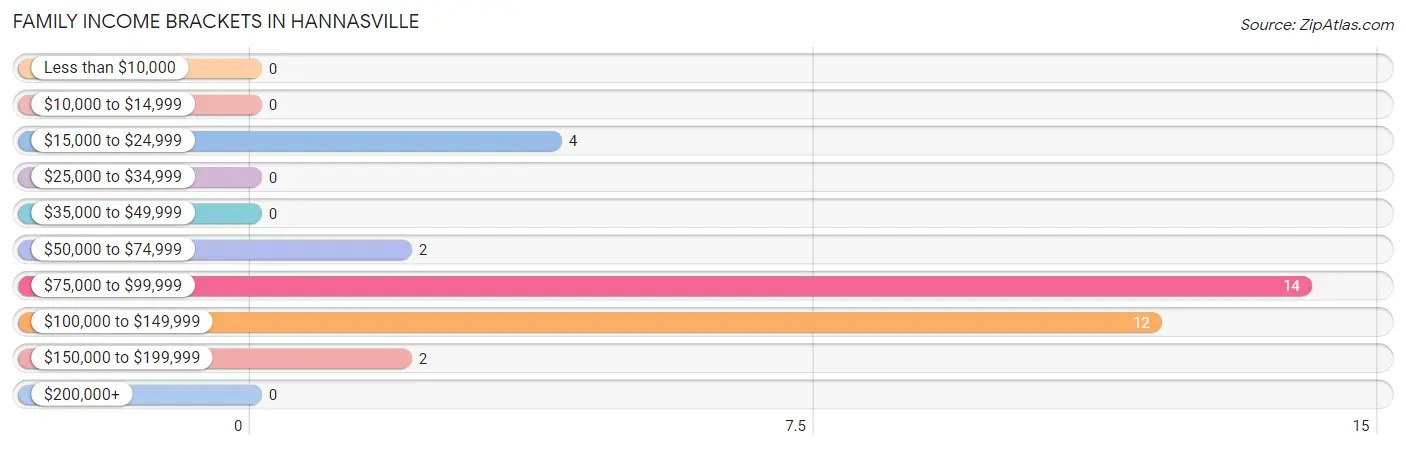
Family Income Brackets in Hannasville
According to the Hannasville family income data, there are 14 families falling into the $75,000 to $99,999 income range, which is the most common income bracket and makes up 41.2% of all families.
| Income Bracket | # Families | % Families |
| Less than $10,000 | 0 | 0.0% |
| $10,000 to $14,999 | 0 | 0.0% |
| $15,000 to $24,999 | 4 | 11.8% |
| $25,000 to $34,999 | 0 | 0.0% |
| $35,000 to $49,999 | 0 | 0.0% |
| $50,000 to $74,999 | 2 | 5.9% |
| $75,000 to $99,999 | 14 | 41.2% |
| $100,000 to $149,999 | 12 | 35.3% |
| $150,000 to $199,999 | 2 | 5.9% |
| $200,000+ | 0 | 0.0% |
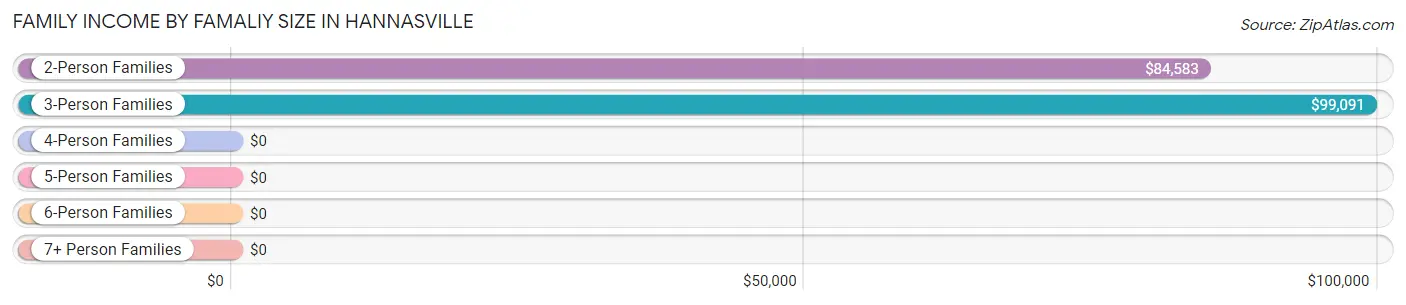
Family Income by Famaliy Size in Hannasville
3-person families (14 | 41.2%) account for the highest median family income in Hannasville with $99,091 per family, while 2-person families (17 | 50.0%) have the highest median income of $42,292 per family member.
| Income Bracket | # Families | Median Income |
| 2-Person Families | 17 (50.0%) | $84,583 |
| 3-Person Families | 14 (41.2%) | $99,091 |
| 4-Person Families | 3 (8.8%) | $0 |
| 5-Person Families | 0 (0.0%) | $0 |
| 6-Person Families | 0 (0.0%) | $0 |
| 7+ Person Families | 0 (0.0%) | $0 |
| Total | 34 (100.0%) | $99,318 |
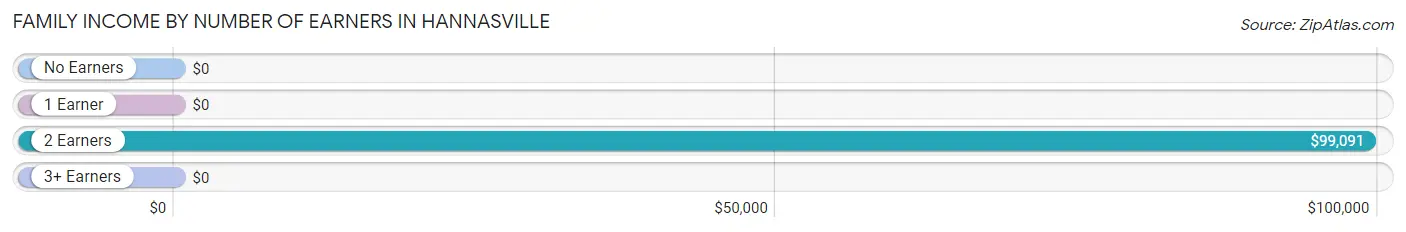
Family Income by Number of Earners in Hannasville
| Number of Earners | # Families | Median Income |
| No Earners | 10 (29.4%) | $0 |
| 1 Earner | 3 (8.8%) | $0 |
| 2 Earners | 20 (58.8%) | $99,091 |
| 3+ Earners | 1 (2.9%) | $0 |
| Total | 34 (100.0%) | $99,318 |
Household Income in Hannasville
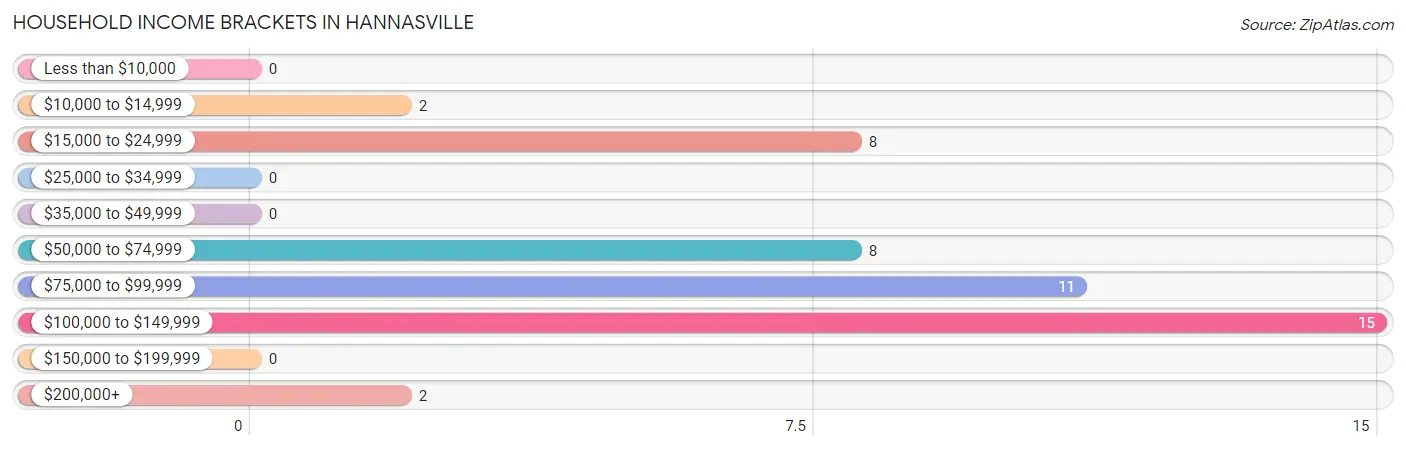
Household Income Brackets in Hannasville
With 15 households falling in the category, the $100,000 to $149,999 income range is the most frequent in Hannasville, accounting for 32.6% of all households.
| Income Bracket | # Households | % Households |
| Less than $10,000 | 0 | 0.0% |
| $10,000 to $14,999 | 2 | 4.3% |
| $15,000 to $24,999 | 8 | 17.4% |
| $25,000 to $34,999 | 0 | 0.0% |
| $35,000 to $49,999 | 0 | 0.0% |
| $50,000 to $74,999 | 8 | 17.4% |
| $75,000 to $99,999 | 11 | 23.9% |
| $100,000 to $149,999 | 15 | 32.6% |
| $150,000 to $199,999 | 0 | 0.0% |
| $200,000+ | 2 | 4.3% |
Household Income by Householder Age in Hannasville
The median household income in Hannasville is $98,636, with the highest median household income of $114,583 found in the 45 to 64 years age bracket for the primary householder. A total of 17 households (37.0%) fall into this category.
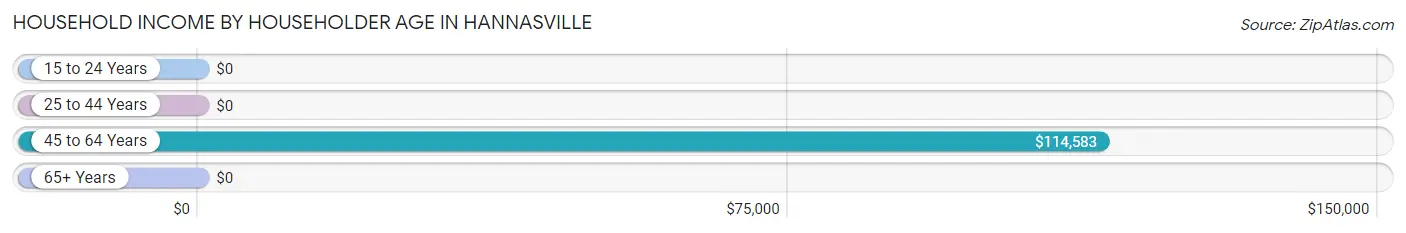
| Income Bracket | # Households | Median Income |
| 15 to 24 Years | 0 (0.0%) | $0 |
| 25 to 44 Years | 13 (28.3%) | $0 |
| 45 to 64 Years | 17 (37.0%) | $114,583 |
| 65+ Years | 16 (34.8%) | $0 |
| Total | 46 (100.0%) | $98,636 |
Poverty in Hannasville
Income Below Poverty by Sex and Age in Hannasville
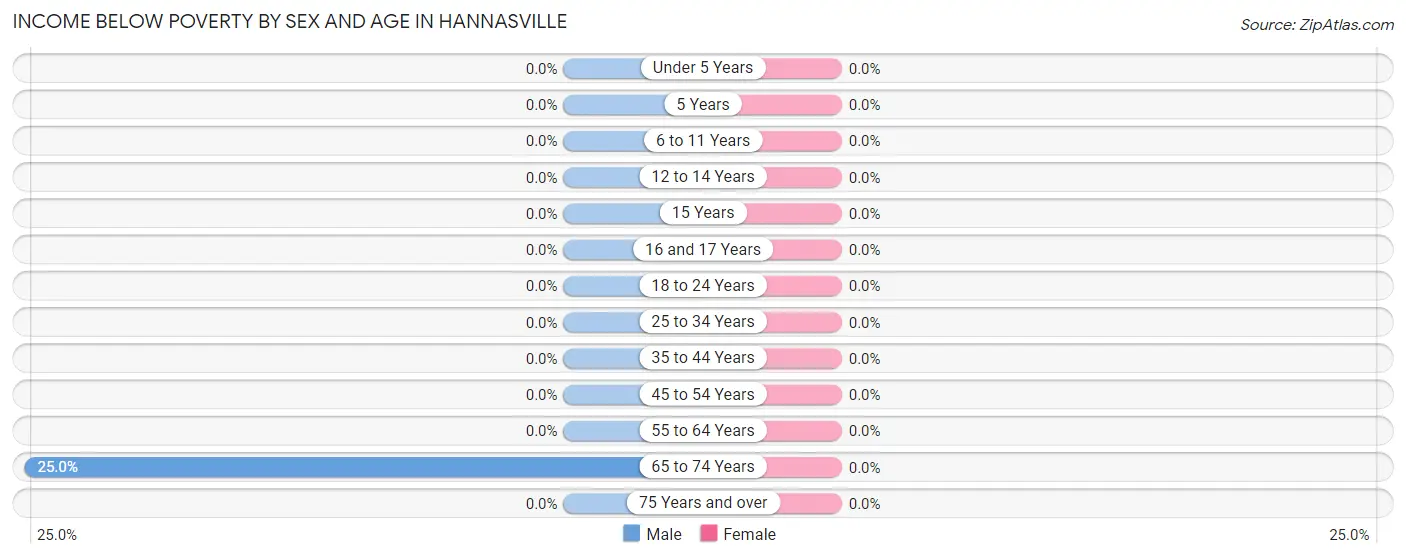
| Age Bracket | Male | Female |
| Under 5 Years | 0 (0.0%) | 0 (0.0%) |
| 5 Years | 0 (0.0%) | 0 (0.0%) |
| 6 to 11 Years | 0 (0.0%) | 0 (0.0%) |
| 12 to 14 Years | 0 (0.0%) | 0 (0.0%) |
| 15 Years | 0 (0.0%) | 0 (0.0%) |
| 16 and 17 Years | 0 (0.0%) | 0 (0.0%) |
| 18 to 24 Years | 0 (0.0%) | 0 (0.0%) |
| 25 to 34 Years | 0 (0.0%) | 0 (0.0%) |
| 35 to 44 Years | 0 (0.0%) | 0 (0.0%) |
| 45 to 54 Years | 0 (0.0%) | 0 (0.0%) |
| 55 to 64 Years | 0 (0.0%) | 0 (0.0%) |
| 65 to 74 Years | 2 (25.0%) | 0 (0.0%) |
| 75 Years and over | 0 (0.0%) | 0 (0.0%) |
| Total | 2 (3.5%) | 0 (0.0%) |
Income Above Poverty by Sex and Age in Hannasville
According to the poverty statistics in Hannasville, males aged 18 to 24 years and females aged under 5 years are the age groups that are most secure financially, with 100.0% of males and 100.0% of females in these age groups living above the poverty line.
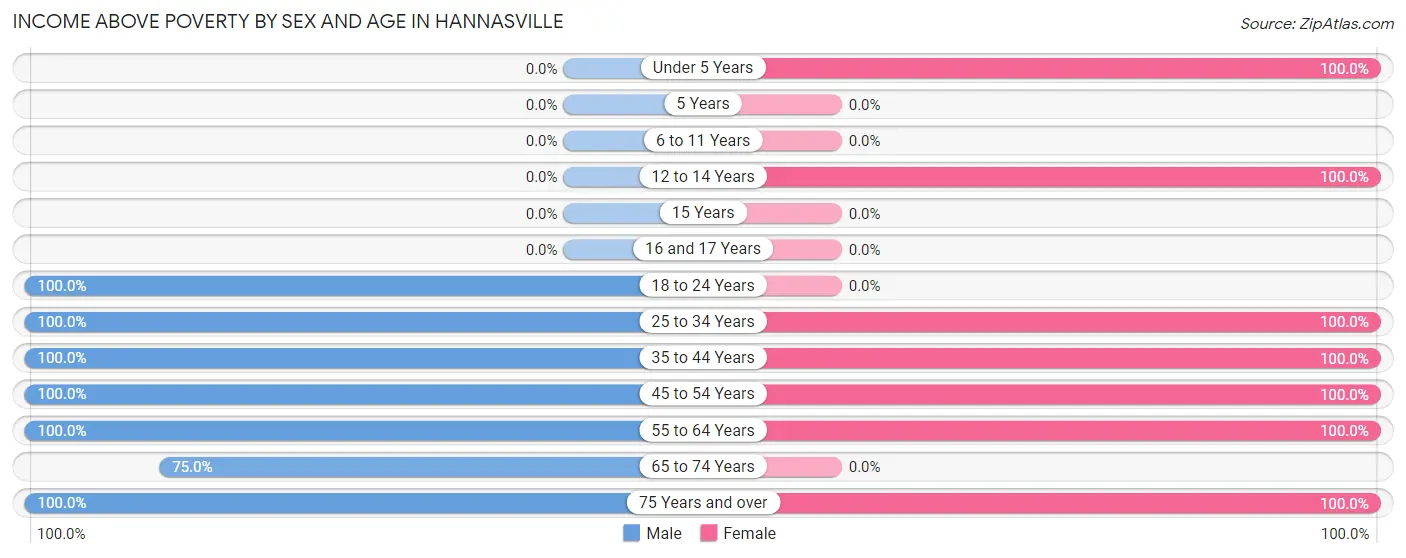
| Age Bracket | Male | Female |
| Under 5 Years | 0 (0.0%) | 3 (100.0%) |
| 5 Years | 0 (0.0%) | 0 (0.0%) |
| 6 to 11 Years | 0 (0.0%) | 0 (0.0%) |
| 12 to 14 Years | 0 (0.0%) | 12 (100.0%) |
| 15 Years | 0 (0.0%) | 0 (0.0%) |
| 16 and 17 Years | 0 (0.0%) | 0 (0.0%) |
| 18 to 24 Years | 4 (100.0%) | 0 (0.0%) |
| 25 to 34 Years | 6 (100.0%) | 2 (100.0%) |
| 35 to 44 Years | 13 (100.0%) | 17 (100.0%) |
| 45 to 54 Years | 13 (100.0%) | 3 (100.0%) |
| 55 to 64 Years | 5 (100.0%) | 8 (100.0%) |
| 65 to 74 Years | 6 (75.0%) | 0 (0.0%) |
| 75 Years and over | 8 (100.0%) | 11 (100.0%) |
| Total | 55 (96.5%) | 56 (100.0%) |
Income Below Poverty Among Married-Couple Families in Hannasville
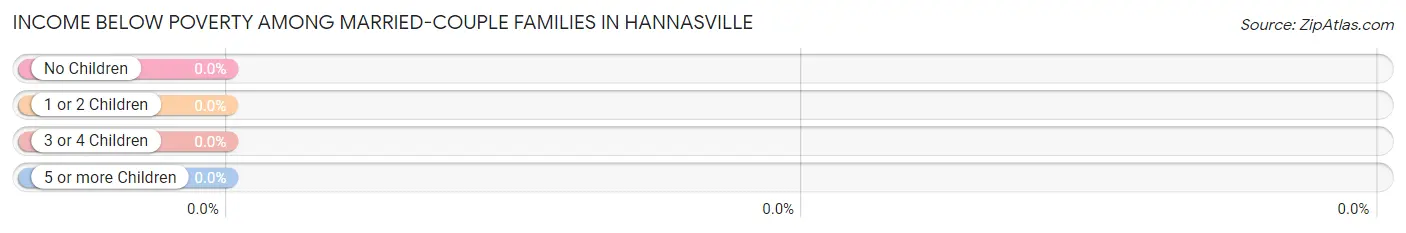
| Children | Above Poverty | Below Poverty |
| No Children | 15 (100.0%) | 0 (0.0%) |
| 1 or 2 Children | 13 (100.0%) | 0 (0.0%) |
| 3 or 4 Children | 0 (0.0%) | 0 (0.0%) |
| 5 or more Children | 0 (0.0%) | 0 (0.0%) |
| Total | 28 (100.0%) | 0 (0.0%) |
Income Below Poverty Among Single-Parent Households in Hannasville
| Children | Single Father | Single Mother |
| No Children | 0 (0.0%) | 0 (0.0%) |
| 1 or 2 Children | 0 (0.0%) | 0 (0.0%) |
| 3 or 4 Children | 0 (0.0%) | 0 (0.0%) |
| 5 or more Children | 0 (0.0%) | 0 (0.0%) |
| Total | 0 (0.0%) | 0 (0.0%) |
Income Below Poverty Among Married-Couple vs Single-Parent Households in Hannasville
| Children | Married-Couple Families | Single-Parent Households |
| No Children | 0 (0.0%) | 0 (0.0%) |
| 1 or 2 Children | 0 (0.0%) | 0 (0.0%) |
| 3 or 4 Children | 0 (0.0%) | 0 (0.0%) |
| 5 or more Children | 0 (0.0%) | 0 (0.0%) |
| Total | 0 (0.0%) | 0 (0.0%) |
Race in Hannasville
The most populous races in Hannasville are White / Caucasian (107 | 94.7%), and Two or more Races (6 | 5.3%).
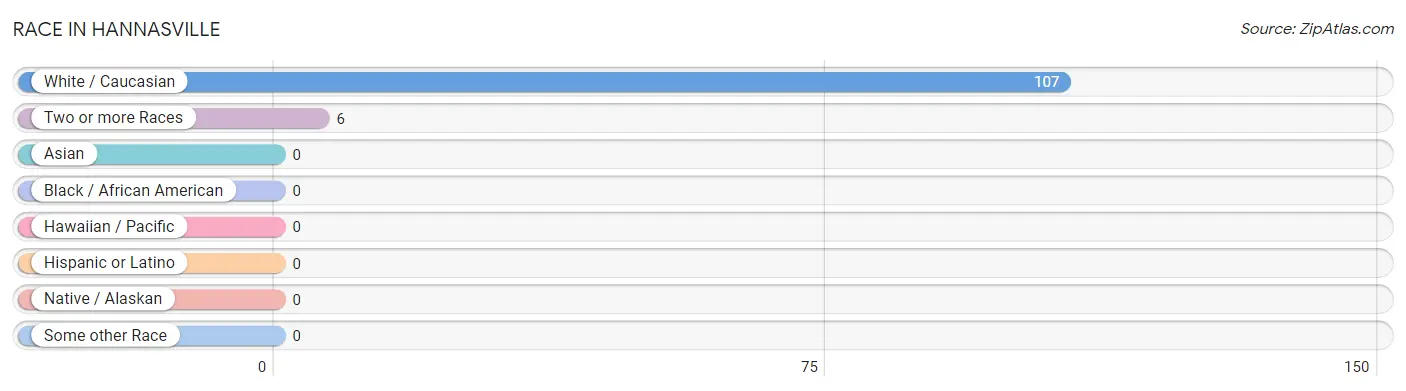
| Race | # Population | % Population |
| Asian | 0 | 0.0% |
| Black / African American | 0 | 0.0% |
| Hawaiian / Pacific | 0 | 0.0% |
| Hispanic or Latino | 0 | 0.0% |
| Native / Alaskan | 0 | 0.0% |
| White / Caucasian | 107 | 94.7% |
| Two or more Races | 6 | 5.3% |
| Some other Race | 0 | 0.0% |
| Total | 113 | 100.0% |
Ancestry in Hannasville
The most populous ancestries reported in Hannasville are German (51 | 45.1%), Irish (41 | 36.3%), American (9 | 8.0%), Welsh (4 | 3.5%), and English (3 | 2.6%), together accounting for 95.6% of all Hannasville residents.
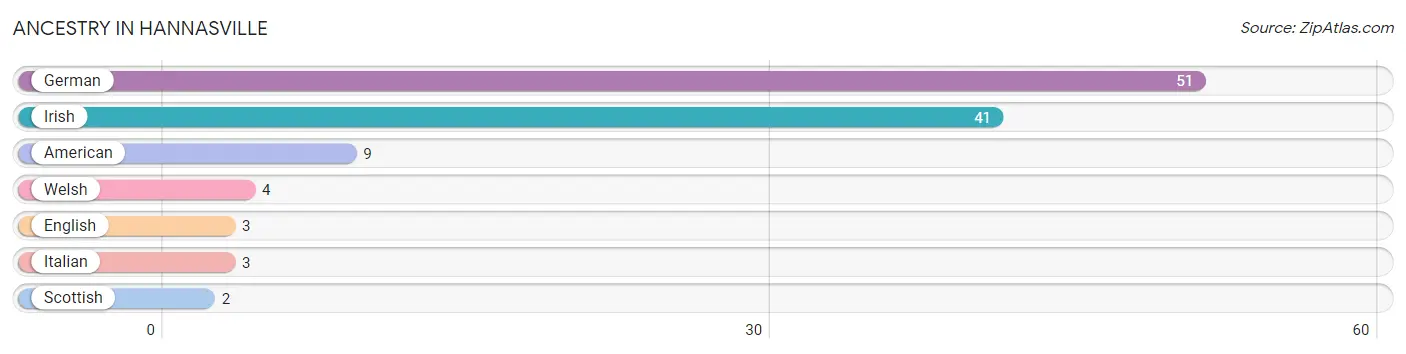
| Ancestry | # Population | % Population |
| American | 9 | 8.0% |
| English | 3 | 2.6% |
| German | 51 | 45.1% |
| Irish | 41 | 36.3% |
| Italian | 3 | 2.6% |
| Scottish | 2 | 1.8% |
| Welsh | 4 | 3.5% | View All 7 Rows |
Immigrants in Hannasville

| Immigration Origin | # Population | % Population | View All 0 Rows |
Sex and Age in Hannasville
Sex and Age in Hannasville
The most populous age groups in Hannasville are 40 to 44 Years (13 | 22.8%) for men and 35 to 39 Years (17 | 30.4%) for women.
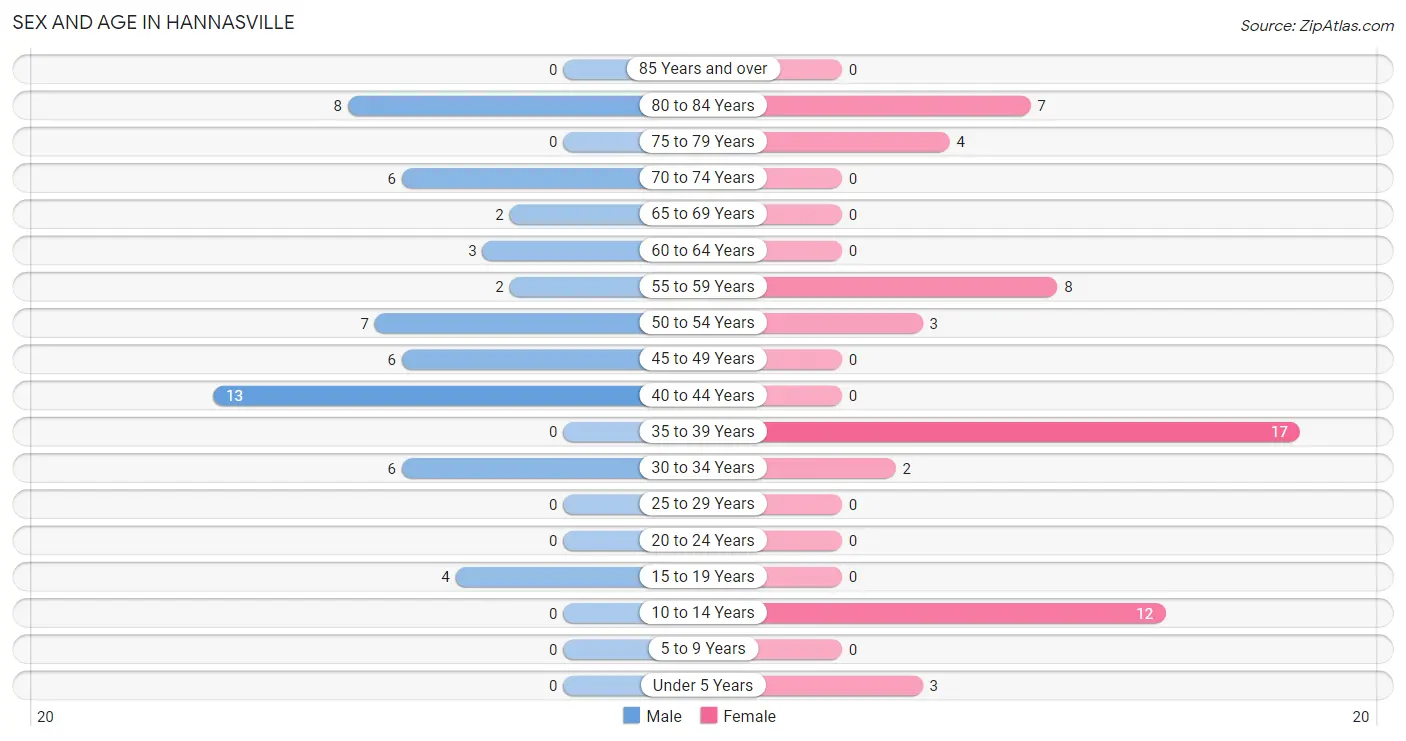
| Age Bracket | Male | Female |
| Under 5 Years | 0 (0.0%) | 3 (5.4%) |
| 5 to 9 Years | 0 (0.0%) | 0 (0.0%) |
| 10 to 14 Years | 0 (0.0%) | 12 (21.4%) |
| 15 to 19 Years | 4 (7.0%) | 0 (0.0%) |
| 20 to 24 Years | 0 (0.0%) | 0 (0.0%) |
| 25 to 29 Years | 0 (0.0%) | 0 (0.0%) |
| 30 to 34 Years | 6 (10.5%) | 2 (3.6%) |
| 35 to 39 Years | 0 (0.0%) | 17 (30.4%) |
| 40 to 44 Years | 13 (22.8%) | 0 (0.0%) |
| 45 to 49 Years | 6 (10.5%) | 0 (0.0%) |
| 50 to 54 Years | 7 (12.3%) | 3 (5.4%) |
| 55 to 59 Years | 2 (3.5%) | 8 (14.3%) |
| 60 to 64 Years | 3 (5.3%) | 0 (0.0%) |
| 65 to 69 Years | 2 (3.5%) | 0 (0.0%) |
| 70 to 74 Years | 6 (10.5%) | 0 (0.0%) |
| 75 to 79 Years | 0 (0.0%) | 4 (7.1%) |
| 80 to 84 Years | 8 (14.0%) | 7 (12.5%) |
| 85 Years and over | 0 (0.0%) | 0 (0.0%) |
| Total | 57 (100.0%) | 56 (100.0%) |
Families and Households in Hannasville
Median Family Size in Hannasville
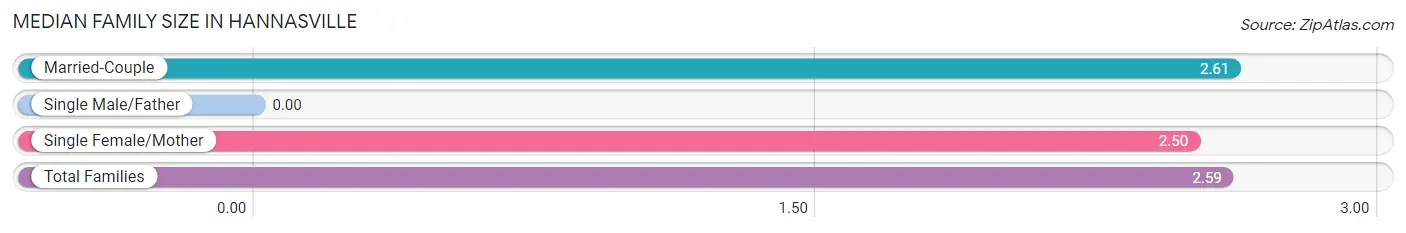
| Family Type | # Families | Family Size |
| Married-Couple | 28 (82.4%) | 2.61 |
| Single Male/Father | 0 (0.0%) | - |
| Single Female/Mother | 6 (17.6%) | 2.50 |
| Total Families | 34 (100.0%) | 2.59 |
Median Household Size in Hannasville
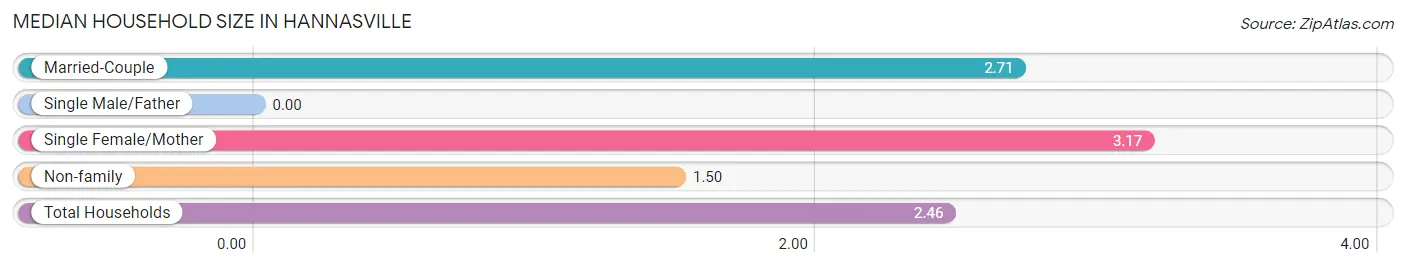
| Household Type | # Households | Household Size |
| Married-Couple | 28 (60.9%) | 2.71 |
| Single Male/Father | 0 (0.0%) | - |
| Single Female/Mother | 6 (13.0%) | 3.17 |
| Non-family | 12 (26.1%) | 1.50 |
| Total Households | 46 (100.0%) | 2.46 |
Household Size by Marriage Status in Hannasville
Out of a total of 46 households in Hannasville, 34 (73.9%) are family households, while 12 (26.1%) are nonfamily households. The most numerous type of family households are 3-person households, comprising 15, and the most common type of nonfamily households are 1-person households, comprising 6.
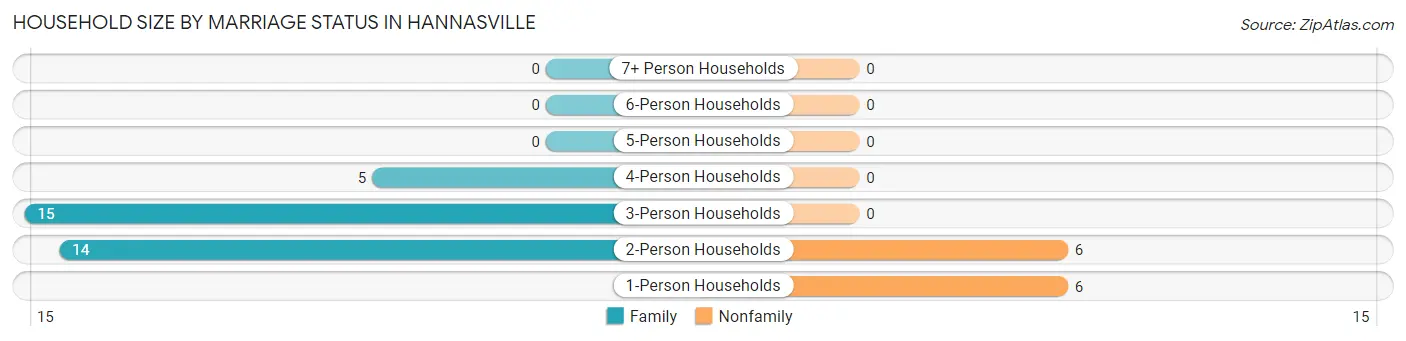
| Household Size | Family Households | Nonfamily Households |
| 1-Person Households | - | 6 (13.0%) |
| 2-Person Households | 14 (30.4%) | 6 (13.0%) |
| 3-Person Households | 15 (32.6%) | 0 (0.0%) |
| 4-Person Households | 5 (10.9%) | 0 (0.0%) |
| 5-Person Households | 0 (0.0%) | 0 (0.0%) |
| 6-Person Households | 0 (0.0%) | 0 (0.0%) |
| 7+ Person Households | 0 (0.0%) | 0 (0.0%) |
| Total | 34 (73.9%) | 12 (26.1%) |
Female Fertility in Hannasville
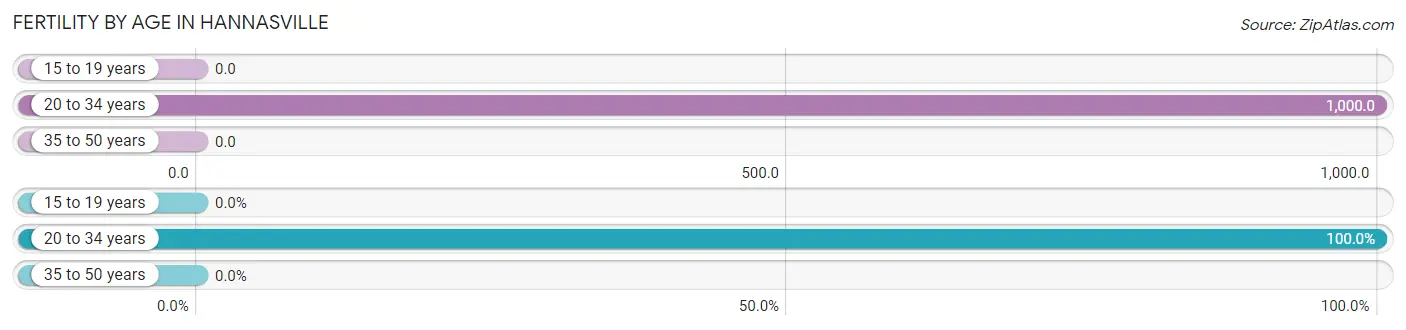
Fertility by Age in Hannasville
Average fertility rate in Hannasville is 91.0 births per 1,000 women. Women in the age bracket of 20 to 34 years have the highest fertility rate with 1,000.0 births per 1,000 women. Women in the age bracket of 20 to 34 years acount for 100.0% of all women with births.
| Age Bracket | Women with Births | Births / 1,000 Women |
| 15 to 19 years | 0 (0.0%) | 0.0 |
| 20 to 34 years | 2 (100.0%) | 1,000.0 |
| 35 to 50 years | 0 (0.0%) | 0.0 |
| Total | 2 (100.0%) | 91.0 |
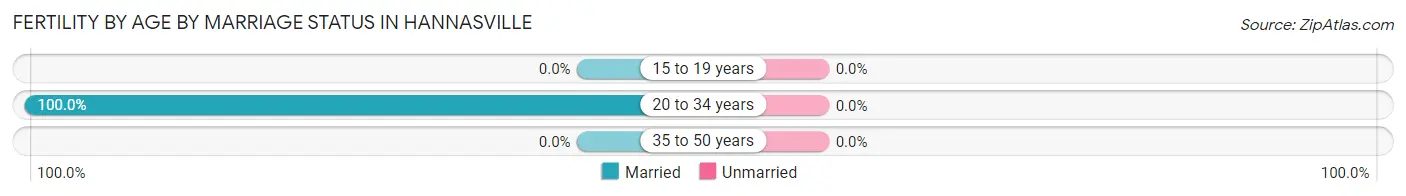
Fertility by Age by Marriage Status in Hannasville
| Age Bracket | Married | Unmarried |
| 15 to 19 years | 0 (0.0%) | 0 (0.0%) |
| 20 to 34 years | 2 (100.0%) | 0 (0.0%) |
| 35 to 50 years | 0 (0.0%) | 0 (0.0%) |
| Total | 2 (100.0%) | 0 (0.0%) |
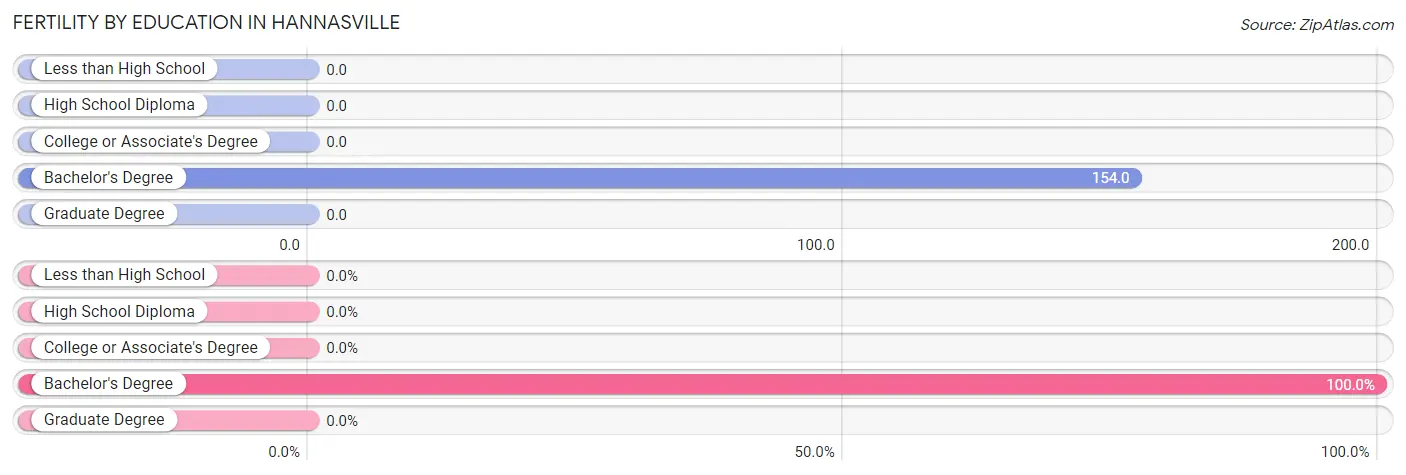
Fertility by Education in Hannasville
| Educational Attainment | Women with Births | Births / 1,000 Women |
| Less than High School | 0 (0.0%) | 0.0 |
| High School Diploma | 0 (0.0%) | 0.0 |
| College or Associate's Degree | 0 (0.0%) | 0.0 |
| Bachelor's Degree | 2 (100.0%) | 154.0 |
| Graduate Degree | 0 (0.0%) | 0.0 |
| Total | 2 (100.0%) | 91.0 |
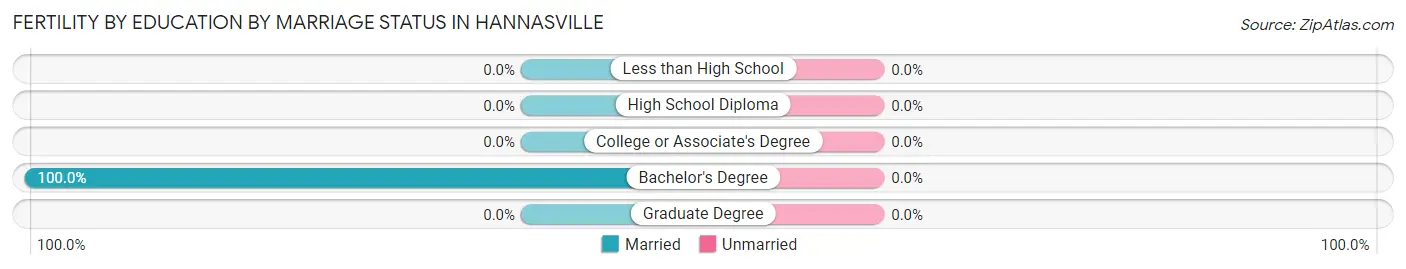
Fertility by Education by Marriage Status in Hannasville
| Educational Attainment | Married | Unmarried |
| Less than High School | 0 (0.0%) | 0 (0.0%) |
| High School Diploma | 0 (0.0%) | 0 (0.0%) |
| College or Associate's Degree | 0 (0.0%) | 0 (0.0%) |
| Bachelor's Degree | 2 (100.0%) | 0 (0.0%) |
| Graduate Degree | 0 (0.0%) | 0 (0.0%) |
| Total | 2 (100.0%) | 0 (0.0%) |
Employment Characteristics in Hannasville
Employment by Class of Employer in Hannasville
Among the 67 employed individuals in Hannasville, private company employees (30 | 44.8%), not-for-profit organizations (17 | 25.4%), and local government employees (10 | 14.9%) make up the most common classes of employment.
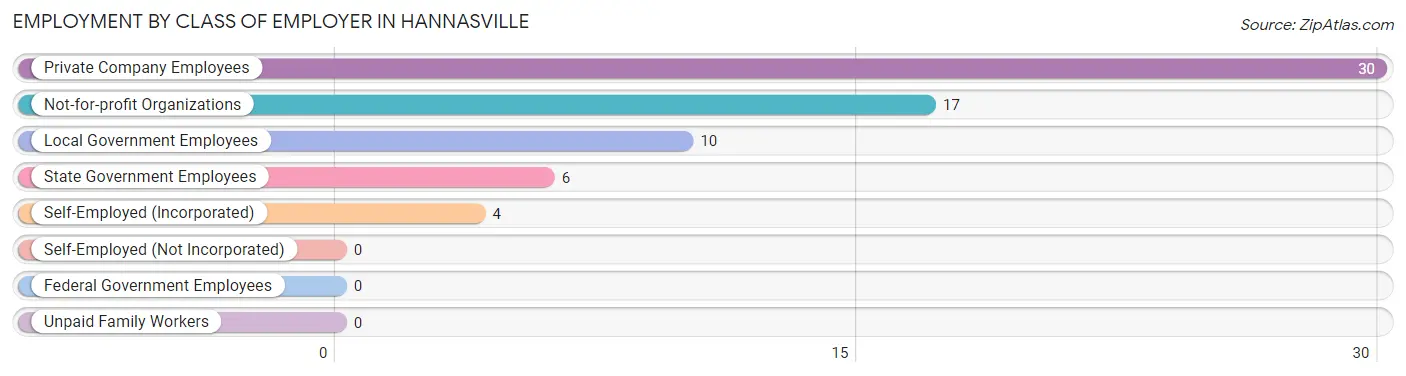
| Employer Class | # Employees | % Employees |
| Private Company Employees | 30 | 44.8% |
| Self-Employed (Incorporated) | 4 | 6.0% |
| Self-Employed (Not Incorporated) | 0 | 0.0% |
| Not-for-profit Organizations | 17 | 25.4% |
| Local Government Employees | 10 | 14.9% |
| State Government Employees | 6 | 9.0% |
| Federal Government Employees | 0 | 0.0% |
| Unpaid Family Workers | 0 | 0.0% |
| Total | 67 | 100.0% |
Employment Status by Age in Hannasville
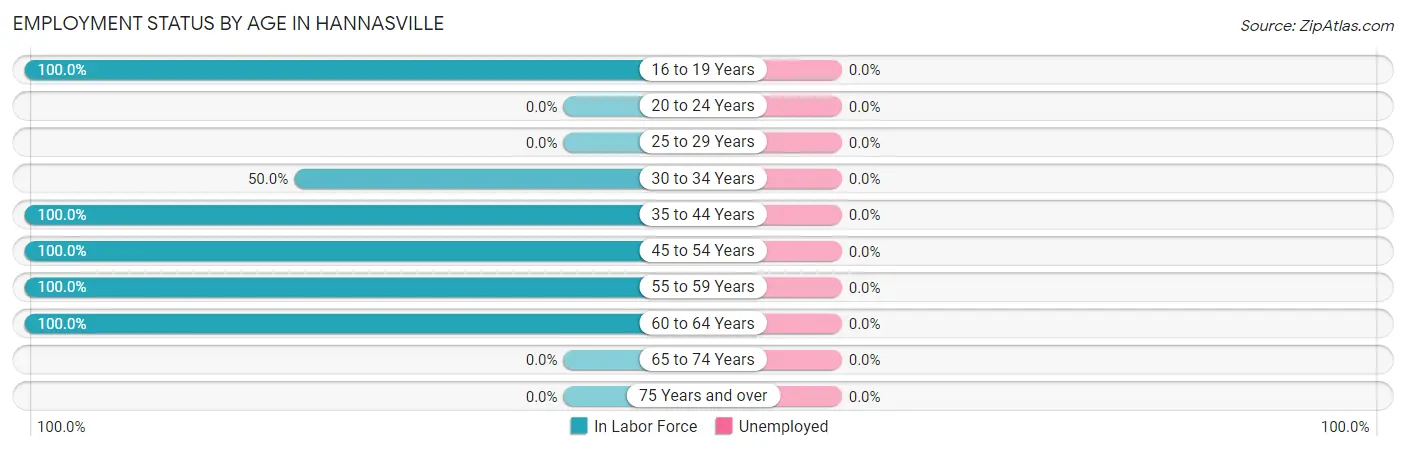
| Age Bracket | In Labor Force | Unemployed |
| 16 to 19 Years | 4 (100.0%) | 0 (0.0%) |
| 20 to 24 Years | 0 (0.0%) | 0 (0.0%) |
| 25 to 29 Years | 0 (0.0%) | 0 (0.0%) |
| 30 to 34 Years | 4 (50.0%) | 0 (0.0%) |
| 35 to 44 Years | 30 (100.0%) | 0 (0.0%) |
| 45 to 54 Years | 16 (100.0%) | 0 (0.0%) |
| 55 to 59 Years | 10 (100.0%) | 0 (0.0%) |
| 60 to 64 Years | 3 (100.0%) | 0 (0.0%) |
| 65 to 74 Years | 0 (0.0%) | 0 (0.0%) |
| 75 Years and over | 0 (0.0%) | 0 (0.0%) |
| Total | 67 (68.4%) | 0 (0.0%) |
Employment Status by Educational Attainment in Hannasville
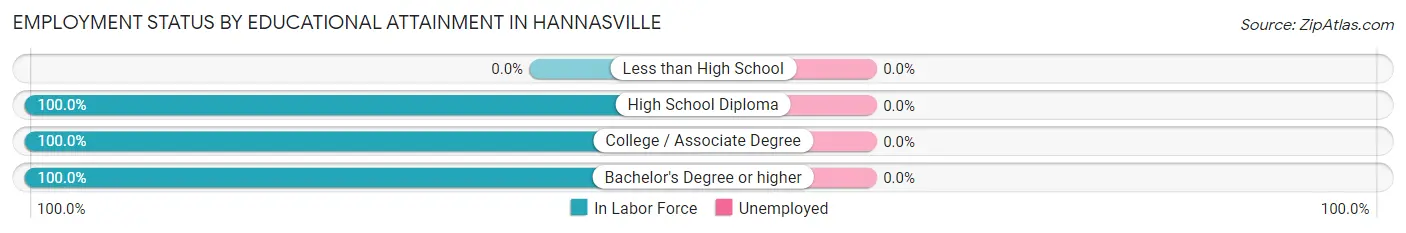
| Educational Attainment | In Labor Force | Unemployed |
| Less than High School | 0 (0.0%) | 0 (0.0%) |
| High School Diploma | 37 (100.0%) | 0 (0.0%) |
| College / Associate Degree | 10 (100.0%) | 0 (0.0%) |
| Bachelor's Degree or higher | 16 (100.0%) | 0 (0.0%) |
| Total | 63 (94.0%) | 0 (0.0%) |
Employment Occupations by Sex in Hannasville
Management, Business, Science and Arts Occupations
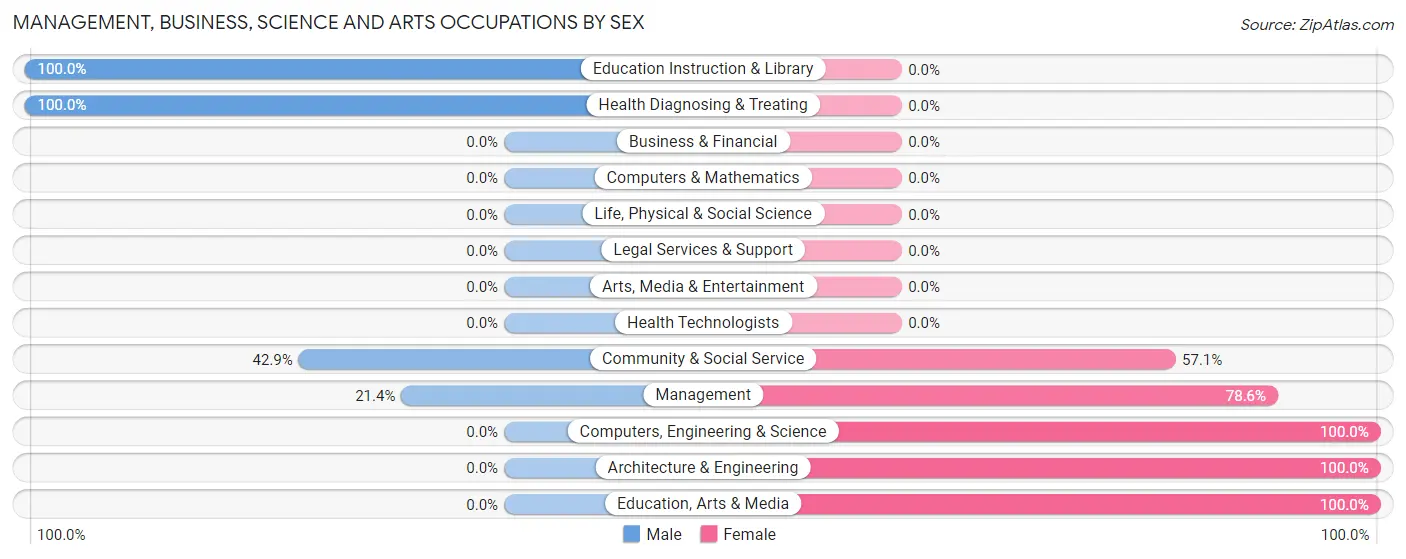
The most common Management, Business, Science and Arts occupations in Hannasville are Management (14 | 20.9%), Community & Social Service (7 | 10.4%), Education, Arts & Media (4 | 6.0%), Education Instruction & Library (3 | 4.5%), and Computers, Engineering & Science (2 | 3.0%).
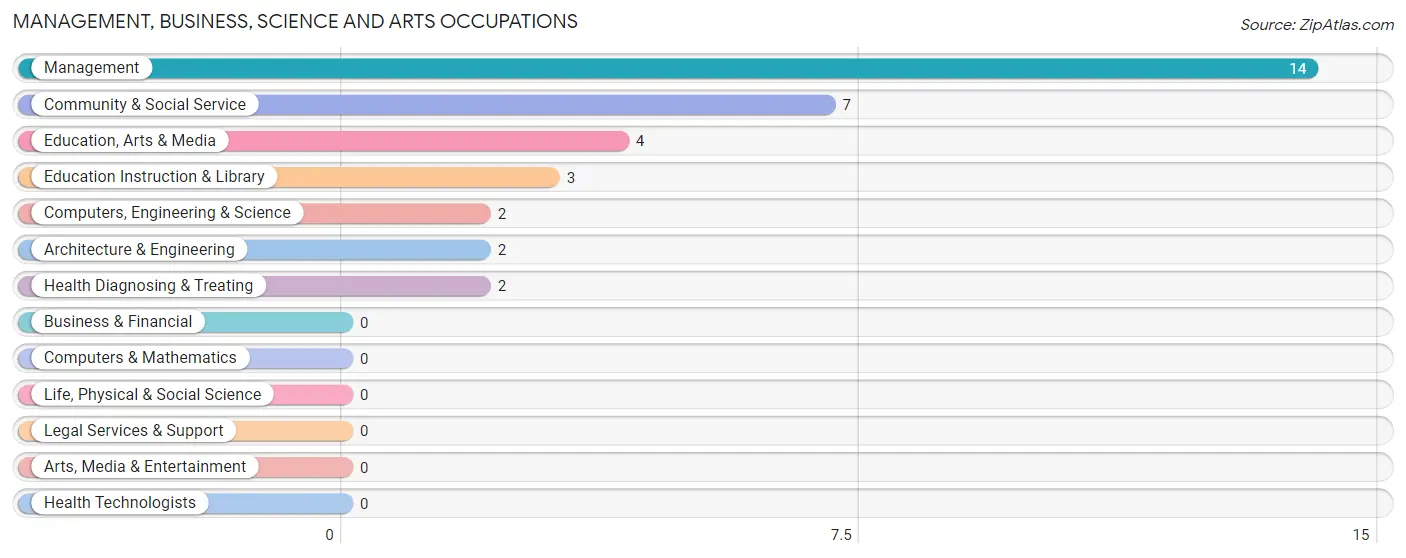
Management, Business, Science and Arts Occupations by Sex
Within the Management, Business, Science and Arts occupations in Hannasville, the most male-oriented occupations are Education Instruction & Library (100.0%), Health Diagnosing & Treating (100.0%), and Community & Social Service (42.9%), while the most female-oriented occupations are Computers, Engineering & Science (100.0%), Architecture & Engineering (100.0%), and Education, Arts & Media (100.0%).
| Occupation | Male | Female |
| Management | 3 (21.4%) | 11 (78.6%) |
| Business & Financial | 0 (0.0%) | 0 (0.0%) |
| Computers, Engineering & Science | 0 (0.0%) | 2 (100.0%) |
| Computers & Mathematics | 0 (0.0%) | 0 (0.0%) |
| Architecture & Engineering | 0 (0.0%) | 2 (100.0%) |
| Life, Physical & Social Science | 0 (0.0%) | 0 (0.0%) |
| Community & Social Service | 3 (42.9%) | 4 (57.1%) |
| Education, Arts & Media | 0 (0.0%) | 4 (100.0%) |
| Legal Services & Support | 0 (0.0%) | 0 (0.0%) |
| Education Instruction & Library | 3 (100.0%) | 0 (0.0%) |
| Arts, Media & Entertainment | 0 (0.0%) | 0 (0.0%) |
| Health Diagnosing & Treating | 2 (100.0%) | 0 (0.0%) |
| Health Technologists | 0 (0.0%) | 0 (0.0%) |
| Total (Category) | 8 (32.0%) | 17 (68.0%) |
| Total (Overall) | 37 (55.2%) | 30 (44.8%) |
Services Occupations
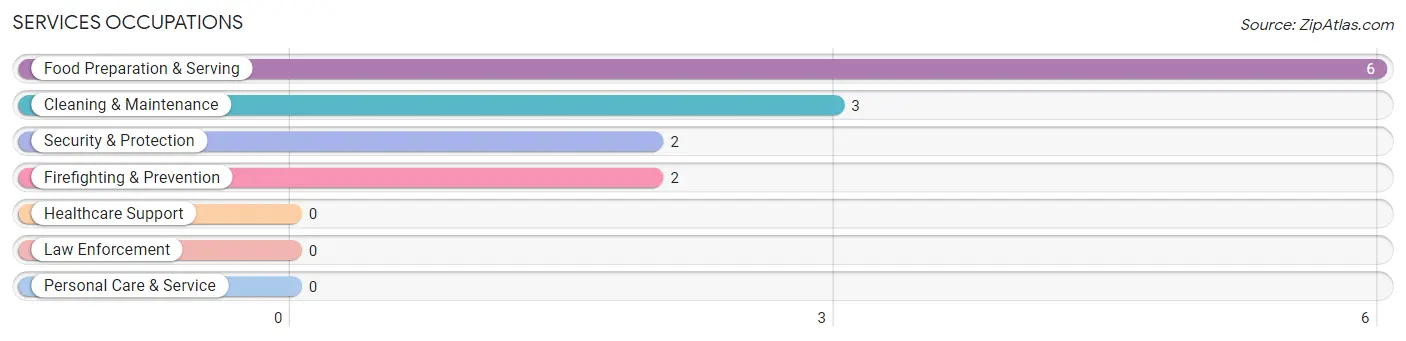
The most common Services occupations in Hannasville are Food Preparation & Serving (6 | 9.0%), Cleaning & Maintenance (3 | 4.5%), Security & Protection (2 | 3.0%), and Firefighting & Prevention (2 | 3.0%).
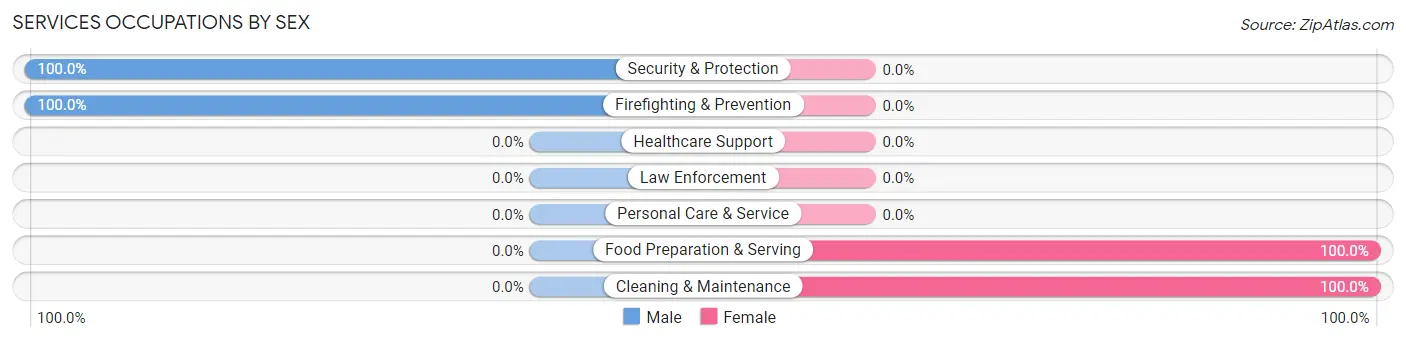
Services Occupations by Sex
Within the Services occupations in Hannasville, the most male-oriented occupations are Security & Protection (100.0%), and Firefighting & Prevention (100.0%), while the most female-oriented occupations are Food Preparation & Serving (100.0%), and Cleaning & Maintenance (100.0%).
| Occupation | Male | Female |
| Healthcare Support | 0 (0.0%) | 0 (0.0%) |
| Security & Protection | 2 (100.0%) | 0 (0.0%) |
| Firefighting & Prevention | 2 (100.0%) | 0 (0.0%) |
| Law Enforcement | 0 (0.0%) | 0 (0.0%) |
| Food Preparation & Serving | 0 (0.0%) | 6 (100.0%) |
| Cleaning & Maintenance | 0 (0.0%) | 3 (100.0%) |
| Personal Care & Service | 0 (0.0%) | 0 (0.0%) |
| Total (Category) | 2 (18.2%) | 9 (81.8%) |
| Total (Overall) | 37 (55.2%) | 30 (44.8%) |
Sales and Office Occupations
The most common Sales and Office occupations in Hannasville are Sales & Related (4 | 6.0%), and Office & Administration (4 | 6.0%).

Sales and Office Occupations by Sex

| Occupation | Male | Female |
| Sales & Related | 4 (100.0%) | 0 (0.0%) |
| Office & Administration | 0 (0.0%) | 4 (100.0%) |
| Total (Category) | 4 (50.0%) | 4 (50.0%) |
| Total (Overall) | 37 (55.2%) | 30 (44.8%) |
Natural Resources, Construction and Maintenance Occupations
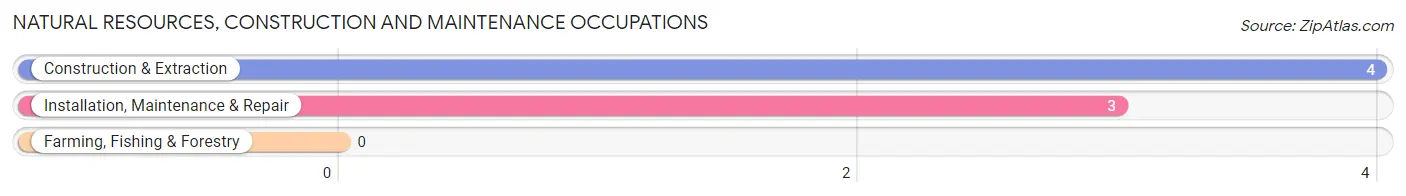
The most common Natural Resources, Construction and Maintenance occupations in Hannasville are Construction & Extraction (4 | 6.0%), and Installation, Maintenance & Repair (3 | 4.5%).
Natural Resources, Construction and Maintenance Occupations by Sex

| Occupation | Male | Female |
| Farming, Fishing & Forestry | 0 (0.0%) | 0 (0.0%) |
| Construction & Extraction | 4 (100.0%) | 0 (0.0%) |
| Installation, Maintenance & Repair | 3 (100.0%) | 0 (0.0%) |
| Total (Category) | 7 (100.0%) | 0 (0.0%) |
| Total (Overall) | 37 (55.2%) | 30 (44.8%) |
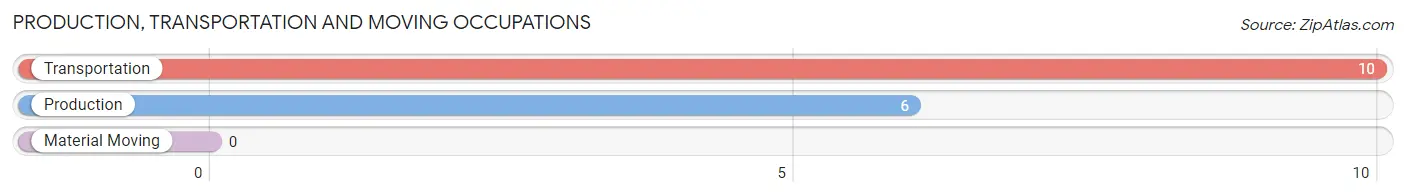
Production, Transportation and Moving Occupations
The most common Production, Transportation and Moving occupations in Hannasville are Transportation (10 | 14.9%), and Production (6 | 9.0%).
Production, Transportation and Moving Occupations by Sex
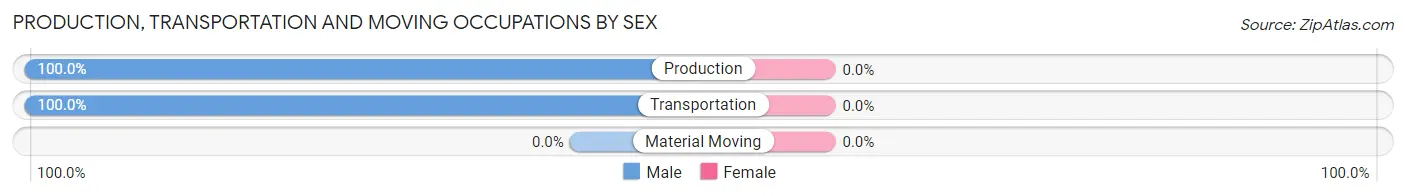
| Occupation | Male | Female |
| Production | 6 (100.0%) | 0 (0.0%) |
| Transportation | 10 (100.0%) | 0 (0.0%) |
| Material Moving | 0 (0.0%) | 0 (0.0%) |
| Total (Category) | 16 (100.0%) | 0 (0.0%) |
| Total (Overall) | 37 (55.2%) | 30 (44.8%) |
Employment Industries by Sex in Hannasville
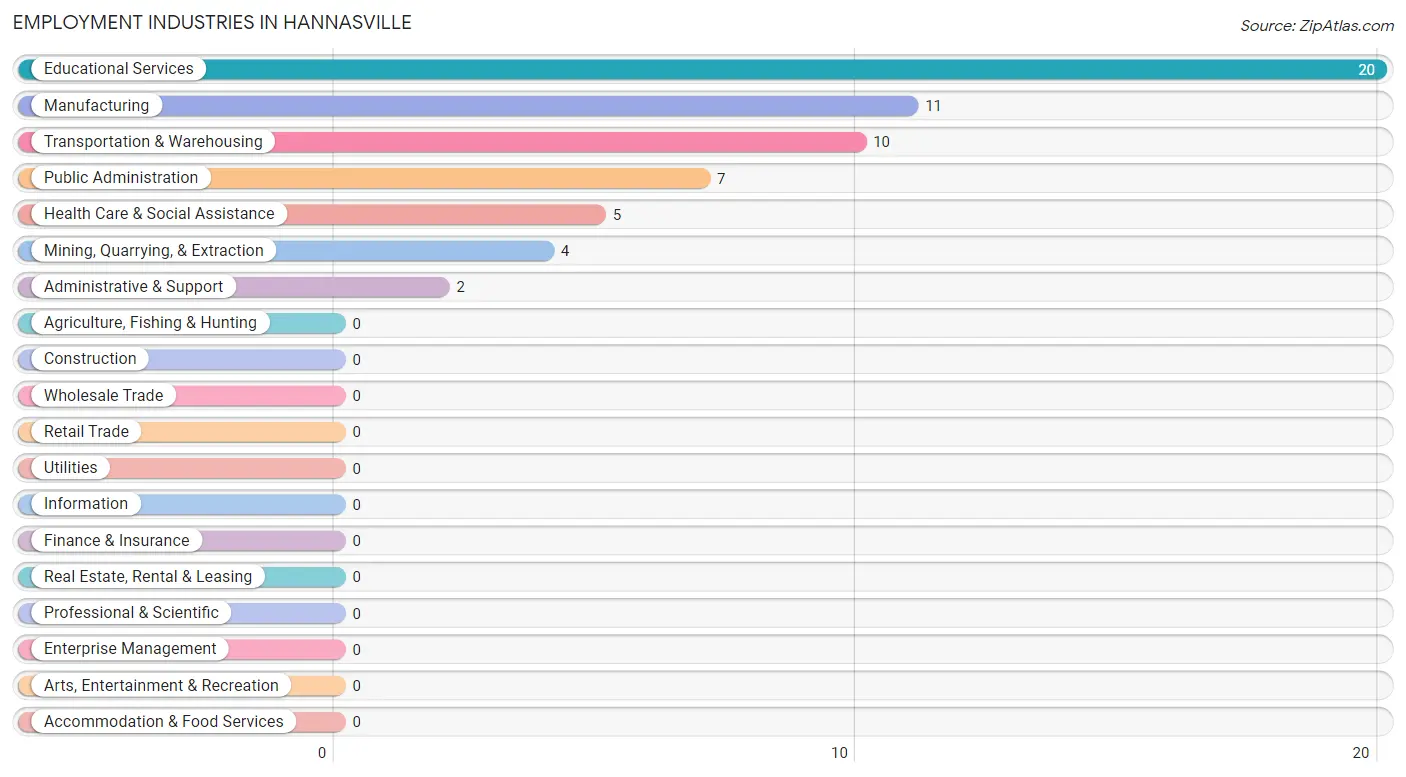
Employment Industries in Hannasville
The major employment industries in Hannasville include Educational Services (20 | 29.8%), Manufacturing (11 | 16.4%), Transportation & Warehousing (10 | 14.9%), Public Administration (7 | 10.4%), and Health Care & Social Assistance (5 | 7.5%).
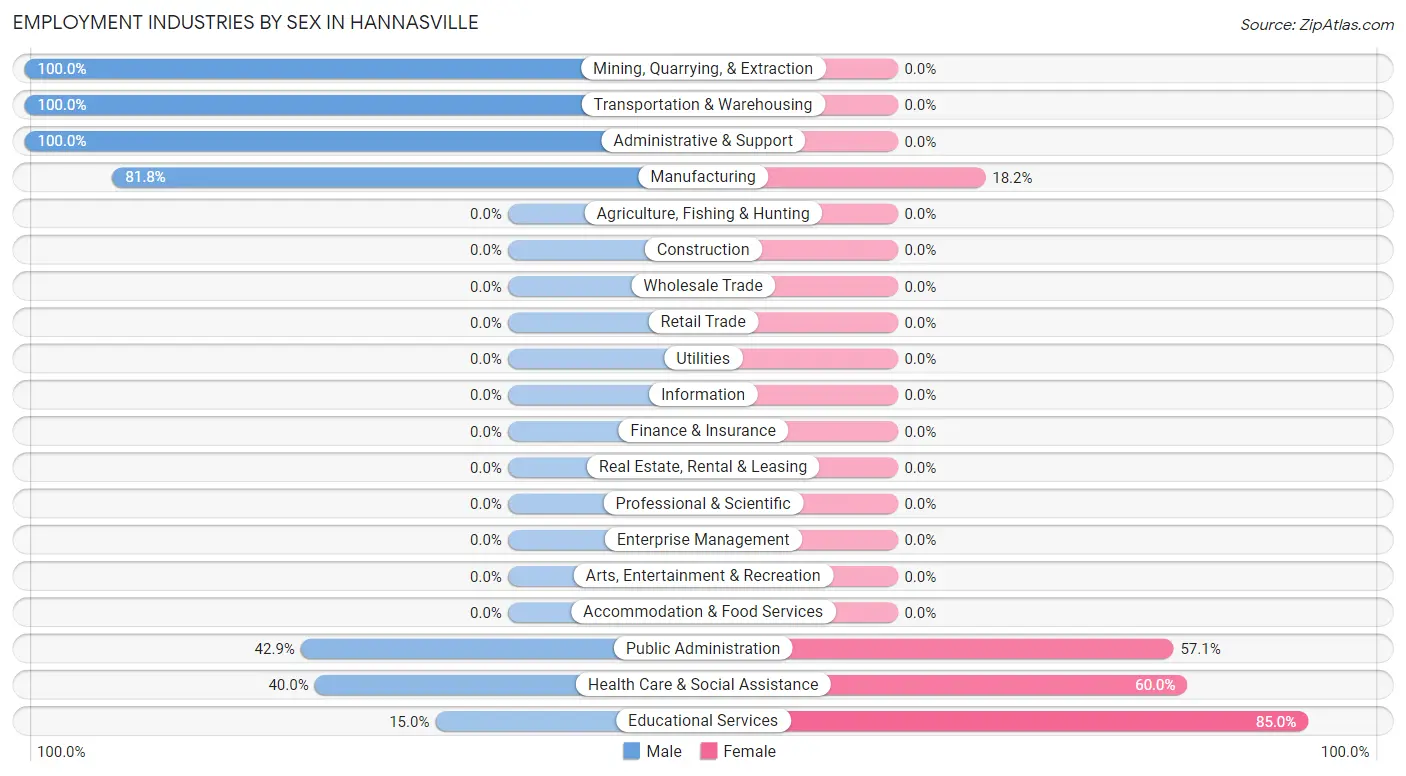
Employment Industries by Sex in Hannasville
The Hannasville industries that see more men than women are Mining, Quarrying, & Extraction (100.0%), Transportation & Warehousing (100.0%), and Administrative & Support (100.0%), whereas the industries that tend to have a higher number of women are Educational Services (85.0%), Health Care & Social Assistance (60.0%), and Public Administration (57.1%).
| Industry | Male | Female |
| Agriculture, Fishing & Hunting | 0 (0.0%) | 0 (0.0%) |
| Mining, Quarrying, & Extraction | 4 (100.0%) | 0 (0.0%) |
| Construction | 0 (0.0%) | 0 (0.0%) |
| Manufacturing | 9 (81.8%) | 2 (18.2%) |
| Wholesale Trade | 0 (0.0%) | 0 (0.0%) |
| Retail Trade | 0 (0.0%) | 0 (0.0%) |
| Transportation & Warehousing | 10 (100.0%) | 0 (0.0%) |
| Utilities | 0 (0.0%) | 0 (0.0%) |
| Information | 0 (0.0%) | 0 (0.0%) |
| Finance & Insurance | 0 (0.0%) | 0 (0.0%) |
| Real Estate, Rental & Leasing | 0 (0.0%) | 0 (0.0%) |
| Professional & Scientific | 0 (0.0%) | 0 (0.0%) |
| Enterprise Management | 0 (0.0%) | 0 (0.0%) |
| Administrative & Support | 2 (100.0%) | 0 (0.0%) |
| Educational Services | 3 (15.0%) | 17 (85.0%) |
| Health Care & Social Assistance | 2 (40.0%) | 3 (60.0%) |
| Arts, Entertainment & Recreation | 0 (0.0%) | 0 (0.0%) |
| Accommodation & Food Services | 0 (0.0%) | 0 (0.0%) |
| Public Administration | 3 (42.9%) | 4 (57.1%) |
| Total | 37 (55.2%) | 30 (44.8%) |
Education in Hannasville
School Enrollment in Hannasville
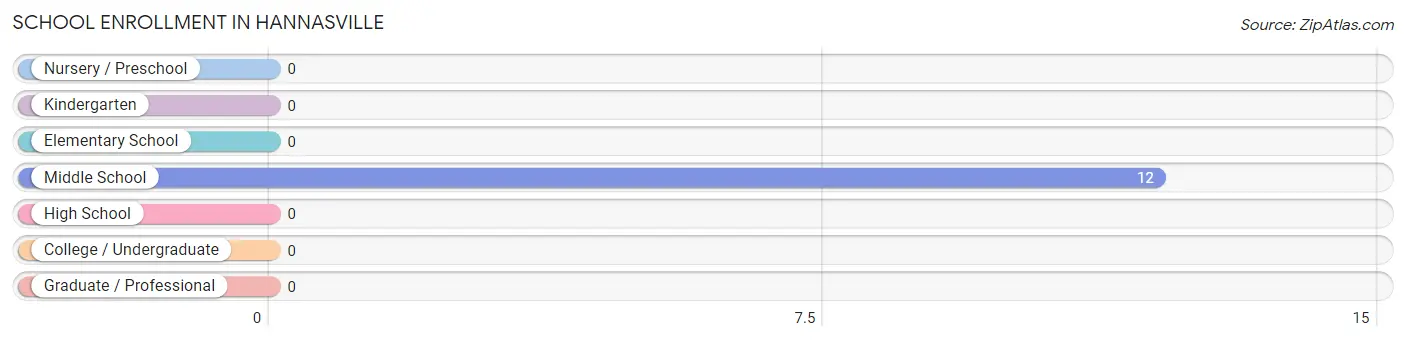
| School Level | # Students | % Students |
| Nursery / Preschool | 0 | 0.0% |
| Kindergarten | 0 | 0.0% |
| Elementary School | 0 | 0.0% |
| Middle School | 12 | 100.0% |
| High School | 0 | 0.0% |
| College / Undergraduate | 0 | 0.0% |
| Graduate / Professional | 0 | 0.0% |
| Total | 12 | 100.0% |
School Enrollment by Age by Funding Source in Hannasville
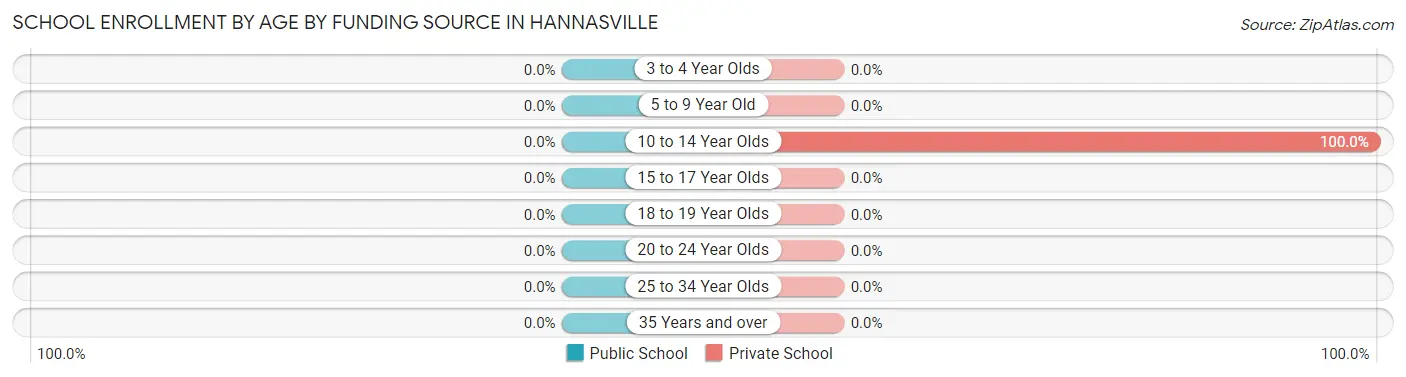
| Age Bracket | Public School | Private School |
| 3 to 4 Year Olds | 0 (0.0%) | 0 (0.0%) |
| 5 to 9 Year Old | 0 (0.0%) | 0 (0.0%) |
| 10 to 14 Year Olds | 0 (0.0%) | 12 (100.0%) |
| 15 to 17 Year Olds | 0 (0.0%) | 0 (0.0%) |
| 18 to 19 Year Olds | 0 (0.0%) | 0 (0.0%) |
| 20 to 24 Year Olds | 0 (0.0%) | 0 (0.0%) |
| 25 to 34 Year Olds | 0 (0.0%) | 0 (0.0%) |
| 35 Years and over | 0 (0.0%) | 0 (0.0%) |
| Total | 0 (0.0%) | 12 (100.0%) |
Educational Attainment by Field of Study in Hannasville
Business (11 | 32.4%), education (7 | 20.6%), engineering (6 | 17.6%), science & technology (4 | 11.8%), and psychology (2 | 5.9%) are the most common fields of study among 34 individuals in Hannasville who have obtained a bachelor's degree or higher.
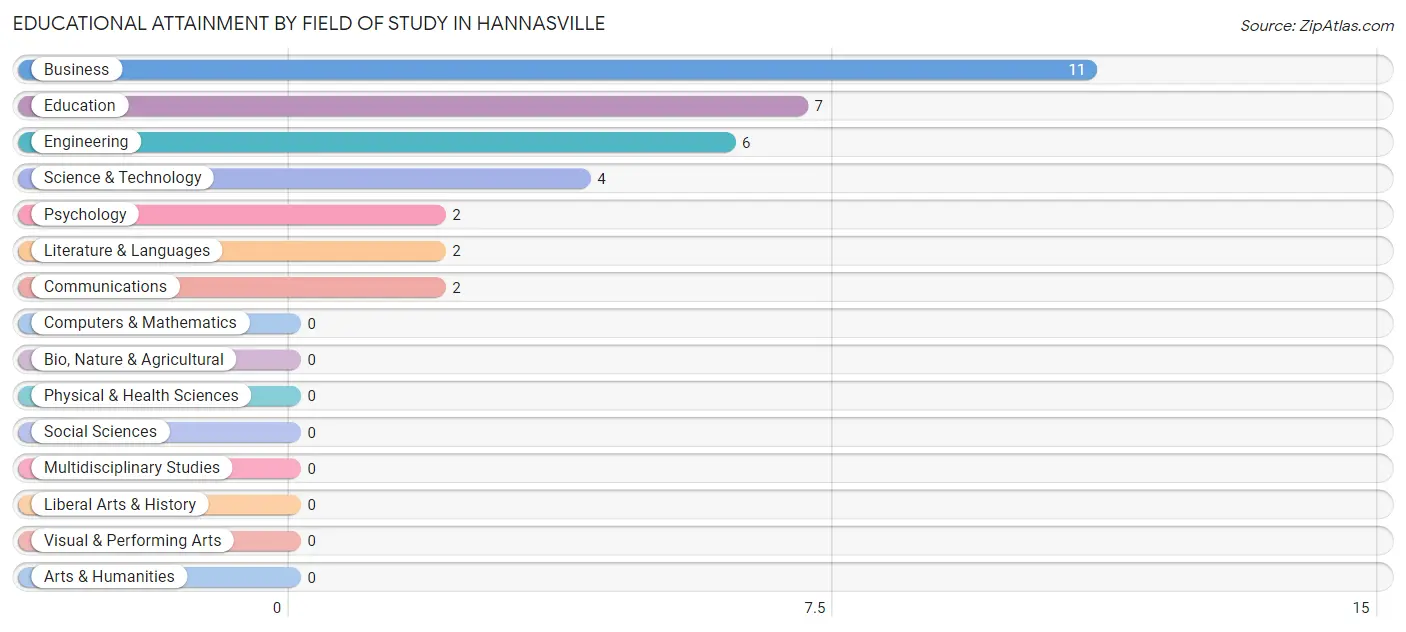
| Field of Study | # Graduates | % Graduates |
| Computers & Mathematics | 0 | 0.0% |
| Bio, Nature & Agricultural | 0 | 0.0% |
| Physical & Health Sciences | 0 | 0.0% |
| Psychology | 2 | 5.9% |
| Social Sciences | 0 | 0.0% |
| Engineering | 6 | 17.6% |
| Multidisciplinary Studies | 0 | 0.0% |
| Science & Technology | 4 | 11.8% |
| Business | 11 | 32.4% |
| Education | 7 | 20.6% |
| Literature & Languages | 2 | 5.9% |
| Liberal Arts & History | 0 | 0.0% |
| Visual & Performing Arts | 0 | 0.0% |
| Communications | 2 | 5.9% |
| Arts & Humanities | 0 | 0.0% |
| Total | 34 | 100.0% |
Transportation & Commute in Hannasville
Vehicle Availability by Sex in Hannasville
The most prevalent vehicle ownership categories in Hannasville are males with 2 vehicles (19, accounting for 51.3%) and females with 2 vehicles (21, making up 63.3%).
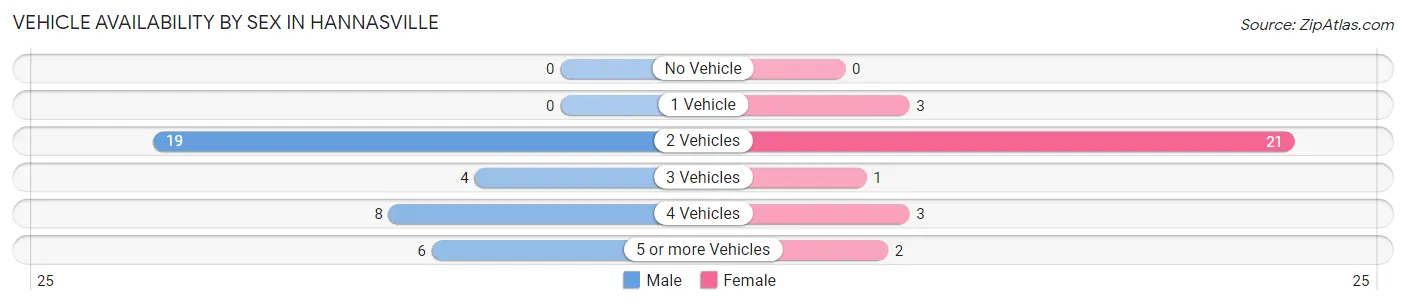
| Vehicles Available | Male | Female |
| No Vehicle | 0 (0.0%) | 0 (0.0%) |
| 1 Vehicle | 0 (0.0%) | 3 (10.0%) |
| 2 Vehicles | 19 (51.3%) | 21 (70.0%) |
| 3 Vehicles | 4 (10.8%) | 1 (3.3%) |
| 4 Vehicles | 8 (21.6%) | 3 (10.0%) |
| 5 or more Vehicles | 6 (16.2%) | 2 (6.7%) |
| Total | 37 (100.0%) | 30 (100.0%) |
Commute Time in Hannasville
The most frequently occuring commute durations in Hannasville are 25 to 29 minutes (32 commuters, 47.8%), 45 to 59 minutes (12 commuters, 17.9%), and 20 to 24 minutes (8 commuters, 11.9%).
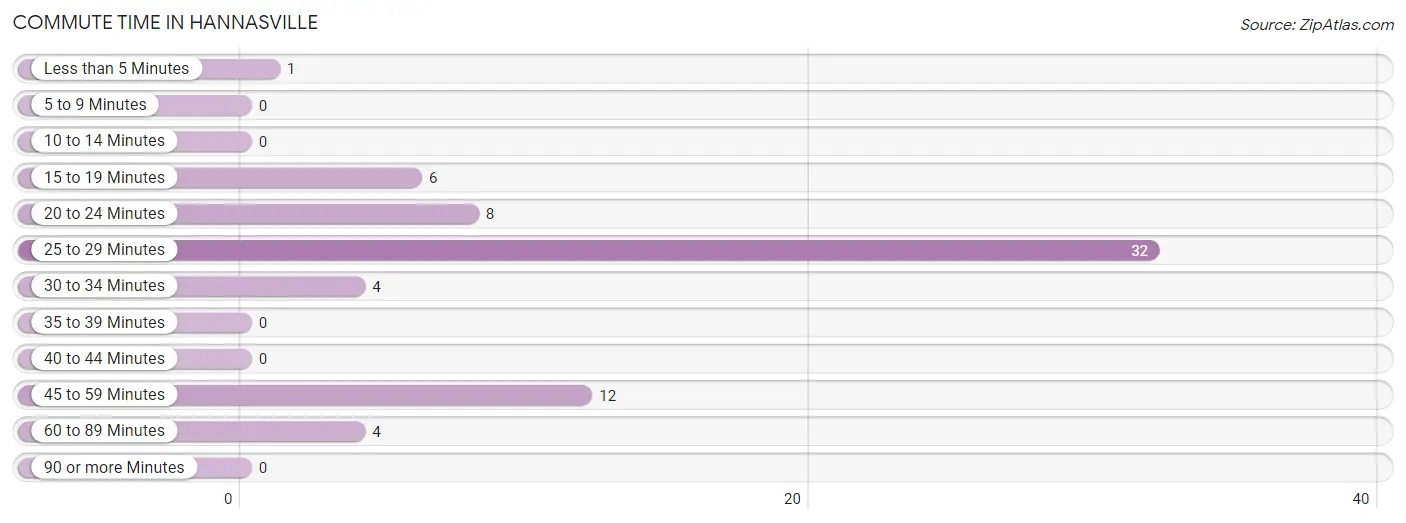
| Commute Time | # Commuters | % Commuters |
| Less than 5 Minutes | 1 | 1.5% |
| 5 to 9 Minutes | 0 | 0.0% |
| 10 to 14 Minutes | 0 | 0.0% |
| 15 to 19 Minutes | 6 | 9.0% |
| 20 to 24 Minutes | 8 | 11.9% |
| 25 to 29 Minutes | 32 | 47.8% |
| 30 to 34 Minutes | 4 | 6.0% |
| 35 to 39 Minutes | 0 | 0.0% |
| 40 to 44 Minutes | 0 | 0.0% |
| 45 to 59 Minutes | 12 | 17.9% |
| 60 to 89 Minutes | 4 | 6.0% |
| 90 or more Minutes | 0 | 0.0% |
Commute Time by Sex in Hannasville
The most common commute times in Hannasville are 25 to 29 minutes (12 commuters, 32.4%) for males and 25 to 29 minutes (20 commuters, 66.7%) for females.
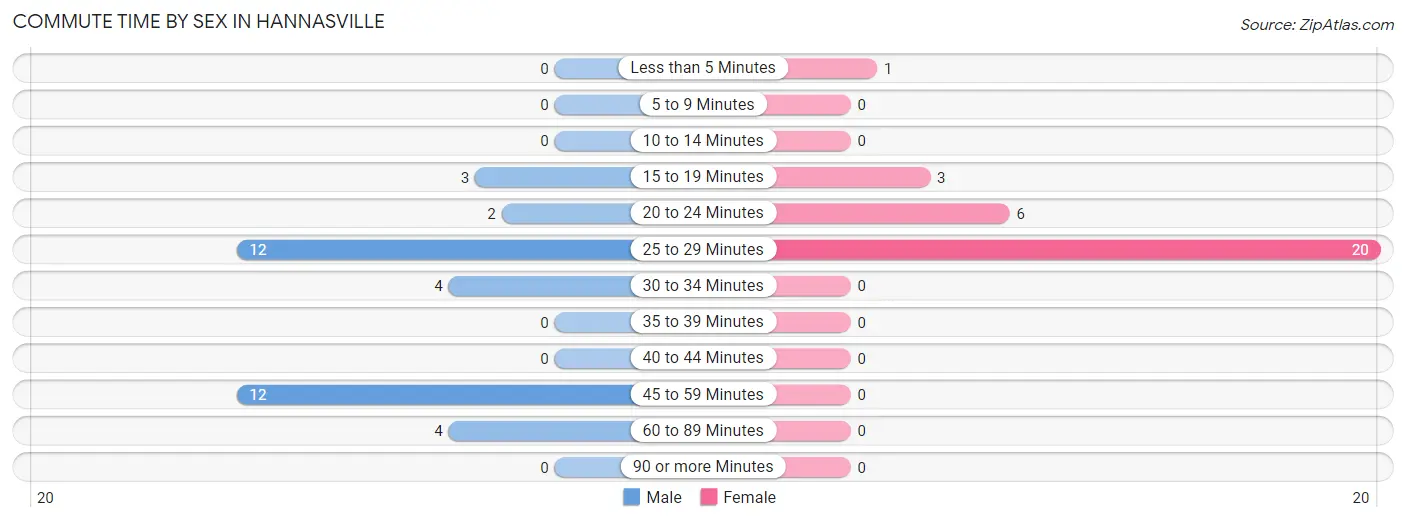
| Commute Time | Male | Female |
| Less than 5 Minutes | 0 (0.0%) | 1 (3.3%) |
| 5 to 9 Minutes | 0 (0.0%) | 0 (0.0%) |
| 10 to 14 Minutes | 0 (0.0%) | 0 (0.0%) |
| 15 to 19 Minutes | 3 (8.1%) | 3 (10.0%) |
| 20 to 24 Minutes | 2 (5.4%) | 6 (20.0%) |
| 25 to 29 Minutes | 12 (32.4%) | 20 (66.7%) |
| 30 to 34 Minutes | 4 (10.8%) | 0 (0.0%) |
| 35 to 39 Minutes | 0 (0.0%) | 0 (0.0%) |
| 40 to 44 Minutes | 0 (0.0%) | 0 (0.0%) |
| 45 to 59 Minutes | 12 (32.4%) | 0 (0.0%) |
| 60 to 89 Minutes | 4 (10.8%) | 0 (0.0%) |
| 90 or more Minutes | 0 (0.0%) | 0 (0.0%) |
Time of Departure to Work by Sex in Hannasville
The most frequent times of departure to work in Hannasville are 12:00 AM to 4:59 AM (10, 27.0%) for males and 7:00 AM to 7:29 AM (20, 66.7%) for females.
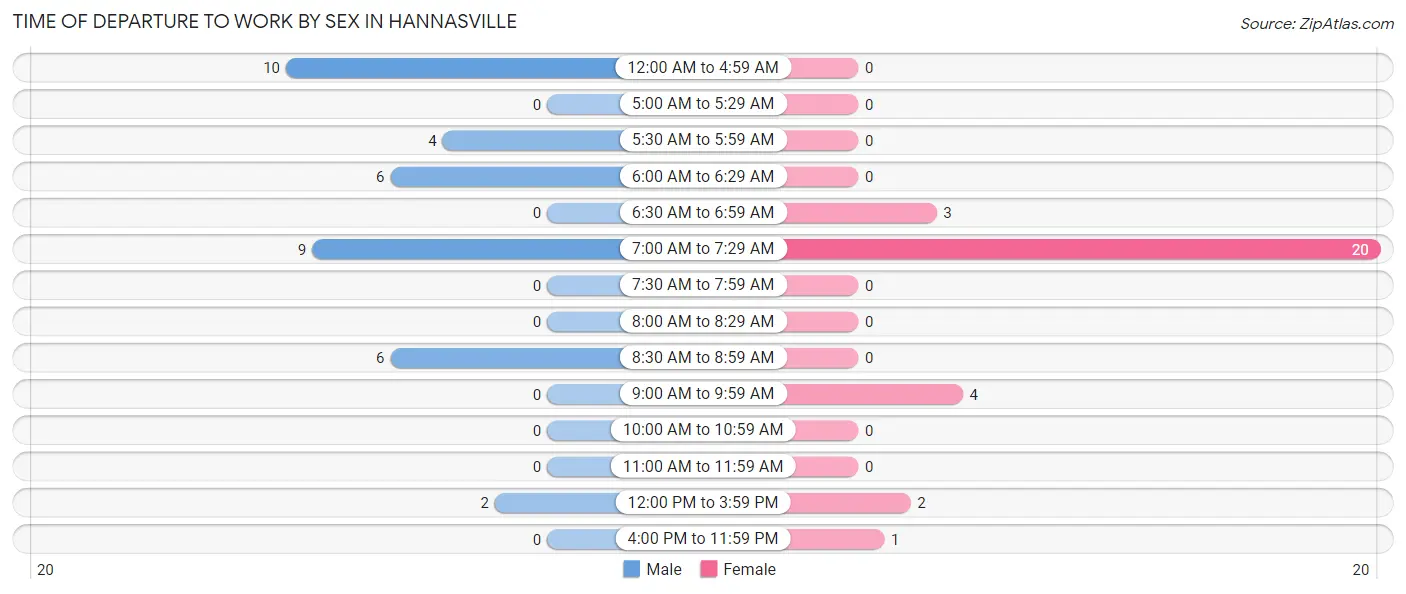
| Time of Departure | Male | Female |
| 12:00 AM to 4:59 AM | 10 (27.0%) | 0 (0.0%) |
| 5:00 AM to 5:29 AM | 0 (0.0%) | 0 (0.0%) |
| 5:30 AM to 5:59 AM | 4 (10.8%) | 0 (0.0%) |
| 6:00 AM to 6:29 AM | 6 (16.2%) | 0 (0.0%) |
| 6:30 AM to 6:59 AM | 0 (0.0%) | 3 (10.0%) |
| 7:00 AM to 7:29 AM | 9 (24.3%) | 20 (66.7%) |
| 7:30 AM to 7:59 AM | 0 (0.0%) | 0 (0.0%) |
| 8:00 AM to 8:29 AM | 0 (0.0%) | 0 (0.0%) |
| 8:30 AM to 8:59 AM | 6 (16.2%) | 0 (0.0%) |
| 9:00 AM to 9:59 AM | 0 (0.0%) | 4 (13.3%) |
| 10:00 AM to 10:59 AM | 0 (0.0%) | 0 (0.0%) |
| 11:00 AM to 11:59 AM | 0 (0.0%) | 0 (0.0%) |
| 12:00 PM to 3:59 PM | 2 (5.4%) | 2 (6.7%) |
| 4:00 PM to 11:59 PM | 0 (0.0%) | 1 (3.3%) |
| Total | 37 (100.0%) | 30 (100.0%) |
Housing Occupancy in Hannasville
Occupancy by Ownership in Hannasville
Of the total 46 dwellings in Hannasville, owner-occupied units account for 42 (91.3%), while renter-occupied units make up 4 (8.7%).
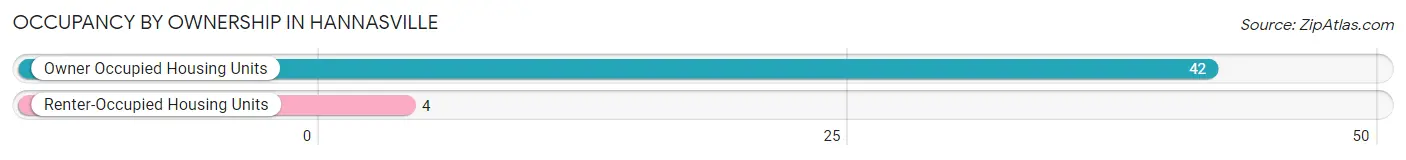
| Occupancy | # Housing Units | % Housing Units |
| Owner Occupied Housing Units | 42 | 91.3% |
| Renter-Occupied Housing Units | 4 | 8.7% |
| Total Occupied Housing Units | 46 | 100.0% |
Occupancy by Household Size in Hannasville
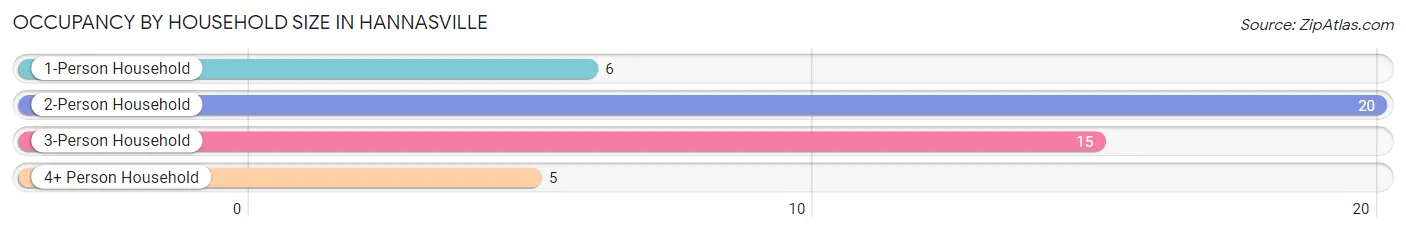
| Household Size | # Housing Units | % Housing Units |
| 1-Person Household | 6 | 13.0% |
| 2-Person Household | 20 | 43.5% |
| 3-Person Household | 15 | 32.6% |
| 4+ Person Household | 5 | 10.9% |
| Total Housing Units | 46 | 100.0% |
Occupancy by Ownership by Household Size in Hannasville
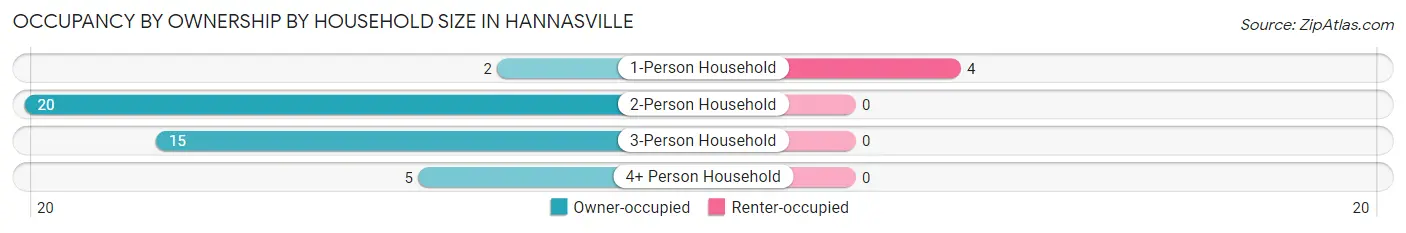
| Household Size | Owner-occupied | Renter-occupied |
| 1-Person Household | 2 (33.3%) | 4 (66.7%) |
| 2-Person Household | 20 (100.0%) | 0 (0.0%) |
| 3-Person Household | 15 (100.0%) | 0 (0.0%) |
| 4+ Person Household | 5 (100.0%) | 0 (0.0%) |
| Total Housing Units | 42 (91.3%) | 4 (8.7%) |
Occupancy by Educational Attainment in Hannasville
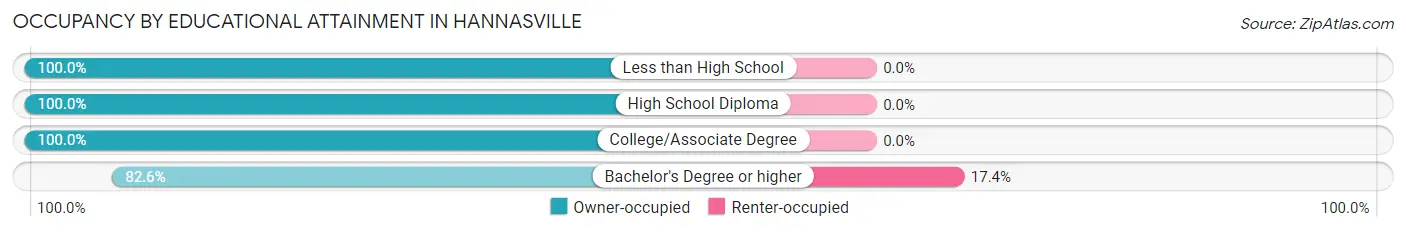
| Household Size | Owner-occupied | Renter-occupied |
| Less than High School | 2 (100.0%) | 0 (0.0%) |
| High School Diploma | 10 (100.0%) | 0 (0.0%) |
| College/Associate Degree | 11 (100.0%) | 0 (0.0%) |
| Bachelor's Degree or higher | 19 (82.6%) | 4 (17.4%) |
Occupancy by Age of Householder in Hannasville
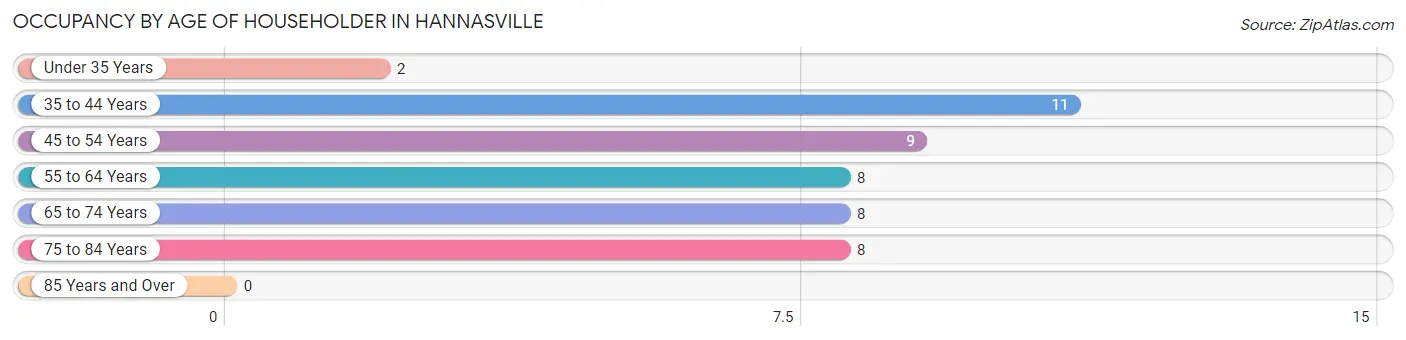
| Age Bracket | # Households | % Households |
| Under 35 Years | 2 | 4.3% |
| 35 to 44 Years | 11 | 23.9% |
| 45 to 54 Years | 9 | 19.6% |
| 55 to 64 Years | 8 | 17.4% |
| 65 to 74 Years | 8 | 17.4% |
| 75 to 84 Years | 8 | 17.4% |
| 85 Years and Over | 0 | 0.0% |
| Total | 46 | 100.0% |
Housing Finances in Hannasville
Median Income by Occupancy in Hannasville
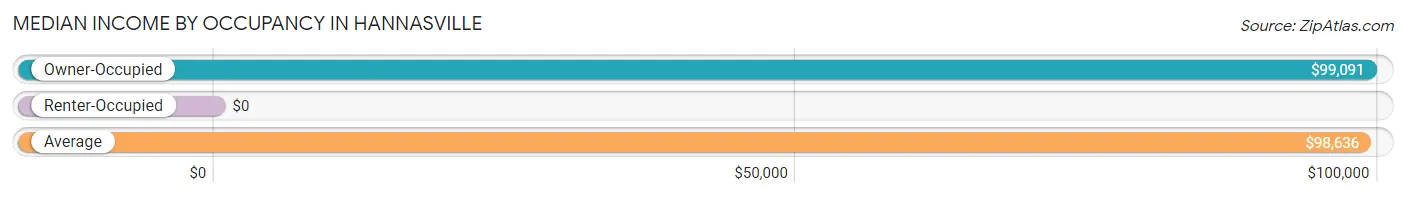
| Occupancy Type | # Households | Median Income |
| Owner-Occupied | 42 (91.3%) | $99,091 |
| Renter-Occupied | 4 (8.7%) | $0 |
| Average | 46 (100.0%) | $98,636 |
Occupancy by Householder Income Bracket in Hannasville
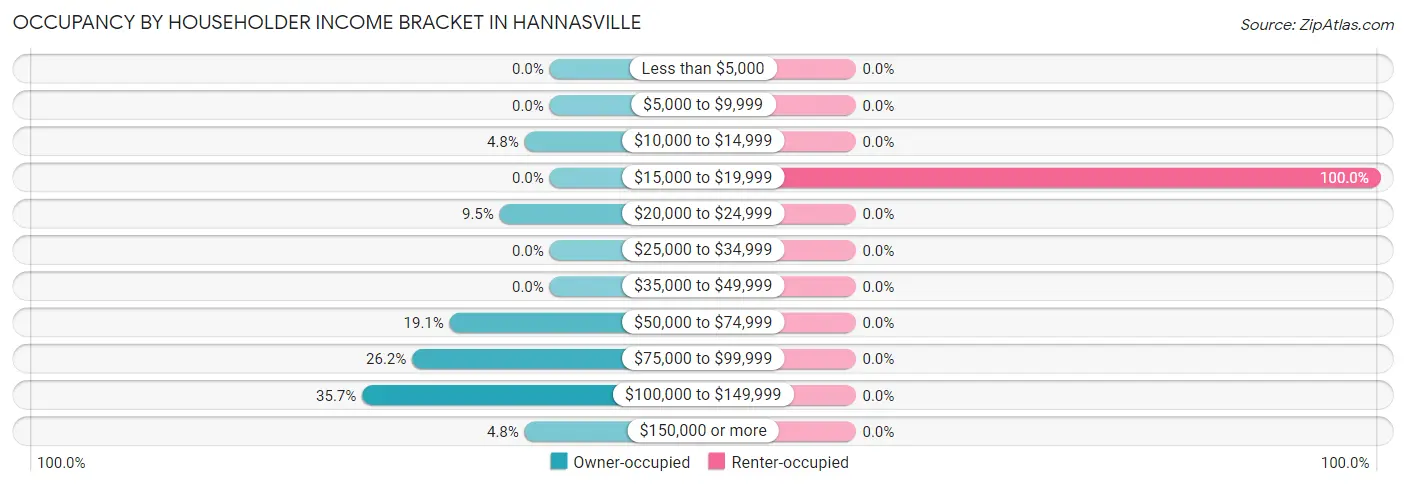
| Income Bracket | Owner-occupied | Renter-occupied |
| Less than $5,000 | 0 (0.0%) | 0 (0.0%) |
| $5,000 to $9,999 | 0 (0.0%) | 0 (0.0%) |
| $10,000 to $14,999 | 2 (4.8%) | 0 (0.0%) |
| $15,000 to $19,999 | 0 (0.0%) | 4 (100.0%) |
| $20,000 to $24,999 | 4 (9.5%) | 0 (0.0%) |
| $25,000 to $34,999 | 0 (0.0%) | 0 (0.0%) |
| $35,000 to $49,999 | 0 (0.0%) | 0 (0.0%) |
| $50,000 to $74,999 | 8 (19.1%) | 0 (0.0%) |
| $75,000 to $99,999 | 11 (26.2%) | 0 (0.0%) |
| $100,000 to $149,999 | 15 (35.7%) | 0 (0.0%) |
| $150,000 or more | 2 (4.8%) | 0 (0.0%) |
| Total | 42 (100.0%) | 4 (100.0%) |
Monthly Housing Cost Tiers in Hannasville
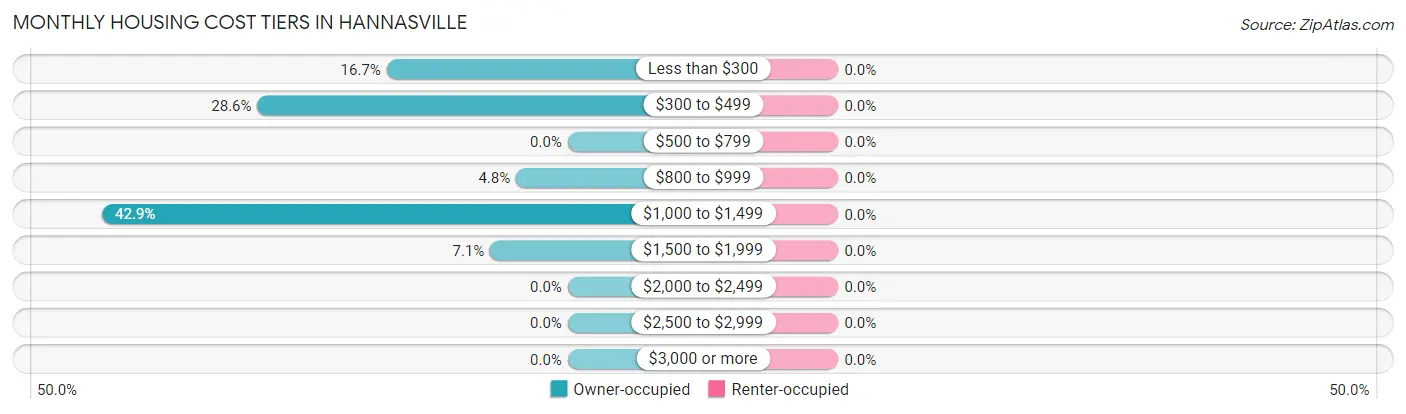
| Monthly Cost | Owner-occupied | Renter-occupied |
| Less than $300 | 7 (16.7%) | 0 (0.0%) |
| $300 to $499 | 12 (28.6%) | 0 (0.0%) |
| $500 to $799 | 0 (0.0%) | 0 (0.0%) |
| $800 to $999 | 2 (4.8%) | 0 (0.0%) |
| $1,000 to $1,499 | 18 (42.9%) | 0 (0.0%) |
| $1,500 to $1,999 | 3 (7.1%) | 0 (0.0%) |
| $2,000 to $2,499 | 0 (0.0%) | 0 (0.0%) |
| $2,500 to $2,999 | 0 (0.0%) | 0 (0.0%) |
| $3,000 or more | 0 (0.0%) | 0 (0.0%) |
| Total | 42 (100.0%) | 4 (100.0%) |
Physical Housing Characteristics in Hannasville
Housing Structures in Hannasville
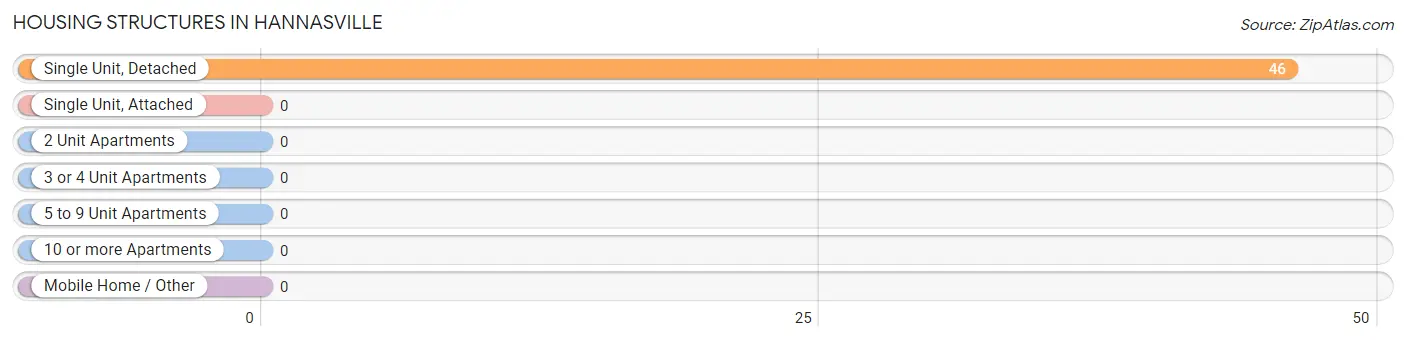
| Structure Type | # Housing Units | % Housing Units |
| Single Unit, Detached | 46 | 100.0% |
| Single Unit, Attached | 0 | 0.0% |
| 2 Unit Apartments | 0 | 0.0% |
| 3 or 4 Unit Apartments | 0 | 0.0% |
| 5 to 9 Unit Apartments | 0 | 0.0% |
| 10 or more Apartments | 0 | 0.0% |
| Mobile Home / Other | 0 | 0.0% |
| Total | 46 | 100.0% |
Housing Structures by Occupancy in Hannasville
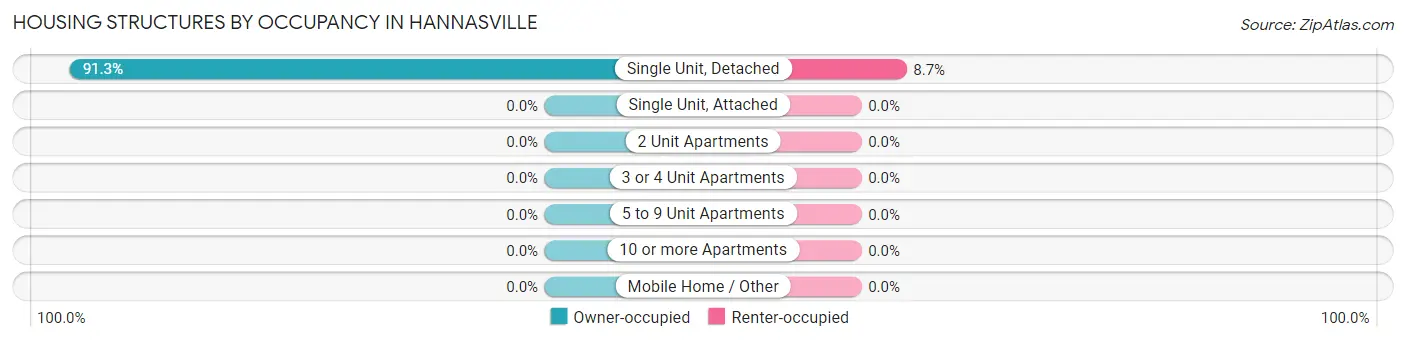
| Structure Type | Owner-occupied | Renter-occupied |
| Single Unit, Detached | 42 (91.3%) | 4 (8.7%) |
| Single Unit, Attached | 0 (0.0%) | 0 (0.0%) |
| 2 Unit Apartments | 0 (0.0%) | 0 (0.0%) |
| 3 or 4 Unit Apartments | 0 (0.0%) | 0 (0.0%) |
| 5 to 9 Unit Apartments | 0 (0.0%) | 0 (0.0%) |
| 10 or more Apartments | 0 (0.0%) | 0 (0.0%) |
| Mobile Home / Other | 0 (0.0%) | 0 (0.0%) |
| Total | 42 (91.3%) | 4 (8.7%) |
Housing Structures by Number of Rooms in Hannasville
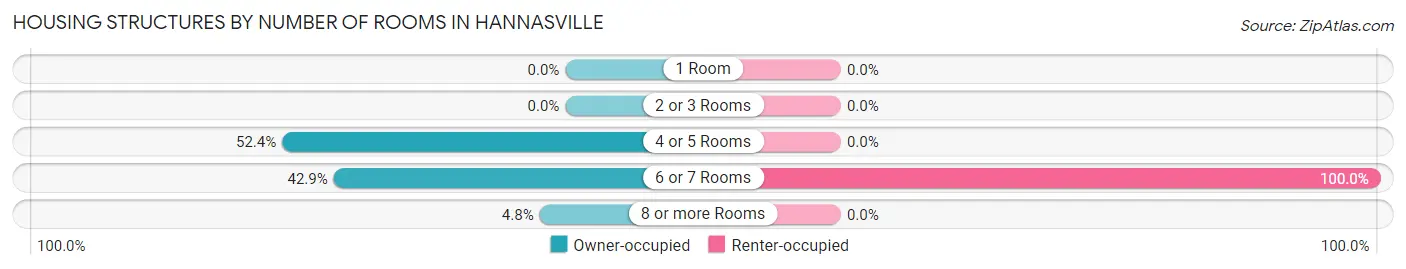
| Number of Rooms | Owner-occupied | Renter-occupied |
| 1 Room | 0 (0.0%) | 0 (0.0%) |
| 2 or 3 Rooms | 0 (0.0%) | 0 (0.0%) |
| 4 or 5 Rooms | 22 (52.4%) | 0 (0.0%) |
| 6 or 7 Rooms | 18 (42.9%) | 4 (100.0%) |
| 8 or more Rooms | 2 (4.8%) | 0 (0.0%) |
| Total | 42 (100.0%) | 4 (100.0%) |
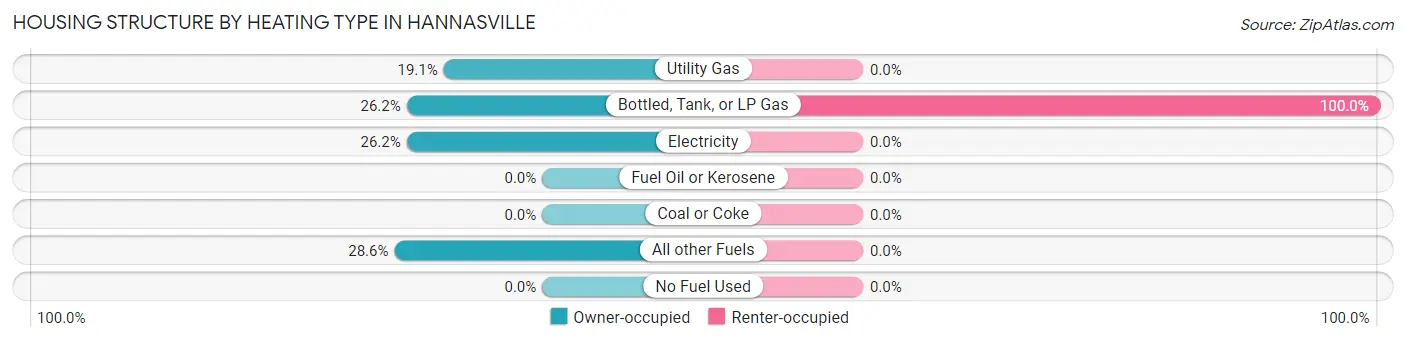
Housing Structure by Heating Type in Hannasville
| Heating Type | Owner-occupied | Renter-occupied |
| Utility Gas | 8 (19.1%) | 0 (0.0%) |
| Bottled, Tank, or LP Gas | 11 (26.2%) | 4 (100.0%) |
| Electricity | 11 (26.2%) | 0 (0.0%) |
| Fuel Oil or Kerosene | 0 (0.0%) | 0 (0.0%) |
| Coal or Coke | 0 (0.0%) | 0 (0.0%) |
| All other Fuels | 12 (28.6%) | 0 (0.0%) |
| No Fuel Used | 0 (0.0%) | 0 (0.0%) |
| Total | 42 (100.0%) | 4 (100.0%) |
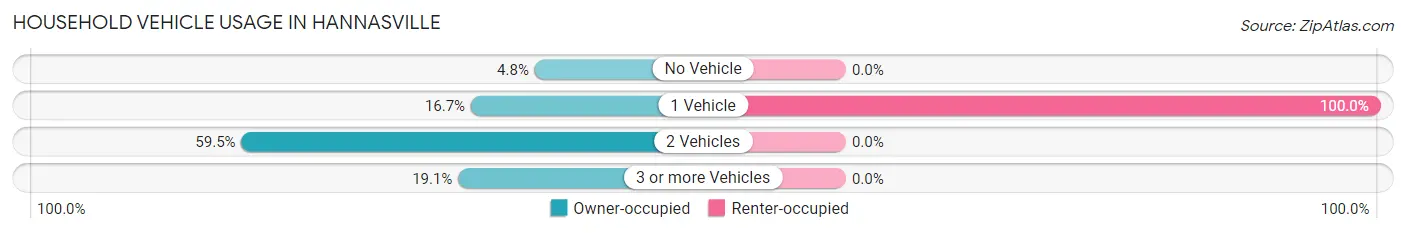
Household Vehicle Usage in Hannasville
| Vehicles per Household | Owner-occupied | Renter-occupied |
| No Vehicle | 2 (4.8%) | 0 (0.0%) |
| 1 Vehicle | 7 (16.7%) | 4 (100.0%) |
| 2 Vehicles | 25 (59.5%) | 0 (0.0%) |
| 3 or more Vehicles | 8 (19.1%) | 0 (0.0%) |
| Total | 42 (100.0%) | 4 (100.0%) |
Real Estate & Mortgages in Hannasville
Real Estate and Mortgage Overview in Hannasville
| Characteristic | Without Mortgage | With Mortgage |
| Housing Units | 21 | 21 |
| Median Property Value | $69,500 | $161,500 |
| Median Household Income | $56,875 | $2 |
| Monthly Housing Costs | $318 | $0 |
| Real Estate Taxes | $1,661 | $0 |
Property Value by Mortgage Status in Hannasville
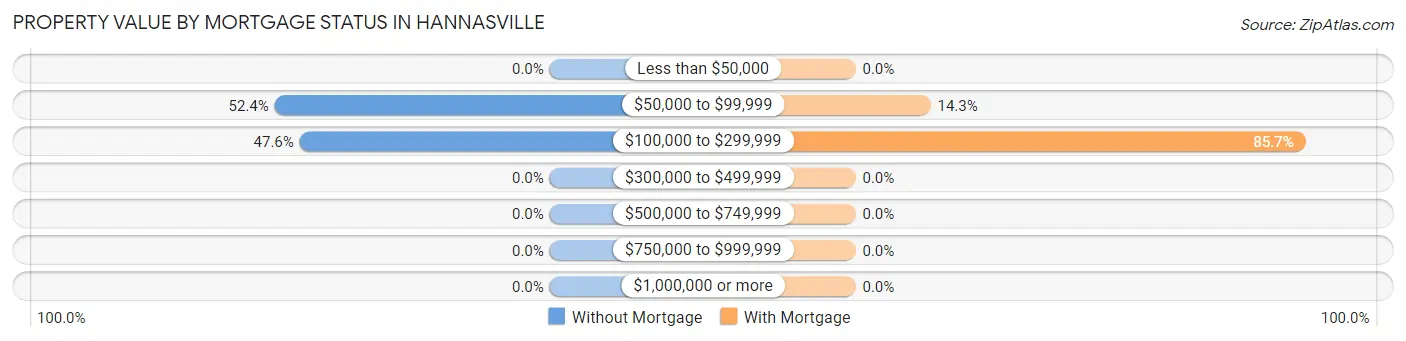
| Property Value | Without Mortgage | With Mortgage |
| Less than $50,000 | 0 (0.0%) | 0 (0.0%) |
| $50,000 to $99,999 | 11 (52.4%) | 3 (14.3%) |
| $100,000 to $299,999 | 10 (47.6%) | 18 (85.7%) |
| $300,000 to $499,999 | 0 (0.0%) | 0 (0.0%) |
| $500,000 to $749,999 | 0 (0.0%) | 0 (0.0%) |
| $750,000 to $999,999 | 0 (0.0%) | 0 (0.0%) |
| $1,000,000 or more | 0 (0.0%) | 0 (0.0%) |
| Total | 21 (100.0%) | 21 (100.0%) |
Household Income by Mortgage Status in Hannasville
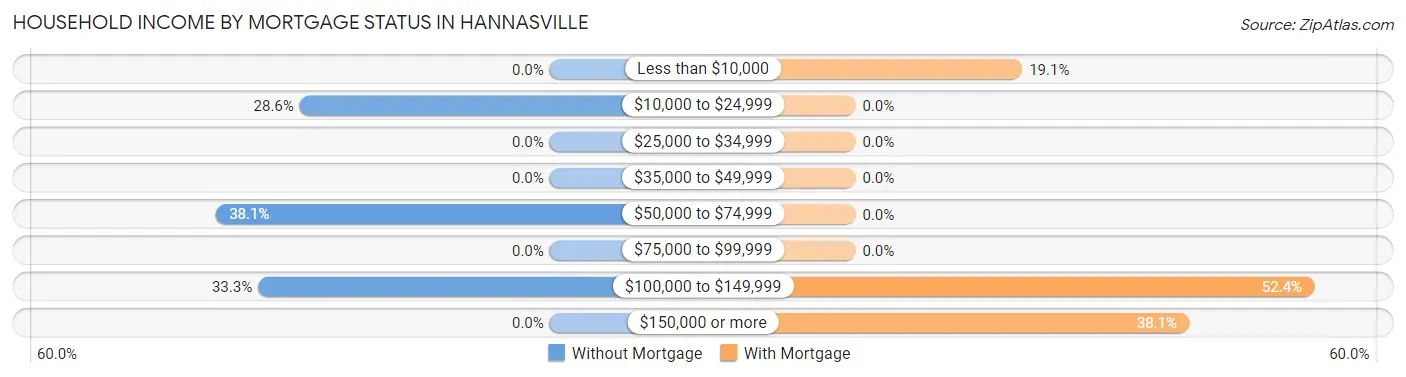
| Household Income | Without Mortgage | With Mortgage |
| Less than $10,000 | 0 (0.0%) | 4 (19.1%) |
| $10,000 to $24,999 | 6 (28.6%) | 0 (0.0%) |
| $25,000 to $34,999 | 0 (0.0%) | 0 (0.0%) |
| $35,000 to $49,999 | 0 (0.0%) | 0 (0.0%) |
| $50,000 to $74,999 | 8 (38.1%) | 0 (0.0%) |
| $75,000 to $99,999 | 0 (0.0%) | 0 (0.0%) |
| $100,000 to $149,999 | 7 (33.3%) | 11 (52.4%) |
| $150,000 or more | 0 (0.0%) | 8 (38.1%) |
| Total | 21 (100.0%) | 21 (100.0%) |
Property Value to Household Income Ratio in Hannasville
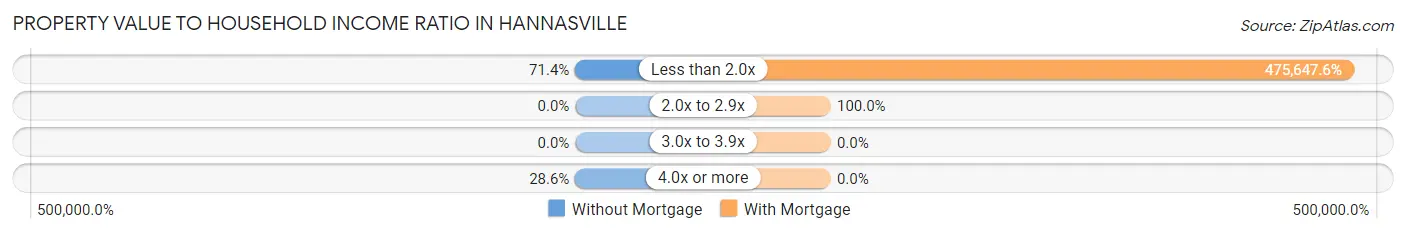
| Value-to-Income Ratio | Without Mortgage | With Mortgage |
| Less than 2.0x | 15 (71.4%) | 99,886 (475,647.6%) |
| 2.0x to 2.9x | 0 (0.0%) | 21 (100.0%) |
| 3.0x to 3.9x | 0 (0.0%) | 0 (0.0%) |
| 4.0x or more | 6 (28.6%) | 0 (0.0%) |
| Total | 21 (100.0%) | 21 (100.0%) |
Real Estate Taxes by Mortgage Status in Hannasville
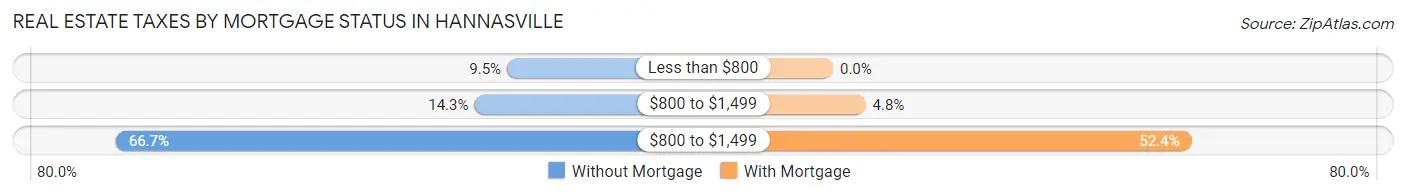
| Property Taxes | Without Mortgage | With Mortgage |
| Less than $800 | 2 (9.5%) | 0 (0.0%) |
| $800 to $1,499 | 3 (14.3%) | 1 (4.8%) |
| $800 to $1,499 | 14 (66.7%) | 11 (52.4%) |
| Total | 21 (100.0%) | 21 (100.0%) |
Health & Disability in Hannasville
Health Insurance Coverage by Age in Hannasville
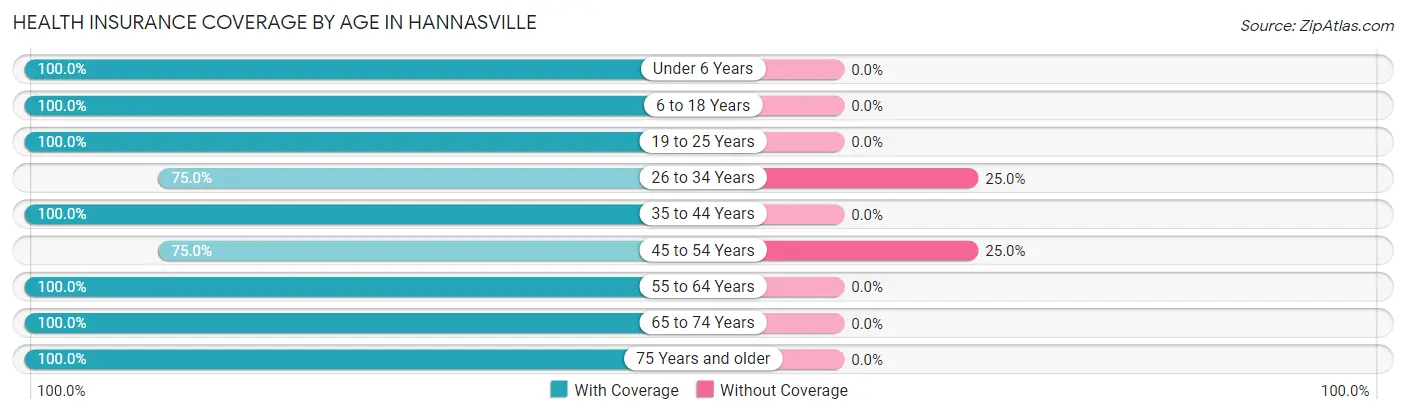
| Age Bracket | With Coverage | Without Coverage |
| Under 6 Years | 3 (100.0%) | 0 (0.0%) |
| 6 to 18 Years | 12 (100.0%) | 0 (0.0%) |
| 19 to 25 Years | 4 (100.0%) | 0 (0.0%) |
| 26 to 34 Years | 6 (75.0%) | 2 (25.0%) |
| 35 to 44 Years | 30 (100.0%) | 0 (0.0%) |
| 45 to 54 Years | 12 (75.0%) | 4 (25.0%) |
| 55 to 64 Years | 13 (100.0%) | 0 (0.0%) |
| 65 to 74 Years | 8 (100.0%) | 0 (0.0%) |
| 75 Years and older | 19 (100.0%) | 0 (0.0%) |
| Total | 107 (94.7%) | 6 (5.3%) |
Health Insurance Coverage by Citizenship Status in Hannasville

| Citizenship Status | With Coverage | Without Coverage |
| Native Born | 3 (100.0%) | 0 (0.0%) |
| Foreign Born, Citizen | 12 (100.0%) | 0 (0.0%) |
| Foreign Born, not a Citizen | 4 (100.0%) | 0 (0.0%) |
Health Insurance Coverage by Household Income in Hannasville
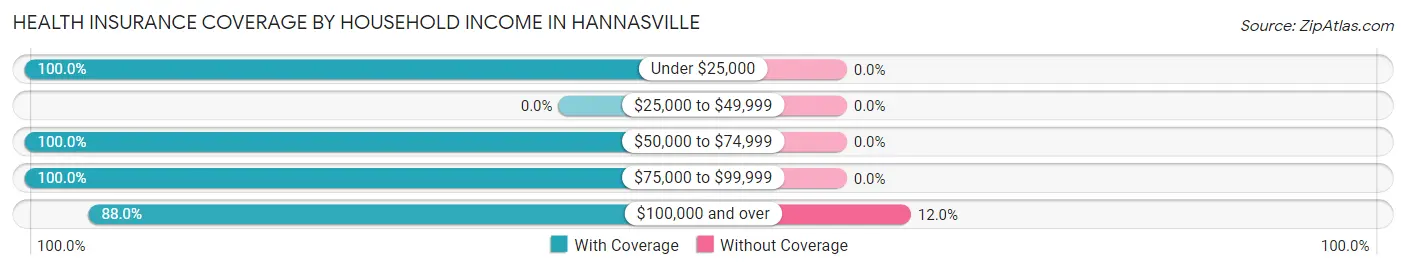
| Household Income | With Coverage | Without Coverage |
| Under $25,000 | 13 (100.0%) | 0 (0.0%) |
| $25,000 to $49,999 | 0 (0.0%) | 0 (0.0%) |
| $50,000 to $74,999 | 17 (100.0%) | 0 (0.0%) |
| $75,000 to $99,999 | 33 (100.0%) | 0 (0.0%) |
| $100,000 and over | 44 (88.0%) | 6 (12.0%) |
Public vs Private Health Insurance Coverage by Age in Hannasville
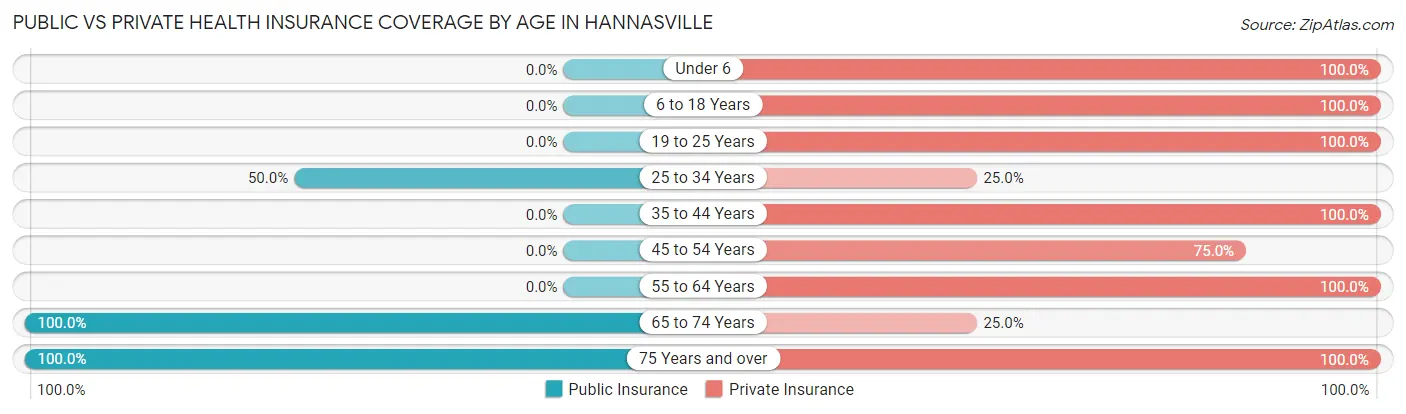
| Age Bracket | Public Insurance | Private Insurance |
| Under 6 | 0 (0.0%) | 3 (100.0%) |
| 6 to 18 Years | 0 (0.0%) | 12 (100.0%) |
| 19 to 25 Years | 0 (0.0%) | 4 (100.0%) |
| 25 to 34 Years | 4 (50.0%) | 2 (25.0%) |
| 35 to 44 Years | 0 (0.0%) | 30 (100.0%) |
| 45 to 54 Years | 0 (0.0%) | 12 (75.0%) |
| 55 to 64 Years | 0 (0.0%) | 13 (100.0%) |
| 65 to 74 Years | 8 (100.0%) | 2 (25.0%) |
| 75 Years and over | 19 (100.0%) | 19 (100.0%) |
| Total | 31 (27.4%) | 97 (85.8%) |
Disability Status by Sex by Age in Hannasville
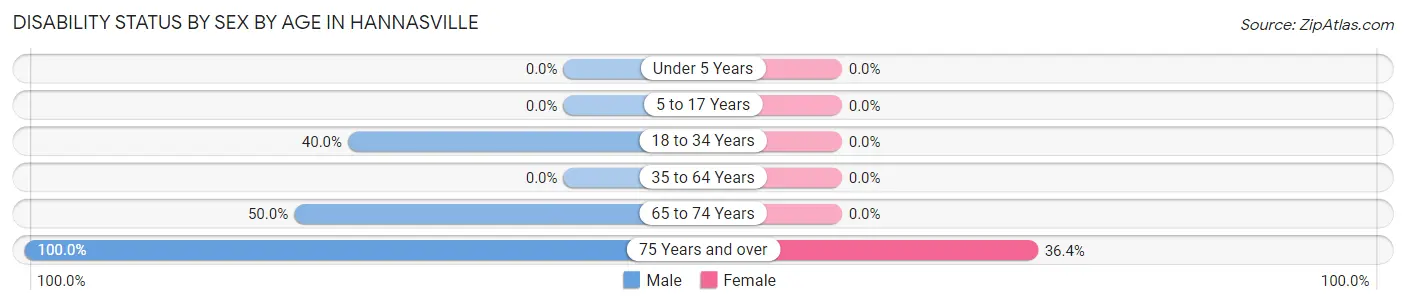
| Age Bracket | Male | Female |
| Under 5 Years | 0 (0.0%) | 0 (0.0%) |
| 5 to 17 Years | 0 (0.0%) | 0 (0.0%) |
| 18 to 34 Years | 4 (40.0%) | 0 (0.0%) |
| 35 to 64 Years | 0 (0.0%) | 0 (0.0%) |
| 65 to 74 Years | 4 (50.0%) | 0 (0.0%) |
| 75 Years and over | 8 (100.0%) | 4 (36.4%) |
Disability Class by Sex by Age in Hannasville
Disability Class: Hearing Difficulty
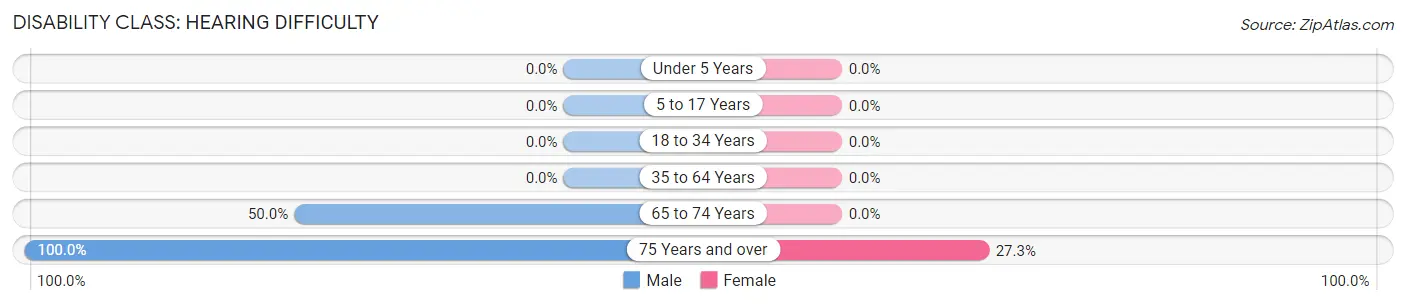
| Age Bracket | Male | Female |
| Under 5 Years | 0 (0.0%) | 0 (0.0%) |
| 5 to 17 Years | 0 (0.0%) | 0 (0.0%) |
| 18 to 34 Years | 0 (0.0%) | 0 (0.0%) |
| 35 to 64 Years | 0 (0.0%) | 0 (0.0%) |
| 65 to 74 Years | 4 (50.0%) | 0 (0.0%) |
| 75 Years and over | 8 (100.0%) | 3 (27.3%) |
Disability Class: Vision Difficulty
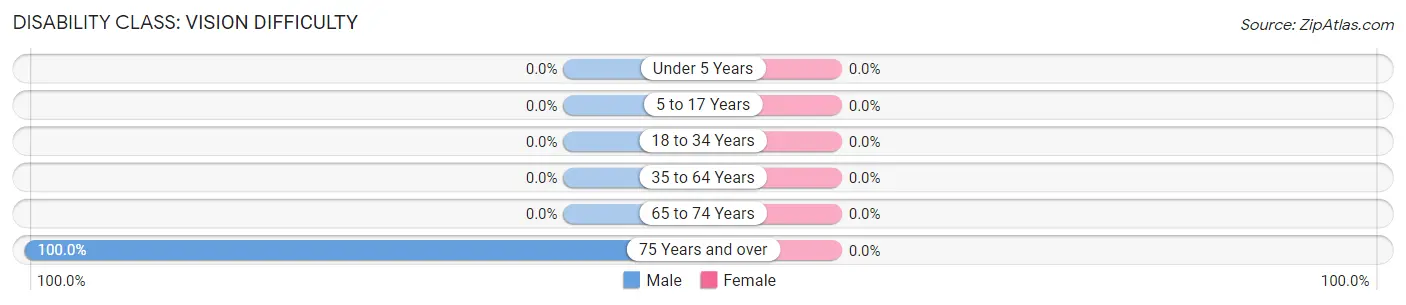
| Age Bracket | Male | Female |
| Under 5 Years | 0 (0.0%) | 0 (0.0%) |
| 5 to 17 Years | 0 (0.0%) | 0 (0.0%) |
| 18 to 34 Years | 0 (0.0%) | 0 (0.0%) |
| 35 to 64 Years | 0 (0.0%) | 0 (0.0%) |
| 65 to 74 Years | 0 (0.0%) | 0 (0.0%) |
| 75 Years and over | 8 (100.0%) | 0 (0.0%) |
Disability Class: Cognitive Difficulty
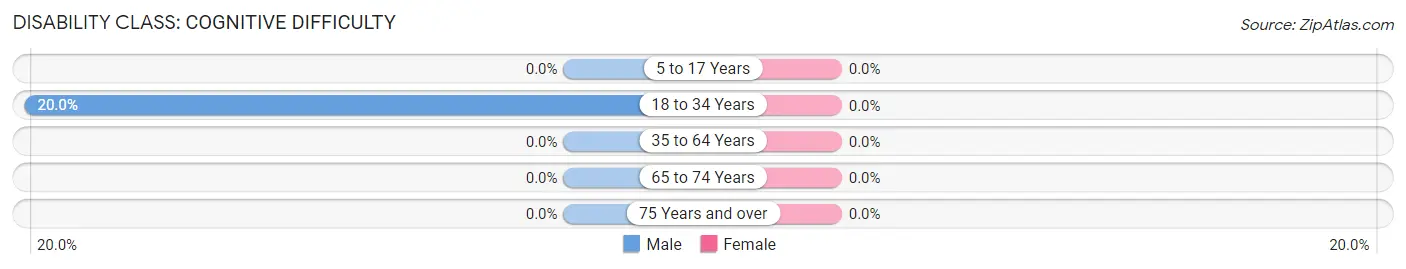
| Age Bracket | Male | Female |
| 5 to 17 Years | 0 (0.0%) | 0 (0.0%) |
| 18 to 34 Years | 2 (20.0%) | 0 (0.0%) |
| 35 to 64 Years | 0 (0.0%) | 0 (0.0%) |
| 65 to 74 Years | 0 (0.0%) | 0 (0.0%) |
| 75 Years and over | 0 (0.0%) | 0 (0.0%) |
Disability Class: Ambulatory Difficulty
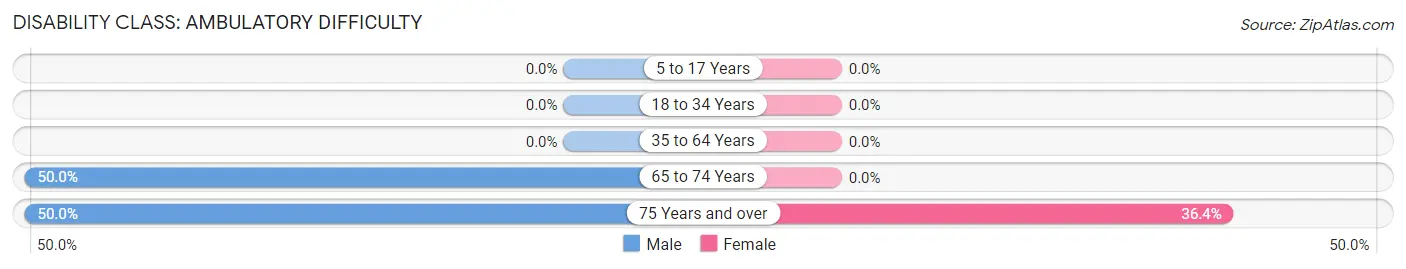
| Age Bracket | Male | Female |
| 5 to 17 Years | 0 (0.0%) | 0 (0.0%) |
| 18 to 34 Years | 0 (0.0%) | 0 (0.0%) |
| 35 to 64 Years | 0 (0.0%) | 0 (0.0%) |
| 65 to 74 Years | 4 (50.0%) | 0 (0.0%) |
| 75 Years and over | 4 (50.0%) | 4 (36.4%) |
Disability Class: Self-Care Difficulty
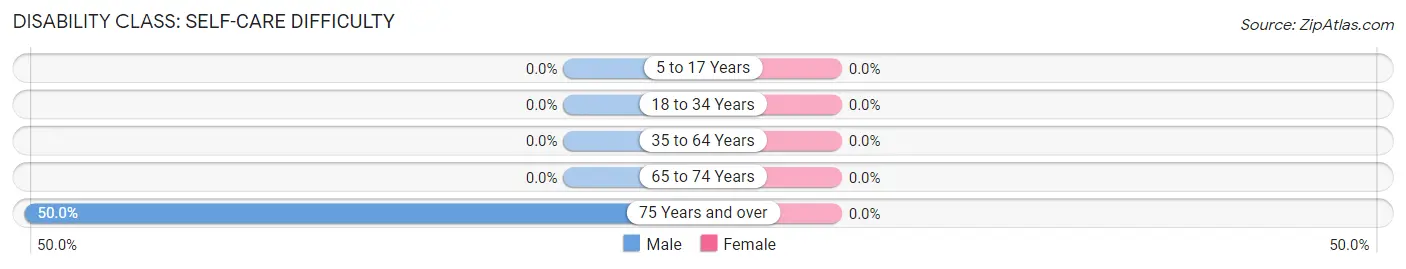
| Age Bracket | Male | Female |
| 5 to 17 Years | 0 (0.0%) | 0 (0.0%) |
| 18 to 34 Years | 0 (0.0%) | 0 (0.0%) |
| 35 to 64 Years | 0 (0.0%) | 0 (0.0%) |
| 65 to 74 Years | 0 (0.0%) | 0 (0.0%) |
| 75 Years and over | 4 (50.0%) | 0 (0.0%) |
Technology Access in Hannasville
Computing Device Access in Hannasville
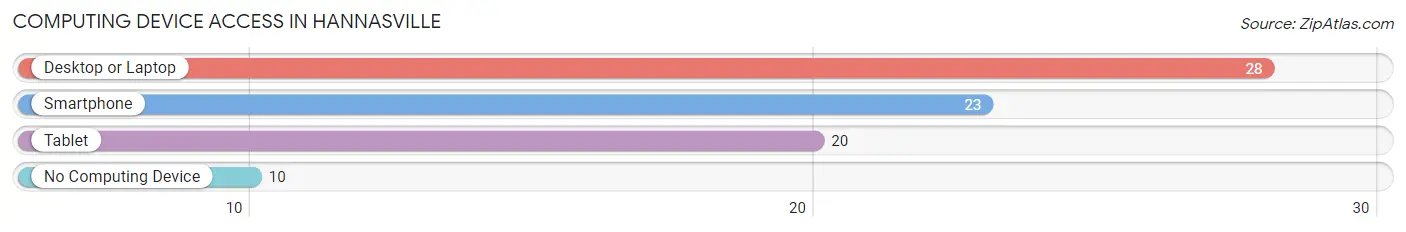
| Device Type | # Households | % Households |
| Desktop or Laptop | 28 | 60.9% |
| Smartphone | 23 | 50.0% |
| Tablet | 20 | 43.5% |
| No Computing Device | 10 | 21.7% |
| Total | 46 | 100.0% |
Internet Access in Hannasville
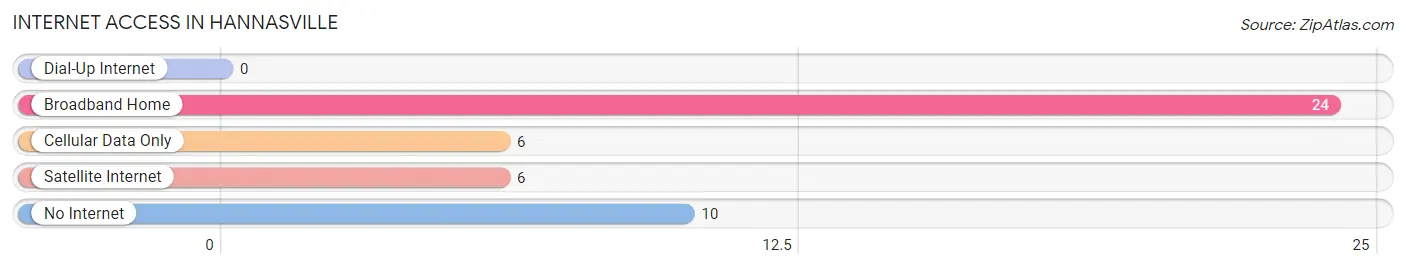
| Internet Type | # Households | % Households |
| Dial-Up Internet | 0 | 0.0% |
| Broadband Home | 24 | 52.2% |
| Cellular Data Only | 6 | 13.0% |
| Satellite Internet | 6 | 13.0% |
| No Internet | 10 | 21.7% |
| Total | 46 | 100.0% |
Hannasville Summary
Hannasville is a small borough located in the state of Pennsylvania, United States. It is situated in the northern part of the state, in the county of Northampton. The borough is located in the Lehigh Valley region of Pennsylvania, and is part of the Allentown-Bethlehem-Easton metropolitan area. As of the 2010 census, the population of Hannasville was 2,845.
Geography
Hannasville is located at 40°41'17" North, 75°20'45" West (40.6879, -75.3458). It is situated in the northern part of the state, in the county of Northampton. The borough is located in the Lehigh Valley region of Pennsylvania, and is part of the Allentown-Bethlehem-Easton metropolitan area.
The total area of Hannasville is 0.9 square miles, all of which is land. The borough is bordered by the boroughs of Easton and Wilson, and by the townships of Palmer and Forks. The Lehigh River flows through the borough, and there are several small creeks and streams in the area.
History
Hannasville was founded in 1790 by John Hanna, a Revolutionary War veteran. The borough was originally known as Hanna's Town, and was later renamed Hannasville. The borough was incorporated in 1845.
Hannasville was an important stop on the Lehigh Valley Railroad, which ran through the borough from 1855 to 1976. The railroad was a major factor in the growth of the borough, and it was also an important factor in the development of the local economy.
Economy
Hannasville has a diverse economy, with a variety of businesses and industries. The borough is home to several manufacturing companies, including a paper mill, a printing company, and a plastics manufacturer. There are also several retail stores in the borough, including a grocery store, a hardware store, and a pharmacy.
The borough is also home to several restaurants, including a pizza shop, a Chinese restaurant, and a Mexican restaurant. There are also several bars and pubs in the borough.
Demographics
As of the 2010 census, the population of Hannasville was 2,845. The racial makeup of the borough was 94.3% White, 1.7% African American, 0.3% Native American, 1.2% Asian, 0.1% Pacific Islander, 0.9% from other races, and 1.5% from two or more races. Hispanic or Latino of any race were 3.2% of the population.
The median household income in Hannasville was $45,938, and the median family income was $54,844. The per capita income for the borough was $21,945. About 8.3% of families and 10.2% of the population were below the poverty line, including 14.2% of those under age 18 and 6.2% of those age 65 or over.
Common Questions
What is Per Capita Income in Hannasville?
Per Capita income in Hannasville is $34,558.
What is the Median Family Income in Hannasville?
Median Family Income in Hannasville is $99,318.
What is the Median Household income in Hannasville?
Median Household Income in Hannasville is $98,636.
What is Income or Wage Gap in Hannasville?
Income or Wage Gap in Hannasville is 32.4%.
Women in Hannasville earn 67.6 cents for every dollar earned by a man.
What is Inequality or Gini Index in Hannasville?
Inequality or Gini Index in Hannasville is 0.30.
What is the Total Population of Hannasville?
Total Population of Hannasville is 113.
What is the Total Male Population of Hannasville?
Total Male Population of Hannasville is 57.
What is the Total Female Population of Hannasville?
Total Female Population of Hannasville is 56.
What is the Ratio of Males per 100 Females in Hannasville?
There are 101.79 Males per 100 Females in Hannasville.
What is the Ratio of Females per 100 Males in Hannasville?
There are 98.25 Females per 100 Males in Hannasville.
What is the Median Population Age in Hannasville?
Median Population Age in Hannasville is 42.0 Years.
What is the Average Family Size in Hannasville
Average Family Size in Hannasville is 2.6 People.
What is the Average Household Size in Hannasville
Average Household Size in Hannasville is 2.5 People.
How Large is the Labor Force in Hannasville?
There are 67 People in the Labor Forcein in Hannasville.
What is the Percentage of People in the Labor Force in Hannasville?
68.4% of People are in the Labor Force in Hannasville.