Hummels Wharf, PA Map & Demographics
Hummels Wharf Map
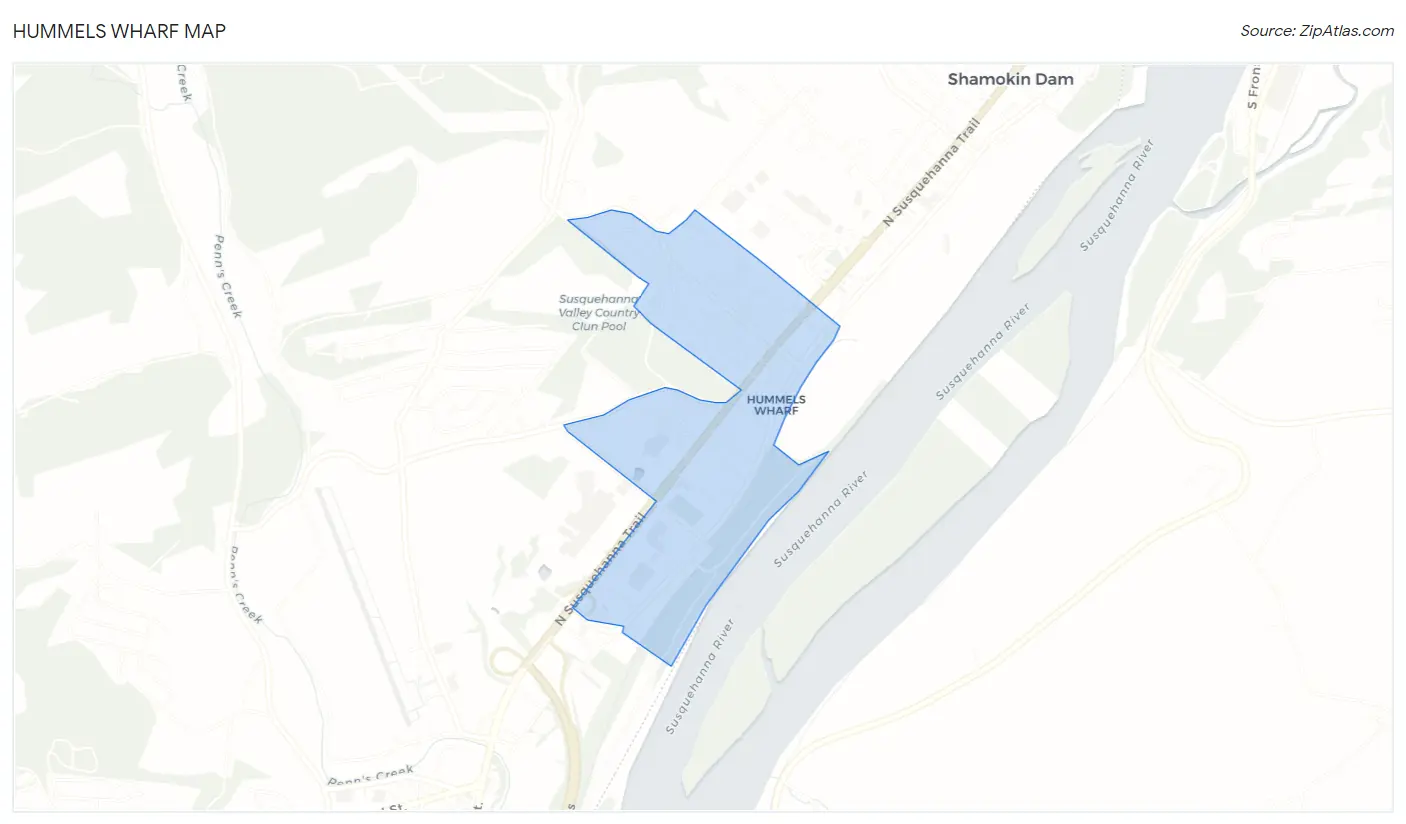
Hummels Wharf Overview
$44,700
PER CAPITA INCOME
$68,920
AVG FAMILY INCOME
$63,953
AVG HOUSEHOLD INCOME
15.4%
WAGE / INCOME GAP [ % ]
84.6¢/ $1
WAGE / INCOME GAP [ $ ]
0.37
INEQUALITY / GINI INDEX
654
TOTAL POPULATION
344
MALE POPULATION
310
FEMALE POPULATION
110.97
MALES / 100 FEMALES
90.12
FEMALES / 100 MALES
62.6
MEDIAN AGE
2.2
AVG FAMILY SIZE
1.8
AVG HOUSEHOLD SIZE
353
LABOR FORCE [ PEOPLE ]
56.4%
PERCENT IN LABOR FORCE
Hummels Wharf Area Codes
Income in Hummels Wharf
Income Overview in Hummels Wharf
Per Capita Income in Hummels Wharf is $44,700, while median incomes of families and households are $68,920 and $63,953 respectively.
| Characteristic | Number | Measure |
| Per Capita Income | 654 | $44,700 |
| Median Family Income | 231 | $68,920 |
| Mean Family Income | 231 | $95,912 |
| Median Household Income | 373 | $63,953 |
| Mean Household Income | 373 | $74,542 |
| Income Deficit | 231 | $0 |
| Wage / Income Gap (%) | 654 | 15.44% |
| Wage / Income Gap ($) | 654 | 84.56¢ per $1 |
| Gini / Inequality Index | 654 | 0.37 |
Earnings by Sex in Hummels Wharf
Average Earnings in Hummels Wharf are $55,236, $56,845 for men and $48,068 for women, a difference of 15.4%.
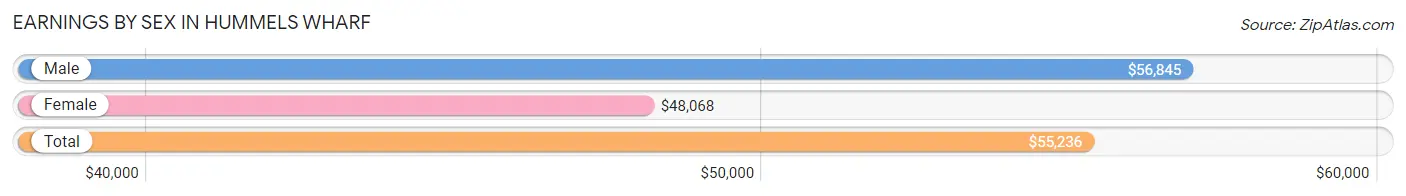
| Sex | Number | Average Earnings |
| Male | 197 (54.4%) | $56,845 |
| Female | 165 (45.6%) | $48,068 |
| Total | 362 (100.0%) | $55,236 |
Earnings by Sex by Income Bracket in Hummels Wharf
The most common earnings brackets in Hummels Wharf are $55,000 to $64,999 for men (57 | 28.9%) and $55,000 to $64,999 for women (53 | 32.1%).
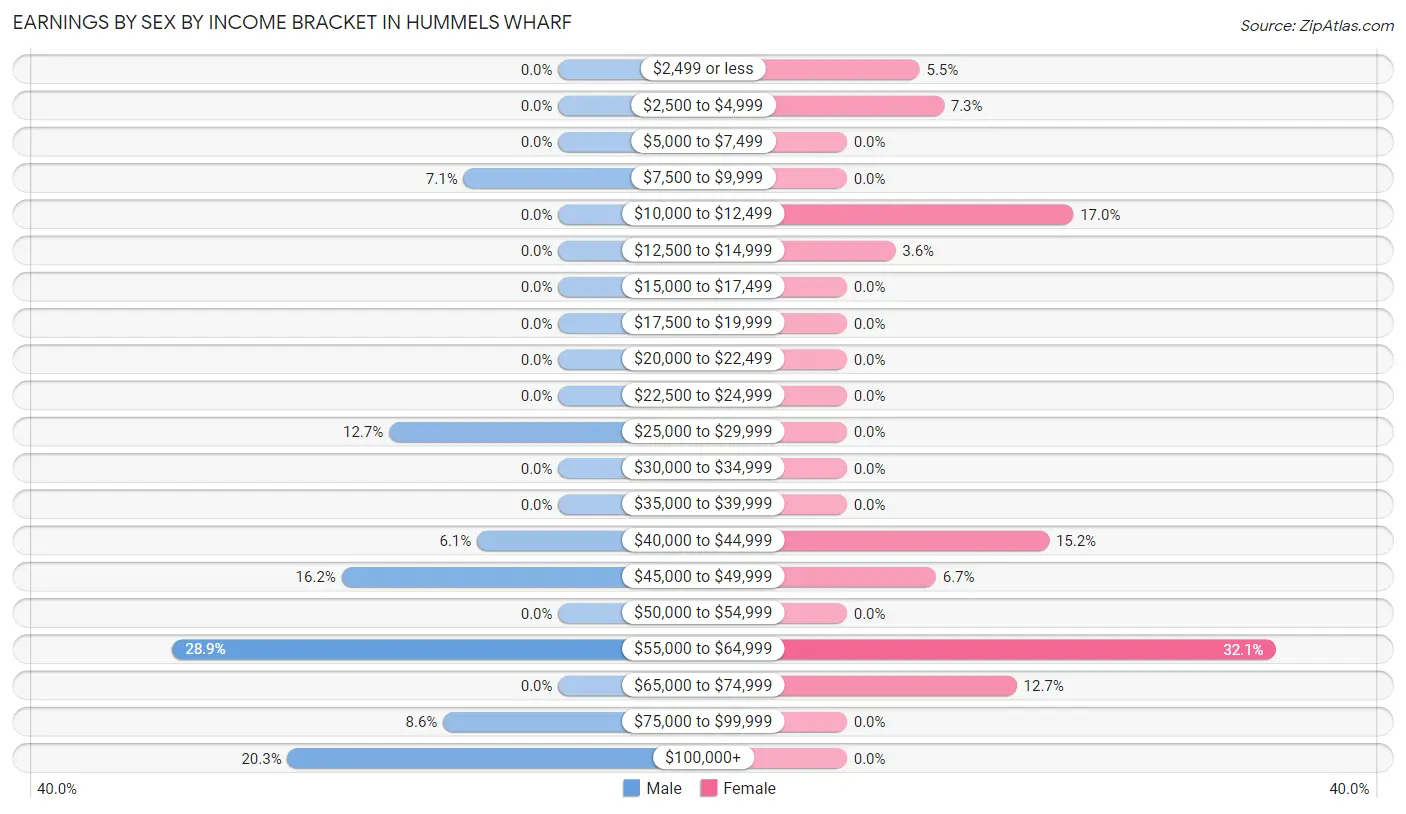
| Income | Male | Female |
| $2,499 or less | 0 (0.0%) | 9 (5.4%) |
| $2,500 to $4,999 | 0 (0.0%) | 12 (7.3%) |
| $5,000 to $7,499 | 0 (0.0%) | 0 (0.0%) |
| $7,500 to $9,999 | 14 (7.1%) | 0 (0.0%) |
| $10,000 to $12,499 | 0 (0.0%) | 28 (17.0%) |
| $12,500 to $14,999 | 0 (0.0%) | 6 (3.6%) |
| $15,000 to $17,499 | 0 (0.0%) | 0 (0.0%) |
| $17,500 to $19,999 | 0 (0.0%) | 0 (0.0%) |
| $20,000 to $22,499 | 0 (0.0%) | 0 (0.0%) |
| $22,500 to $24,999 | 0 (0.0%) | 0 (0.0%) |
| $25,000 to $29,999 | 25 (12.7%) | 0 (0.0%) |
| $30,000 to $34,999 | 0 (0.0%) | 0 (0.0%) |
| $35,000 to $39,999 | 0 (0.0%) | 0 (0.0%) |
| $40,000 to $44,999 | 12 (6.1%) | 25 (15.1%) |
| $45,000 to $49,999 | 32 (16.2%) | 11 (6.7%) |
| $50,000 to $54,999 | 0 (0.0%) | 0 (0.0%) |
| $55,000 to $64,999 | 57 (28.9%) | 53 (32.1%) |
| $65,000 to $74,999 | 0 (0.0%) | 21 (12.7%) |
| $75,000 to $99,999 | 17 (8.6%) | 0 (0.0%) |
| $100,000+ | 40 (20.3%) | 0 (0.0%) |
| Total | 197 (100.0%) | 165 (100.0%) |
Earnings by Sex by Educational Attainment in Hummels Wharf
Average earnings in Hummels Wharf are $57,969 for men and $49,091 for women, a difference of 15.3%. Men with an educational attainment of bachelor's degree enjoy the highest average annual earnings of $60,438, while those with high school diploma education earn the least with $59,453. Women with an educational attainment of high school diploma earn the most with the average annual earnings of $56,061, while those with high school diploma education have the smallest earnings of $56,061.
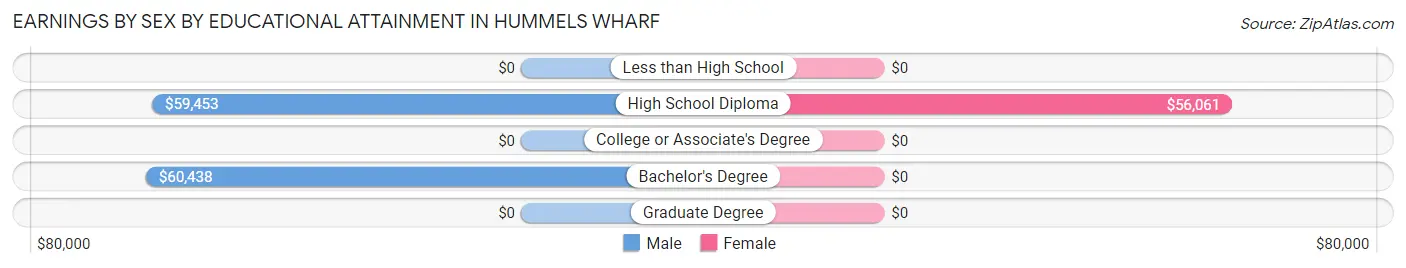
| Educational Attainment | Male Income | Female Income |
| Less than High School | - | - |
| High School Diploma | $59,453 | $56,061 |
| College or Associate's Degree | - | - |
| Bachelor's Degree | $60,438 | $0 |
| Graduate Degree | - | - |
| Total | $57,969 | $49,091 |
Family Income in Hummels Wharf
Family Income Brackets in Hummels Wharf
According to the Hummels Wharf family income data, there are 99 families falling into the $50,000 to $74,999 income range, which is the most common income bracket and makes up 42.9% of all families.
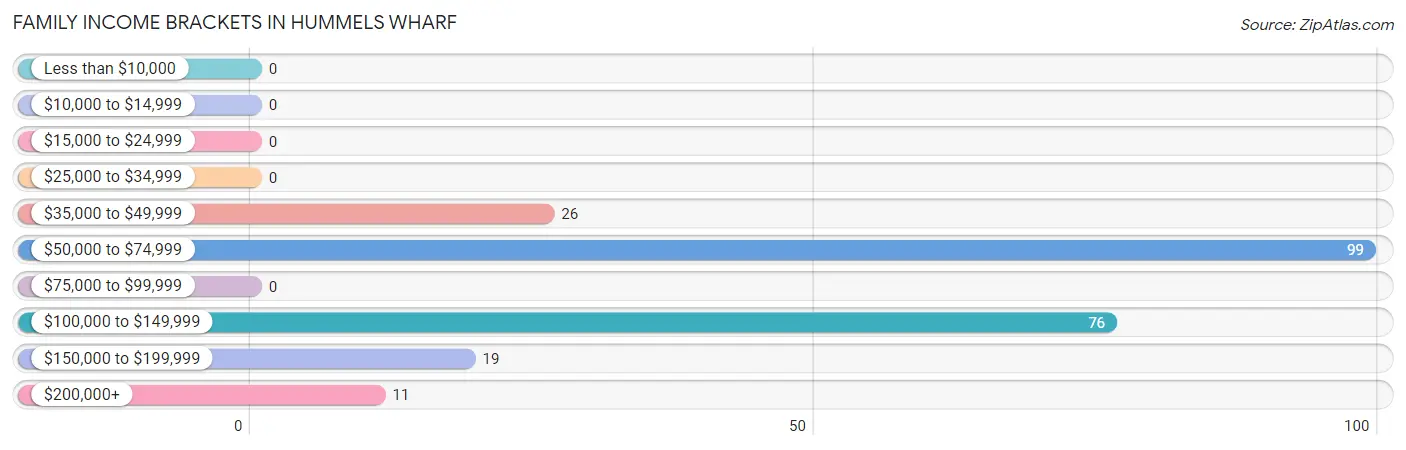
| Income Bracket | # Families | % Families |
| Less than $10,000 | 0 | 0.0% |
| $10,000 to $14,999 | 0 | 0.0% |
| $15,000 to $24,999 | 0 | 0.0% |
| $25,000 to $34,999 | 0 | 0.0% |
| $35,000 to $49,999 | 26 | 11.3% |
| $50,000 to $74,999 | 99 | 42.9% |
| $75,000 to $99,999 | 0 | 0.0% |
| $100,000 to $149,999 | 76 | 32.9% |
| $150,000 to $199,999 | 19 | 8.2% |
| $200,000+ | 11 | 4.8% |
Family Income by Famaliy Size in Hummels Wharf
2-person families (217 | 93.9%) account for the highest median family income in Hummels Wharf with $68,125 per family, while 2-person families (217 | 93.9%) have the highest median income of $34,062 per family member.
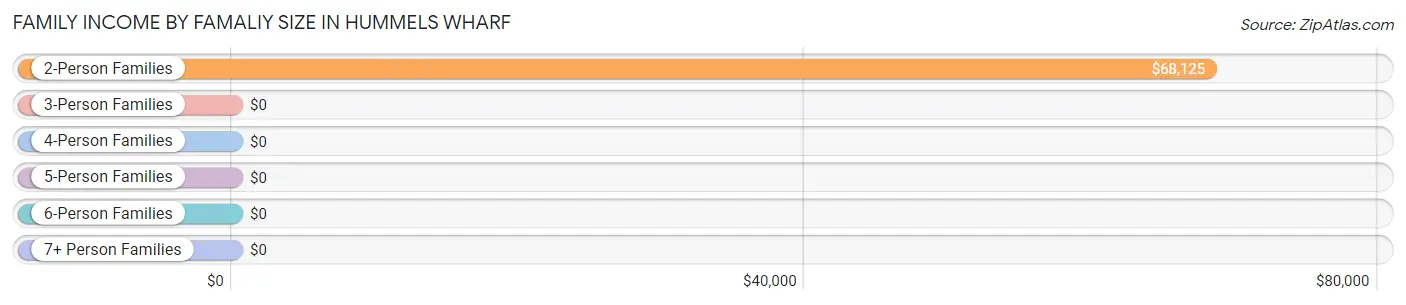
| Income Bracket | # Families | Median Income |
| 2-Person Families | 217 (93.9%) | $68,125 |
| 3-Person Families | 14 (6.1%) | $0 |
| 4-Person Families | 0 (0.0%) | $0 |
| 5-Person Families | 0 (0.0%) | $0 |
| 6-Person Families | 0 (0.0%) | $0 |
| 7+ Person Families | 0 (0.0%) | $0 |
| Total | 231 (100.0%) | $68,920 |
Family Income by Number of Earners in Hummels Wharf
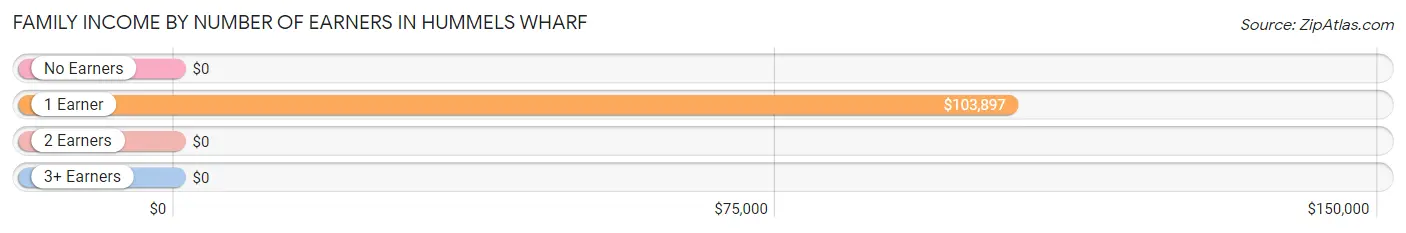
| Number of Earners | # Families | Median Income |
| No Earners | 51 (22.1%) | $0 |
| 1 Earner | 68 (29.4%) | $103,897 |
| 2 Earners | 112 (48.5%) | $0 |
| 3+ Earners | 0 (0.0%) | $0 |
| Total | 231 (100.0%) | $68,920 |
Household Income in Hummels Wharf
Household Income Brackets in Hummels Wharf
With 120 households falling in the category, the $50,000 to $74,999 income range is the most frequent in Hummels Wharf, accounting for 32.2% of all households. In contrast, only 8 households (2.1%) fall into the $75,000 to $99,999 income bracket, making it the least populous group.
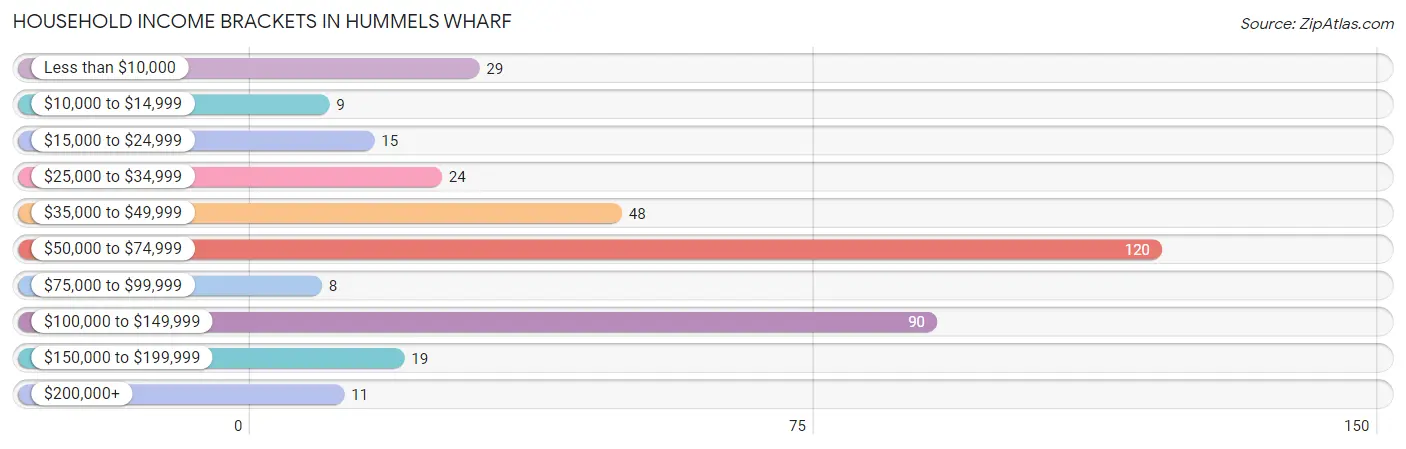
| Income Bracket | # Households | % Households |
| Less than $10,000 | 29 | 7.8% |
| $10,000 to $14,999 | 9 | 2.4% |
| $15,000 to $24,999 | 15 | 4.0% |
| $25,000 to $34,999 | 24 | 6.4% |
| $35,000 to $49,999 | 48 | 12.9% |
| $50,000 to $74,999 | 120 | 32.2% |
| $75,000 to $99,999 | 8 | 2.1% |
| $100,000 to $149,999 | 90 | 24.1% |
| $150,000 to $199,999 | 19 | 5.1% |
| $200,000+ | 11 | 2.9% |
Household Income by Householder Age in Hummels Wharf
The median household income in Hummels Wharf is $63,953, with the highest median household income of $72,857 found in the 45 to 64 years age bracket for the primary householder. A total of 116 households (31.1%) fall into this category.
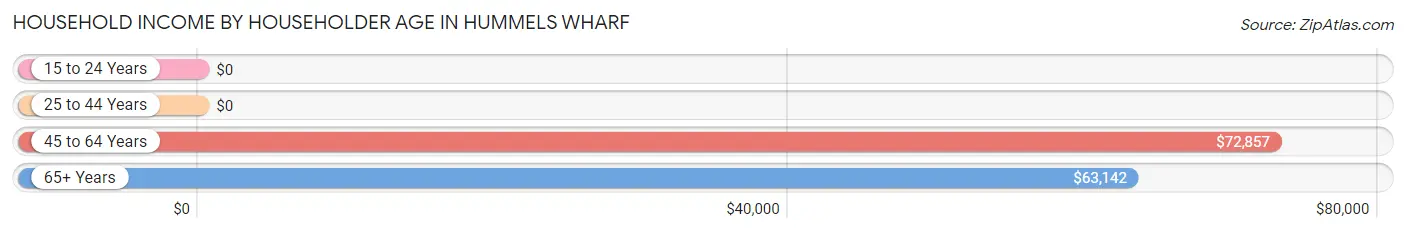
| Income Bracket | # Households | Median Income |
| 15 to 24 Years | 0 (0.0%) | $0 |
| 25 to 44 Years | 26 (7.0%) | $0 |
| 45 to 64 Years | 116 (31.1%) | $72,857 |
| 65+ Years | 231 (61.9%) | $63,142 |
| Total | 373 (100.0%) | $63,953 |
Poverty in Hummels Wharf
Income Below Poverty by Sex and Age in Hummels Wharf
With 4.1% poverty level for males and 10.6% for females among the residents of Hummels Wharf, 75 year old and over males and 45 to 54 year old females are the most vulnerable to poverty, with 14 males (17.7%) and 18 females (41.9%) in their respective age groups living below the poverty level.
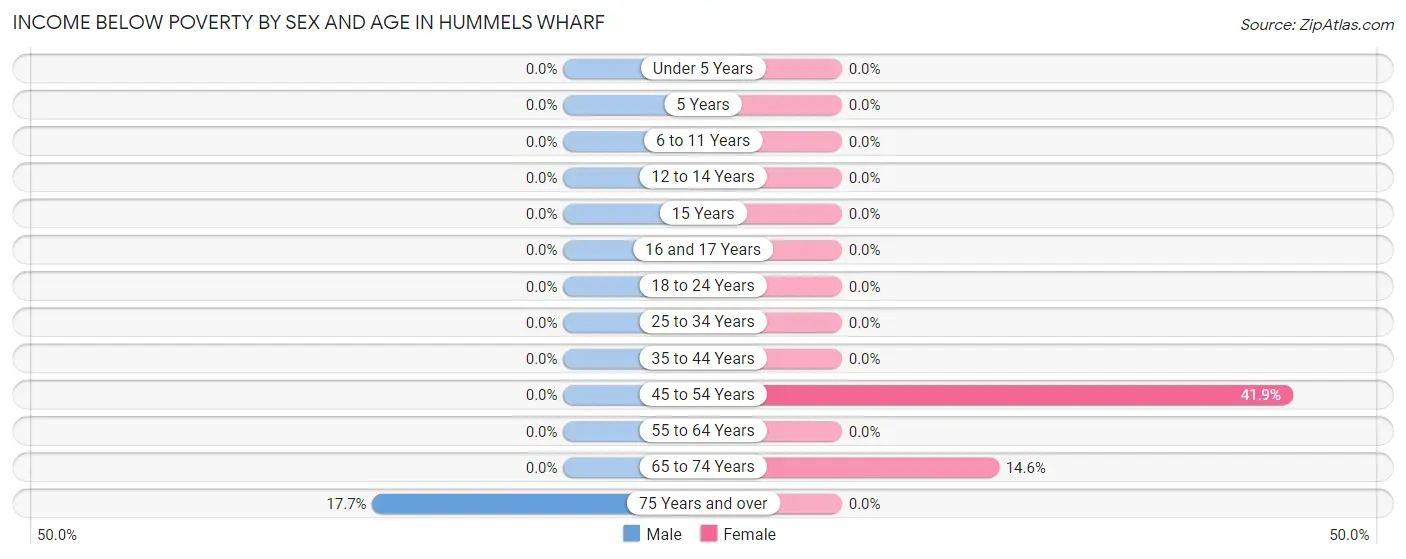
| Age Bracket | Male | Female |
| Under 5 Years | 0 (0.0%) | 0 (0.0%) |
| 5 Years | 0 (0.0%) | 0 (0.0%) |
| 6 to 11 Years | 0 (0.0%) | 0 (0.0%) |
| 12 to 14 Years | 0 (0.0%) | 0 (0.0%) |
| 15 Years | 0 (0.0%) | 0 (0.0%) |
| 16 and 17 Years | 0 (0.0%) | 0 (0.0%) |
| 18 to 24 Years | 0 (0.0%) | 0 (0.0%) |
| 25 to 34 Years | 0 (0.0%) | 0 (0.0%) |
| 35 to 44 Years | 0 (0.0%) | 0 (0.0%) |
| 45 to 54 Years | 0 (0.0%) | 18 (41.9%) |
| 55 to 64 Years | 0 (0.0%) | 0 (0.0%) |
| 65 to 74 Years | 0 (0.0%) | 15 (14.6%) |
| 75 Years and over | 14 (17.7%) | 0 (0.0%) |
| Total | 14 (4.1%) | 33 (10.6%) |
Income Above Poverty by Sex and Age in Hummels Wharf
According to the poverty statistics in Hummels Wharf, males aged 15 years and females aged 16 and 17 years are the age groups that are most secure financially, with 100.0% of males and 100.0% of females in these age groups living above the poverty line.
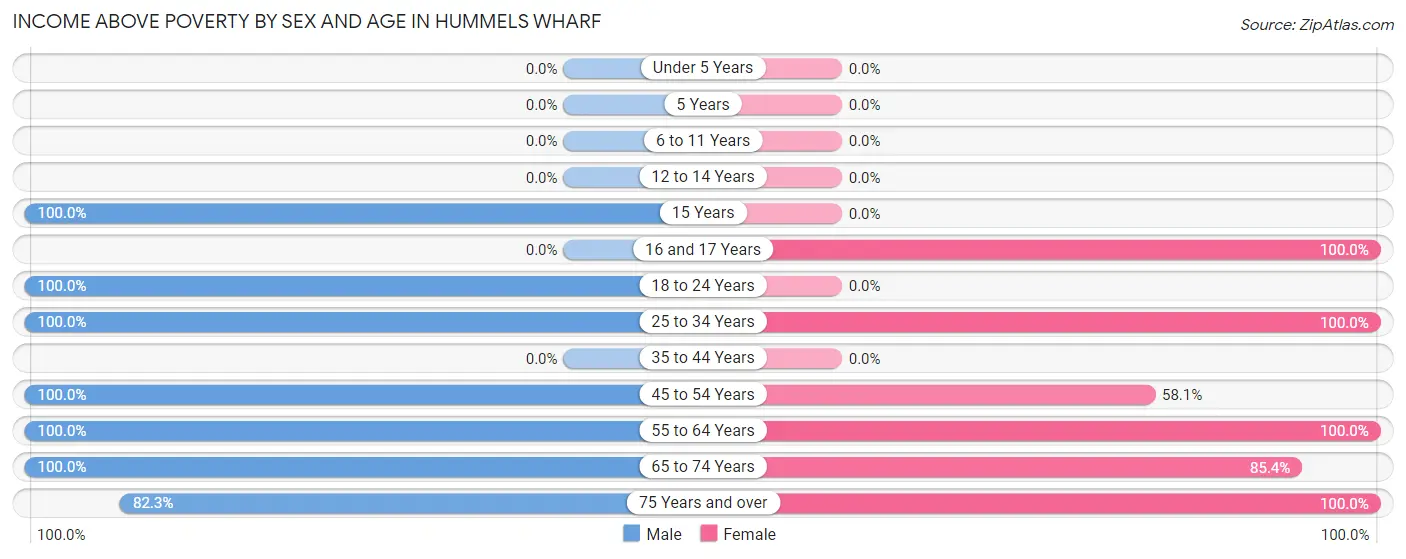
| Age Bracket | Male | Female |
| Under 5 Years | 0 (0.0%) | 0 (0.0%) |
| 5 Years | 0 (0.0%) | 0 (0.0%) |
| 6 to 11 Years | 0 (0.0%) | 0 (0.0%) |
| 12 to 14 Years | 0 (0.0%) | 0 (0.0%) |
| 15 Years | 28 (100.0%) | 0 (0.0%) |
| 16 and 17 Years | 0 (0.0%) | 9 (100.0%) |
| 18 to 24 Years | 17 (100.0%) | 0 (0.0%) |
| 25 to 34 Years | 53 (100.0%) | 14 (100.0%) |
| 35 to 44 Years | 0 (0.0%) | 0 (0.0%) |
| 45 to 54 Years | 32 (100.0%) | 25 (58.1%) |
| 55 to 64 Years | 61 (100.0%) | 74 (100.0%) |
| 65 to 74 Years | 74 (100.0%) | 88 (85.4%) |
| 75 Years and over | 65 (82.3%) | 67 (100.0%) |
| Total | 330 (95.9%) | 277 (89.3%) |
Income Below Poverty Among Married-Couple Families in Hummels Wharf
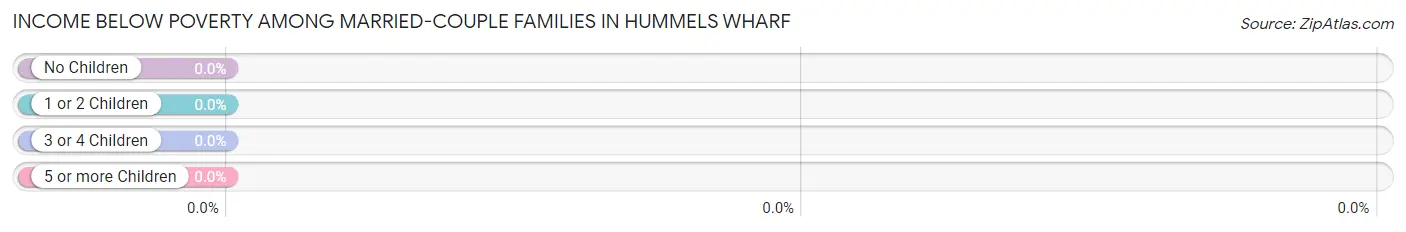
| Children | Above Poverty | Below Poverty |
| No Children | 177 (100.0%) | 0 (0.0%) |
| 1 or 2 Children | 0 (0.0%) | 0 (0.0%) |
| 3 or 4 Children | 0 (0.0%) | 0 (0.0%) |
| 5 or more Children | 0 (0.0%) | 0 (0.0%) |
| Total | 177 (100.0%) | 0 (0.0%) |
Income Below Poverty Among Single-Parent Households in Hummels Wharf
| Children | Single Father | Single Mother |
| No Children | 0 (0.0%) | 0 (0.0%) |
| 1 or 2 Children | 0 (0.0%) | 0 (0.0%) |
| 3 or 4 Children | 0 (0.0%) | 0 (0.0%) |
| 5 or more Children | 0 (0.0%) | 0 (0.0%) |
| Total | 0 (0.0%) | 0 (0.0%) |
Income Below Poverty Among Married-Couple vs Single-Parent Households in Hummels Wharf
| Children | Married-Couple Families | Single-Parent Households |
| No Children | 0 (0.0%) | 0 (0.0%) |
| 1 or 2 Children | 0 (0.0%) | 0 (0.0%) |
| 3 or 4 Children | 0 (0.0%) | 0 (0.0%) |
| 5 or more Children | 0 (0.0%) | 0 (0.0%) |
| Total | 0 (0.0%) | 0 (0.0%) |
Race in Hummels Wharf
The most populous races in Hummels Wharf are White / Caucasian (595 | 91.0%), Hispanic or Latino (53 | 8.1%), and Some other Race (53 | 8.1%).
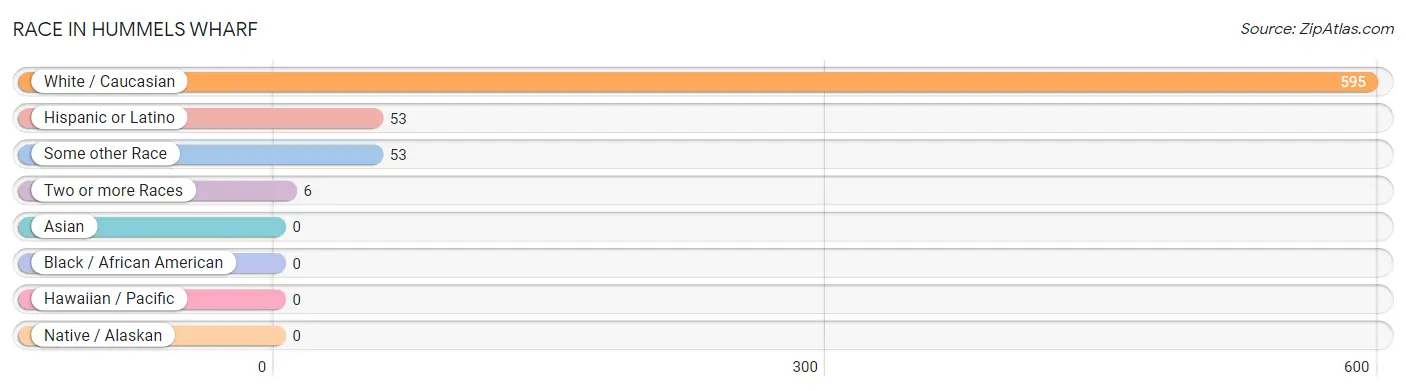
| Race | # Population | % Population |
| Asian | 0 | 0.0% |
| Black / African American | 0 | 0.0% |
| Hawaiian / Pacific | 0 | 0.0% |
| Hispanic or Latino | 53 | 8.1% |
| Native / Alaskan | 0 | 0.0% |
| White / Caucasian | 595 | 91.0% |
| Two or more Races | 6 | 0.9% |
| Some other Race | 53 | 8.1% |
| Total | 654 | 100.0% |
Ancestry in Hummels Wharf
The most populous ancestries reported in Hummels Wharf are German (112 | 17.1%), English (80 | 12.2%), Irish (79 | 12.1%), Puerto Rican (53 | 8.1%), and American (38 | 5.8%), together accounting for 55.4% of all Hummels Wharf residents.
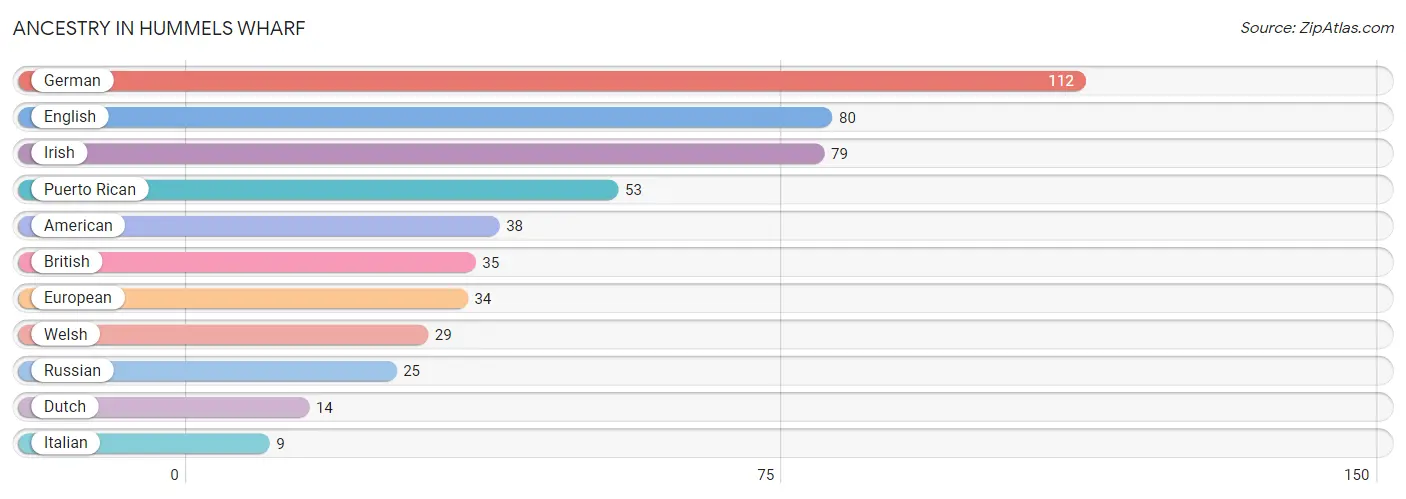
| Ancestry | # Population | % Population |
| American | 38 | 5.8% |
| British | 35 | 5.3% |
| Dutch | 14 | 2.1% |
| English | 80 | 12.2% |
| European | 34 | 5.2% |
| German | 112 | 17.1% |
| Irish | 79 | 12.1% |
| Italian | 9 | 1.4% |
| Puerto Rican | 53 | 8.1% |
| Russian | 25 | 3.8% |
| Welsh | 29 | 4.4% | View All 11 Rows |
Immigrants in Hummels Wharf
The most numerous immigrant groups reported in Hummels Wharf came from Europe (11 | 1.7%), and Northern Europe (11 | 1.7%), together accounting for 3.4% of all Hummels Wharf residents.
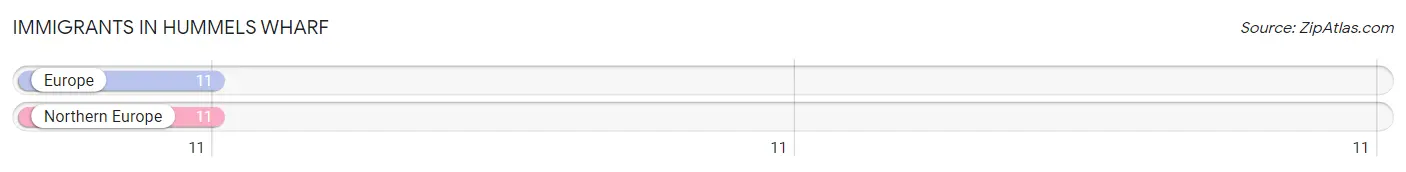
| Immigration Origin | # Population | % Population |
| Europe | 11 | 1.7% |
| Northern Europe | 11 | 1.7% | View All 2 Rows |
Sex and Age in Hummels Wharf
Sex and Age in Hummels Wharf
The most populous age groups in Hummels Wharf are 70 to 74 Years (60 | 17.4%) for men and 65 to 69 Years (89 | 28.7%) for women.
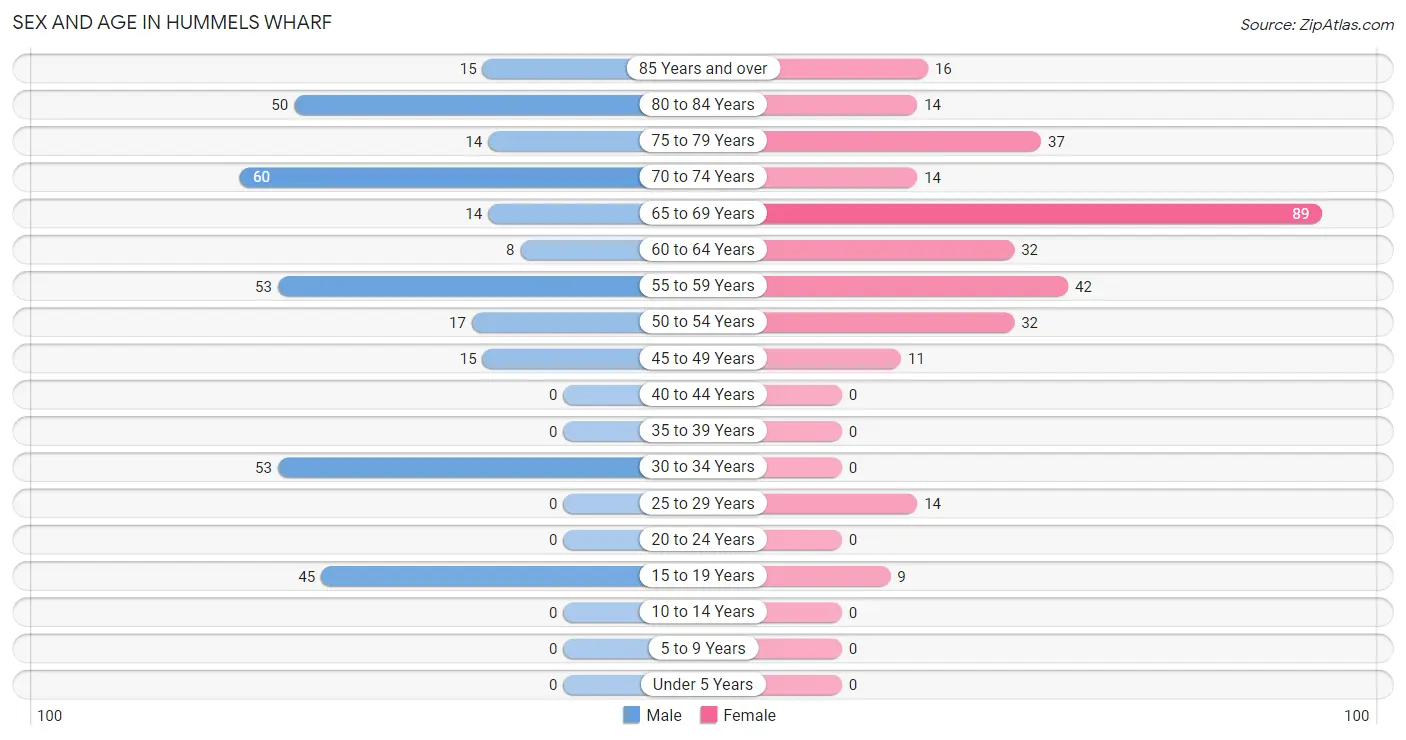
| Age Bracket | Male | Female |
| Under 5 Years | 0 (0.0%) | 0 (0.0%) |
| 5 to 9 Years | 0 (0.0%) | 0 (0.0%) |
| 10 to 14 Years | 0 (0.0%) | 0 (0.0%) |
| 15 to 19 Years | 45 (13.1%) | 9 (2.9%) |
| 20 to 24 Years | 0 (0.0%) | 0 (0.0%) |
| 25 to 29 Years | 0 (0.0%) | 14 (4.5%) |
| 30 to 34 Years | 53 (15.4%) | 0 (0.0%) |
| 35 to 39 Years | 0 (0.0%) | 0 (0.0%) |
| 40 to 44 Years | 0 (0.0%) | 0 (0.0%) |
| 45 to 49 Years | 15 (4.4%) | 11 (3.5%) |
| 50 to 54 Years | 17 (4.9%) | 32 (10.3%) |
| 55 to 59 Years | 53 (15.4%) | 42 (13.6%) |
| 60 to 64 Years | 8 (2.3%) | 32 (10.3%) |
| 65 to 69 Years | 14 (4.1%) | 89 (28.7%) |
| 70 to 74 Years | 60 (17.4%) | 14 (4.5%) |
| 75 to 79 Years | 14 (4.1%) | 37 (11.9%) |
| 80 to 84 Years | 50 (14.5%) | 14 (4.5%) |
| 85 Years and over | 15 (4.4%) | 16 (5.2%) |
| Total | 344 (100.0%) | 310 (100.0%) |
Families and Households in Hummels Wharf
Median Family Size in Hummels Wharf
The median family size in Hummels Wharf is 2.18 persons per family, with single male/father families (15 | 6.5%) accounting for the largest median family size of 2.87 persons per family. On the other hand, single female/mother families (39 | 16.9%) represent the smallest median family size with 1.87 persons per family.
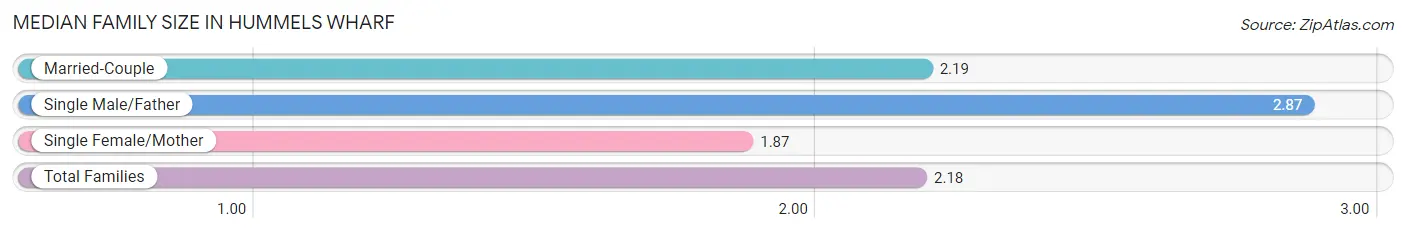
| Family Type | # Families | Family Size |
| Married-Couple | 177 (76.6%) | 2.19 |
| Single Male/Father | 15 (6.5%) | 2.87 |
| Single Female/Mother | 39 (16.9%) | 1.87 |
| Total Families | 231 (100.0%) | 2.18 |
Median Household Size in Hummels Wharf
The median household size in Hummels Wharf is 1.75 persons per household, with single male/father households (15 | 4.0%) accounting for the largest median household size of 2.87 persons per household. non-family households (142 | 38.1%) represent the smallest median household size with 1.06 persons per household.
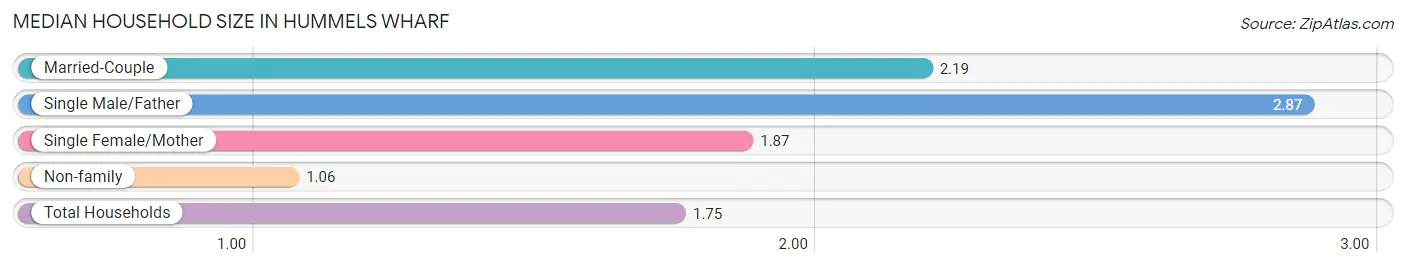
| Household Type | # Households | Household Size |
| Married-Couple | 177 (47.4%) | 2.19 |
| Single Male/Father | 15 (4.0%) | 2.87 |
| Single Female/Mother | 39 (10.5%) | 1.87 |
| Non-family | 142 (38.1%) | 1.06 |
| Total Households | 373 (100.0%) | 1.75 |
Household Size by Marriage Status in Hummels Wharf
Out of a total of 373 households in Hummels Wharf, 231 (61.9%) are family households, while 142 (38.1%) are nonfamily households. The most numerous type of family households are 2-person households, comprising 217, and the most common type of nonfamily households are 1-person households, comprising 133.
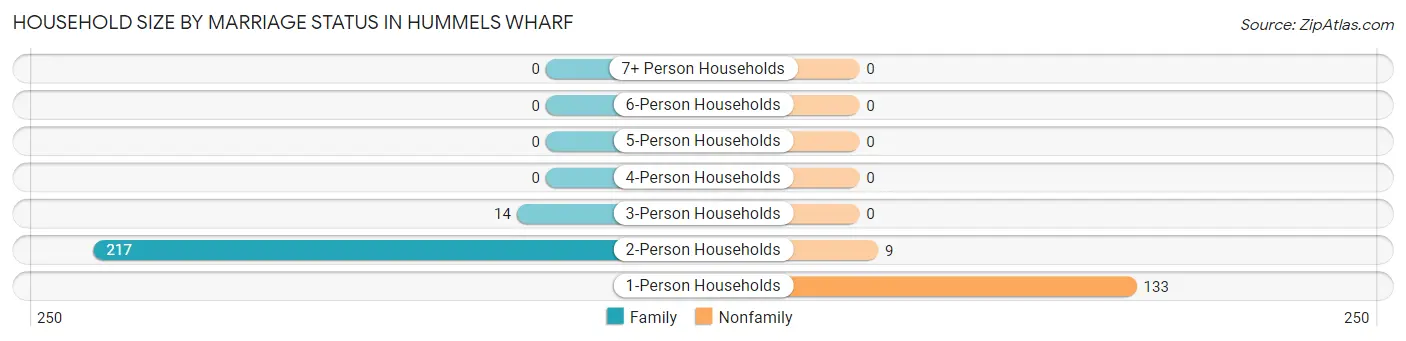
| Household Size | Family Households | Nonfamily Households |
| 1-Person Households | - | 133 (35.7%) |
| 2-Person Households | 217 (58.2%) | 9 (2.4%) |
| 3-Person Households | 14 (3.7%) | 0 (0.0%) |
| 4-Person Households | 0 (0.0%) | 0 (0.0%) |
| 5-Person Households | 0 (0.0%) | 0 (0.0%) |
| 6-Person Households | 0 (0.0%) | 0 (0.0%) |
| 7+ Person Households | 0 (0.0%) | 0 (0.0%) |
| Total | 231 (61.9%) | 142 (38.1%) |
Female Fertility in Hummels Wharf
Fertility by Age in Hummels Wharf
| Age Bracket | Women with Births | Births / 1,000 Women |
| 15 to 19 years | 0 (0.0%) | 0.0 |
| 20 to 34 years | 0 (0.0%) | 0.0 |
| 35 to 50 years | 0 (0.0%) | 0.0 |
| Total | 0 (0.0%) | 0.0 |
Fertility by Age by Marriage Status in Hummels Wharf
| Age Bracket | Married | Unmarried |
| 15 to 19 years | 0 (0.0%) | 0 (0.0%) |
| 20 to 34 years | 0 (0.0%) | 0 (0.0%) |
| 35 to 50 years | 0 (0.0%) | 0 (0.0%) |
| Total | 0 (0.0%) | 0 (0.0%) |
Fertility by Education in Hummels Wharf
| Educational Attainment | Women with Births | Births / 1,000 Women |
| Less than High School | 0 (0.0%) | 0.0 |
| High School Diploma | 0 (0.0%) | 0.0 |
| College or Associate's Degree | 0 (0.0%) | 0.0 |
| Bachelor's Degree | 0 (0.0%) | 0.0 |
| Graduate Degree | 0 (0.0%) | 0.0 |
| Total | 0 (0.0%) | 0.0 |
Fertility by Education by Marriage Status in Hummels Wharf
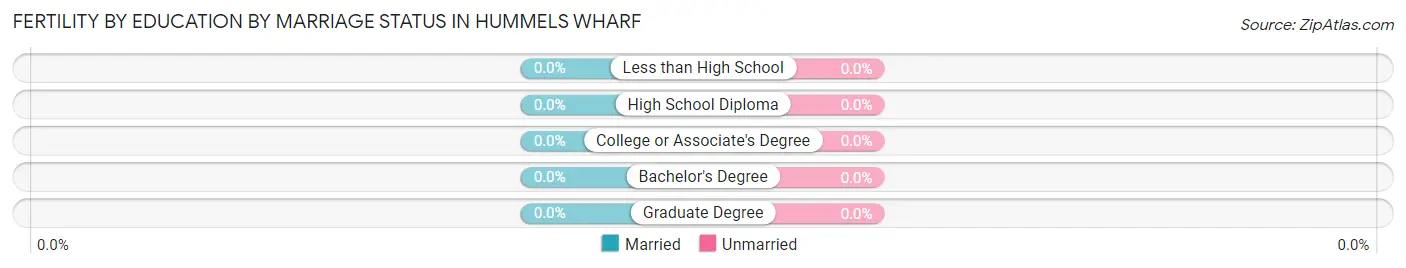
| Educational Attainment | Married | Unmarried |
| Less than High School | 0 (0.0%) | 0 (0.0%) |
| High School Diploma | 0 (0.0%) | 0 (0.0%) |
| College or Associate's Degree | 0 (0.0%) | 0 (0.0%) |
| Bachelor's Degree | 0 (0.0%) | 0 (0.0%) |
| Graduate Degree | 0 (0.0%) | 0 (0.0%) |
| Total | 0 (0.0%) | 0 (0.0%) |
Employment Characteristics in Hummels Wharf
Employment by Class of Employer in Hummels Wharf
Among the 338 employed individuals in Hummels Wharf, private company employees (203 | 60.1%), not-for-profit organizations (48 | 14.2%), and self-employed (incorporated) (34 | 10.1%) make up the most common classes of employment.
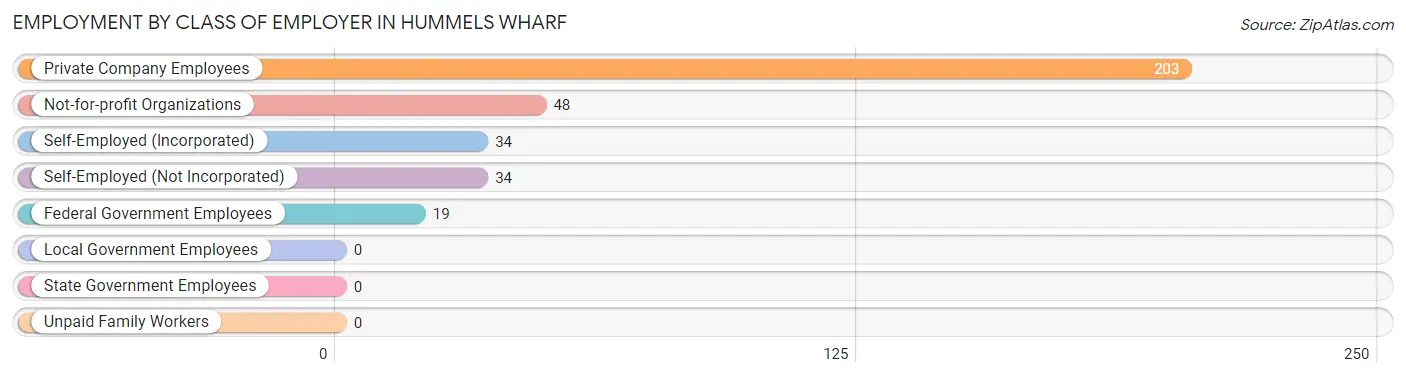
| Employer Class | # Employees | % Employees |
| Private Company Employees | 203 | 60.1% |
| Self-Employed (Incorporated) | 34 | 10.1% |
| Self-Employed (Not Incorporated) | 34 | 10.1% |
| Not-for-profit Organizations | 48 | 14.2% |
| Local Government Employees | 0 | 0.0% |
| State Government Employees | 0 | 0.0% |
| Federal Government Employees | 19 | 5.6% |
| Unpaid Family Workers | 0 | 0.0% |
| Total | 338 | 100.0% |
Employment Status by Age in Hummels Wharf
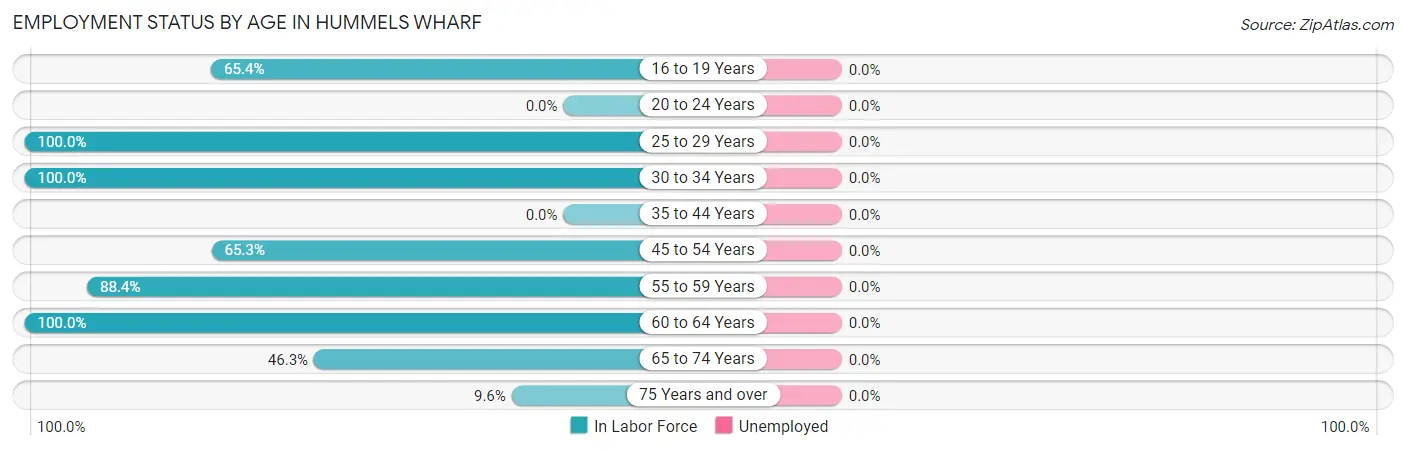
| Age Bracket | In Labor Force | Unemployed |
| 16 to 19 Years | 17 (65.4%) | 0 (0.0%) |
| 20 to 24 Years | 0 (0.0%) | 0 (0.0%) |
| 25 to 29 Years | 14 (100.0%) | 0 (0.0%) |
| 30 to 34 Years | 53 (100.0%) | 0 (0.0%) |
| 35 to 44 Years | 0 (0.0%) | 0 (0.0%) |
| 45 to 54 Years | 49 (65.3%) | 0 (0.0%) |
| 55 to 59 Years | 84 (88.4%) | 0 (0.0%) |
| 60 to 64 Years | 40 (100.0%) | 0 (0.0%) |
| 65 to 74 Years | 82 (46.3%) | 0 (0.0%) |
| 75 Years and over | 14 (9.6%) | 0 (0.0%) |
| Total | 353 (56.4%) | 0 (0.0%) |
Employment Status by Educational Attainment in Hummels Wharf
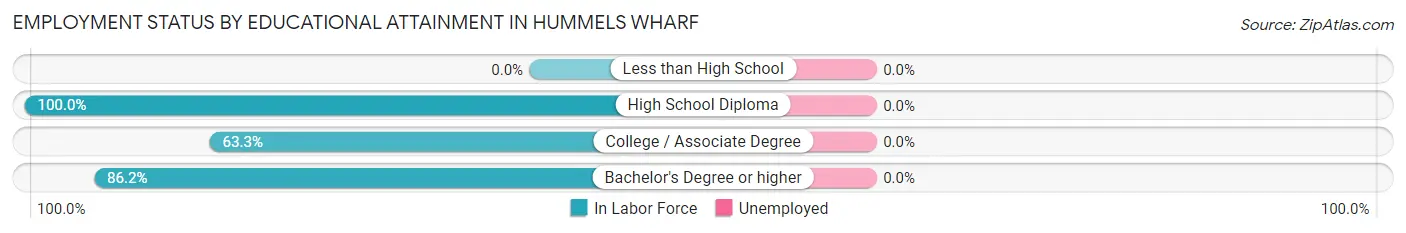
| Educational Attainment | In Labor Force | Unemployed |
| Less than High School | 0 (0.0%) | 0 (0.0%) |
| High School Diploma | 140 (100.0%) | 0 (0.0%) |
| College / Associate Degree | 50 (63.3%) | 0 (0.0%) |
| Bachelor's Degree or higher | 50 (86.2%) | 0 (0.0%) |
| Total | 240 (86.6%) | 0 (0.0%) |
Employment Occupations by Sex in Hummels Wharf
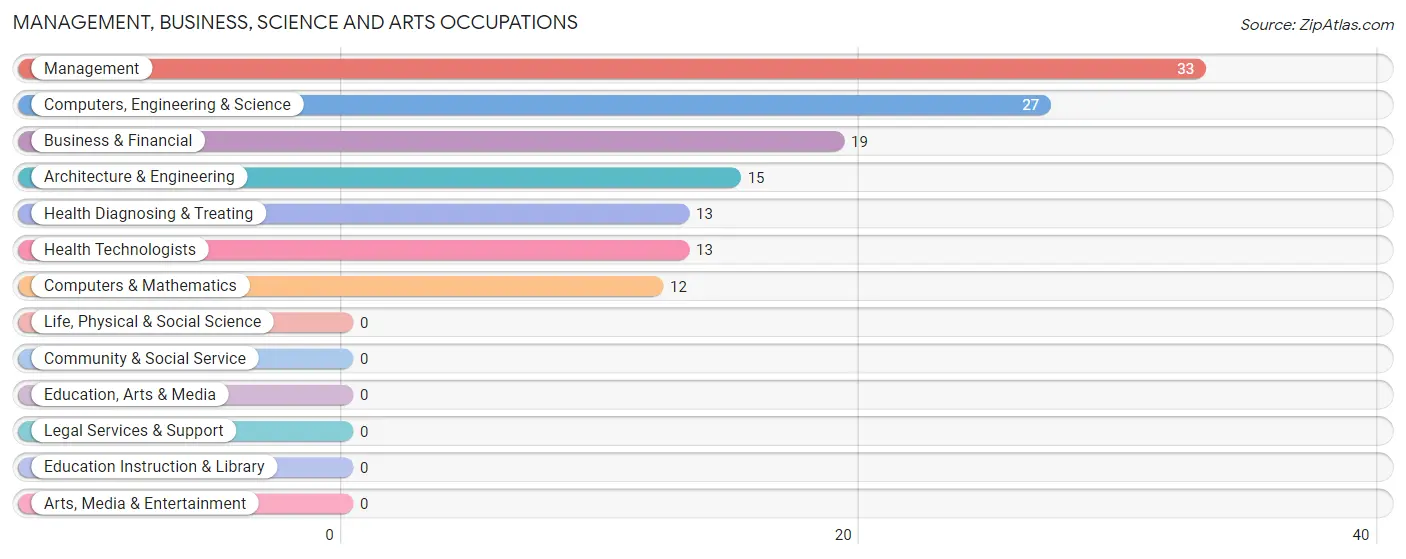
Management, Business, Science and Arts Occupations
The most common Management, Business, Science and Arts occupations in Hummels Wharf are Management (33 | 9.3%), Computers, Engineering & Science (27 | 7.6%), Business & Financial (19 | 5.4%), Architecture & Engineering (15 | 4.3%), and Health Diagnosing & Treating (13 | 3.7%).
Management, Business, Science and Arts Occupations by Sex
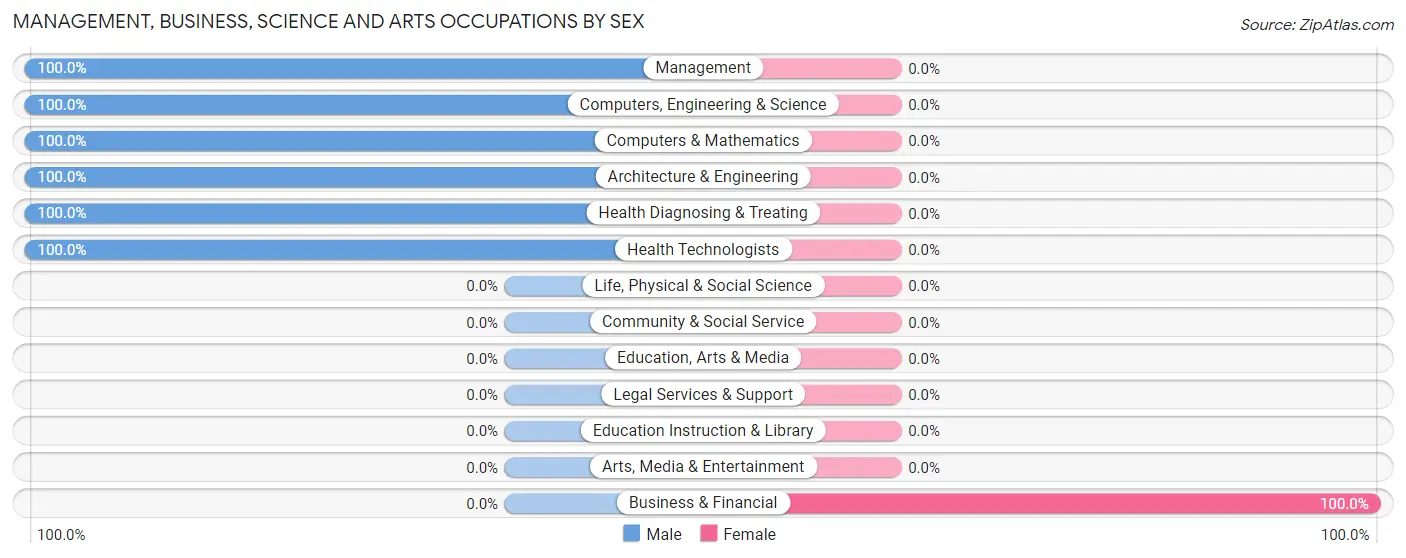
| Occupation | Male | Female |
| Management | 33 (100.0%) | 0 (0.0%) |
| Business & Financial | 0 (0.0%) | 19 (100.0%) |
| Computers, Engineering & Science | 27 (100.0%) | 0 (0.0%) |
| Computers & Mathematics | 12 (100.0%) | 0 (0.0%) |
| Architecture & Engineering | 15 (100.0%) | 0 (0.0%) |
| Life, Physical & Social Science | 0 (0.0%) | 0 (0.0%) |
| Community & Social Service | 0 (0.0%) | 0 (0.0%) |
| Education, Arts & Media | 0 (0.0%) | 0 (0.0%) |
| Legal Services & Support | 0 (0.0%) | 0 (0.0%) |
| Education Instruction & Library | 0 (0.0%) | 0 (0.0%) |
| Arts, Media & Entertainment | 0 (0.0%) | 0 (0.0%) |
| Health Diagnosing & Treating | 13 (100.0%) | 0 (0.0%) |
| Health Technologists | 13 (100.0%) | 0 (0.0%) |
| Total (Category) | 73 (79.3%) | 19 (20.6%) |
| Total (Overall) | 197 (55.8%) | 156 (44.2%) |
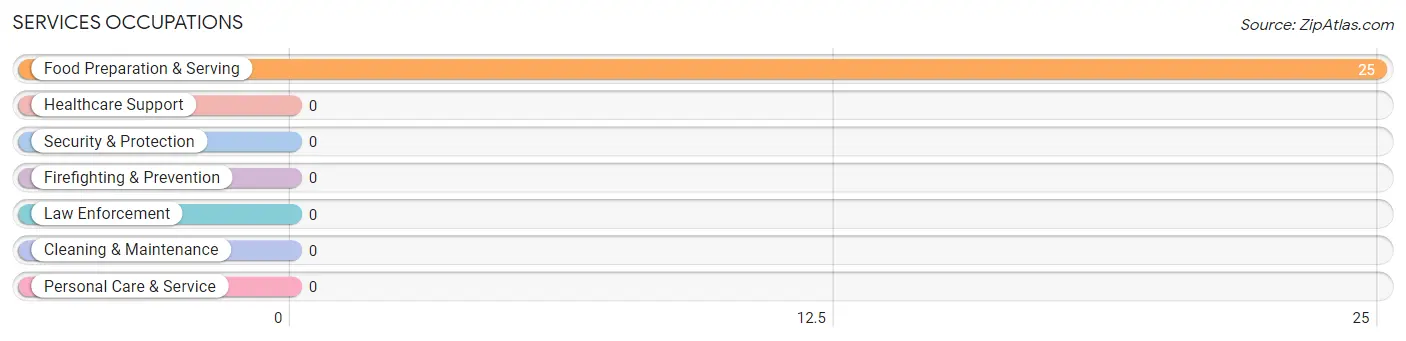
Services Occupations
The most common Services occupations in Hummels Wharf are , and Food Preparation & Serving (25 | 7.1%).
Services Occupations by Sex
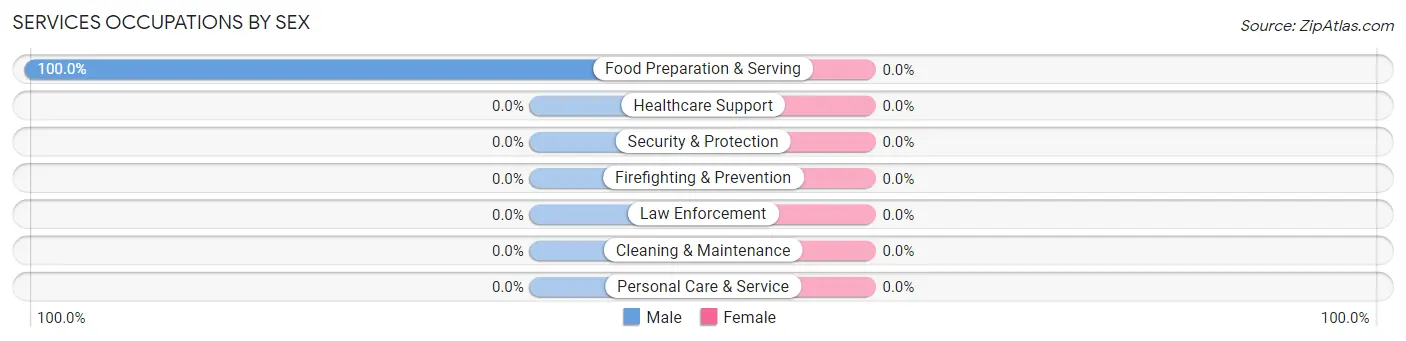
| Occupation | Male | Female |
| Healthcare Support | 0 (0.0%) | 0 (0.0%) |
| Security & Protection | 0 (0.0%) | 0 (0.0%) |
| Firefighting & Prevention | 0 (0.0%) | 0 (0.0%) |
| Law Enforcement | 0 (0.0%) | 0 (0.0%) |
| Food Preparation & Serving | 25 (100.0%) | 0 (0.0%) |
| Cleaning & Maintenance | 0 (0.0%) | 0 (0.0%) |
| Personal Care & Service | 0 (0.0%) | 0 (0.0%) |
| Total (Category) | 25 (100.0%) | 0 (0.0%) |
| Total (Overall) | 197 (55.8%) | 156 (44.2%) |
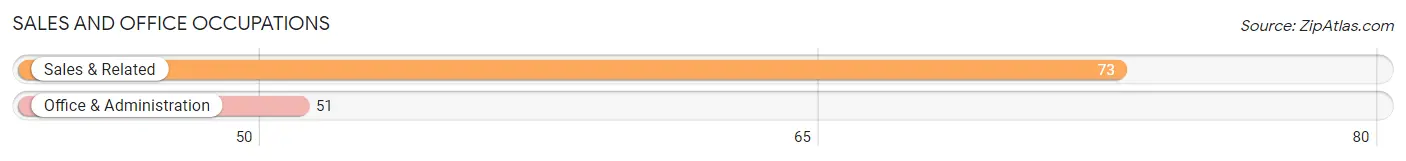
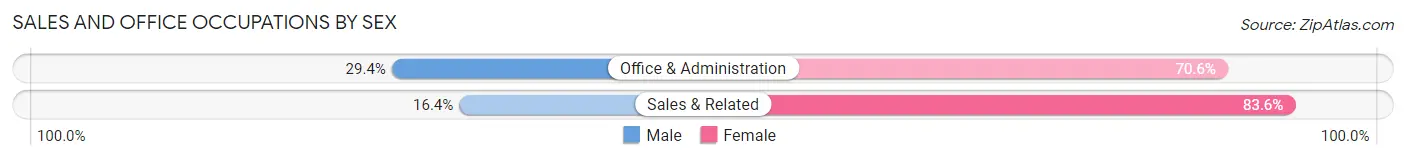
Sales and Office Occupations
The most common Sales and Office occupations in Hummels Wharf are Sales & Related (73 | 20.7%), and Office & Administration (51 | 14.4%).
Sales and Office Occupations by Sex
| Occupation | Male | Female |
| Sales & Related | 12 (16.4%) | 61 (83.6%) |
| Office & Administration | 15 (29.4%) | 36 (70.6%) |
| Total (Category) | 27 (21.8%) | 97 (78.2%) |
| Total (Overall) | 197 (55.8%) | 156 (44.2%) |
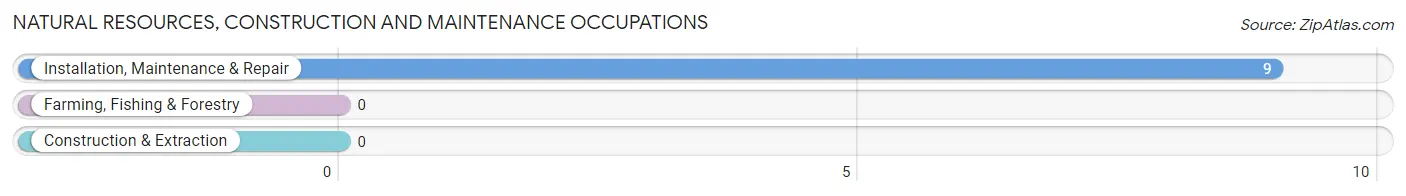
Natural Resources, Construction and Maintenance Occupations
The most common Natural Resources, Construction and Maintenance occupations in Hummels Wharf are , and Installation, Maintenance & Repair (9 | 2.5%).
Natural Resources, Construction and Maintenance Occupations by Sex
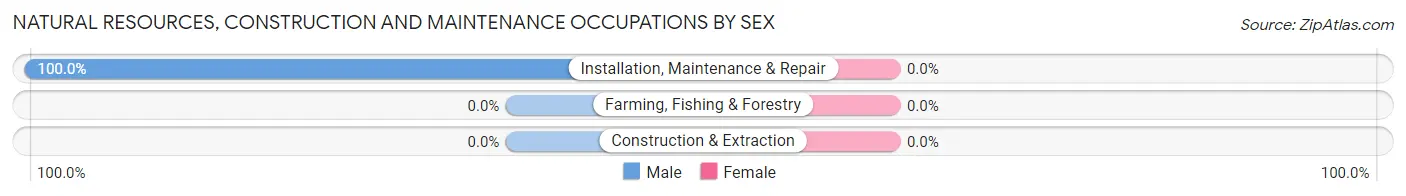
| Occupation | Male | Female |
| Farming, Fishing & Forestry | 0 (0.0%) | 0 (0.0%) |
| Construction & Extraction | 0 (0.0%) | 0 (0.0%) |
| Installation, Maintenance & Repair | 9 (100.0%) | 0 (0.0%) |
| Total (Category) | 9 (100.0%) | 0 (0.0%) |
| Total (Overall) | 197 (55.8%) | 156 (44.2%) |
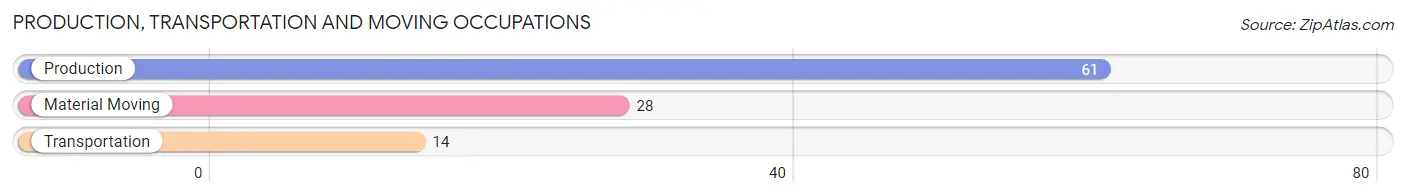
Production, Transportation and Moving Occupations
The most common Production, Transportation and Moving occupations in Hummels Wharf are Production (61 | 17.3%), Material Moving (28 | 7.9%), and Transportation (14 | 4.0%).
Production, Transportation and Moving Occupations by Sex
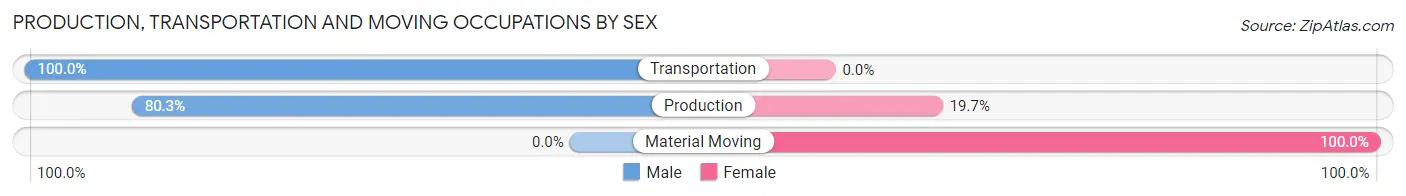
| Occupation | Male | Female |
| Production | 49 (80.3%) | 12 (19.7%) |
| Transportation | 14 (100.0%) | 0 (0.0%) |
| Material Moving | 0 (0.0%) | 28 (100.0%) |
| Total (Category) | 63 (61.2%) | 40 (38.8%) |
| Total (Overall) | 197 (55.8%) | 156 (44.2%) |
Employment Industries by Sex in Hummels Wharf
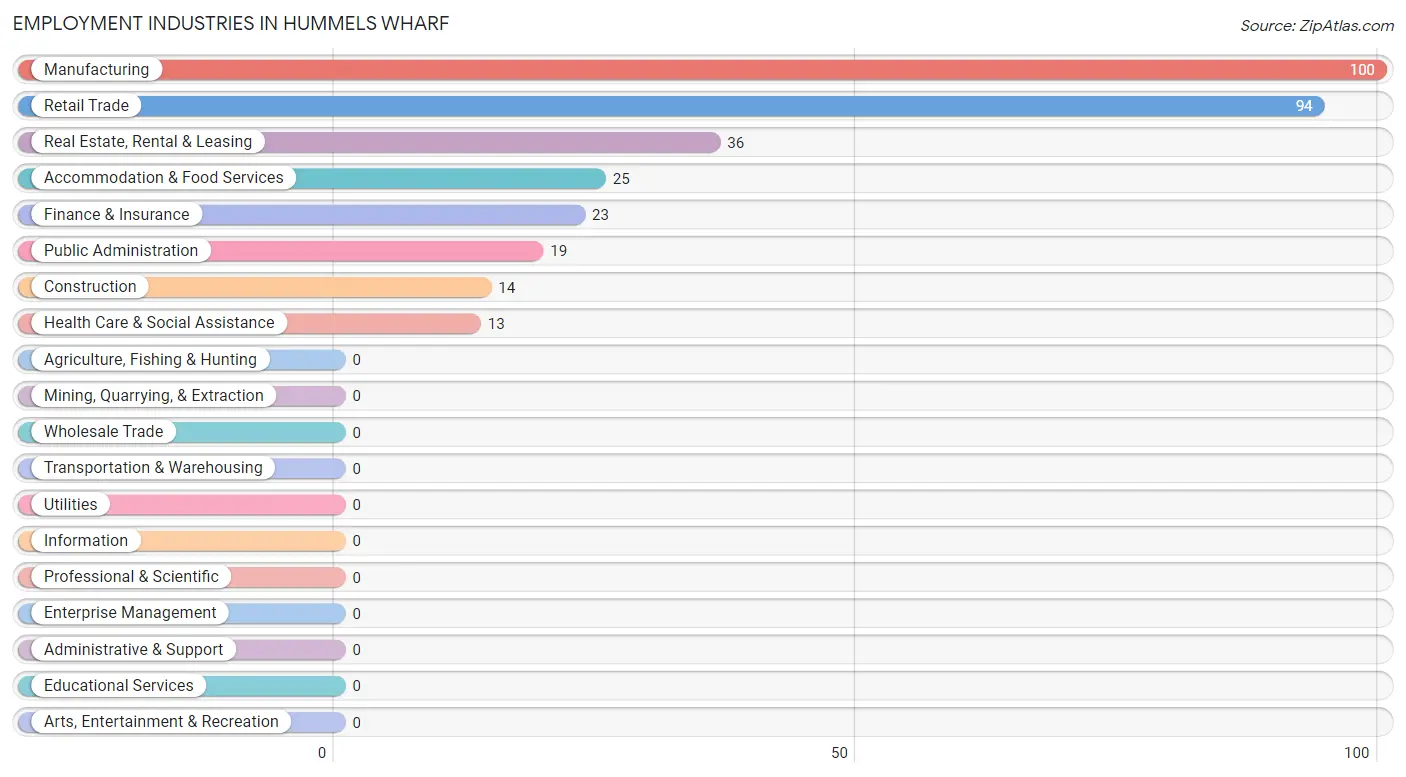
Employment Industries in Hummels Wharf
The major employment industries in Hummels Wharf include Manufacturing (100 | 28.3%), Retail Trade (94 | 26.6%), Real Estate, Rental & Leasing (36 | 10.2%), Accommodation & Food Services (25 | 7.1%), and Finance & Insurance (23 | 6.5%).
Employment Industries by Sex in Hummels Wharf
The Hummels Wharf industries that see more men than women are Health Care & Social Assistance (100.0%), Accommodation & Food Services (100.0%), and Manufacturing (77.0%), whereas the industries that tend to have a higher number of women are Construction (100.0%), Public Administration (100.0%), and Retail Trade (72.3%).
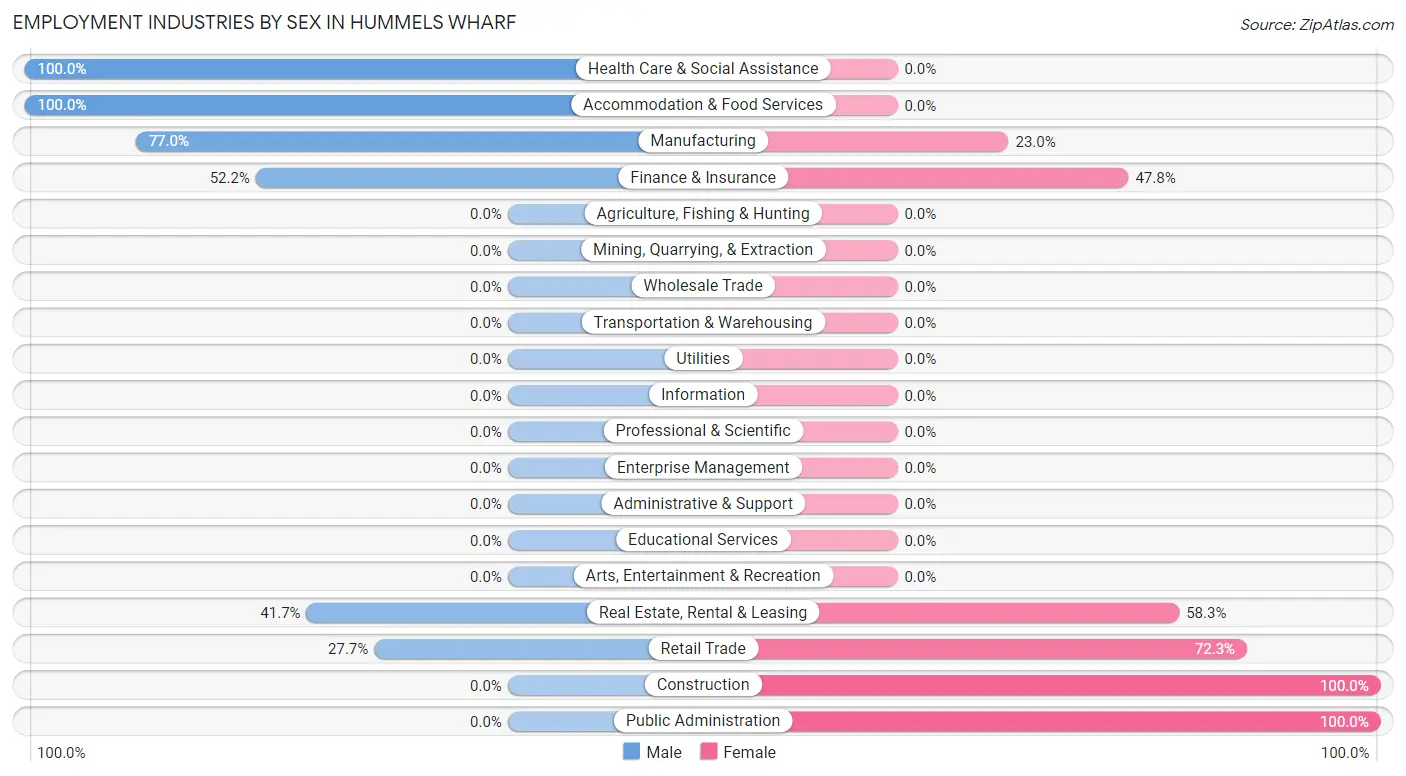
| Industry | Male | Female |
| Agriculture, Fishing & Hunting | 0 (0.0%) | 0 (0.0%) |
| Mining, Quarrying, & Extraction | 0 (0.0%) | 0 (0.0%) |
| Construction | 0 (0.0%) | 14 (100.0%) |
| Manufacturing | 77 (77.0%) | 23 (23.0%) |
| Wholesale Trade | 0 (0.0%) | 0 (0.0%) |
| Retail Trade | 26 (27.7%) | 68 (72.3%) |
| Transportation & Warehousing | 0 (0.0%) | 0 (0.0%) |
| Utilities | 0 (0.0%) | 0 (0.0%) |
| Information | 0 (0.0%) | 0 (0.0%) |
| Finance & Insurance | 12 (52.2%) | 11 (47.8%) |
| Real Estate, Rental & Leasing | 15 (41.7%) | 21 (58.3%) |
| Professional & Scientific | 0 (0.0%) | 0 (0.0%) |
| Enterprise Management | 0 (0.0%) | 0 (0.0%) |
| Administrative & Support | 0 (0.0%) | 0 (0.0%) |
| Educational Services | 0 (0.0%) | 0 (0.0%) |
| Health Care & Social Assistance | 13 (100.0%) | 0 (0.0%) |
| Arts, Entertainment & Recreation | 0 (0.0%) | 0 (0.0%) |
| Accommodation & Food Services | 25 (100.0%) | 0 (0.0%) |
| Public Administration | 0 (0.0%) | 19 (100.0%) |
| Total | 197 (55.8%) | 156 (44.2%) |
Education in Hummels Wharf
School Enrollment in Hummels Wharf
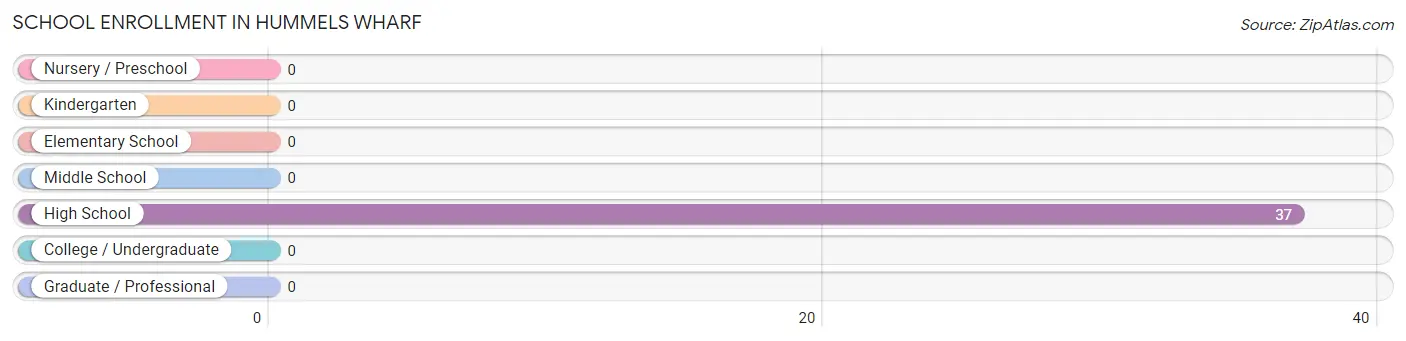
| School Level | # Students | % Students |
| Nursery / Preschool | 0 | 0.0% |
| Kindergarten | 0 | 0.0% |
| Elementary School | 0 | 0.0% |
| Middle School | 0 | 0.0% |
| High School | 37 | 100.0% |
| College / Undergraduate | 0 | 0.0% |
| Graduate / Professional | 0 | 0.0% |
| Total | 37 | 100.0% |
School Enrollment by Age by Funding Source in Hummels Wharf
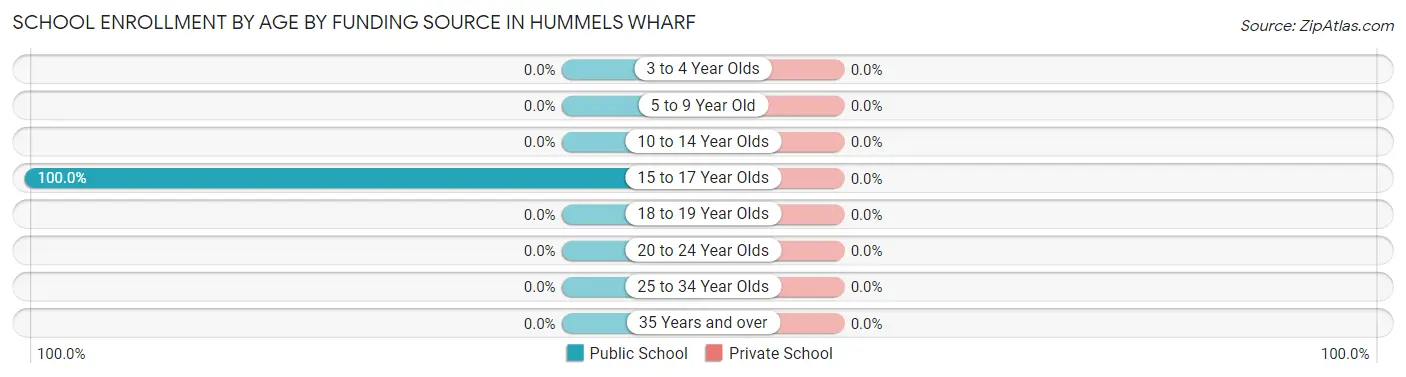
| Age Bracket | Public School | Private School |
| 3 to 4 Year Olds | 0 (0.0%) | 0 (0.0%) |
| 5 to 9 Year Old | 0 (0.0%) | 0 (0.0%) |
| 10 to 14 Year Olds | 0 (0.0%) | 0 (0.0%) |
| 15 to 17 Year Olds | 37 (100.0%) | 0 (0.0%) |
| 18 to 19 Year Olds | 0 (0.0%) | 0 (0.0%) |
| 20 to 24 Year Olds | 0 (0.0%) | 0 (0.0%) |
| 25 to 34 Year Olds | 0 (0.0%) | 0 (0.0%) |
| 35 Years and over | 0 (0.0%) | 0 (0.0%) |
| Total | 37 (100.0%) | 0 (0.0%) |
Educational Attainment by Field of Study in Hummels Wharf
Business (45 | 34.1%), bio, nature & agricultural (40 | 30.3%), engineering (25 | 18.9%), education (14 | 10.6%), and science & technology (8 | 6.1%) are the most common fields of study among 132 individuals in Hummels Wharf who have obtained a bachelor's degree or higher.
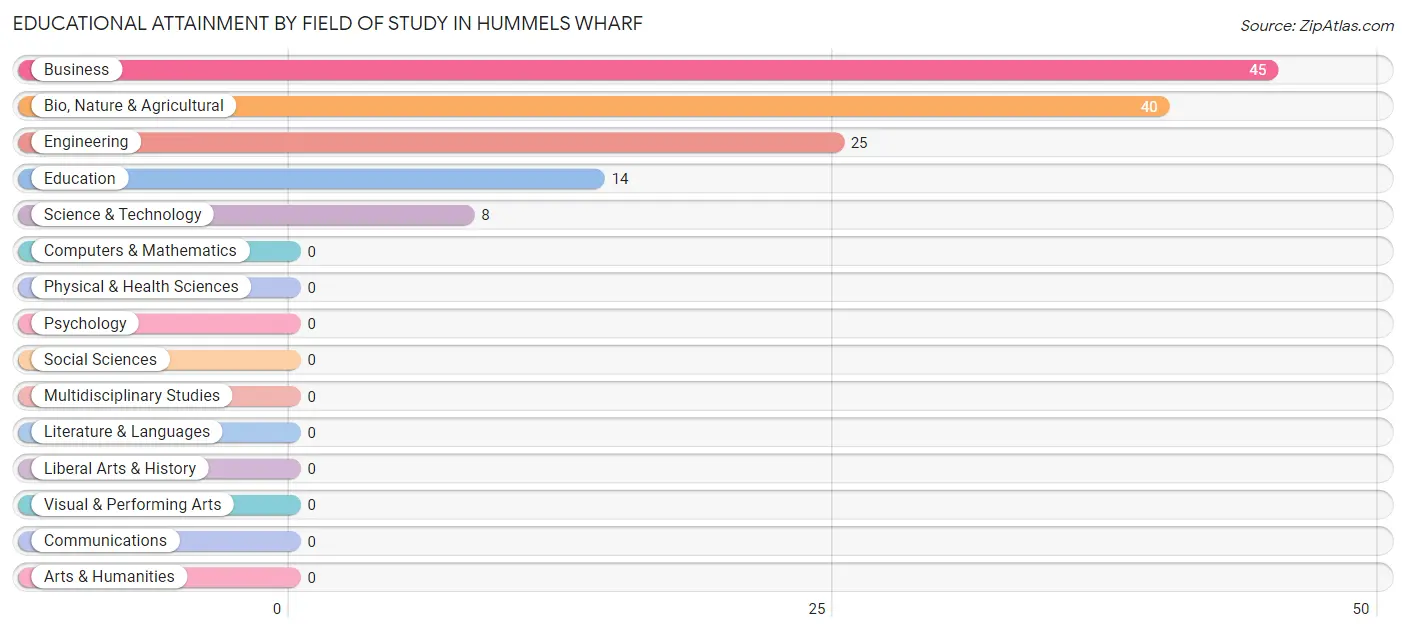
| Field of Study | # Graduates | % Graduates |
| Computers & Mathematics | 0 | 0.0% |
| Bio, Nature & Agricultural | 40 | 30.3% |
| Physical & Health Sciences | 0 | 0.0% |
| Psychology | 0 | 0.0% |
| Social Sciences | 0 | 0.0% |
| Engineering | 25 | 18.9% |
| Multidisciplinary Studies | 0 | 0.0% |
| Science & Technology | 8 | 6.1% |
| Business | 45 | 34.1% |
| Education | 14 | 10.6% |
| Literature & Languages | 0 | 0.0% |
| Liberal Arts & History | 0 | 0.0% |
| Visual & Performing Arts | 0 | 0.0% |
| Communications | 0 | 0.0% |
| Arts & Humanities | 0 | 0.0% |
| Total | 132 | 100.0% |
Transportation & Commute in Hummels Wharf
Vehicle Availability by Sex in Hummels Wharf
The most prevalent vehicle ownership categories in Hummels Wharf are males with 2 vehicles (86, accounting for 47.2%) and females with 2 vehicles (93, making up 55.1%).
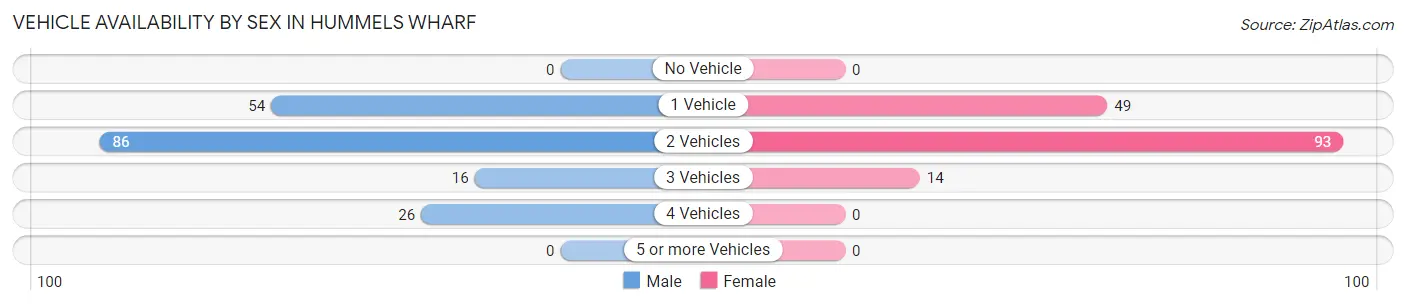
| Vehicles Available | Male | Female |
| No Vehicle | 0 (0.0%) | 0 (0.0%) |
| 1 Vehicle | 54 (29.7%) | 49 (31.4%) |
| 2 Vehicles | 86 (47.2%) | 93 (59.6%) |
| 3 Vehicles | 16 (8.8%) | 14 (9.0%) |
| 4 Vehicles | 26 (14.3%) | 0 (0.0%) |
| 5 or more Vehicles | 0 (0.0%) | 0 (0.0%) |
| Total | 182 (100.0%) | 156 (100.0%) |
Commute Time in Hummels Wharf
The most frequently occuring commute durations in Hummels Wharf are 10 to 14 minutes (53 commuters, 15.7%), 20 to 24 minutes (53 commuters, 15.7%), and 15 to 19 minutes (49 commuters, 14.5%).
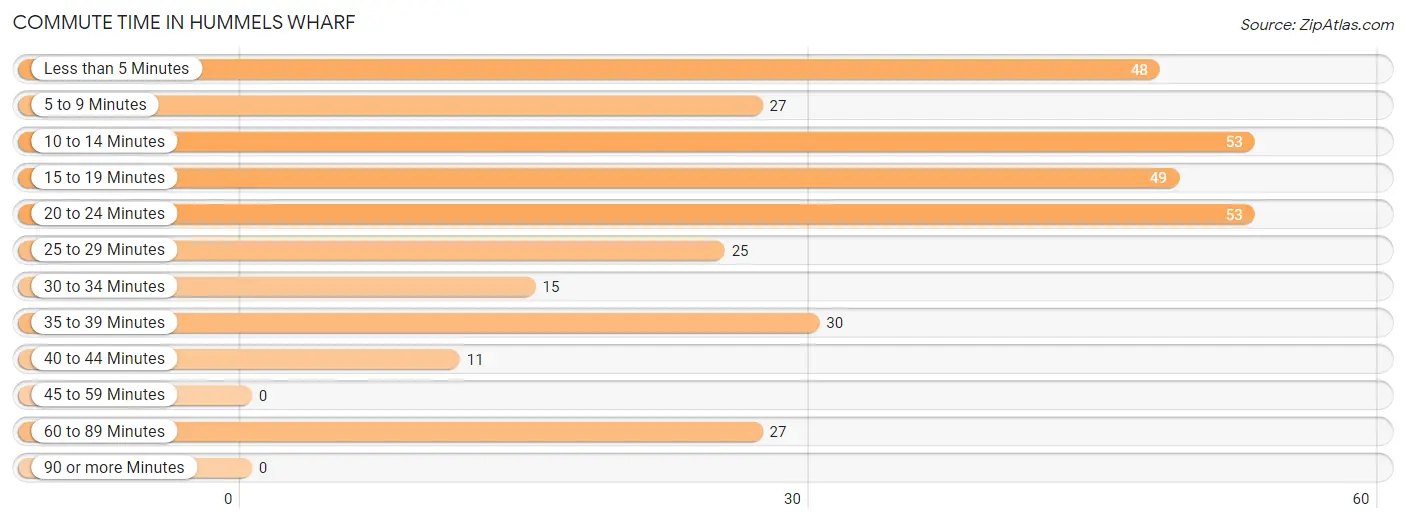
| Commute Time | # Commuters | % Commuters |
| Less than 5 Minutes | 48 | 14.2% |
| 5 to 9 Minutes | 27 | 8.0% |
| 10 to 14 Minutes | 53 | 15.7% |
| 15 to 19 Minutes | 49 | 14.5% |
| 20 to 24 Minutes | 53 | 15.7% |
| 25 to 29 Minutes | 25 | 7.4% |
| 30 to 34 Minutes | 15 | 4.4% |
| 35 to 39 Minutes | 30 | 8.9% |
| 40 to 44 Minutes | 11 | 3.3% |
| 45 to 59 Minutes | 0 | 0.0% |
| 60 to 89 Minutes | 27 | 8.0% |
| 90 or more Minutes | 0 | 0.0% |
Commute Time by Sex in Hummels Wharf
The most common commute times in Hummels Wharf are 15 to 19 minutes (49 commuters, 26.9%) for males and less than 5 minutes (48 commuters, 30.8%) for females.
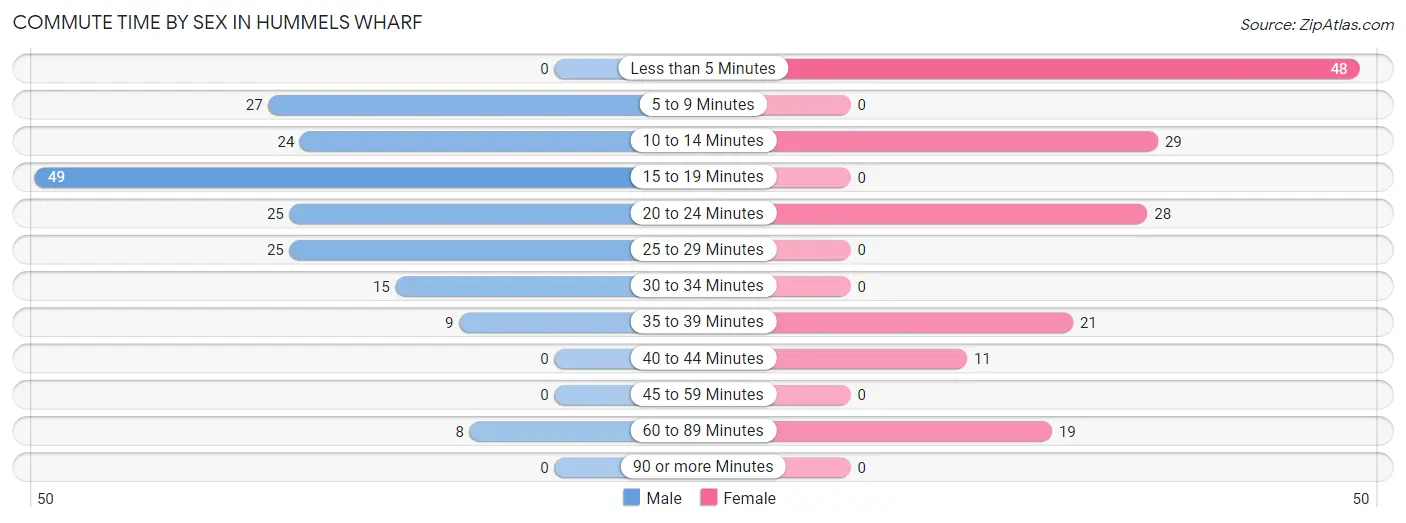
| Commute Time | Male | Female |
| Less than 5 Minutes | 0 (0.0%) | 48 (30.8%) |
| 5 to 9 Minutes | 27 (14.8%) | 0 (0.0%) |
| 10 to 14 Minutes | 24 (13.2%) | 29 (18.6%) |
| 15 to 19 Minutes | 49 (26.9%) | 0 (0.0%) |
| 20 to 24 Minutes | 25 (13.7%) | 28 (17.9%) |
| 25 to 29 Minutes | 25 (13.7%) | 0 (0.0%) |
| 30 to 34 Minutes | 15 (8.2%) | 0 (0.0%) |
| 35 to 39 Minutes | 9 (5.0%) | 21 (13.5%) |
| 40 to 44 Minutes | 0 (0.0%) | 11 (7.0%) |
| 45 to 59 Minutes | 0 (0.0%) | 0 (0.0%) |
| 60 to 89 Minutes | 8 (4.4%) | 19 (12.2%) |
| 90 or more Minutes | 0 (0.0%) | 0 (0.0%) |
Time of Departure to Work by Sex in Hummels Wharf
The most frequent times of departure to work in Hummels Wharf are 8:30 AM to 8:59 AM (49, 26.9%) for males and 7:00 AM to 7:29 AM (41, 26.3%) for females.
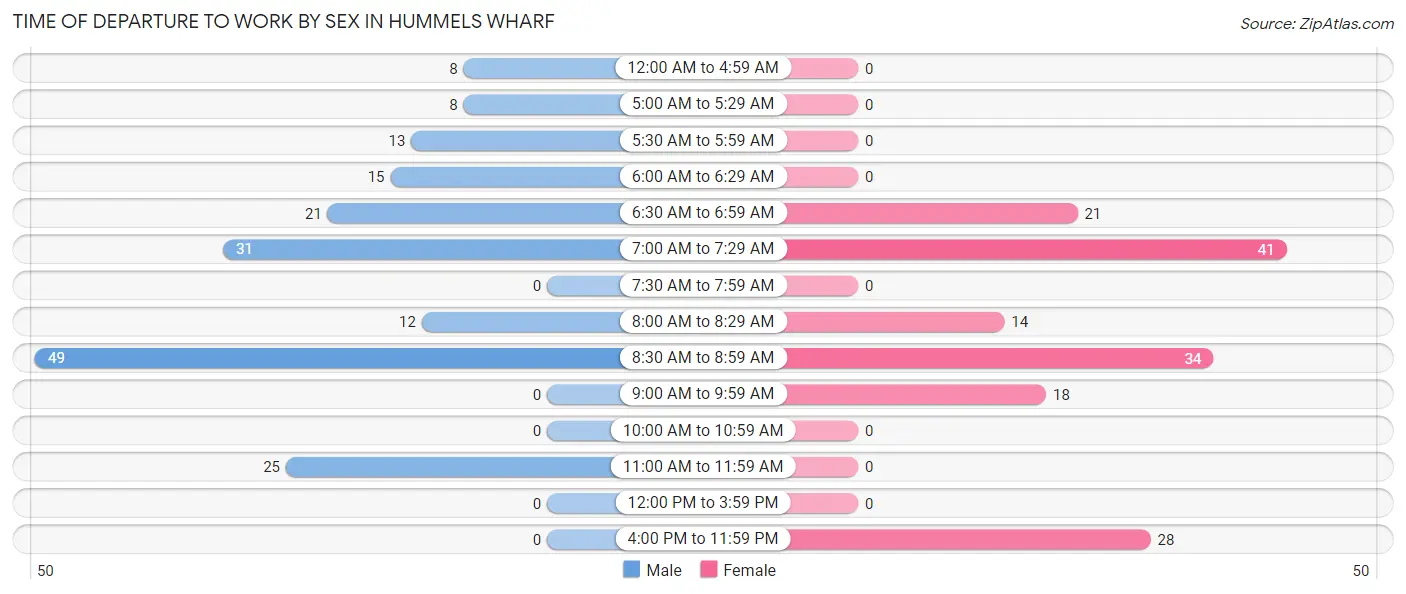
| Time of Departure | Male | Female |
| 12:00 AM to 4:59 AM | 8 (4.4%) | 0 (0.0%) |
| 5:00 AM to 5:29 AM | 8 (4.4%) | 0 (0.0%) |
| 5:30 AM to 5:59 AM | 13 (7.1%) | 0 (0.0%) |
| 6:00 AM to 6:29 AM | 15 (8.2%) | 0 (0.0%) |
| 6:30 AM to 6:59 AM | 21 (11.5%) | 21 (13.5%) |
| 7:00 AM to 7:29 AM | 31 (17.0%) | 41 (26.3%) |
| 7:30 AM to 7:59 AM | 0 (0.0%) | 0 (0.0%) |
| 8:00 AM to 8:29 AM | 12 (6.6%) | 14 (9.0%) |
| 8:30 AM to 8:59 AM | 49 (26.9%) | 34 (21.8%) |
| 9:00 AM to 9:59 AM | 0 (0.0%) | 18 (11.5%) |
| 10:00 AM to 10:59 AM | 0 (0.0%) | 0 (0.0%) |
| 11:00 AM to 11:59 AM | 25 (13.7%) | 0 (0.0%) |
| 12:00 PM to 3:59 PM | 0 (0.0%) | 0 (0.0%) |
| 4:00 PM to 11:59 PM | 0 (0.0%) | 28 (17.9%) |
| Total | 182 (100.0%) | 156 (100.0%) |
Housing Occupancy in Hummels Wharf
Occupancy by Ownership in Hummels Wharf
Of the total 373 dwellings in Hummels Wharf, owner-occupied units account for 256 (68.6%), while renter-occupied units make up 117 (31.4%).
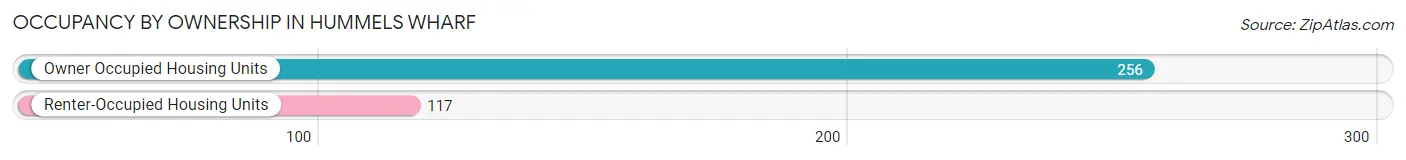
| Occupancy | # Housing Units | % Housing Units |
| Owner Occupied Housing Units | 256 | 68.6% |
| Renter-Occupied Housing Units | 117 | 31.4% |
| Total Occupied Housing Units | 373 | 100.0% |
Occupancy by Household Size in Hummels Wharf
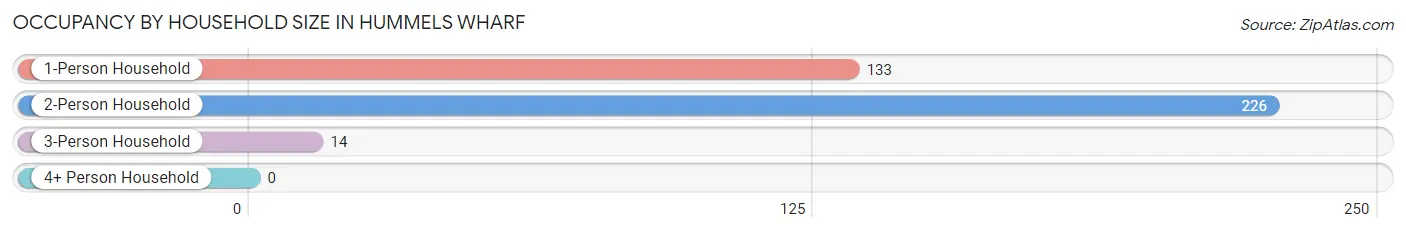
| Household Size | # Housing Units | % Housing Units |
| 1-Person Household | 133 | 35.7% |
| 2-Person Household | 226 | 60.6% |
| 3-Person Household | 14 | 3.7% |
| 4+ Person Household | 0 | 0.0% |
| Total Housing Units | 373 | 100.0% |
Occupancy by Ownership by Household Size in Hummels Wharf
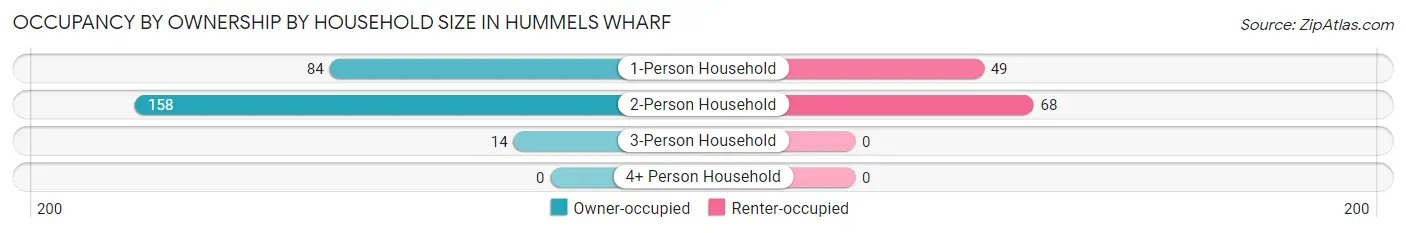
| Household Size | Owner-occupied | Renter-occupied |
| 1-Person Household | 84 (63.2%) | 49 (36.8%) |
| 2-Person Household | 158 (69.9%) | 68 (30.1%) |
| 3-Person Household | 14 (100.0%) | 0 (0.0%) |
| 4+ Person Household | 0 (0.0%) | 0 (0.0%) |
| Total Housing Units | 256 (68.6%) | 117 (31.4%) |
Occupancy by Educational Attainment in Hummels Wharf
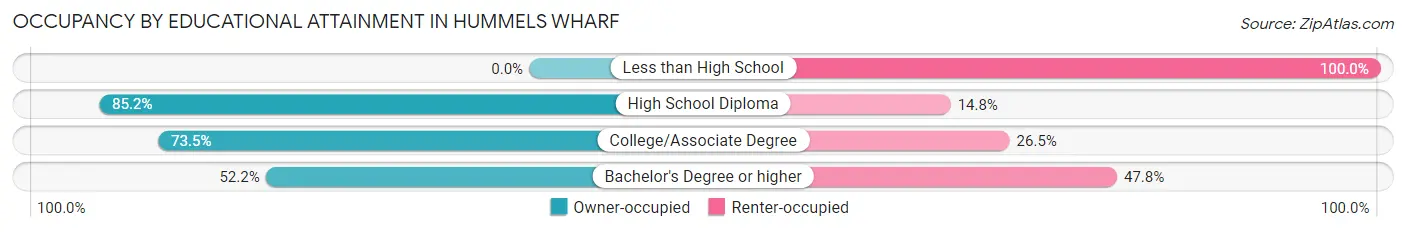
| Household Size | Owner-occupied | Renter-occupied |
| Less than High School | 0 (0.0%) | 42 (100.0%) |
| High School Diploma | 196 (85.2%) | 34 (14.8%) |
| College/Associate Degree | 25 (73.5%) | 9 (26.5%) |
| Bachelor's Degree or higher | 35 (52.2%) | 32 (47.8%) |
Occupancy by Age of Householder in Hummels Wharf
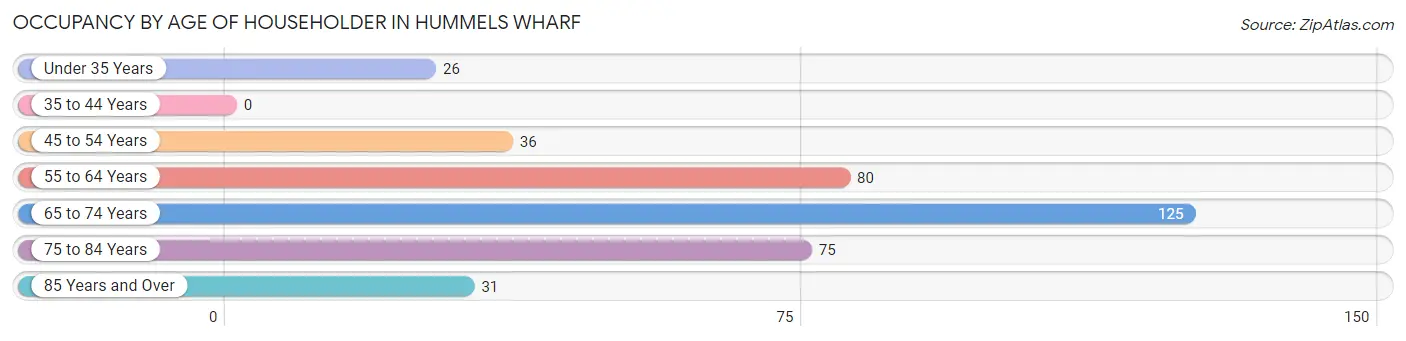
| Age Bracket | # Households | % Households |
| Under 35 Years | 26 | 7.0% |
| 35 to 44 Years | 0 | 0.0% |
| 45 to 54 Years | 36 | 9.7% |
| 55 to 64 Years | 80 | 21.4% |
| 65 to 74 Years | 125 | 33.5% |
| 75 to 84 Years | 75 | 20.1% |
| 85 Years and Over | 31 | 8.3% |
| Total | 373 | 100.0% |
Housing Finances in Hummels Wharf
Median Income by Occupancy in Hummels Wharf
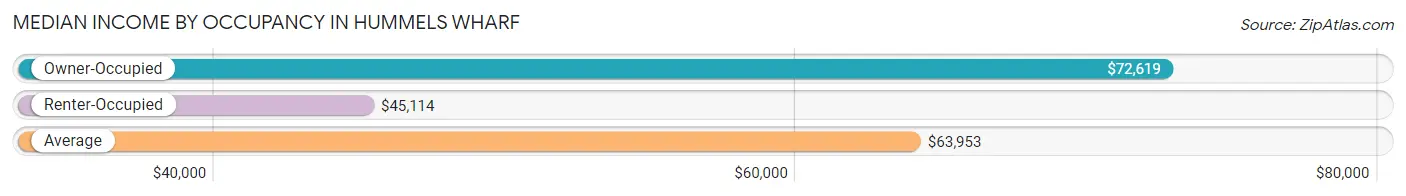
| Occupancy Type | # Households | Median Income |
| Owner-Occupied | 256 (68.6%) | $72,619 |
| Renter-Occupied | 117 (31.4%) | $45,114 |
| Average | 373 (100.0%) | $63,953 |
Occupancy by Householder Income Bracket in Hummels Wharf
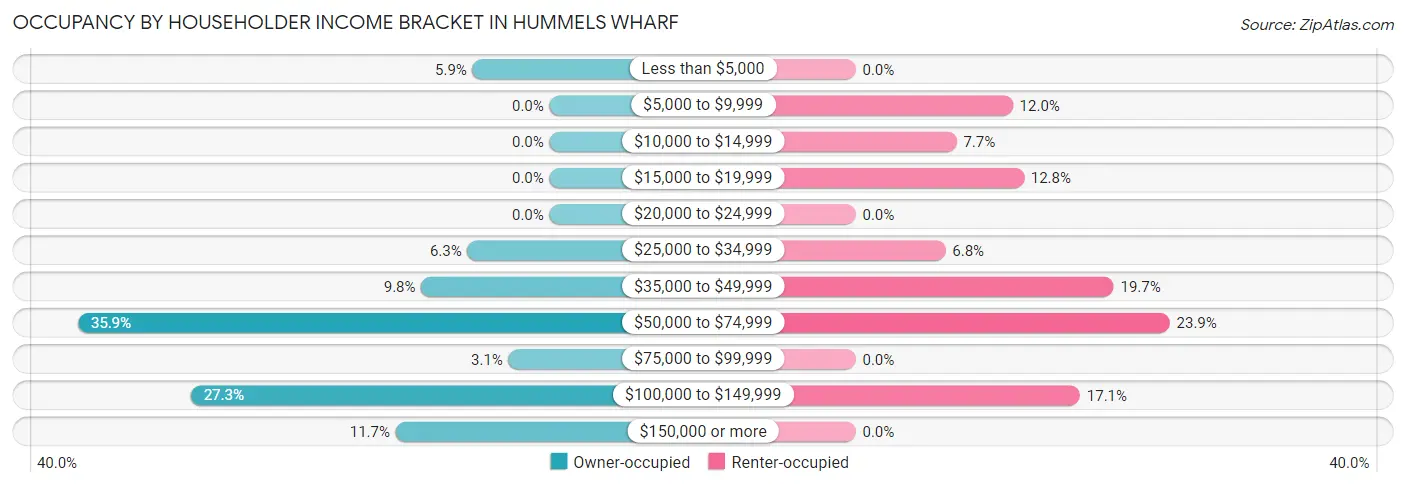
| Income Bracket | Owner-occupied | Renter-occupied |
| Less than $5,000 | 15 (5.9%) | 0 (0.0%) |
| $5,000 to $9,999 | 0 (0.0%) | 14 (12.0%) |
| $10,000 to $14,999 | 0 (0.0%) | 9 (7.7%) |
| $15,000 to $19,999 | 0 (0.0%) | 15 (12.8%) |
| $20,000 to $24,999 | 0 (0.0%) | 0 (0.0%) |
| $25,000 to $34,999 | 16 (6.2%) | 8 (6.8%) |
| $35,000 to $49,999 | 25 (9.8%) | 23 (19.7%) |
| $50,000 to $74,999 | 92 (35.9%) | 28 (23.9%) |
| $75,000 to $99,999 | 8 (3.1%) | 0 (0.0%) |
| $100,000 to $149,999 | 70 (27.3%) | 20 (17.1%) |
| $150,000 or more | 30 (11.7%) | 0 (0.0%) |
| Total | 256 (100.0%) | 117 (100.0%) |
Monthly Housing Cost Tiers in Hummels Wharf
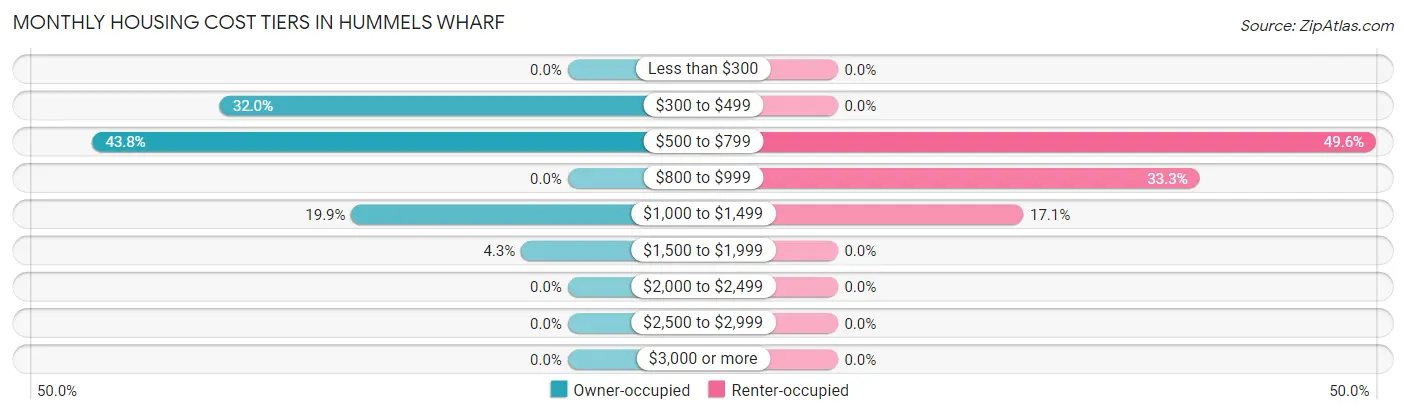
| Monthly Cost | Owner-occupied | Renter-occupied |
| Less than $300 | 0 (0.0%) | 0 (0.0%) |
| $300 to $499 | 82 (32.0%) | 0 (0.0%) |
| $500 to $799 | 112 (43.8%) | 58 (49.6%) |
| $800 to $999 | 0 (0.0%) | 39 (33.3%) |
| $1,000 to $1,499 | 51 (19.9%) | 20 (17.1%) |
| $1,500 to $1,999 | 11 (4.3%) | 0 (0.0%) |
| $2,000 to $2,499 | 0 (0.0%) | 0 (0.0%) |
| $2,500 to $2,999 | 0 (0.0%) | 0 (0.0%) |
| $3,000 or more | 0 (0.0%) | 0 (0.0%) |
| Total | 256 (100.0%) | 117 (100.0%) |
Physical Housing Characteristics in Hummels Wharf
Housing Structures in Hummels Wharf
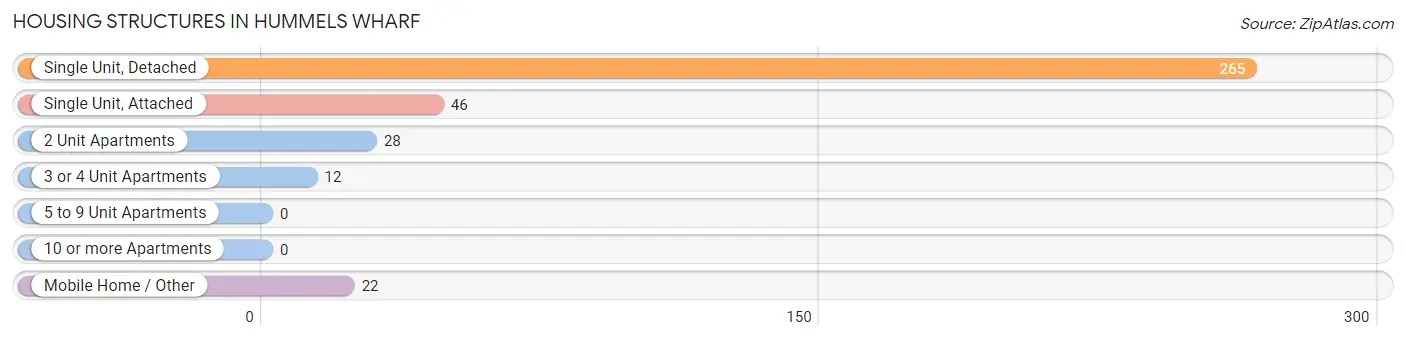
| Structure Type | # Housing Units | % Housing Units |
| Single Unit, Detached | 265 | 71.1% |
| Single Unit, Attached | 46 | 12.3% |
| 2 Unit Apartments | 28 | 7.5% |
| 3 or 4 Unit Apartments | 12 | 3.2% |
| 5 to 9 Unit Apartments | 0 | 0.0% |
| 10 or more Apartments | 0 | 0.0% |
| Mobile Home / Other | 22 | 5.9% |
| Total | 373 | 100.0% |
Housing Structures by Occupancy in Hummels Wharf
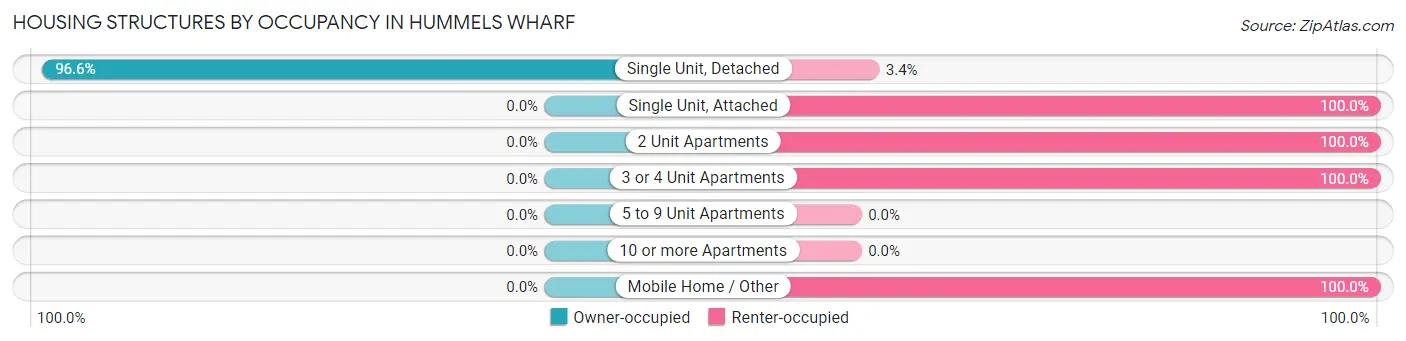
| Structure Type | Owner-occupied | Renter-occupied |
| Single Unit, Detached | 256 (96.6%) | 9 (3.4%) |
| Single Unit, Attached | 0 (0.0%) | 46 (100.0%) |
| 2 Unit Apartments | 0 (0.0%) | 28 (100.0%) |
| 3 or 4 Unit Apartments | 0 (0.0%) | 12 (100.0%) |
| 5 to 9 Unit Apartments | 0 (0.0%) | 0 (0.0%) |
| 10 or more Apartments | 0 (0.0%) | 0 (0.0%) |
| Mobile Home / Other | 0 (0.0%) | 22 (100.0%) |
| Total | 256 (68.6%) | 117 (31.4%) |
Housing Structures by Number of Rooms in Hummels Wharf
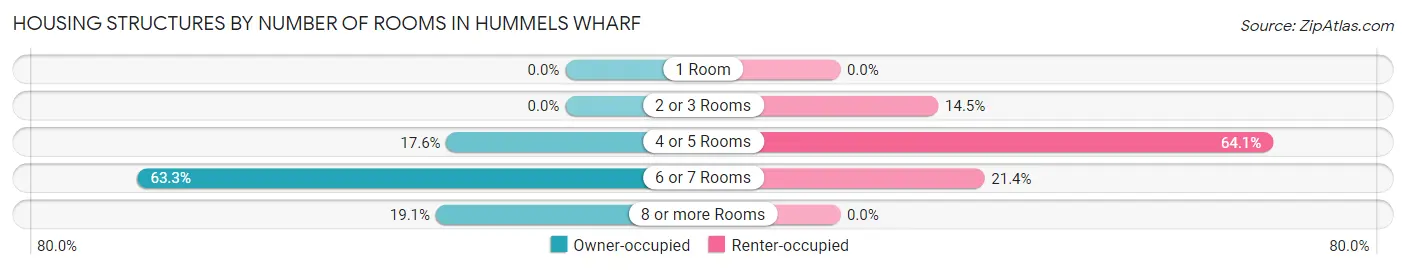
| Number of Rooms | Owner-occupied | Renter-occupied |
| 1 Room | 0 (0.0%) | 0 (0.0%) |
| 2 or 3 Rooms | 0 (0.0%) | 17 (14.5%) |
| 4 or 5 Rooms | 45 (17.6%) | 75 (64.1%) |
| 6 or 7 Rooms | 162 (63.3%) | 25 (21.4%) |
| 8 or more Rooms | 49 (19.1%) | 0 (0.0%) |
| Total | 256 (100.0%) | 117 (100.0%) |
Housing Structure by Heating Type in Hummels Wharf
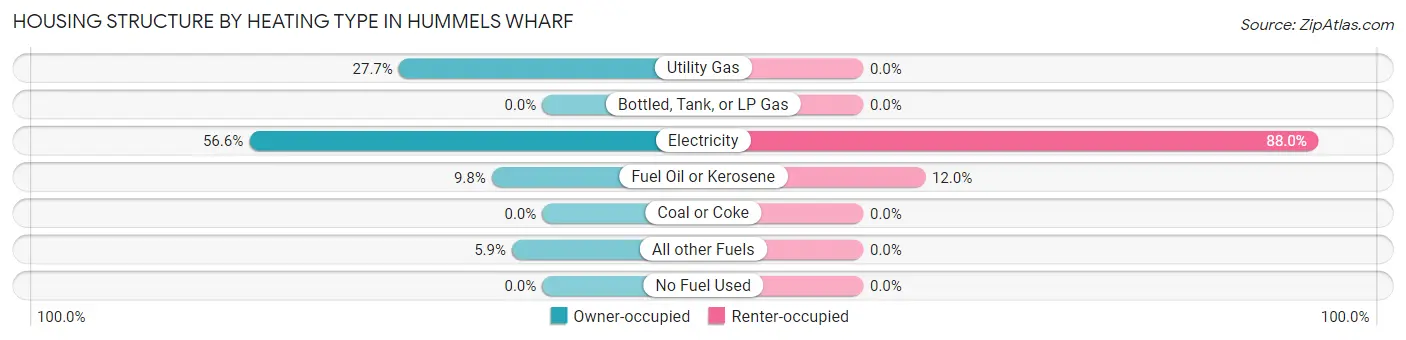
| Heating Type | Owner-occupied | Renter-occupied |
| Utility Gas | 71 (27.7%) | 0 (0.0%) |
| Bottled, Tank, or LP Gas | 0 (0.0%) | 0 (0.0%) |
| Electricity | 145 (56.6%) | 103 (88.0%) |
| Fuel Oil or Kerosene | 25 (9.8%) | 14 (12.0%) |
| Coal or Coke | 0 (0.0%) | 0 (0.0%) |
| All other Fuels | 15 (5.9%) | 0 (0.0%) |
| No Fuel Used | 0 (0.0%) | 0 (0.0%) |
| Total | 256 (100.0%) | 117 (100.0%) |
Household Vehicle Usage in Hummels Wharf
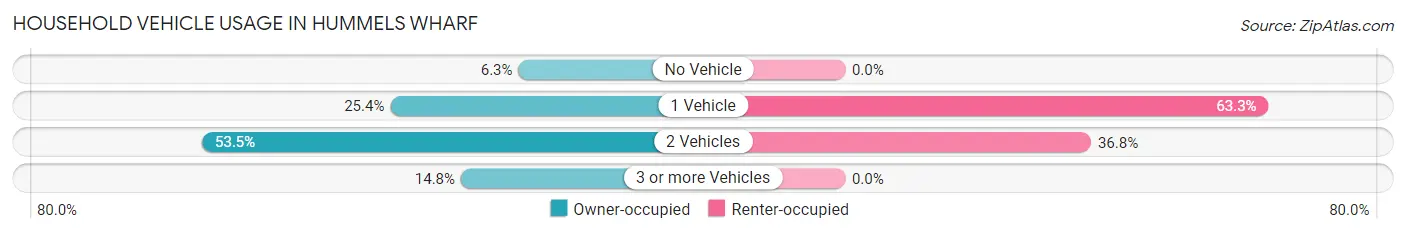
| Vehicles per Household | Owner-occupied | Renter-occupied |
| No Vehicle | 16 (6.2%) | 0 (0.0%) |
| 1 Vehicle | 65 (25.4%) | 74 (63.2%) |
| 2 Vehicles | 137 (53.5%) | 43 (36.7%) |
| 3 or more Vehicles | 38 (14.8%) | 0 (0.0%) |
| Total | 256 (100.0%) | 117 (100.0%) |
Real Estate & Mortgages in Hummels Wharf
Real Estate and Mortgage Overview in Hummels Wharf
| Characteristic | Without Mortgage | With Mortgage |
| Housing Units | 194 | 62 |
| Median Property Value | $181,600 | $156,300 |
| Median Household Income | $68,750 | $17 |
| Monthly Housing Costs | $560 | $0 |
| Real Estate Taxes | $2,290 | $0 |
Property Value by Mortgage Status in Hummels Wharf
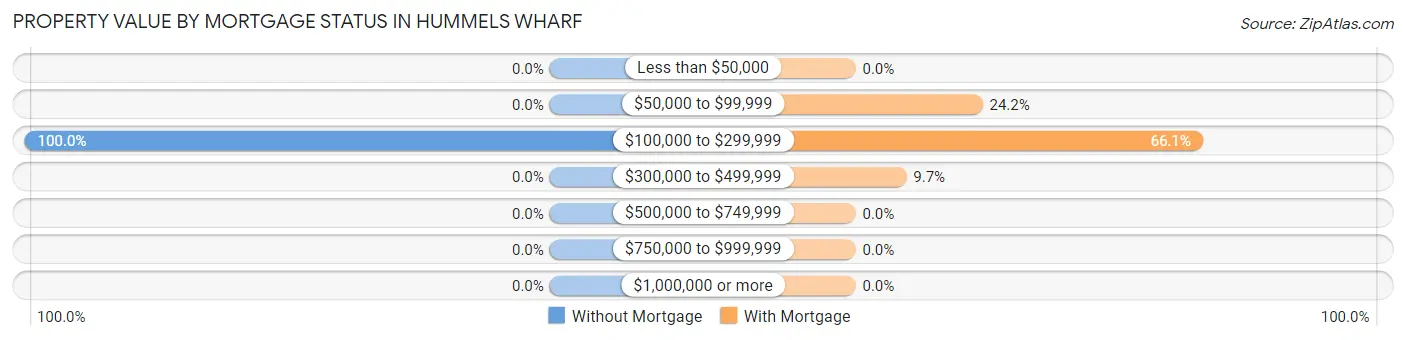
| Property Value | Without Mortgage | With Mortgage |
| Less than $50,000 | 0 (0.0%) | 0 (0.0%) |
| $50,000 to $99,999 | 0 (0.0%) | 15 (24.2%) |
| $100,000 to $299,999 | 194 (100.0%) | 41 (66.1%) |
| $300,000 to $499,999 | 0 (0.0%) | 6 (9.7%) |
| $500,000 to $749,999 | 0 (0.0%) | 0 (0.0%) |
| $750,000 to $999,999 | 0 (0.0%) | 0 (0.0%) |
| $1,000,000 or more | 0 (0.0%) | 0 (0.0%) |
| Total | 194 (100.0%) | 62 (100.0%) |
Household Income by Mortgage Status in Hummels Wharf
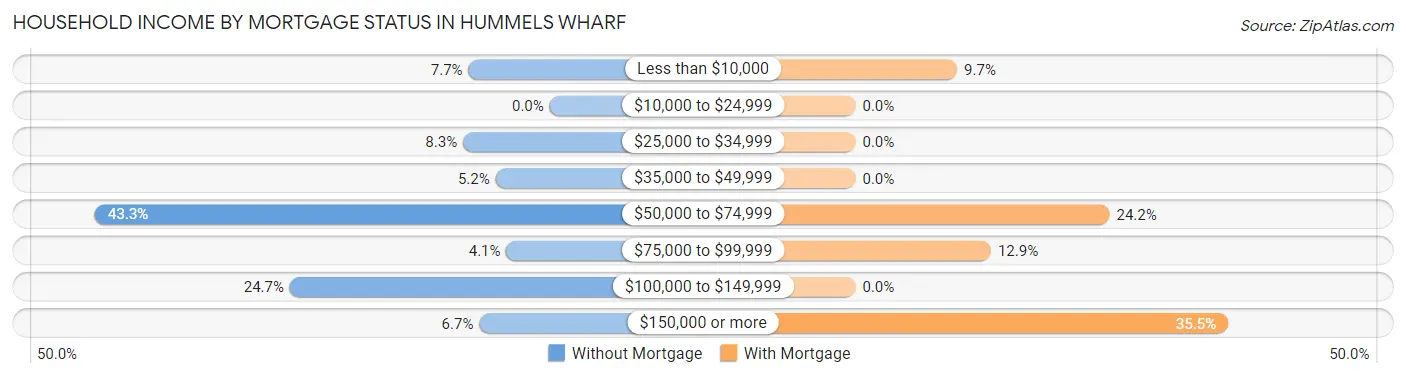
| Household Income | Without Mortgage | With Mortgage |
| Less than $10,000 | 15 (7.7%) | 6 (9.7%) |
| $10,000 to $24,999 | 0 (0.0%) | 0 (0.0%) |
| $25,000 to $34,999 | 16 (8.3%) | 0 (0.0%) |
| $35,000 to $49,999 | 10 (5.1%) | 0 (0.0%) |
| $50,000 to $74,999 | 84 (43.3%) | 15 (24.2%) |
| $75,000 to $99,999 | 8 (4.1%) | 8 (12.9%) |
| $100,000 to $149,999 | 48 (24.7%) | 0 (0.0%) |
| $150,000 or more | 13 (6.7%) | 22 (35.5%) |
| Total | 194 (100.0%) | 62 (100.0%) |
Property Value to Household Income Ratio in Hummels Wharf
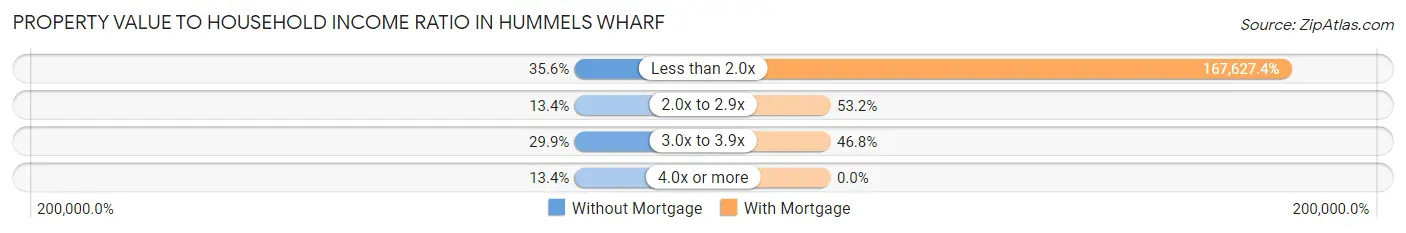
| Value-to-Income Ratio | Without Mortgage | With Mortgage |
| Less than 2.0x | 69 (35.6%) | 103,929 (167,627.4%) |
| 2.0x to 2.9x | 26 (13.4%) | 33 (53.2%) |
| 3.0x to 3.9x | 58 (29.9%) | 29 (46.8%) |
| 4.0x or more | 26 (13.4%) | 0 (0.0%) |
| Total | 194 (100.0%) | 62 (100.0%) |
Real Estate Taxes by Mortgage Status in Hummels Wharf
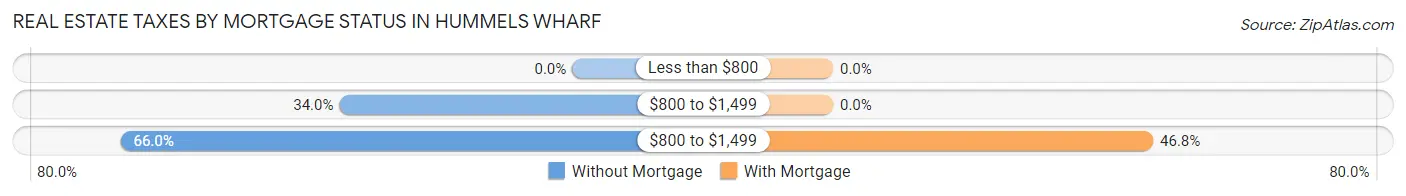
| Property Taxes | Without Mortgage | With Mortgage |
| Less than $800 | 0 (0.0%) | 0 (0.0%) |
| $800 to $1,499 | 66 (34.0%) | 0 (0.0%) |
| $800 to $1,499 | 128 (66.0%) | 29 (46.8%) |
| Total | 194 (100.0%) | 62 (100.0%) |
Health & Disability in Hummels Wharf
Health Insurance Coverage by Age in Hummels Wharf
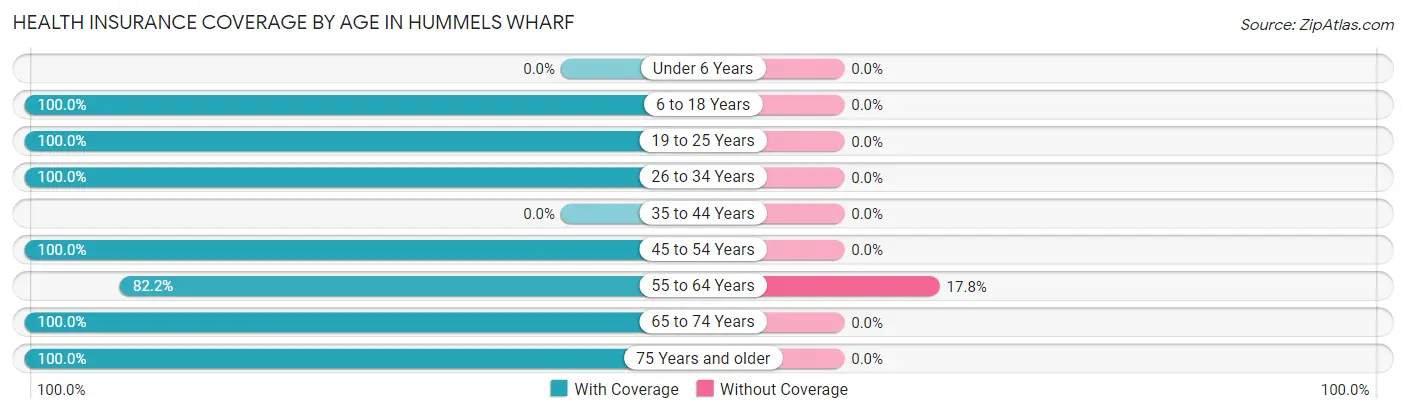
| Age Bracket | With Coverage | Without Coverage |
| Under 6 Years | 0 (0.0%) | 0 (0.0%) |
| 6 to 18 Years | 37 (100.0%) | 0 (0.0%) |
| 19 to 25 Years | 31 (100.0%) | 0 (0.0%) |
| 26 to 34 Years | 53 (100.0%) | 0 (0.0%) |
| 35 to 44 Years | 0 (0.0%) | 0 (0.0%) |
| 45 to 54 Years | 75 (100.0%) | 0 (0.0%) |
| 55 to 64 Years | 111 (82.2%) | 24 (17.8%) |
| 65 to 74 Years | 177 (100.0%) | 0 (0.0%) |
| 75 Years and older | 146 (100.0%) | 0 (0.0%) |
| Total | 630 (96.3%) | 24 (3.7%) |
Health Insurance Coverage by Citizenship Status in Hummels Wharf
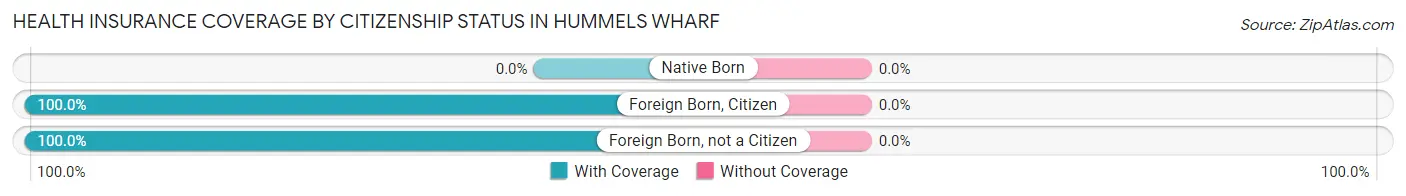
| Citizenship Status | With Coverage | Without Coverage |
| Native Born | 0 (0.0%) | 0 (0.0%) |
| Foreign Born, Citizen | 37 (100.0%) | 0 (0.0%) |
| Foreign Born, not a Citizen | 31 (100.0%) | 0 (0.0%) |
Health Insurance Coverage by Household Income in Hummels Wharf
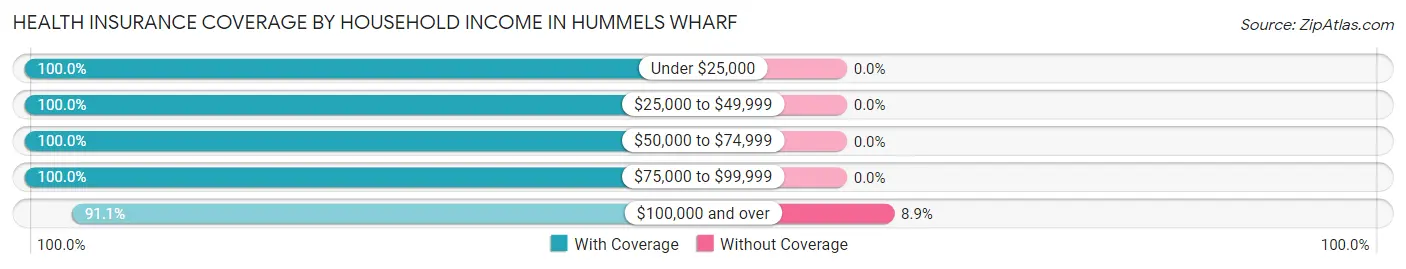
| Household Income | With Coverage | Without Coverage |
| Under $25,000 | 62 (100.0%) | 0 (0.0%) |
| $25,000 to $49,999 | 109 (100.0%) | 0 (0.0%) |
| $50,000 to $74,999 | 204 (100.0%) | 0 (0.0%) |
| $75,000 to $99,999 | 8 (100.0%) | 0 (0.0%) |
| $100,000 and over | 247 (91.1%) | 24 (8.9%) |
Public vs Private Health Insurance Coverage by Age in Hummels Wharf
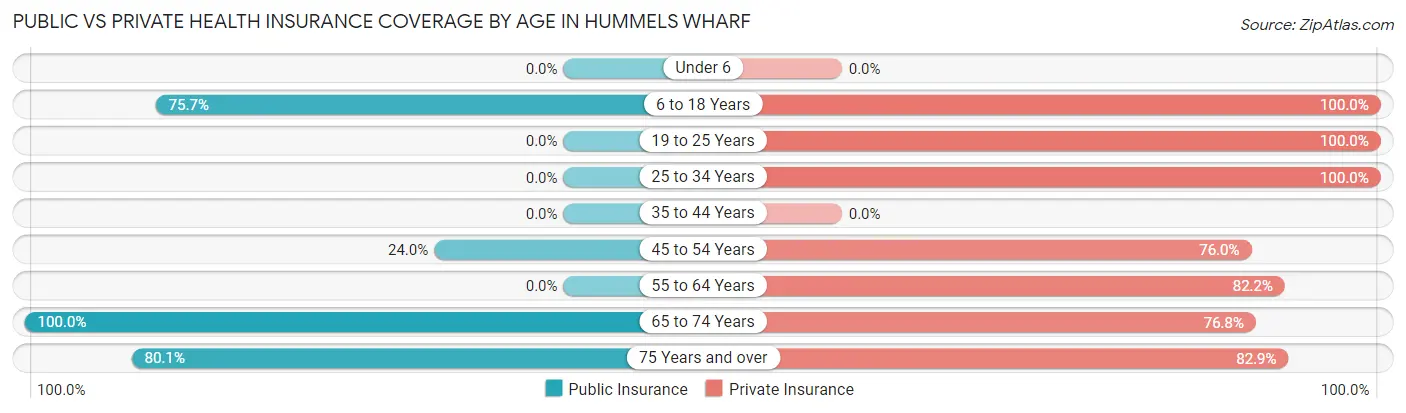
| Age Bracket | Public Insurance | Private Insurance |
| Under 6 | 0 (0.0%) | 0 (0.0%) |
| 6 to 18 Years | 28 (75.7%) | 37 (100.0%) |
| 19 to 25 Years | 0 (0.0%) | 31 (100.0%) |
| 25 to 34 Years | 0 (0.0%) | 53 (100.0%) |
| 35 to 44 Years | 0 (0.0%) | 0 (0.0%) |
| 45 to 54 Years | 18 (24.0%) | 57 (76.0%) |
| 55 to 64 Years | 0 (0.0%) | 111 (82.2%) |
| 65 to 74 Years | 177 (100.0%) | 136 (76.8%) |
| 75 Years and over | 117 (80.1%) | 121 (82.9%) |
| Total | 340 (52.0%) | 546 (83.5%) |
Disability Status by Sex by Age in Hummels Wharf
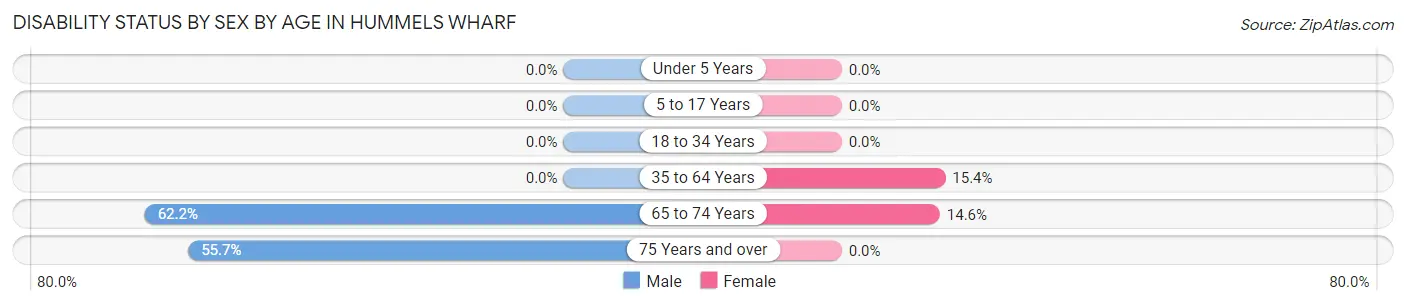
| Age Bracket | Male | Female |
| Under 5 Years | 0 (0.0%) | 0 (0.0%) |
| 5 to 17 Years | 0 (0.0%) | 0 (0.0%) |
| 18 to 34 Years | 0 (0.0%) | 0 (0.0%) |
| 35 to 64 Years | 0 (0.0%) | 18 (15.4%) |
| 65 to 74 Years | 46 (62.2%) | 15 (14.6%) |
| 75 Years and over | 44 (55.7%) | 0 (0.0%) |
Disability Class by Sex by Age in Hummels Wharf
Disability Class: Hearing Difficulty
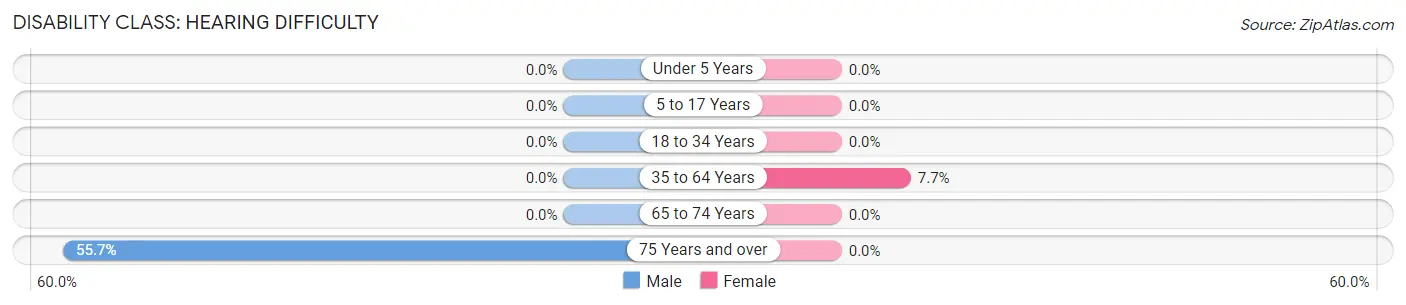
| Age Bracket | Male | Female |
| Under 5 Years | 0 (0.0%) | 0 (0.0%) |
| 5 to 17 Years | 0 (0.0%) | 0 (0.0%) |
| 18 to 34 Years | 0 (0.0%) | 0 (0.0%) |
| 35 to 64 Years | 0 (0.0%) | 9 (7.7%) |
| 65 to 74 Years | 0 (0.0%) | 0 (0.0%) |
| 75 Years and over | 44 (55.7%) | 0 (0.0%) |
Disability Class: Vision Difficulty
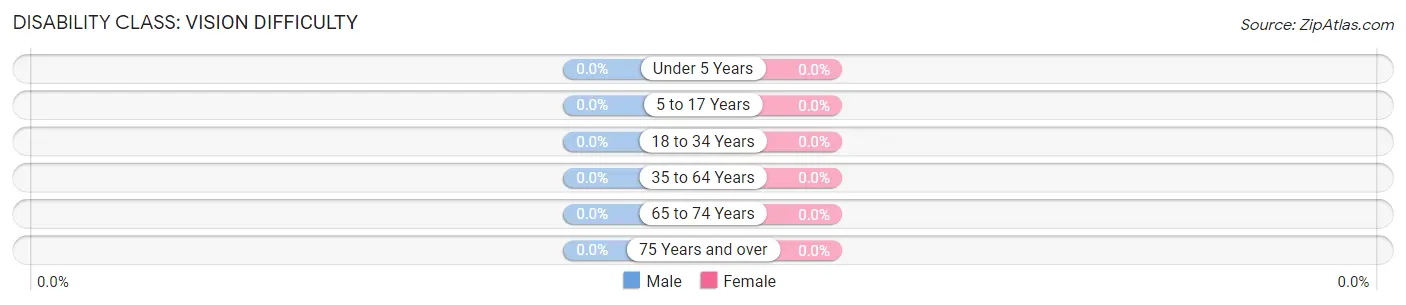
| Age Bracket | Male | Female |
| Under 5 Years | 0 (0.0%) | 0 (0.0%) |
| 5 to 17 Years | 0 (0.0%) | 0 (0.0%) |
| 18 to 34 Years | 0 (0.0%) | 0 (0.0%) |
| 35 to 64 Years | 0 (0.0%) | 0 (0.0%) |
| 65 to 74 Years | 0 (0.0%) | 0 (0.0%) |
| 75 Years and over | 0 (0.0%) | 0 (0.0%) |
Disability Class: Cognitive Difficulty
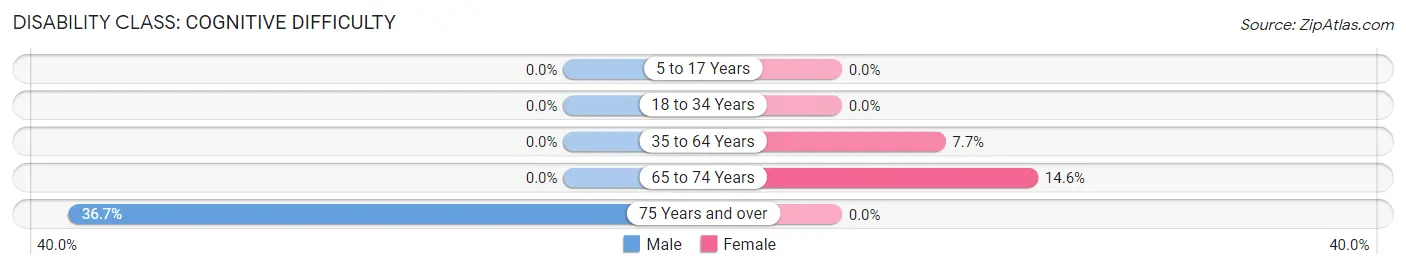
| Age Bracket | Male | Female |
| 5 to 17 Years | 0 (0.0%) | 0 (0.0%) |
| 18 to 34 Years | 0 (0.0%) | 0 (0.0%) |
| 35 to 64 Years | 0 (0.0%) | 9 (7.7%) |
| 65 to 74 Years | 0 (0.0%) | 15 (14.6%) |
| 75 Years and over | 29 (36.7%) | 0 (0.0%) |
Disability Class: Ambulatory Difficulty
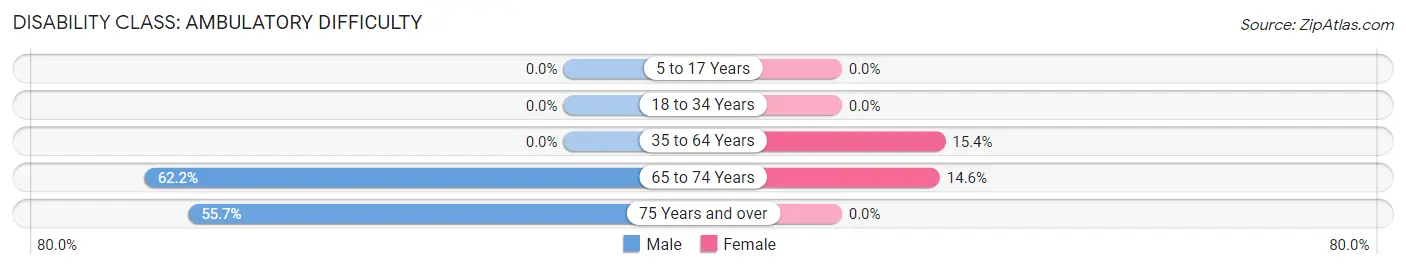
| Age Bracket | Male | Female |
| 5 to 17 Years | 0 (0.0%) | 0 (0.0%) |
| 18 to 34 Years | 0 (0.0%) | 0 (0.0%) |
| 35 to 64 Years | 0 (0.0%) | 18 (15.4%) |
| 65 to 74 Years | 46 (62.2%) | 15 (14.6%) |
| 75 Years and over | 44 (55.7%) | 0 (0.0%) |
Disability Class: Self-Care Difficulty
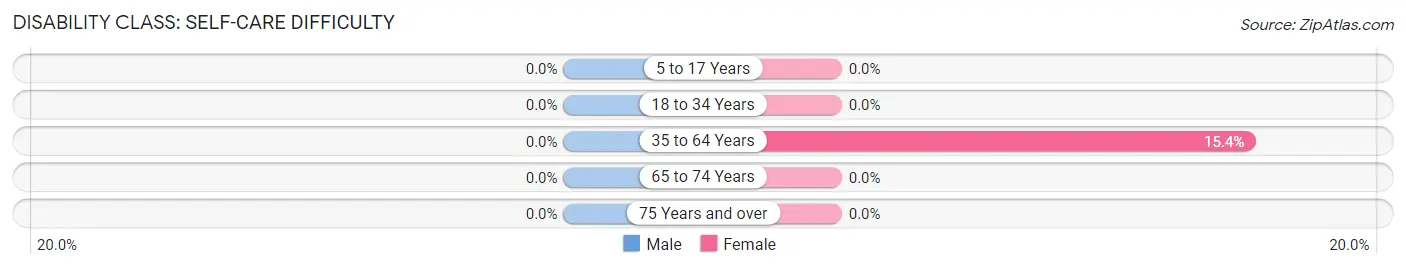
| Age Bracket | Male | Female |
| 5 to 17 Years | 0 (0.0%) | 0 (0.0%) |
| 18 to 34 Years | 0 (0.0%) | 0 (0.0%) |
| 35 to 64 Years | 0 (0.0%) | 18 (15.4%) |
| 65 to 74 Years | 0 (0.0%) | 0 (0.0%) |
| 75 Years and over | 0 (0.0%) | 0 (0.0%) |
Technology Access in Hummels Wharf
Computing Device Access in Hummels Wharf
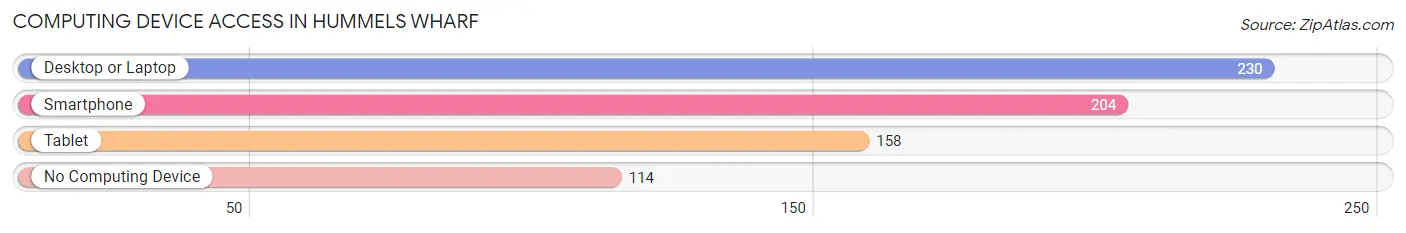
| Device Type | # Households | % Households |
| Desktop or Laptop | 230 | 61.7% |
| Smartphone | 204 | 54.7% |
| Tablet | 158 | 42.4% |
| No Computing Device | 114 | 30.6% |
| Total | 373 | 100.0% |
Internet Access in Hummels Wharf
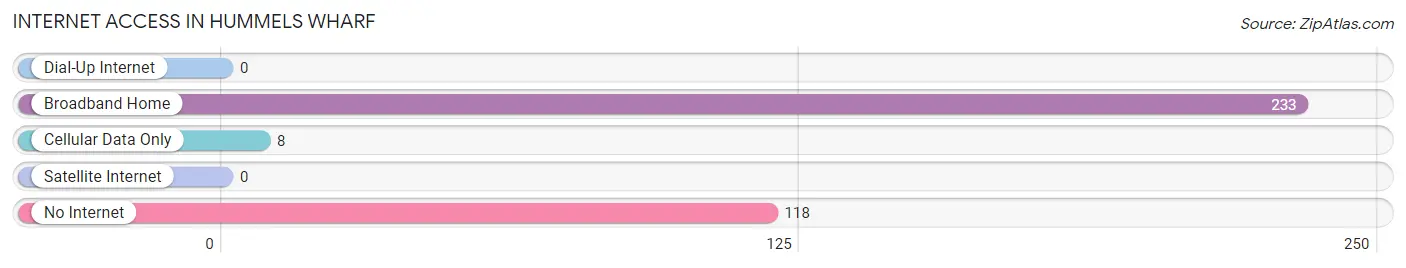
| Internet Type | # Households | % Households |
| Dial-Up Internet | 0 | 0.0% |
| Broadband Home | 233 | 62.5% |
| Cellular Data Only | 8 | 2.1% |
| Satellite Internet | 0 | 0.0% |
| No Internet | 118 | 31.6% |
| Total | 373 | 100.0% |
Hummels Wharf Summary
Hummels Wharf is a small borough located in Snyder County, Pennsylvania. It is situated along the Susquehanna River, approximately five miles south of Selinsgrove. The population of Hummels Wharf was 1,093 at the 2010 census.
History
Hummels Wharf was founded in 1845 by John Hummel, a German immigrant who had settled in the area in 1835. He purchased a tract of land along the Susquehanna River and built a wharf and store. The wharf was used to transport goods and passengers between the Susquehanna and Juniata Rivers. The town was named after Hummel and was incorporated in 1876.
In the late 19th century, Hummels Wharf was a thriving river port. The town was home to several businesses, including a sawmill, gristmill, and a brickyard. The town also had a hotel, a post office, and several stores.
In the early 20th century, the town began to decline as the river trade declined. The last passenger boat to leave Hummels Wharf was in the 1930s. The town was also bypassed by the railroad, which had a major impact on the local economy.
Geography
Hummels Wharf is located at 40°45'45" North, 76°51'45" West (40.7625, -76.8625). It is situated along the Susquehanna River, approximately five miles south of Selinsgrove. The borough has a total area of 0.3 square miles, all of which is land.
Economy
Hummels Wharf is a small, rural community with a limited economy. The town is home to several small businesses, including a convenience store, a restaurant, and a few other retail stores. The town also has a few light industrial businesses.
The town is also home to a number of farms, which produce a variety of crops, including corn, soybeans, and hay. The town also has a few small wineries and vineyards.
Demographics
As of the 2010 census, there were 1,093 people, 441 households, and 298 families residing in the borough. The population density was 3,633.3 people per square mile. The racial makeup of the borough was 97.7% White, 0.5% African American, 0.2% Native American, 0.2% Asian, 0.1% from other races, and 1.3% from two or more races. Hispanic or Latino of any race were 0.7% of the population.
The median age in the borough was 43.2 years. 22.2% of residents were under the age of 18; 6.7% were between the ages of 18 and 24; 24.2% were from 25 to 44; 30.2% were from 45 to 64; and 16.7% were 65 years of age or older. The gender makeup of the borough was 48.2% male and 51.8% female.
The median income for a household in the borough was $41,250, and the median income for a family was $50,000. Males had a median income of $35,000 versus $25,000 for females. The per capita income for the borough was $20,845. About 5.2% of families and 8.2% of the population were below the poverty line, including 10.2% of those under age 18 and 8.3% of those age 65 or over.
Common Questions
What is Per Capita Income in Hummels Wharf?
Per Capita income in Hummels Wharf is $44,700.
What is the Median Family Income in Hummels Wharf?
Median Family Income in Hummels Wharf is $68,920.
What is the Median Household income in Hummels Wharf?
Median Household Income in Hummels Wharf is $63,953.
What is Income or Wage Gap in Hummels Wharf?
Income or Wage Gap in Hummels Wharf is 15.4%.
Women in Hummels Wharf earn 84.6 cents for every dollar earned by a man.
What is Inequality or Gini Index in Hummels Wharf?
Inequality or Gini Index in Hummels Wharf is 0.37.
What is the Total Population of Hummels Wharf?
Total Population of Hummels Wharf is 654.
What is the Total Male Population of Hummels Wharf?
Total Male Population of Hummels Wharf is 344.
What is the Total Female Population of Hummels Wharf?
Total Female Population of Hummels Wharf is 310.
What is the Ratio of Males per 100 Females in Hummels Wharf?
There are 110.97 Males per 100 Females in Hummels Wharf.
What is the Ratio of Females per 100 Males in Hummels Wharf?
There are 90.12 Females per 100 Males in Hummels Wharf.
What is the Median Population Age in Hummels Wharf?
Median Population Age in Hummels Wharf is 62.6 Years.
What is the Average Family Size in Hummels Wharf
Average Family Size in Hummels Wharf is 2.2 People.
What is the Average Household Size in Hummels Wharf
Average Household Size in Hummels Wharf is 1.8 People.
How Large is the Labor Force in Hummels Wharf?
There are 353 People in the Labor Forcein in Hummels Wharf.
What is the Percentage of People in the Labor Force in Hummels Wharf?
56.4% of People are in the Labor Force in Hummels Wharf.