Hebron, PA Map & Demographics
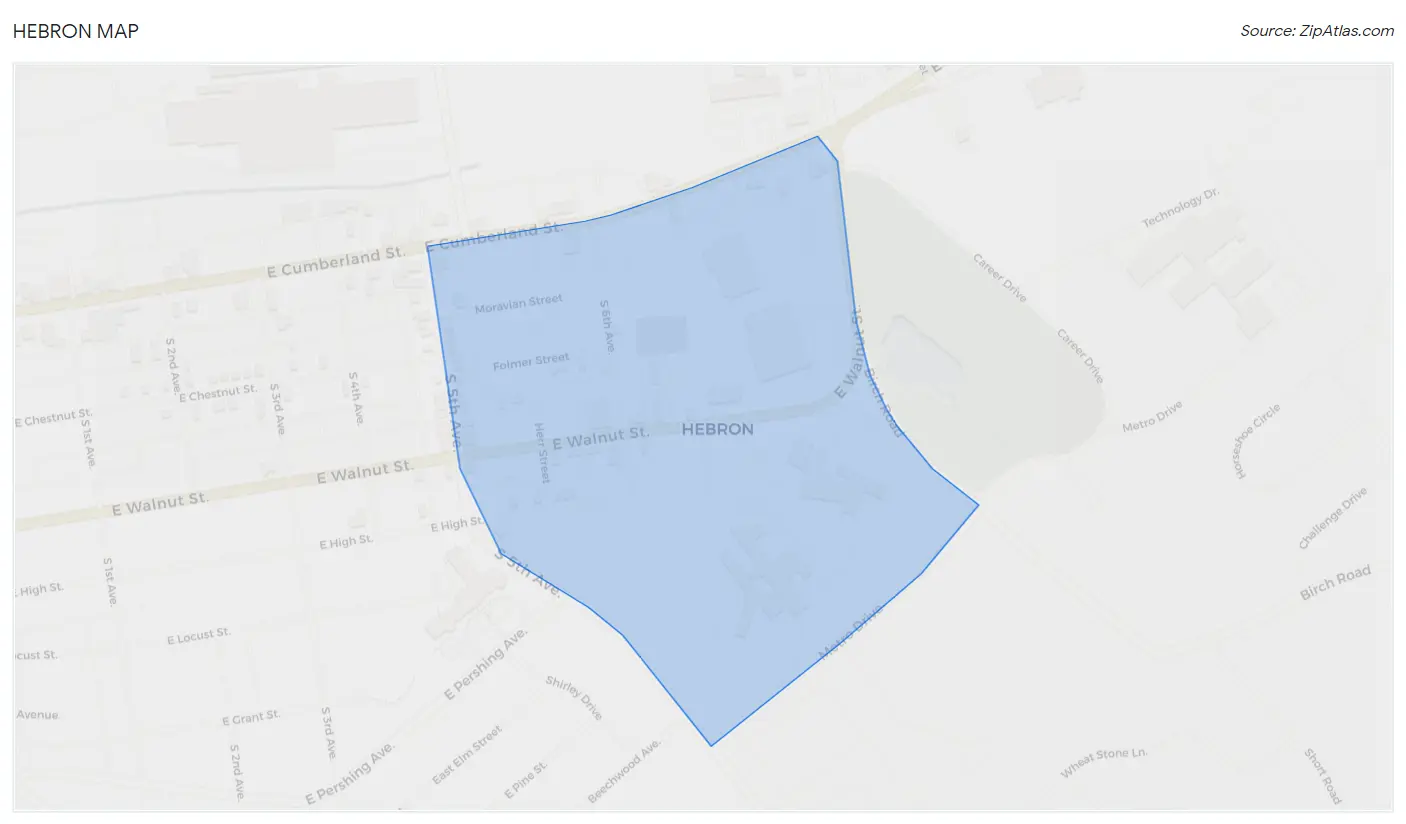
Hebron Map
Hebron Overview
$25,593
PER CAPITA INCOME
$99,429
AVG FAMILY INCOME
$97,607
AVG HOUSEHOLD INCOME
18.8%
WAGE / INCOME GAP [ % ]
81.2¢/ $1
WAGE / INCOME GAP [ $ ]
0.23
INEQUALITY / GINI INDEX
1,080
TOTAL POPULATION
470
MALE POPULATION
610
FEMALE POPULATION
77.05
MALES / 100 FEMALES
129.79
FEMALES / 100 MALES
51.6
MEDIAN AGE
3.2
AVG FAMILY SIZE
2.9
AVG HOUSEHOLD SIZE
450
LABOR FORCE [ PEOPLE ]
48.3%
PERCENT IN LABOR FORCE
Income in Hebron
Income Overview in Hebron
Per Capita Income in Hebron is $25,593, while median incomes of families and households are $99,429 and $97,607 respectively.
| Characteristic | Number | Measure |
| Per Capita Income | 1,080 | $25,593 |
| Median Family Income | 184 | $99,429 |
| Mean Family Income | 184 | $93,929 |
| Median Household Income | 249 | $97,607 |
| Mean Household Income | 249 | $87,188 |
| Income Deficit | 184 | $0 |
| Wage / Income Gap (%) | 1,080 | 18.82% |
| Wage / Income Gap ($) | 1,080 | 81.18¢ per $1 |
| Gini / Inequality Index | 1,080 | 0.23 |
Earnings by Sex in Hebron
Average Earnings in Hebron are $38,289, $45,234 for men and $36,719 for women, a difference of 18.8%.
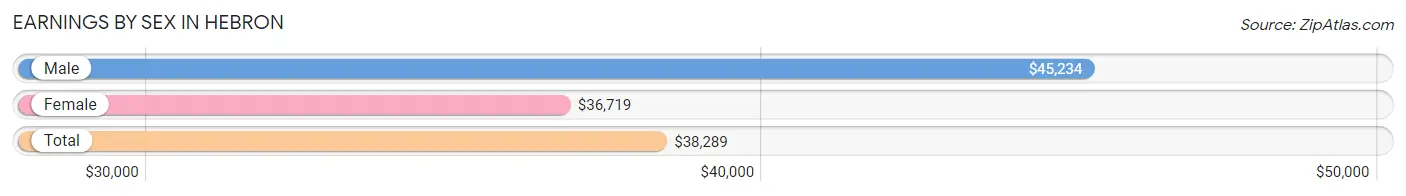
| Sex | Number | Average Earnings |
| Male | 243 (51.7%) | $45,234 |
| Female | 227 (48.3%) | $36,719 |
| Total | 470 (100.0%) | $38,289 |
Earnings by Sex by Income Bracket in Hebron
The most common earnings brackets in Hebron are $55,000 to $64,999 for men (46 | 18.9%) and $40,000 to $44,999 for women (51 | 22.5%).
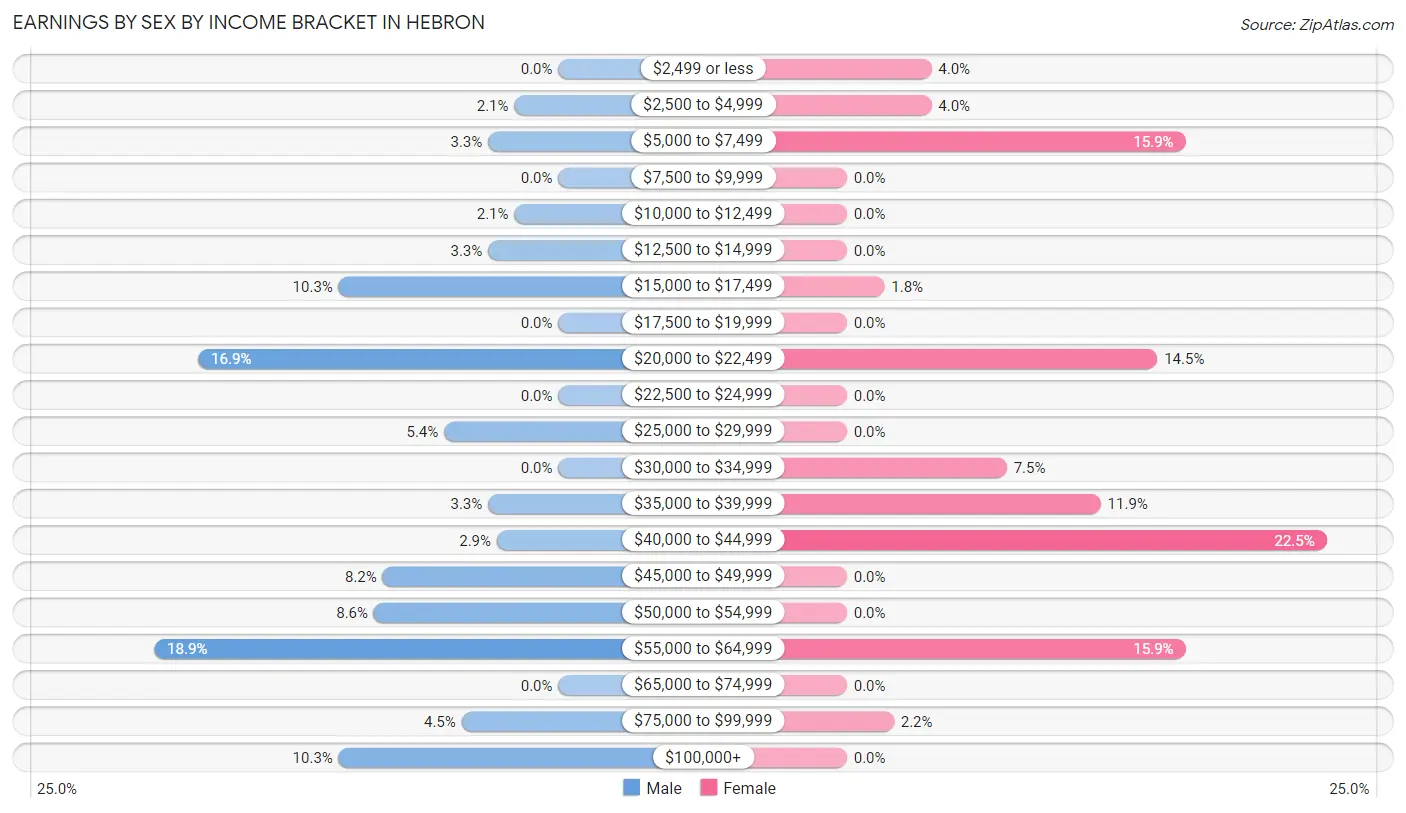
| Income | Male | Female |
| $2,499 or less | 0 (0.0%) | 9 (4.0%) |
| $2,500 to $4,999 | 5 (2.1%) | 9 (4.0%) |
| $5,000 to $7,499 | 8 (3.3%) | 36 (15.9%) |
| $7,500 to $9,999 | 0 (0.0%) | 0 (0.0%) |
| $10,000 to $12,499 | 5 (2.1%) | 0 (0.0%) |
| $12,500 to $14,999 | 8 (3.3%) | 0 (0.0%) |
| $15,000 to $17,499 | 25 (10.3%) | 4 (1.8%) |
| $17,500 to $19,999 | 0 (0.0%) | 0 (0.0%) |
| $20,000 to $22,499 | 41 (16.9%) | 33 (14.5%) |
| $22,500 to $24,999 | 0 (0.0%) | 0 (0.0%) |
| $25,000 to $29,999 | 13 (5.3%) | 0 (0.0%) |
| $30,000 to $34,999 | 0 (0.0%) | 17 (7.5%) |
| $35,000 to $39,999 | 8 (3.3%) | 27 (11.9%) |
| $40,000 to $44,999 | 7 (2.9%) | 51 (22.5%) |
| $45,000 to $49,999 | 20 (8.2%) | 0 (0.0%) |
| $50,000 to $54,999 | 21 (8.6%) | 0 (0.0%) |
| $55,000 to $64,999 | 46 (18.9%) | 36 (15.9%) |
| $65,000 to $74,999 | 0 (0.0%) | 0 (0.0%) |
| $75,000 to $99,999 | 11 (4.5%) | 5 (2.2%) |
| $100,000+ | 25 (10.3%) | 0 (0.0%) |
| Total | 243 (100.0%) | 227 (100.0%) |
Earnings by Sex by Educational Attainment in Hebron
Average earnings in Hebron are $54,940 for men and $39,276 for women, a difference of 28.5%. Men with an educational attainment of high school diploma enjoy the highest average annual earnings of $54,107, while those with high school diploma education earn the least with $54,107. Women with an educational attainment of high school diploma earn the most with the average annual earnings of $40,357, while those with college or associate's degree education have the smallest earnings of $31,103.
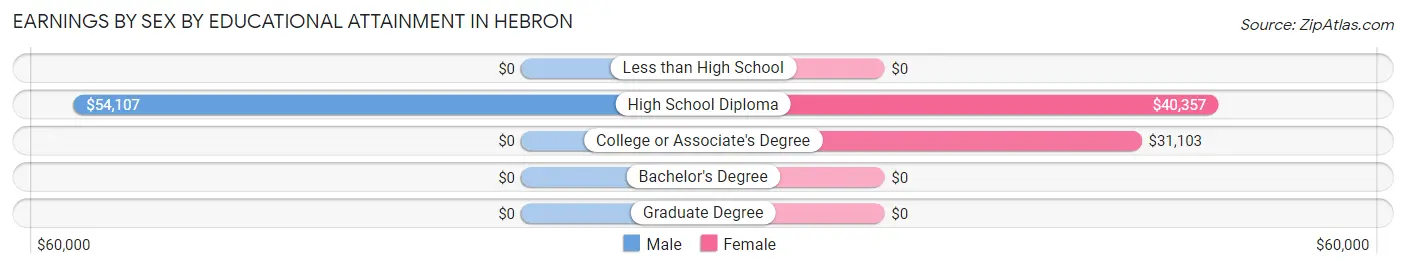
| Educational Attainment | Male Income | Female Income |
| Less than High School | - | - |
| High School Diploma | $54,107 | $40,357 |
| College or Associate's Degree | - | - |
| Bachelor's Degree | - | - |
| Graduate Degree | - | - |
| Total | $54,940 | $39,276 |
Family Income in Hebron
Family Income Brackets in Hebron
According to the Hebron family income data, there are 77 families falling into the $100,000 to $149,999 income range, which is the most common income bracket and makes up 41.8% of all families.
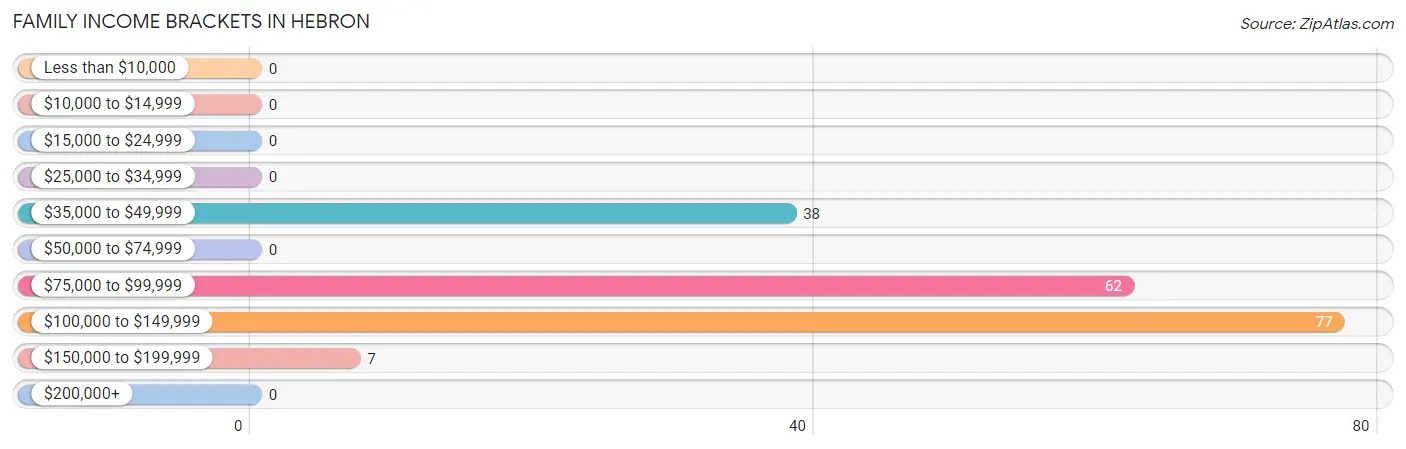
| Income Bracket | # Families | % Families |
| Less than $10,000 | 0 | 0.0% |
| $10,000 to $14,999 | 0 | 0.0% |
| $15,000 to $24,999 | 0 | 0.0% |
| $25,000 to $34,999 | 0 | 0.0% |
| $35,000 to $49,999 | 38 | 20.7% |
| $50,000 to $74,999 | 0 | 0.0% |
| $75,000 to $99,999 | 62 | 33.7% |
| $100,000 to $149,999 | 77 | 41.8% |
| $150,000 to $199,999 | 7 | 3.8% |
| $200,000+ | 0 | 0.0% |
Family Income by Famaliy Size in Hebron
5-person families (42 | 22.8%) account for the highest median family income in Hebron with $103,750 per family, while 3-person families (66 | 35.9%) have the highest median income of $33,305 per family member.
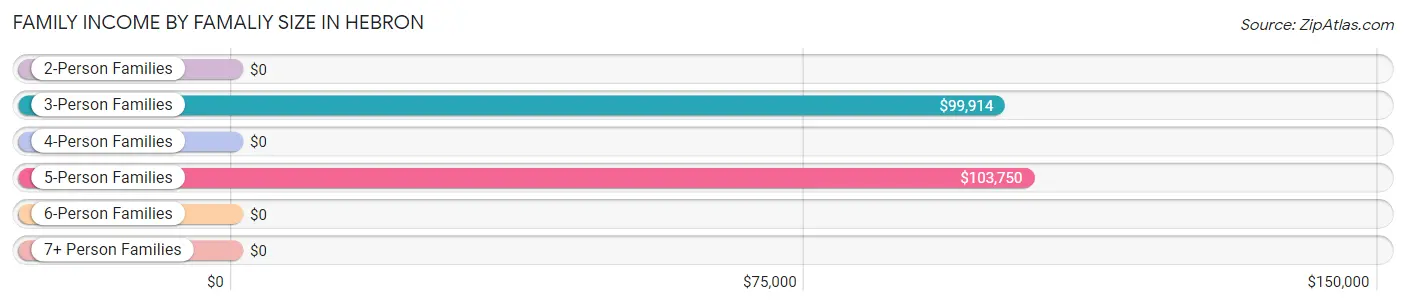
| Income Bracket | # Families | Median Income |
| 2-Person Families | 57 (31.0%) | $0 |
| 3-Person Families | 66 (35.9%) | $99,914 |
| 4-Person Families | 13 (7.1%) | $0 |
| 5-Person Families | 42 (22.8%) | $103,750 |
| 6-Person Families | 6 (3.3%) | $0 |
| 7+ Person Families | 0 (0.0%) | $0 |
| Total | 184 (100.0%) | $99,429 |
Family Income by Number of Earners in Hebron
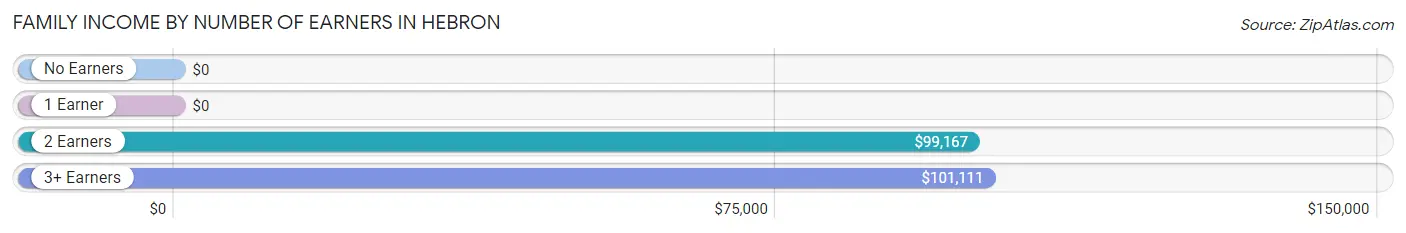
| Number of Earners | # Families | Median Income |
| No Earners | 5 (2.7%) | $0 |
| 1 Earner | 71 (38.6%) | $0 |
| 2 Earners | 42 (22.8%) | $99,167 |
| 3+ Earners | 66 (35.9%) | $101,111 |
| Total | 184 (100.0%) | $99,429 |
Household Income in Hebron
Household Income Brackets in Hebron
With 79 households falling in the category, the $100,000 to $149,999 income range is the most frequent in Hebron, accounting for 31.7% of all households.
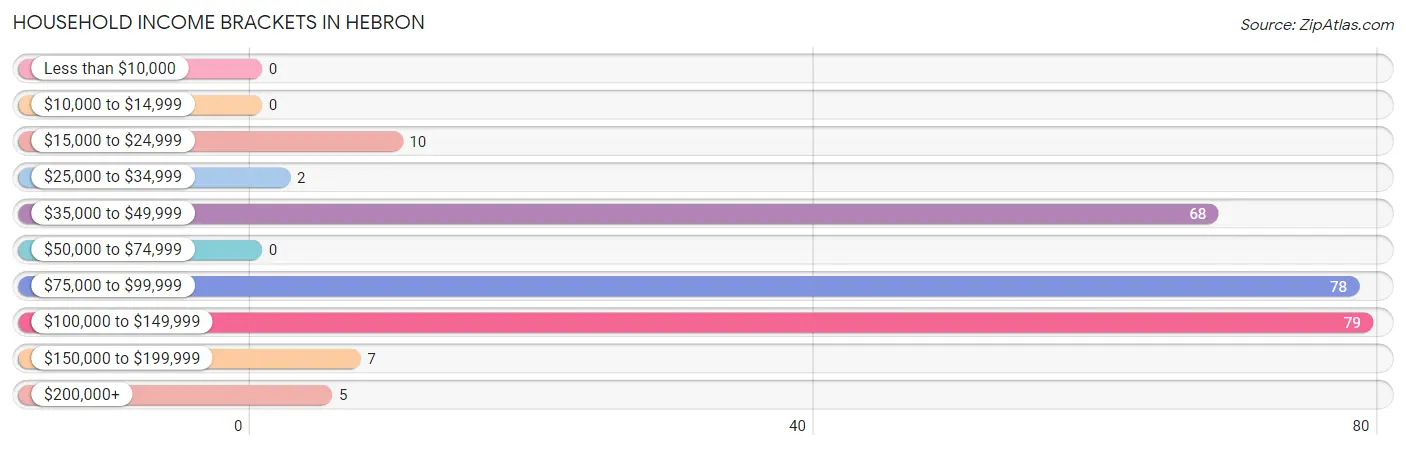
| Income Bracket | # Households | % Households |
| Less than $10,000 | 0 | 0.0% |
| $10,000 to $14,999 | 0 | 0.0% |
| $15,000 to $24,999 | 10 | 4.0% |
| $25,000 to $34,999 | 2 | 0.8% |
| $35,000 to $49,999 | 68 | 27.3% |
| $50,000 to $74,999 | 0 | 0.0% |
| $75,000 to $99,999 | 78 | 31.3% |
| $100,000 to $149,999 | 79 | 31.7% |
| $150,000 to $199,999 | 7 | 2.8% |
| $200,000+ | 5 | 2.0% |
Household Income by Householder Age in Hebron
The median household income in Hebron is $97,607, with the highest median household income of $105,357 found in the 25 to 44 years age bracket for the primary householder. A total of 46 households (18.5%) fall into this category. Meanwhile, the 15 to 24 years age bracket for the primary householder has the lowest median household income of $0, with 82 households (32.9%) in this group.
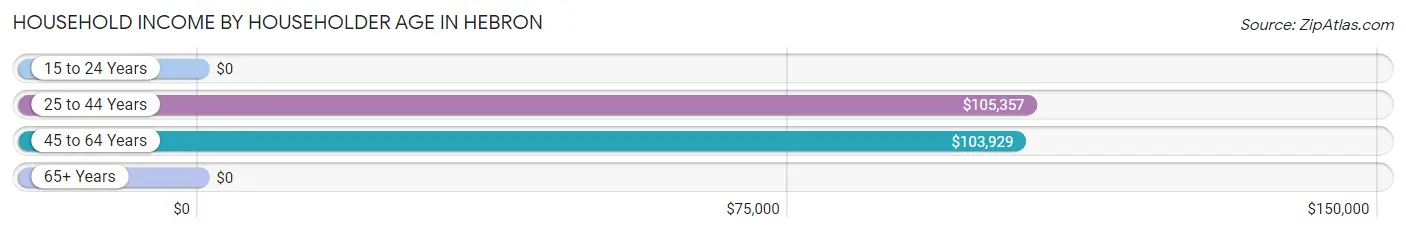
| Income Bracket | # Households | Median Income |
| 15 to 24 Years | 82 (32.9%) | $0 |
| 25 to 44 Years | 46 (18.5%) | $105,357 |
| 45 to 64 Years | 60 (24.1%) | $103,929 |
| 65+ Years | 61 (24.5%) | $0 |
| Total | 249 (100.0%) | $97,607 |
Poverty in Hebron
Income Below Poverty by Sex and Age in Hebron
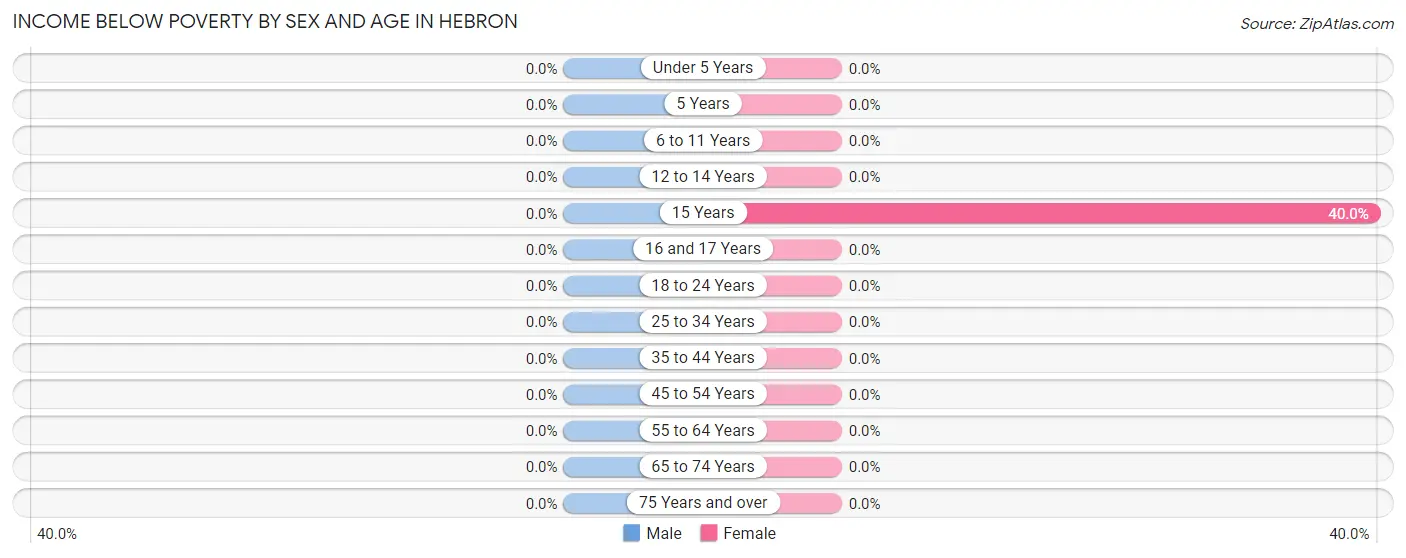
| Age Bracket | Male | Female |
| Under 5 Years | 0 (0.0%) | 0 (0.0%) |
| 5 Years | 0 (0.0%) | 0 (0.0%) |
| 6 to 11 Years | 0 (0.0%) | 0 (0.0%) |
| 12 to 14 Years | 0 (0.0%) | 0 (0.0%) |
| 15 Years | 0 (0.0%) | 2 (40.0%) |
| 16 and 17 Years | 0 (0.0%) | 0 (0.0%) |
| 18 to 24 Years | 0 (0.0%) | 0 (0.0%) |
| 25 to 34 Years | 0 (0.0%) | 0 (0.0%) |
| 35 to 44 Years | 0 (0.0%) | 0 (0.0%) |
| 45 to 54 Years | 0 (0.0%) | 0 (0.0%) |
| 55 to 64 Years | 0 (0.0%) | 0 (0.0%) |
| 65 to 74 Years | 0 (0.0%) | 0 (0.0%) |
| 75 Years and over | 0 (0.0%) | 0 (0.0%) |
| Total | 0 (0.0%) | 2 (0.5%) |
Income Above Poverty by Sex and Age in Hebron
According to the poverty statistics in Hebron, males aged under 5 years and females aged under 5 years are the age groups that are most secure financially, with 100.0% of males and 100.0% of females in these age groups living above the poverty line.
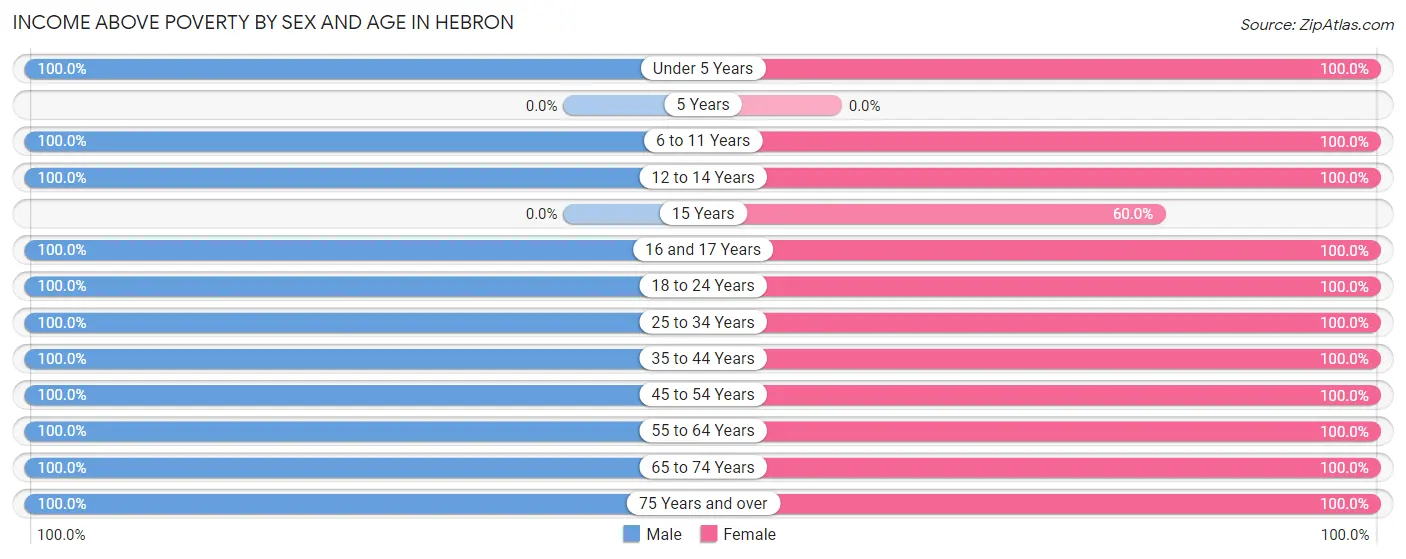
| Age Bracket | Male | Female |
| Under 5 Years | 38 (100.0%) | 38 (100.0%) |
| 5 Years | 0 (0.0%) | 0 (0.0%) |
| 6 to 11 Years | 23 (100.0%) | 34 (100.0%) |
| 12 to 14 Years | 6 (100.0%) | 4 (100.0%) |
| 15 Years | 0 (0.0%) | 3 (60.0%) |
| 16 and 17 Years | 9 (100.0%) | 4 (100.0%) |
| 18 to 24 Years | 61 (100.0%) | 86 (100.0%) |
| 25 to 34 Years | 15 (100.0%) | 12 (100.0%) |
| 35 to 44 Years | 53 (100.0%) | 45 (100.0%) |
| 45 to 54 Years | 54 (100.0%) | 27 (100.0%) |
| 55 to 64 Years | 31 (100.0%) | 76 (100.0%) |
| 65 to 74 Years | 17 (100.0%) | 44 (100.0%) |
| 75 Years and over | 12 (100.0%) | 30 (100.0%) |
| Total | 319 (100.0%) | 403 (99.5%) |
Income Below Poverty Among Married-Couple Families in Hebron
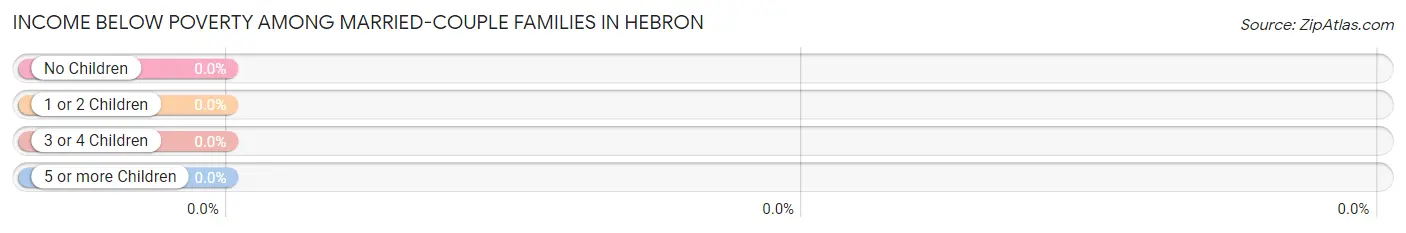
| Children | Above Poverty | Below Poverty |
| No Children | 38 (100.0%) | 0 (0.0%) |
| 1 or 2 Children | 4 (100.0%) | 0 (0.0%) |
| 3 or 4 Children | 32 (100.0%) | 0 (0.0%) |
| 5 or more Children | 0 (0.0%) | 0 (0.0%) |
| Total | 74 (100.0%) | 0 (0.0%) |
Income Below Poverty Among Single-Parent Households in Hebron
| Children | Single Father | Single Mother |
| No Children | 0 (0.0%) | 0 (0.0%) |
| 1 or 2 Children | 0 (0.0%) | 0 (0.0%) |
| 3 or 4 Children | 0 (0.0%) | 0 (0.0%) |
| 5 or more Children | 0 (0.0%) | 0 (0.0%) |
| Total | 0 (0.0%) | 0 (0.0%) |
Income Below Poverty Among Married-Couple vs Single-Parent Households in Hebron
| Children | Married-Couple Families | Single-Parent Households |
| No Children | 0 (0.0%) | 0 (0.0%) |
| 1 or 2 Children | 0 (0.0%) | 0 (0.0%) |
| 3 or 4 Children | 0 (0.0%) | 0 (0.0%) |
| 5 or more Children | 0 (0.0%) | 0 (0.0%) |
| Total | 0 (0.0%) | 0 (0.0%) |
Race in Hebron
The most populous races in Hebron are White / Caucasian (974 | 90.2%), Hispanic or Latino (91 | 8.4%), and Two or more Races (70 | 6.5%).
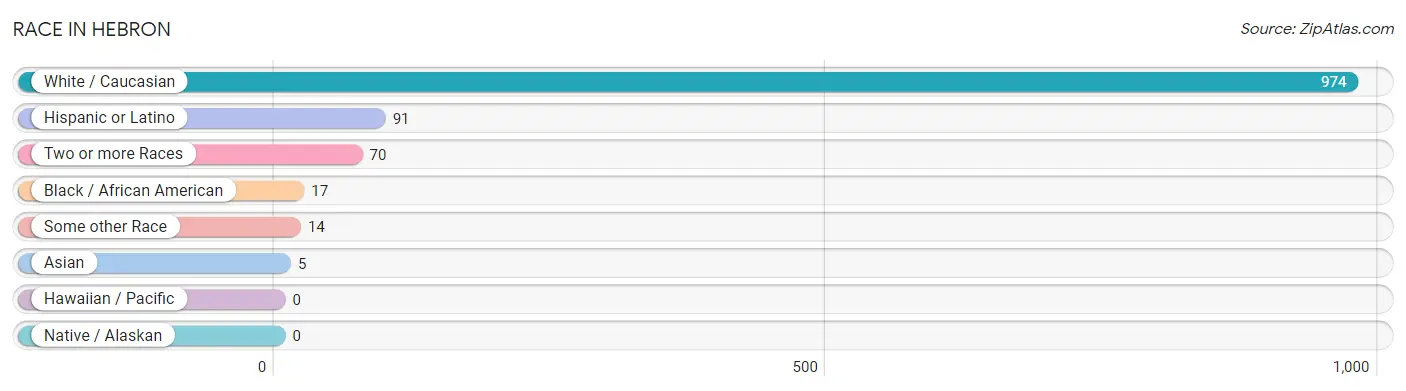
| Race | # Population | % Population |
| Asian | 5 | 0.5% |
| Black / African American | 17 | 1.6% |
| Hawaiian / Pacific | 0 | 0.0% |
| Hispanic or Latino | 91 | 8.4% |
| Native / Alaskan | 0 | 0.0% |
| White / Caucasian | 974 | 90.2% |
| Two or more Races | 70 | 6.5% |
| Some other Race | 14 | 1.3% |
| Total | 1,080 | 100.0% |
Ancestry in Hebron
The most populous ancestries reported in Hebron are German (319 | 29.5%), Irish (152 | 14.1%), Dominican (70 | 6.5%), Italian (35 | 3.2%), and English (31 | 2.9%), together accounting for 56.2% of all Hebron residents.
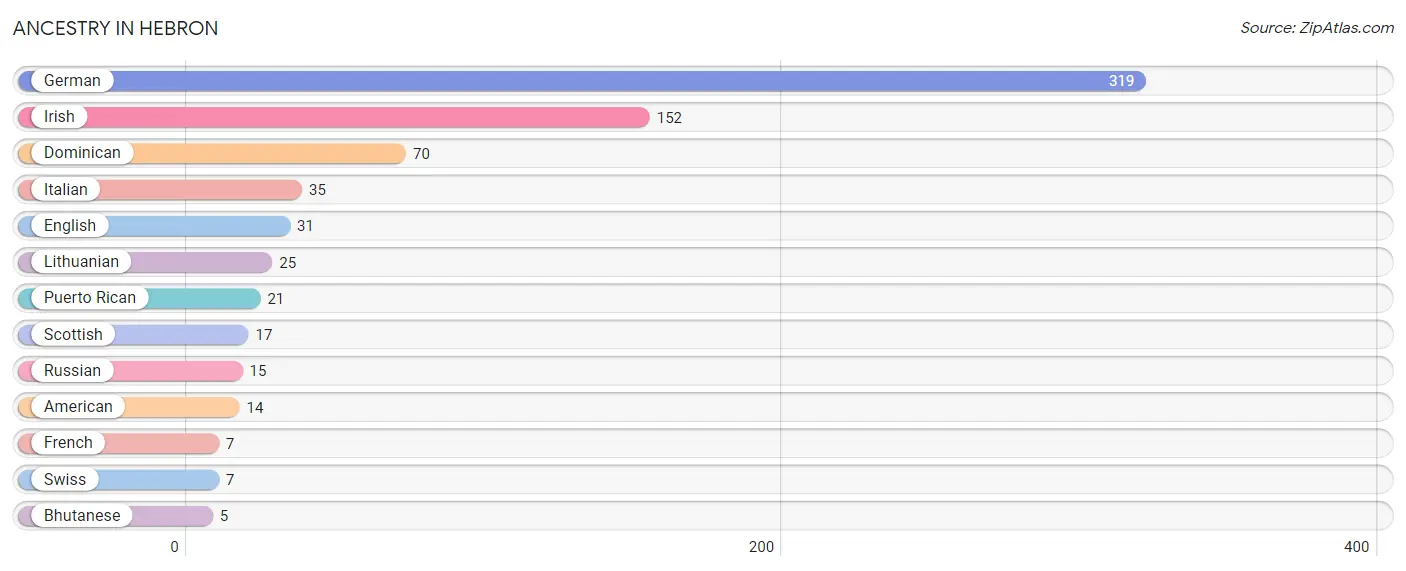
| Ancestry | # Population | % Population |
| American | 14 | 1.3% |
| Bhutanese | 5 | 0.5% |
| Dominican | 70 | 6.5% |
| English | 31 | 2.9% |
| French | 7 | 0.6% |
| German | 319 | 29.5% |
| Irish | 152 | 14.1% |
| Italian | 35 | 3.2% |
| Lithuanian | 25 | 2.3% |
| Puerto Rican | 21 | 1.9% |
| Russian | 15 | 1.4% |
| Scottish | 17 | 1.6% |
| Swiss | 7 | 0.6% | View All 13 Rows |
Immigrants in Hebron
The most numerous immigrant groups reported in Hebron came from Caribbean (46 | 4.3%), Dominican Republic (46 | 4.3%), Latin America (46 | 4.3%), Asia (5 | 0.5%), and Eastern Asia (5 | 0.5%), together accounting for 13.7% of all Hebron residents.
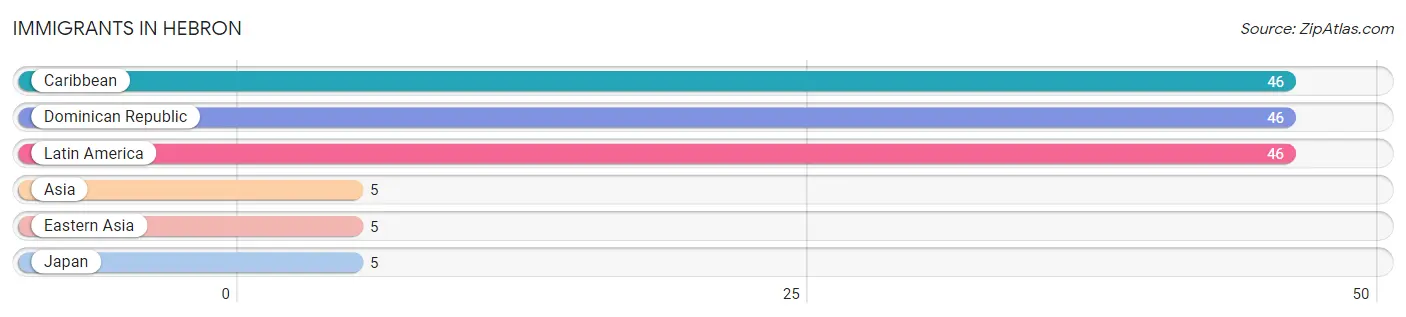
| Immigration Origin | # Population | % Population |
| Asia | 5 | 0.5% |
| Caribbean | 46 | 4.3% |
| Dominican Republic | 46 | 4.3% |
| Eastern Asia | 5 | 0.5% |
| Japan | 5 | 0.5% |
| Latin America | 46 | 4.3% | View All 6 Rows |
Sex and Age in Hebron
Sex and Age in Hebron
The most populous age groups in Hebron are 20 to 24 Years (63 | 13.4%) for men and 85 Years and over (114 | 18.7%) for women.
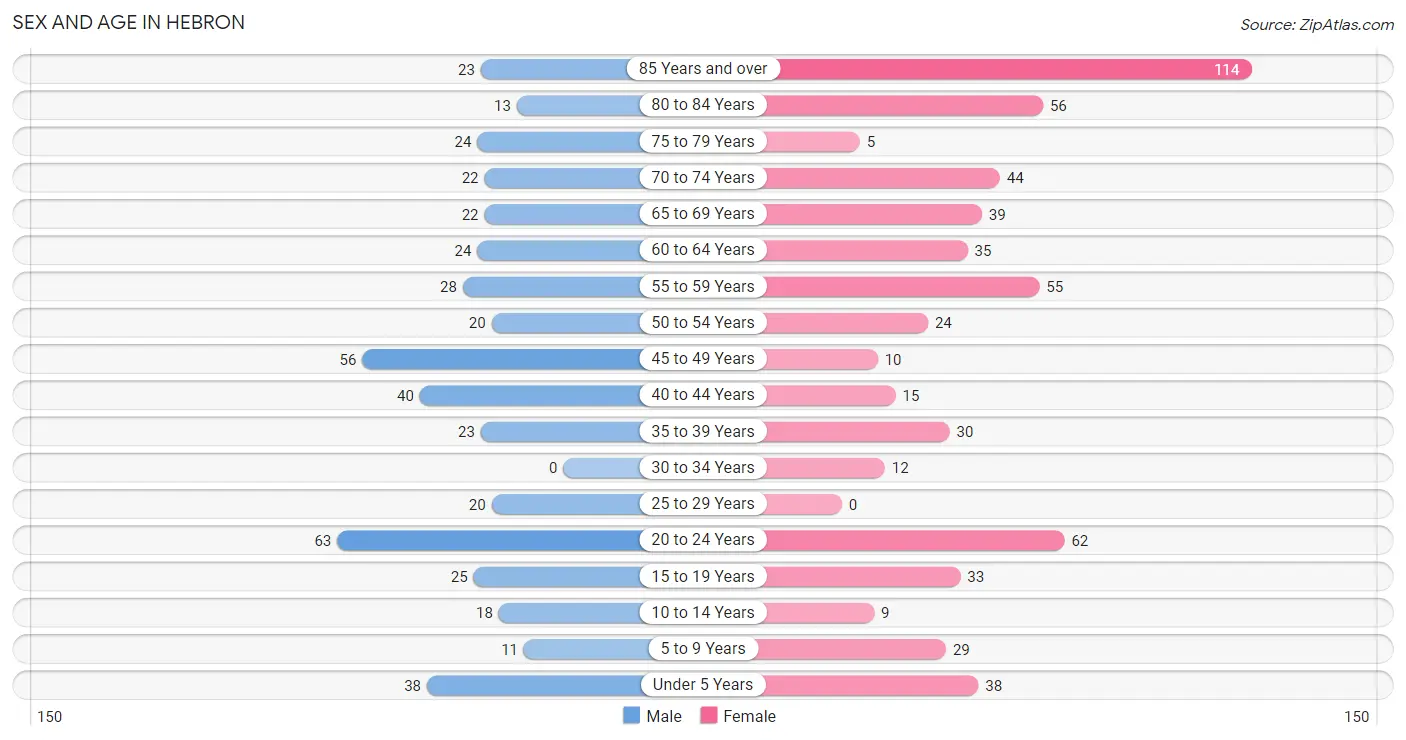
| Age Bracket | Male | Female |
| Under 5 Years | 38 (8.1%) | 38 (6.2%) |
| 5 to 9 Years | 11 (2.3%) | 29 (4.8%) |
| 10 to 14 Years | 18 (3.8%) | 9 (1.5%) |
| 15 to 19 Years | 25 (5.3%) | 33 (5.4%) |
| 20 to 24 Years | 63 (13.4%) | 62 (10.2%) |
| 25 to 29 Years | 20 (4.3%) | 0 (0.0%) |
| 30 to 34 Years | 0 (0.0%) | 12 (2.0%) |
| 35 to 39 Years | 23 (4.9%) | 30 (4.9%) |
| 40 to 44 Years | 40 (8.5%) | 15 (2.5%) |
| 45 to 49 Years | 56 (11.9%) | 10 (1.6%) |
| 50 to 54 Years | 20 (4.3%) | 24 (3.9%) |
| 55 to 59 Years | 28 (6.0%) | 55 (9.0%) |
| 60 to 64 Years | 24 (5.1%) | 35 (5.7%) |
| 65 to 69 Years | 22 (4.7%) | 39 (6.4%) |
| 70 to 74 Years | 22 (4.7%) | 44 (7.2%) |
| 75 to 79 Years | 24 (5.1%) | 5 (0.8%) |
| 80 to 84 Years | 13 (2.8%) | 56 (9.2%) |
| 85 Years and over | 23 (4.9%) | 114 (18.7%) |
| Total | 470 (100.0%) | 610 (100.0%) |
Families and Households in Hebron
Median Family Size in Hebron
The median family size in Hebron is 3.24 persons per family, with married-couple families (74 | 40.2%) accounting for the largest median family size of 3.96 persons per family. On the other hand, single female/mother families (89 | 48.4%) represent the smallest median family size with 2.63 persons per family.
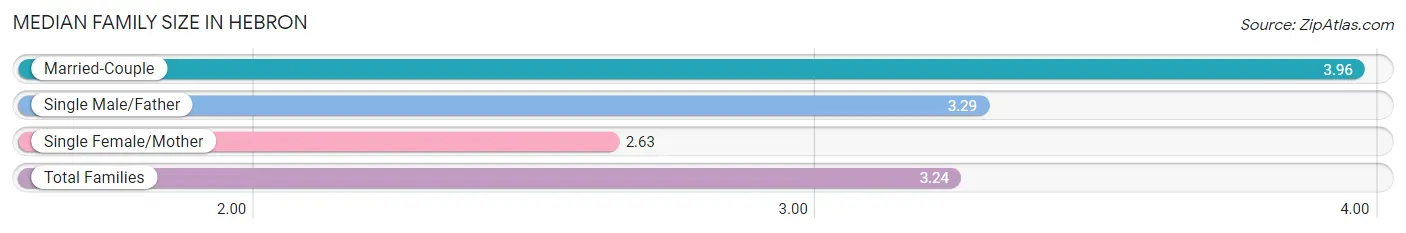
| Family Type | # Families | Family Size |
| Married-Couple | 74 (40.2%) | 3.96 |
| Single Male/Father | 21 (11.4%) | 3.29 |
| Single Female/Mother | 89 (48.4%) | 2.63 |
| Total Families | 184 (100.0%) | 3.24 |
Median Household Size in Hebron
The median household size in Hebron is 2.91 persons per household, with married-couple households (74 | 29.7%) accounting for the largest median household size of 3.96 persons per household. non-family households (65 | 26.1%) represent the smallest median household size with 1.68 persons per household.
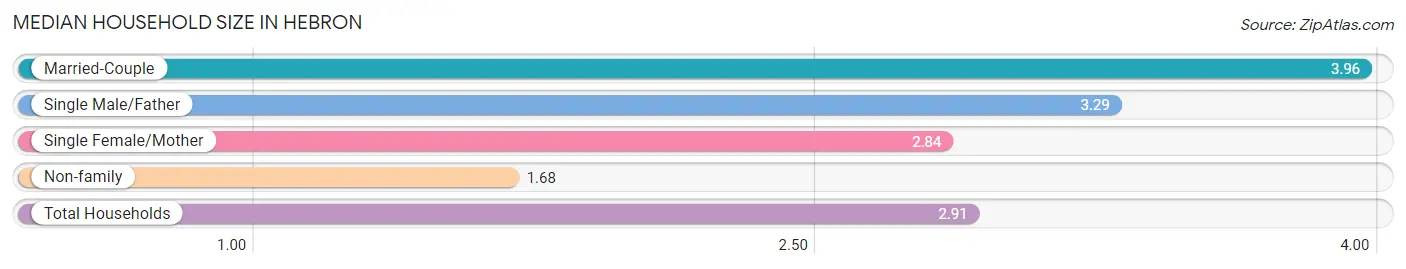
| Household Type | # Households | Household Size |
| Married-Couple | 74 (29.7%) | 3.96 |
| Single Male/Father | 21 (8.4%) | 3.29 |
| Single Female/Mother | 89 (35.7%) | 2.84 |
| Non-family | 65 (26.1%) | 1.68 |
| Total Households | 249 (100.0%) | 2.91 |
Household Size by Marriage Status in Hebron
Out of a total of 249 households in Hebron, 184 (73.9%) are family households, while 65 (26.1%) are nonfamily households. The most numerous type of family households are 3-person households, comprising 66, and the most common type of nonfamily households are 2-person households, comprising 44.
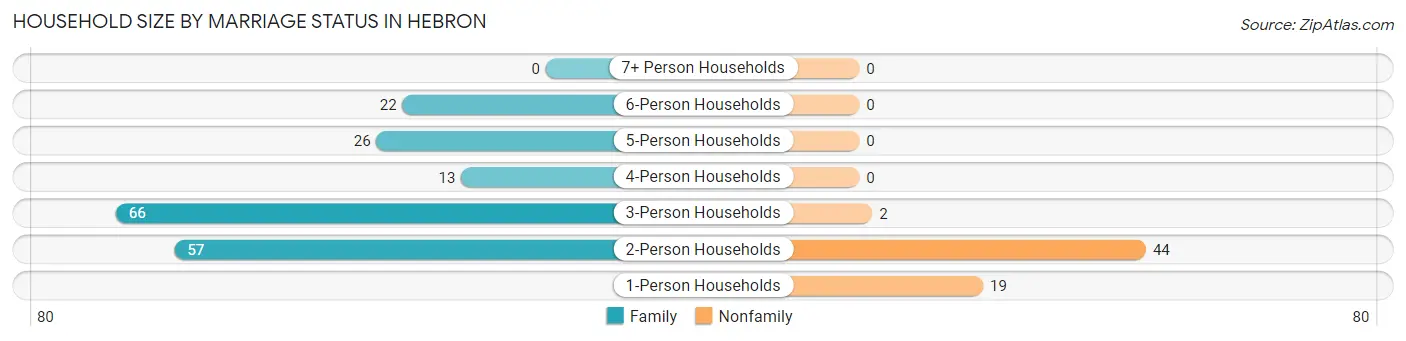
| Household Size | Family Households | Nonfamily Households |
| 1-Person Households | - | 19 (7.6%) |
| 2-Person Households | 57 (22.9%) | 44 (17.7%) |
| 3-Person Households | 66 (26.5%) | 2 (0.8%) |
| 4-Person Households | 13 (5.2%) | 0 (0.0%) |
| 5-Person Households | 26 (10.4%) | 0 (0.0%) |
| 6-Person Households | 22 (8.8%) | 0 (0.0%) |
| 7+ Person Households | 0 (0.0%) | 0 (0.0%) |
| Total | 184 (73.9%) | 65 (26.1%) |
Female Fertility in Hebron
Fertility by Age in Hebron
| Age Bracket | Women with Births | Births / 1,000 Women |
| 15 to 19 years | 0 (0.0%) | 0.0 |
| 20 to 34 years | 0 (0.0%) | 0.0 |
| 35 to 50 years | 0 (0.0%) | 0.0 |
| Total | 0 (0.0%) | 0.0 |
Fertility by Age by Marriage Status in Hebron
| Age Bracket | Married | Unmarried |
| 15 to 19 years | 0 (0.0%) | 0 (0.0%) |
| 20 to 34 years | 0 (0.0%) | 0 (0.0%) |
| 35 to 50 years | 0 (0.0%) | 0 (0.0%) |
| Total | 0 (0.0%) | 0 (0.0%) |
Fertility by Education in Hebron
| Educational Attainment | Women with Births | Births / 1,000 Women |
| Less than High School | 0 (0.0%) | 0.0 |
| High School Diploma | 0 (0.0%) | 0.0 |
| College or Associate's Degree | 0 (0.0%) | 0.0 |
| Bachelor's Degree | 0 (0.0%) | 0.0 |
| Graduate Degree | 0 (0.0%) | 0.0 |
| Total | 0 (0.0%) | 0.0 |
Fertility by Education by Marriage Status in Hebron
| Educational Attainment | Married | Unmarried |
| Less than High School | 0 (0.0%) | 0 (0.0%) |
| High School Diploma | 0 (0.0%) | 0 (0.0%) |
| College or Associate's Degree | 0 (0.0%) | 0 (0.0%) |
| Bachelor's Degree | 0 (0.0%) | 0 (0.0%) |
| Graduate Degree | 0 (0.0%) | 0 (0.0%) |
| Total | 0 (0.0%) | 0 (0.0%) |
Employment Characteristics in Hebron
Employment by Class of Employer in Hebron
Among the 450 employed individuals in Hebron, private company employees (394 | 87.6%), local government employees (17 | 3.8%), and federal government employees (15 | 3.3%) make up the most common classes of employment.
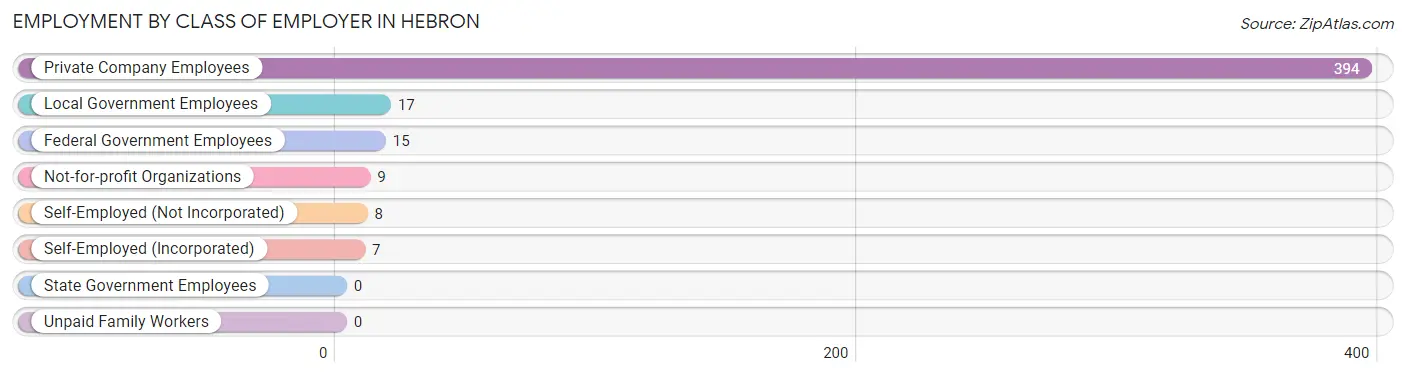
| Employer Class | # Employees | % Employees |
| Private Company Employees | 394 | 87.6% |
| Self-Employed (Incorporated) | 7 | 1.6% |
| Self-Employed (Not Incorporated) | 8 | 1.8% |
| Not-for-profit Organizations | 9 | 2.0% |
| Local Government Employees | 17 | 3.8% |
| State Government Employees | 0 | 0.0% |
| Federal Government Employees | 15 | 3.3% |
| Unpaid Family Workers | 0 | 0.0% |
| Total | 450 | 100.0% |
Employment Status by Age in Hebron
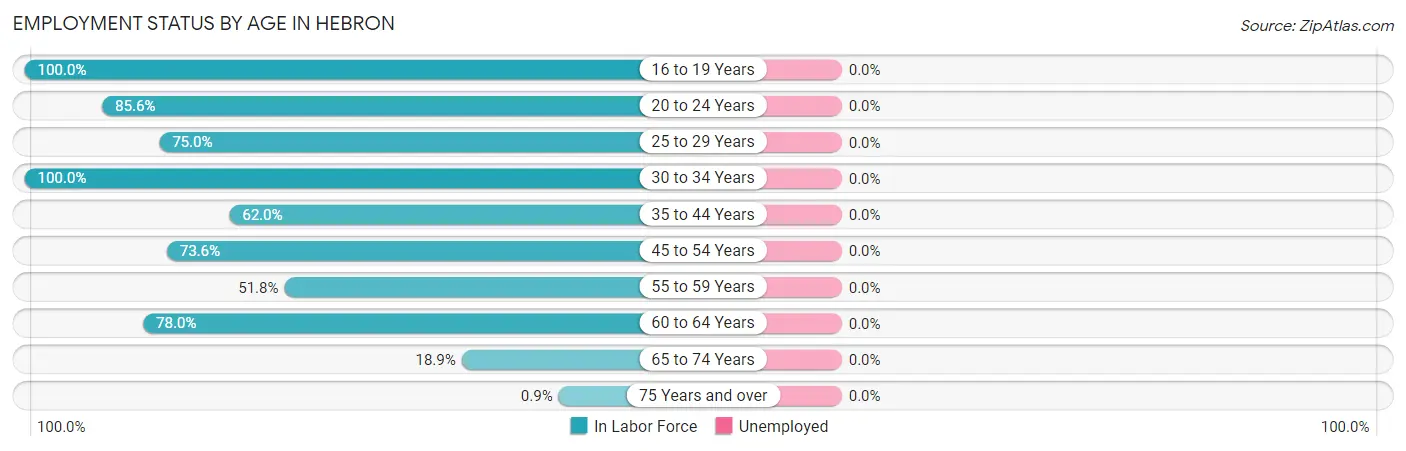
| Age Bracket | In Labor Force | Unemployed |
| 16 to 19 Years | 53 (100.0%) | 0 (0.0%) |
| 20 to 24 Years | 107 (85.6%) | 0 (0.0%) |
| 25 to 29 Years | 15 (75.0%) | 0 (0.0%) |
| 30 to 34 Years | 12 (100.0%) | 0 (0.0%) |
| 35 to 44 Years | 67 (62.0%) | 0 (0.0%) |
| 45 to 54 Years | 81 (73.6%) | 0 (0.0%) |
| 55 to 59 Years | 43 (51.8%) | 0 (0.0%) |
| 60 to 64 Years | 46 (78.0%) | 0 (0.0%) |
| 65 to 74 Years | 24 (18.9%) | 0 (0.0%) |
| 75 Years and over | 2 (0.9%) | 0 (0.0%) |
| Total | 450 (48.3%) | 0 (0.0%) |
Employment Status by Educational Attainment in Hebron
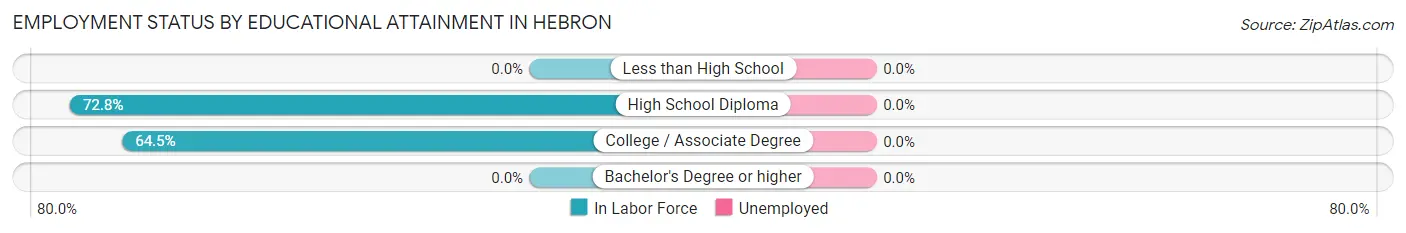
| Educational Attainment | In Labor Force | Unemployed |
| Less than High School | 0 (0.0%) | 0 (0.0%) |
| High School Diploma | 195 (72.8%) | 0 (0.0%) |
| College / Associate Degree | 69 (64.5%) | 0 (0.0%) |
| Bachelor's Degree or higher | 0 (0.0%) | 0 (0.0%) |
| Total | 264 (67.3%) | 0 (0.0%) |
Employment Occupations by Sex in Hebron
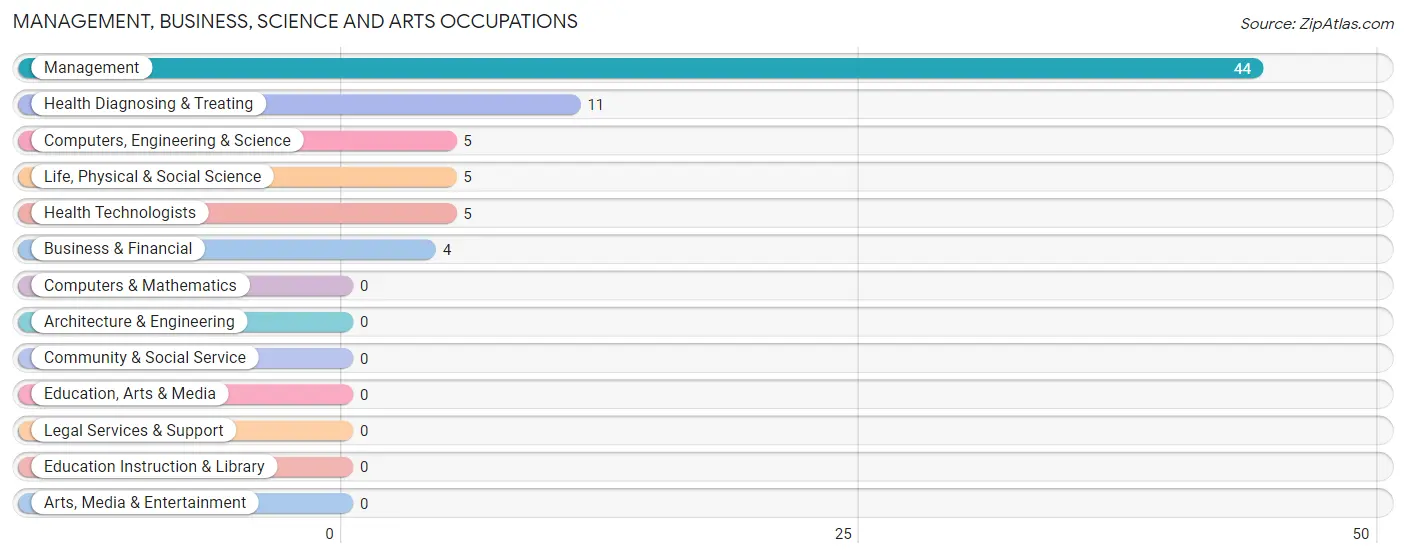
Management, Business, Science and Arts Occupations
The most common Management, Business, Science and Arts occupations in Hebron are Management (44 | 9.8%), Health Diagnosing & Treating (11 | 2.4%), Computers, Engineering & Science (5 | 1.1%), Life, Physical & Social Science (5 | 1.1%), and Health Technologists (5 | 1.1%).
Management, Business, Science and Arts Occupations by Sex
Within the Management, Business, Science and Arts occupations in Hebron, the most male-oriented occupations are Business & Financial (100.0%), Computers, Engineering & Science (100.0%), and Life, Physical & Social Science (100.0%), while the most female-oriented occupations are Health Diagnosing & Treating (100.0%), Health Technologists (100.0%), and Management (84.1%).
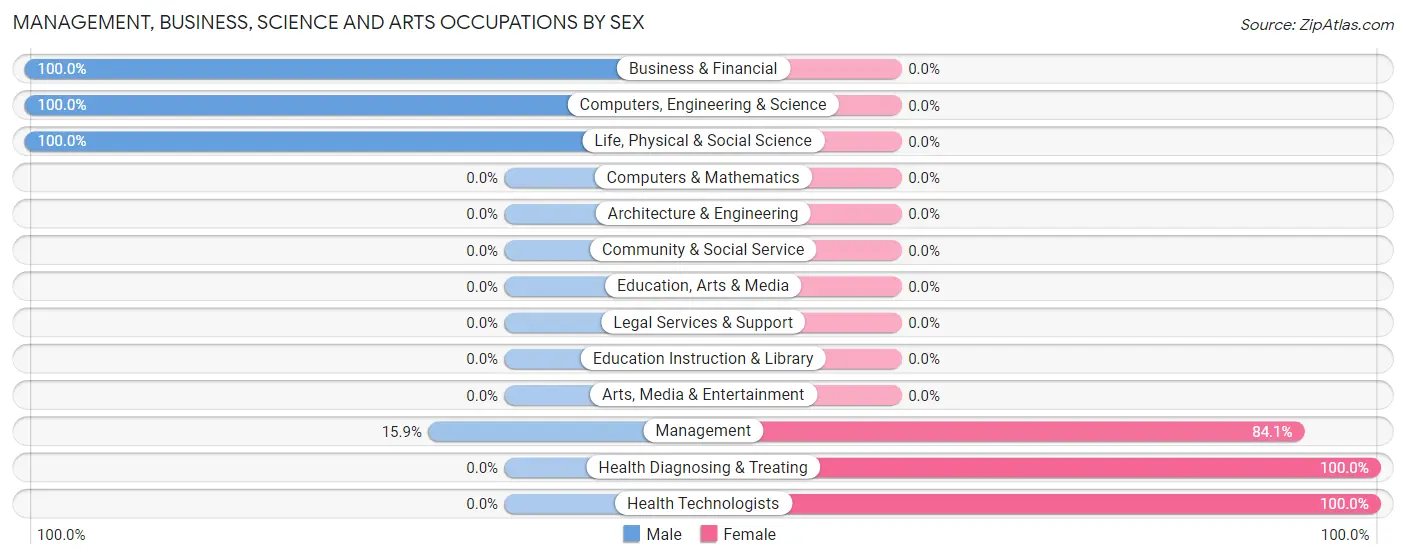
| Occupation | Male | Female |
| Management | 7 (15.9%) | 37 (84.1%) |
| Business & Financial | 4 (100.0%) | 0 (0.0%) |
| Computers, Engineering & Science | 5 (100.0%) | 0 (0.0%) |
| Computers & Mathematics | 0 (0.0%) | 0 (0.0%) |
| Architecture & Engineering | 0 (0.0%) | 0 (0.0%) |
| Life, Physical & Social Science | 5 (100.0%) | 0 (0.0%) |
| Community & Social Service | 0 (0.0%) | 0 (0.0%) |
| Education, Arts & Media | 0 (0.0%) | 0 (0.0%) |
| Legal Services & Support | 0 (0.0%) | 0 (0.0%) |
| Education Instruction & Library | 0 (0.0%) | 0 (0.0%) |
| Arts, Media & Entertainment | 0 (0.0%) | 0 (0.0%) |
| Health Diagnosing & Treating | 0 (0.0%) | 11 (100.0%) |
| Health Technologists | 0 (0.0%) | 5 (100.0%) |
| Total (Category) | 16 (25.0%) | 48 (75.0%) |
| Total (Overall) | 230 (51.1%) | 220 (48.9%) |
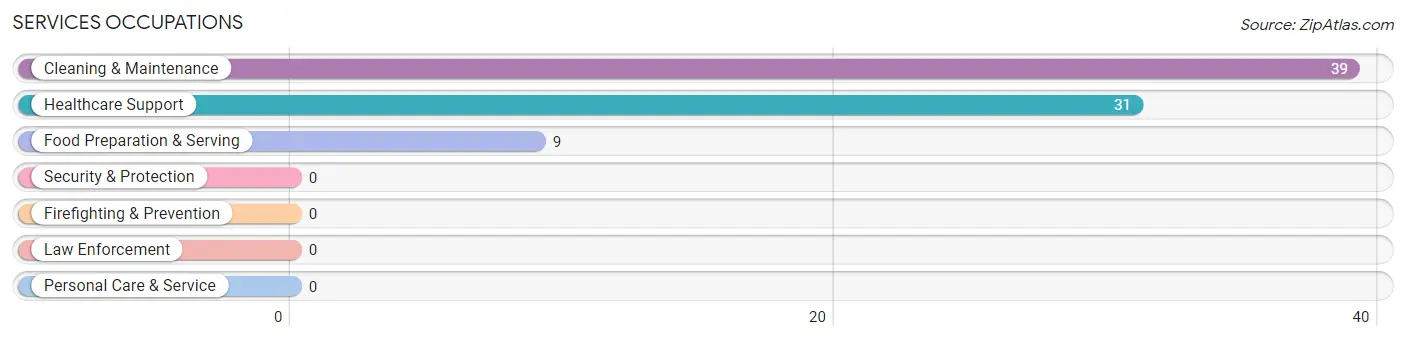
Services Occupations
The most common Services occupations in Hebron are Cleaning & Maintenance (39 | 8.7%), Healthcare Support (31 | 6.9%), and Food Preparation & Serving (9 | 2.0%).
Services Occupations by Sex
Within the Services occupations in Hebron, the most male-oriented occupations are Food Preparation & Serving (100.0%), and Cleaning & Maintenance (94.9%), while the most female-oriented occupations are Healthcare Support (100.0%), and Cleaning & Maintenance (5.1%).
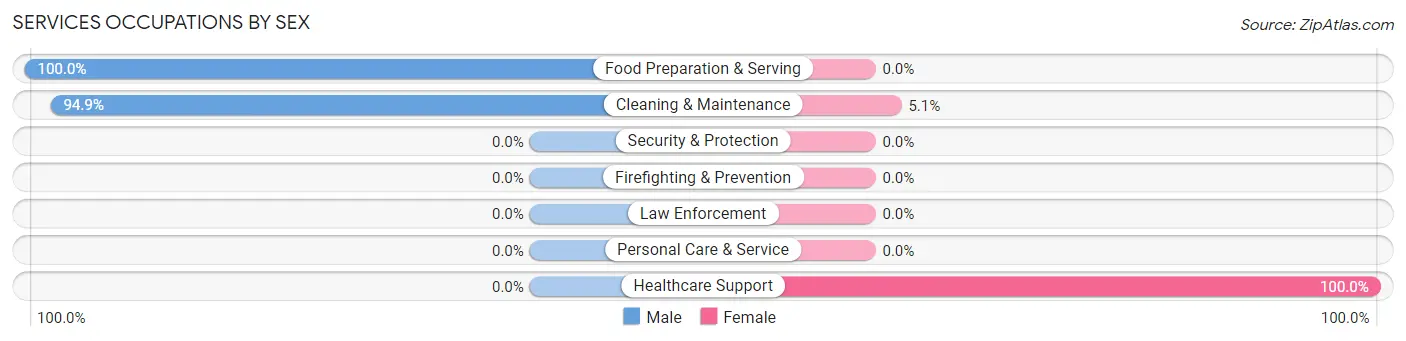
| Occupation | Male | Female |
| Healthcare Support | 0 (0.0%) | 31 (100.0%) |
| Security & Protection | 0 (0.0%) | 0 (0.0%) |
| Firefighting & Prevention | 0 (0.0%) | 0 (0.0%) |
| Law Enforcement | 0 (0.0%) | 0 (0.0%) |
| Food Preparation & Serving | 9 (100.0%) | 0 (0.0%) |
| Cleaning & Maintenance | 37 (94.9%) | 2 (5.1%) |
| Personal Care & Service | 0 (0.0%) | 0 (0.0%) |
| Total (Category) | 46 (58.2%) | 33 (41.8%) |
| Total (Overall) | 230 (51.1%) | 220 (48.9%) |
Sales and Office Occupations
The most common Sales and Office occupations in Hebron are Office & Administration (88 | 19.6%), and Sales & Related (58 | 12.9%).
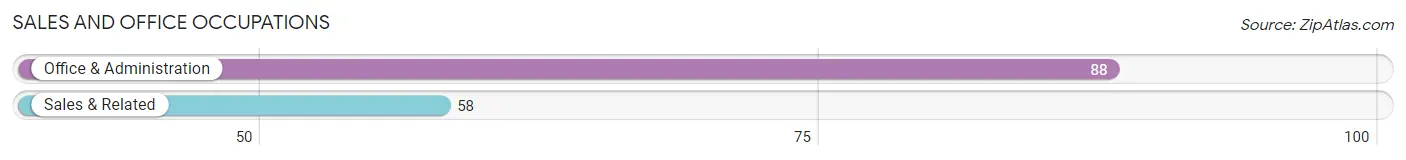
Sales and Office Occupations by Sex
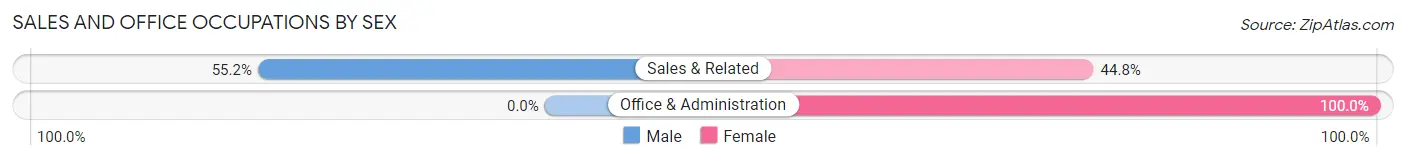
| Occupation | Male | Female |
| Sales & Related | 32 (55.2%) | 26 (44.8%) |
| Office & Administration | 0 (0.0%) | 88 (100.0%) |
| Total (Category) | 32 (21.9%) | 114 (78.1%) |
| Total (Overall) | 230 (51.1%) | 220 (48.9%) |
Natural Resources, Construction and Maintenance Occupations
The most common Natural Resources, Construction and Maintenance occupations in Hebron are Installation, Maintenance & Repair (37 | 8.2%), and Farming, Fishing & Forestry (4 | 0.9%).
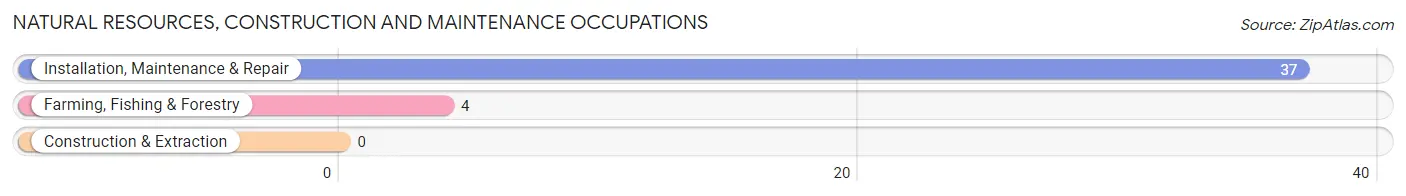
Natural Resources, Construction and Maintenance Occupations by Sex
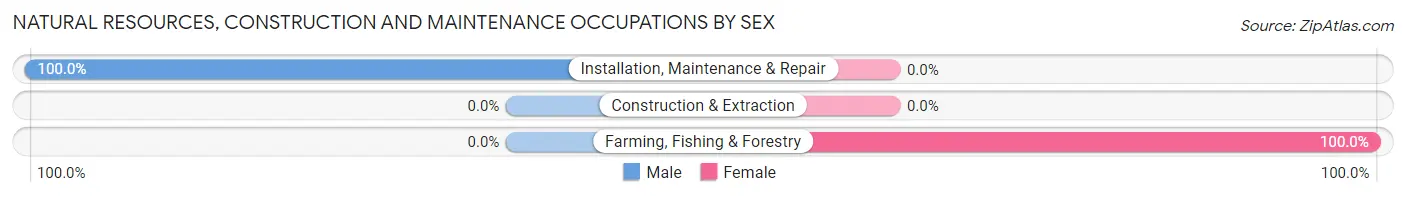
| Occupation | Male | Female |
| Farming, Fishing & Forestry | 0 (0.0%) | 4 (100.0%) |
| Construction & Extraction | 0 (0.0%) | 0 (0.0%) |
| Installation, Maintenance & Repair | 37 (100.0%) | 0 (0.0%) |
| Total (Category) | 37 (90.2%) | 4 (9.8%) |
| Total (Overall) | 230 (51.1%) | 220 (48.9%) |
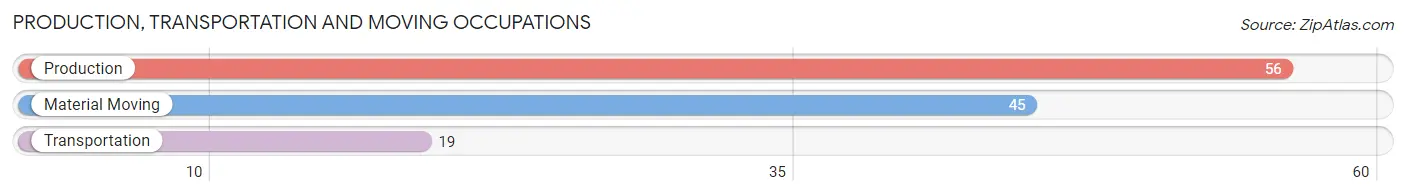
Production, Transportation and Moving Occupations
The most common Production, Transportation and Moving occupations in Hebron are Production (56 | 12.4%), Material Moving (45 | 10.0%), and Transportation (19 | 4.2%).
Production, Transportation and Moving Occupations by Sex
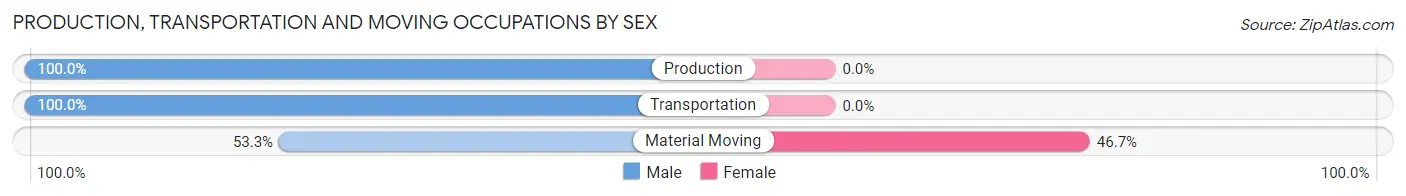
| Occupation | Male | Female |
| Production | 56 (100.0%) | 0 (0.0%) |
| Transportation | 19 (100.0%) | 0 (0.0%) |
| Material Moving | 24 (53.3%) | 21 (46.7%) |
| Total (Category) | 99 (82.5%) | 21 (17.5%) |
| Total (Overall) | 230 (51.1%) | 220 (48.9%) |
Employment Industries by Sex in Hebron
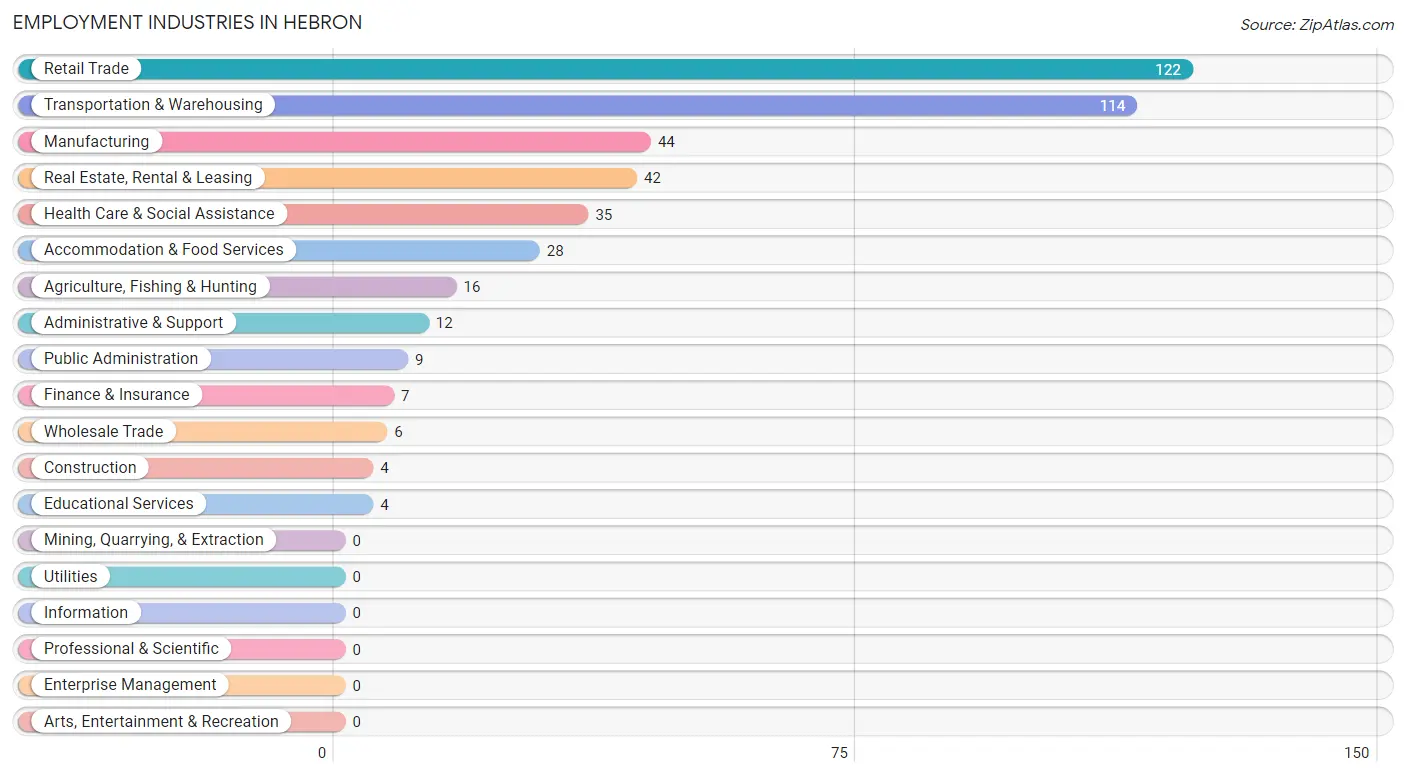
Employment Industries in Hebron
The major employment industries in Hebron include Retail Trade (122 | 27.1%), Transportation & Warehousing (114 | 25.3%), Manufacturing (44 | 9.8%), Real Estate, Rental & Leasing (42 | 9.3%), and Health Care & Social Assistance (35 | 7.8%).
Employment Industries by Sex in Hebron
The Hebron industries that see more men than women are Construction (100.0%), Manufacturing (100.0%), and Wholesale Trade (100.0%), whereas the industries that tend to have a higher number of women are Educational Services (100.0%), Health Care & Social Assistance (85.7%), and Accommodation & Food Services (85.7%).
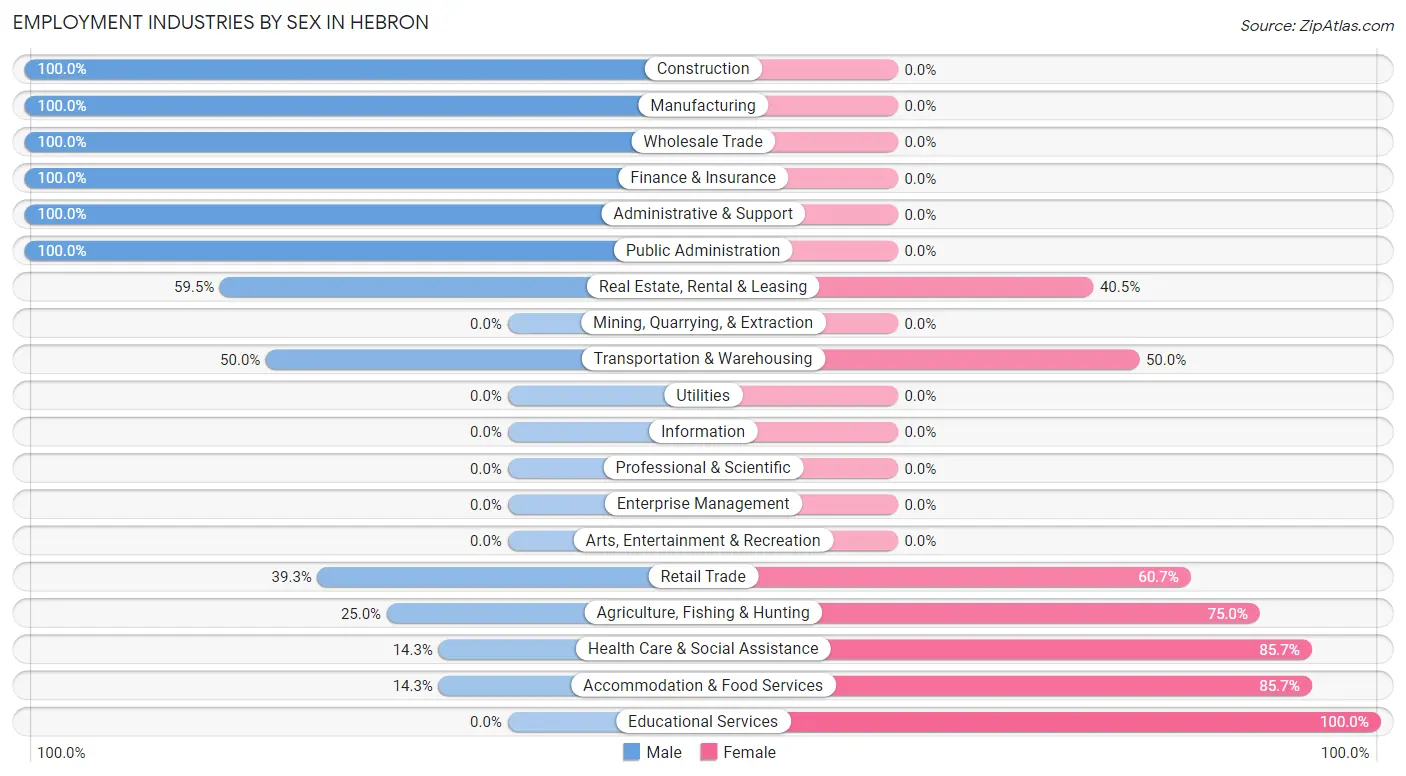
| Industry | Male | Female |
| Agriculture, Fishing & Hunting | 4 (25.0%) | 12 (75.0%) |
| Mining, Quarrying, & Extraction | 0 (0.0%) | 0 (0.0%) |
| Construction | 4 (100.0%) | 0 (0.0%) |
| Manufacturing | 44 (100.0%) | 0 (0.0%) |
| Wholesale Trade | 6 (100.0%) | 0 (0.0%) |
| Retail Trade | 48 (39.3%) | 74 (60.7%) |
| Transportation & Warehousing | 57 (50.0%) | 57 (50.0%) |
| Utilities | 0 (0.0%) | 0 (0.0%) |
| Information | 0 (0.0%) | 0 (0.0%) |
| Finance & Insurance | 7 (100.0%) | 0 (0.0%) |
| Real Estate, Rental & Leasing | 25 (59.5%) | 17 (40.5%) |
| Professional & Scientific | 0 (0.0%) | 0 (0.0%) |
| Enterprise Management | 0 (0.0%) | 0 (0.0%) |
| Administrative & Support | 12 (100.0%) | 0 (0.0%) |
| Educational Services | 0 (0.0%) | 4 (100.0%) |
| Health Care & Social Assistance | 5 (14.3%) | 30 (85.7%) |
| Arts, Entertainment & Recreation | 0 (0.0%) | 0 (0.0%) |
| Accommodation & Food Services | 4 (14.3%) | 24 (85.7%) |
| Public Administration | 9 (100.0%) | 0 (0.0%) |
| Total | 230 (51.1%) | 220 (48.9%) |
Education in Hebron
School Enrollment in Hebron
The most common levels of schooling among the 168 students in Hebron are high school (47 | 28.0%), elementary school (45 | 26.8%), and college / undergraduate (33 | 19.6%).
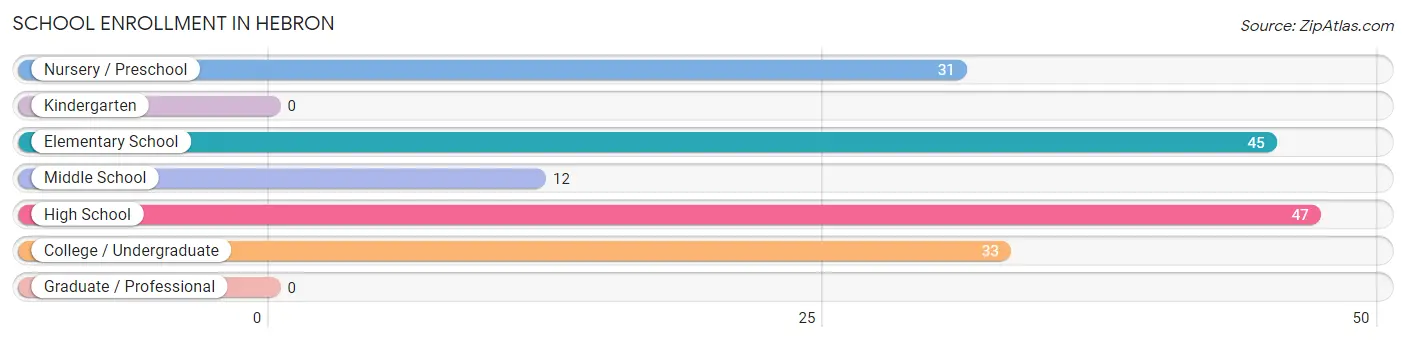
| School Level | # Students | % Students |
| Nursery / Preschool | 31 | 18.4% |
| Kindergarten | 0 | 0.0% |
| Elementary School | 45 | 26.8% |
| Middle School | 12 | 7.1% |
| High School | 47 | 28.0% |
| College / Undergraduate | 33 | 19.6% |
| Graduate / Professional | 0 | 0.0% |
| Total | 168 | 100.0% |
School Enrollment by Age by Funding Source in Hebron
Out of a total of 168 students who are enrolled in schools in Hebron, 22 (13.1%) attend a private institution, while the remaining 146 (86.9%) are enrolled in public schools. The age group of 10 to 14 year olds has the highest likelihood of being enrolled in private schools, with 16 (59.3% in the age bracket) enrolled. Conversely, the age group of 5 to 9 year old has the lowest likelihood of being enrolled in a private school, with 40 (100.0% in the age bracket) attending a public institution.
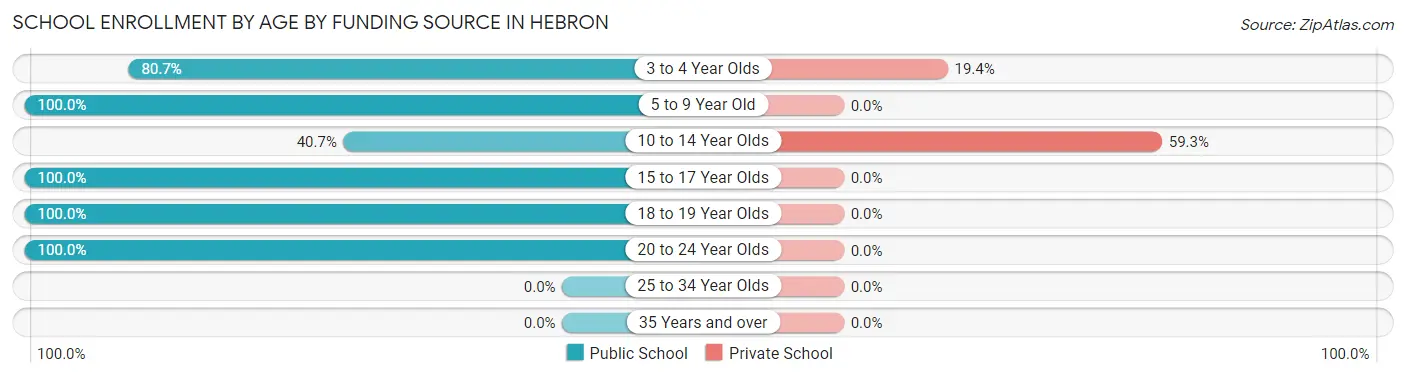
| Age Bracket | Public School | Private School |
| 3 to 4 Year Olds | 25 (80.6%) | 6 (19.4%) |
| 5 to 9 Year Old | 40 (100.0%) | 0 (0.0%) |
| 10 to 14 Year Olds | 11 (40.7%) | 16 (59.3%) |
| 15 to 17 Year Olds | 13 (100.0%) | 0 (0.0%) |
| 18 to 19 Year Olds | 24 (100.0%) | 0 (0.0%) |
| 20 to 24 Year Olds | 33 (100.0%) | 0 (0.0%) |
| 25 to 34 Year Olds | 0 (0.0%) | 0 (0.0%) |
| 35 Years and over | 0 (0.0%) | 0 (0.0%) |
| Total | 146 (86.9%) | 22 (13.1%) |
Educational Attainment by Field of Study in Hebron
Engineering (8 | 30.8%), business (7 | 26.9%), social sciences (6 | 23.1%), and education (5 | 19.2%) are the most common fields of study among 26 individuals in Hebron who have obtained a bachelor's degree or higher.
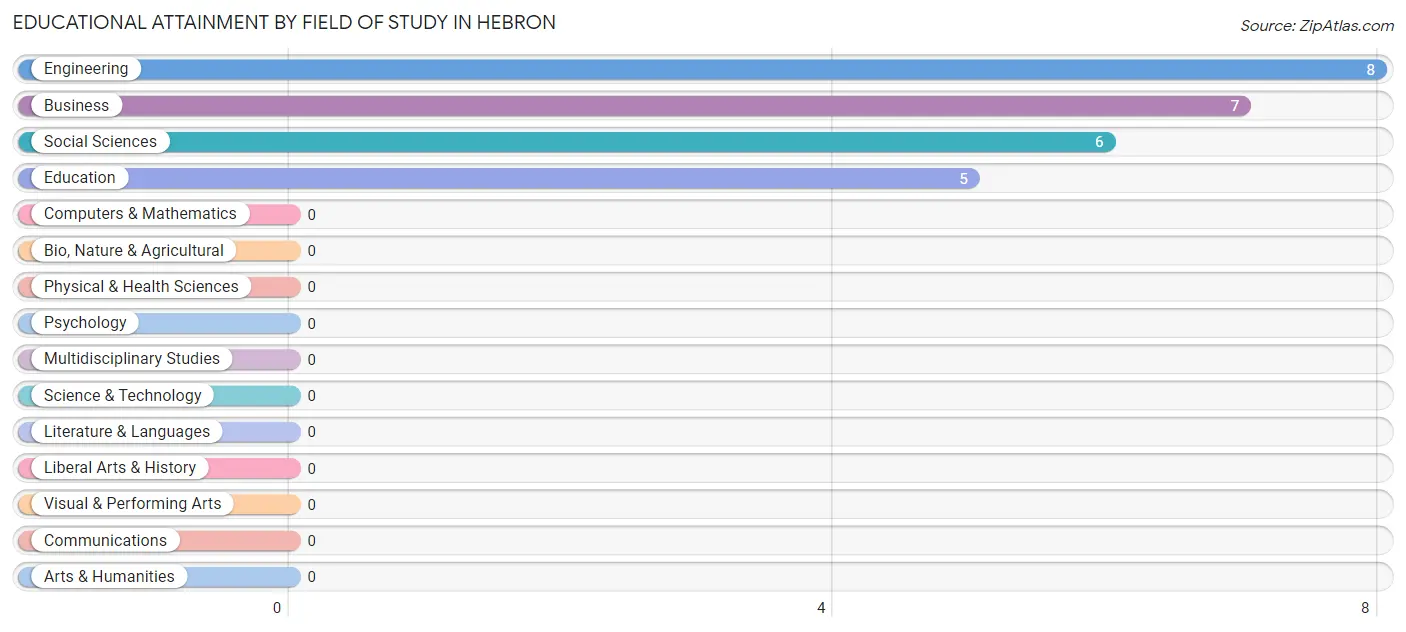
| Field of Study | # Graduates | % Graduates |
| Computers & Mathematics | 0 | 0.0% |
| Bio, Nature & Agricultural | 0 | 0.0% |
| Physical & Health Sciences | 0 | 0.0% |
| Psychology | 0 | 0.0% |
| Social Sciences | 6 | 23.1% |
| Engineering | 8 | 30.8% |
| Multidisciplinary Studies | 0 | 0.0% |
| Science & Technology | 0 | 0.0% |
| Business | 7 | 26.9% |
| Education | 5 | 19.2% |
| Literature & Languages | 0 | 0.0% |
| Liberal Arts & History | 0 | 0.0% |
| Visual & Performing Arts | 0 | 0.0% |
| Communications | 0 | 0.0% |
| Arts & Humanities | 0 | 0.0% |
| Total | 26 | 100.0% |
Transportation & Commute in Hebron
Vehicle Availability by Sex in Hebron
The most prevalent vehicle ownership categories in Hebron are males with 2 vehicles (137, accounting for 59.6%) and females with 2 vehicles (123, making up 62.3%).
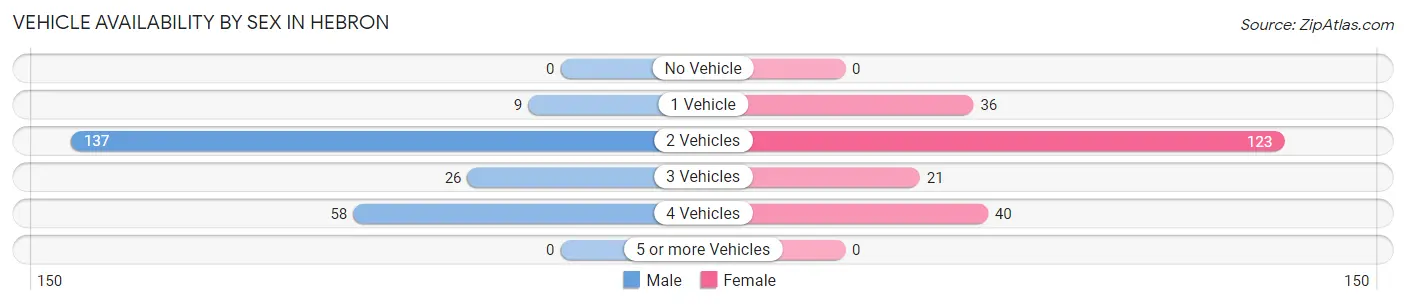
| Vehicles Available | Male | Female |
| No Vehicle | 0 (0.0%) | 0 (0.0%) |
| 1 Vehicle | 9 (3.9%) | 36 (16.4%) |
| 2 Vehicles | 137 (59.6%) | 123 (55.9%) |
| 3 Vehicles | 26 (11.3%) | 21 (9.6%) |
| 4 Vehicles | 58 (25.2%) | 40 (18.2%) |
| 5 or more Vehicles | 0 (0.0%) | 0 (0.0%) |
| Total | 230 (100.0%) | 220 (100.0%) |
Commute Time in Hebron
The most frequently occuring commute durations in Hebron are 10 to 14 minutes (89 commuters, 19.8%), 60 to 89 minutes (62 commuters, 13.8%), and 15 to 19 minutes (59 commuters, 13.1%).
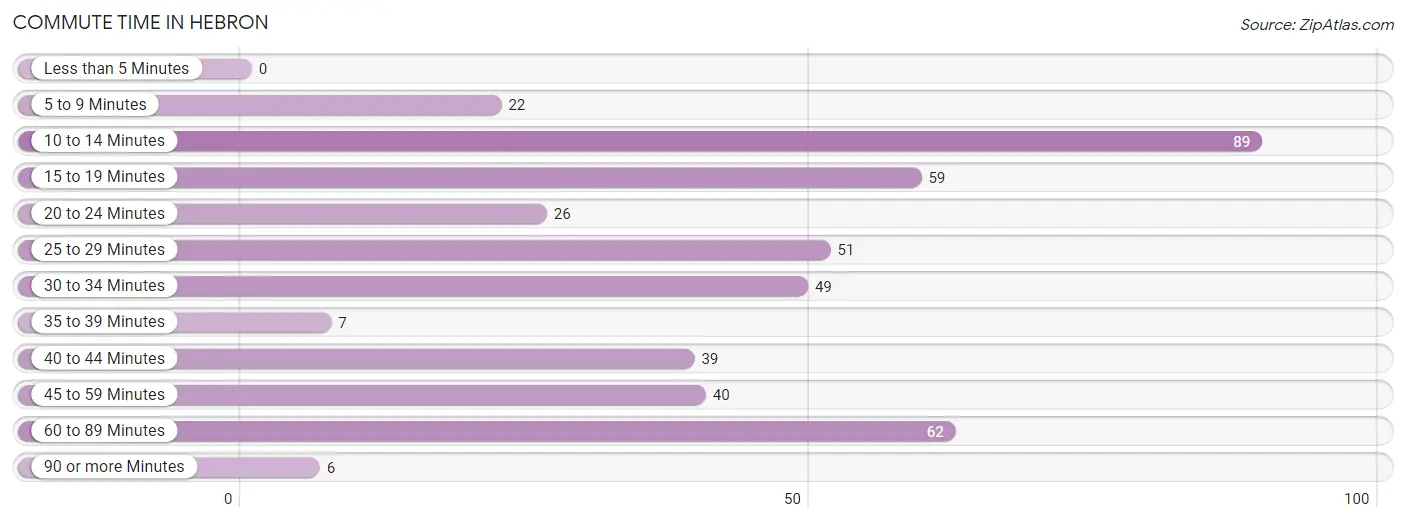
| Commute Time | # Commuters | % Commuters |
| Less than 5 Minutes | 0 | 0.0% |
| 5 to 9 Minutes | 22 | 4.9% |
| 10 to 14 Minutes | 89 | 19.8% |
| 15 to 19 Minutes | 59 | 13.1% |
| 20 to 24 Minutes | 26 | 5.8% |
| 25 to 29 Minutes | 51 | 11.3% |
| 30 to 34 Minutes | 49 | 10.9% |
| 35 to 39 Minutes | 7 | 1.6% |
| 40 to 44 Minutes | 39 | 8.7% |
| 45 to 59 Minutes | 40 | 8.9% |
| 60 to 89 Minutes | 62 | 13.8% |
| 90 or more Minutes | 6 | 1.3% |
Commute Time by Sex in Hebron
The most common commute times in Hebron are 15 to 19 minutes (42 commuters, 18.3%) for males and 10 to 14 minutes (66 commuters, 30.0%) for females.
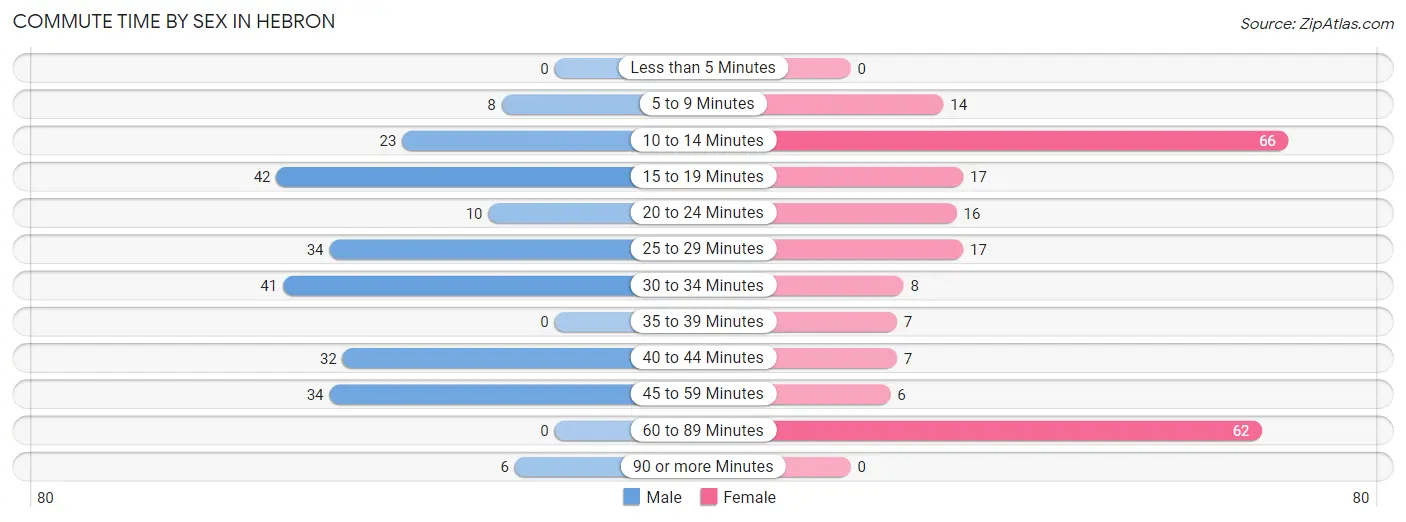
| Commute Time | Male | Female |
| Less than 5 Minutes | 0 (0.0%) | 0 (0.0%) |
| 5 to 9 Minutes | 8 (3.5%) | 14 (6.4%) |
| 10 to 14 Minutes | 23 (10.0%) | 66 (30.0%) |
| 15 to 19 Minutes | 42 (18.3%) | 17 (7.7%) |
| 20 to 24 Minutes | 10 (4.3%) | 16 (7.3%) |
| 25 to 29 Minutes | 34 (14.8%) | 17 (7.7%) |
| 30 to 34 Minutes | 41 (17.8%) | 8 (3.6%) |
| 35 to 39 Minutes | 0 (0.0%) | 7 (3.2%) |
| 40 to 44 Minutes | 32 (13.9%) | 7 (3.2%) |
| 45 to 59 Minutes | 34 (14.8%) | 6 (2.7%) |
| 60 to 89 Minutes | 0 (0.0%) | 62 (28.2%) |
| 90 or more Minutes | 6 (2.6%) | 0 (0.0%) |
Time of Departure to Work by Sex in Hebron
The most frequent times of departure to work in Hebron are 6:00 AM to 6:29 AM (48, 20.9%) for males and 12:00 PM to 3:59 PM (41, 18.6%) for females.
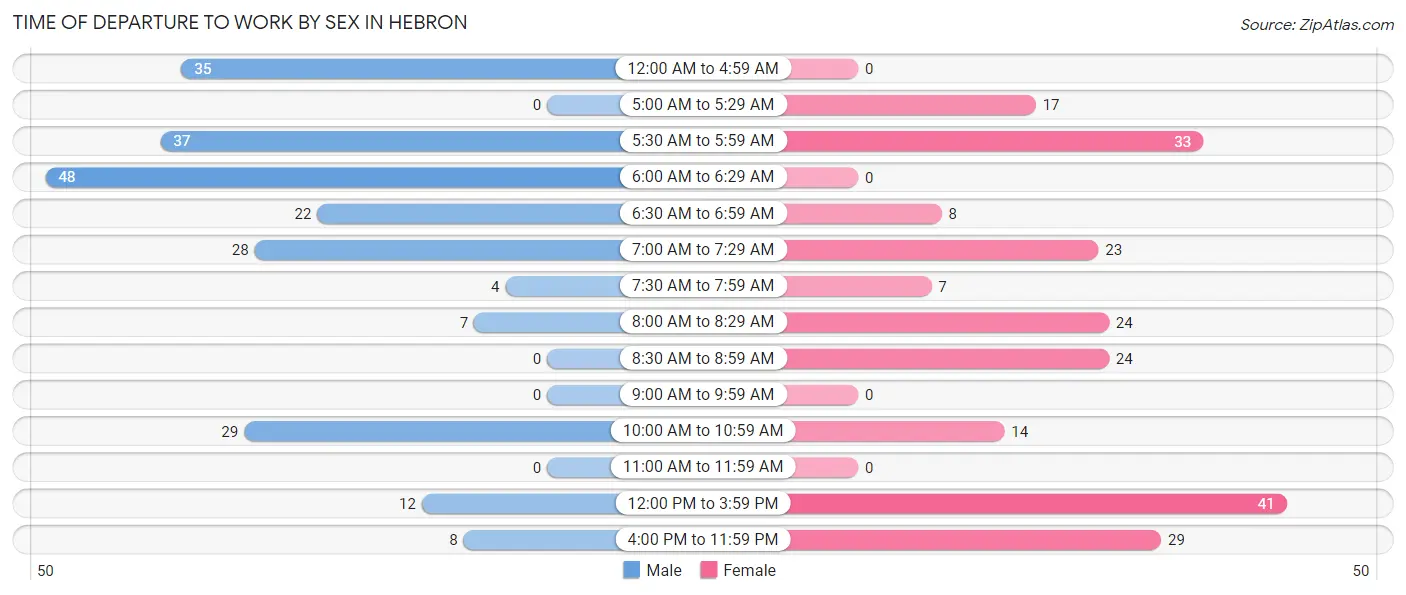
| Time of Departure | Male | Female |
| 12:00 AM to 4:59 AM | 35 (15.2%) | 0 (0.0%) |
| 5:00 AM to 5:29 AM | 0 (0.0%) | 17 (7.7%) |
| 5:30 AM to 5:59 AM | 37 (16.1%) | 33 (15.0%) |
| 6:00 AM to 6:29 AM | 48 (20.9%) | 0 (0.0%) |
| 6:30 AM to 6:59 AM | 22 (9.6%) | 8 (3.6%) |
| 7:00 AM to 7:29 AM | 28 (12.2%) | 23 (10.4%) |
| 7:30 AM to 7:59 AM | 4 (1.7%) | 7 (3.2%) |
| 8:00 AM to 8:29 AM | 7 (3.0%) | 24 (10.9%) |
| 8:30 AM to 8:59 AM | 0 (0.0%) | 24 (10.9%) |
| 9:00 AM to 9:59 AM | 0 (0.0%) | 0 (0.0%) |
| 10:00 AM to 10:59 AM | 29 (12.6%) | 14 (6.4%) |
| 11:00 AM to 11:59 AM | 0 (0.0%) | 0 (0.0%) |
| 12:00 PM to 3:59 PM | 12 (5.2%) | 41 (18.6%) |
| 4:00 PM to 11:59 PM | 8 (3.5%) | 29 (13.2%) |
| Total | 230 (100.0%) | 220 (100.0%) |
Housing Occupancy in Hebron
Occupancy by Ownership in Hebron
Of the total 249 dwellings in Hebron, owner-occupied units account for 235 (94.4%), while renter-occupied units make up 14 (5.6%).
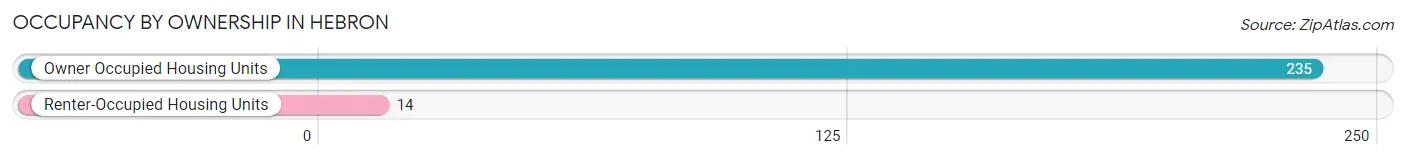
| Occupancy | # Housing Units | % Housing Units |
| Owner Occupied Housing Units | 235 | 94.4% |
| Renter-Occupied Housing Units | 14 | 5.6% |
| Total Occupied Housing Units | 249 | 100.0% |
Occupancy by Household Size in Hebron
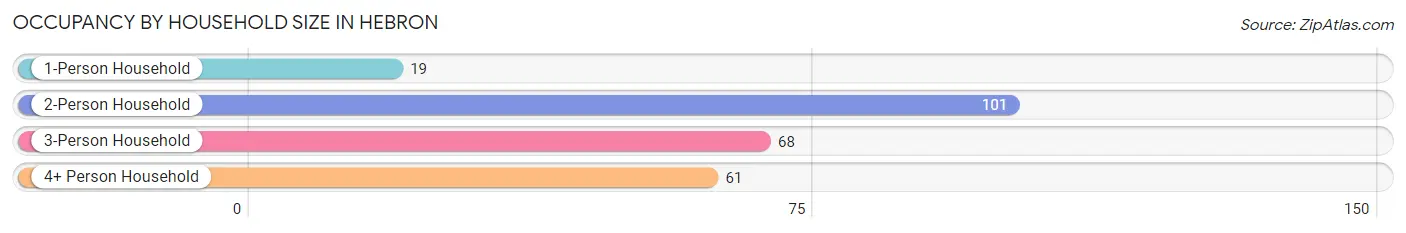
| Household Size | # Housing Units | % Housing Units |
| 1-Person Household | 19 | 7.6% |
| 2-Person Household | 101 | 40.6% |
| 3-Person Household | 68 | 27.3% |
| 4+ Person Household | 61 | 24.5% |
| Total Housing Units | 249 | 100.0% |
Occupancy by Ownership by Household Size in Hebron
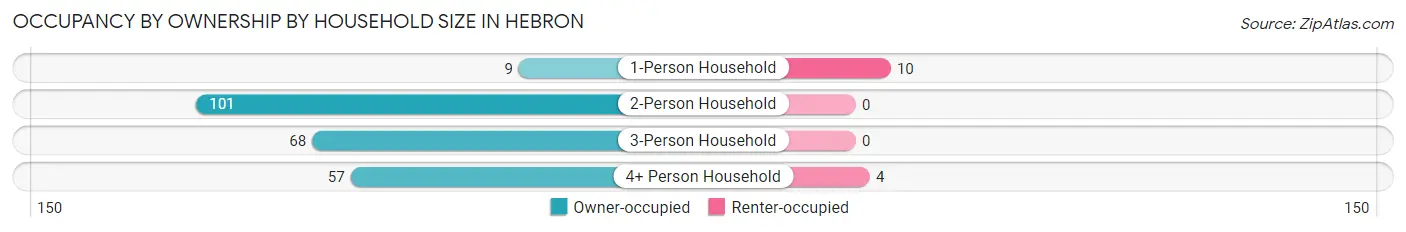
| Household Size | Owner-occupied | Renter-occupied |
| 1-Person Household | 9 (47.4%) | 10 (52.6%) |
| 2-Person Household | 101 (100.0%) | 0 (0.0%) |
| 3-Person Household | 68 (100.0%) | 0 (0.0%) |
| 4+ Person Household | 57 (93.4%) | 4 (6.6%) |
| Total Housing Units | 235 (94.4%) | 14 (5.6%) |
Occupancy by Educational Attainment in Hebron
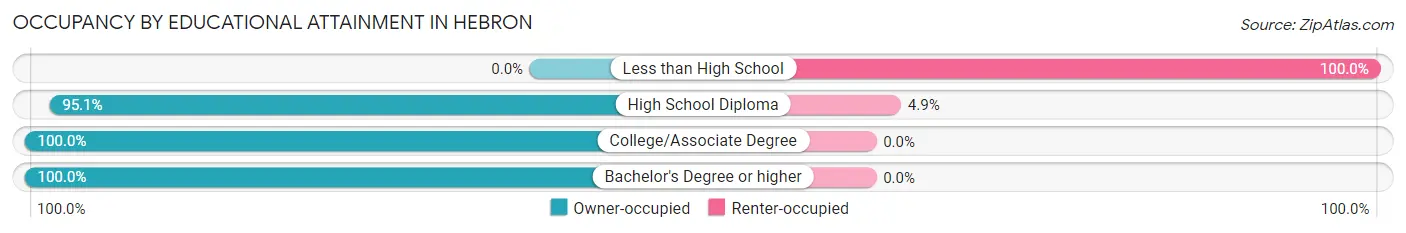
| Household Size | Owner-occupied | Renter-occupied |
| Less than High School | 0 (0.0%) | 6 (100.0%) |
| High School Diploma | 155 (95.1%) | 8 (4.9%) |
| College/Associate Degree | 73 (100.0%) | 0 (0.0%) |
| Bachelor's Degree or higher | 7 (100.0%) | 0 (0.0%) |
Occupancy by Age of Householder in Hebron
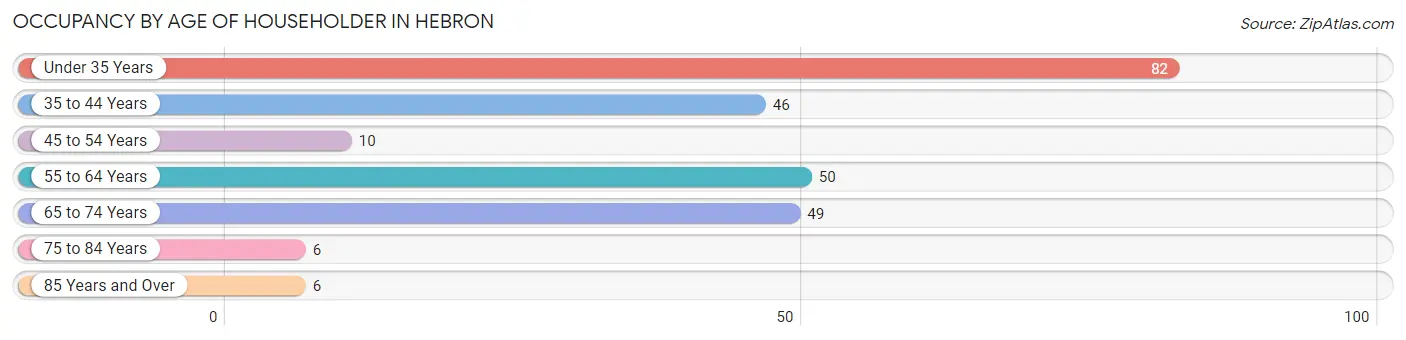
| Age Bracket | # Households | % Households |
| Under 35 Years | 82 | 32.9% |
| 35 to 44 Years | 46 | 18.5% |
| 45 to 54 Years | 10 | 4.0% |
| 55 to 64 Years | 50 | 20.1% |
| 65 to 74 Years | 49 | 19.7% |
| 75 to 84 Years | 6 | 2.4% |
| 85 Years and Over | 6 | 2.4% |
| Total | 249 | 100.0% |
Housing Finances in Hebron
Median Income by Occupancy in Hebron
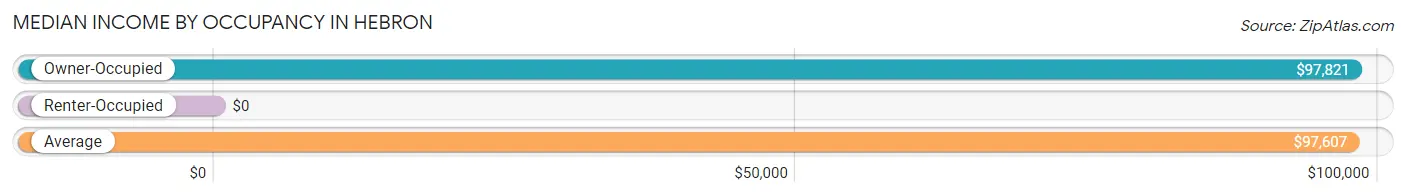
| Occupancy Type | # Households | Median Income |
| Owner-Occupied | 235 (94.4%) | $97,821 |
| Renter-Occupied | 14 (5.6%) | $0 |
| Average | 249 (100.0%) | $97,607 |
Occupancy by Householder Income Bracket in Hebron
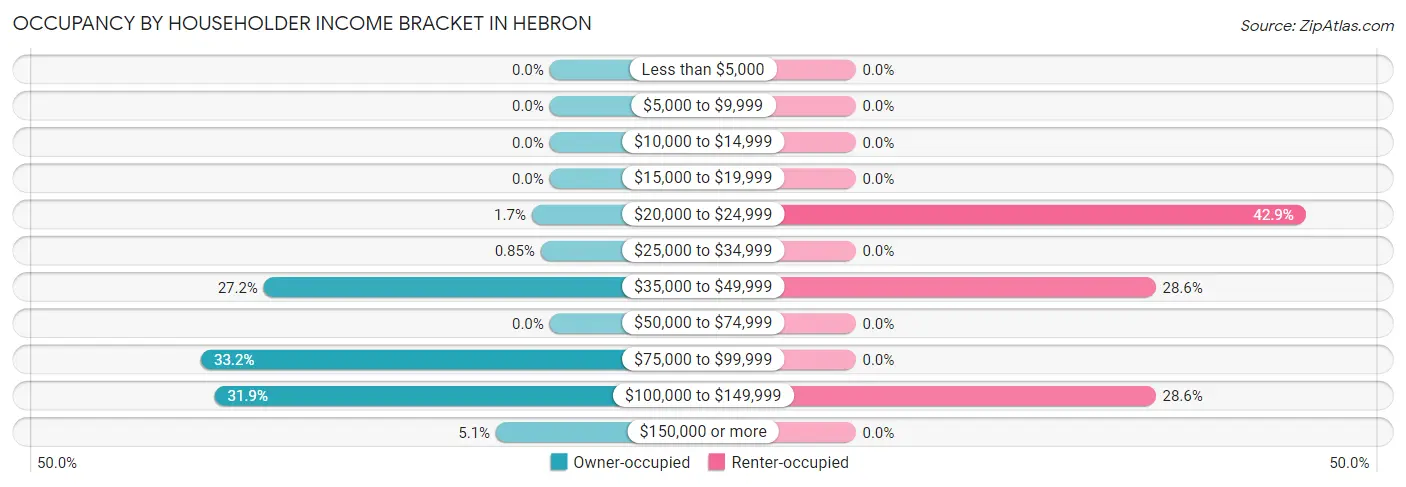
| Income Bracket | Owner-occupied | Renter-occupied |
| Less than $5,000 | 0 (0.0%) | 0 (0.0%) |
| $5,000 to $9,999 | 0 (0.0%) | 0 (0.0%) |
| $10,000 to $14,999 | 0 (0.0%) | 0 (0.0%) |
| $15,000 to $19,999 | 0 (0.0%) | 0 (0.0%) |
| $20,000 to $24,999 | 4 (1.7%) | 6 (42.9%) |
| $25,000 to $34,999 | 2 (0.9%) | 0 (0.0%) |
| $35,000 to $49,999 | 64 (27.2%) | 4 (28.6%) |
| $50,000 to $74,999 | 0 (0.0%) | 0 (0.0%) |
| $75,000 to $99,999 | 78 (33.2%) | 0 (0.0%) |
| $100,000 to $149,999 | 75 (31.9%) | 4 (28.6%) |
| $150,000 or more | 12 (5.1%) | 0 (0.0%) |
| Total | 235 (100.0%) | 14 (100.0%) |
Monthly Housing Cost Tiers in Hebron
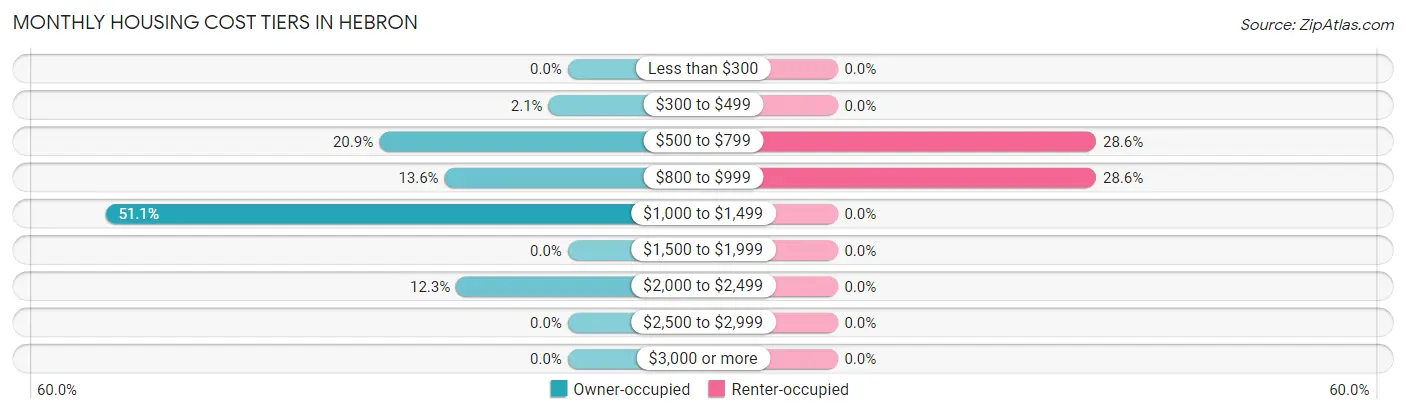
| Monthly Cost | Owner-occupied | Renter-occupied |
| Less than $300 | 0 (0.0%) | 0 (0.0%) |
| $300 to $499 | 5 (2.1%) | 0 (0.0%) |
| $500 to $799 | 49 (20.8%) | 4 (28.6%) |
| $800 to $999 | 32 (13.6%) | 4 (28.6%) |
| $1,000 to $1,499 | 120 (51.1%) | 0 (0.0%) |
| $1,500 to $1,999 | 0 (0.0%) | 0 (0.0%) |
| $2,000 to $2,499 | 29 (12.3%) | 0 (0.0%) |
| $2,500 to $2,999 | 0 (0.0%) | 0 (0.0%) |
| $3,000 or more | 0 (0.0%) | 0 (0.0%) |
| Total | 235 (100.0%) | 14 (100.0%) |
Physical Housing Characteristics in Hebron
Housing Structures in Hebron
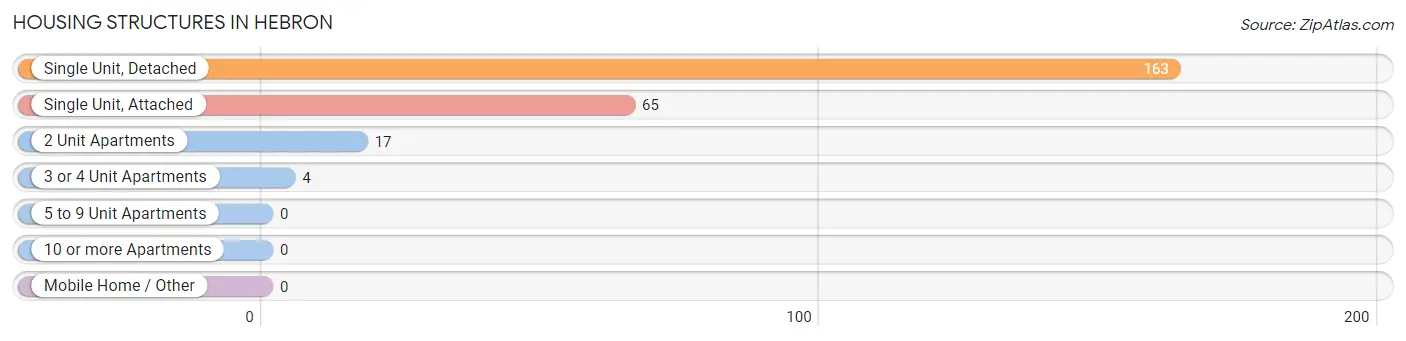
| Structure Type | # Housing Units | % Housing Units |
| Single Unit, Detached | 163 | 65.5% |
| Single Unit, Attached | 65 | 26.1% |
| 2 Unit Apartments | 17 | 6.8% |
| 3 or 4 Unit Apartments | 4 | 1.6% |
| 5 to 9 Unit Apartments | 0 | 0.0% |
| 10 or more Apartments | 0 | 0.0% |
| Mobile Home / Other | 0 | 0.0% |
| Total | 249 | 100.0% |
Housing Structures by Occupancy in Hebron
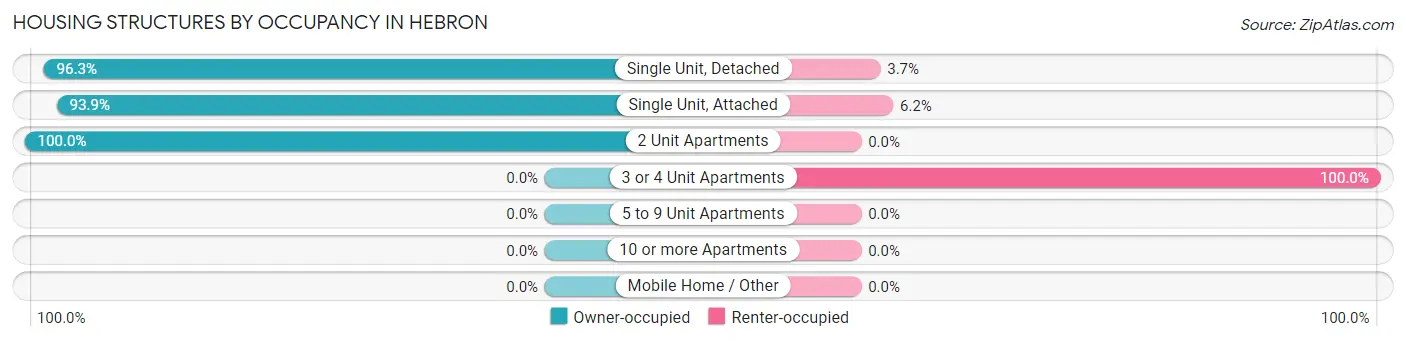
| Structure Type | Owner-occupied | Renter-occupied |
| Single Unit, Detached | 157 (96.3%) | 6 (3.7%) |
| Single Unit, Attached | 61 (93.9%) | 4 (6.1%) |
| 2 Unit Apartments | 17 (100.0%) | 0 (0.0%) |
| 3 or 4 Unit Apartments | 0 (0.0%) | 4 (100.0%) |
| 5 to 9 Unit Apartments | 0 (0.0%) | 0 (0.0%) |
| 10 or more Apartments | 0 (0.0%) | 0 (0.0%) |
| Mobile Home / Other | 0 (0.0%) | 0 (0.0%) |
| Total | 235 (94.4%) | 14 (5.6%) |
Housing Structures by Number of Rooms in Hebron
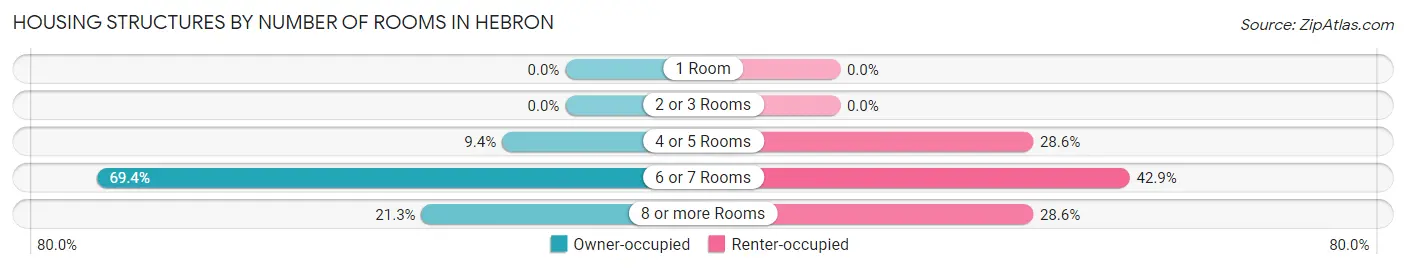
| Number of Rooms | Owner-occupied | Renter-occupied |
| 1 Room | 0 (0.0%) | 0 (0.0%) |
| 2 or 3 Rooms | 0 (0.0%) | 0 (0.0%) |
| 4 or 5 Rooms | 22 (9.4%) | 4 (28.6%) |
| 6 or 7 Rooms | 163 (69.4%) | 6 (42.9%) |
| 8 or more Rooms | 50 (21.3%) | 4 (28.6%) |
| Total | 235 (100.0%) | 14 (100.0%) |
Housing Structure by Heating Type in Hebron
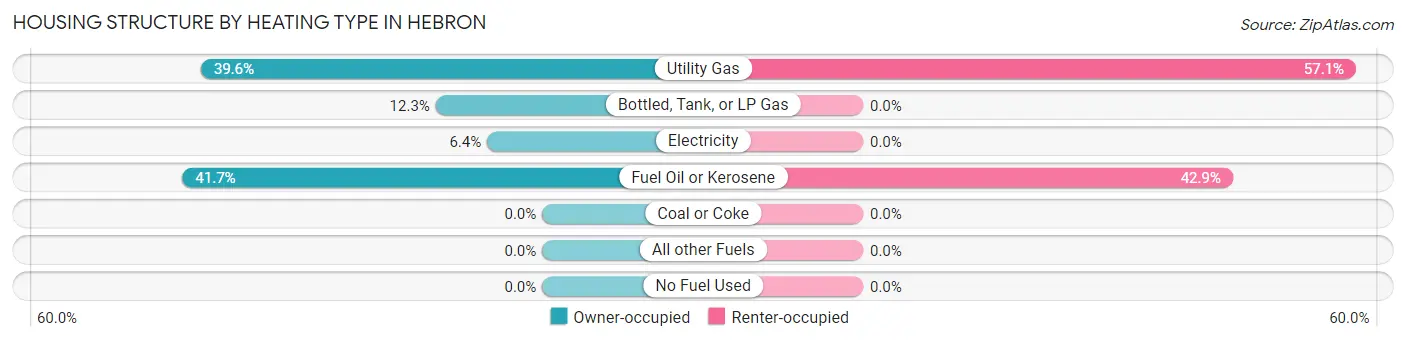
| Heating Type | Owner-occupied | Renter-occupied |
| Utility Gas | 93 (39.6%) | 8 (57.1%) |
| Bottled, Tank, or LP Gas | 29 (12.3%) | 0 (0.0%) |
| Electricity | 15 (6.4%) | 0 (0.0%) |
| Fuel Oil or Kerosene | 98 (41.7%) | 6 (42.9%) |
| Coal or Coke | 0 (0.0%) | 0 (0.0%) |
| All other Fuels | 0 (0.0%) | 0 (0.0%) |
| No Fuel Used | 0 (0.0%) | 0 (0.0%) |
| Total | 235 (100.0%) | 14 (100.0%) |
Household Vehicle Usage in Hebron
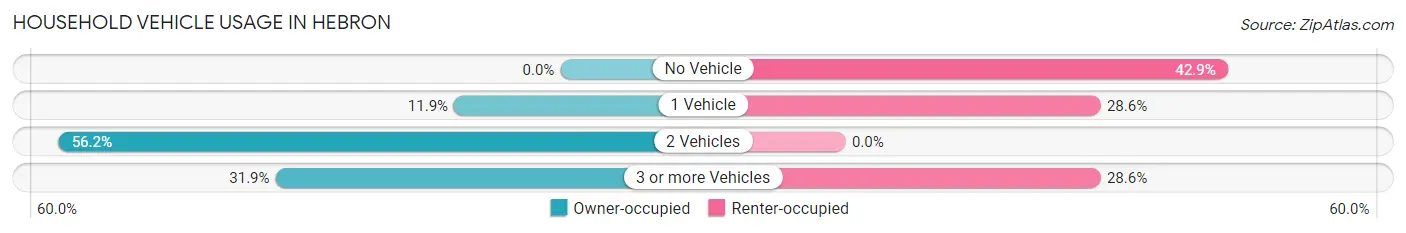
| Vehicles per Household | Owner-occupied | Renter-occupied |
| No Vehicle | 0 (0.0%) | 6 (42.9%) |
| 1 Vehicle | 28 (11.9%) | 4 (28.6%) |
| 2 Vehicles | 132 (56.2%) | 0 (0.0%) |
| 3 or more Vehicles | 75 (31.9%) | 4 (28.6%) |
| Total | 235 (100.0%) | 14 (100.0%) |
Real Estate & Mortgages in Hebron
Real Estate and Mortgage Overview in Hebron
| Characteristic | Without Mortgage | With Mortgage |
| Housing Units | 61 | 174 |
| Median Property Value | $114,800 | $159,600 |
| Median Household Income | - | - |
| Monthly Housing Costs | $559 | $0 |
| Real Estate Taxes | $1,609 | $0 |
Property Value by Mortgage Status in Hebron
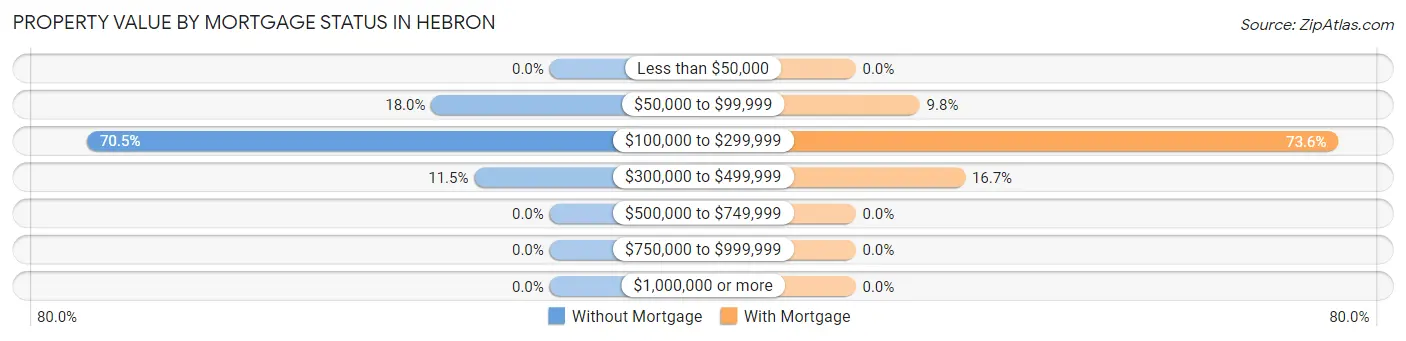
| Property Value | Without Mortgage | With Mortgage |
| Less than $50,000 | 0 (0.0%) | 0 (0.0%) |
| $50,000 to $99,999 | 11 (18.0%) | 17 (9.8%) |
| $100,000 to $299,999 | 43 (70.5%) | 128 (73.6%) |
| $300,000 to $499,999 | 7 (11.5%) | 29 (16.7%) |
| $500,000 to $749,999 | 0 (0.0%) | 0 (0.0%) |
| $750,000 to $999,999 | 0 (0.0%) | 0 (0.0%) |
| $1,000,000 or more | 0 (0.0%) | 0 (0.0%) |
| Total | 61 (100.0%) | 174 (100.0%) |
Household Income by Mortgage Status in Hebron
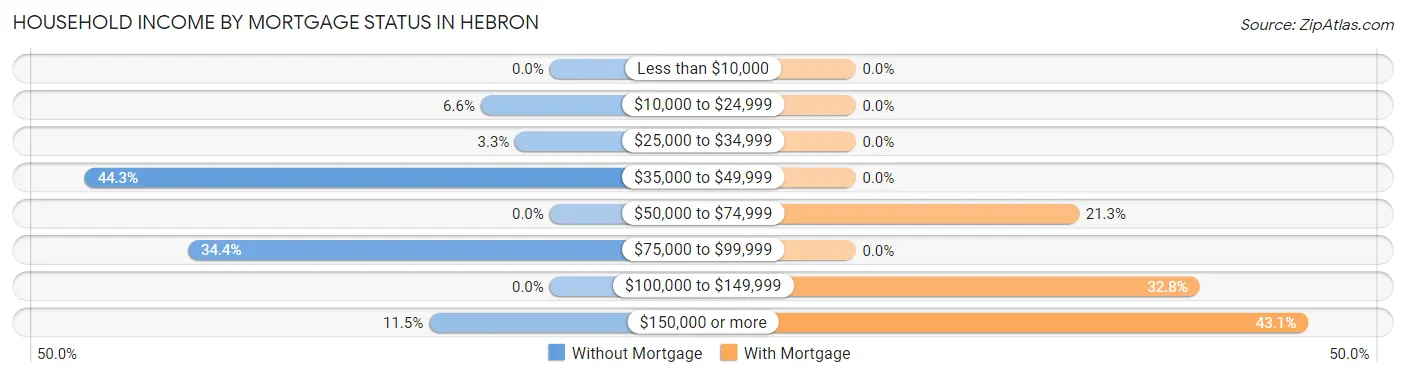
| Household Income | Without Mortgage | With Mortgage |
| Less than $10,000 | 0 (0.0%) | 0 (0.0%) |
| $10,000 to $24,999 | 4 (6.6%) | 0 (0.0%) |
| $25,000 to $34,999 | 2 (3.3%) | 0 (0.0%) |
| $35,000 to $49,999 | 27 (44.3%) | 0 (0.0%) |
| $50,000 to $74,999 | 0 (0.0%) | 37 (21.3%) |
| $75,000 to $99,999 | 21 (34.4%) | 0 (0.0%) |
| $100,000 to $149,999 | 0 (0.0%) | 57 (32.8%) |
| $150,000 or more | 7 (11.5%) | 75 (43.1%) |
| Total | 61 (100.0%) | 174 (100.0%) |
Property Value to Household Income Ratio in Hebron
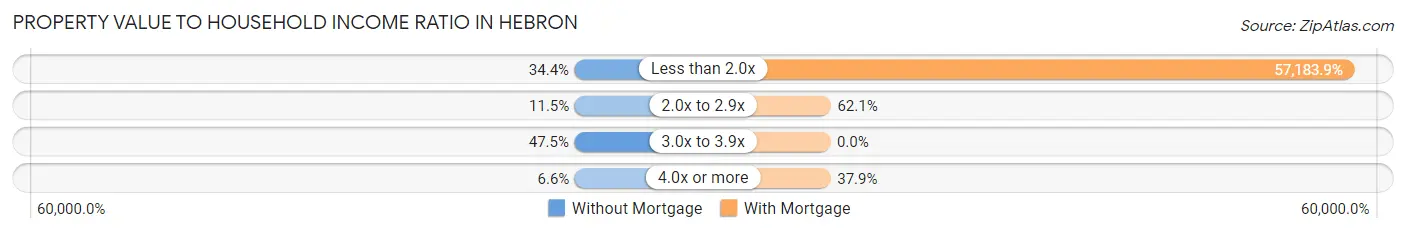
| Value-to-Income Ratio | Without Mortgage | With Mortgage |
| Less than 2.0x | 21 (34.4%) | 99,500 (57,183.9%) |
| 2.0x to 2.9x | 7 (11.5%) | 108 (62.1%) |
| 3.0x to 3.9x | 29 (47.5%) | 0 (0.0%) |
| 4.0x or more | 4 (6.6%) | 66 (37.9%) |
| Total | 61 (100.0%) | 174 (100.0%) |
Real Estate Taxes by Mortgage Status in Hebron
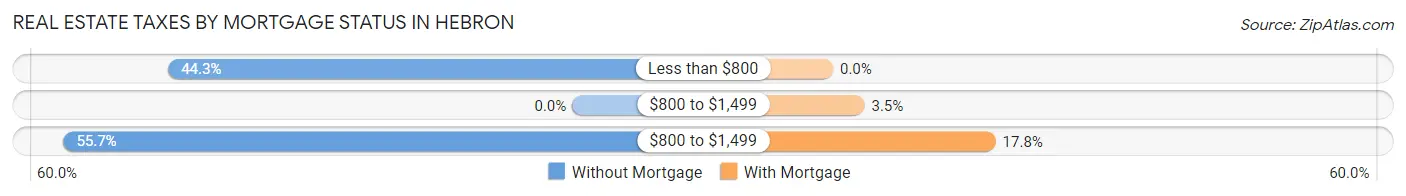
| Property Taxes | Without Mortgage | With Mortgage |
| Less than $800 | 27 (44.3%) | 0 (0.0%) |
| $800 to $1,499 | 0 (0.0%) | 6 (3.5%) |
| $800 to $1,499 | 34 (55.7%) | 31 (17.8%) |
| Total | 61 (100.0%) | 174 (100.0%) |
Health & Disability in Hebron
Health Insurance Coverage by Age in Hebron
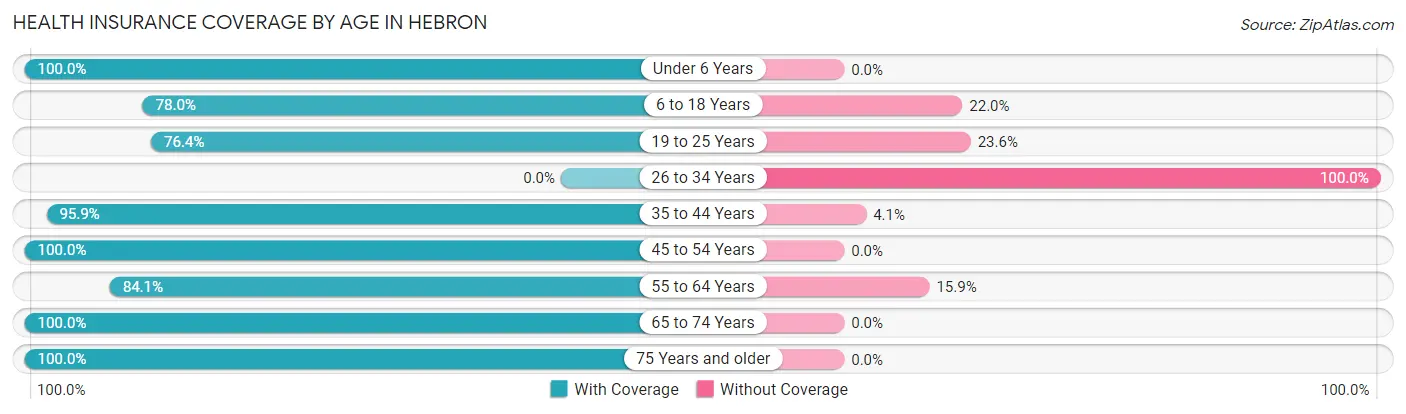
| Age Bracket | With Coverage | Without Coverage |
| Under 6 Years | 76 (100.0%) | 0 (0.0%) |
| 6 to 18 Years | 85 (78.0%) | 24 (22.0%) |
| 19 to 25 Years | 94 (76.4%) | 29 (23.6%) |
| 26 to 34 Years | 0 (0.0%) | 27 (100.0%) |
| 35 to 44 Years | 94 (95.9%) | 4 (4.1%) |
| 45 to 54 Years | 81 (100.0%) | 0 (0.0%) |
| 55 to 64 Years | 90 (84.1%) | 17 (15.9%) |
| 65 to 74 Years | 61 (100.0%) | 0 (0.0%) |
| 75 Years and older | 42 (100.0%) | 0 (0.0%) |
| Total | 623 (86.1%) | 101 (14.0%) |
Health Insurance Coverage by Citizenship Status in Hebron
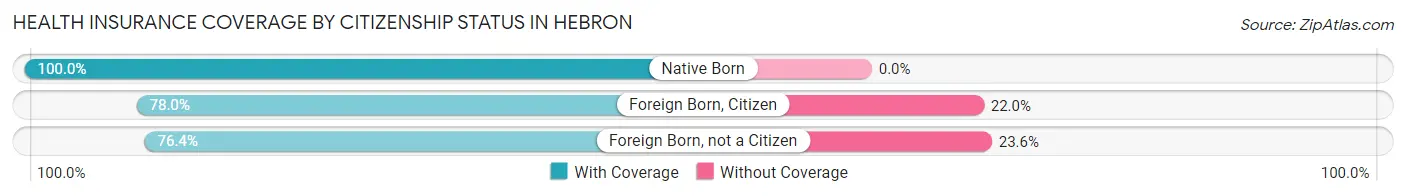
| Citizenship Status | With Coverage | Without Coverage |
| Native Born | 76 (100.0%) | 0 (0.0%) |
| Foreign Born, Citizen | 85 (78.0%) | 24 (22.0%) |
| Foreign Born, not a Citizen | 94 (76.4%) | 29 (23.6%) |
Health Insurance Coverage by Household Income in Hebron
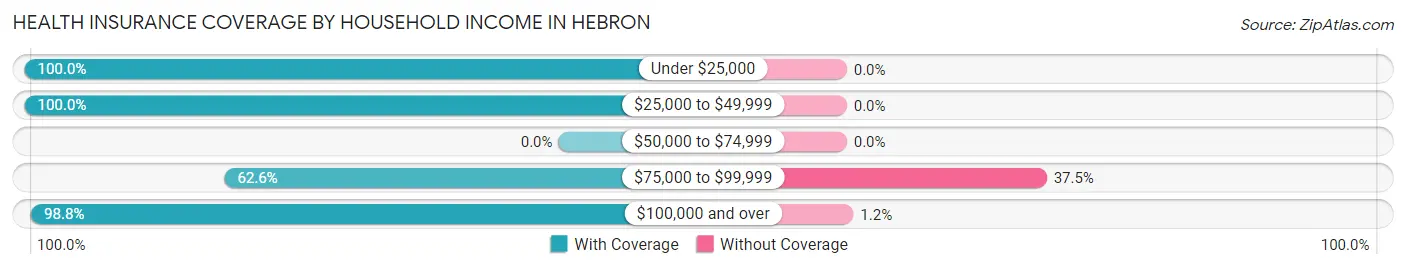
| Household Income | With Coverage | Without Coverage |
| Under $25,000 | 10 (100.0%) | 0 (0.0%) |
| $25,000 to $49,999 | 132 (100.0%) | 0 (0.0%) |
| $50,000 to $74,999 | 0 (0.0%) | 0 (0.0%) |
| $75,000 to $99,999 | 162 (62.5%) | 97 (37.4%) |
| $100,000 and over | 319 (98.8%) | 4 (1.2%) |
Public vs Private Health Insurance Coverage by Age in Hebron
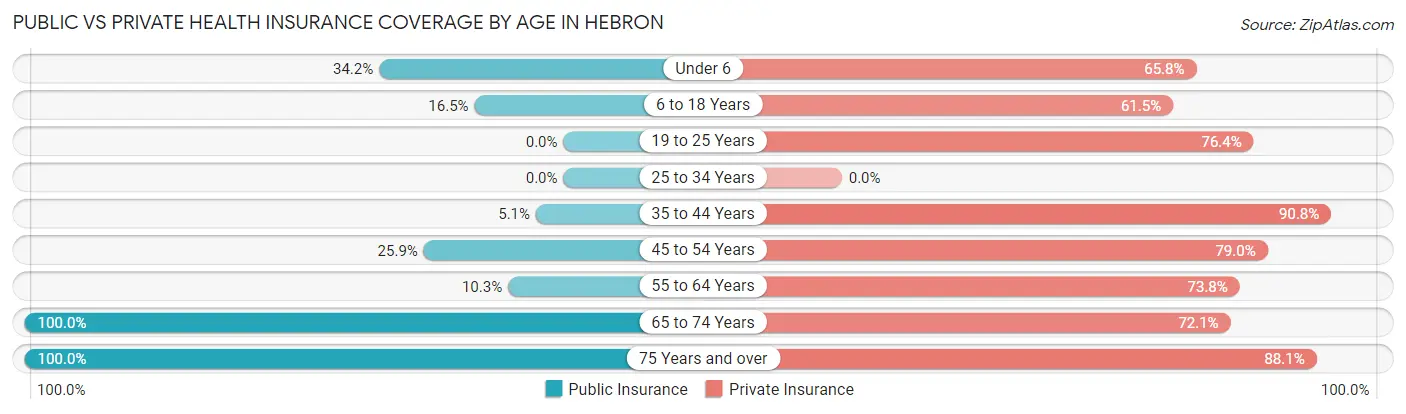
| Age Bracket | Public Insurance | Private Insurance |
| Under 6 | 26 (34.2%) | 50 (65.8%) |
| 6 to 18 Years | 18 (16.5%) | 67 (61.5%) |
| 19 to 25 Years | 0 (0.0%) | 94 (76.4%) |
| 25 to 34 Years | 0 (0.0%) | 0 (0.0%) |
| 35 to 44 Years | 5 (5.1%) | 89 (90.8%) |
| 45 to 54 Years | 21 (25.9%) | 64 (79.0%) |
| 55 to 64 Years | 11 (10.3%) | 79 (73.8%) |
| 65 to 74 Years | 61 (100.0%) | 44 (72.1%) |
| 75 Years and over | 42 (100.0%) | 37 (88.1%) |
| Total | 184 (25.4%) | 524 (72.4%) |
Disability Status by Sex by Age in Hebron
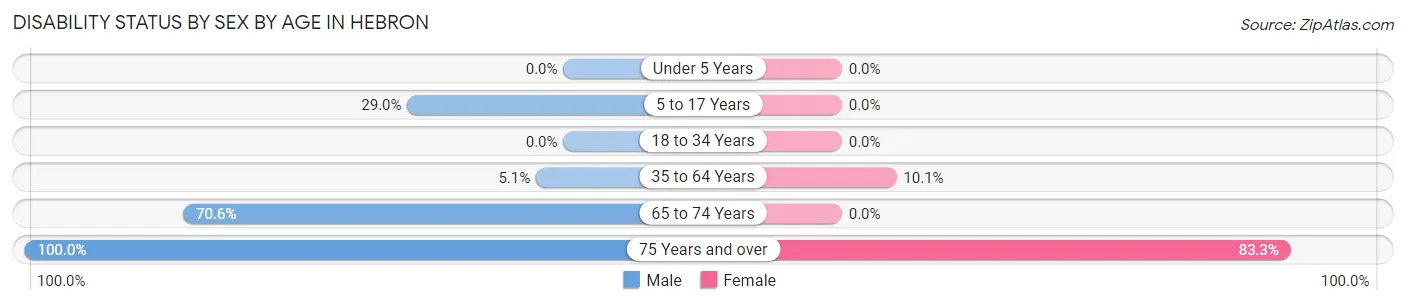
| Age Bracket | Male | Female |
| Under 5 Years | 0 (0.0%) | 0 (0.0%) |
| 5 to 17 Years | 11 (28.9%) | 0 (0.0%) |
| 18 to 34 Years | 0 (0.0%) | 0 (0.0%) |
| 35 to 64 Years | 7 (5.1%) | 15 (10.1%) |
| 65 to 74 Years | 12 (70.6%) | 0 (0.0%) |
| 75 Years and over | 12 (100.0%) | 25 (83.3%) |
Disability Class by Sex by Age in Hebron
Disability Class: Hearing Difficulty
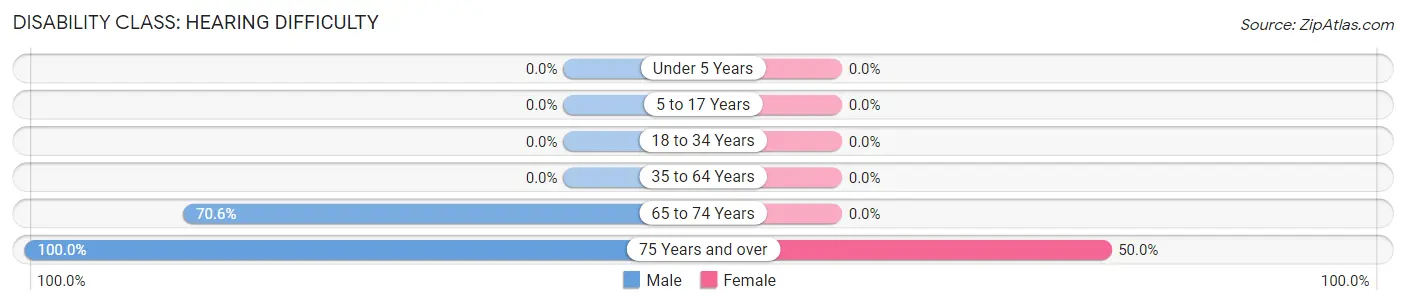
| Age Bracket | Male | Female |
| Under 5 Years | 0 (0.0%) | 0 (0.0%) |
| 5 to 17 Years | 0 (0.0%) | 0 (0.0%) |
| 18 to 34 Years | 0 (0.0%) | 0 (0.0%) |
| 35 to 64 Years | 0 (0.0%) | 0 (0.0%) |
| 65 to 74 Years | 12 (70.6%) | 0 (0.0%) |
| 75 Years and over | 12 (100.0%) | 15 (50.0%) |
Disability Class: Vision Difficulty
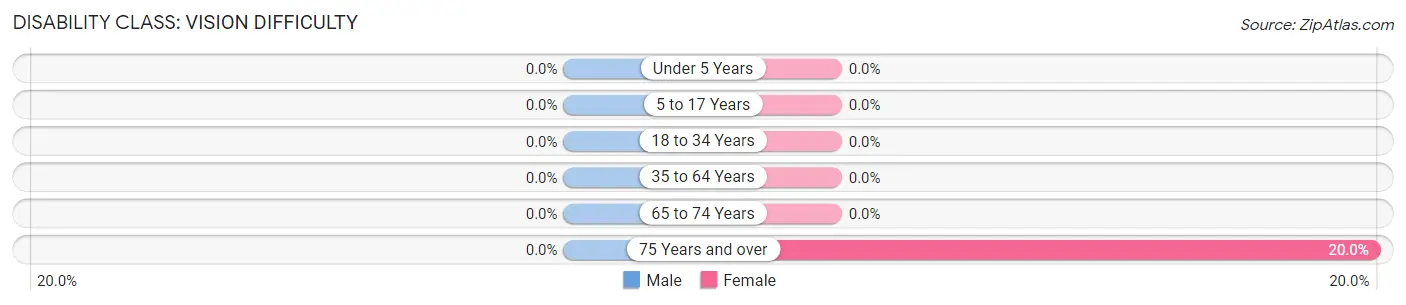
| Age Bracket | Male | Female |
| Under 5 Years | 0 (0.0%) | 0 (0.0%) |
| 5 to 17 Years | 0 (0.0%) | 0 (0.0%) |
| 18 to 34 Years | 0 (0.0%) | 0 (0.0%) |
| 35 to 64 Years | 0 (0.0%) | 0 (0.0%) |
| 65 to 74 Years | 0 (0.0%) | 0 (0.0%) |
| 75 Years and over | 0 (0.0%) | 6 (20.0%) |
Disability Class: Cognitive Difficulty
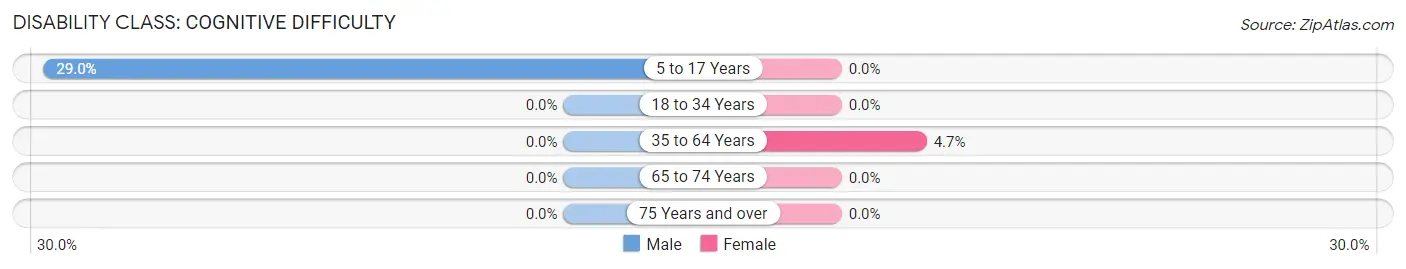
| Age Bracket | Male | Female |
| 5 to 17 Years | 11 (28.9%) | 0 (0.0%) |
| 18 to 34 Years | 0 (0.0%) | 0 (0.0%) |
| 35 to 64 Years | 0 (0.0%) | 7 (4.7%) |
| 65 to 74 Years | 0 (0.0%) | 0 (0.0%) |
| 75 Years and over | 0 (0.0%) | 0 (0.0%) |
Disability Class: Ambulatory Difficulty
| Age Bracket | Male | Female |
| 5 to 17 Years | 0 (0.0%) | 0 (0.0%) |
| 18 to 34 Years | 0 (0.0%) | 0 (0.0%) |
| 35 to 64 Years | 7 (5.1%) | 8 (5.4%) |
| 65 to 74 Years | 0 (0.0%) | 0 (0.0%) |
| 75 Years and over | 8 (66.7%) | 23 (76.7%) |
Disability Class: Self-Care Difficulty
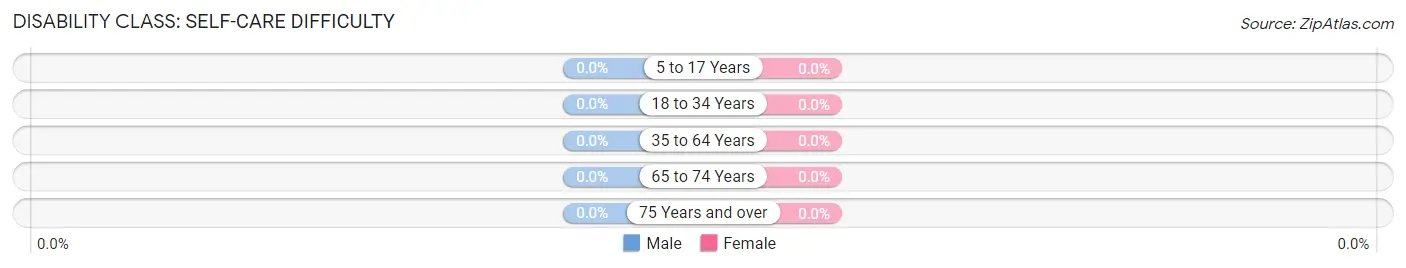
| Age Bracket | Male | Female |
| 5 to 17 Years | 0 (0.0%) | 0 (0.0%) |
| 18 to 34 Years | 0 (0.0%) | 0 (0.0%) |
| 35 to 64 Years | 0 (0.0%) | 0 (0.0%) |
| 65 to 74 Years | 0 (0.0%) | 0 (0.0%) |
| 75 Years and over | 0 (0.0%) | 0 (0.0%) |
Technology Access in Hebron
Computing Device Access in Hebron
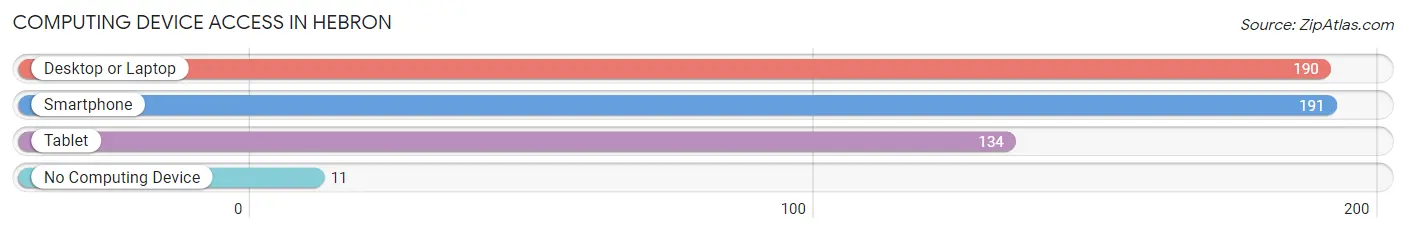
| Device Type | # Households | % Households |
| Desktop or Laptop | 190 | 76.3% |
| Smartphone | 191 | 76.7% |
| Tablet | 134 | 53.8% |
| No Computing Device | 11 | 4.4% |
| Total | 249 | 100.0% |
Internet Access in Hebron
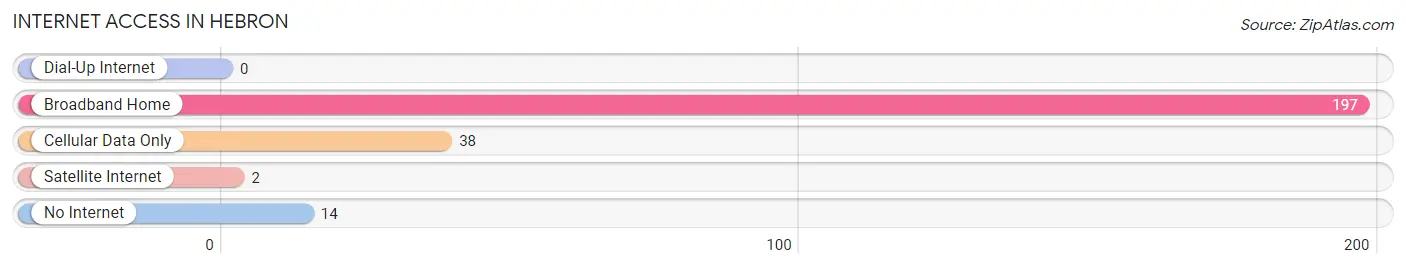
| Internet Type | # Households | % Households |
| Dial-Up Internet | 0 | 0.0% |
| Broadband Home | 197 | 79.1% |
| Cellular Data Only | 38 | 15.3% |
| Satellite Internet | 2 | 0.8% |
| No Internet | 14 | 5.6% |
| Total | 249 | 100.0% |
Hebron Summary
Hebron is a small borough located in Washington County, Pennsylvania. It is situated in the southwestern corner of the state, approximately 25 miles south of Pittsburgh. The population of Hebron was 1,093 at the 2010 census.
History
Hebron was founded in 1817 by a group of settlers from the nearby town of Washington. The town was named after the biblical city of Hebron, which is located in the West Bank. The settlers were attracted to the area due to its fertile soil and abundant natural resources.
The first settlers in Hebron were mostly farmers, and the town quickly grew to become a thriving agricultural community. In 1820, the first school was built in Hebron, and the town soon became a center of education and culture.
In the late 19th century, Hebron began to experience a period of industrialization. The town was home to several coal mines, and the local economy began to shift from agriculture to industry. By the early 20th century, Hebron had become a major coal-mining center.
Geography
Hebron is located in southwestern Pennsylvania, approximately 25 miles south of Pittsburgh. The borough is situated in the foothills of the Allegheny Mountains, and is surrounded by rolling hills and lush forests. The town is located along the banks of the Monongahela River, which provides a scenic backdrop for the town.
The climate in Hebron is generally mild, with warm summers and cold winters. The average annual temperature is around 50 degrees Fahrenheit.
Economy
Hebron’s economy is largely based on agriculture and tourism. The town is home to several farms, which produce a variety of crops, including corn, wheat, and hay. The town is also home to several wineries, which produce a variety of wines.
Tourism is an important part of the local economy. The town is home to several historic sites, including the Hebron Historic District, which is listed on the National Register of Historic Places. The town also hosts several annual festivals and events, which attract visitors from all over the region.
Demographics
As of the 2010 census, the population of Hebron was 1,093. The racial makeup of the town was 97.3% White, 0.7% African American, 0.2% Native American, 0.2% Asian, and 1.6% from two or more races. The median household income was $37,917, and the median family income was $45,625.
Hebron is a small, rural town with a close-knit community. The town is home to several churches, and the local school system is highly rated. The town is also home to several parks and recreational areas, which provide a variety of activities for residents and visitors alike.
Common Questions
What is Per Capita Income in Hebron?
Per Capita income in Hebron is $25,593.
What is the Median Family Income in Hebron?
Median Family Income in Hebron is $99,429.
What is the Median Household income in Hebron?
Median Household Income in Hebron is $97,607.
What is Income or Wage Gap in Hebron?
Income or Wage Gap in Hebron is 18.8%.
Women in Hebron earn 81.2 cents for every dollar earned by a man.
What is Inequality or Gini Index in Hebron?
Inequality or Gini Index in Hebron is 0.23.
What is the Total Population of Hebron?
Total Population of Hebron is 1,080.
What is the Total Male Population of Hebron?
Total Male Population of Hebron is 470.
What is the Total Female Population of Hebron?
Total Female Population of Hebron is 610.
What is the Ratio of Males per 100 Females in Hebron?
There are 77.05 Males per 100 Females in Hebron.
What is the Ratio of Females per 100 Males in Hebron?
There are 129.79 Females per 100 Males in Hebron.
What is the Median Population Age in Hebron?
Median Population Age in Hebron is 51.6 Years.
What is the Average Family Size in Hebron
Average Family Size in Hebron is 3.2 People.
What is the Average Household Size in Hebron
Average Household Size in Hebron is 2.9 People.
How Large is the Labor Force in Hebron?
There are 450 People in the Labor Forcein in Hebron.
What is the Percentage of People in the Labor Force in Hebron?
48.3% of People are in the Labor Force in Hebron.