Browntown, PA Map & Demographics
Browntown Map
Browntown Overview
$29,693
PER CAPITA INCOME
$65,677
AVG FAMILY INCOME
$63,438
AVG HOUSEHOLD INCOME
9.4%
WAGE / INCOME GAP [ % ]
90.6¢/ $1
WAGE / INCOME GAP [ $ ]
0.33
INEQUALITY / GINI INDEX
1,476
TOTAL POPULATION
816
MALE POPULATION
660
FEMALE POPULATION
123.64
MALES / 100 FEMALES
80.88
FEMALES / 100 MALES
37.2
MEDIAN AGE
3.1
AVG FAMILY SIZE
2.4
AVG HOUSEHOLD SIZE
788
LABOR FORCE [ PEOPLE ]
65.2%
PERCENT IN LABOR FORCE
3.2%
UNEMPLOYMENT RATE
Income in Browntown
Income Overview in Browntown
Per Capita Income in Browntown is $29,693, while median incomes of families and households are $65,677 and $63,438 respectively.
| Characteristic | Number | Measure |
| Per Capita Income | 1,476 | $29,693 |
| Median Family Income | 360 | $65,677 |
| Mean Family Income | 360 | $74,643 |
| Median Household Income | 610 | $63,438 |
| Mean Household Income | 610 | $69,733 |
| Income Deficit | 360 | $0 |
| Wage / Income Gap (%) | 1,476 | 9.41% |
| Wage / Income Gap ($) | 1,476 | 90.59¢ per $1 |
| Gini / Inequality Index | 1,476 | 0.33 |
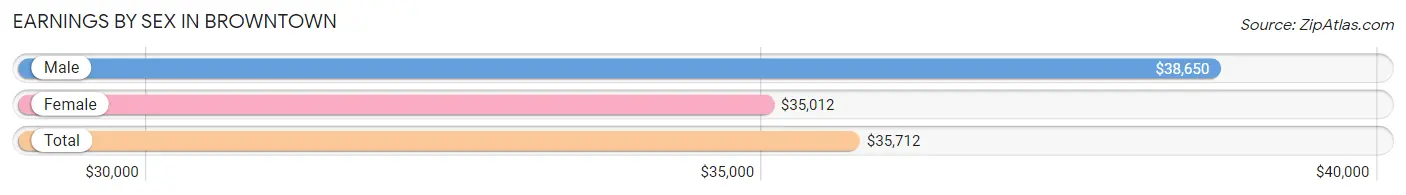
Earnings by Sex in Browntown
Average Earnings in Browntown are $35,712, $38,650 for men and $35,012 for women, a difference of 9.4%.
| Sex | Number | Average Earnings |
| Male | 397 (49.9%) | $38,650 |
| Female | 399 (50.1%) | $35,012 |
| Total | 796 (100.0%) | $35,712 |
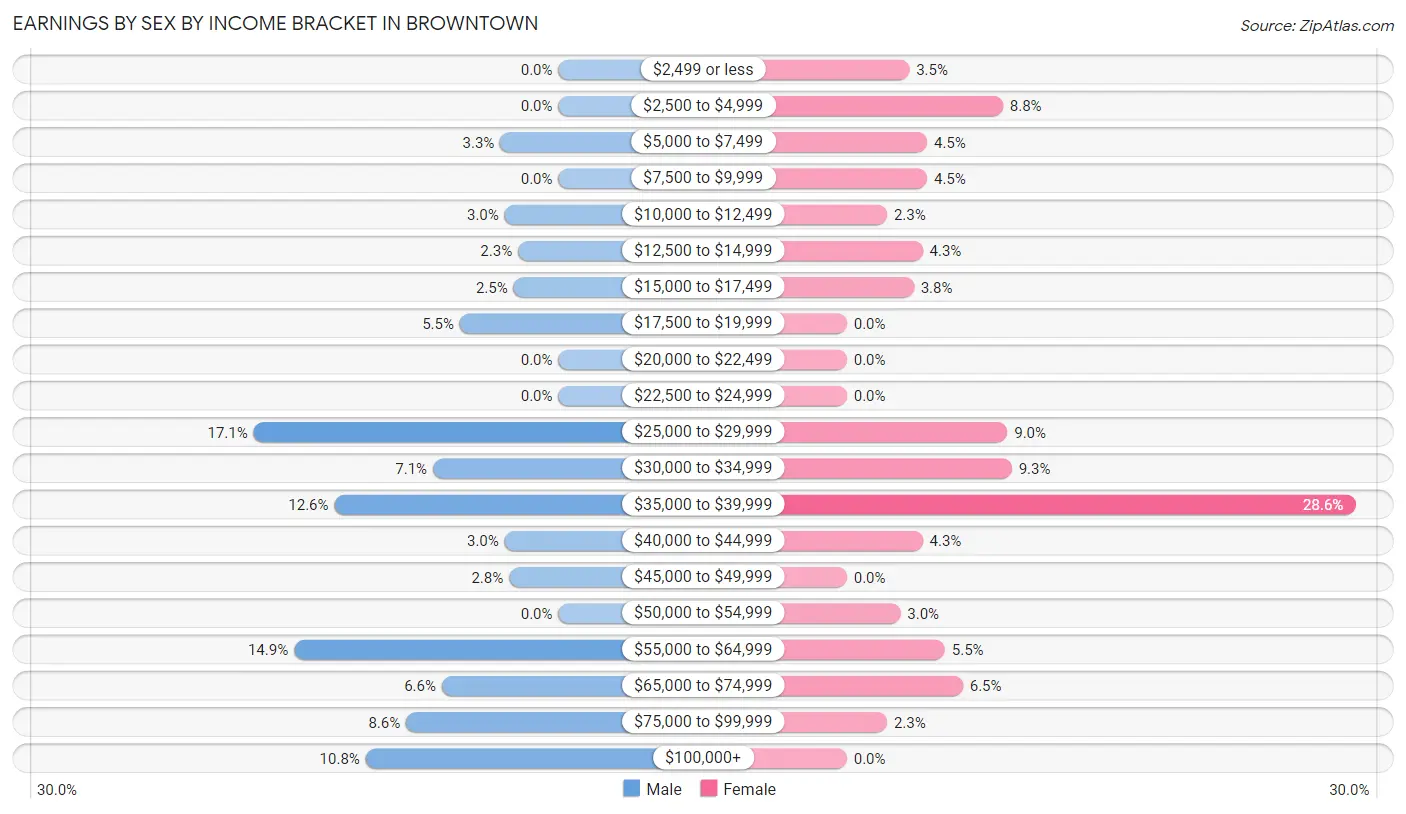
Earnings by Sex by Income Bracket in Browntown
The most common earnings brackets in Browntown are $25,000 to $29,999 for men (68 | 17.1%) and $35,000 to $39,999 for women (114 | 28.6%).
| Income | Male | Female |
| $2,499 or less | 0 (0.0%) | 14 (3.5%) |
| $2,500 to $4,999 | 0 (0.0%) | 35 (8.8%) |
| $5,000 to $7,499 | 13 (3.3%) | 18 (4.5%) |
| $7,500 to $9,999 | 0 (0.0%) | 18 (4.5%) |
| $10,000 to $12,499 | 12 (3.0%) | 9 (2.3%) |
| $12,500 to $14,999 | 9 (2.3%) | 17 (4.3%) |
| $15,000 to $17,499 | 10 (2.5%) | 15 (3.8%) |
| $17,500 to $19,999 | 22 (5.5%) | 0 (0.0%) |
| $20,000 to $22,499 | 0 (0.0%) | 0 (0.0%) |
| $22,500 to $24,999 | 0 (0.0%) | 0 (0.0%) |
| $25,000 to $29,999 | 68 (17.1%) | 36 (9.0%) |
| $30,000 to $34,999 | 28 (7.0%) | 37 (9.3%) |
| $35,000 to $39,999 | 50 (12.6%) | 114 (28.6%) |
| $40,000 to $44,999 | 12 (3.0%) | 17 (4.3%) |
| $45,000 to $49,999 | 11 (2.8%) | 0 (0.0%) |
| $50,000 to $54,999 | 0 (0.0%) | 12 (3.0%) |
| $55,000 to $64,999 | 59 (14.9%) | 22 (5.5%) |
| $65,000 to $74,999 | 26 (6.6%) | 26 (6.5%) |
| $75,000 to $99,999 | 34 (8.6%) | 9 (2.3%) |
| $100,000+ | 43 (10.8%) | 0 (0.0%) |
| Total | 397 (100.0%) | 399 (100.0%) |
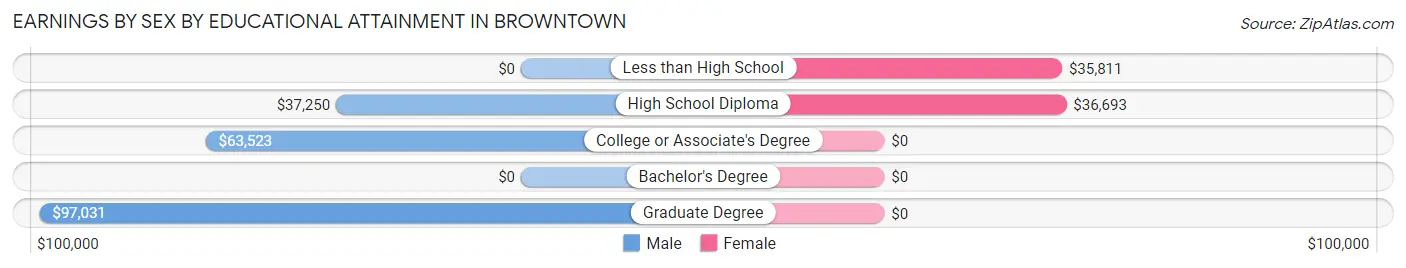
Earnings by Sex by Educational Attainment in Browntown
Average earnings in Browntown are $41,111 for men and $35,298 for women, a difference of 14.1%. Men with an educational attainment of graduate degree enjoy the highest average annual earnings of $97,031, while those with high school diploma education earn the least with $37,250. Women with an educational attainment of high school diploma earn the most with the average annual earnings of $36,693, while those with less than high school education have the smallest earnings of $35,811.
| Educational Attainment | Male Income | Female Income |
| Less than High School | - | - |
| High School Diploma | $37,250 | $36,693 |
| College or Associate's Degree | $63,523 | $0 |
| Bachelor's Degree | - | - |
| Graduate Degree | $97,031 | $0 |
| Total | $41,111 | $35,298 |
Family Income in Browntown
Family Income Brackets in Browntown
According to the Browntown family income data, there are 133 families falling into the $50,000 to $74,999 income range, which is the most common income bracket and makes up 36.9% of all families.
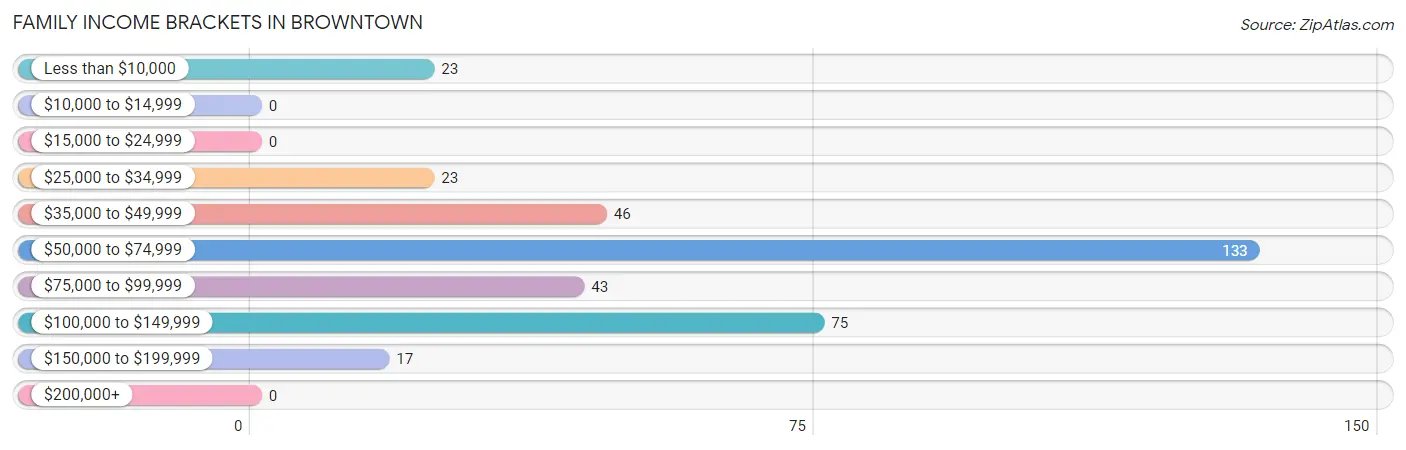
| Income Bracket | # Families | % Families |
| Less than $10,000 | 23 | 6.4% |
| $10,000 to $14,999 | 0 | 0.0% |
| $15,000 to $24,999 | 0 | 0.0% |
| $25,000 to $34,999 | 23 | 6.4% |
| $35,000 to $49,999 | 46 | 12.8% |
| $50,000 to $74,999 | 133 | 36.9% |
| $75,000 to $99,999 | 43 | 11.9% |
| $100,000 to $149,999 | 75 | 20.8% |
| $150,000 to $199,999 | 17 | 4.7% |
| $200,000+ | 0 | 0.0% |
Family Income by Famaliy Size in Browntown
3-person families (54 | 15.0%) account for the highest median family income in Browntown with $92,222 per family, while 2-person families (212 | 58.9%) have the highest median income of $31,406 per family member.
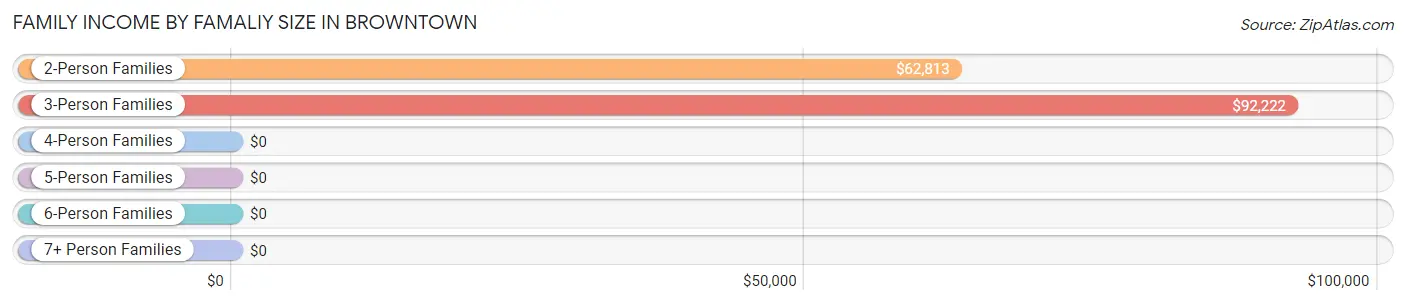
| Income Bracket | # Families | Median Income |
| 2-Person Families | 212 (58.9%) | $62,813 |
| 3-Person Families | 54 (15.0%) | $92,222 |
| 4-Person Families | 37 (10.3%) | $0 |
| 5-Person Families | 0 (0.0%) | $0 |
| 6-Person Families | 57 (15.8%) | $0 |
| 7+ Person Families | 0 (0.0%) | $0 |
| Total | 360 (100.0%) | $65,677 |
Family Income by Number of Earners in Browntown
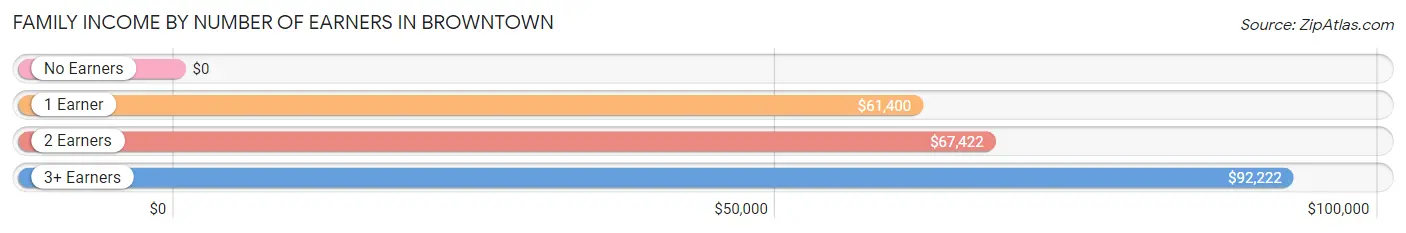
| Number of Earners | # Families | Median Income |
| No Earners | 57 (15.8%) | $0 |
| 1 Earner | 140 (38.9%) | $61,400 |
| 2 Earners | 123 (34.2%) | $67,422 |
| 3+ Earners | 40 (11.1%) | $92,222 |
| Total | 360 (100.0%) | $65,677 |
Household Income in Browntown
Household Income Brackets in Browntown
With 219 households falling in the category, the $50,000 to $74,999 income range is the most frequent in Browntown, accounting for 35.9% of all households. In contrast, only 9 households (1.5%) fall into the $200,000+ income bracket, making it the least populous group.
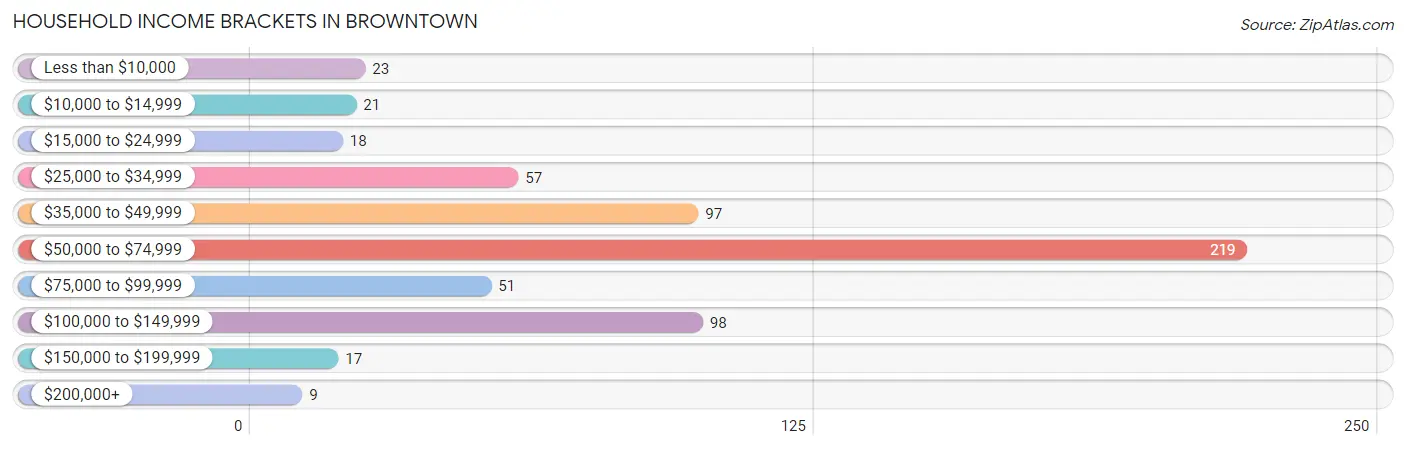
| Income Bracket | # Households | % Households |
| Less than $10,000 | 23 | 3.8% |
| $10,000 to $14,999 | 21 | 3.4% |
| $15,000 to $24,999 | 18 | 3.0% |
| $25,000 to $34,999 | 57 | 9.3% |
| $35,000 to $49,999 | 97 | 15.9% |
| $50,000 to $74,999 | 219 | 35.9% |
| $75,000 to $99,999 | 51 | 8.4% |
| $100,000 to $149,999 | 98 | 16.1% |
| $150,000 to $199,999 | 17 | 2.8% |
| $200,000+ | 9 | 1.5% |
Household Income by Householder Age in Browntown
The median household income in Browntown is $63,438, with the highest median household income of $71,190 found in the 45 to 64 years age bracket for the primary householder. A total of 166 households (27.2%) fall into this category. Meanwhile, the 15 to 24 years age bracket for the primary householder has the lowest median household income of $0, with 12 households (2.0%) in this group.
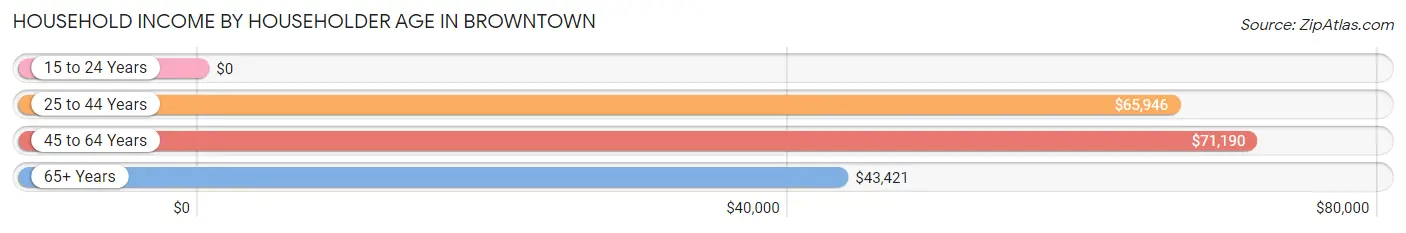
| Income Bracket | # Households | Median Income |
| 15 to 24 Years | 12 (2.0%) | $0 |
| 25 to 44 Years | 232 (38.0%) | $65,946 |
| 45 to 64 Years | 166 (27.2%) | $71,190 |
| 65+ Years | 200 (32.8%) | $43,421 |
| Total | 610 (100.0%) | $63,438 |
Poverty in Browntown
Income Below Poverty by Sex and Age in Browntown
With 2.4% poverty level for males and 9.4% for females among the residents of Browntown, under 5 year old males and 6 to 11 year old females are the most vulnerable to poverty, with 12 males (54.5%) and 24 females (42.1%) in their respective age groups living below the poverty level.
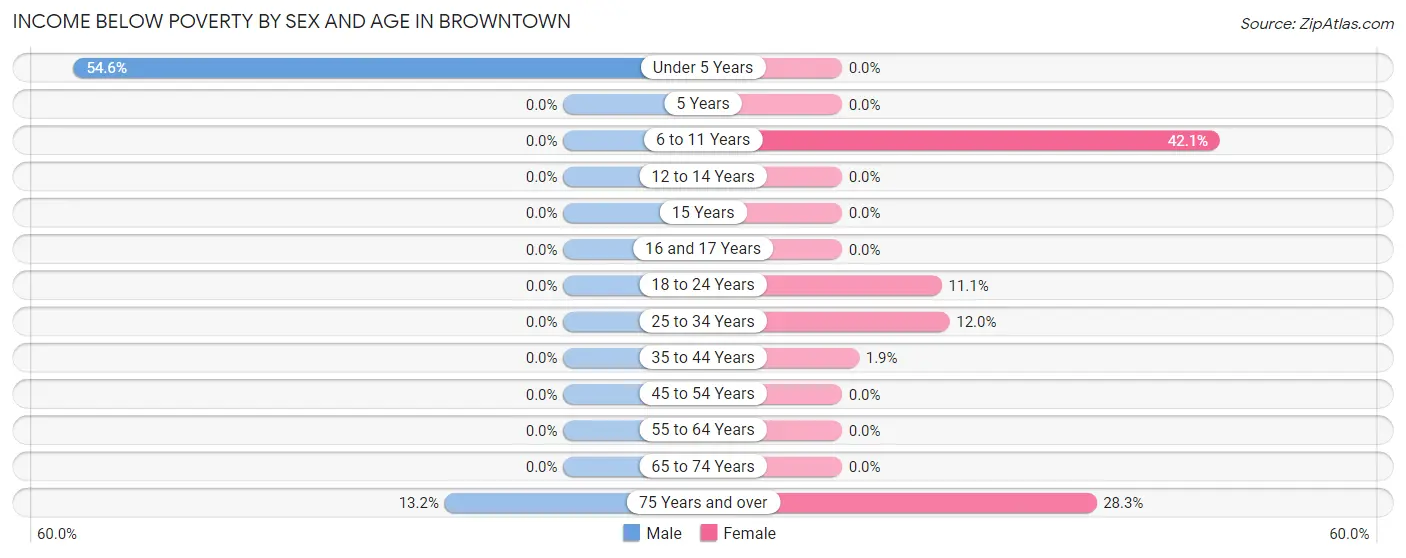
| Age Bracket | Male | Female |
| Under 5 Years | 12 (54.5%) | 0 (0.0%) |
| 5 Years | 0 (0.0%) | 0 (0.0%) |
| 6 to 11 Years | 0 (0.0%) | 24 (42.1%) |
| 12 to 14 Years | 0 (0.0%) | 0 (0.0%) |
| 15 Years | 0 (0.0%) | 0 (0.0%) |
| 16 and 17 Years | 0 (0.0%) | 0 (0.0%) |
| 18 to 24 Years | 0 (0.0%) | 3 (11.1%) |
| 25 to 34 Years | 0 (0.0%) | 14 (12.0%) |
| 35 to 44 Years | 0 (0.0%) | 2 (1.9%) |
| 45 to 54 Years | 0 (0.0%) | 0 (0.0%) |
| 55 to 64 Years | 0 (0.0%) | 0 (0.0%) |
| 65 to 74 Years | 0 (0.0%) | 0 (0.0%) |
| 75 Years and over | 7 (13.2%) | 17 (28.3%) |
| Total | 19 (2.4%) | 60 (9.4%) |
Income Above Poverty by Sex and Age in Browntown
According to the poverty statistics in Browntown, males aged 5 years and females aged 12 to 14 years are the age groups that are most secure financially, with 100.0% of males and 100.0% of females in these age groups living above the poverty line.
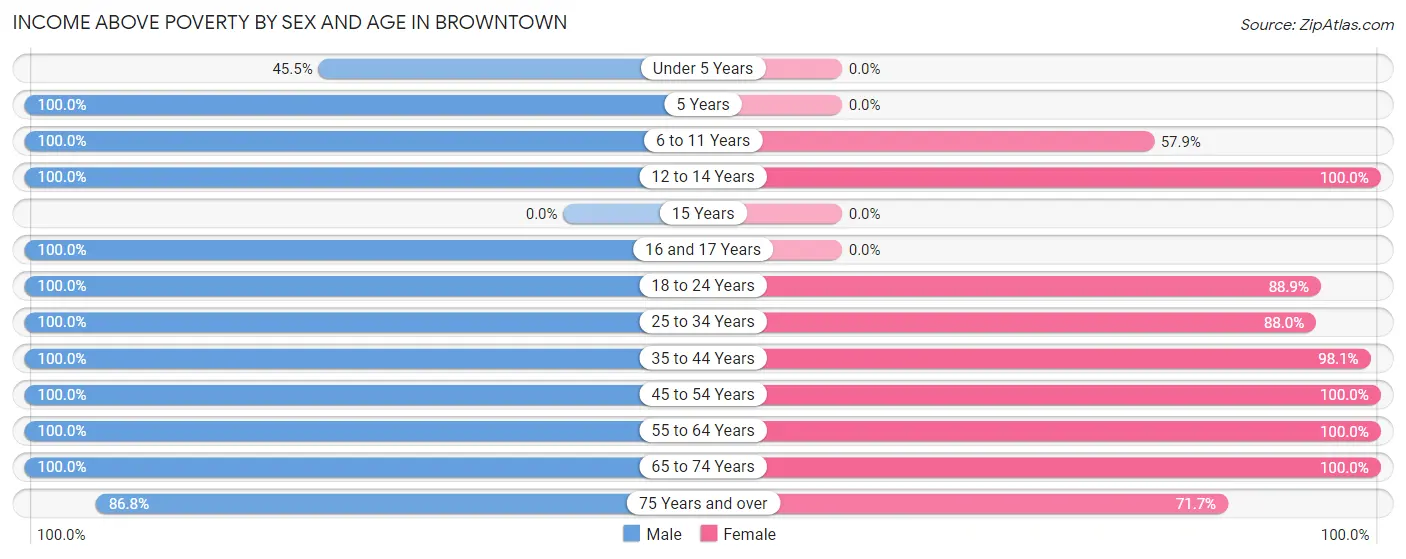
| Age Bracket | Male | Female |
| Under 5 Years | 10 (45.5%) | 0 (0.0%) |
| 5 Years | 54 (100.0%) | 0 (0.0%) |
| 6 to 11 Years | 89 (100.0%) | 33 (57.9%) |
| 12 to 14 Years | 4 (100.0%) | 8 (100.0%) |
| 15 Years | 0 (0.0%) | 0 (0.0%) |
| 16 and 17 Years | 53 (100.0%) | 0 (0.0%) |
| 18 to 24 Years | 81 (100.0%) | 24 (88.9%) |
| 25 to 34 Years | 154 (100.0%) | 103 (88.0%) |
| 35 to 44 Years | 58 (100.0%) | 104 (98.1%) |
| 45 to 54 Years | 27 (100.0%) | 45 (100.0%) |
| 55 to 64 Years | 116 (100.0%) | 164 (100.0%) |
| 65 to 74 Years | 91 (100.0%) | 57 (100.0%) |
| 75 Years and over | 46 (86.8%) | 43 (71.7%) |
| Total | 783 (97.6%) | 581 (90.6%) |
Income Below Poverty Among Married-Couple Families in Browntown
The poverty statistics for married-couple families in Browntown show that 2.9% or 7 of the total 240 families live below the poverty line. Families with no children have the highest poverty rate of 4.6%, comprising of 7 families. On the other hand, families with 1 or 2 children have the lowest poverty rate of 0.0%, which includes 0 families.
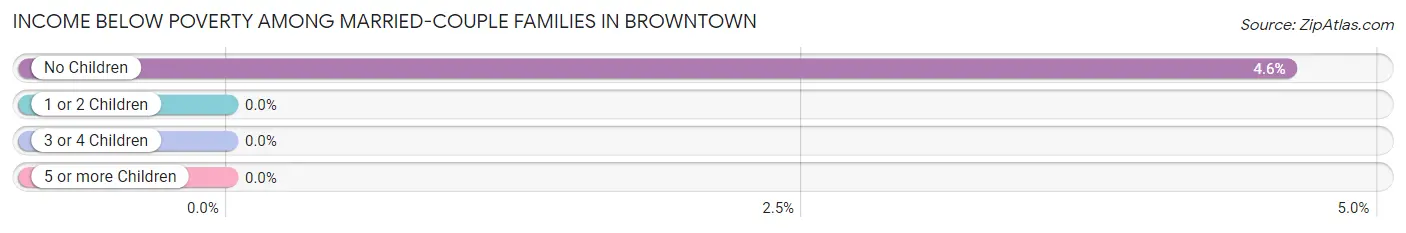
| Children | Above Poverty | Below Poverty |
| No Children | 145 (95.4%) | 7 (4.6%) |
| 1 or 2 Children | 40 (100.0%) | 0 (0.0%) |
| 3 or 4 Children | 48 (100.0%) | 0 (0.0%) |
| 5 or more Children | 0 (0.0%) | 0 (0.0%) |
| Total | 233 (97.1%) | 7 (2.9%) |
Income Below Poverty Among Single-Parent Households in Browntown
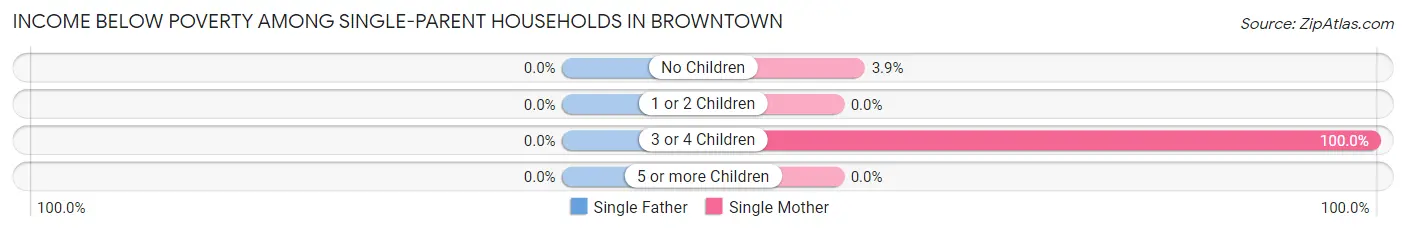
| Children | Single Father | Single Mother |
| No Children | 0 (0.0%) | 2 (3.9%) |
| 1 or 2 Children | 0 (0.0%) | 0 (0.0%) |
| 3 or 4 Children | 0 (0.0%) | 14 (100.0%) |
| 5 or more Children | 0 (0.0%) | 0 (0.0%) |
| Total | 0 (0.0%) | 16 (18.4%) |
Income Below Poverty Among Married-Couple vs Single-Parent Households in Browntown
The poverty data for Browntown shows that 7 of the married-couple family households (2.9%) and 16 of the single-parent households (13.3%) are living below the poverty level. Within the married-couple family households, those with no children have the highest poverty rate, with 7 households (4.6%) falling below the poverty line. Among the single-parent households, those with 3 or 4 children have the highest poverty rate, with 14 household (100.0%) living below poverty.
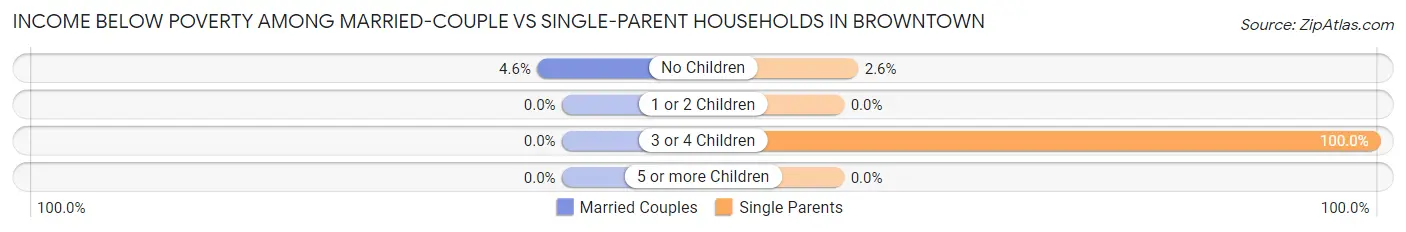
| Children | Married-Couple Families | Single-Parent Households |
| No Children | 7 (4.6%) | 2 (2.6%) |
| 1 or 2 Children | 0 (0.0%) | 0 (0.0%) |
| 3 or 4 Children | 0 (0.0%) | 14 (100.0%) |
| 5 or more Children | 0 (0.0%) | 0 (0.0%) |
| Total | 7 (2.9%) | 16 (13.3%) |
Race in Browntown
The most populous races in Browntown are White / Caucasian (1,449 | 98.2%), Two or more Races (19 | 1.3%), and Black / African American (8 | 0.5%).
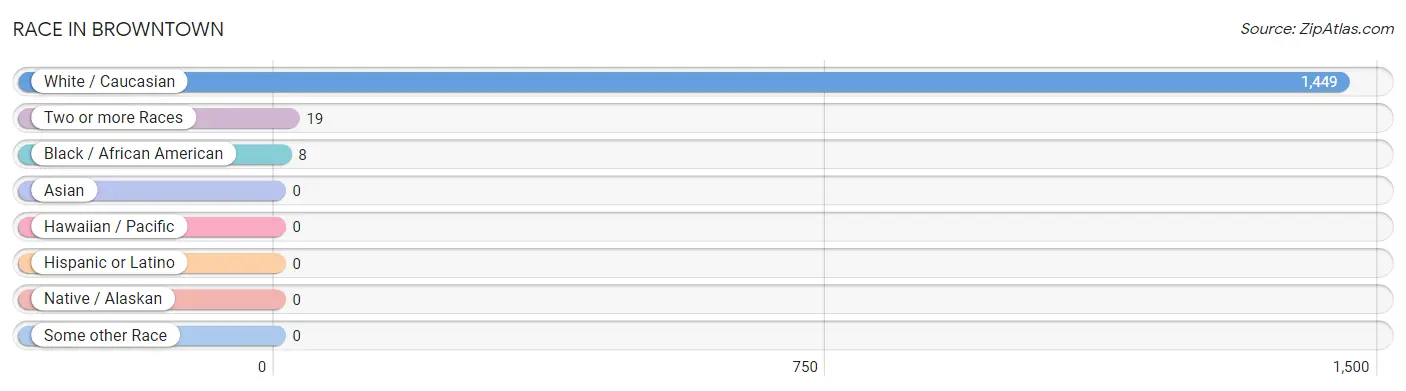
| Race | # Population | % Population |
| Asian | 0 | 0.0% |
| Black / African American | 8 | 0.5% |
| Hawaiian / Pacific | 0 | 0.0% |
| Hispanic or Latino | 0 | 0.0% |
| Native / Alaskan | 0 | 0.0% |
| White / Caucasian | 1,449 | 98.2% |
| Two or more Races | 19 | 1.3% |
| Some other Race | 0 | 0.0% |
| Total | 1,476 | 100.0% |
Ancestry in Browntown
The most populous ancestries reported in Browntown are Italian (818 | 55.4%), Irish (568 | 38.5%), German (187 | 12.7%), Polish (135 | 9.1%), and American (49 | 3.3%), together accounting for 119.0% of all Browntown residents.
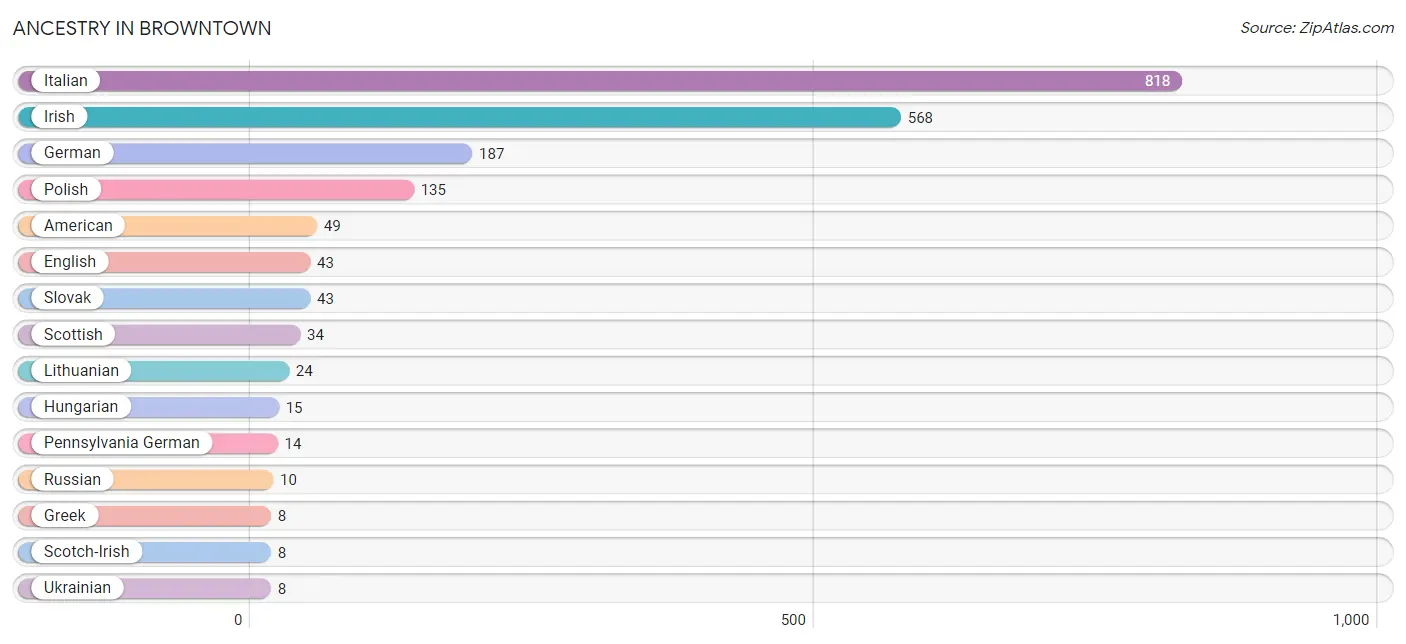
| Ancestry | # Population | % Population |
| American | 49 | 3.3% |
| Apache | 5 | 0.3% |
| Blackfeet | 5 | 0.3% |
| Czechoslovakian | 3 | 0.2% |
| English | 43 | 2.9% |
| German | 187 | 12.7% |
| Greek | 8 | 0.5% |
| Hungarian | 15 | 1.0% |
| Irish | 568 | 38.5% |
| Italian | 818 | 55.4% |
| Lithuanian | 24 | 1.6% |
| Pennsylvania German | 14 | 0.9% |
| Polish | 135 | 9.1% |
| Russian | 10 | 0.7% |
| Scotch-Irish | 8 | 0.5% |
| Scottish | 34 | 2.3% |
| Slovak | 43 | 2.9% |
| Ukrainian | 8 | 0.5% |
| Welsh | 8 | 0.5% | View All 19 Rows |
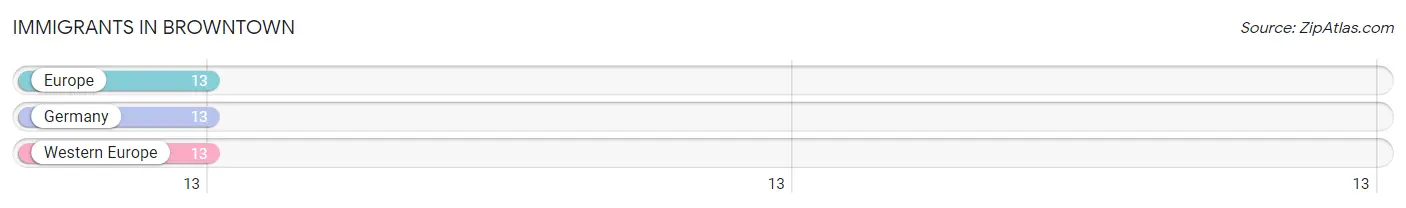
Immigrants in Browntown
The most numerous immigrant groups reported in Browntown came from Europe (13 | 0.9%), Germany (13 | 0.9%), and Western Europe (13 | 0.9%), together accounting for 2.6% of all Browntown residents.
| Immigration Origin | # Population | % Population |
| Europe | 13 | 0.9% |
| Germany | 13 | 0.9% |
| Western Europe | 13 | 0.9% | View All 3 Rows |
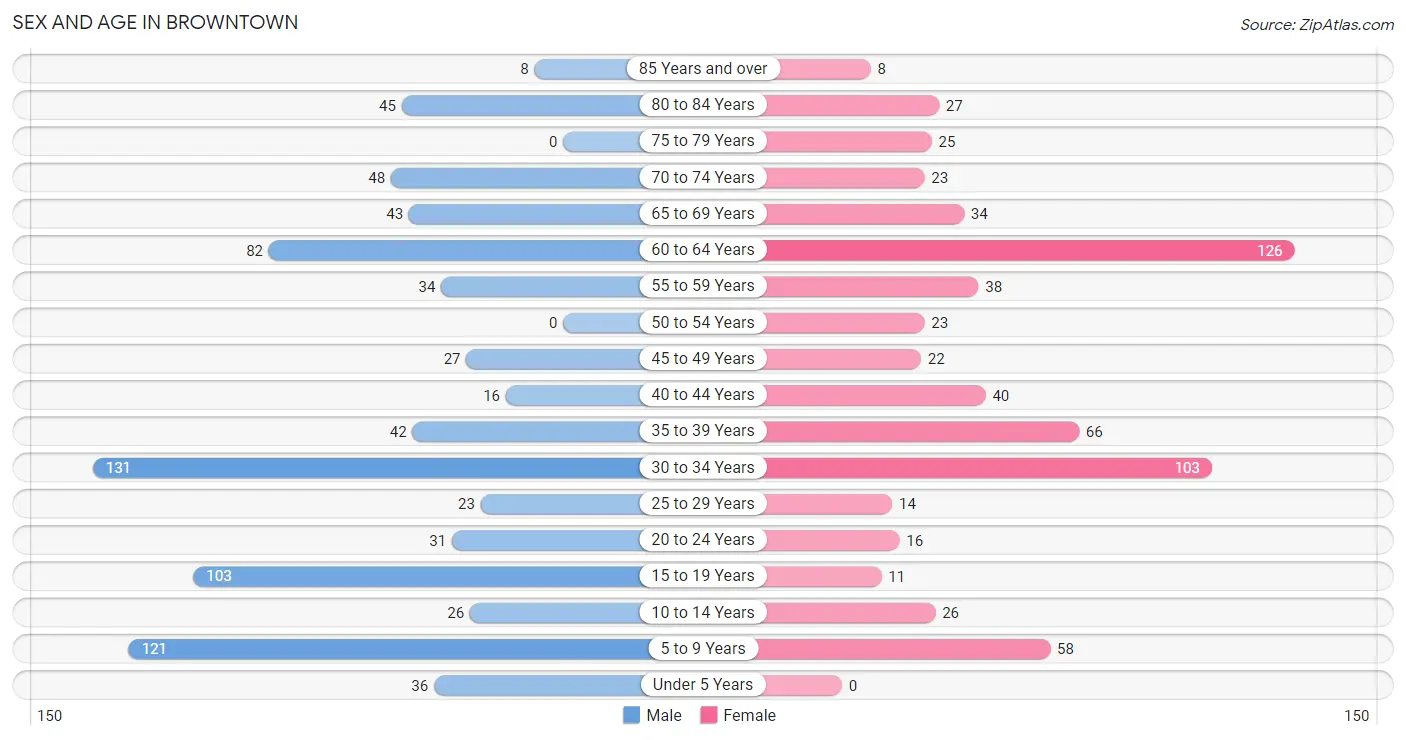
Sex and Age in Browntown
Sex and Age in Browntown
The most populous age groups in Browntown are 30 to 34 Years (131 | 16.1%) for men and 60 to 64 Years (126 | 19.1%) for women.
| Age Bracket | Male | Female |
| Under 5 Years | 36 (4.4%) | 0 (0.0%) |
| 5 to 9 Years | 121 (14.8%) | 58 (8.8%) |
| 10 to 14 Years | 26 (3.2%) | 26 (3.9%) |
| 15 to 19 Years | 103 (12.6%) | 11 (1.7%) |
| 20 to 24 Years | 31 (3.8%) | 16 (2.4%) |
| 25 to 29 Years | 23 (2.8%) | 14 (2.1%) |
| 30 to 34 Years | 131 (16.1%) | 103 (15.6%) |
| 35 to 39 Years | 42 (5.1%) | 66 (10.0%) |
| 40 to 44 Years | 16 (2.0%) | 40 (6.1%) |
| 45 to 49 Years | 27 (3.3%) | 22 (3.3%) |
| 50 to 54 Years | 0 (0.0%) | 23 (3.5%) |
| 55 to 59 Years | 34 (4.2%) | 38 (5.8%) |
| 60 to 64 Years | 82 (10.1%) | 126 (19.1%) |
| 65 to 69 Years | 43 (5.3%) | 34 (5.1%) |
| 70 to 74 Years | 48 (5.9%) | 23 (3.5%) |
| 75 to 79 Years | 0 (0.0%) | 25 (3.8%) |
| 80 to 84 Years | 45 (5.5%) | 27 (4.1%) |
| 85 Years and over | 8 (1.0%) | 8 (1.2%) |
| Total | 816 (100.0%) | 660 (100.0%) |
Families and Households in Browntown
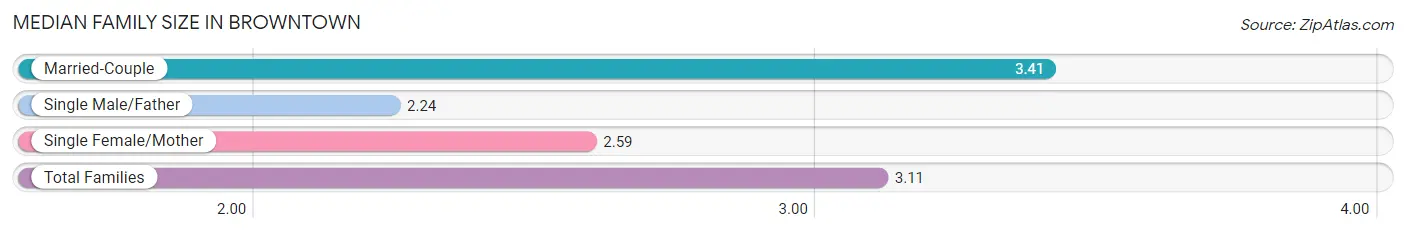
Median Family Size in Browntown
The median family size in Browntown is 3.11 persons per family, with married-couple families (240 | 66.7%) accounting for the largest median family size of 3.41 persons per family. On the other hand, single male/father families (33 | 9.2%) represent the smallest median family size with 2.24 persons per family.
| Family Type | # Families | Family Size |
| Married-Couple | 240 (66.7%) | 3.41 |
| Single Male/Father | 33 (9.2%) | 2.24 |
| Single Female/Mother | 87 (24.2%) | 2.59 |
| Total Families | 360 (100.0%) | 3.11 |
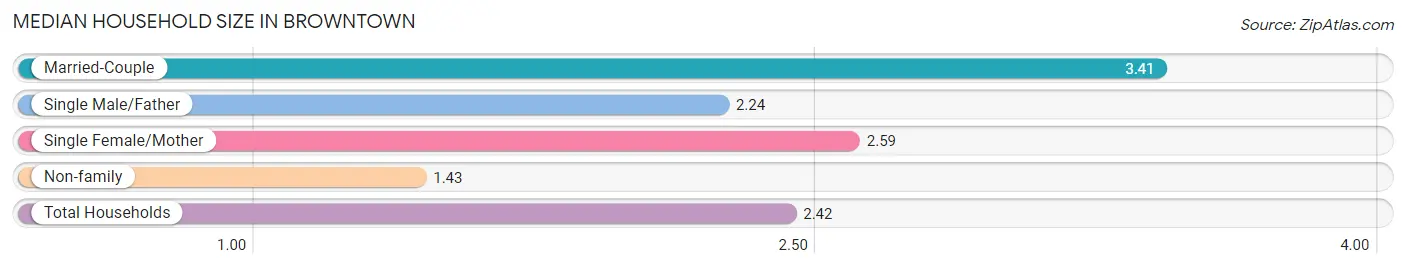
Median Household Size in Browntown
The median household size in Browntown is 2.42 persons per household, with married-couple households (240 | 39.3%) accounting for the largest median household size of 3.41 persons per household. non-family households (250 | 41.0%) represent the smallest median household size with 1.43 persons per household.
| Household Type | # Households | Household Size |
| Married-Couple | 240 (39.3%) | 3.41 |
| Single Male/Father | 33 (5.4%) | 2.24 |
| Single Female/Mother | 87 (14.3%) | 2.59 |
| Non-family | 250 (41.0%) | 1.43 |
| Total Households | 610 (100.0%) | 2.42 |
Household Size by Marriage Status in Browntown
Out of a total of 610 households in Browntown, 360 (59.0%) are family households, while 250 (41.0%) are nonfamily households. The most numerous type of family households are 2-person households, comprising 212, and the most common type of nonfamily households are 1-person households, comprising 197.
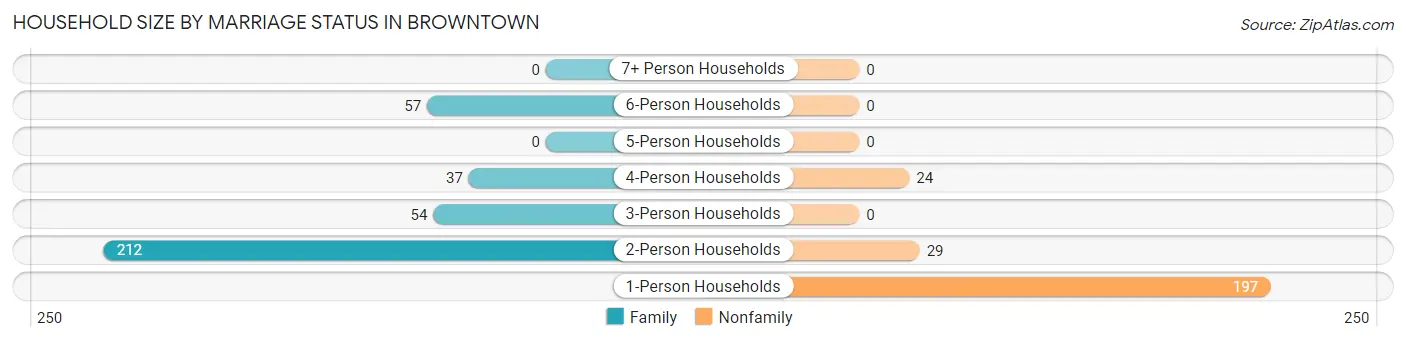
| Household Size | Family Households | Nonfamily Households |
| 1-Person Households | - | 197 (32.3%) |
| 2-Person Households | 212 (34.7%) | 29 (4.8%) |
| 3-Person Households | 54 (8.8%) | 0 (0.0%) |
| 4-Person Households | 37 (6.1%) | 24 (3.9%) |
| 5-Person Households | 0 (0.0%) | 0 (0.0%) |
| 6-Person Households | 57 (9.3%) | 0 (0.0%) |
| 7+ Person Households | 0 (0.0%) | 0 (0.0%) |
| Total | 360 (59.0%) | 250 (41.0%) |
Female Fertility in Browntown
Fertility by Age in Browntown
| Age Bracket | Women with Births | Births / 1,000 Women |
| 15 to 19 years | 0 (0.0%) | 0.0 |
| 20 to 34 years | 0 (0.0%) | 0.0 |
| 35 to 50 years | 0 (0.0%) | 0.0 |
| Total | 0 (0.0%) | 0.0 |
Fertility by Age by Marriage Status in Browntown
| Age Bracket | Married | Unmarried |
| 15 to 19 years | 0 (0.0%) | 0 (0.0%) |
| 20 to 34 years | 0 (0.0%) | 0 (0.0%) |
| 35 to 50 years | 0 (0.0%) | 0 (0.0%) |
| Total | 0 (0.0%) | 0 (0.0%) |
Fertility by Education in Browntown
| Educational Attainment | Women with Births | Births / 1,000 Women |
| Less than High School | 0 (0.0%) | 0.0 |
| High School Diploma | 0 (0.0%) | 0.0 |
| College or Associate's Degree | 0 (0.0%) | 0.0 |
| Bachelor's Degree | 0 (0.0%) | 0.0 |
| Graduate Degree | 0 (0.0%) | 0.0 |
| Total | 0 (0.0%) | 0.0 |
Fertility by Education by Marriage Status in Browntown
| Educational Attainment | Married | Unmarried |
| Less than High School | 0 (0.0%) | 0 (0.0%) |
| High School Diploma | 0 (0.0%) | 0 (0.0%) |
| College or Associate's Degree | 0 (0.0%) | 0 (0.0%) |
| Bachelor's Degree | 0 (0.0%) | 0 (0.0%) |
| Graduate Degree | 0 (0.0%) | 0 (0.0%) |
| Total | 0 (0.0%) | 0 (0.0%) |
Employment Characteristics in Browntown
Employment by Class of Employer in Browntown
Among the 707 employed individuals in Browntown, private company employees (462 | 65.3%), not-for-profit organizations (106 | 15.0%), and federal government employees (58 | 8.2%) make up the most common classes of employment.
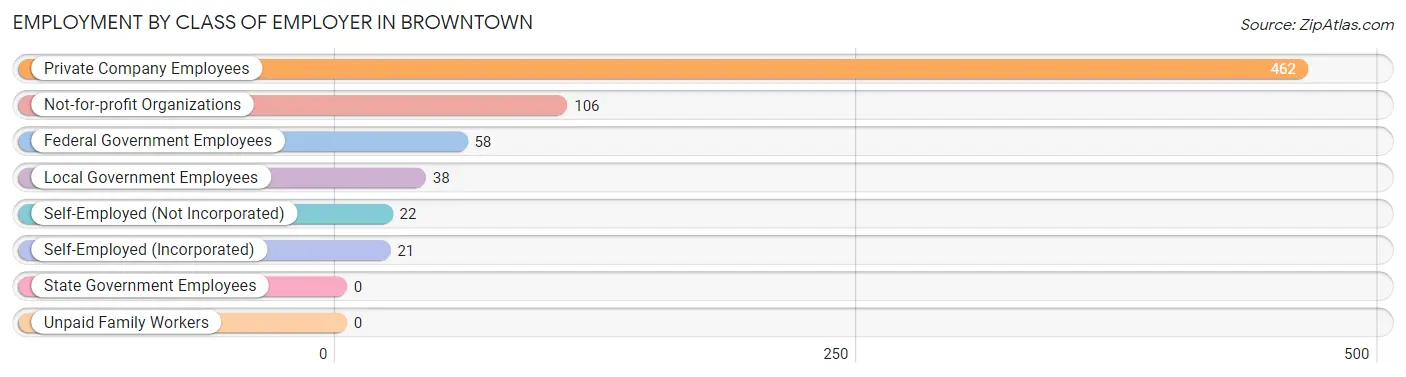
| Employer Class | # Employees | % Employees |
| Private Company Employees | 462 | 65.3% |
| Self-Employed (Incorporated) | 21 | 3.0% |
| Self-Employed (Not Incorporated) | 22 | 3.1% |
| Not-for-profit Organizations | 106 | 15.0% |
| Local Government Employees | 38 | 5.4% |
| State Government Employees | 0 | 0.0% |
| Federal Government Employees | 58 | 8.2% |
| Unpaid Family Workers | 0 | 0.0% |
| Total | 707 | 100.0% |
Employment Status by Age in Browntown
According to the labor force statistics for Browntown, out of the total population over 16 years of age (1,209), 65.2% or 788 individuals are in the labor force, with 3.2% or 25 of them unemployed. The age group with the highest labor force participation rate is 25 to 29 years, with 100.0% or 37 individuals in the labor force. Within the labor force, the 60 to 64 years age range has the highest percentage of unemployed individuals, with 16.0% or 20 of them being unemployed.
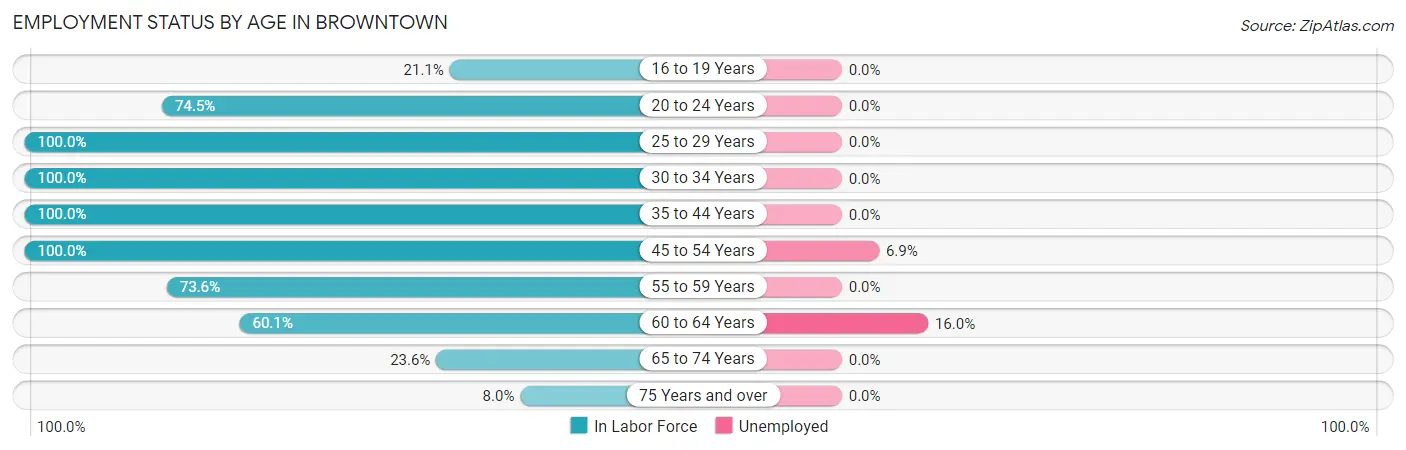
| Age Bracket | In Labor Force | Unemployed |
| 16 to 19 Years | 24 (21.1%) | 0 (0.0%) |
| 20 to 24 Years | 35 (74.5%) | 0 (0.0%) |
| 25 to 29 Years | 37 (100.0%) | 0 (0.0%) |
| 30 to 34 Years | 234 (100.0%) | 0 (0.0%) |
| 35 to 44 Years | 164 (100.0%) | 0 (0.0%) |
| 45 to 54 Years | 72 (100.0%) | 5 (6.9%) |
| 55 to 59 Years | 53 (73.6%) | 0 (0.0%) |
| 60 to 64 Years | 125 (60.1%) | 20 (16.0%) |
| 65 to 74 Years | 35 (23.6%) | 0 (0.0%) |
| 75 Years and over | 9 (8.0%) | 0 (0.0%) |
| Total | 788 (65.2%) | 25 (3.2%) |
Employment Status by Educational Attainment in Browntown
According to labor force statistics for Browntown, 87.0% of individuals (685) out of the total population between 25 and 64 years of age (787) are in the labor force, with 3.6% or 25 of them being unemployed. The group with the highest labor force participation rate are those with the educational attainment of high school diploma, with 91.6% or 350 individuals in the labor force. Within the labor force, individuals with less than high school education have the highest percentage of unemployment, with 13.0% or 10 of them being unemployed.
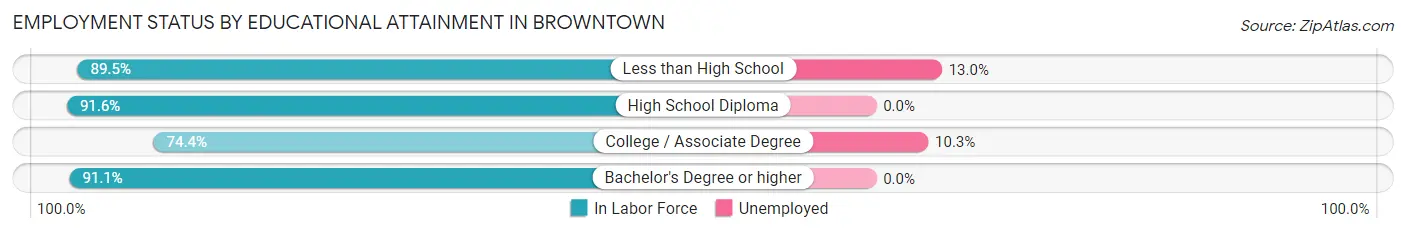
| Educational Attainment | In Labor Force | Unemployed |
| Less than High School | 77 (89.5%) | 11 (13.0%) |
| High School Diploma | 350 (91.6%) | 0 (0.0%) |
| College / Associate Degree | 145 (74.4%) | 20 (10.3%) |
| Bachelor's Degree or higher | 113 (91.1%) | 0 (0.0%) |
| Total | 685 (87.0%) | 28 (3.6%) |
Employment Occupations by Sex in Browntown
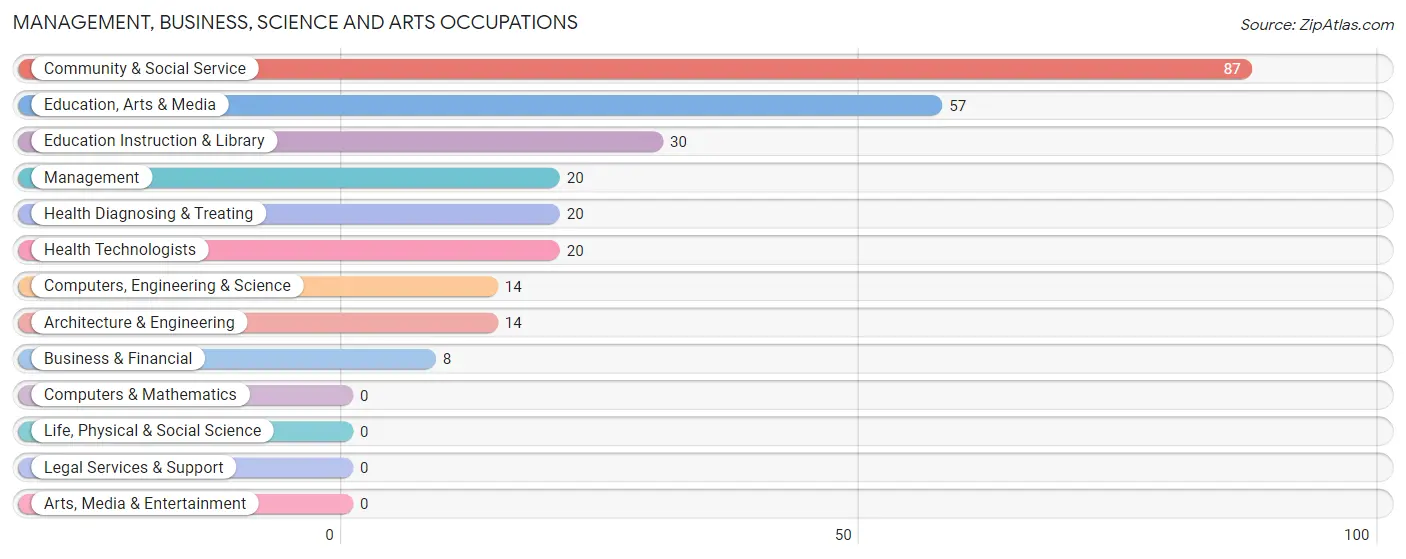
Management, Business, Science and Arts Occupations
The most common Management, Business, Science and Arts occupations in Browntown are Community & Social Service (87 | 11.4%), Education, Arts & Media (57 | 7.5%), Education Instruction & Library (30 | 3.9%), Management (20 | 2.6%), and Health Diagnosing & Treating (20 | 2.6%).
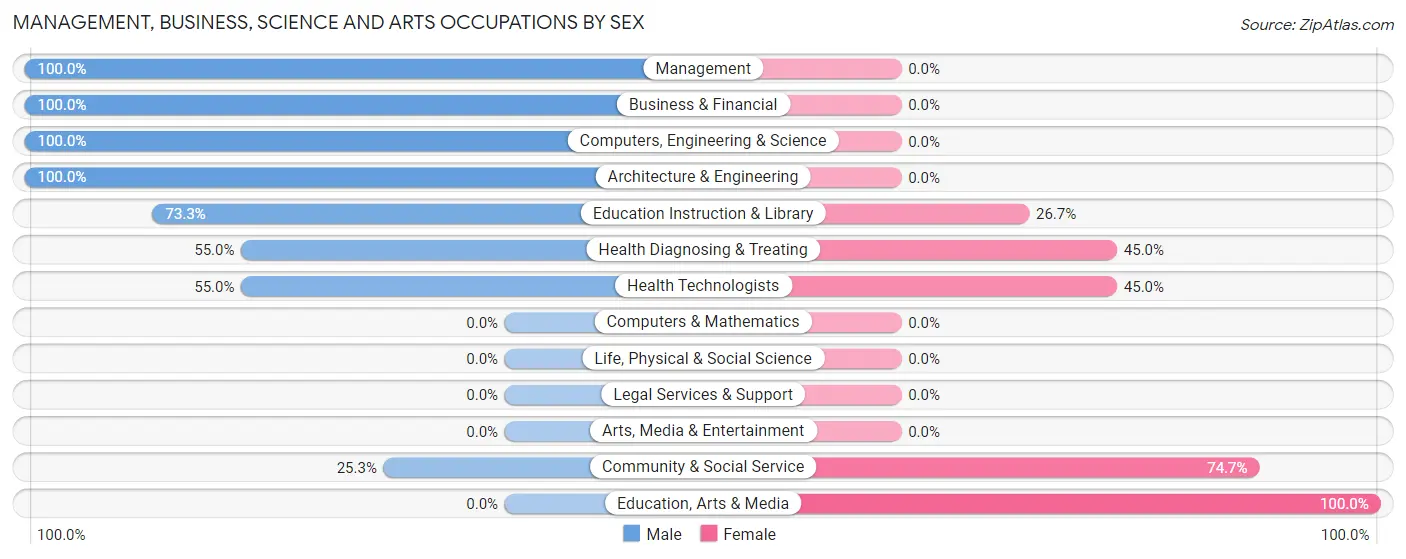
Management, Business, Science and Arts Occupations by Sex
Within the Management, Business, Science and Arts occupations in Browntown, the most male-oriented occupations are Management (100.0%), Business & Financial (100.0%), and Computers, Engineering & Science (100.0%), while the most female-oriented occupations are Education, Arts & Media (100.0%), Community & Social Service (74.7%), and Health Diagnosing & Treating (45.0%).
| Occupation | Male | Female |
| Management | 20 (100.0%) | 0 (0.0%) |
| Business & Financial | 8 (100.0%) | 0 (0.0%) |
| Computers, Engineering & Science | 14 (100.0%) | 0 (0.0%) |
| Computers & Mathematics | 0 (0.0%) | 0 (0.0%) |
| Architecture & Engineering | 14 (100.0%) | 0 (0.0%) |
| Life, Physical & Social Science | 0 (0.0%) | 0 (0.0%) |
| Community & Social Service | 22 (25.3%) | 65 (74.7%) |
| Education, Arts & Media | 0 (0.0%) | 57 (100.0%) |
| Legal Services & Support | 0 (0.0%) | 0 (0.0%) |
| Education Instruction & Library | 22 (73.3%) | 8 (26.7%) |
| Arts, Media & Entertainment | 0 (0.0%) | 0 (0.0%) |
| Health Diagnosing & Treating | 11 (55.0%) | 9 (45.0%) |
| Health Technologists | 11 (55.0%) | 9 (45.0%) |
| Total (Category) | 75 (50.3%) | 74 (49.7%) |
| Total (Overall) | 397 (52.0%) | 366 (48.0%) |
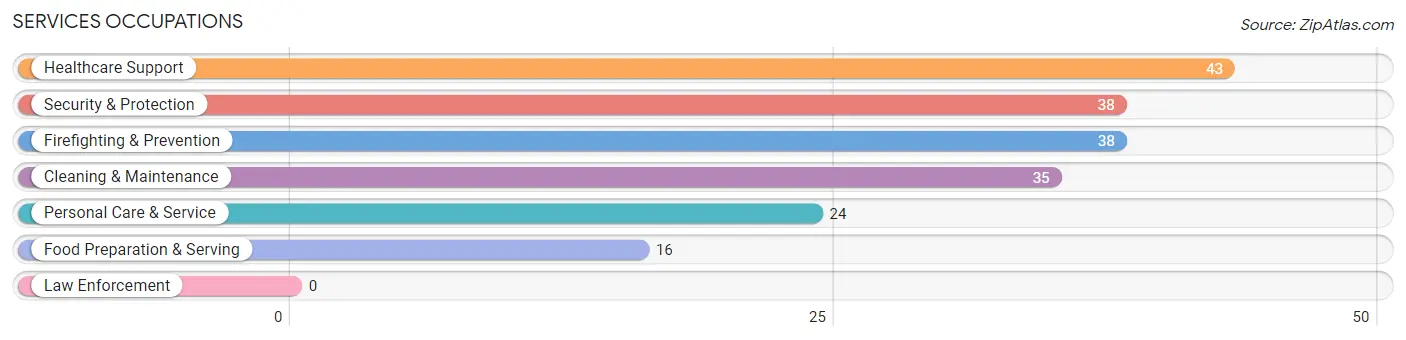
Services Occupations
The most common Services occupations in Browntown are Healthcare Support (43 | 5.6%), Security & Protection (38 | 5.0%), Firefighting & Prevention (38 | 5.0%), Cleaning & Maintenance (35 | 4.6%), and Personal Care & Service (24 | 3.2%).
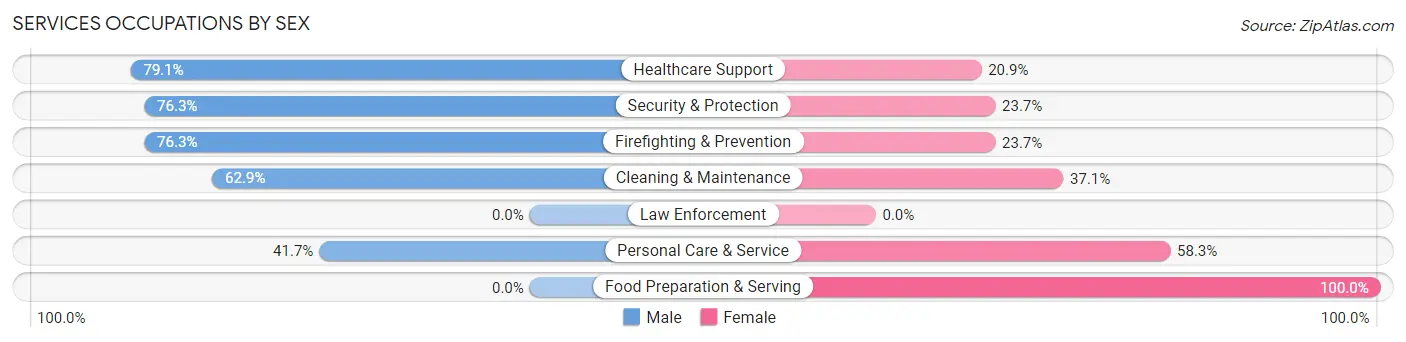
Services Occupations by Sex
Within the Services occupations in Browntown, the most male-oriented occupations are Healthcare Support (79.1%), Security & Protection (76.3%), and Firefighting & Prevention (76.3%), while the most female-oriented occupations are Food Preparation & Serving (100.0%), Personal Care & Service (58.3%), and Cleaning & Maintenance (37.1%).
| Occupation | Male | Female |
| Healthcare Support | 34 (79.1%) | 9 (20.9%) |
| Security & Protection | 29 (76.3%) | 9 (23.7%) |
| Firefighting & Prevention | 29 (76.3%) | 9 (23.7%) |
| Law Enforcement | 0 (0.0%) | 0 (0.0%) |
| Food Preparation & Serving | 0 (0.0%) | 16 (100.0%) |
| Cleaning & Maintenance | 22 (62.9%) | 13 (37.1%) |
| Personal Care & Service | 10 (41.7%) | 14 (58.3%) |
| Total (Category) | 95 (60.9%) | 61 (39.1%) |
| Total (Overall) | 397 (52.0%) | 366 (48.0%) |
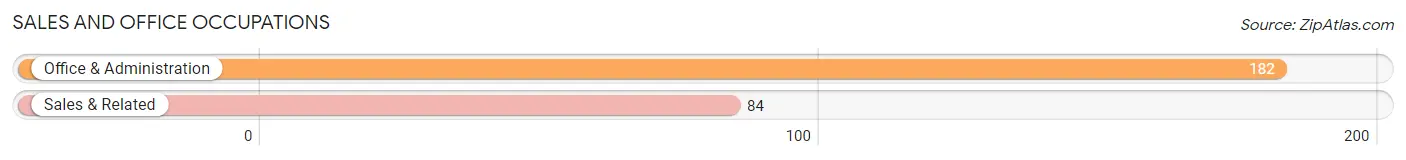
Sales and Office Occupations
The most common Sales and Office occupations in Browntown are Office & Administration (182 | 23.8%), and Sales & Related (84 | 11.0%).
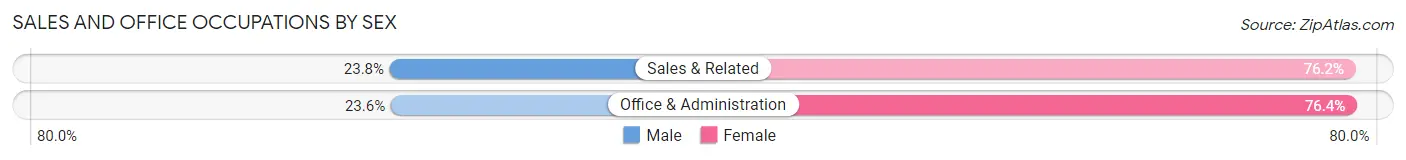
Sales and Office Occupations by Sex
| Occupation | Male | Female |
| Sales & Related | 20 (23.8%) | 64 (76.2%) |
| Office & Administration | 43 (23.6%) | 139 (76.4%) |
| Total (Category) | 63 (23.7%) | 203 (76.3%) |
| Total (Overall) | 397 (52.0%) | 366 (48.0%) |
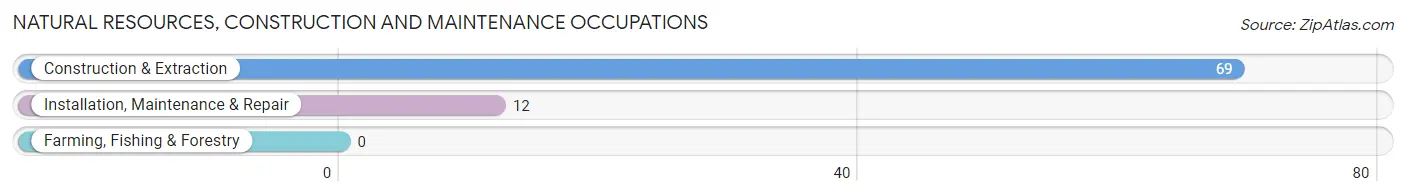
Natural Resources, Construction and Maintenance Occupations
The most common Natural Resources, Construction and Maintenance occupations in Browntown are Construction & Extraction (69 | 9.0%), and Installation, Maintenance & Repair (12 | 1.6%).
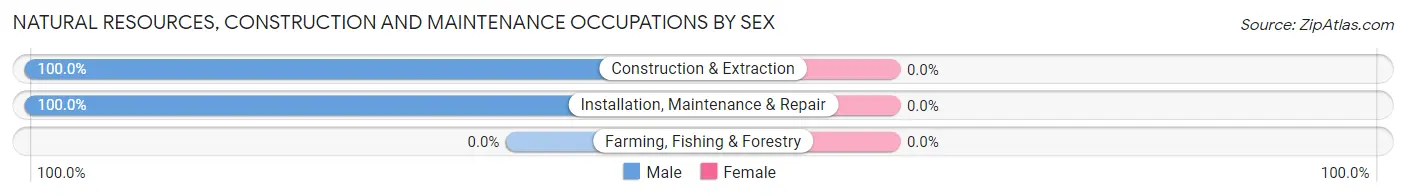
Natural Resources, Construction and Maintenance Occupations by Sex
| Occupation | Male | Female |
| Farming, Fishing & Forestry | 0 (0.0%) | 0 (0.0%) |
| Construction & Extraction | 69 (100.0%) | 0 (0.0%) |
| Installation, Maintenance & Repair | 12 (100.0%) | 0 (0.0%) |
| Total (Category) | 81 (100.0%) | 0 (0.0%) |
| Total (Overall) | 397 (52.0%) | 366 (48.0%) |
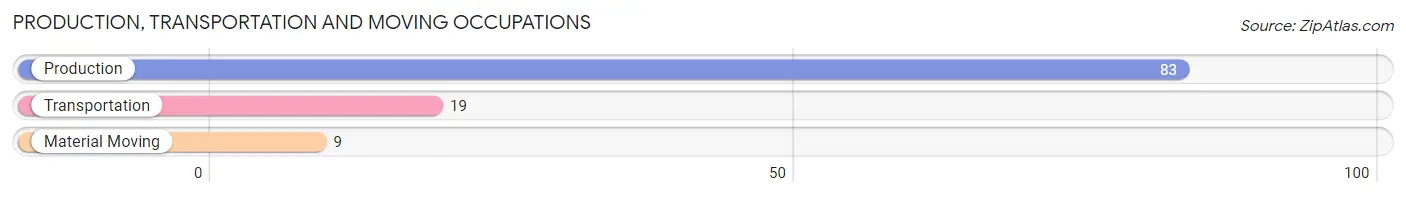
Production, Transportation and Moving Occupations
The most common Production, Transportation and Moving occupations in Browntown are Production (83 | 10.9%), Transportation (19 | 2.5%), and Material Moving (9 | 1.2%).
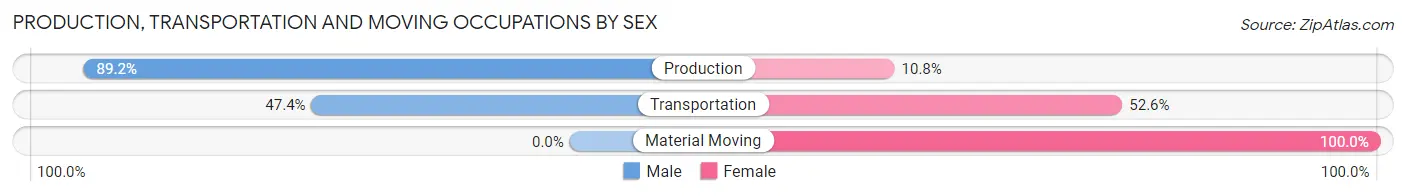
Production, Transportation and Moving Occupations by Sex
| Occupation | Male | Female |
| Production | 74 (89.2%) | 9 (10.8%) |
| Transportation | 9 (47.4%) | 10 (52.6%) |
| Material Moving | 0 (0.0%) | 9 (100.0%) |
| Total (Category) | 83 (74.8%) | 28 (25.2%) |
| Total (Overall) | 397 (52.0%) | 366 (48.0%) |
Employment Industries by Sex in Browntown
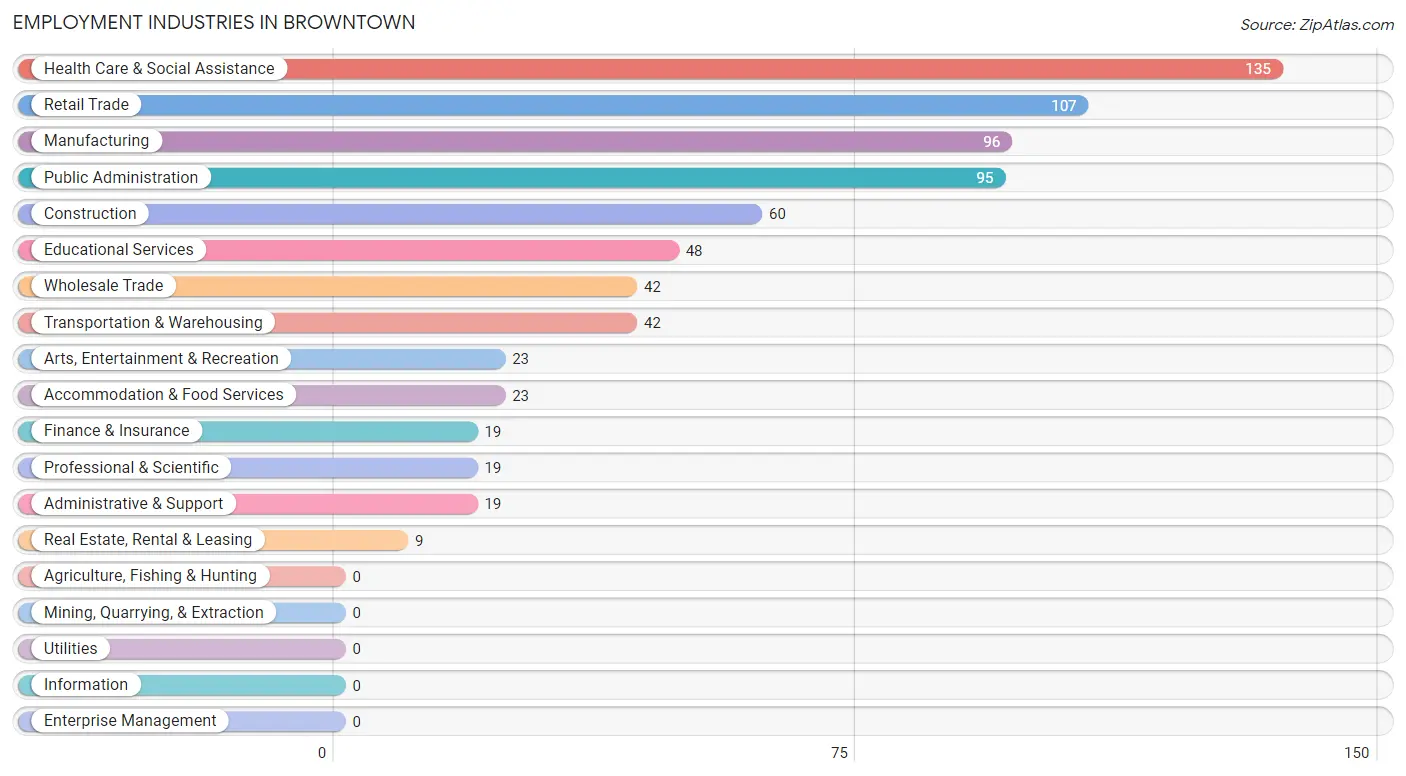
Employment Industries in Browntown
The major employment industries in Browntown include Health Care & Social Assistance (135 | 17.7%), Retail Trade (107 | 14.0%), Manufacturing (96 | 12.6%), Public Administration (95 | 12.4%), and Construction (60 | 7.9%).
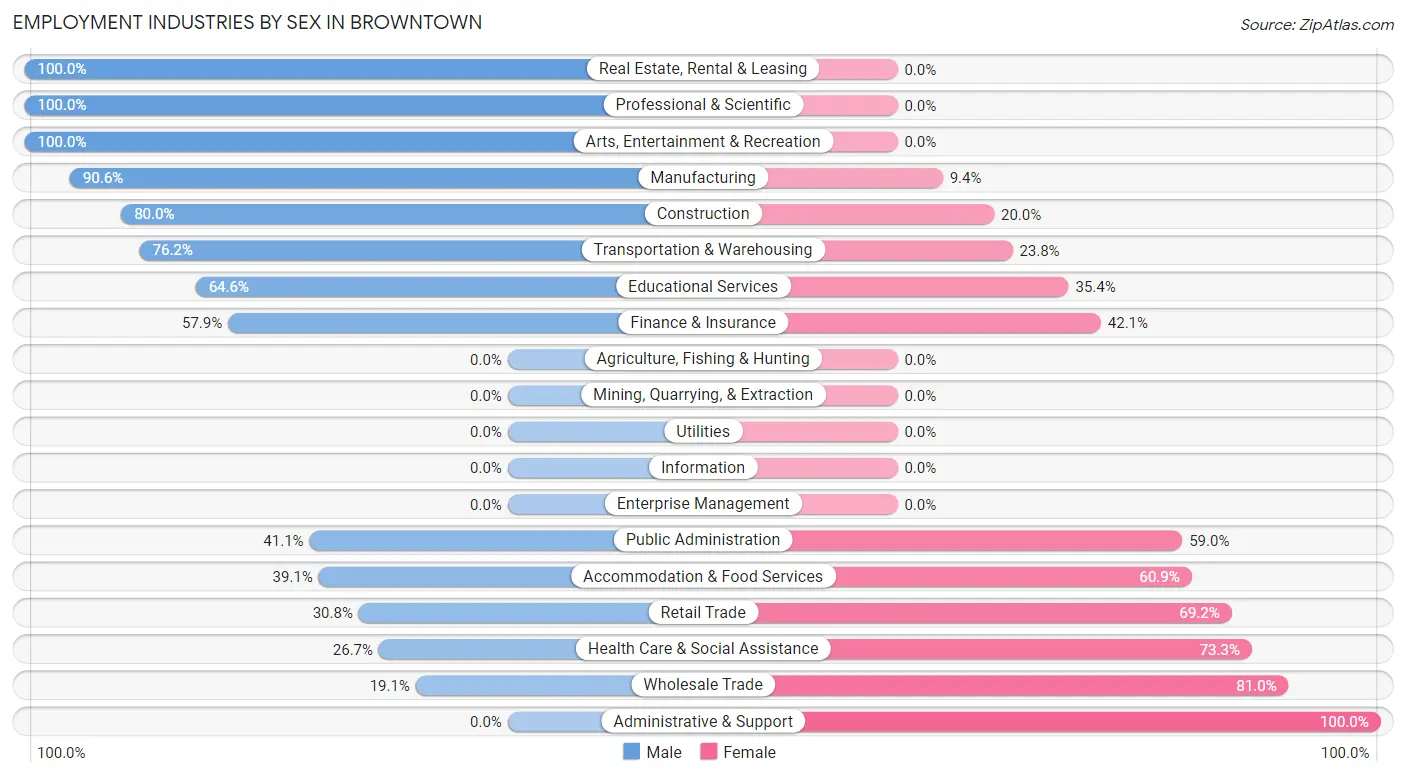
Employment Industries by Sex in Browntown
The Browntown industries that see more men than women are Real Estate, Rental & Leasing (100.0%), Professional & Scientific (100.0%), and Arts, Entertainment & Recreation (100.0%), whereas the industries that tend to have a higher number of women are Administrative & Support (100.0%), Wholesale Trade (80.9%), and Health Care & Social Assistance (73.3%).
| Industry | Male | Female |
| Agriculture, Fishing & Hunting | 0 (0.0%) | 0 (0.0%) |
| Mining, Quarrying, & Extraction | 0 (0.0%) | 0 (0.0%) |
| Construction | 48 (80.0%) | 12 (20.0%) |
| Manufacturing | 87 (90.6%) | 9 (9.4%) |
| Wholesale Trade | 8 (19.1%) | 34 (80.9%) |
| Retail Trade | 33 (30.8%) | 74 (69.2%) |
| Transportation & Warehousing | 32 (76.2%) | 10 (23.8%) |
| Utilities | 0 (0.0%) | 0 (0.0%) |
| Information | 0 (0.0%) | 0 (0.0%) |
| Finance & Insurance | 11 (57.9%) | 8 (42.1%) |
| Real Estate, Rental & Leasing | 9 (100.0%) | 0 (0.0%) |
| Professional & Scientific | 19 (100.0%) | 0 (0.0%) |
| Enterprise Management | 0 (0.0%) | 0 (0.0%) |
| Administrative & Support | 0 (0.0%) | 19 (100.0%) |
| Educational Services | 31 (64.6%) | 17 (35.4%) |
| Health Care & Social Assistance | 36 (26.7%) | 99 (73.3%) |
| Arts, Entertainment & Recreation | 23 (100.0%) | 0 (0.0%) |
| Accommodation & Food Services | 9 (39.1%) | 14 (60.9%) |
| Public Administration | 39 (41.0%) | 56 (59.0%) |
| Total | 397 (52.0%) | 366 (48.0%) |
Education in Browntown
School Enrollment in Browntown
The most common levels of schooling among the 363 students in Browntown are elementary school (132 | 36.4%), high school (83 | 22.9%), and kindergarten (68 | 18.7%).
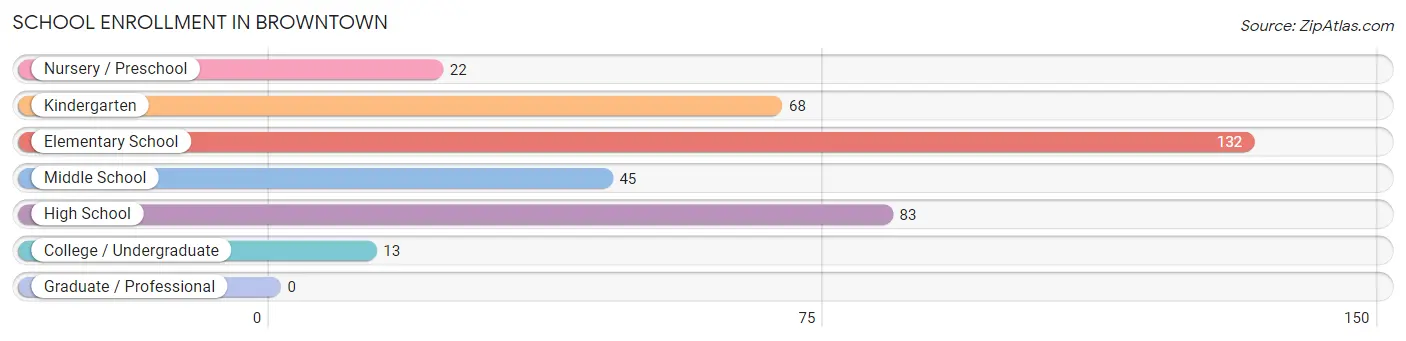
| School Level | # Students | % Students |
| Nursery / Preschool | 22 | 6.1% |
| Kindergarten | 68 | 18.7% |
| Elementary School | 132 | 36.4% |
| Middle School | 45 | 12.4% |
| High School | 83 | 22.9% |
| College / Undergraduate | 13 | 3.6% |
| Graduate / Professional | 0 | 0.0% |
| Total | 363 | 100.0% |
School Enrollment by Age by Funding Source in Browntown
Out of a total of 363 students who are enrolled in schools in Browntown, 19 (5.2%) attend a private institution, while the remaining 344 (94.8%) are enrolled in public schools. The age group of 3 to 4 year olds has the highest likelihood of being enrolled in private schools, with 10 (27.8% in the age bracket) enrolled. Conversely, the age group of 5 to 9 year old has the lowest likelihood of being enrolled in a private school, with 179 (100.0% in the age bracket) attending a public institution.
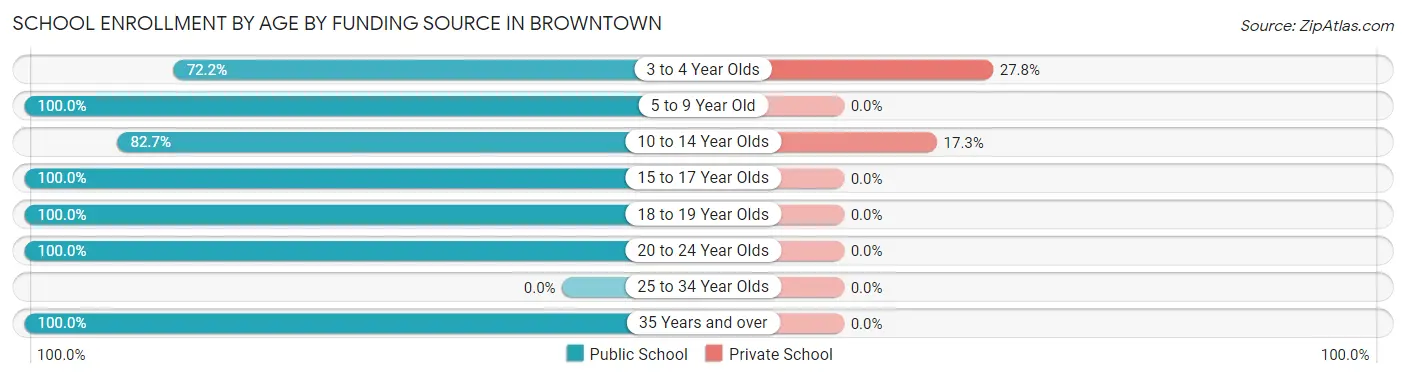
| Age Bracket | Public School | Private School |
| 3 to 4 Year Olds | 26 (72.2%) | 10 (27.8%) |
| 5 to 9 Year Old | 179 (100.0%) | 0 (0.0%) |
| 10 to 14 Year Olds | 43 (82.7%) | 9 (17.3%) |
| 15 to 17 Year Olds | 53 (100.0%) | 0 (0.0%) |
| 18 to 19 Year Olds | 21 (100.0%) | 0 (0.0%) |
| 20 to 24 Year Olds | 12 (100.0%) | 0 (0.0%) |
| 25 to 34 Year Olds | 0 (0.0%) | 0 (0.0%) |
| 35 Years and over | 10 (100.0%) | 0 (0.0%) |
| Total | 344 (94.8%) | 19 (5.2%) |
Educational Attainment by Field of Study in Browntown
Literature & languages (36 | 23.4%), education (35 | 22.7%), engineering (25 | 16.2%), business (14 | 9.1%), and science & technology (11 | 7.1%) are the most common fields of study among 154 individuals in Browntown who have obtained a bachelor's degree or higher.
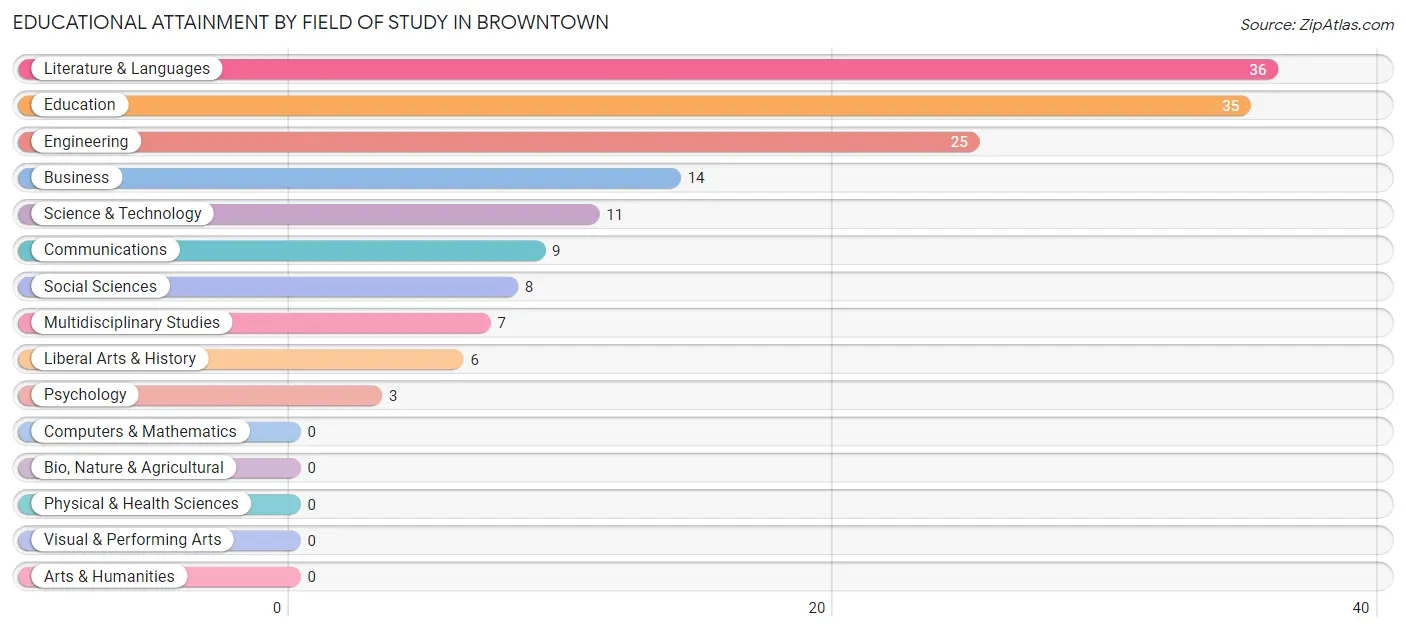
| Field of Study | # Graduates | % Graduates |
| Computers & Mathematics | 0 | 0.0% |
| Bio, Nature & Agricultural | 0 | 0.0% |
| Physical & Health Sciences | 0 | 0.0% |
| Psychology | 3 | 1.9% |
| Social Sciences | 8 | 5.2% |
| Engineering | 25 | 16.2% |
| Multidisciplinary Studies | 7 | 4.5% |
| Science & Technology | 11 | 7.1% |
| Business | 14 | 9.1% |
| Education | 35 | 22.7% |
| Literature & Languages | 36 | 23.4% |
| Liberal Arts & History | 6 | 3.9% |
| Visual & Performing Arts | 0 | 0.0% |
| Communications | 9 | 5.8% |
| Arts & Humanities | 0 | 0.0% |
| Total | 154 | 100.0% |
Transportation & Commute in Browntown
Vehicle Availability by Sex in Browntown
The most prevalent vehicle ownership categories in Browntown are males with 2 vehicles (161, accounting for 40.6%) and females with 2 vehicles (85, making up 51.9%).
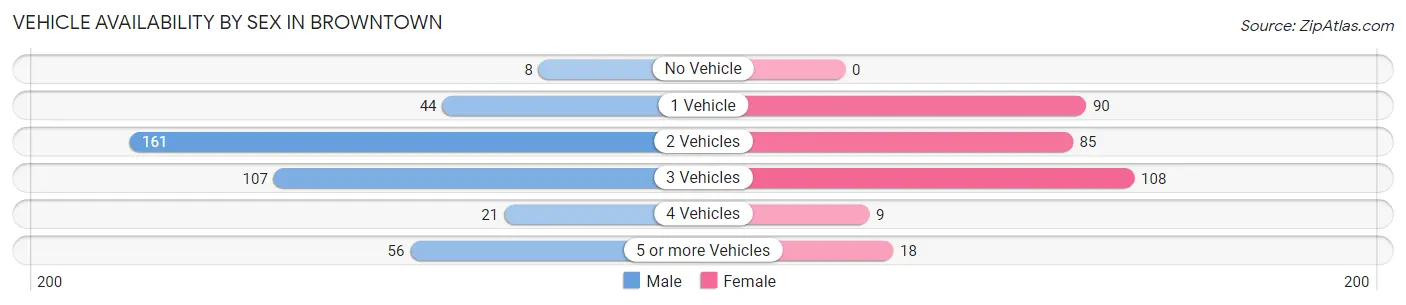
| Vehicles Available | Male | Female |
| No Vehicle | 8 (2.0%) | 0 (0.0%) |
| 1 Vehicle | 44 (11.1%) | 90 (29.0%) |
| 2 Vehicles | 161 (40.6%) | 85 (27.4%) |
| 3 Vehicles | 107 (27.0%) | 108 (34.8%) |
| 4 Vehicles | 21 (5.3%) | 9 (2.9%) |
| 5 or more Vehicles | 56 (14.1%) | 18 (5.8%) |
| Total | 397 (100.0%) | 310 (100.0%) |
Commute Time in Browntown
The most frequently occuring commute durations in Browntown are 10 to 14 minutes (146 commuters, 23.8%), less than 5 minutes (74 commuters, 12.0%), and 30 to 34 minutes (74 commuters, 12.0%).
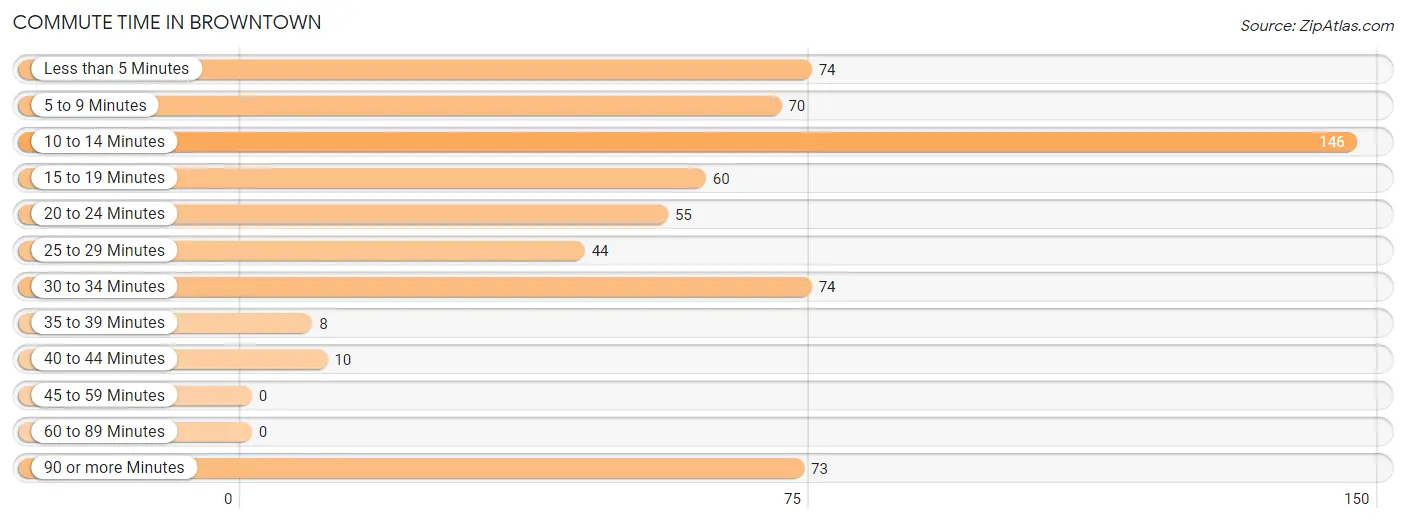
| Commute Time | # Commuters | % Commuters |
| Less than 5 Minutes | 74 | 12.0% |
| 5 to 9 Minutes | 70 | 11.4% |
| 10 to 14 Minutes | 146 | 23.8% |
| 15 to 19 Minutes | 60 | 9.8% |
| 20 to 24 Minutes | 55 | 9.0% |
| 25 to 29 Minutes | 44 | 7.2% |
| 30 to 34 Minutes | 74 | 12.0% |
| 35 to 39 Minutes | 8 | 1.3% |
| 40 to 44 Minutes | 10 | 1.6% |
| 45 to 59 Minutes | 0 | 0.0% |
| 60 to 89 Minutes | 0 | 0.0% |
| 90 or more Minutes | 73 | 11.9% |
Commute Time by Sex in Browntown
The most common commute times in Browntown are 10 to 14 minutes (112 commuters, 30.6%) for males and 30 to 34 minutes (57 commuters, 23.0%) for females.
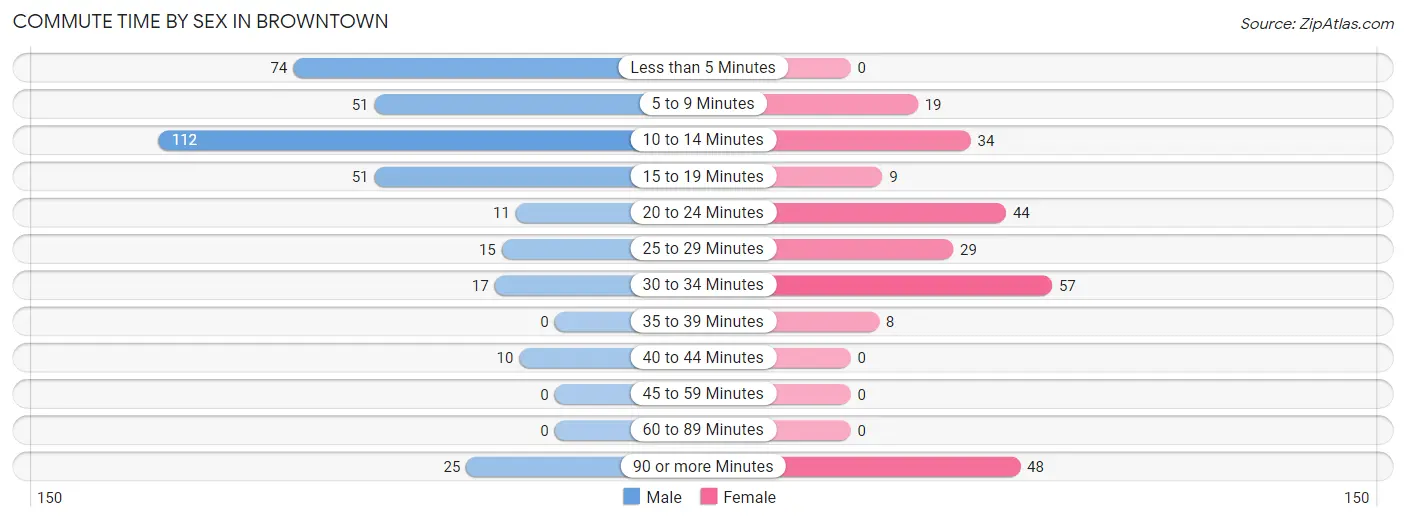
| Commute Time | Male | Female |
| Less than 5 Minutes | 74 (20.2%) | 0 (0.0%) |
| 5 to 9 Minutes | 51 (13.9%) | 19 (7.7%) |
| 10 to 14 Minutes | 112 (30.6%) | 34 (13.7%) |
| 15 to 19 Minutes | 51 (13.9%) | 9 (3.6%) |
| 20 to 24 Minutes | 11 (3.0%) | 44 (17.7%) |
| 25 to 29 Minutes | 15 (4.1%) | 29 (11.7%) |
| 30 to 34 Minutes | 17 (4.6%) | 57 (23.0%) |
| 35 to 39 Minutes | 0 (0.0%) | 8 (3.2%) |
| 40 to 44 Minutes | 10 (2.7%) | 0 (0.0%) |
| 45 to 59 Minutes | 0 (0.0%) | 0 (0.0%) |
| 60 to 89 Minutes | 0 (0.0%) | 0 (0.0%) |
| 90 or more Minutes | 25 (6.8%) | 48 (19.4%) |
Time of Departure to Work by Sex in Browntown
The most frequent times of departure to work in Browntown are 8:00 AM to 8:29 AM (79, 21.6%) for males and 9:00 AM to 9:59 AM (59, 23.8%) for females.
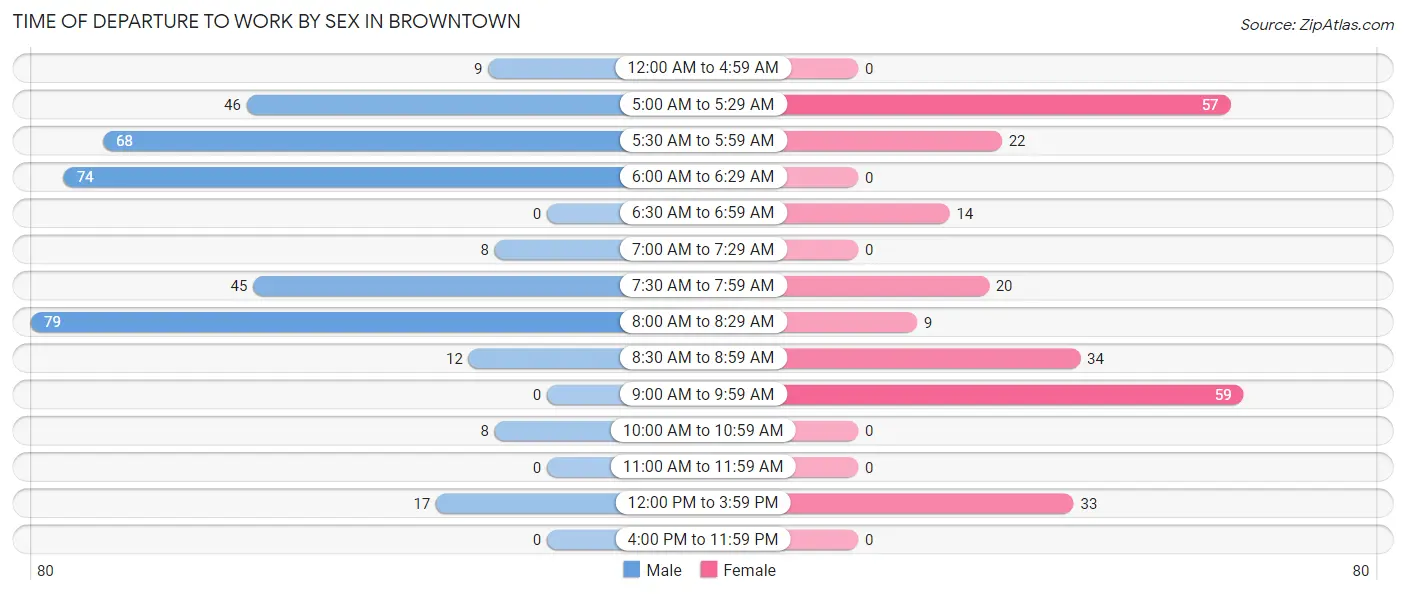
| Time of Departure | Male | Female |
| 12:00 AM to 4:59 AM | 9 (2.5%) | 0 (0.0%) |
| 5:00 AM to 5:29 AM | 46 (12.6%) | 57 (23.0%) |
| 5:30 AM to 5:59 AM | 68 (18.6%) | 22 (8.9%) |
| 6:00 AM to 6:29 AM | 74 (20.2%) | 0 (0.0%) |
| 6:30 AM to 6:59 AM | 0 (0.0%) | 14 (5.7%) |
| 7:00 AM to 7:29 AM | 8 (2.2%) | 0 (0.0%) |
| 7:30 AM to 7:59 AM | 45 (12.3%) | 20 (8.1%) |
| 8:00 AM to 8:29 AM | 79 (21.6%) | 9 (3.6%) |
| 8:30 AM to 8:59 AM | 12 (3.3%) | 34 (13.7%) |
| 9:00 AM to 9:59 AM | 0 (0.0%) | 59 (23.8%) |
| 10:00 AM to 10:59 AM | 8 (2.2%) | 0 (0.0%) |
| 11:00 AM to 11:59 AM | 0 (0.0%) | 0 (0.0%) |
| 12:00 PM to 3:59 PM | 17 (4.6%) | 33 (13.3%) |
| 4:00 PM to 11:59 PM | 0 (0.0%) | 0 (0.0%) |
| Total | 366 (100.0%) | 248 (100.0%) |
Housing Occupancy in Browntown
Occupancy by Ownership in Browntown
Of the total 610 dwellings in Browntown, owner-occupied units account for 441 (72.3%), while renter-occupied units make up 169 (27.7%).
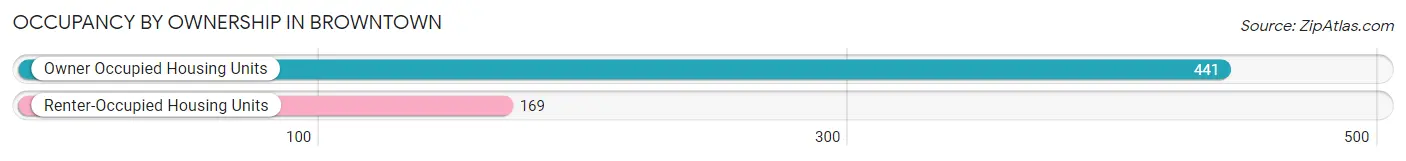
| Occupancy | # Housing Units | % Housing Units |
| Owner Occupied Housing Units | 441 | 72.3% |
| Renter-Occupied Housing Units | 169 | 27.7% |
| Total Occupied Housing Units | 610 | 100.0% |
Occupancy by Household Size in Browntown
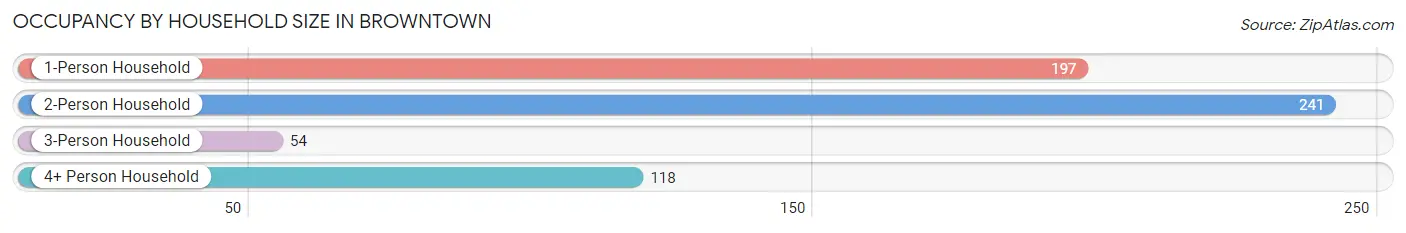
| Household Size | # Housing Units | % Housing Units |
| 1-Person Household | 197 | 32.3% |
| 2-Person Household | 241 | 39.5% |
| 3-Person Household | 54 | 8.8% |
| 4+ Person Household | 118 | 19.3% |
| Total Housing Units | 610 | 100.0% |
Occupancy by Ownership by Household Size in Browntown
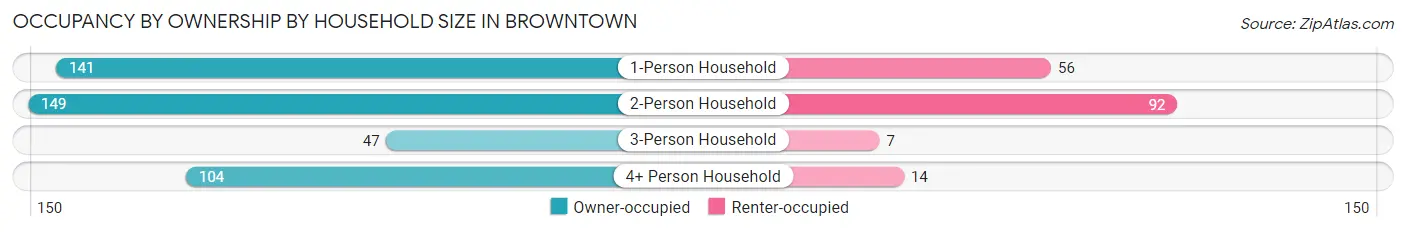
| Household Size | Owner-occupied | Renter-occupied |
| 1-Person Household | 141 (71.6%) | 56 (28.4%) |
| 2-Person Household | 149 (61.8%) | 92 (38.2%) |
| 3-Person Household | 47 (87.0%) | 7 (13.0%) |
| 4+ Person Household | 104 (88.1%) | 14 (11.9%) |
| Total Housing Units | 441 (72.3%) | 169 (27.7%) |
Occupancy by Educational Attainment in Browntown
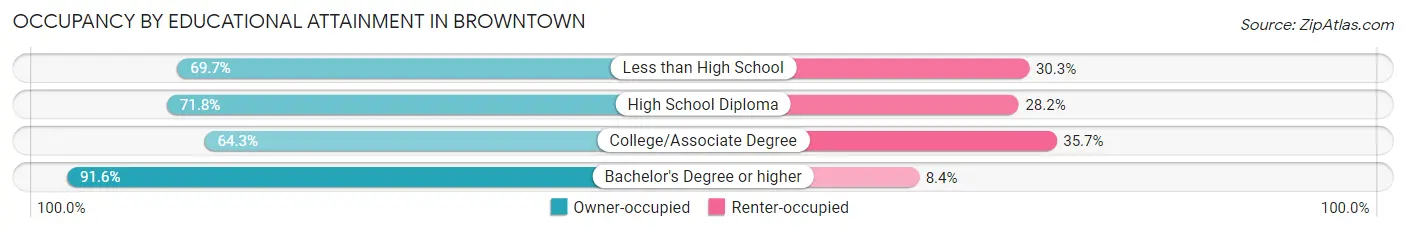
| Household Size | Owner-occupied | Renter-occupied |
| Less than High School | 23 (69.7%) | 10 (30.3%) |
| High School Diploma | 234 (71.8%) | 92 (28.2%) |
| College/Associate Degree | 108 (64.3%) | 60 (35.7%) |
| Bachelor's Degree or higher | 76 (91.6%) | 7 (8.4%) |
Occupancy by Age of Householder in Browntown
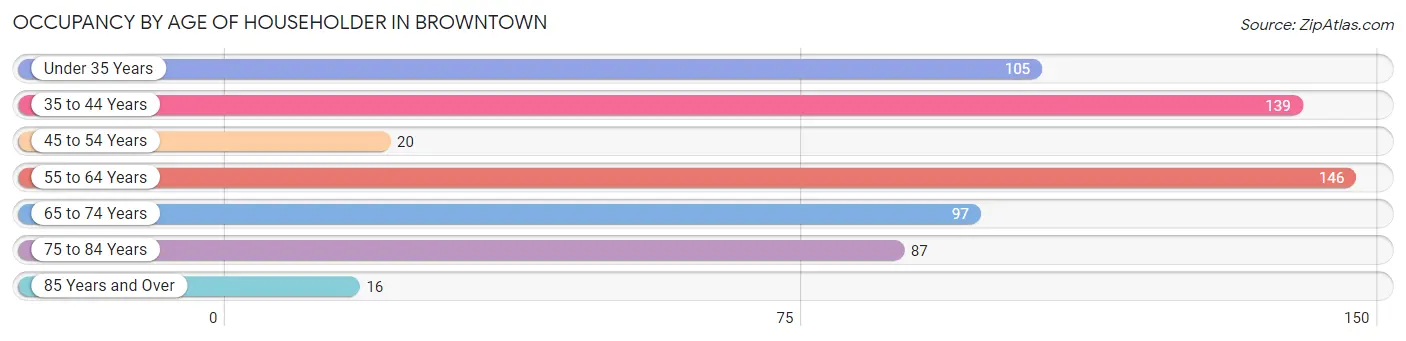
| Age Bracket | # Households | % Households |
| Under 35 Years | 105 | 17.2% |
| 35 to 44 Years | 139 | 22.8% |
| 45 to 54 Years | 20 | 3.3% |
| 55 to 64 Years | 146 | 23.9% |
| 65 to 74 Years | 97 | 15.9% |
| 75 to 84 Years | 87 | 14.3% |
| 85 Years and Over | 16 | 2.6% |
| Total | 610 | 100.0% |
Housing Finances in Browntown
Median Income by Occupancy in Browntown
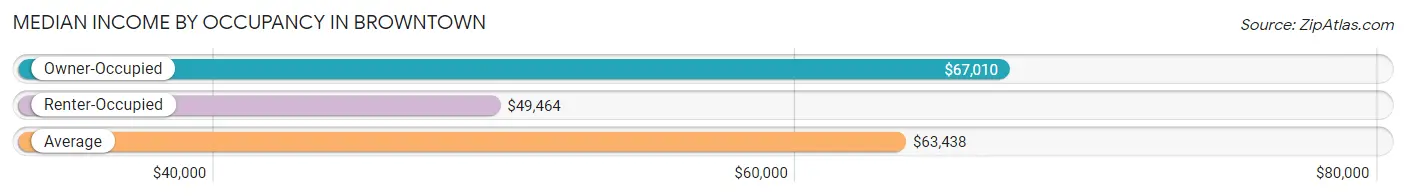
| Occupancy Type | # Households | Median Income |
| Owner-Occupied | 441 (72.3%) | $67,010 |
| Renter-Occupied | 169 (27.7%) | $49,464 |
| Average | 610 (100.0%) | $63,438 |
Occupancy by Householder Income Bracket in Browntown
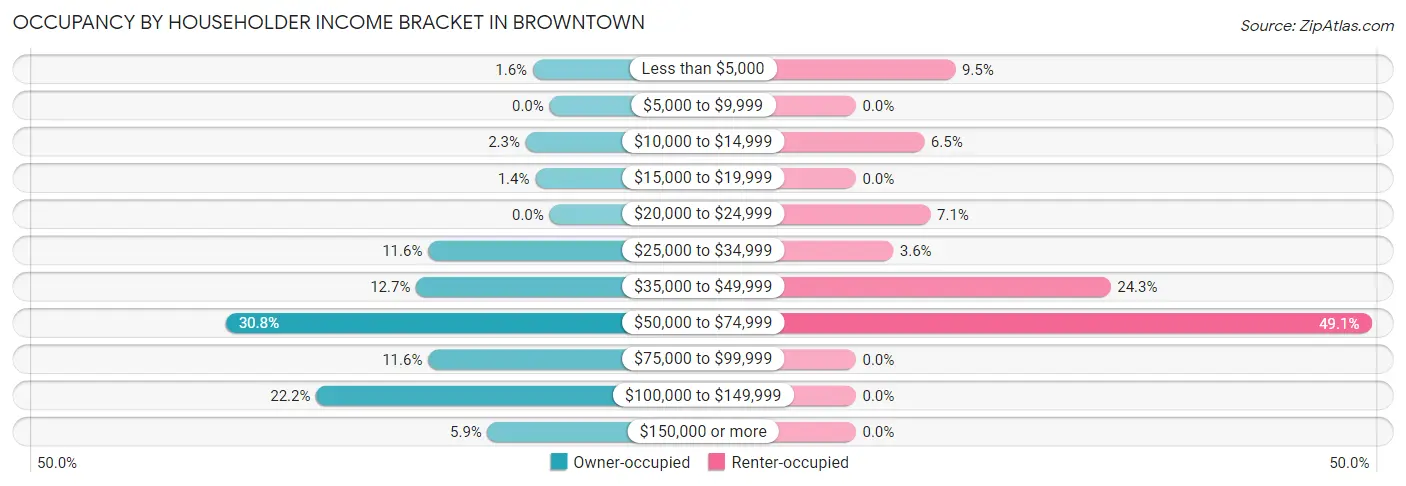
| Income Bracket | Owner-occupied | Renter-occupied |
| Less than $5,000 | 7 (1.6%) | 16 (9.5%) |
| $5,000 to $9,999 | 0 (0.0%) | 0 (0.0%) |
| $10,000 to $14,999 | 10 (2.3%) | 11 (6.5%) |
| $15,000 to $19,999 | 6 (1.4%) | 0 (0.0%) |
| $20,000 to $24,999 | 0 (0.0%) | 12 (7.1%) |
| $25,000 to $34,999 | 51 (11.6%) | 6 (3.5%) |
| $35,000 to $49,999 | 56 (12.7%) | 41 (24.3%) |
| $50,000 to $74,999 | 136 (30.8%) | 83 (49.1%) |
| $75,000 to $99,999 | 51 (11.6%) | 0 (0.0%) |
| $100,000 to $149,999 | 98 (22.2%) | 0 (0.0%) |
| $150,000 or more | 26 (5.9%) | 0 (0.0%) |
| Total | 441 (100.0%) | 169 (100.0%) |
Monthly Housing Cost Tiers in Browntown
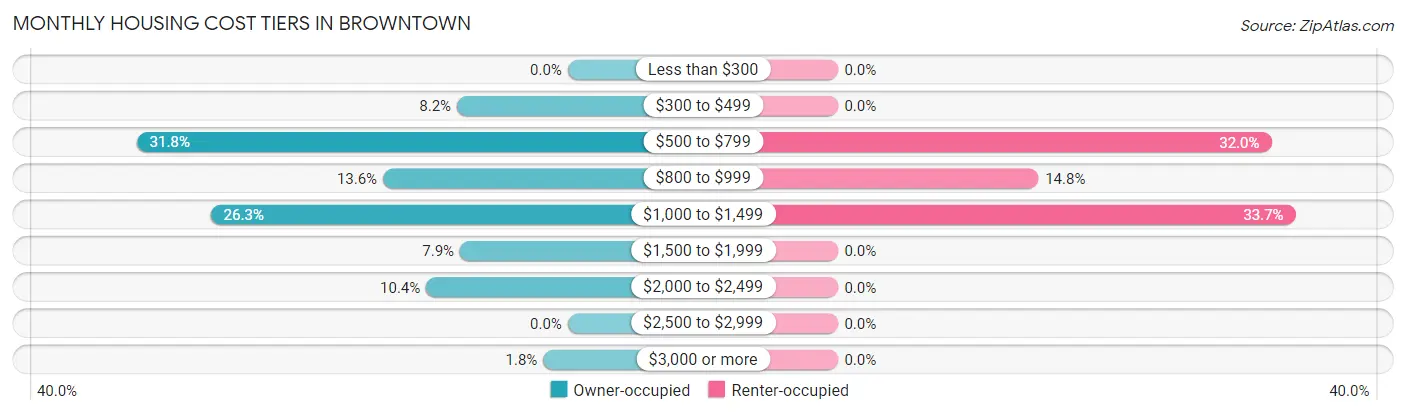
| Monthly Cost | Owner-occupied | Renter-occupied |
| Less than $300 | 0 (0.0%) | 0 (0.0%) |
| $300 to $499 | 36 (8.2%) | 0 (0.0%) |
| $500 to $799 | 140 (31.8%) | 54 (32.0%) |
| $800 to $999 | 60 (13.6%) | 25 (14.8%) |
| $1,000 to $1,499 | 116 (26.3%) | 57 (33.7%) |
| $1,500 to $1,999 | 35 (7.9%) | 0 (0.0%) |
| $2,000 to $2,499 | 46 (10.4%) | 0 (0.0%) |
| $2,500 to $2,999 | 0 (0.0%) | 0 (0.0%) |
| $3,000 or more | 8 (1.8%) | 0 (0.0%) |
| Total | 441 (100.0%) | 169 (100.0%) |
Physical Housing Characteristics in Browntown
Housing Structures in Browntown
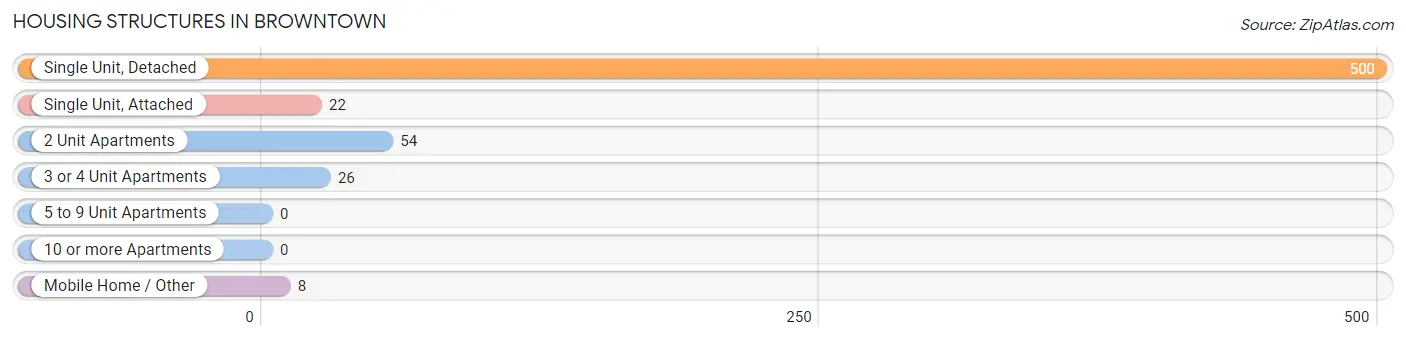
| Structure Type | # Housing Units | % Housing Units |
| Single Unit, Detached | 500 | 82.0% |
| Single Unit, Attached | 22 | 3.6% |
| 2 Unit Apartments | 54 | 8.8% |
| 3 or 4 Unit Apartments | 26 | 4.3% |
| 5 to 9 Unit Apartments | 0 | 0.0% |
| 10 or more Apartments | 0 | 0.0% |
| Mobile Home / Other | 8 | 1.3% |
| Total | 610 | 100.0% |
Housing Structures by Occupancy in Browntown
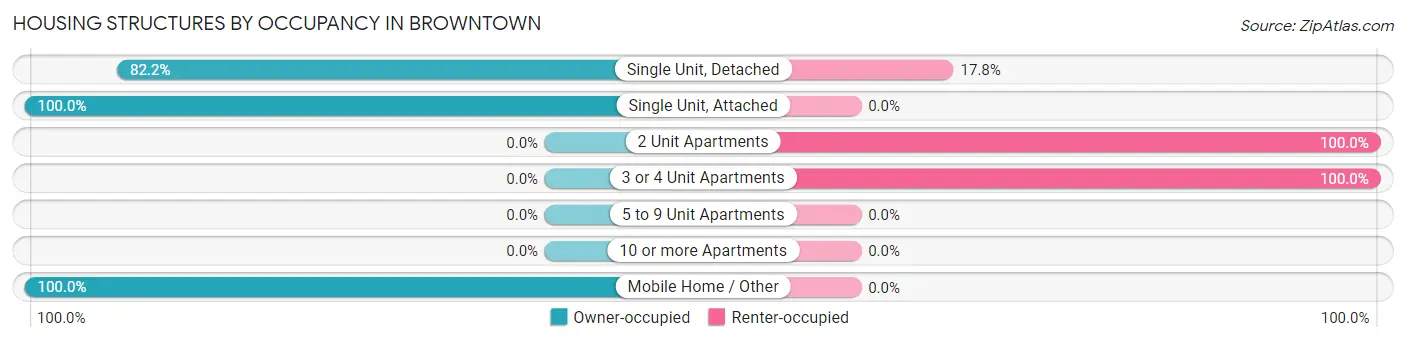
| Structure Type | Owner-occupied | Renter-occupied |
| Single Unit, Detached | 411 (82.2%) | 89 (17.8%) |
| Single Unit, Attached | 22 (100.0%) | 0 (0.0%) |
| 2 Unit Apartments | 0 (0.0%) | 54 (100.0%) |
| 3 or 4 Unit Apartments | 0 (0.0%) | 26 (100.0%) |
| 5 to 9 Unit Apartments | 0 (0.0%) | 0 (0.0%) |
| 10 or more Apartments | 0 (0.0%) | 0 (0.0%) |
| Mobile Home / Other | 8 (100.0%) | 0 (0.0%) |
| Total | 441 (72.3%) | 169 (27.7%) |
Housing Structures by Number of Rooms in Browntown
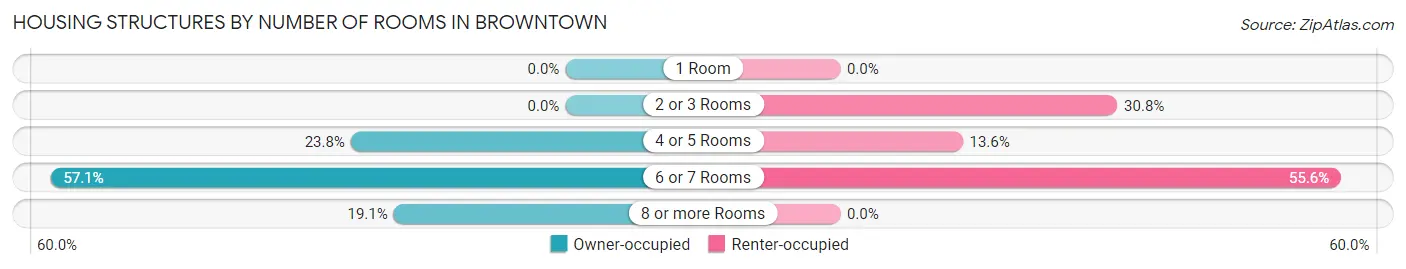
| Number of Rooms | Owner-occupied | Renter-occupied |
| 1 Room | 0 (0.0%) | 0 (0.0%) |
| 2 or 3 Rooms | 0 (0.0%) | 52 (30.8%) |
| 4 or 5 Rooms | 105 (23.8%) | 23 (13.6%) |
| 6 or 7 Rooms | 252 (57.1%) | 94 (55.6%) |
| 8 or more Rooms | 84 (19.1%) | 0 (0.0%) |
| Total | 441 (100.0%) | 169 (100.0%) |
Housing Structure by Heating Type in Browntown
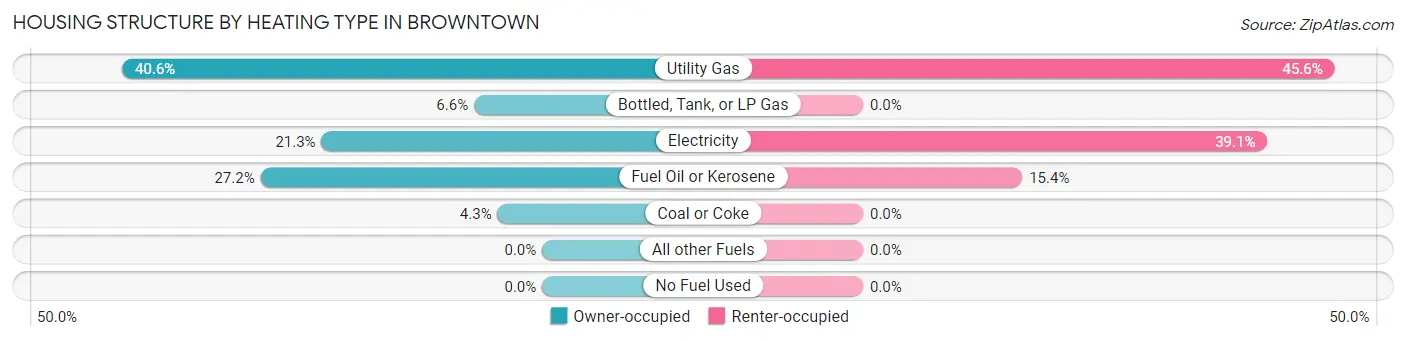
| Heating Type | Owner-occupied | Renter-occupied |
| Utility Gas | 179 (40.6%) | 77 (45.6%) |
| Bottled, Tank, or LP Gas | 29 (6.6%) | 0 (0.0%) |
| Electricity | 94 (21.3%) | 66 (39.1%) |
| Fuel Oil or Kerosene | 120 (27.2%) | 26 (15.4%) |
| Coal or Coke | 19 (4.3%) | 0 (0.0%) |
| All other Fuels | 0 (0.0%) | 0 (0.0%) |
| No Fuel Used | 0 (0.0%) | 0 (0.0%) |
| Total | 441 (100.0%) | 169 (100.0%) |
Household Vehicle Usage in Browntown
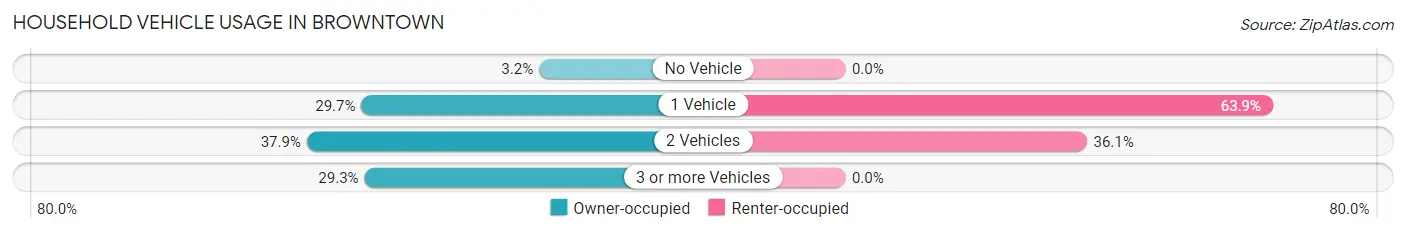
| Vehicles per Household | Owner-occupied | Renter-occupied |
| No Vehicle | 14 (3.2%) | 0 (0.0%) |
| 1 Vehicle | 131 (29.7%) | 108 (63.9%) |
| 2 Vehicles | 167 (37.9%) | 61 (36.1%) |
| 3 or more Vehicles | 129 (29.2%) | 0 (0.0%) |
| Total | 441 (100.0%) | 169 (100.0%) |
Real Estate & Mortgages in Browntown
Real Estate and Mortgage Overview in Browntown
| Characteristic | Without Mortgage | With Mortgage |
| Housing Units | 204 | 237 |
| Median Property Value | $151,400 | $119,600 |
| Median Household Income | $66,058 | $9 |
| Monthly Housing Costs | $724 | $8 |
| Real Estate Taxes | $3,120 | $0 |
Property Value by Mortgage Status in Browntown
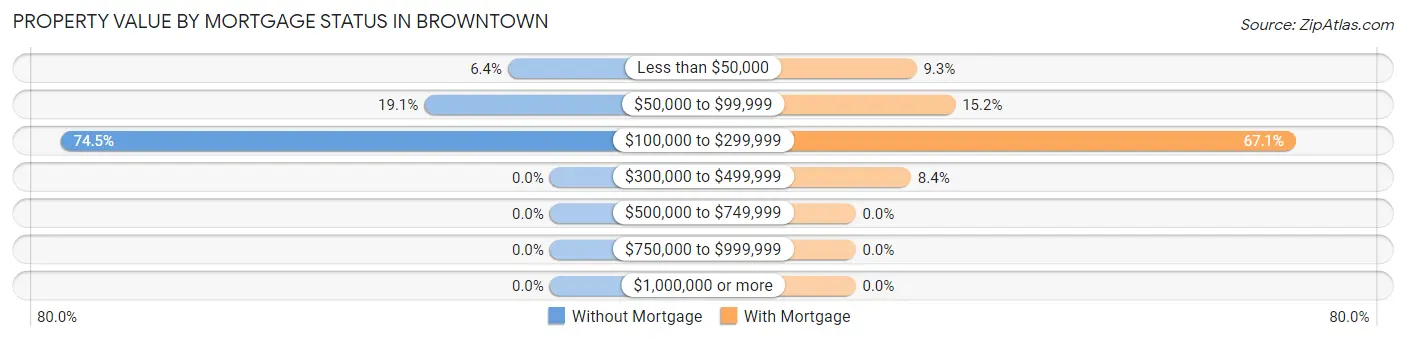
| Property Value | Without Mortgage | With Mortgage |
| Less than $50,000 | 13 (6.4%) | 22 (9.3%) |
| $50,000 to $99,999 | 39 (19.1%) | 36 (15.2%) |
| $100,000 to $299,999 | 152 (74.5%) | 159 (67.1%) |
| $300,000 to $499,999 | 0 (0.0%) | 20 (8.4%) |
| $500,000 to $749,999 | 0 (0.0%) | 0 (0.0%) |
| $750,000 to $999,999 | 0 (0.0%) | 0 (0.0%) |
| $1,000,000 or more | 0 (0.0%) | 0 (0.0%) |
| Total | 204 (100.0%) | 237 (100.0%) |
Household Income by Mortgage Status in Browntown
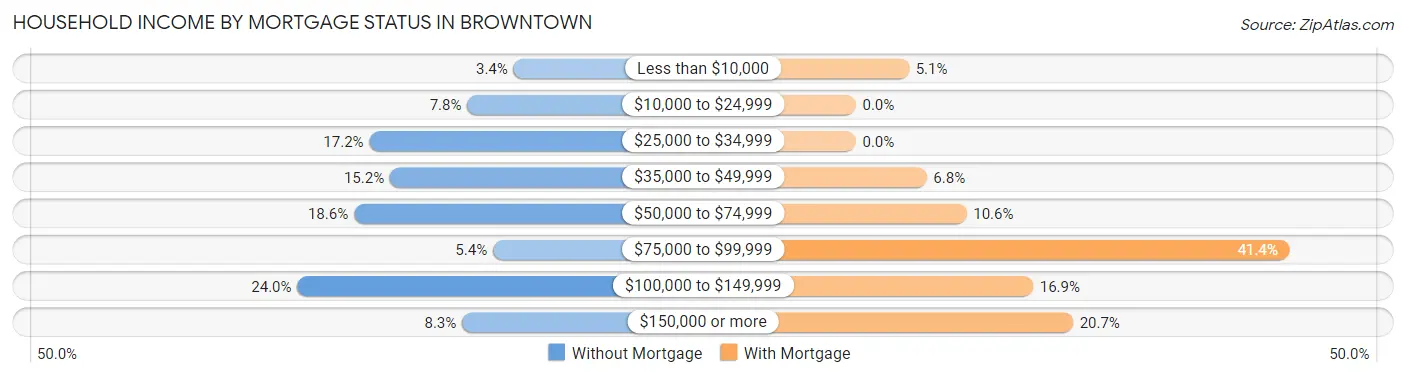
| Household Income | Without Mortgage | With Mortgage |
| Less than $10,000 | 7 (3.4%) | 12 (5.1%) |
| $10,000 to $24,999 | 16 (7.8%) | 0 (0.0%) |
| $25,000 to $34,999 | 35 (17.2%) | 0 (0.0%) |
| $35,000 to $49,999 | 31 (15.2%) | 16 (6.8%) |
| $50,000 to $74,999 | 38 (18.6%) | 25 (10.5%) |
| $75,000 to $99,999 | 11 (5.4%) | 98 (41.3%) |
| $100,000 to $149,999 | 49 (24.0%) | 40 (16.9%) |
| $150,000 or more | 17 (8.3%) | 49 (20.7%) |
| Total | 204 (100.0%) | 237 (100.0%) |
Property Value to Household Income Ratio in Browntown
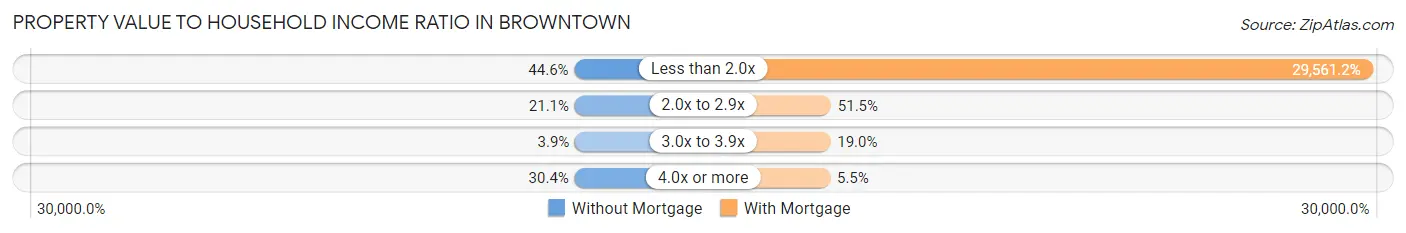
| Value-to-Income Ratio | Without Mortgage | With Mortgage |
| Less than 2.0x | 91 (44.6%) | 70,060 (29,561.2%) |
| 2.0x to 2.9x | 43 (21.1%) | 122 (51.5%) |
| 3.0x to 3.9x | 8 (3.9%) | 45 (19.0%) |
| 4.0x or more | 62 (30.4%) | 13 (5.5%) |
| Total | 204 (100.0%) | 237 (100.0%) |
Real Estate Taxes by Mortgage Status in Browntown
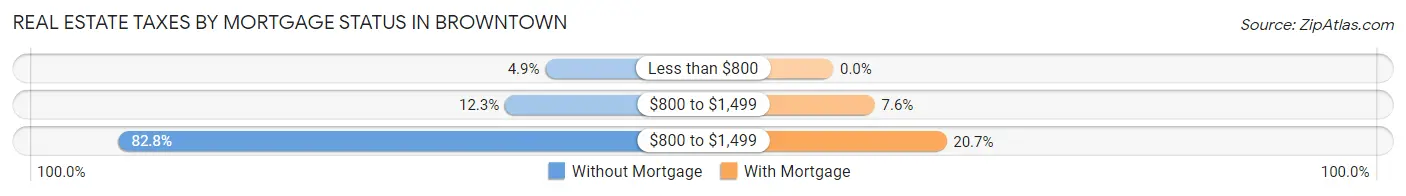
| Property Taxes | Without Mortgage | With Mortgage |
| Less than $800 | 10 (4.9%) | 0 (0.0%) |
| $800 to $1,499 | 25 (12.2%) | 18 (7.6%) |
| $800 to $1,499 | 169 (82.8%) | 49 (20.7%) |
| Total | 204 (100.0%) | 237 (100.0%) |
Health & Disability in Browntown
Health Insurance Coverage by Age in Browntown
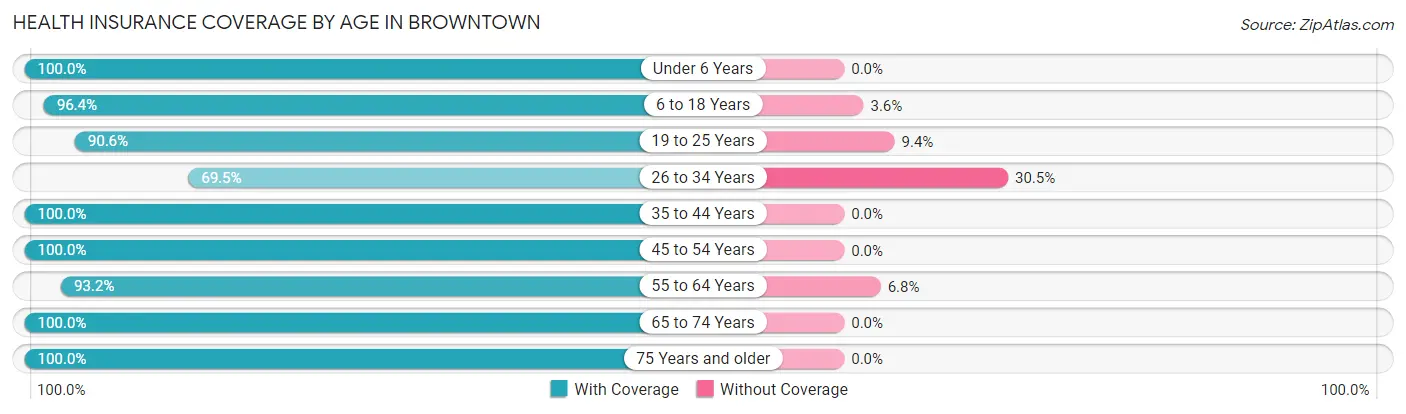
| Age Bracket | With Coverage | Without Coverage |
| Under 6 Years | 90 (100.0%) | 0 (0.0%) |
| 6 to 18 Years | 242 (96.4%) | 9 (3.6%) |
| 19 to 25 Years | 87 (90.6%) | 9 (9.4%) |
| 26 to 34 Years | 182 (69.5%) | 80 (30.5%) |
| 35 to 44 Years | 164 (100.0%) | 0 (0.0%) |
| 45 to 54 Years | 72 (100.0%) | 0 (0.0%) |
| 55 to 64 Years | 261 (93.2%) | 19 (6.8%) |
| 65 to 74 Years | 148 (100.0%) | 0 (0.0%) |
| 75 Years and older | 113 (100.0%) | 0 (0.0%) |
| Total | 1,359 (92.1%) | 117 (7.9%) |
Health Insurance Coverage by Citizenship Status in Browntown
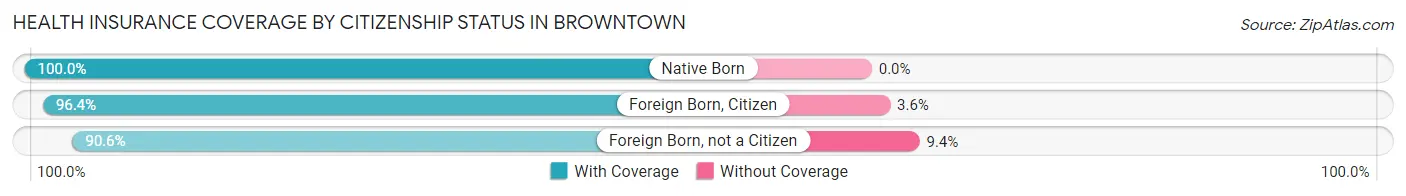
| Citizenship Status | With Coverage | Without Coverage |
| Native Born | 90 (100.0%) | 0 (0.0%) |
| Foreign Born, Citizen | 242 (96.4%) | 9 (3.6%) |
| Foreign Born, not a Citizen | 87 (90.6%) | 9 (9.4%) |
Health Insurance Coverage by Household Income in Browntown
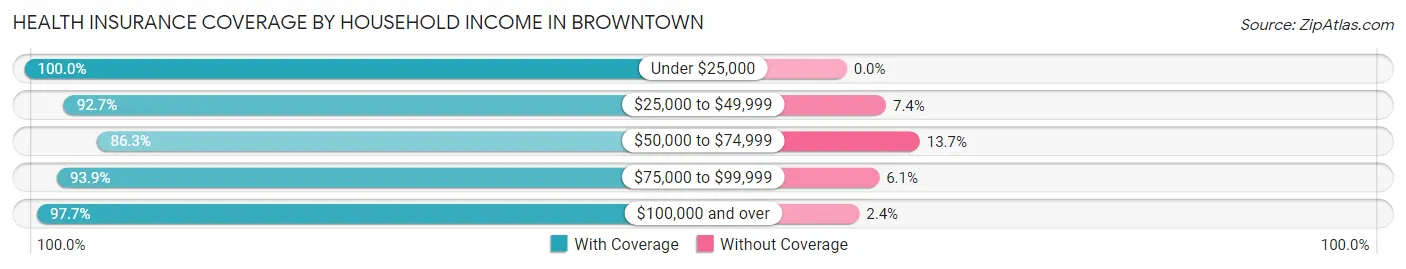
| Household Income | With Coverage | Without Coverage |
| Under $25,000 | 108 (100.0%) | 0 (0.0%) |
| $25,000 to $49,999 | 227 (92.6%) | 18 (7.3%) |
| $50,000 to $74,999 | 511 (86.3%) | 81 (13.7%) |
| $75,000 to $99,999 | 139 (93.9%) | 9 (6.1%) |
| $100,000 and over | 374 (97.7%) | 9 (2.4%) |
Public vs Private Health Insurance Coverage by Age in Browntown
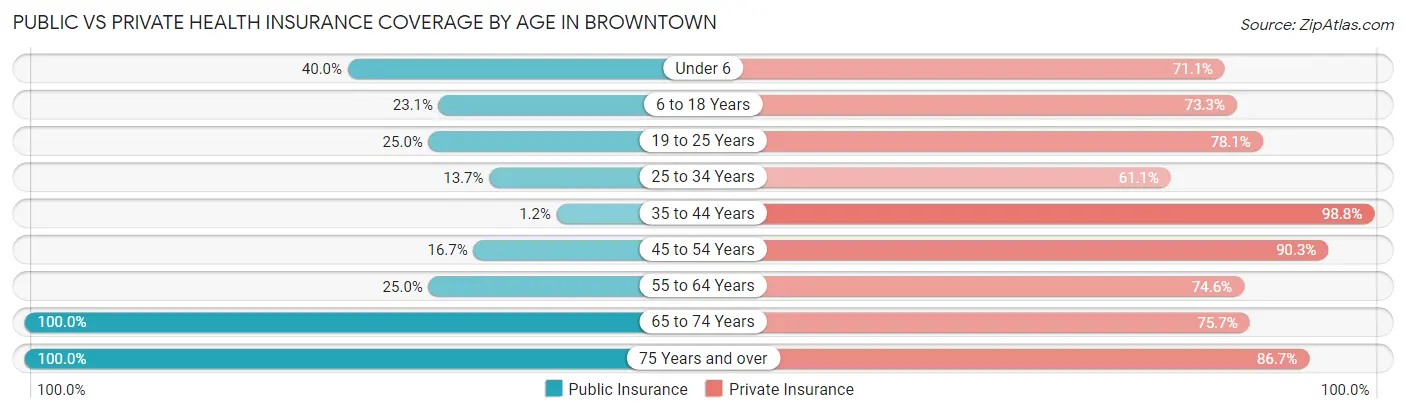
| Age Bracket | Public Insurance | Private Insurance |
| Under 6 | 36 (40.0%) | 64 (71.1%) |
| 6 to 18 Years | 58 (23.1%) | 184 (73.3%) |
| 19 to 25 Years | 24 (25.0%) | 75 (78.1%) |
| 25 to 34 Years | 36 (13.7%) | 160 (61.1%) |
| 35 to 44 Years | 2 (1.2%) | 162 (98.8%) |
| 45 to 54 Years | 12 (16.7%) | 65 (90.3%) |
| 55 to 64 Years | 70 (25.0%) | 209 (74.6%) |
| 65 to 74 Years | 148 (100.0%) | 112 (75.7%) |
| 75 Years and over | 113 (100.0%) | 98 (86.7%) |
| Total | 499 (33.8%) | 1,129 (76.5%) |
Disability Status by Sex by Age in Browntown
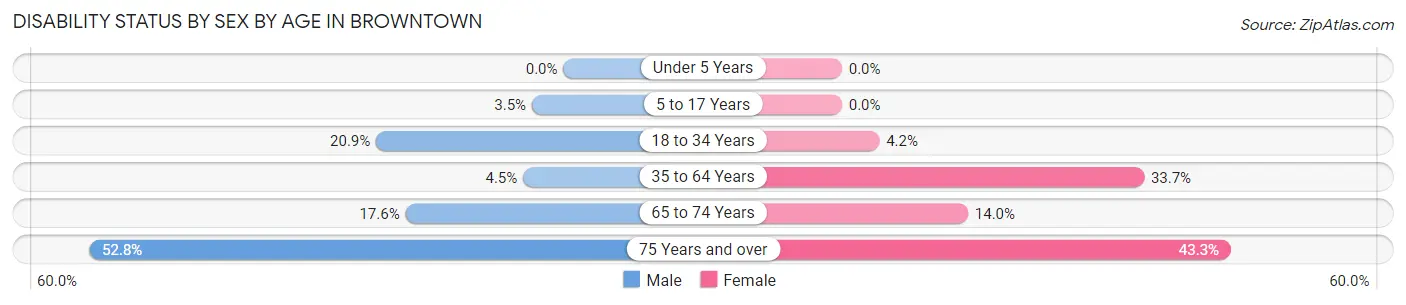
| Age Bracket | Male | Female |
| Under 5 Years | 0 (0.0%) | 0 (0.0%) |
| 5 to 17 Years | 7 (3.5%) | 0 (0.0%) |
| 18 to 34 Years | 49 (20.8%) | 6 (4.2%) |
| 35 to 64 Years | 9 (4.5%) | 106 (33.7%) |
| 65 to 74 Years | 16 (17.6%) | 8 (14.0%) |
| 75 Years and over | 28 (52.8%) | 26 (43.3%) |
Disability Class by Sex by Age in Browntown
Disability Class: Hearing Difficulty
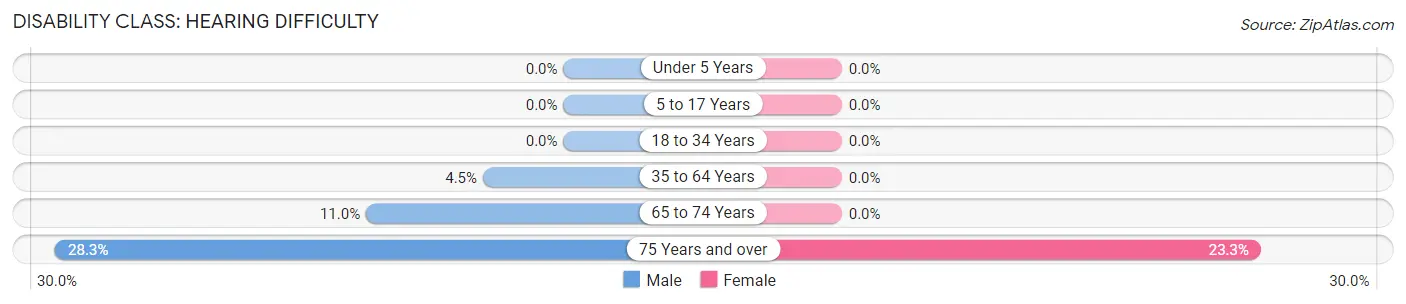
| Age Bracket | Male | Female |
| Under 5 Years | 0 (0.0%) | 0 (0.0%) |
| 5 to 17 Years | 0 (0.0%) | 0 (0.0%) |
| 18 to 34 Years | 0 (0.0%) | 0 (0.0%) |
| 35 to 64 Years | 9 (4.5%) | 0 (0.0%) |
| 65 to 74 Years | 10 (11.0%) | 0 (0.0%) |
| 75 Years and over | 15 (28.3%) | 14 (23.3%) |
Disability Class: Vision Difficulty
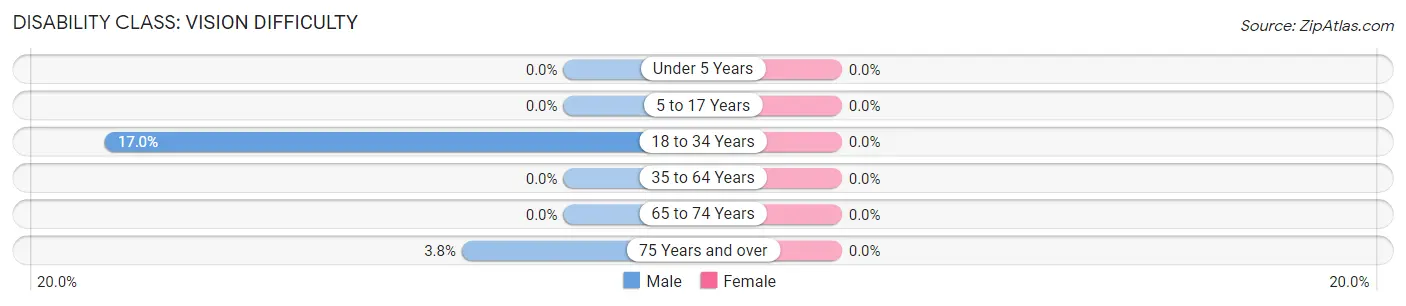
| Age Bracket | Male | Female |
| Under 5 Years | 0 (0.0%) | 0 (0.0%) |
| 5 to 17 Years | 0 (0.0%) | 0 (0.0%) |
| 18 to 34 Years | 40 (17.0%) | 0 (0.0%) |
| 35 to 64 Years | 0 (0.0%) | 0 (0.0%) |
| 65 to 74 Years | 0 (0.0%) | 0 (0.0%) |
| 75 Years and over | 2 (3.8%) | 0 (0.0%) |
Disability Class: Cognitive Difficulty
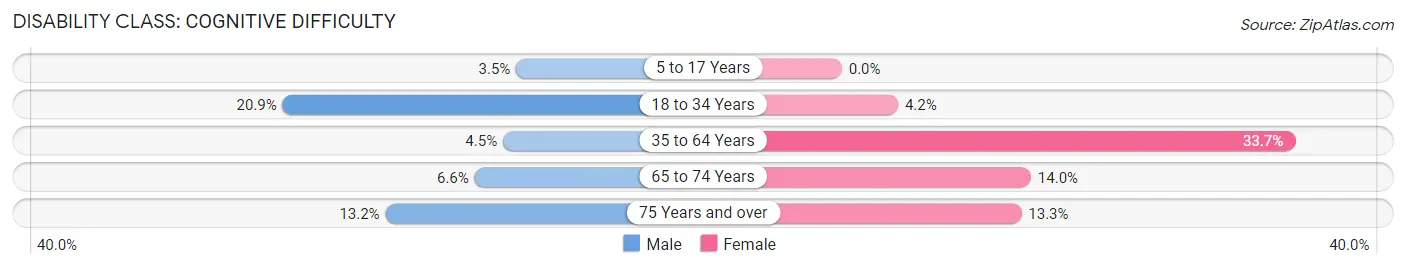
| Age Bracket | Male | Female |
| 5 to 17 Years | 7 (3.5%) | 0 (0.0%) |
| 18 to 34 Years | 49 (20.8%) | 6 (4.2%) |
| 35 to 64 Years | 9 (4.5%) | 106 (33.7%) |
| 65 to 74 Years | 6 (6.6%) | 8 (14.0%) |
| 75 Years and over | 7 (13.2%) | 8 (13.3%) |
Disability Class: Ambulatory Difficulty
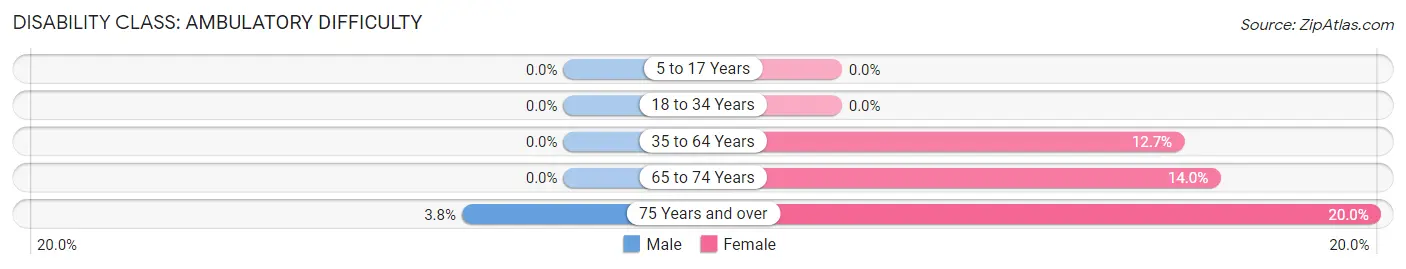
| Age Bracket | Male | Female |
| 5 to 17 Years | 0 (0.0%) | 0 (0.0%) |
| 18 to 34 Years | 0 (0.0%) | 0 (0.0%) |
| 35 to 64 Years | 0 (0.0%) | 40 (12.7%) |
| 65 to 74 Years | 0 (0.0%) | 8 (14.0%) |
| 75 Years and over | 2 (3.8%) | 12 (20.0%) |
Disability Class: Self-Care Difficulty
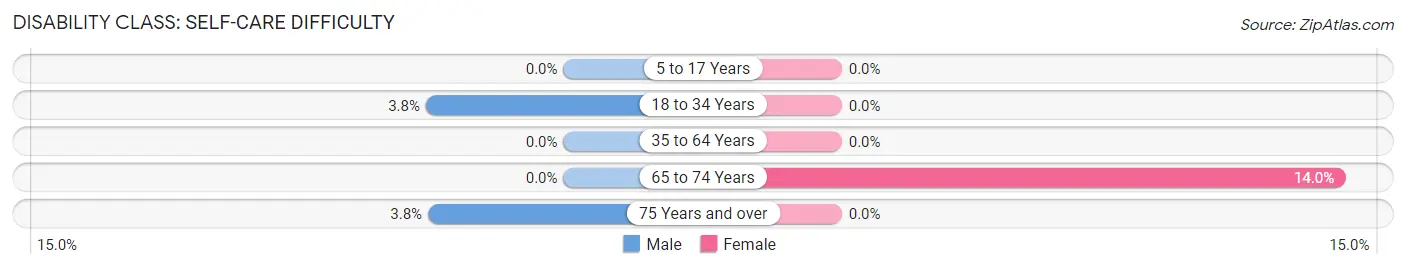
| Age Bracket | Male | Female |
| 5 to 17 Years | 0 (0.0%) | 0 (0.0%) |
| 18 to 34 Years | 9 (3.8%) | 0 (0.0%) |
| 35 to 64 Years | 0 (0.0%) | 0 (0.0%) |
| 65 to 74 Years | 0 (0.0%) | 8 (14.0%) |
| 75 Years and over | 2 (3.8%) | 0 (0.0%) |
Technology Access in Browntown
Computing Device Access in Browntown
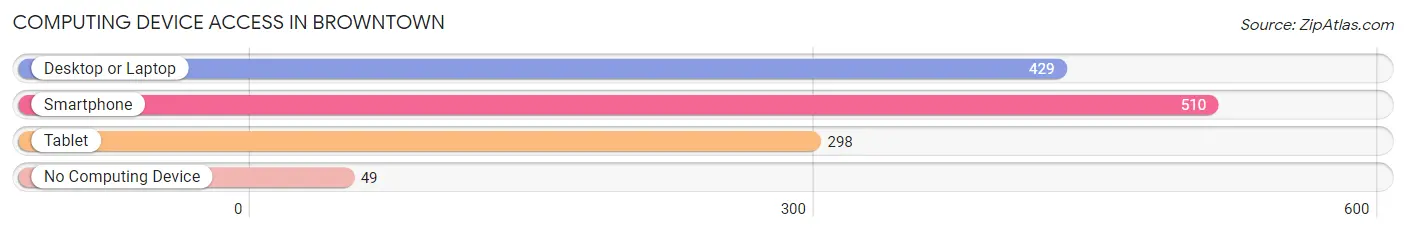
| Device Type | # Households | % Households |
| Desktop or Laptop | 429 | 70.3% |
| Smartphone | 510 | 83.6% |
| Tablet | 298 | 48.8% |
| No Computing Device | 49 | 8.0% |
| Total | 610 | 100.0% |
Internet Access in Browntown
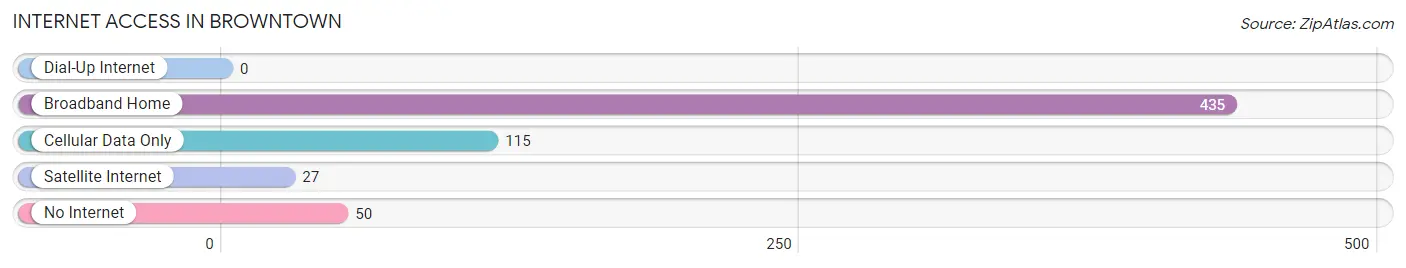
| Internet Type | # Households | % Households |
| Dial-Up Internet | 0 | 0.0% |
| Broadband Home | 435 | 71.3% |
| Cellular Data Only | 115 | 18.9% |
| Satellite Internet | 27 | 4.4% |
| No Internet | 50 | 8.2% |
| Total | 610 | 100.0% |
Browntown Summary
Brownstown is a borough located in Lancaster County, Pennsylvania. It is situated in the southeastern part of the county, approximately 8 miles east of the city of Lancaster. The population of Brownstown was 1,845 at the 2010 census.
History
Brownstown was founded in 1737 by a group of German settlers who had migrated from the Palatinate region of Germany. The town was originally known as “Brown’s Town” after the first settler, John Brown. The town was officially incorporated in 1815.
In the 19th century, Brownstown was a thriving agricultural community. The town was known for its production of wheat, corn, oats, and potatoes. The town also had a number of mills, including a grist mill, a saw mill, and a woolen mill.
In the early 20th century, Brownstown began to experience a decline in its agricultural economy. This was due to the introduction of new farming techniques and the mechanization of farming. As a result, many of the town’s residents began to look for work in the nearby cities of Lancaster and Reading.
Geography
Brownstown is located at 40°7′17″N 76°14′17″W (40.1214, -76.2379). According to the United States Census Bureau, the borough has a total area of 0.7 square miles (1.8 km2), all of it land.
The borough is located in the southeastern part of Lancaster County, approximately 8 miles east of the city of Lancaster. The borough is bordered by East Cocalico Township to the north, West Cocalico Township to the east, East Earl Township to the south, and West Earl Township to the west.
Economy
Brownstown’s economy is largely based on agriculture and light manufacturing. The town is home to a number of small businesses, including a feed mill, a lumber yard, and a number of small retail stores.
The town is also home to a number of small farms, which produce a variety of crops, including corn, wheat, oats, and potatoes. The town also has a number of small orchards, which produce apples, peaches, and other fruits.
Demographics
As of the 2010 census, there were 1,845 people, 745 households, and 517 families residing in the borough. The population density was 2,637.3 people per square mile (1,017.2/km2). There were 790 housing units at an average density of 1,125.7 per square mile (433.3/km2). The racial makeup of the borough was 97.2% White, 0.7% African American, 0.2% Native American, 0.2% Asian, 0.2% from other races, and 1.7% from two or more races. Hispanic or Latino of any race were 1.2% of the population.
There were 745 households, out of which 28.7% had children under the age of 18 living with them, 53.2% were married couples living together, 9.7% had a female householder with no husband present, and 32.3% were non-families. 28.2% of all households were made up of individuals, and 14.2% had someone living alone who was 65 years of age or older. The average household size was 2.47 and the average family size was 3.03.
In the borough, the population was spread out, with 24.2% under the age of 18, 6.7% from 18 to 24, 28.2% from 25 to 44, 22.7% from 45 to 64, and 18.2% who were 65 years of age or older. The median age was 39 years. For every 100 females, there were 92.2 males. For every 100 females age 18 and over, there were 88.2 males.
The median income for a household in the borough was $41,250, and the median income for a family was $50,000. Males had a median income of $35,000 versus $25,000 for females. The per capita income for the borough was $19,945. About 4.2% of families and 6.2% of the population were below the poverty line, including 8.2% of those under age 18 and 5.2% of those age 65 or over.
Common Questions
What is Per Capita Income in Browntown?
Per Capita income in Browntown is $29,693.
What is the Median Family Income in Browntown?
Median Family Income in Browntown is $65,677.
What is the Median Household income in Browntown?
Median Household Income in Browntown is $63,438.
What is Income or Wage Gap in Browntown?
Income or Wage Gap in Browntown is 9.4%.
Women in Browntown earn 90.6 cents for every dollar earned by a man.
What is Inequality or Gini Index in Browntown?
Inequality or Gini Index in Browntown is 0.33.
What is the Total Population of Browntown?
Total Population of Browntown is 1,476.
What is the Total Male Population of Browntown?
Total Male Population of Browntown is 816.
What is the Total Female Population of Browntown?
Total Female Population of Browntown is 660.
What is the Ratio of Males per 100 Females in Browntown?
There are 123.64 Males per 100 Females in Browntown.
What is the Ratio of Females per 100 Males in Browntown?
There are 80.88 Females per 100 Males in Browntown.
What is the Median Population Age in Browntown?
Median Population Age in Browntown is 37.2 Years.
What is the Average Family Size in Browntown
Average Family Size in Browntown is 3.1 People.
What is the Average Household Size in Browntown
Average Household Size in Browntown is 2.4 People.
How Large is the Labor Force in Browntown?
There are 788 People in the Labor Forcein in Browntown.
What is the Percentage of People in the Labor Force in Browntown?
65.2% of People are in the Labor Force in Browntown.
What is the Unemployment Rate in Browntown?
Unemployment Rate in Browntown is 3.2%.