Rupert, PA Map & Demographics
Rupert Map
Rupert Overview
$23,505
PER CAPITA INCOME
$46,635
AVG FAMILY INCOME
$46,442
AVG HOUSEHOLD INCOME
57.4%
WAGE / INCOME GAP [ % ]
42.6¢/ $1
WAGE / INCOME GAP [ $ ]
0.44
INEQUALITY / GINI INDEX
220
TOTAL POPULATION
107
MALE POPULATION
113
FEMALE POPULATION
94.69
MALES / 100 FEMALES
105.61
FEMALES / 100 MALES
34.8
MEDIAN AGE
3.3
AVG FAMILY SIZE
3.4
AVG HOUSEHOLD SIZE
109
LABOR FORCE [ PEOPLE ]
69.0%
PERCENT IN LABOR FORCE
7.3%
UNEMPLOYMENT RATE
Income in Rupert
Income Overview in Rupert
Per Capita Income in Rupert is $23,505, while median incomes of families and households are $46,635 and $46,442 respectively.
| Characteristic | Number | Measure |
| Per Capita Income | 220 | $23,505 |
| Median Family Income | 63 | $46,635 |
| Mean Family Income | 63 | $77,795 |
| Median Household Income | 65 | $46,442 |
| Mean Household Income | 65 | $82,314 |
| Income Deficit | 63 | $0 |
| Wage / Income Gap (%) | 220 | 57.45% |
| Wage / Income Gap ($) | 220 | 42.55¢ per $1 |
| Gini / Inequality Index | 220 | 0.44 |
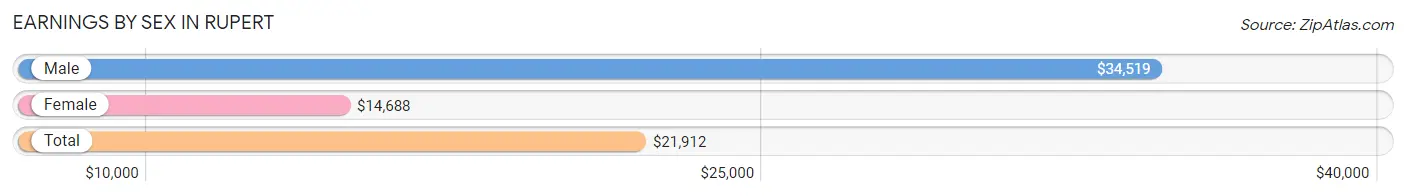
Earnings by Sex in Rupert
Average Earnings in Rupert are $21,912, $34,519 for men and $14,688 for women, a difference of 57.5%.
| Sex | Number | Average Earnings |
| Male | 61 (52.6%) | $34,519 |
| Female | 55 (47.4%) | $14,688 |
| Total | 116 (100.0%) | $21,912 |
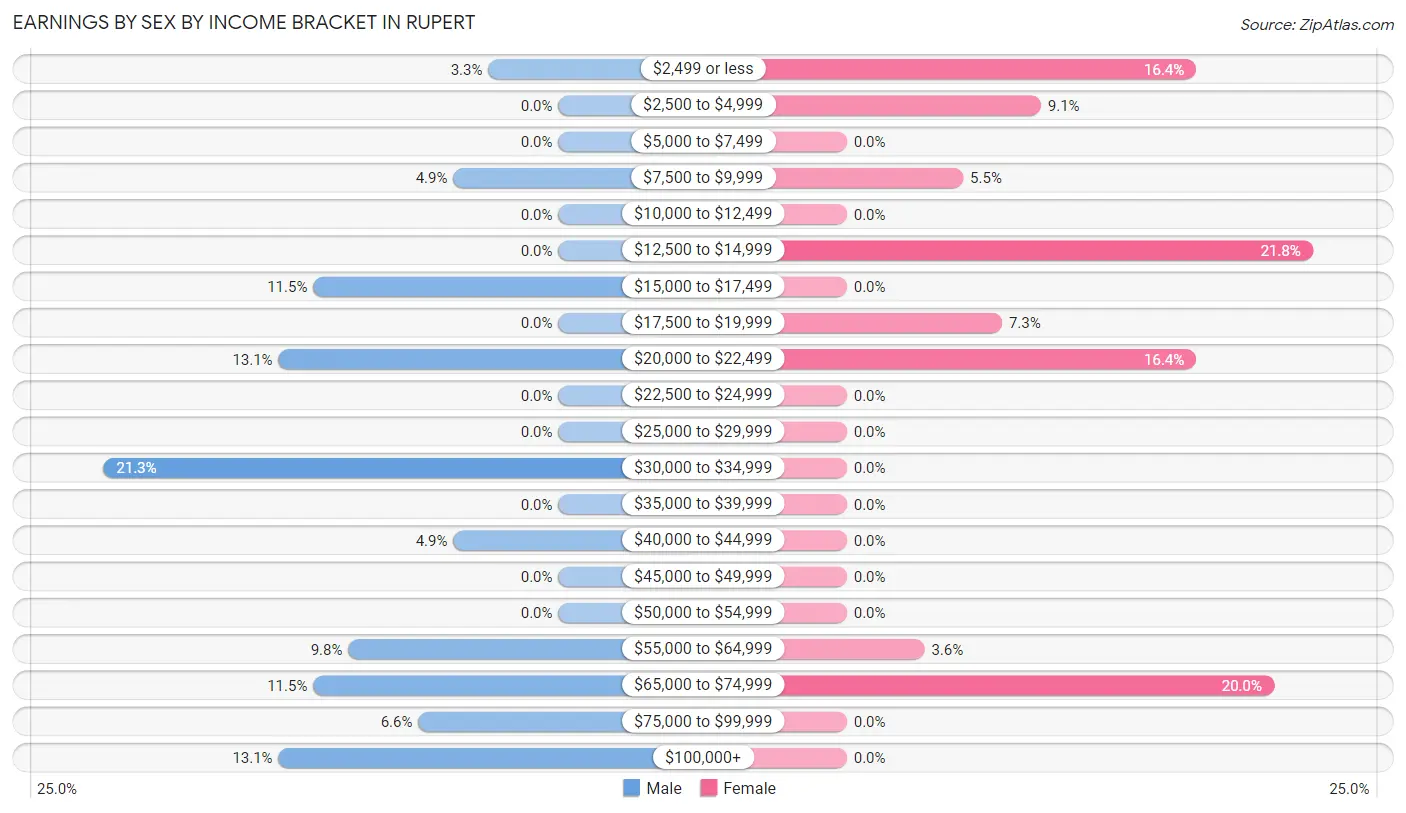
Earnings by Sex by Income Bracket in Rupert
The most common earnings brackets in Rupert are $30,000 to $34,999 for men (13 | 21.3%) and $12,500 to $14,999 for women (12 | 21.8%).
| Income | Male | Female |
| $2,499 or less | 2 (3.3%) | 9 (16.4%) |
| $2,500 to $4,999 | 0 (0.0%) | 5 (9.1%) |
| $5,000 to $7,499 | 0 (0.0%) | 0 (0.0%) |
| $7,500 to $9,999 | 3 (4.9%) | 3 (5.4%) |
| $10,000 to $12,499 | 0 (0.0%) | 0 (0.0%) |
| $12,500 to $14,999 | 0 (0.0%) | 12 (21.8%) |
| $15,000 to $17,499 | 7 (11.5%) | 0 (0.0%) |
| $17,500 to $19,999 | 0 (0.0%) | 4 (7.3%) |
| $20,000 to $22,499 | 8 (13.1%) | 9 (16.4%) |
| $22,500 to $24,999 | 0 (0.0%) | 0 (0.0%) |
| $25,000 to $29,999 | 0 (0.0%) | 0 (0.0%) |
| $30,000 to $34,999 | 13 (21.3%) | 0 (0.0%) |
| $35,000 to $39,999 | 0 (0.0%) | 0 (0.0%) |
| $40,000 to $44,999 | 3 (4.9%) | 0 (0.0%) |
| $45,000 to $49,999 | 0 (0.0%) | 0 (0.0%) |
| $50,000 to $54,999 | 0 (0.0%) | 0 (0.0%) |
| $55,000 to $64,999 | 6 (9.8%) | 2 (3.6%) |
| $65,000 to $74,999 | 7 (11.5%) | 11 (20.0%) |
| $75,000 to $99,999 | 4 (6.6%) | 0 (0.0%) |
| $100,000+ | 8 (13.1%) | 0 (0.0%) |
| Total | 61 (100.0%) | 55 (100.0%) |
Earnings by Sex by Educational Attainment in Rupert
| Educational Attainment | Male Income | Female Income |
| Less than High School | - | - |
| High School Diploma | - | - |
| College or Associate's Degree | - | - |
| Bachelor's Degree | - | - |
| Graduate Degree | - | - |
| Total | - | - |
Family Income in Rupert
Family Income Brackets in Rupert
According to the Rupert family income data, there are 15 families falling into the $15,000 to $24,999 income range, which is the most common income bracket and makes up 23.8% of all families.
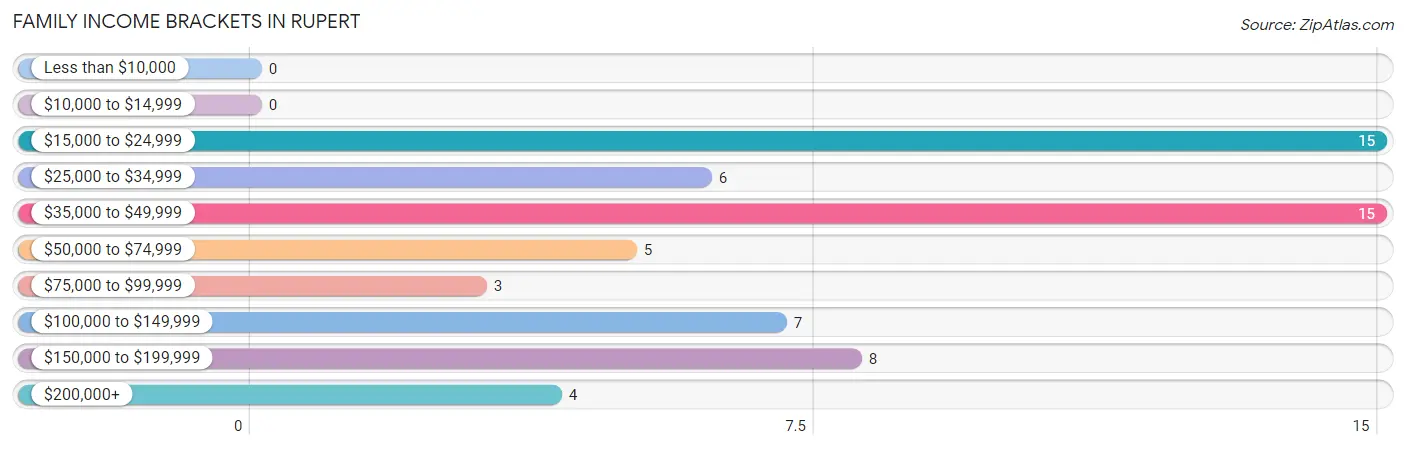
| Income Bracket | # Families | % Families |
| Less than $10,000 | 0 | 0.0% |
| $10,000 to $14,999 | 0 | 0.0% |
| $15,000 to $24,999 | 15 | 23.8% |
| $25,000 to $34,999 | 6 | 9.5% |
| $35,000 to $49,999 | 15 | 23.8% |
| $50,000 to $74,999 | 5 | 7.9% |
| $75,000 to $99,999 | 3 | 4.8% |
| $100,000 to $149,999 | 7 | 11.1% |
| $150,000 to $199,999 | 8 | 12.7% |
| $200,000+ | 4 | 6.3% |
Family Income by Famaliy Size in Rupert
4-person families (11 | 17.5%) account for the highest median family income in Rupert with $183,281 per family, while 4-person families (11 | 17.5%) have the highest median income of $45,820 per family member.
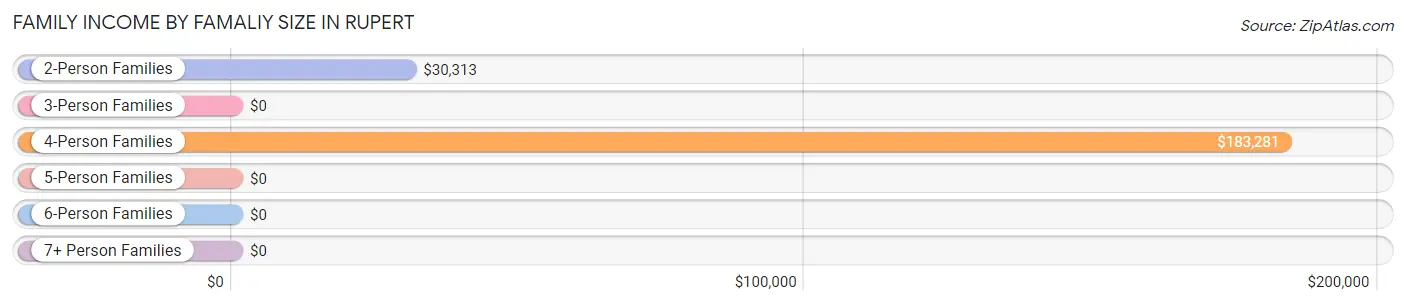
| Income Bracket | # Families | Median Income |
| 2-Person Families | 19 (30.2%) | $30,313 |
| 3-Person Families | 16 (25.4%) | $0 |
| 4-Person Families | 11 (17.5%) | $183,281 |
| 5-Person Families | 17 (27.0%) | $0 |
| 6-Person Families | 0 (0.0%) | $0 |
| 7+ Person Families | 0 (0.0%) | $0 |
| Total | 63 (100.0%) | $46,635 |
Family Income by Number of Earners in Rupert
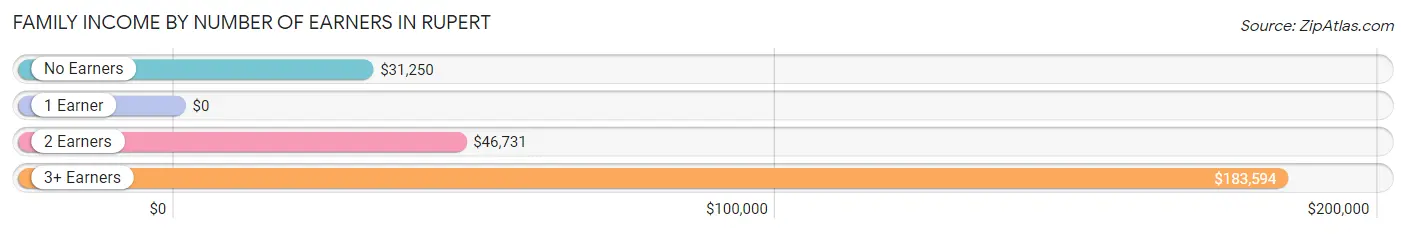
| Number of Earners | # Families | Median Income |
| No Earners | 6 (9.5%) | $31,250 |
| 1 Earner | 22 (34.9%) | $0 |
| 2 Earners | 18 (28.6%) | $46,731 |
| 3+ Earners | 17 (27.0%) | $183,594 |
| Total | 63 (100.0%) | $46,635 |
Household Income in Rupert
Household Income Brackets in Rupert
With 23 households falling in the category, the $35,000 to $49,999 income range is the most frequent in Rupert, accounting for 35.4% of all households.
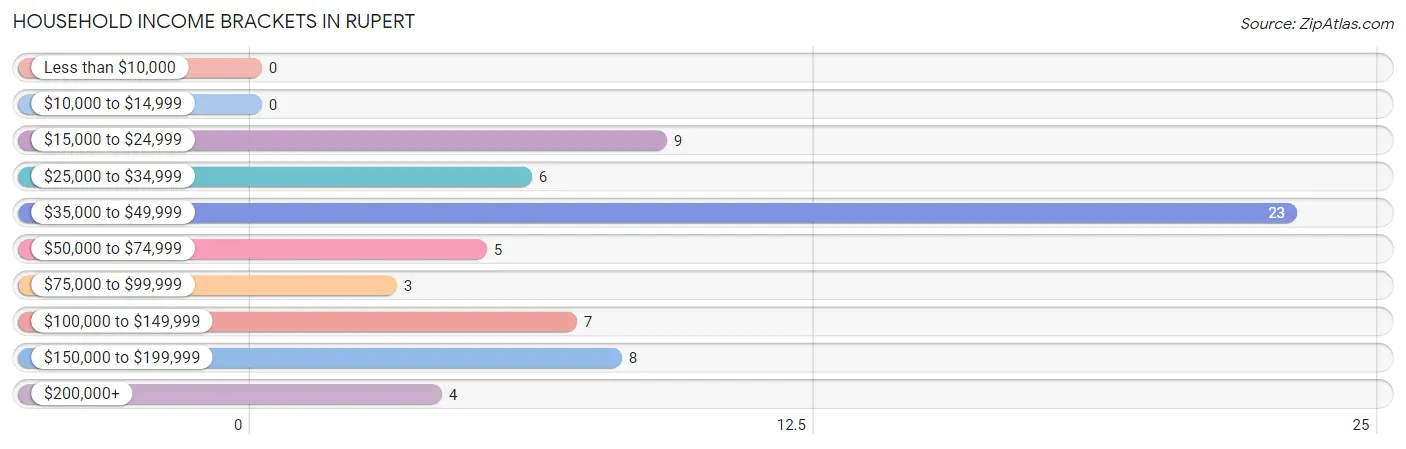
| Income Bracket | # Households | % Households |
| Less than $10,000 | 0 | 0.0% |
| $10,000 to $14,999 | 0 | 0.0% |
| $15,000 to $24,999 | 9 | 13.8% |
| $25,000 to $34,999 | 6 | 9.2% |
| $35,000 to $49,999 | 23 | 35.4% |
| $50,000 to $74,999 | 5 | 7.7% |
| $75,000 to $99,999 | 3 | 4.6% |
| $100,000 to $149,999 | 7 | 10.8% |
| $150,000 to $199,999 | 8 | 12.3% |
| $200,000+ | 4 | 6.2% |
Household Income by Householder Age in Rupert
The median household income in Rupert is $46,442, with the highest median household income of $32,188 found in the 65+ years age bracket for the primary householder. A total of 15 households (23.1%) fall into this category. Meanwhile, the 15 to 24 years age bracket for the primary householder has the lowest median household income of $0, with 5 households (7.7%) in this group.
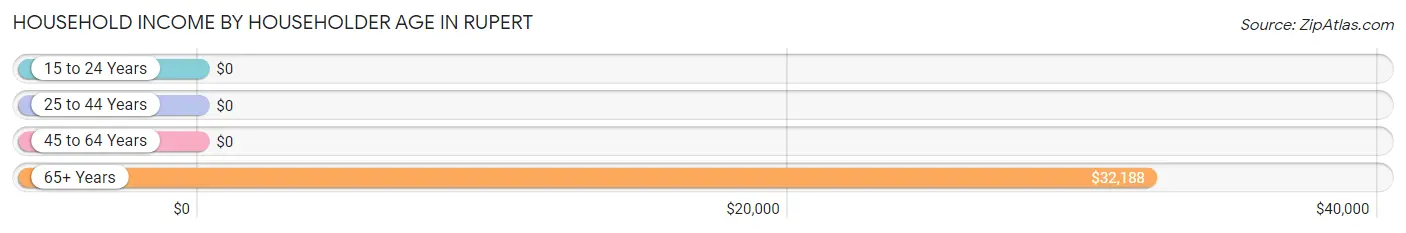
| Income Bracket | # Households | Median Income |
| 15 to 24 Years | 5 (7.7%) | $0 |
| 25 to 44 Years | 20 (30.8%) | $0 |
| 45 to 64 Years | 25 (38.5%) | $0 |
| 65+ Years | 15 (23.1%) | $32,188 |
| Total | 65 (100.0%) | $46,442 |
Poverty in Rupert
Income Below Poverty by Sex and Age in Rupert
With 13.1% poverty level for males and 12.4% for females among the residents of Rupert, 45 to 54 year old males and 12 to 14 year old females are the most vulnerable to poverty, with 8 males (50.0%) and 7 females (63.6%) in their respective age groups living below the poverty level.
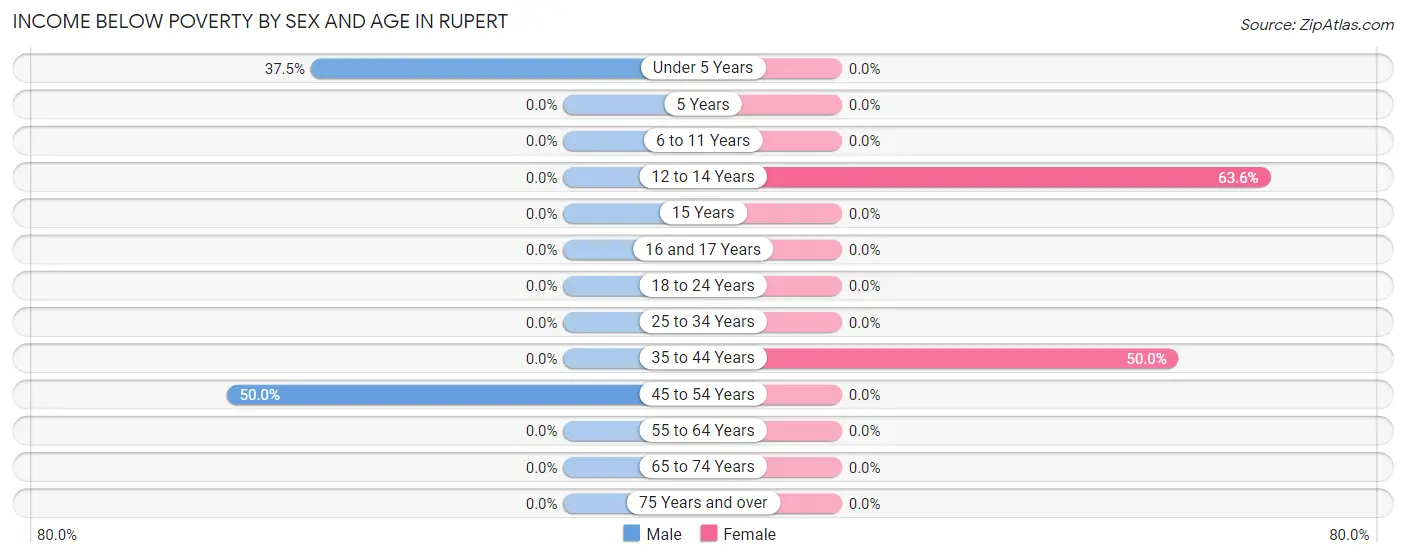
| Age Bracket | Male | Female |
| Under 5 Years | 6 (37.5%) | 0 (0.0%) |
| 5 Years | 0 (0.0%) | 0 (0.0%) |
| 6 to 11 Years | 0 (0.0%) | 0 (0.0%) |
| 12 to 14 Years | 0 (0.0%) | 7 (63.6%) |
| 15 Years | 0 (0.0%) | 0 (0.0%) |
| 16 and 17 Years | 0 (0.0%) | 0 (0.0%) |
| 18 to 24 Years | 0 (0.0%) | 0 (0.0%) |
| 25 to 34 Years | 0 (0.0%) | 0 (0.0%) |
| 35 to 44 Years | 0 (0.0%) | 7 (50.0%) |
| 45 to 54 Years | 8 (50.0%) | 0 (0.0%) |
| 55 to 64 Years | 0 (0.0%) | 0 (0.0%) |
| 65 to 74 Years | 0 (0.0%) | 0 (0.0%) |
| 75 Years and over | 0 (0.0%) | 0 (0.0%) |
| Total | 14 (13.1%) | 14 (12.4%) |
Income Above Poverty by Sex and Age in Rupert
According to the poverty statistics in Rupert, males aged 6 to 11 years and females aged under 5 years are the age groups that are most secure financially, with 100.0% of males and 100.0% of females in these age groups living above the poverty line.
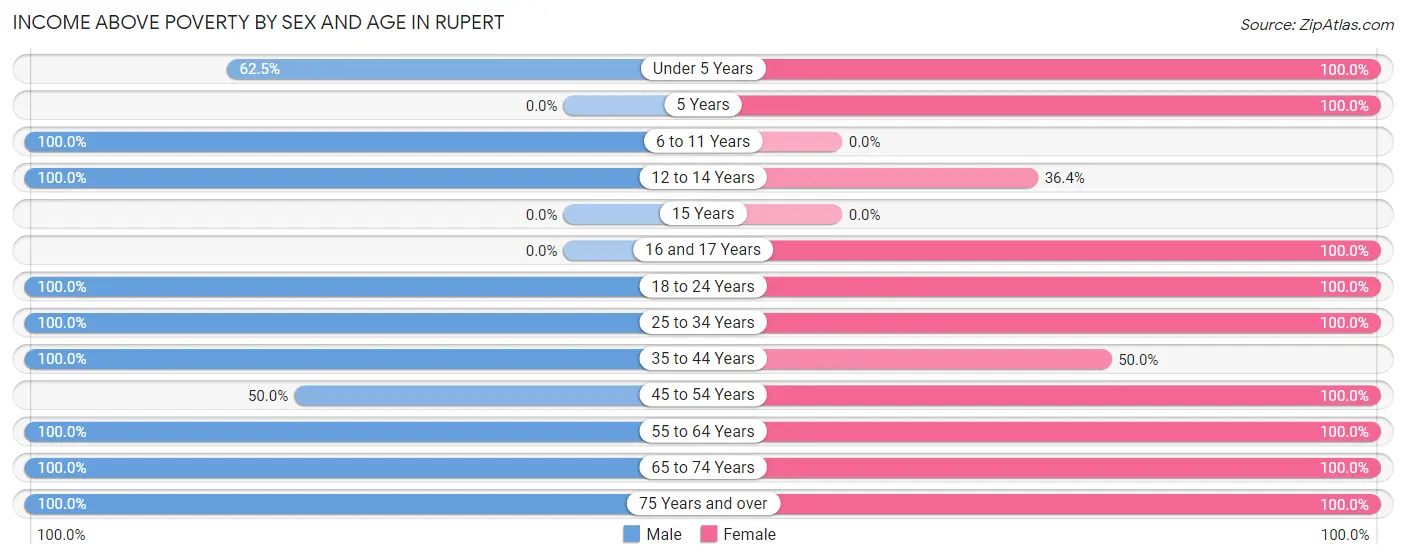
| Age Bracket | Male | Female |
| Under 5 Years | 10 (62.5%) | 3 (100.0%) |
| 5 Years | 0 (0.0%) | 12 (100.0%) |
| 6 to 11 Years | 16 (100.0%) | 0 (0.0%) |
| 12 to 14 Years | 4 (100.0%) | 4 (36.4%) |
| 15 Years | 0 (0.0%) | 0 (0.0%) |
| 16 and 17 Years | 0 (0.0%) | 9 (100.0%) |
| 18 to 24 Years | 5 (100.0%) | 5 (100.0%) |
| 25 to 34 Years | 6 (100.0%) | 28 (100.0%) |
| 35 to 44 Years | 23 (100.0%) | 7 (50.0%) |
| 45 to 54 Years | 8 (50.0%) | 3 (100.0%) |
| 55 to 64 Years | 7 (100.0%) | 13 (100.0%) |
| 65 to 74 Years | 9 (100.0%) | 9 (100.0%) |
| 75 Years and over | 5 (100.0%) | 6 (100.0%) |
| Total | 93 (86.9%) | 99 (87.6%) |
Income Below Poverty Among Married-Couple Families in Rupert
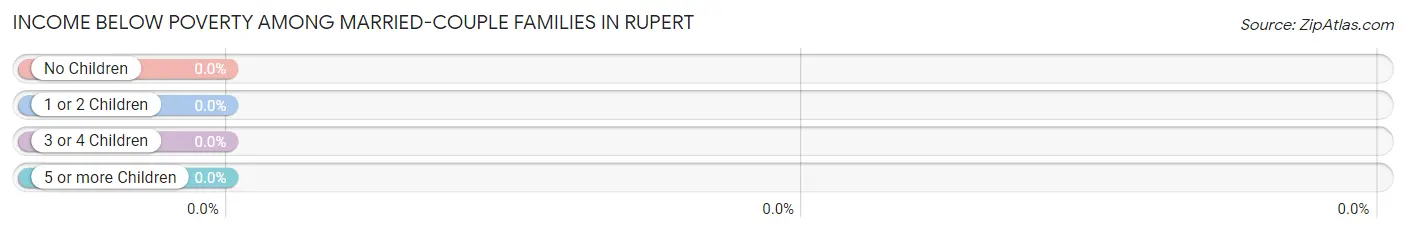
| Children | Above Poverty | Below Poverty |
| No Children | 15 (100.0%) | 0 (0.0%) |
| 1 or 2 Children | 15 (100.0%) | 0 (0.0%) |
| 3 or 4 Children | 13 (100.0%) | 0 (0.0%) |
| 5 or more Children | 0 (0.0%) | 0 (0.0%) |
| Total | 43 (100.0%) | 0 (0.0%) |
Income Below Poverty Among Single-Parent Households in Rupert
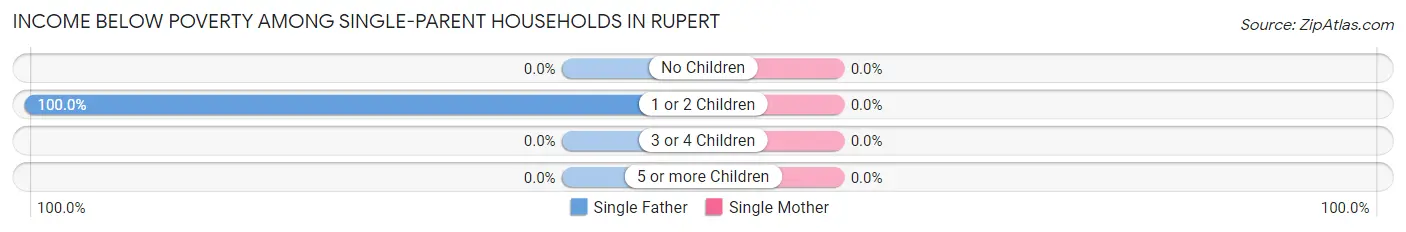
| Children | Single Father | Single Mother |
| No Children | 0 (0.0%) | 0 (0.0%) |
| 1 or 2 Children | 8 (100.0%) | 0 (0.0%) |
| 3 or 4 Children | 0 (0.0%) | 0 (0.0%) |
| 5 or more Children | 0 (0.0%) | 0 (0.0%) |
| Total | 8 (100.0%) | 0 (0.0%) |
Income Below Poverty Among Married-Couple vs Single-Parent Households in Rupert
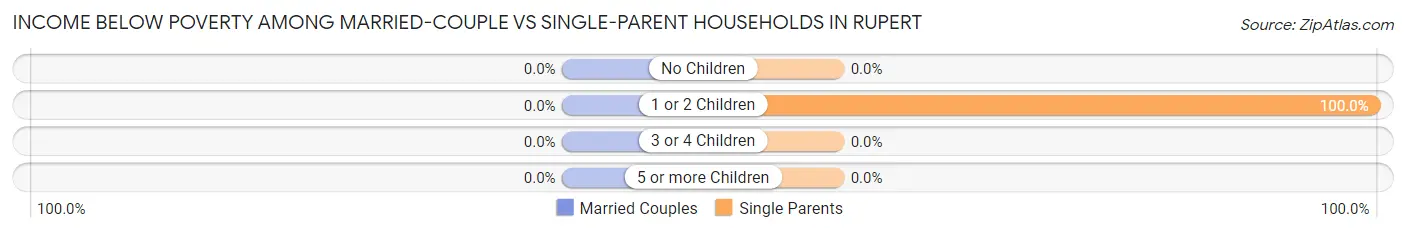
| Children | Married-Couple Families | Single-Parent Households |
| No Children | 0 (0.0%) | 0 (0.0%) |
| 1 or 2 Children | 0 (0.0%) | 8 (100.0%) |
| 3 or 4 Children | 0 (0.0%) | 0 (0.0%) |
| 5 or more Children | 0 (0.0%) | 0 (0.0%) |
| Total | 0 (0.0%) | 8 (40.0%) |
Race in Rupert
The most populous races in Rupert are White / Caucasian (209 | 95.0%), and Asian (11 | 5.0%).
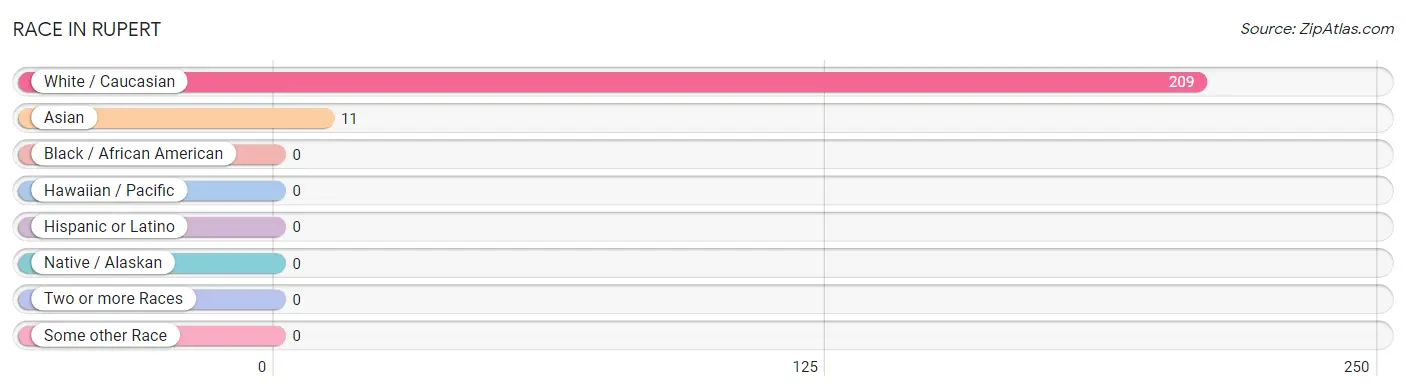
| Race | # Population | % Population |
| Asian | 11 | 5.0% |
| Black / African American | 0 | 0.0% |
| Hawaiian / Pacific | 0 | 0.0% |
| Hispanic or Latino | 0 | 0.0% |
| Native / Alaskan | 0 | 0.0% |
| White / Caucasian | 209 | 95.0% |
| Two or more Races | 0 | 0.0% |
| Some other Race | 0 | 0.0% |
| Total | 220 | 100.0% |
Ancestry in Rupert
The most populous ancestries reported in Rupert are Italian (30 | 13.6%), German (27 | 12.3%), Irish (27 | 12.3%), English (20 | 9.1%), and Pennsylvania German (20 | 9.1%), together accounting for 56.4% of all Rupert residents.
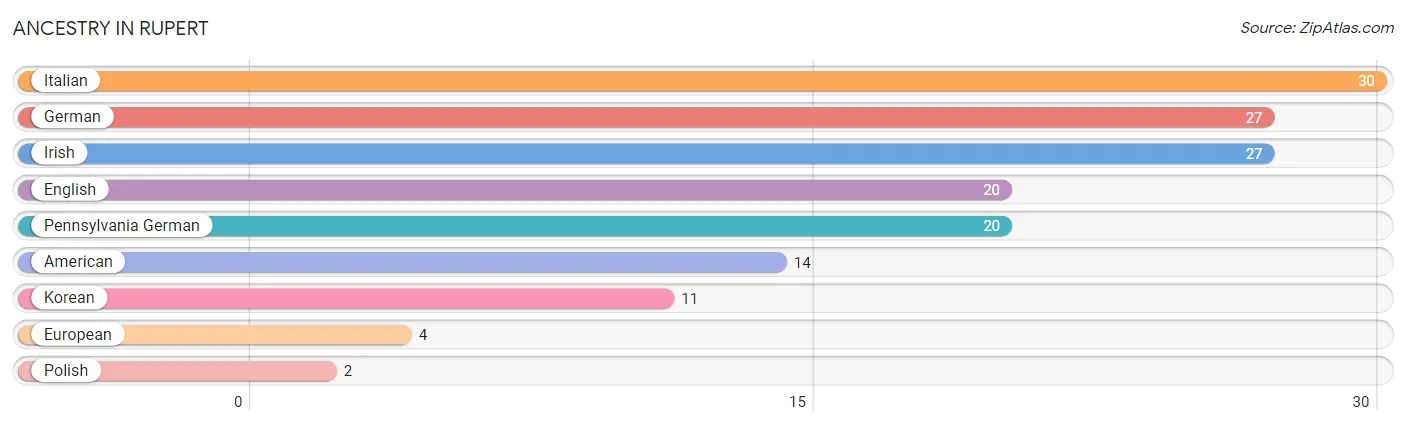
| Ancestry | # Population | % Population |
| American | 14 | 6.4% |
| English | 20 | 9.1% |
| European | 4 | 1.8% |
| German | 27 | 12.3% |
| Irish | 27 | 12.3% |
| Italian | 30 | 13.6% |
| Korean | 11 | 5.0% |
| Pennsylvania German | 20 | 9.1% |
| Polish | 2 | 0.9% | View All 9 Rows |
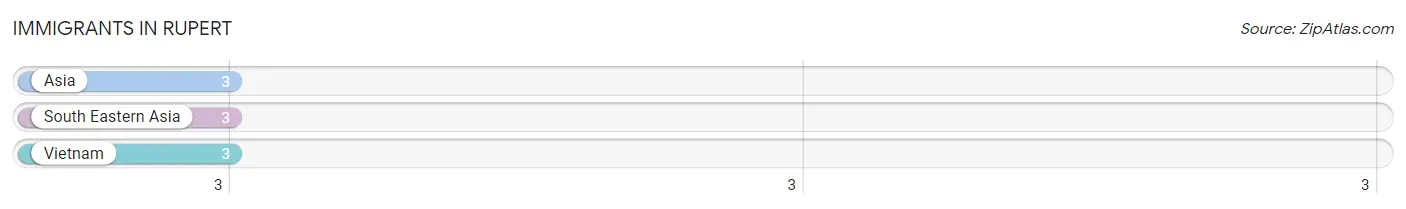
Immigrants in Rupert
The most numerous immigrant groups reported in Rupert came from Asia (3 | 1.4%), South Eastern Asia (3 | 1.4%), and Vietnam (3 | 1.4%), together accounting for 4.1% of all Rupert residents.
| Immigration Origin | # Population | % Population |
| Asia | 3 | 1.4% |
| South Eastern Asia | 3 | 1.4% |
| Vietnam | 3 | 1.4% | View All 3 Rows |
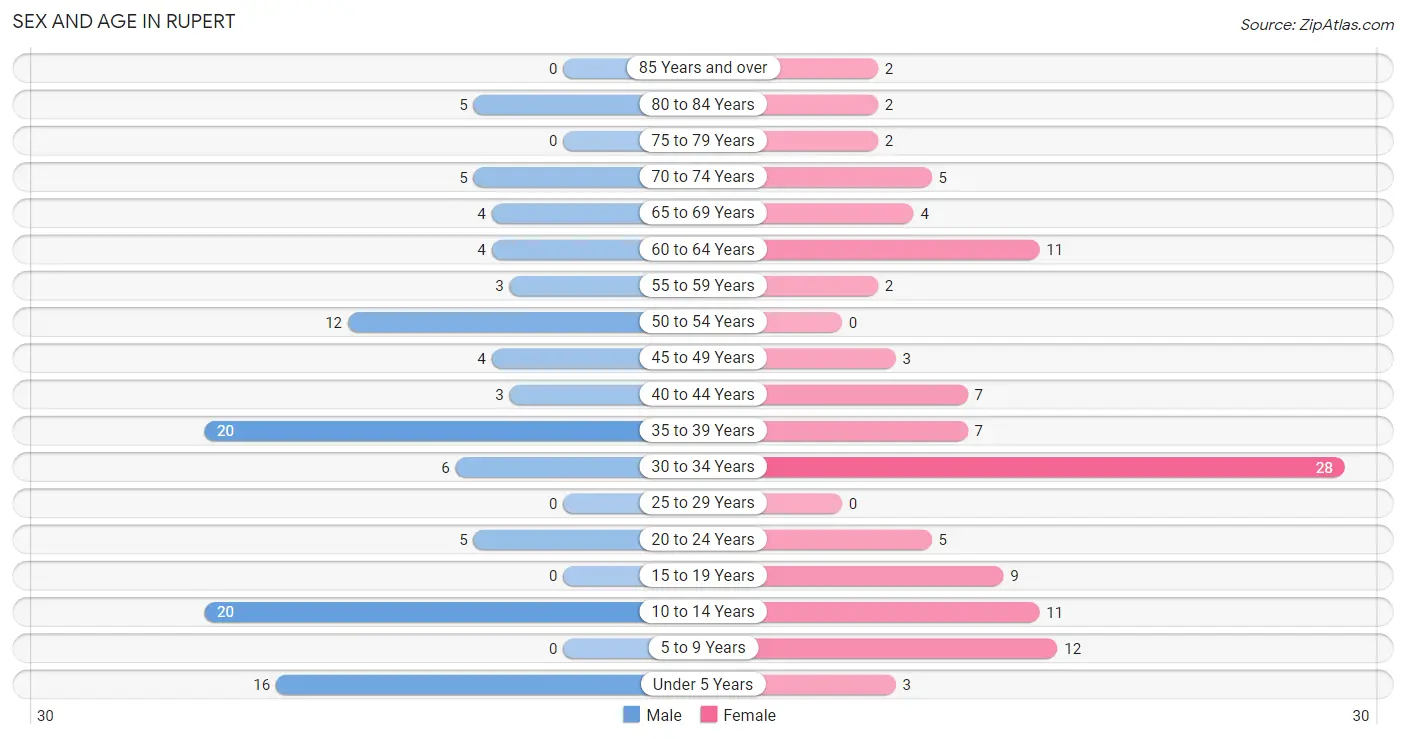
Sex and Age in Rupert
Sex and Age in Rupert
The most populous age groups in Rupert are 10 to 14 Years (20 | 18.7%) for men and 30 to 34 Years (28 | 24.8%) for women.
| Age Bracket | Male | Female |
| Under 5 Years | 16 (14.9%) | 3 (2.6%) |
| 5 to 9 Years | 0 (0.0%) | 12 (10.6%) |
| 10 to 14 Years | 20 (18.7%) | 11 (9.7%) |
| 15 to 19 Years | 0 (0.0%) | 9 (8.0%) |
| 20 to 24 Years | 5 (4.7%) | 5 (4.4%) |
| 25 to 29 Years | 0 (0.0%) | 0 (0.0%) |
| 30 to 34 Years | 6 (5.6%) | 28 (24.8%) |
| 35 to 39 Years | 20 (18.7%) | 7 (6.2%) |
| 40 to 44 Years | 3 (2.8%) | 7 (6.2%) |
| 45 to 49 Years | 4 (3.7%) | 3 (2.6%) |
| 50 to 54 Years | 12 (11.2%) | 0 (0.0%) |
| 55 to 59 Years | 3 (2.8%) | 2 (1.8%) |
| 60 to 64 Years | 4 (3.7%) | 11 (9.7%) |
| 65 to 69 Years | 4 (3.7%) | 4 (3.5%) |
| 70 to 74 Years | 5 (4.7%) | 5 (4.4%) |
| 75 to 79 Years | 0 (0.0%) | 2 (1.8%) |
| 80 to 84 Years | 5 (4.7%) | 2 (1.8%) |
| 85 Years and over | 0 (0.0%) | 2 (1.8%) |
| Total | 107 (100.0%) | 113 (100.0%) |
Families and Households in Rupert
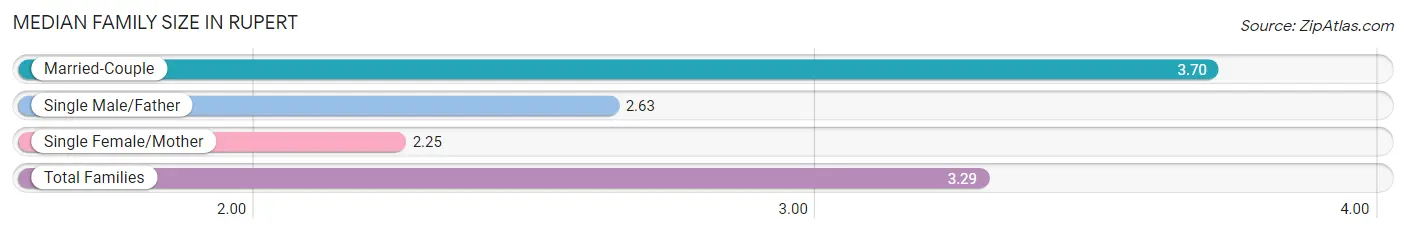
Median Family Size in Rupert
The median family size in Rupert is 3.29 persons per family, with married-couple families (43 | 68.2%) accounting for the largest median family size of 3.7 persons per family. On the other hand, single female/mother families (12 | 19.1%) represent the smallest median family size with 2.25 persons per family.
| Family Type | # Families | Family Size |
| Married-Couple | 43 (68.2%) | 3.70 |
| Single Male/Father | 8 (12.7%) | 2.63 |
| Single Female/Mother | 12 (19.1%) | 2.25 |
| Total Families | 63 (100.0%) | 3.29 |
Median Household Size in Rupert
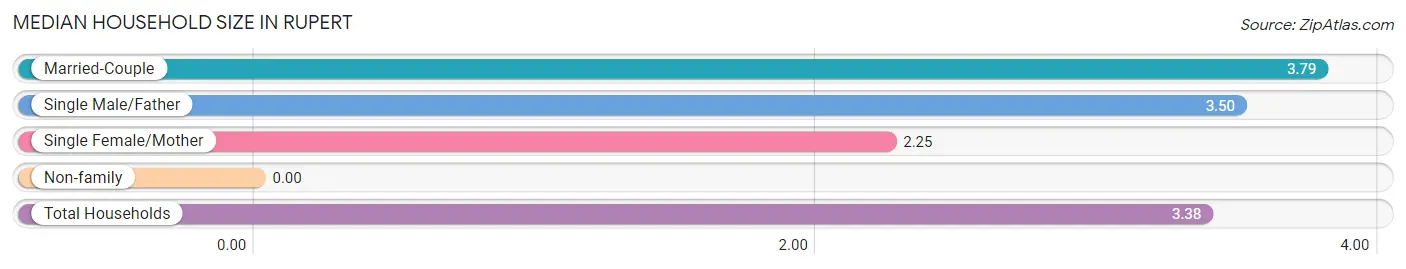
| Household Type | # Households | Household Size |
| Married-Couple | 43 (66.1%) | 3.79 |
| Single Male/Father | 8 (12.3%) | 3.50 |
| Single Female/Mother | 12 (18.5%) | 2.25 |
| Non-family | 2 (3.1%) | - |
| Total Households | 65 (100.0%) | 3.38 |
Household Size by Marriage Status in Rupert
Out of a total of 65 households in Rupert, 63 (96.9%) are family households, while 2 (3.1%) are nonfamily households. The most numerous type of family households are 2-person households, comprising 19, and the most common type of nonfamily households are 1-person households, comprising 2.
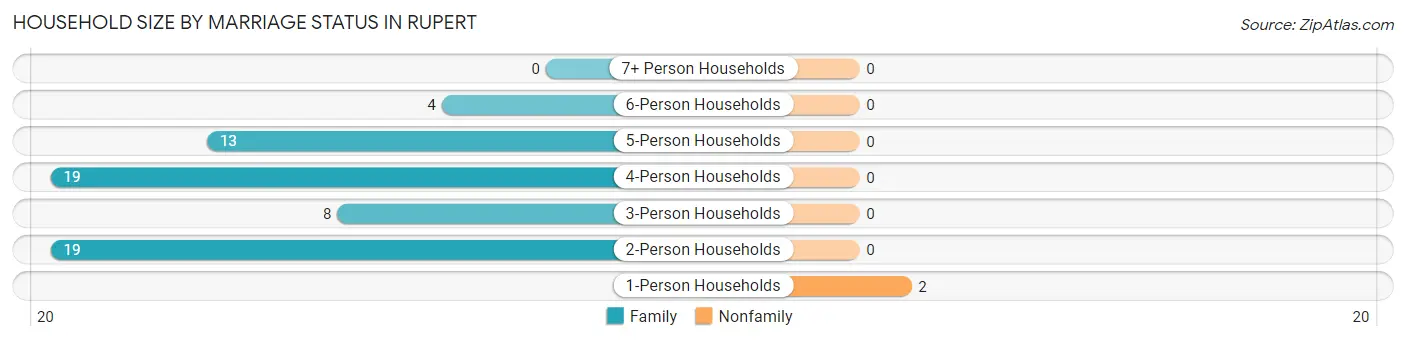
| Household Size | Family Households | Nonfamily Households |
| 1-Person Households | - | 2 (3.1%) |
| 2-Person Households | 19 (29.2%) | 0 (0.0%) |
| 3-Person Households | 8 (12.3%) | 0 (0.0%) |
| 4-Person Households | 19 (29.2%) | 0 (0.0%) |
| 5-Person Households | 13 (20.0%) | 0 (0.0%) |
| 6-Person Households | 4 (6.1%) | 0 (0.0%) |
| 7+ Person Households | 0 (0.0%) | 0 (0.0%) |
| Total | 63 (96.9%) | 2 (3.1%) |
Female Fertility in Rupert
Fertility by Age in Rupert
| Age Bracket | Women with Births | Births / 1,000 Women |
| 15 to 19 years | 0 (0.0%) | 0.0 |
| 20 to 34 years | 0 (0.0%) | 0.0 |
| 35 to 50 years | 0 (0.0%) | 0.0 |
| Total | 0 (0.0%) | 0.0 |
Fertility by Age by Marriage Status in Rupert
| Age Bracket | Married | Unmarried |
| 15 to 19 years | 0 (0.0%) | 0 (0.0%) |
| 20 to 34 years | 0 (0.0%) | 0 (0.0%) |
| 35 to 50 years | 0 (0.0%) | 0 (0.0%) |
| Total | 0 (0.0%) | 0 (0.0%) |
Fertility by Education in Rupert
| Educational Attainment | Women with Births | Births / 1,000 Women |
| Less than High School | 0 (0.0%) | 0.0 |
| High School Diploma | 0 (0.0%) | 0.0 |
| College or Associate's Degree | 0 (0.0%) | 0.0 |
| Bachelor's Degree | 0 (0.0%) | 0.0 |
| Graduate Degree | 0 (0.0%) | 0.0 |
| Total | 0 (0.0%) | 0.0 |
Fertility by Education by Marriage Status in Rupert
| Educational Attainment | Married | Unmarried |
| Less than High School | 0 (0.0%) | 0 (0.0%) |
| High School Diploma | 0 (0.0%) | 0 (0.0%) |
| College or Associate's Degree | 0 (0.0%) | 0 (0.0%) |
| Bachelor's Degree | 0 (0.0%) | 0 (0.0%) |
| Graduate Degree | 0 (0.0%) | 0 (0.0%) |
| Total | 0 (0.0%) | 0 (0.0%) |
Employment Characteristics in Rupert
Employment by Class of Employer in Rupert
Among the 101 employed individuals in Rupert, private company employees (97 | 96.0%), and state government employees (4 | 4.0%) make up the most common classes of employment.
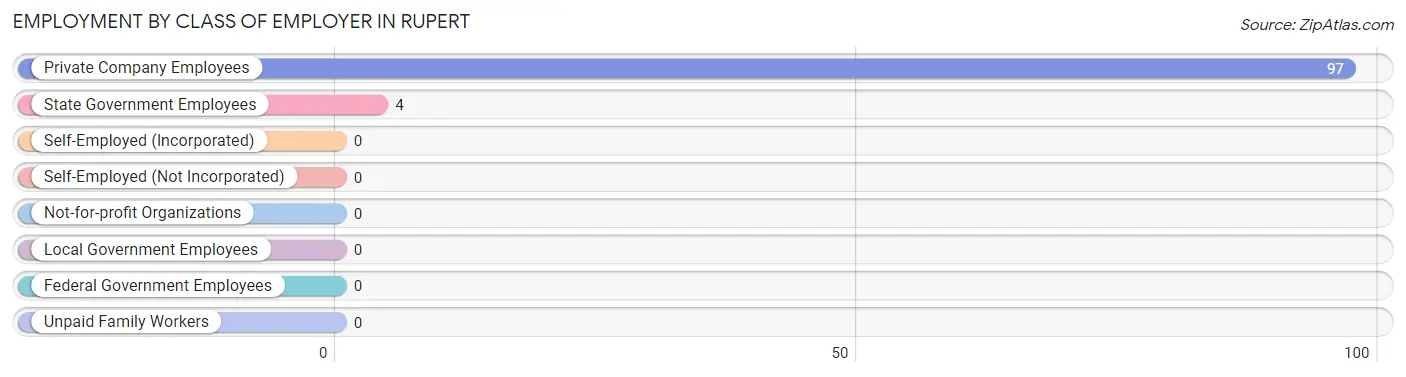
| Employer Class | # Employees | % Employees |
| Private Company Employees | 97 | 96.0% |
| Self-Employed (Incorporated) | 0 | 0.0% |
| Self-Employed (Not Incorporated) | 0 | 0.0% |
| Not-for-profit Organizations | 0 | 0.0% |
| Local Government Employees | 0 | 0.0% |
| State Government Employees | 4 | 4.0% |
| Federal Government Employees | 0 | 0.0% |
| Unpaid Family Workers | 0 | 0.0% |
| Total | 101 | 100.0% |
Employment Status by Age in Rupert
According to the labor force statistics for Rupert, out of the total population over 16 years of age (158), 69.0% or 109 individuals are in the labor force, with 7.3% or 8 of them unemployed. The age group with the highest labor force participation rate is 16 to 19 years, with 100.0% or 9 individuals in the labor force. Within the labor force, the 20 to 24 years age range has the highest percentage of unemployed individuals, with 50.0% or 5 of them being unemployed.
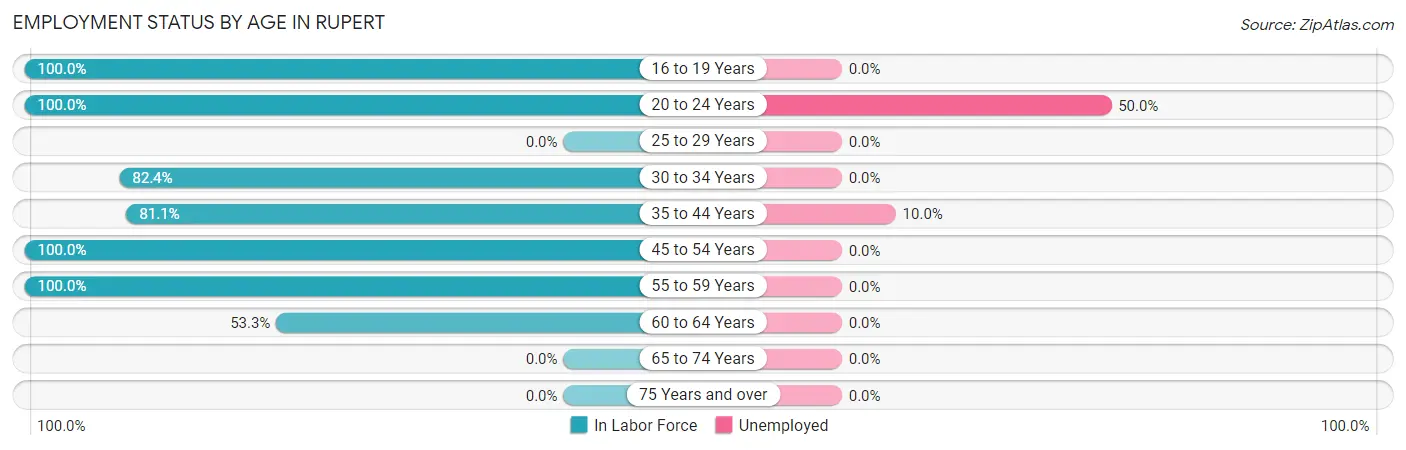
| Age Bracket | In Labor Force | Unemployed |
| 16 to 19 Years | 9 (100.0%) | 0 (0.0%) |
| 20 to 24 Years | 10 (100.0%) | 5 (50.0%) |
| 25 to 29 Years | 0 (0.0%) | 0 (0.0%) |
| 30 to 34 Years | 28 (82.4%) | 0 (0.0%) |
| 35 to 44 Years | 30 (81.1%) | 3 (10.0%) |
| 45 to 54 Years | 19 (100.0%) | 0 (0.0%) |
| 55 to 59 Years | 5 (100.0%) | 0 (0.0%) |
| 60 to 64 Years | 8 (53.3%) | 0 (0.0%) |
| 65 to 74 Years | 0 (0.0%) | 0 (0.0%) |
| 75 Years and over | 0 (0.0%) | 0 (0.0%) |
| Total | 109 (69.0%) | 8 (7.3%) |
Employment Status by Educational Attainment in Rupert
According to labor force statistics for Rupert, 81.8% of individuals (90) out of the total population between 25 and 64 years of age (110) are in the labor force, with 3.3% or 3 of them being unemployed. The group with the highest labor force participation rate are those with the educational attainment of college / associate degree, with 100.0% or 29 individuals in the labor force. Within the labor force, individuals with high school diploma education have the highest percentage of unemployment, with 6.7% or 3 of them being unemployed.
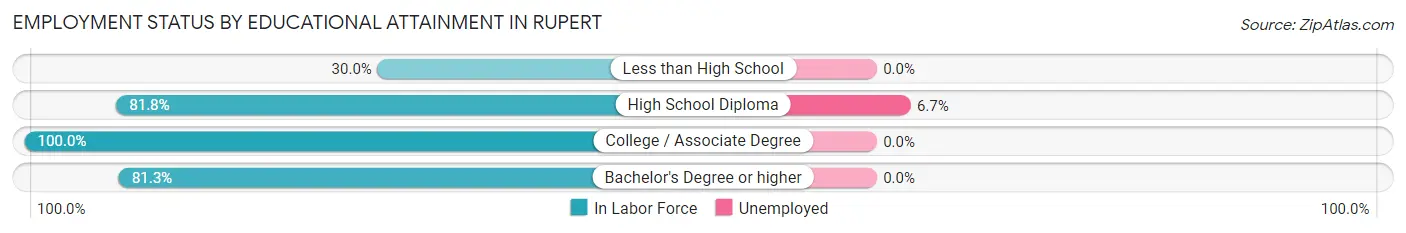
| Educational Attainment | In Labor Force | Unemployed |
| Less than High School | 3 (30.0%) | 0 (0.0%) |
| High School Diploma | 45 (81.8%) | 4 (6.7%) |
| College / Associate Degree | 29 (100.0%) | 0 (0.0%) |
| Bachelor's Degree or higher | 13 (81.3%) | 0 (0.0%) |
| Total | 90 (81.8%) | 4 (3.3%) |
Employment Occupations by Sex in Rupert
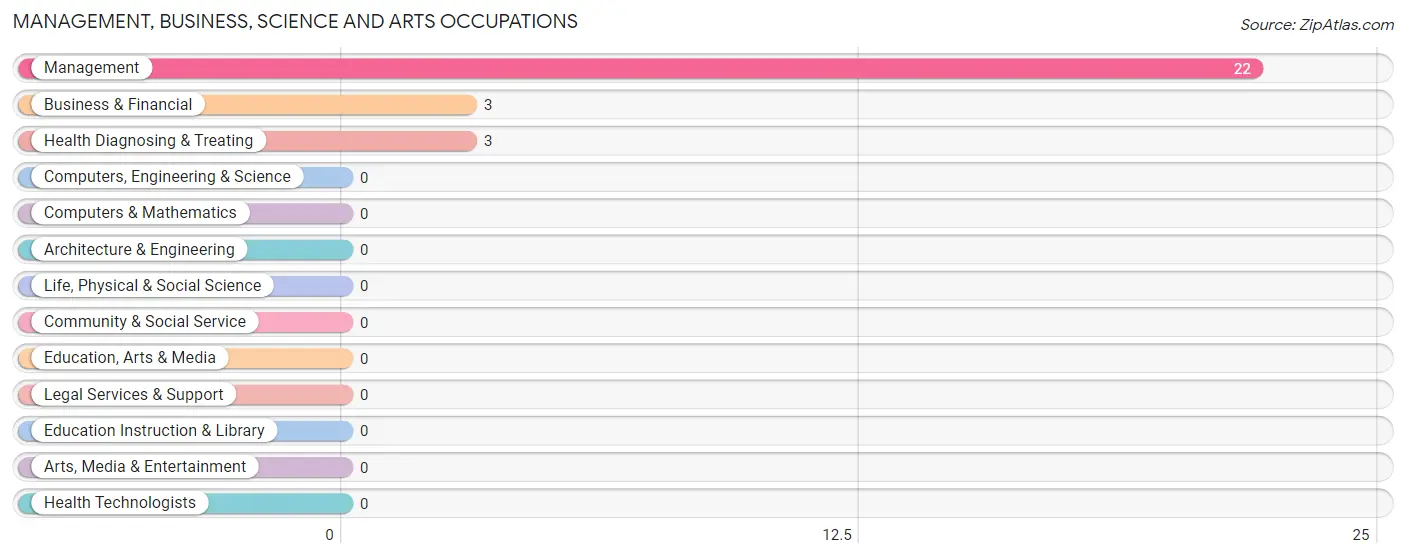
Management, Business, Science and Arts Occupations
The most common Management, Business, Science and Arts occupations in Rupert are Management (22 | 21.8%), Business & Financial (3 | 3.0%), and Health Diagnosing & Treating (3 | 3.0%).
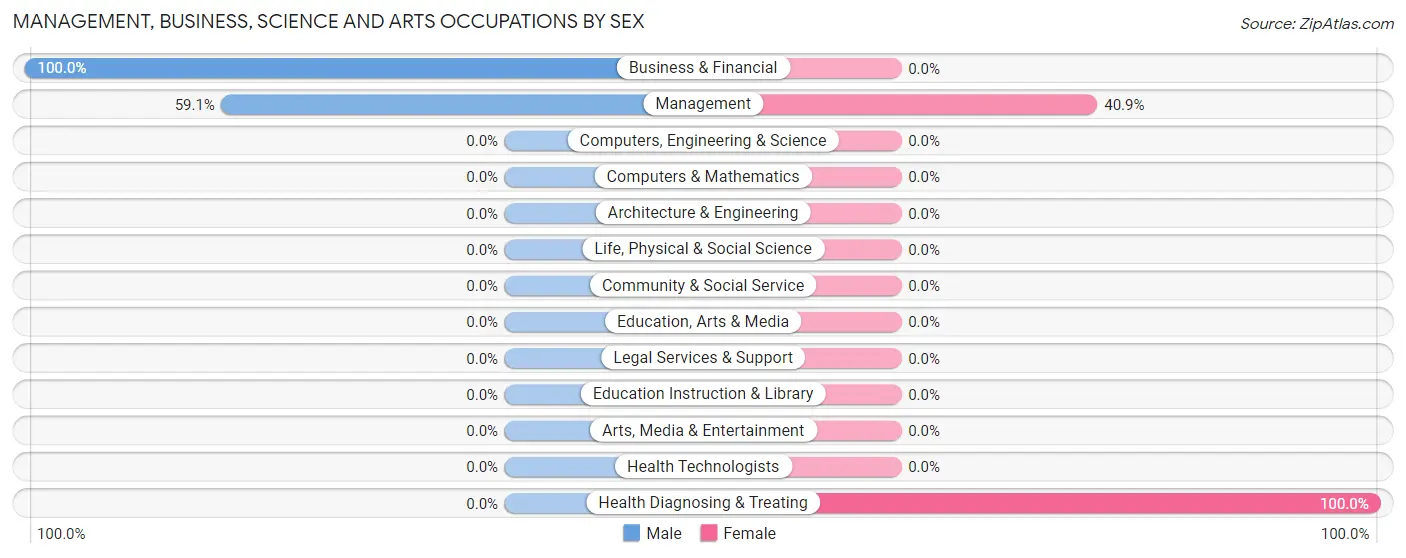
Management, Business, Science and Arts Occupations by Sex
Within the Management, Business, Science and Arts occupations in Rupert, the most male-oriented occupations are Business & Financial (100.0%), and Management (59.1%), while the most female-oriented occupations are Health Diagnosing & Treating (100.0%), and Management (40.9%).
| Occupation | Male | Female |
| Management | 13 (59.1%) | 9 (40.9%) |
| Business & Financial | 3 (100.0%) | 0 (0.0%) |
| Computers, Engineering & Science | 0 (0.0%) | 0 (0.0%) |
| Computers & Mathematics | 0 (0.0%) | 0 (0.0%) |
| Architecture & Engineering | 0 (0.0%) | 0 (0.0%) |
| Life, Physical & Social Science | 0 (0.0%) | 0 (0.0%) |
| Community & Social Service | 0 (0.0%) | 0 (0.0%) |
| Education, Arts & Media | 0 (0.0%) | 0 (0.0%) |
| Legal Services & Support | 0 (0.0%) | 0 (0.0%) |
| Education Instruction & Library | 0 (0.0%) | 0 (0.0%) |
| Arts, Media & Entertainment | 0 (0.0%) | 0 (0.0%) |
| Health Diagnosing & Treating | 0 (0.0%) | 3 (100.0%) |
| Health Technologists | 0 (0.0%) | 0 (0.0%) |
| Total (Category) | 16 (57.1%) | 12 (42.9%) |
| Total (Overall) | 51 (50.5%) | 50 (49.5%) |
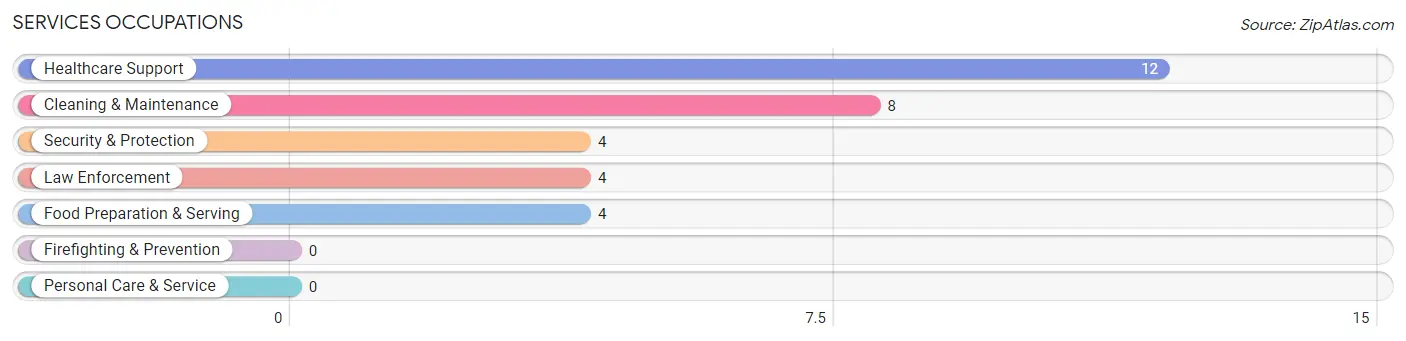
Services Occupations
The most common Services occupations in Rupert are Healthcare Support (12 | 11.9%), Cleaning & Maintenance (8 | 7.9%), Security & Protection (4 | 4.0%), Law Enforcement (4 | 4.0%), and Food Preparation & Serving (4 | 4.0%).
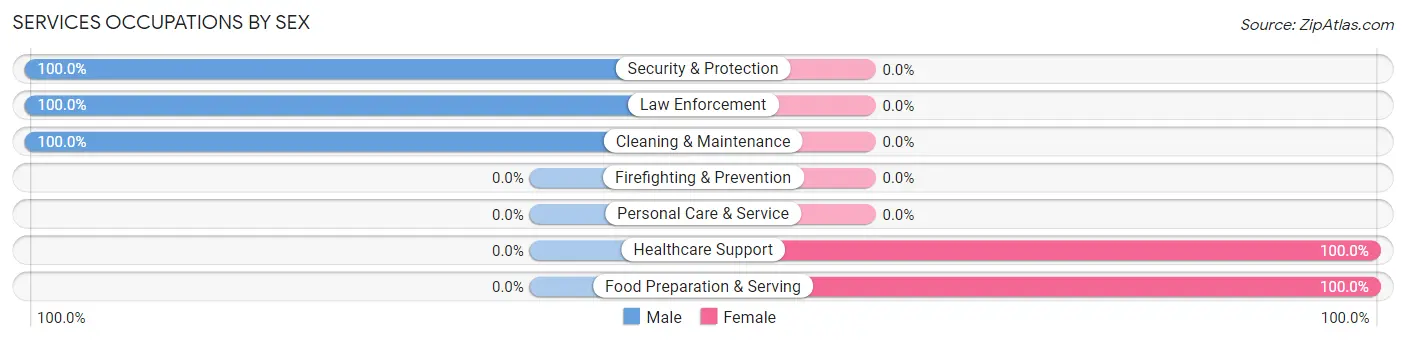
Services Occupations by Sex
Within the Services occupations in Rupert, the most male-oriented occupations are Security & Protection (100.0%), Law Enforcement (100.0%), and Cleaning & Maintenance (100.0%), while the most female-oriented occupations are Healthcare Support (100.0%), and Food Preparation & Serving (100.0%).
| Occupation | Male | Female |
| Healthcare Support | 0 (0.0%) | 12 (100.0%) |
| Security & Protection | 4 (100.0%) | 0 (0.0%) |
| Firefighting & Prevention | 0 (0.0%) | 0 (0.0%) |
| Law Enforcement | 4 (100.0%) | 0 (0.0%) |
| Food Preparation & Serving | 0 (0.0%) | 4 (100.0%) |
| Cleaning & Maintenance | 8 (100.0%) | 0 (0.0%) |
| Personal Care & Service | 0 (0.0%) | 0 (0.0%) |
| Total (Category) | 12 (42.9%) | 16 (57.1%) |
| Total (Overall) | 51 (50.5%) | 50 (49.5%) |
Sales and Office Occupations
The most common Sales and Office occupations in Rupert are Sales & Related (16 | 15.8%), and Office & Administration (7 | 6.9%).
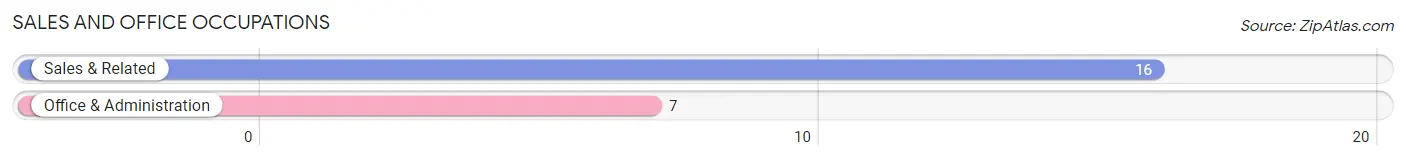
Sales and Office Occupations by Sex

| Occupation | Male | Female |
| Sales & Related | 0 (0.0%) | 16 (100.0%) |
| Office & Administration | 7 (100.0%) | 0 (0.0%) |
| Total (Category) | 7 (30.4%) | 16 (69.6%) |
| Total (Overall) | 51 (50.5%) | 50 (49.5%) |
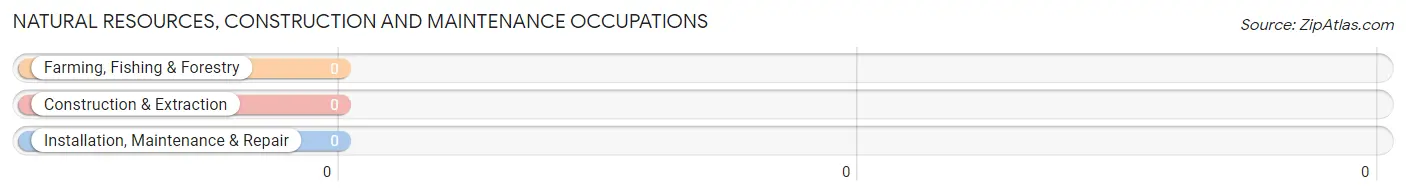
Natural Resources, Construction and Maintenance Occupations
Natural Resources, Construction and Maintenance Occupations by Sex
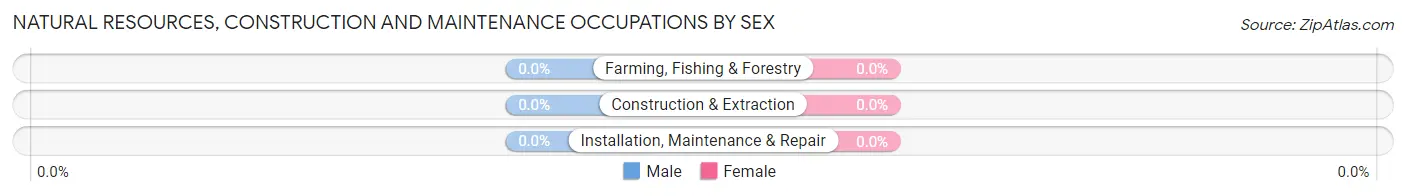
| Occupation | Male | Female |
| Farming, Fishing & Forestry | 0 (0.0%) | 0 (0.0%) |
| Construction & Extraction | 0 (0.0%) | 0 (0.0%) |
| Installation, Maintenance & Repair | 0 (0.0%) | 0 (0.0%) |
| Total (Category) | 0 (0.0%) | 0 (0.0%) |
| Total (Overall) | 51 (50.5%) | 50 (49.5%) |
Production, Transportation and Moving Occupations
The most common Production, Transportation and Moving occupations in Rupert are Production (13 | 12.9%), Material Moving (5 | 5.0%), and Transportation (4 | 4.0%).
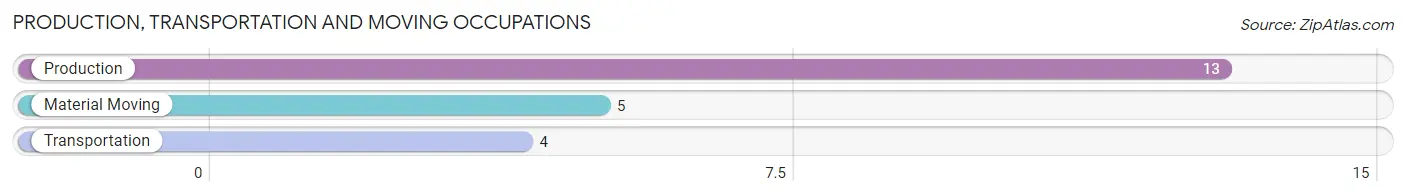
Production, Transportation and Moving Occupations by Sex
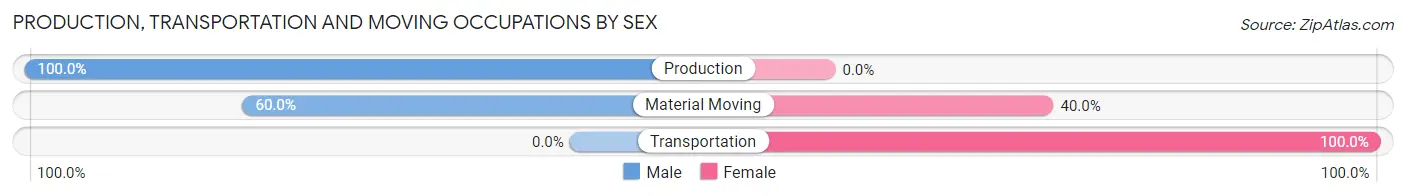
| Occupation | Male | Female |
| Production | 13 (100.0%) | 0 (0.0%) |
| Transportation | 0 (0.0%) | 4 (100.0%) |
| Material Moving | 3 (60.0%) | 2 (40.0%) |
| Total (Category) | 16 (72.7%) | 6 (27.3%) |
| Total (Overall) | 51 (50.5%) | 50 (49.5%) |
Employment Industries by Sex in Rupert
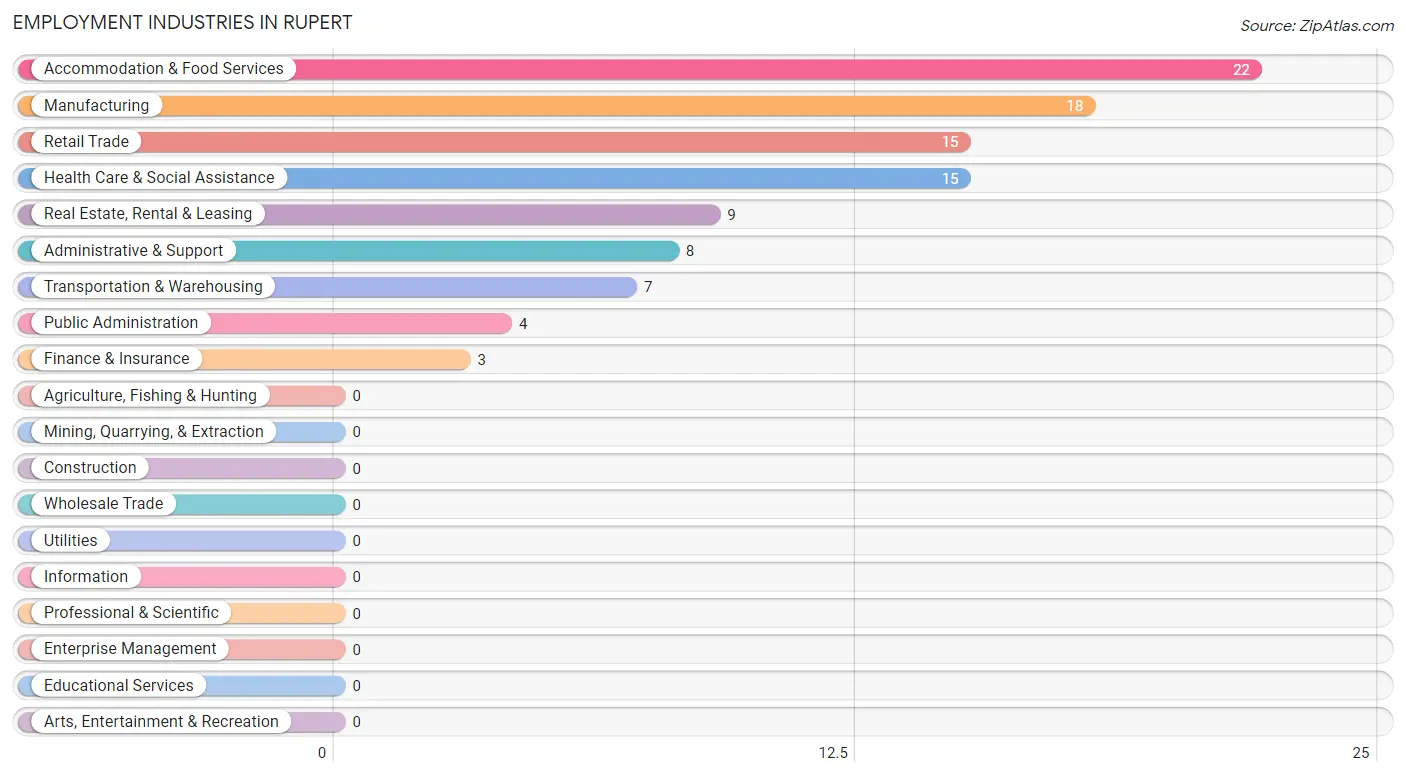
Employment Industries in Rupert
The major employment industries in Rupert include Accommodation & Food Services (22 | 21.8%), Manufacturing (18 | 17.8%), Retail Trade (15 | 14.8%), Health Care & Social Assistance (15 | 14.8%), and Real Estate, Rental & Leasing (9 | 8.9%).
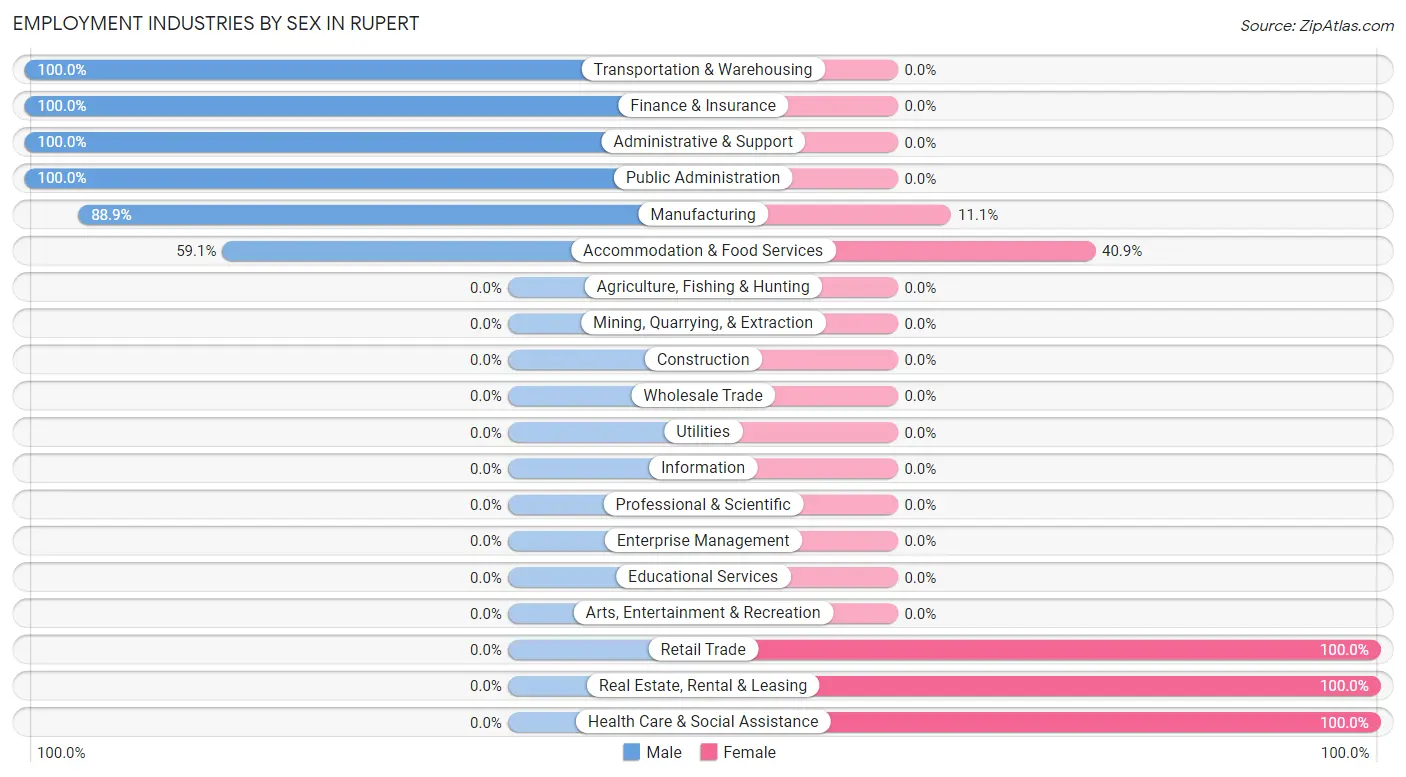
Employment Industries by Sex in Rupert
The Rupert industries that see more men than women are Transportation & Warehousing (100.0%), Finance & Insurance (100.0%), and Administrative & Support (100.0%), whereas the industries that tend to have a higher number of women are Retail Trade (100.0%), Real Estate, Rental & Leasing (100.0%), and Health Care & Social Assistance (100.0%).
| Industry | Male | Female |
| Agriculture, Fishing & Hunting | 0 (0.0%) | 0 (0.0%) |
| Mining, Quarrying, & Extraction | 0 (0.0%) | 0 (0.0%) |
| Construction | 0 (0.0%) | 0 (0.0%) |
| Manufacturing | 16 (88.9%) | 2 (11.1%) |
| Wholesale Trade | 0 (0.0%) | 0 (0.0%) |
| Retail Trade | 0 (0.0%) | 15 (100.0%) |
| Transportation & Warehousing | 7 (100.0%) | 0 (0.0%) |
| Utilities | 0 (0.0%) | 0 (0.0%) |
| Information | 0 (0.0%) | 0 (0.0%) |
| Finance & Insurance | 3 (100.0%) | 0 (0.0%) |
| Real Estate, Rental & Leasing | 0 (0.0%) | 9 (100.0%) |
| Professional & Scientific | 0 (0.0%) | 0 (0.0%) |
| Enterprise Management | 0 (0.0%) | 0 (0.0%) |
| Administrative & Support | 8 (100.0%) | 0 (0.0%) |
| Educational Services | 0 (0.0%) | 0 (0.0%) |
| Health Care & Social Assistance | 0 (0.0%) | 15 (100.0%) |
| Arts, Entertainment & Recreation | 0 (0.0%) | 0 (0.0%) |
| Accommodation & Food Services | 13 (59.1%) | 9 (40.9%) |
| Public Administration | 4 (100.0%) | 0 (0.0%) |
| Total | 51 (50.5%) | 50 (49.5%) |
Education in Rupert
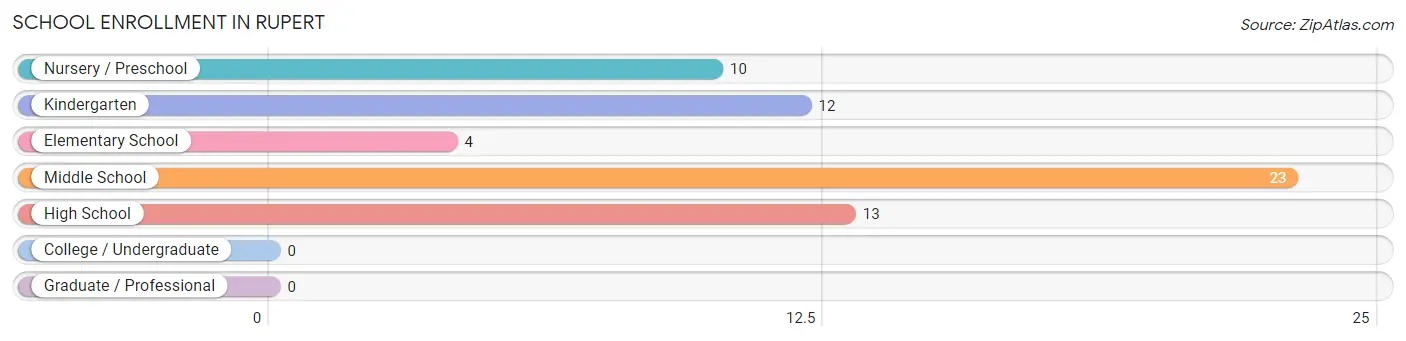
School Enrollment in Rupert
The most common levels of schooling among the 62 students in Rupert are middle school (23 | 37.1%), high school (13 | 21.0%), and kindergarten (12 | 19.4%).
| School Level | # Students | % Students |
| Nursery / Preschool | 10 | 16.1% |
| Kindergarten | 12 | 19.4% |
| Elementary School | 4 | 6.5% |
| Middle School | 23 | 37.1% |
| High School | 13 | 21.0% |
| College / Undergraduate | 0 | 0.0% |
| Graduate / Professional | 0 | 0.0% |
| Total | 62 | 100.0% |
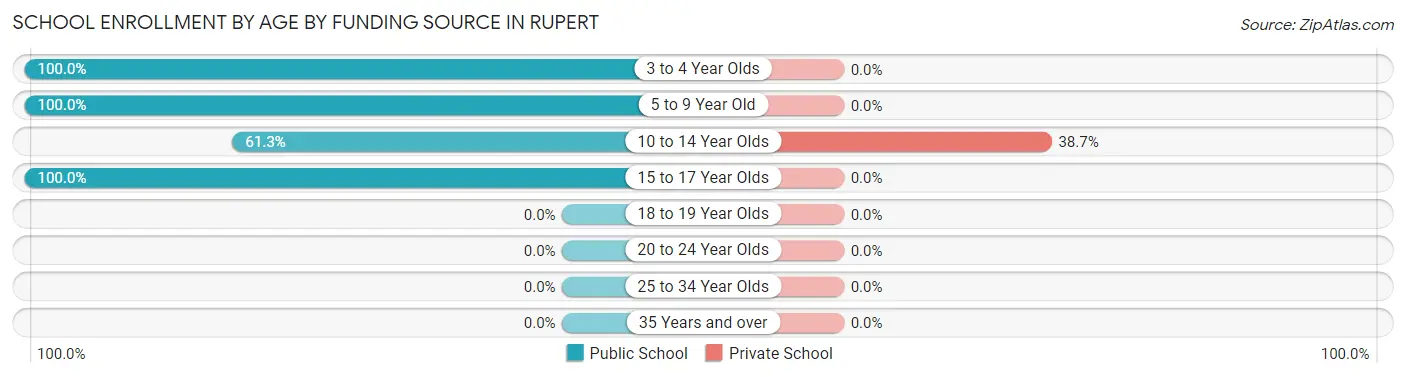
School Enrollment by Age by Funding Source in Rupert
Out of a total of 62 students who are enrolled in schools in Rupert, 12 (19.4%) attend a private institution, while the remaining 50 (80.6%) are enrolled in public schools. The age group of 10 to 14 year olds has the highest likelihood of being enrolled in private schools, with 12 (38.7% in the age bracket) enrolled. Conversely, the age group of 3 to 4 year olds has the lowest likelihood of being enrolled in a private school, with 10 (100.0% in the age bracket) attending a public institution.
| Age Bracket | Public School | Private School |
| 3 to 4 Year Olds | 10 (100.0%) | 0 (0.0%) |
| 5 to 9 Year Old | 12 (100.0%) | 0 (0.0%) |
| 10 to 14 Year Olds | 19 (61.3%) | 12 (38.7%) |
| 15 to 17 Year Olds | 9 (100.0%) | 0 (0.0%) |
| 18 to 19 Year Olds | 0 (0.0%) | 0 (0.0%) |
| 20 to 24 Year Olds | 0 (0.0%) | 0 (0.0%) |
| 25 to 34 Year Olds | 0 (0.0%) | 0 (0.0%) |
| 35 Years and over | 0 (0.0%) | 0 (0.0%) |
| Total | 50 (80.6%) | 12 (19.4%) |
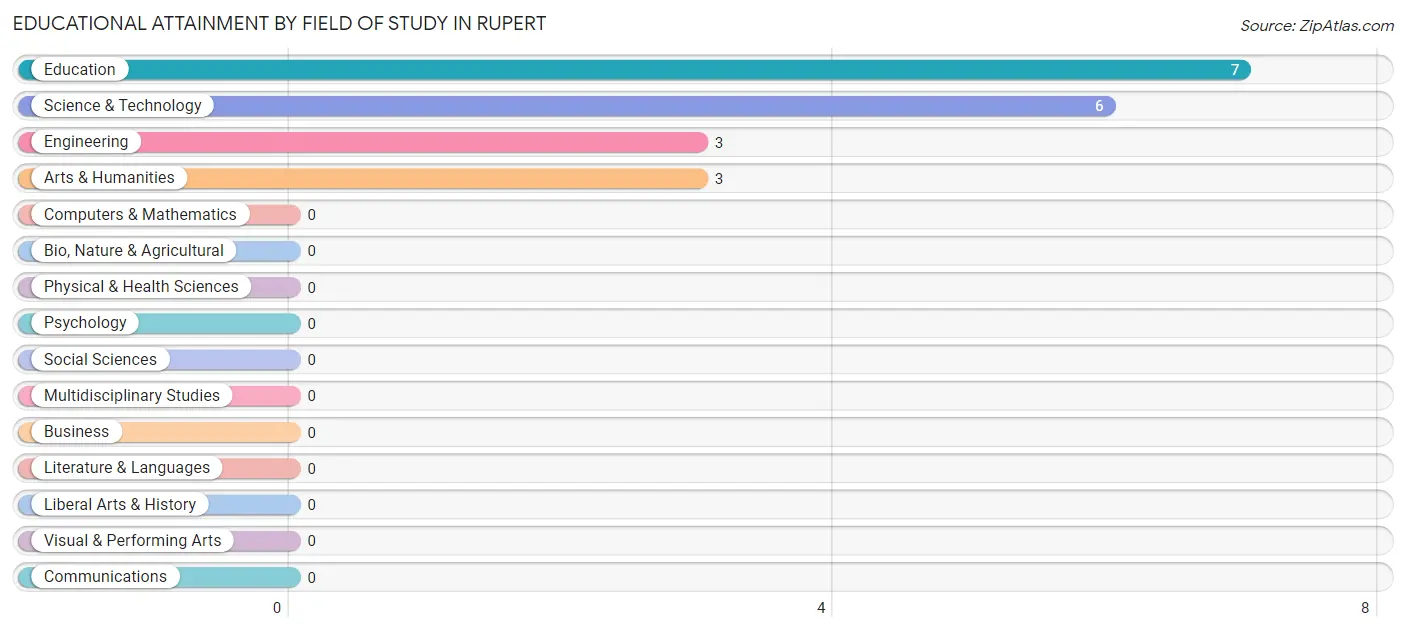
Educational Attainment by Field of Study in Rupert
Education (7 | 36.8%), science & technology (6 | 31.6%), engineering (3 | 15.8%), and arts & humanities (3 | 15.8%) are the most common fields of study among 19 individuals in Rupert who have obtained a bachelor's degree or higher.
| Field of Study | # Graduates | % Graduates |
| Computers & Mathematics | 0 | 0.0% |
| Bio, Nature & Agricultural | 0 | 0.0% |
| Physical & Health Sciences | 0 | 0.0% |
| Psychology | 0 | 0.0% |
| Social Sciences | 0 | 0.0% |
| Engineering | 3 | 15.8% |
| Multidisciplinary Studies | 0 | 0.0% |
| Science & Technology | 6 | 31.6% |
| Business | 0 | 0.0% |
| Education | 7 | 36.8% |
| Literature & Languages | 0 | 0.0% |
| Liberal Arts & History | 0 | 0.0% |
| Visual & Performing Arts | 0 | 0.0% |
| Communications | 0 | 0.0% |
| Arts & Humanities | 3 | 15.8% |
| Total | 19 | 100.0% |
Transportation & Commute in Rupert
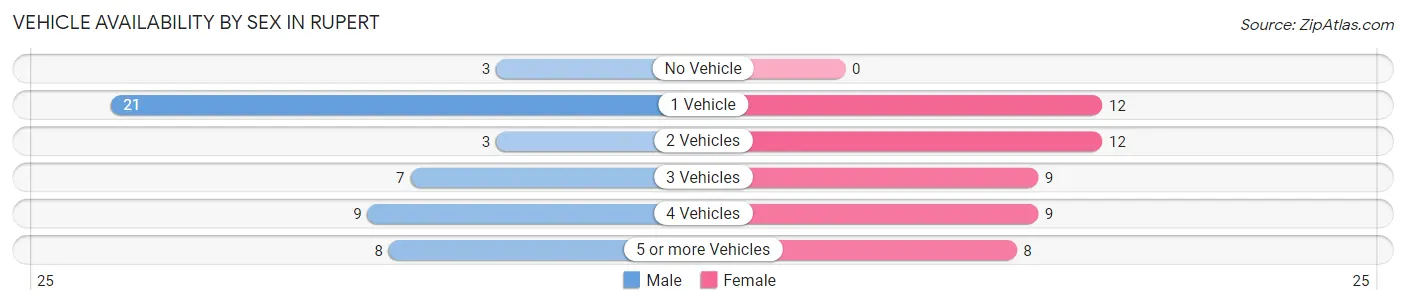
Vehicle Availability by Sex in Rupert
The most prevalent vehicle ownership categories in Rupert are males with 1 vehicle (21, accounting for 41.2%) and females with 1 vehicle (12, making up 42.0%).
| Vehicles Available | Male | Female |
| No Vehicle | 3 (5.9%) | 0 (0.0%) |
| 1 Vehicle | 21 (41.2%) | 12 (24.0%) |
| 2 Vehicles | 3 (5.9%) | 12 (24.0%) |
| 3 Vehicles | 7 (13.7%) | 9 (18.0%) |
| 4 Vehicles | 9 (17.6%) | 9 (18.0%) |
| 5 or more Vehicles | 8 (15.7%) | 8 (16.0%) |
| Total | 51 (100.0%) | 50 (100.0%) |
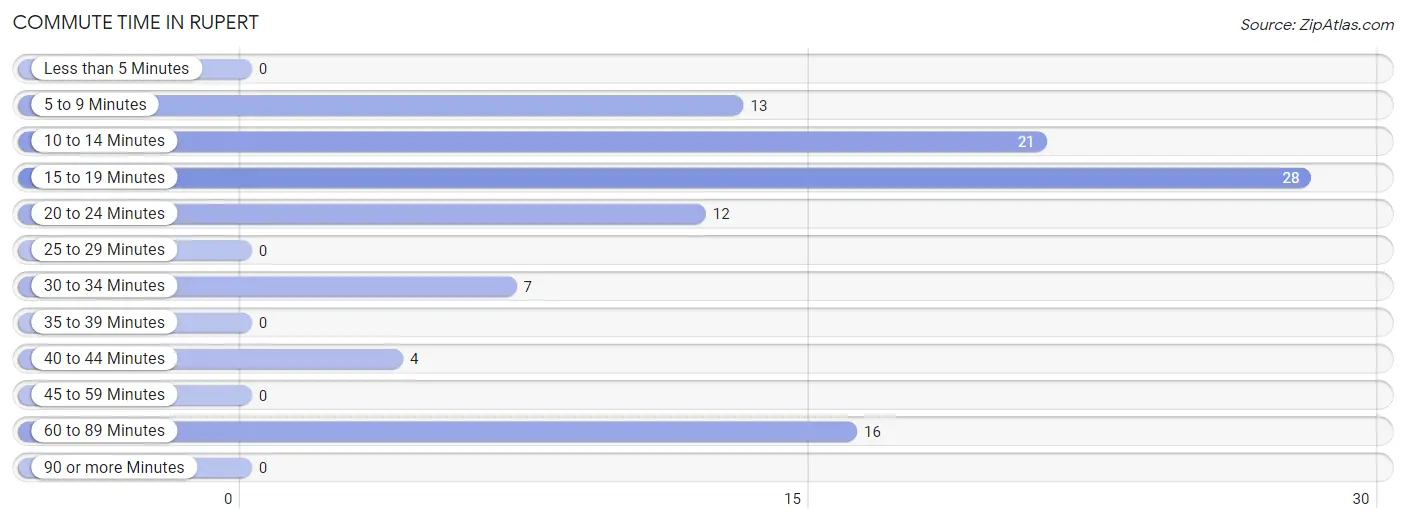
Commute Time in Rupert
The most frequently occuring commute durations in Rupert are 15 to 19 minutes (28 commuters, 27.7%), 10 to 14 minutes (21 commuters, 20.8%), and 60 to 89 minutes (16 commuters, 15.8%).
| Commute Time | # Commuters | % Commuters |
| Less than 5 Minutes | 0 | 0.0% |
| 5 to 9 Minutes | 13 | 12.9% |
| 10 to 14 Minutes | 21 | 20.8% |
| 15 to 19 Minutes | 28 | 27.7% |
| 20 to 24 Minutes | 12 | 11.9% |
| 25 to 29 Minutes | 0 | 0.0% |
| 30 to 34 Minutes | 7 | 6.9% |
| 35 to 39 Minutes | 0 | 0.0% |
| 40 to 44 Minutes | 4 | 4.0% |
| 45 to 59 Minutes | 0 | 0.0% |
| 60 to 89 Minutes | 16 | 15.8% |
| 90 or more Minutes | 0 | 0.0% |
Commute Time by Sex in Rupert
The most common commute times in Rupert are 15 to 19 minutes (25 commuters, 49.0%) for males and 10 to 14 minutes (15 commuters, 30.0%) for females.
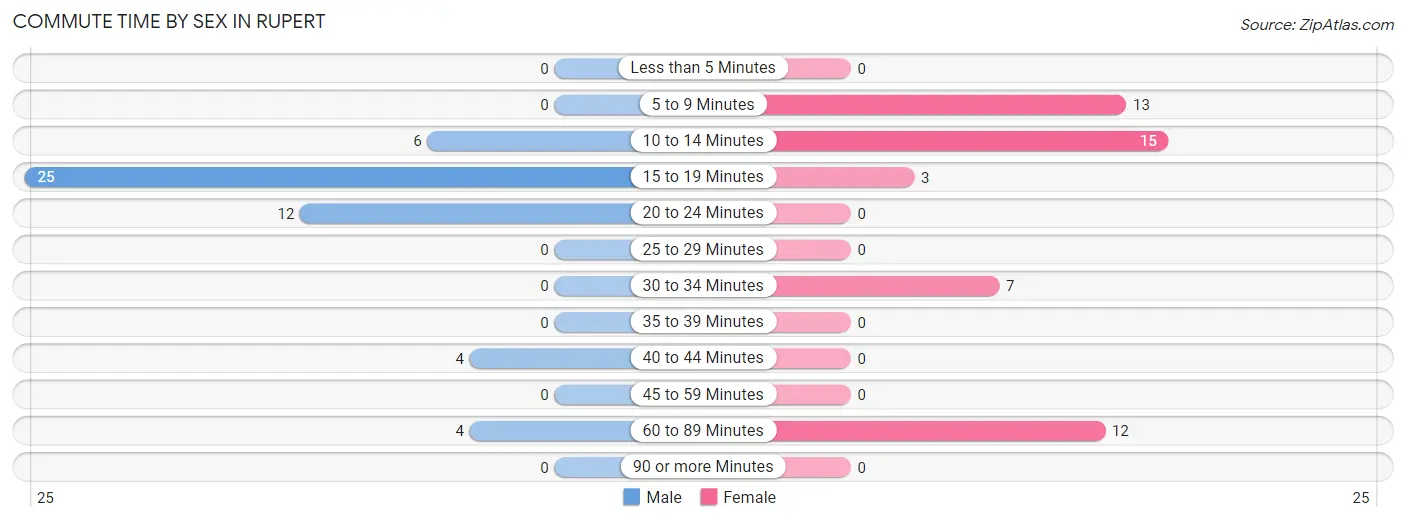
| Commute Time | Male | Female |
| Less than 5 Minutes | 0 (0.0%) | 0 (0.0%) |
| 5 to 9 Minutes | 0 (0.0%) | 13 (26.0%) |
| 10 to 14 Minutes | 6 (11.8%) | 15 (30.0%) |
| 15 to 19 Minutes | 25 (49.0%) | 3 (6.0%) |
| 20 to 24 Minutes | 12 (23.5%) | 0 (0.0%) |
| 25 to 29 Minutes | 0 (0.0%) | 0 (0.0%) |
| 30 to 34 Minutes | 0 (0.0%) | 7 (14.0%) |
| 35 to 39 Minutes | 0 (0.0%) | 0 (0.0%) |
| 40 to 44 Minutes | 4 (7.8%) | 0 (0.0%) |
| 45 to 59 Minutes | 0 (0.0%) | 0 (0.0%) |
| 60 to 89 Minutes | 4 (7.8%) | 12 (24.0%) |
| 90 or more Minutes | 0 (0.0%) | 0 (0.0%) |
Time of Departure to Work by Sex in Rupert
The most frequent times of departure to work in Rupert are 6:30 AM to 6:59 AM (21, 41.2%) for males and 8:00 AM to 8:29 AM (13, 26.0%) for females.
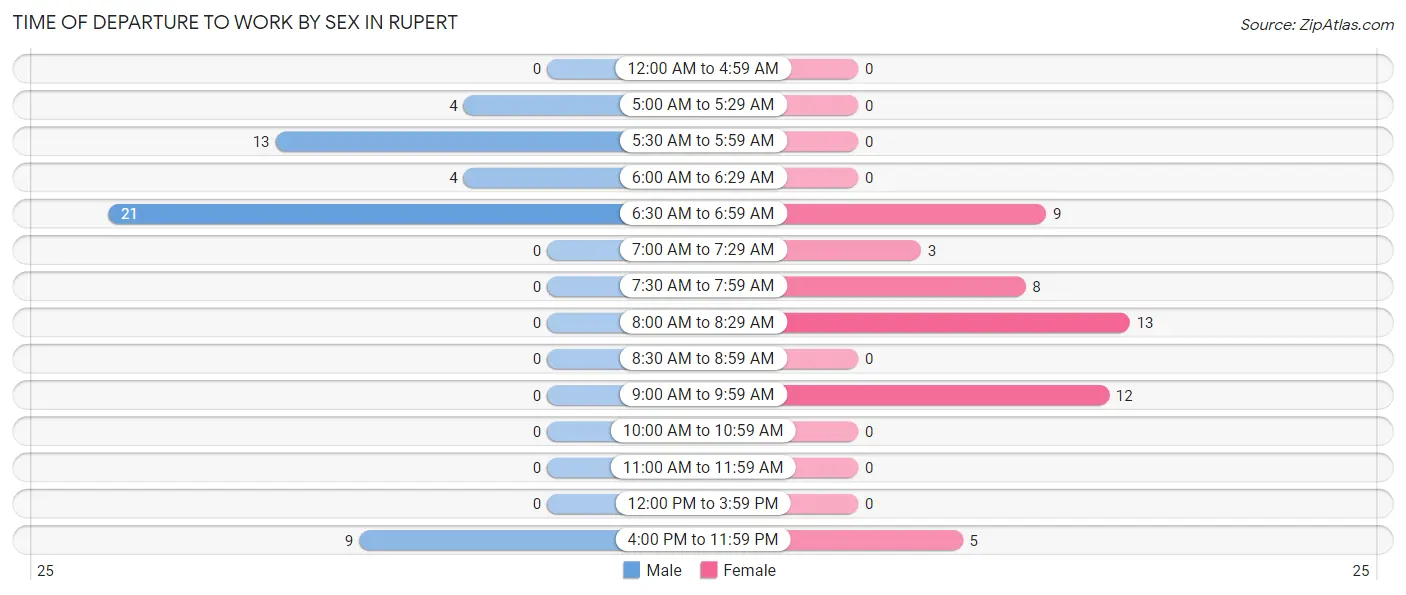
| Time of Departure | Male | Female |
| 12:00 AM to 4:59 AM | 0 (0.0%) | 0 (0.0%) |
| 5:00 AM to 5:29 AM | 4 (7.8%) | 0 (0.0%) |
| 5:30 AM to 5:59 AM | 13 (25.5%) | 0 (0.0%) |
| 6:00 AM to 6:29 AM | 4 (7.8%) | 0 (0.0%) |
| 6:30 AM to 6:59 AM | 21 (41.2%) | 9 (18.0%) |
| 7:00 AM to 7:29 AM | 0 (0.0%) | 3 (6.0%) |
| 7:30 AM to 7:59 AM | 0 (0.0%) | 8 (16.0%) |
| 8:00 AM to 8:29 AM | 0 (0.0%) | 13 (26.0%) |
| 8:30 AM to 8:59 AM | 0 (0.0%) | 0 (0.0%) |
| 9:00 AM to 9:59 AM | 0 (0.0%) | 12 (24.0%) |
| 10:00 AM to 10:59 AM | 0 (0.0%) | 0 (0.0%) |
| 11:00 AM to 11:59 AM | 0 (0.0%) | 0 (0.0%) |
| 12:00 PM to 3:59 PM | 0 (0.0%) | 0 (0.0%) |
| 4:00 PM to 11:59 PM | 9 (17.6%) | 5 (10.0%) |
| Total | 51 (100.0%) | 50 (100.0%) |
Housing Occupancy in Rupert
Occupancy by Ownership in Rupert
Of the total 65 dwellings in Rupert, owner-occupied units account for 57 (87.7%), while renter-occupied units make up 8 (12.3%).
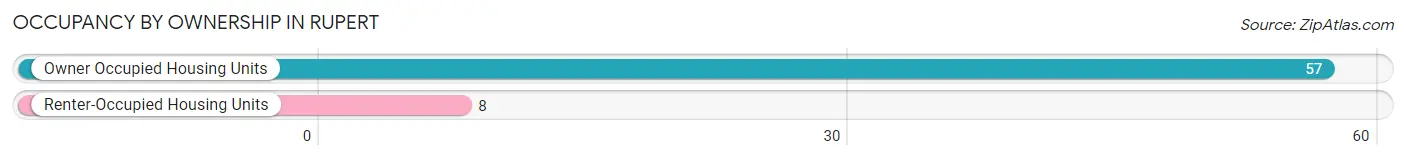
| Occupancy | # Housing Units | % Housing Units |
| Owner Occupied Housing Units | 57 | 87.7% |
| Renter-Occupied Housing Units | 8 | 12.3% |
| Total Occupied Housing Units | 65 | 100.0% |
Occupancy by Household Size in Rupert
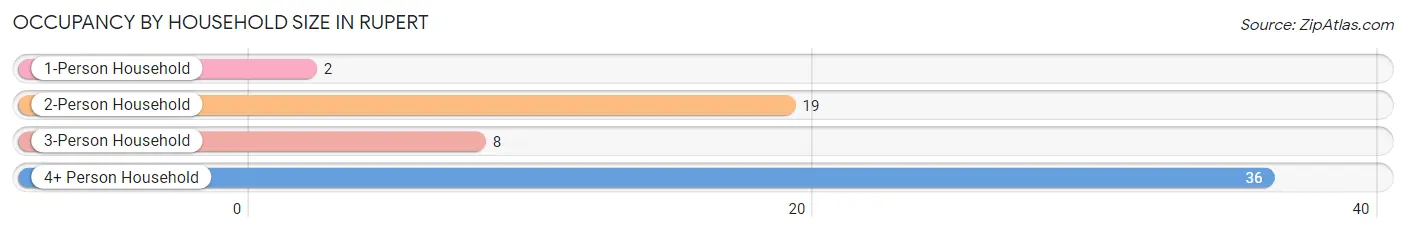
| Household Size | # Housing Units | % Housing Units |
| 1-Person Household | 2 | 3.1% |
| 2-Person Household | 19 | 29.2% |
| 3-Person Household | 8 | 12.3% |
| 4+ Person Household | 36 | 55.4% |
| Total Housing Units | 65 | 100.0% |
Occupancy by Ownership by Household Size in Rupert
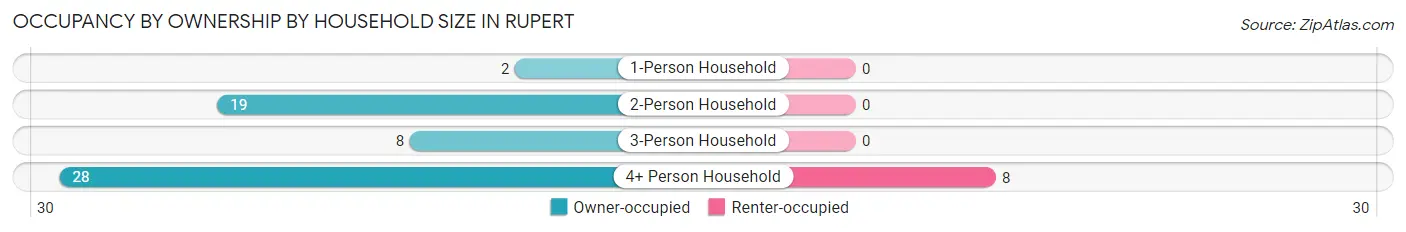
| Household Size | Owner-occupied | Renter-occupied |
| 1-Person Household | 2 (100.0%) | 0 (0.0%) |
| 2-Person Household | 19 (100.0%) | 0 (0.0%) |
| 3-Person Household | 8 (100.0%) | 0 (0.0%) |
| 4+ Person Household | 28 (77.8%) | 8 (22.2%) |
| Total Housing Units | 57 (87.7%) | 8 (12.3%) |
Occupancy by Educational Attainment in Rupert
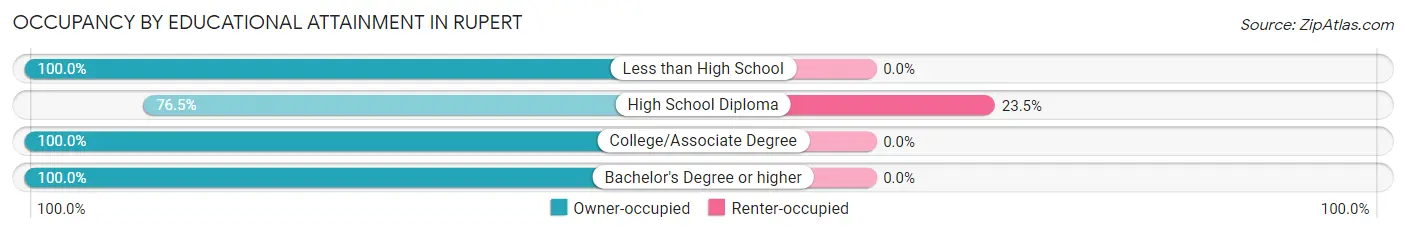
| Household Size | Owner-occupied | Renter-occupied |
| Less than High School | 6 (100.0%) | 0 (0.0%) |
| High School Diploma | 26 (76.5%) | 8 (23.5%) |
| College/Associate Degree | 17 (100.0%) | 0 (0.0%) |
| Bachelor's Degree or higher | 8 (100.0%) | 0 (0.0%) |
Occupancy by Age of Householder in Rupert
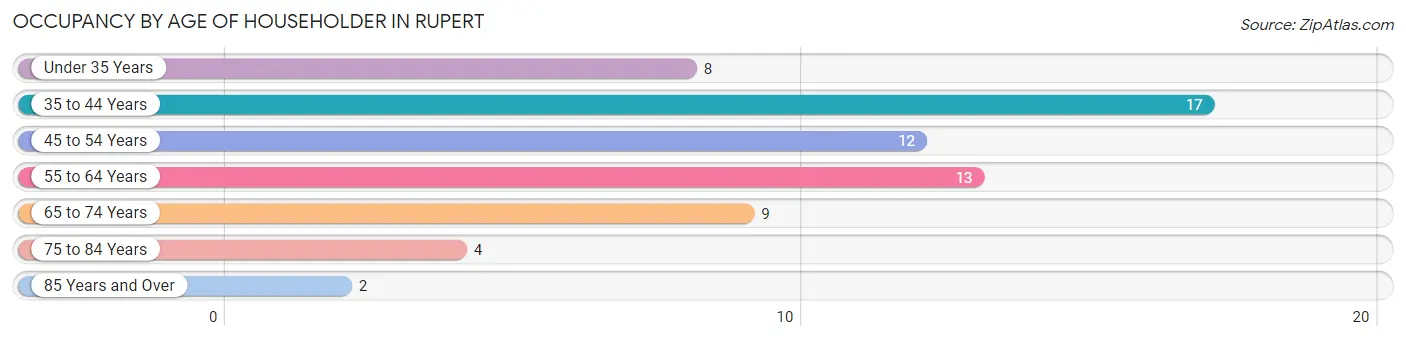
| Age Bracket | # Households | % Households |
| Under 35 Years | 8 | 12.3% |
| 35 to 44 Years | 17 | 26.2% |
| 45 to 54 Years | 12 | 18.5% |
| 55 to 64 Years | 13 | 20.0% |
| 65 to 74 Years | 9 | 13.9% |
| 75 to 84 Years | 4 | 6.1% |
| 85 Years and Over | 2 | 3.1% |
| Total | 65 | 100.0% |
Housing Finances in Rupert
Median Income by Occupancy in Rupert
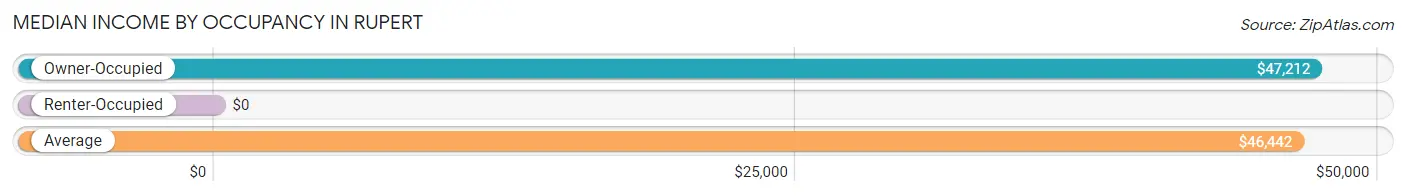
| Occupancy Type | # Households | Median Income |
| Owner-Occupied | 57 (87.7%) | $47,212 |
| Renter-Occupied | 8 (12.3%) | $0 |
| Average | 65 (100.0%) | $46,442 |
Occupancy by Householder Income Bracket in Rupert
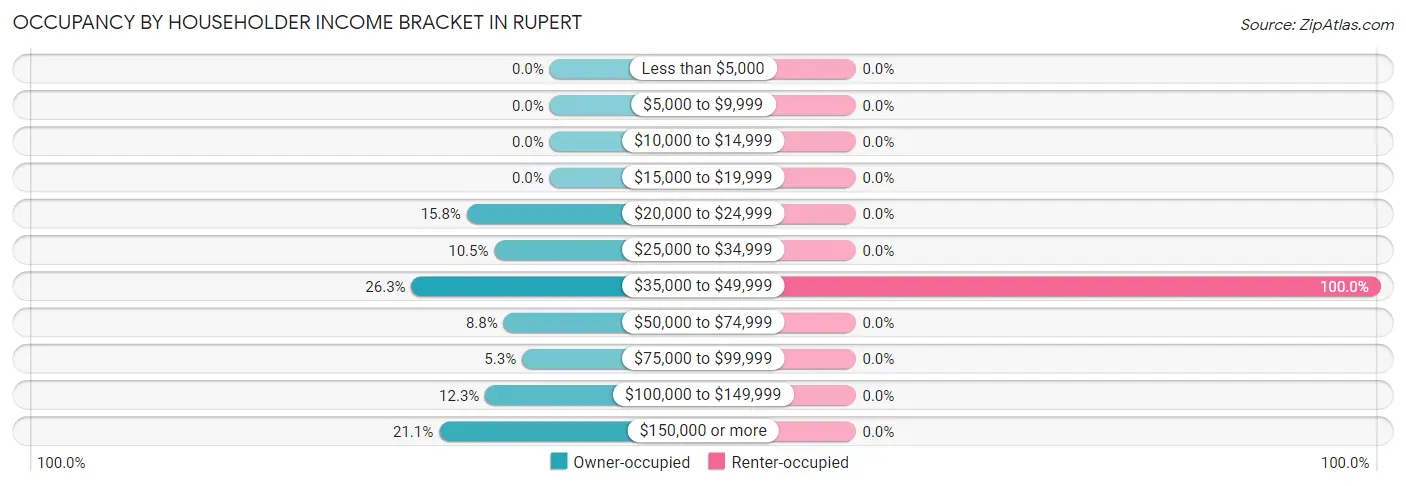
| Income Bracket | Owner-occupied | Renter-occupied |
| Less than $5,000 | 0 (0.0%) | 0 (0.0%) |
| $5,000 to $9,999 | 0 (0.0%) | 0 (0.0%) |
| $10,000 to $14,999 | 0 (0.0%) | 0 (0.0%) |
| $15,000 to $19,999 | 0 (0.0%) | 0 (0.0%) |
| $20,000 to $24,999 | 9 (15.8%) | 0 (0.0%) |
| $25,000 to $34,999 | 6 (10.5%) | 0 (0.0%) |
| $35,000 to $49,999 | 15 (26.3%) | 8 (100.0%) |
| $50,000 to $74,999 | 5 (8.8%) | 0 (0.0%) |
| $75,000 to $99,999 | 3 (5.3%) | 0 (0.0%) |
| $100,000 to $149,999 | 7 (12.3%) | 0 (0.0%) |
| $150,000 or more | 12 (21.0%) | 0 (0.0%) |
| Total | 57 (100.0%) | 8 (100.0%) |
Monthly Housing Cost Tiers in Rupert
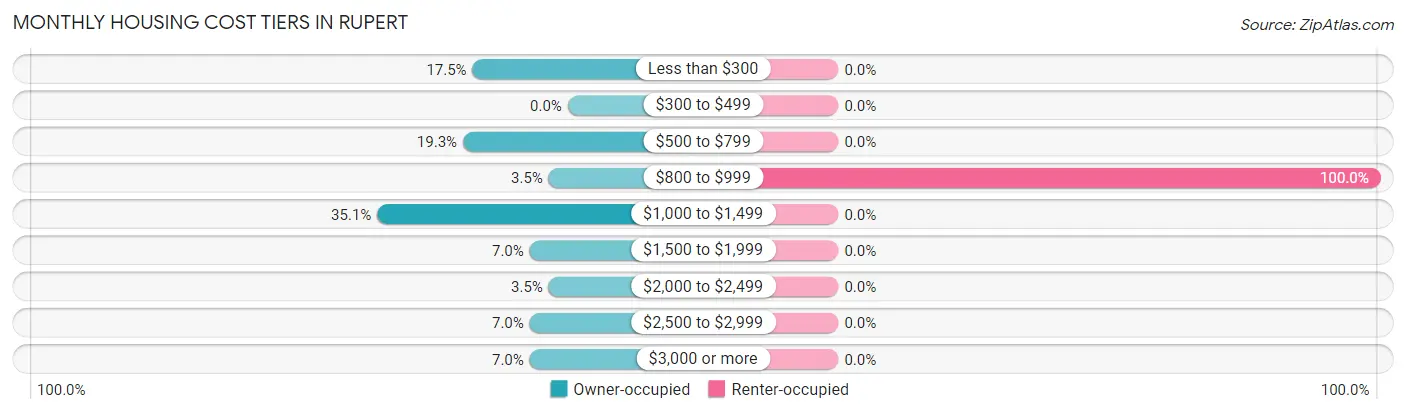
| Monthly Cost | Owner-occupied | Renter-occupied |
| Less than $300 | 10 (17.5%) | 0 (0.0%) |
| $300 to $499 | 0 (0.0%) | 0 (0.0%) |
| $500 to $799 | 11 (19.3%) | 0 (0.0%) |
| $800 to $999 | 2 (3.5%) | 8 (100.0%) |
| $1,000 to $1,499 | 20 (35.1%) | 0 (0.0%) |
| $1,500 to $1,999 | 4 (7.0%) | 0 (0.0%) |
| $2,000 to $2,499 | 2 (3.5%) | 0 (0.0%) |
| $2,500 to $2,999 | 4 (7.0%) | 0 (0.0%) |
| $3,000 or more | 4 (7.0%) | 0 (0.0%) |
| Total | 57 (100.0%) | 8 (100.0%) |
Physical Housing Characteristics in Rupert
Housing Structures in Rupert
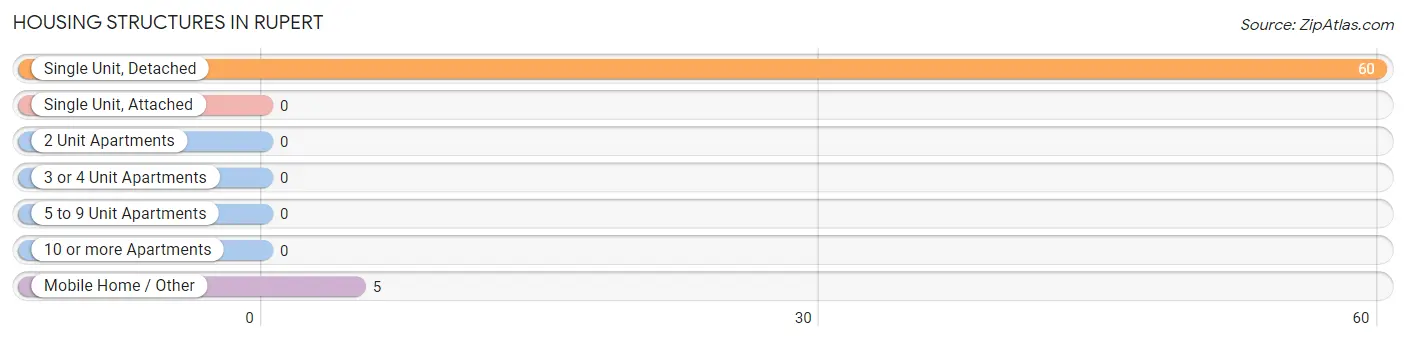
| Structure Type | # Housing Units | % Housing Units |
| Single Unit, Detached | 60 | 92.3% |
| Single Unit, Attached | 0 | 0.0% |
| 2 Unit Apartments | 0 | 0.0% |
| 3 or 4 Unit Apartments | 0 | 0.0% |
| 5 to 9 Unit Apartments | 0 | 0.0% |
| 10 or more Apartments | 0 | 0.0% |
| Mobile Home / Other | 5 | 7.7% |
| Total | 65 | 100.0% |
Housing Structures by Occupancy in Rupert
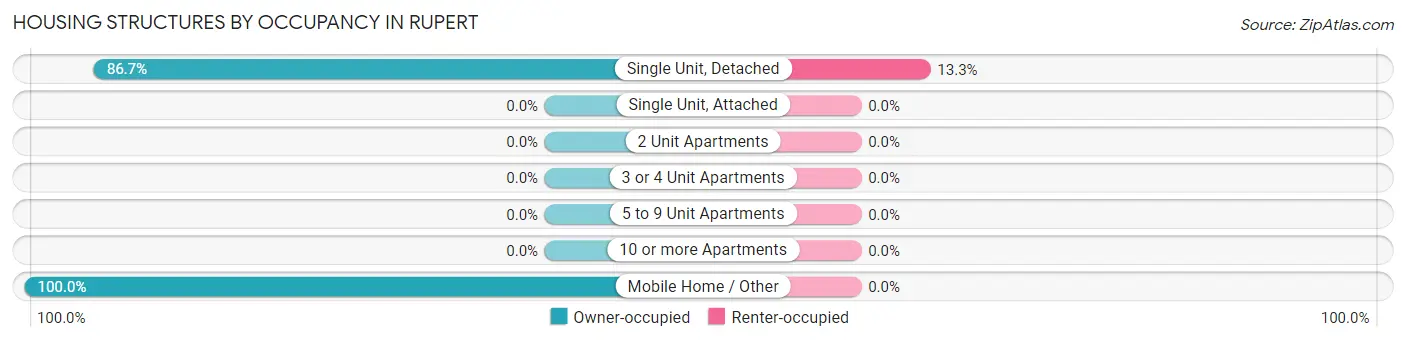
| Structure Type | Owner-occupied | Renter-occupied |
| Single Unit, Detached | 52 (86.7%) | 8 (13.3%) |
| Single Unit, Attached | 0 (0.0%) | 0 (0.0%) |
| 2 Unit Apartments | 0 (0.0%) | 0 (0.0%) |
| 3 or 4 Unit Apartments | 0 (0.0%) | 0 (0.0%) |
| 5 to 9 Unit Apartments | 0 (0.0%) | 0 (0.0%) |
| 10 or more Apartments | 0 (0.0%) | 0 (0.0%) |
| Mobile Home / Other | 5 (100.0%) | 0 (0.0%) |
| Total | 57 (87.7%) | 8 (12.3%) |
Housing Structures by Number of Rooms in Rupert
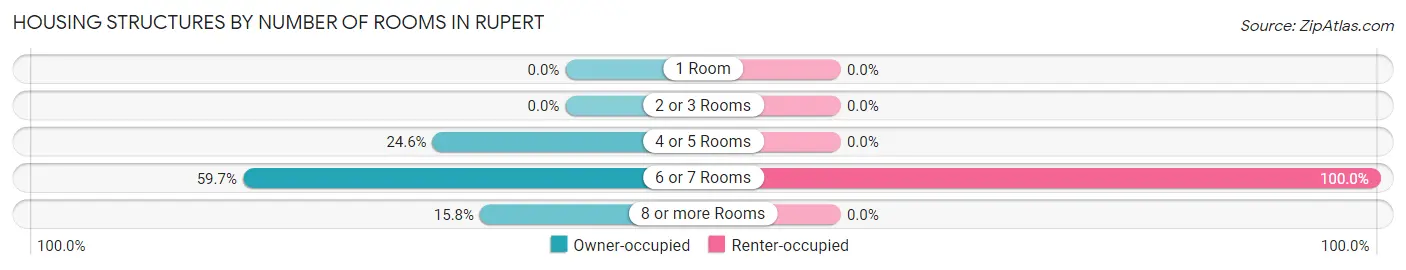
| Number of Rooms | Owner-occupied | Renter-occupied |
| 1 Room | 0 (0.0%) | 0 (0.0%) |
| 2 or 3 Rooms | 0 (0.0%) | 0 (0.0%) |
| 4 or 5 Rooms | 14 (24.6%) | 0 (0.0%) |
| 6 or 7 Rooms | 34 (59.7%) | 8 (100.0%) |
| 8 or more Rooms | 9 (15.8%) | 0 (0.0%) |
| Total | 57 (100.0%) | 8 (100.0%) |
Housing Structure by Heating Type in Rupert
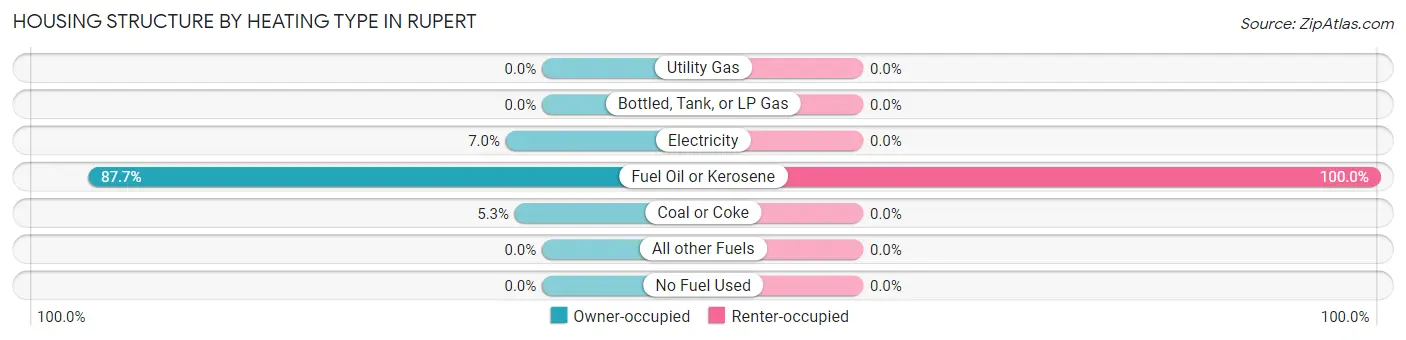
| Heating Type | Owner-occupied | Renter-occupied |
| Utility Gas | 0 (0.0%) | 0 (0.0%) |
| Bottled, Tank, or LP Gas | 0 (0.0%) | 0 (0.0%) |
| Electricity | 4 (7.0%) | 0 (0.0%) |
| Fuel Oil or Kerosene | 50 (87.7%) | 8 (100.0%) |
| Coal or Coke | 3 (5.3%) | 0 (0.0%) |
| All other Fuels | 0 (0.0%) | 0 (0.0%) |
| No Fuel Used | 0 (0.0%) | 0 (0.0%) |
| Total | 57 (100.0%) | 8 (100.0%) |
Household Vehicle Usage in Rupert
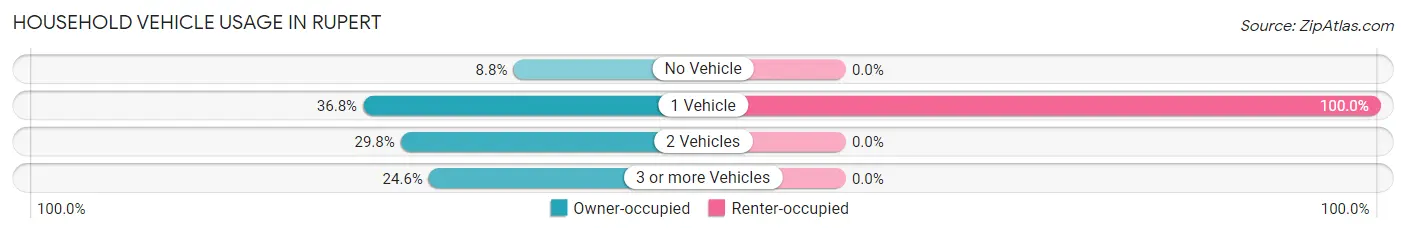
| Vehicles per Household | Owner-occupied | Renter-occupied |
| No Vehicle | 5 (8.8%) | 0 (0.0%) |
| 1 Vehicle | 21 (36.8%) | 8 (100.0%) |
| 2 Vehicles | 17 (29.8%) | 0 (0.0%) |
| 3 or more Vehicles | 14 (24.6%) | 0 (0.0%) |
| Total | 57 (100.0%) | 8 (100.0%) |
Real Estate & Mortgages in Rupert
Real Estate and Mortgage Overview in Rupert
| Characteristic | Without Mortgage | With Mortgage |
| Housing Units | 23 | 34 |
| Median Property Value | $183,900 | $165,400 |
| Median Household Income | $30,625 | $12 |
| Monthly Housing Costs | $514 | $4 |
| Real Estate Taxes | $2,500 | $13 |
Property Value by Mortgage Status in Rupert
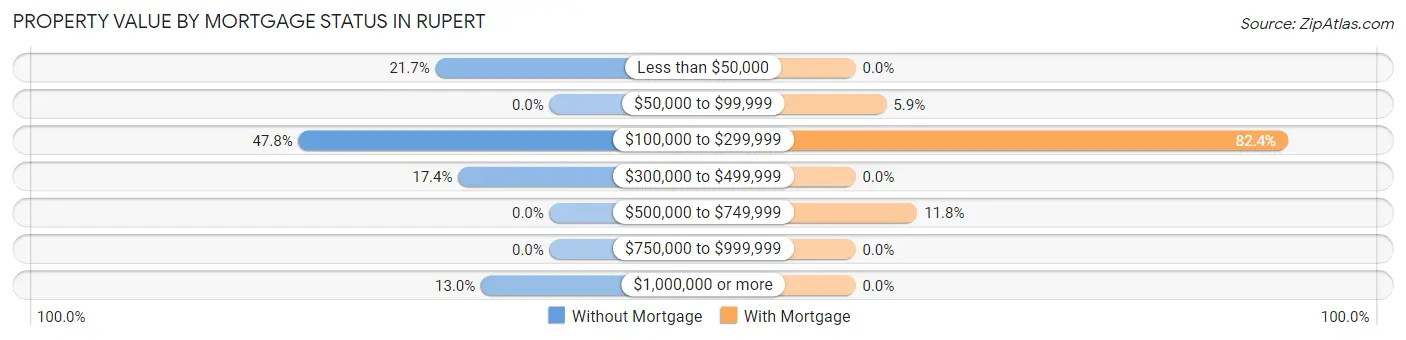
| Property Value | Without Mortgage | With Mortgage |
| Less than $50,000 | 5 (21.7%) | 0 (0.0%) |
| $50,000 to $99,999 | 0 (0.0%) | 2 (5.9%) |
| $100,000 to $299,999 | 11 (47.8%) | 28 (82.4%) |
| $300,000 to $499,999 | 4 (17.4%) | 0 (0.0%) |
| $500,000 to $749,999 | 0 (0.0%) | 4 (11.8%) |
| $750,000 to $999,999 | 0 (0.0%) | 0 (0.0%) |
| $1,000,000 or more | 3 (13.0%) | 0 (0.0%) |
| Total | 23 (100.0%) | 34 (100.0%) |
Household Income by Mortgage Status in Rupert
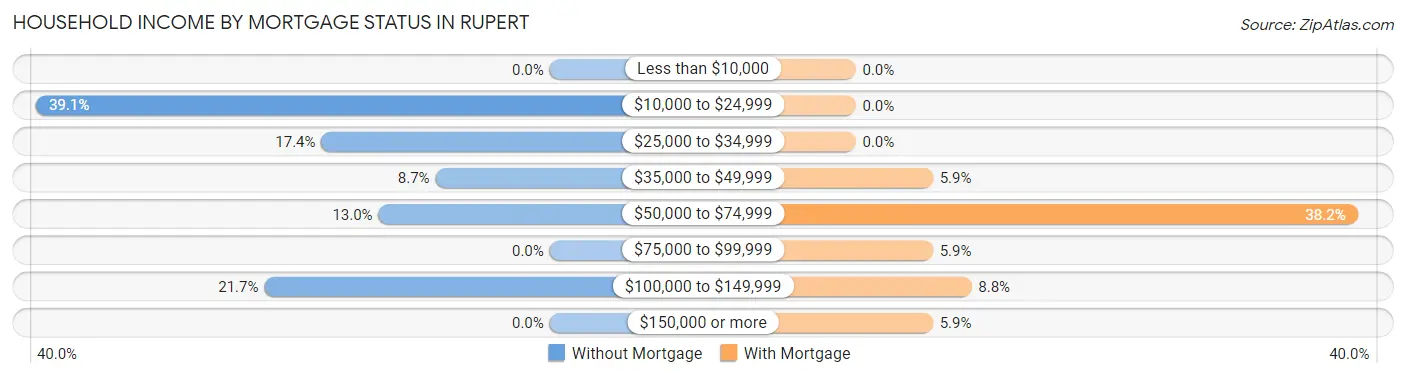
| Household Income | Without Mortgage | With Mortgage |
| Less than $10,000 | 0 (0.0%) | 0 (0.0%) |
| $10,000 to $24,999 | 9 (39.1%) | 0 (0.0%) |
| $25,000 to $34,999 | 4 (17.4%) | 0 (0.0%) |
| $35,000 to $49,999 | 2 (8.7%) | 2 (5.9%) |
| $50,000 to $74,999 | 3 (13.0%) | 13 (38.2%) |
| $75,000 to $99,999 | 0 (0.0%) | 2 (5.9%) |
| $100,000 to $149,999 | 5 (21.7%) | 3 (8.8%) |
| $150,000 or more | 0 (0.0%) | 2 (5.9%) |
| Total | 23 (100.0%) | 34 (100.0%) |
Property Value to Household Income Ratio in Rupert
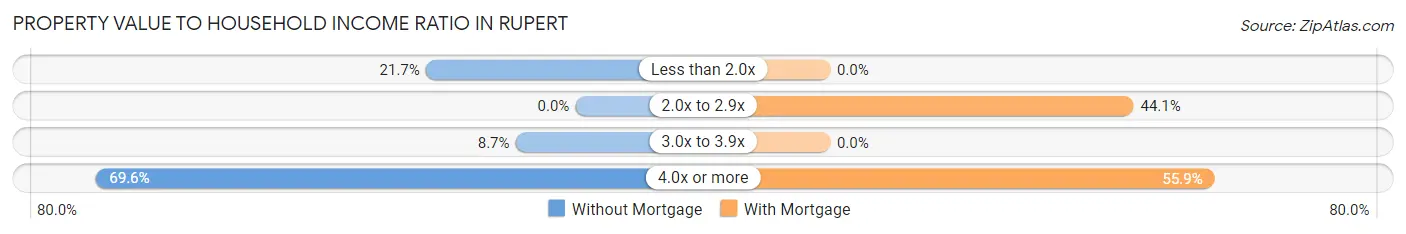
| Value-to-Income Ratio | Without Mortgage | With Mortgage |
| Less than 2.0x | 5 (21.7%) | 0 (0.0%) |
| 2.0x to 2.9x | 0 (0.0%) | 15 (44.1%) |
| 3.0x to 3.9x | 2 (8.7%) | 0 (0.0%) |
| 4.0x or more | 16 (69.6%) | 19 (55.9%) |
| Total | 23 (100.0%) | 34 (100.0%) |
Real Estate Taxes by Mortgage Status in Rupert
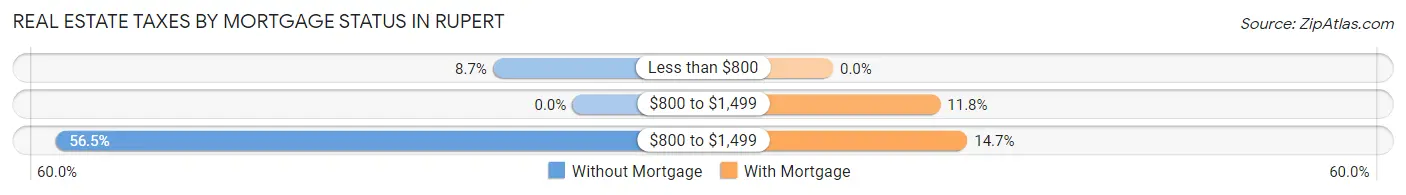
| Property Taxes | Without Mortgage | With Mortgage |
| Less than $800 | 2 (8.7%) | 0 (0.0%) |
| $800 to $1,499 | 0 (0.0%) | 4 (11.8%) |
| $800 to $1,499 | 13 (56.5%) | 5 (14.7%) |
| Total | 23 (100.0%) | 34 (100.0%) |
Health & Disability in Rupert
Health Insurance Coverage by Age in Rupert
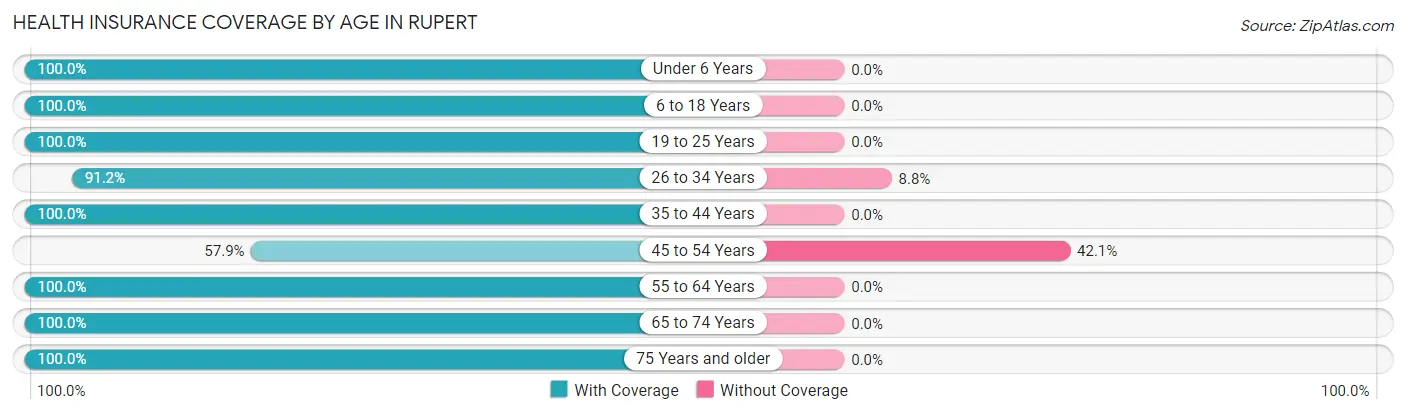
| Age Bracket | With Coverage | Without Coverage |
| Under 6 Years | 31 (100.0%) | 0 (0.0%) |
| 6 to 18 Years | 40 (100.0%) | 0 (0.0%) |
| 19 to 25 Years | 10 (100.0%) | 0 (0.0%) |
| 26 to 34 Years | 31 (91.2%) | 3 (8.8%) |
| 35 to 44 Years | 37 (100.0%) | 0 (0.0%) |
| 45 to 54 Years | 11 (57.9%) | 8 (42.1%) |
| 55 to 64 Years | 20 (100.0%) | 0 (0.0%) |
| 65 to 74 Years | 18 (100.0%) | 0 (0.0%) |
| 75 Years and older | 11 (100.0%) | 0 (0.0%) |
| Total | 209 (95.0%) | 11 (5.0%) |
Health Insurance Coverage by Citizenship Status in Rupert
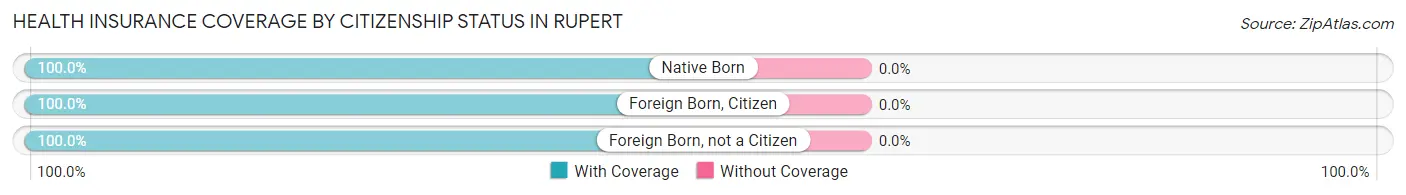
| Citizenship Status | With Coverage | Without Coverage |
| Native Born | 31 (100.0%) | 0 (0.0%) |
| Foreign Born, Citizen | 40 (100.0%) | 0 (0.0%) |
| Foreign Born, not a Citizen | 10 (100.0%) | 0 (0.0%) |
Health Insurance Coverage by Household Income in Rupert
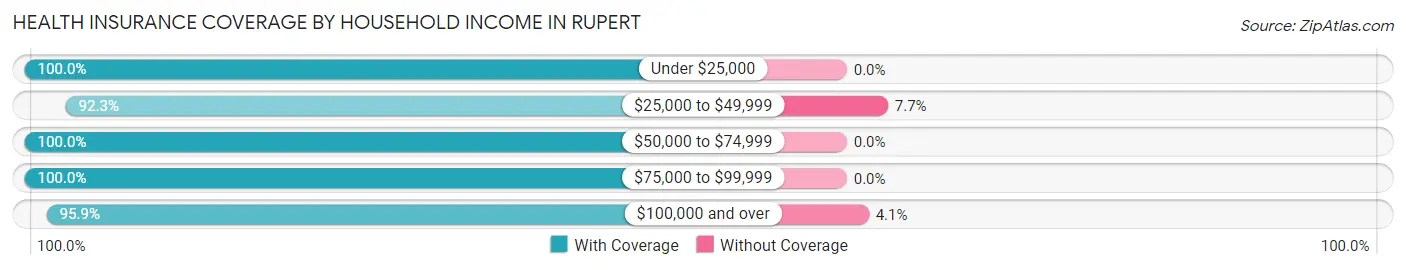
| Household Income | With Coverage | Without Coverage |
| Under $25,000 | 18 (100.0%) | 0 (0.0%) |
| $25,000 to $49,999 | 96 (92.3%) | 8 (7.7%) |
| $50,000 to $74,999 | 16 (100.0%) | 0 (0.0%) |
| $75,000 to $99,999 | 9 (100.0%) | 0 (0.0%) |
| $100,000 and over | 70 (95.9%) | 3 (4.1%) |
Public vs Private Health Insurance Coverage by Age in Rupert
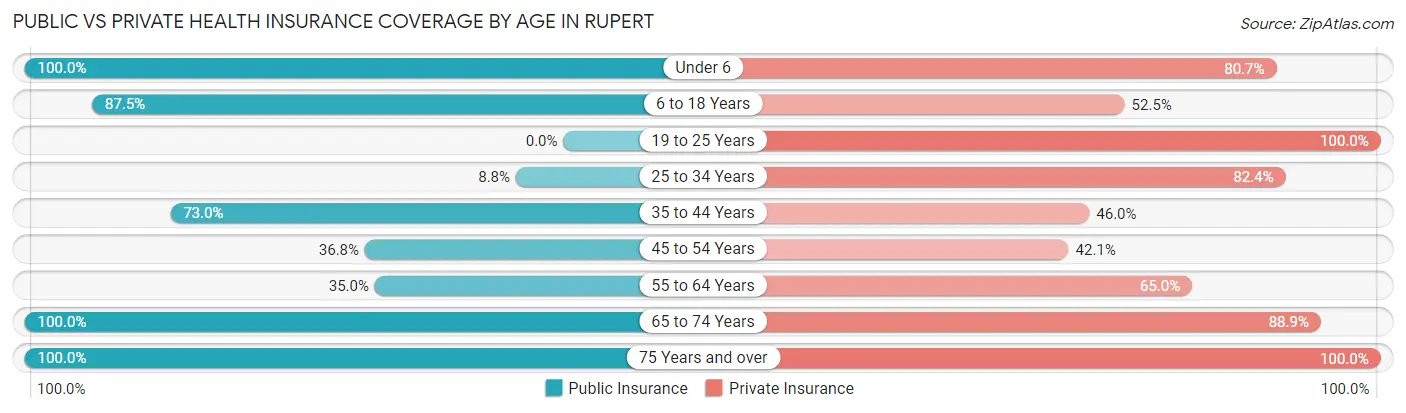
| Age Bracket | Public Insurance | Private Insurance |
| Under 6 | 31 (100.0%) | 25 (80.6%) |
| 6 to 18 Years | 35 (87.5%) | 21 (52.5%) |
| 19 to 25 Years | 0 (0.0%) | 10 (100.0%) |
| 25 to 34 Years | 3 (8.8%) | 28 (82.4%) |
| 35 to 44 Years | 27 (73.0%) | 17 (46.0%) |
| 45 to 54 Years | 7 (36.8%) | 8 (42.1%) |
| 55 to 64 Years | 7 (35.0%) | 13 (65.0%) |
| 65 to 74 Years | 18 (100.0%) | 16 (88.9%) |
| 75 Years and over | 11 (100.0%) | 11 (100.0%) |
| Total | 139 (63.2%) | 149 (67.7%) |
Disability Status by Sex by Age in Rupert
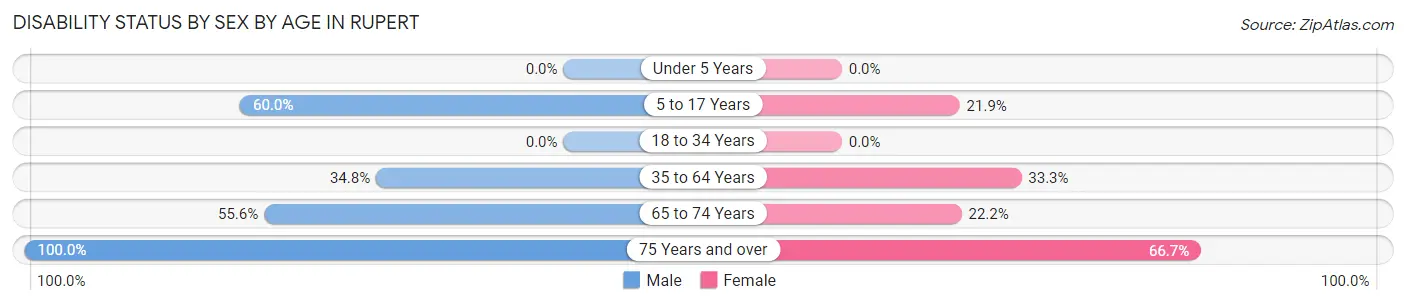
| Age Bracket | Male | Female |
| Under 5 Years | 0 (0.0%) | 0 (0.0%) |
| 5 to 17 Years | 12 (60.0%) | 7 (21.9%) |
| 18 to 34 Years | 0 (0.0%) | 0 (0.0%) |
| 35 to 64 Years | 16 (34.8%) | 10 (33.3%) |
| 65 to 74 Years | 5 (55.6%) | 2 (22.2%) |
| 75 Years and over | 5 (100.0%) | 4 (66.7%) |
Disability Class by Sex by Age in Rupert
Disability Class: Hearing Difficulty
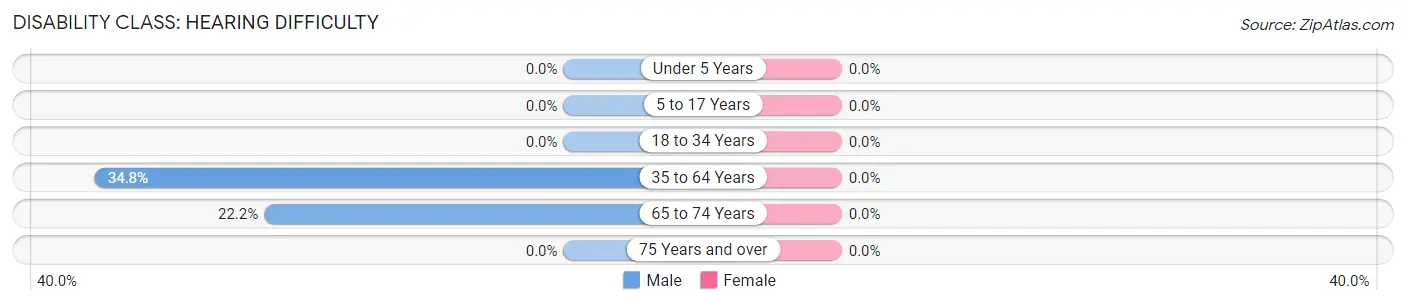
| Age Bracket | Male | Female |
| Under 5 Years | 0 (0.0%) | 0 (0.0%) |
| 5 to 17 Years | 0 (0.0%) | 0 (0.0%) |
| 18 to 34 Years | 0 (0.0%) | 0 (0.0%) |
| 35 to 64 Years | 16 (34.8%) | 0 (0.0%) |
| 65 to 74 Years | 2 (22.2%) | 0 (0.0%) |
| 75 Years and over | 0 (0.0%) | 0 (0.0%) |
Disability Class: Vision Difficulty
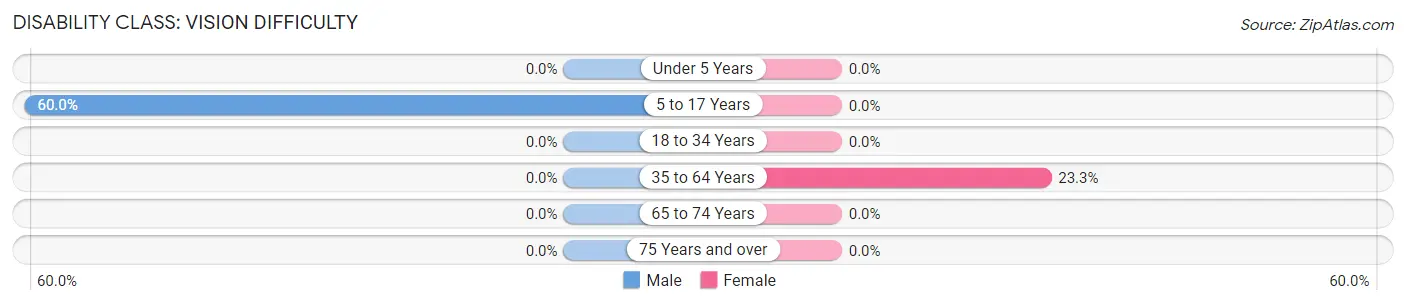
| Age Bracket | Male | Female |
| Under 5 Years | 0 (0.0%) | 0 (0.0%) |
| 5 to 17 Years | 12 (60.0%) | 0 (0.0%) |
| 18 to 34 Years | 0 (0.0%) | 0 (0.0%) |
| 35 to 64 Years | 0 (0.0%) | 7 (23.3%) |
| 65 to 74 Years | 0 (0.0%) | 0 (0.0%) |
| 75 Years and over | 0 (0.0%) | 0 (0.0%) |
Disability Class: Cognitive Difficulty
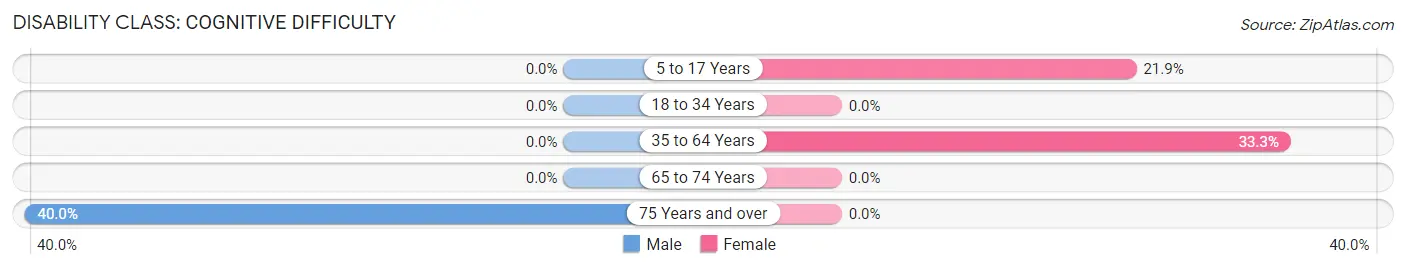
| Age Bracket | Male | Female |
| 5 to 17 Years | 0 (0.0%) | 7 (21.9%) |
| 18 to 34 Years | 0 (0.0%) | 0 (0.0%) |
| 35 to 64 Years | 0 (0.0%) | 10 (33.3%) |
| 65 to 74 Years | 0 (0.0%) | 0 (0.0%) |
| 75 Years and over | 2 (40.0%) | 0 (0.0%) |
Disability Class: Ambulatory Difficulty
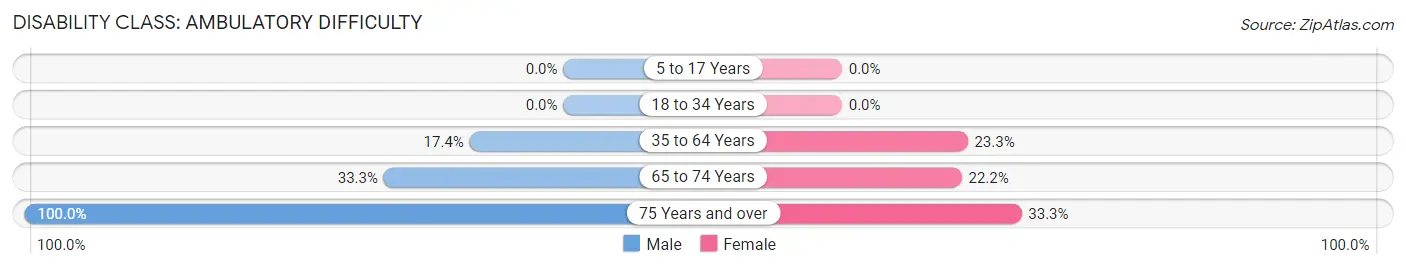
| Age Bracket | Male | Female |
| 5 to 17 Years | 0 (0.0%) | 0 (0.0%) |
| 18 to 34 Years | 0 (0.0%) | 0 (0.0%) |
| 35 to 64 Years | 8 (17.4%) | 7 (23.3%) |
| 65 to 74 Years | 3 (33.3%) | 2 (22.2%) |
| 75 Years and over | 5 (100.0%) | 2 (33.3%) |
Disability Class: Self-Care Difficulty
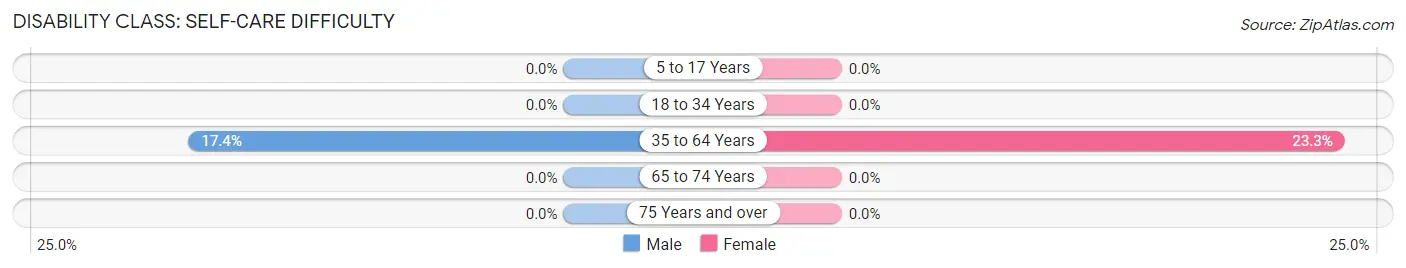
| Age Bracket | Male | Female |
| 5 to 17 Years | 0 (0.0%) | 0 (0.0%) |
| 18 to 34 Years | 0 (0.0%) | 0 (0.0%) |
| 35 to 64 Years | 8 (17.4%) | 7 (23.3%) |
| 65 to 74 Years | 0 (0.0%) | 0 (0.0%) |
| 75 Years and over | 0 (0.0%) | 0 (0.0%) |
Technology Access in Rupert
Computing Device Access in Rupert
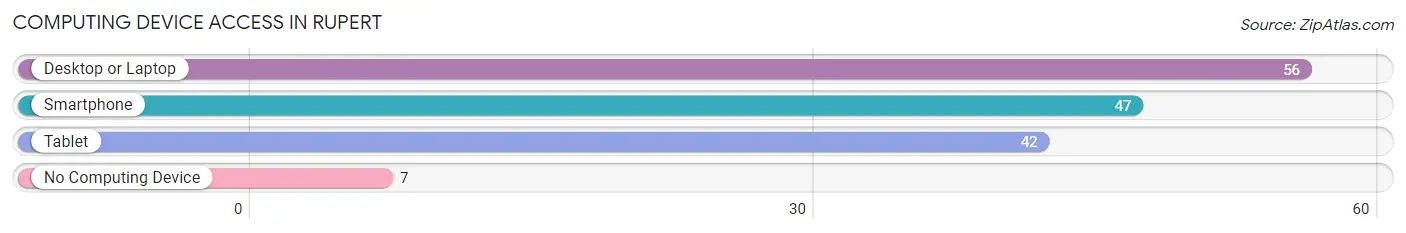
| Device Type | # Households | % Households |
| Desktop or Laptop | 56 | 86.2% |
| Smartphone | 47 | 72.3% |
| Tablet | 42 | 64.6% |
| No Computing Device | 7 | 10.8% |
| Total | 65 | 100.0% |
Internet Access in Rupert
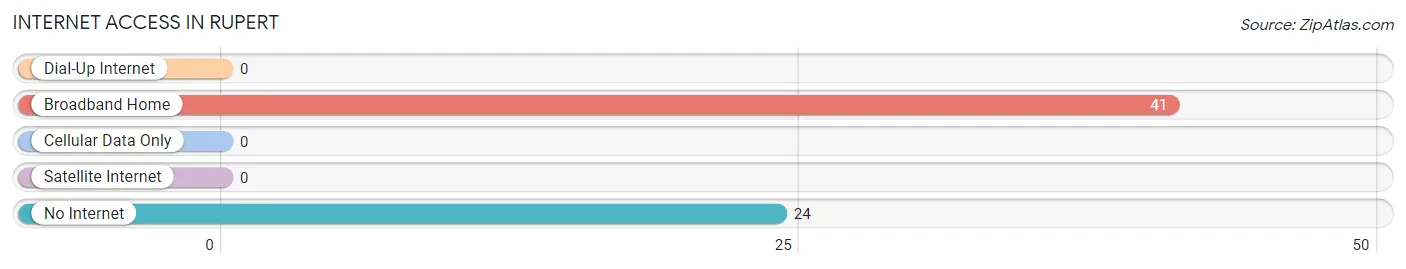
| Internet Type | # Households | % Households |
| Dial-Up Internet | 0 | 0.0% |
| Broadband Home | 41 | 63.1% |
| Cellular Data Only | 0 | 0.0% |
| Satellite Internet | 0 | 0.0% |
| No Internet | 24 | 36.9% |
| Total | 65 | 100.0% |
Rupert Summary
Rupert, Pennsylvania is a small borough located in Franklin County, Pennsylvania. It is situated in the south-central part of the state, approximately 20 miles south of Chambersburg and about 90 miles west of Baltimore, Maryland. The population of Rupert was 1,093 as of the 2010 census.
History
Rupert was founded in 1790 by John Rupert, a German immigrant who had settled in the area in 1786. Rupert was originally known as Rupertstown, and was the first settlement in what is now Franklin County. The town was laid out in 1790 and incorporated in 1820.
Rupert was an important stop on the Underground Railroad, with many of the town's residents helping to hide and transport escaped slaves. The town was also the site of a Civil War battle in 1863, when Confederate troops attempted to capture the town. The Union forces were able to repel the attack and the town was spared.
Geography
Rupert is located in south-central Pennsylvania, in the Cumberland Valley. The borough is situated in the Appalachian Mountains, and is surrounded by rolling hills and forests. The town is located along the Conococheague Creek, which flows through the center of the borough.
The climate in Rupert is humid continental, with hot summers and cold winters. The average annual temperature is around 50 degrees Fahrenheit, and the average annual precipitation is around 40 inches.
Economy
Rupert's economy is largely based on agriculture and tourism. The town is home to several small farms, which produce a variety of crops, including corn, soybeans, wheat, and hay. The town is also home to several small businesses, including a grocery store, a hardware store, and a few restaurants.
Rupert is also a popular tourist destination, with many visitors coming to the area to enjoy the town's natural beauty and outdoor activities. The town is home to several parks, including the Conococheague Creek Park, which offers fishing, hiking, and camping.
Demographics
As of the 2010 census, the population of Rupert was 1,093. The racial makeup of the town was 97.2% White, 0.7% African American, 0.2% Native American, 0.2% Asian, 0.2% from other races, and 1.7% from two or more races. Hispanic or Latino of any race were 0.7% of the population.
The median household income in Rupert was $41,250, and the median family income was $48,750. The per capita income for the town was $19,945. About 8.2% of families and 10.2% of the population were below the poverty line, including 14.3% of those under age 18 and 8.3% of those age 65 or over.
Common Questions
What is Per Capita Income in Rupert?
Per Capita income in Rupert is $23,505.
What is the Median Family Income in Rupert?
Median Family Income in Rupert is $46,635.
What is the Median Household income in Rupert?
Median Household Income in Rupert is $46,442.
What is Income or Wage Gap in Rupert?
Income or Wage Gap in Rupert is 57.4%.
Women in Rupert earn 42.6 cents for every dollar earned by a man.
What is Inequality or Gini Index in Rupert?
Inequality or Gini Index in Rupert is 0.44.
What is the Total Population of Rupert?
Total Population of Rupert is 220.
What is the Total Male Population of Rupert?
Total Male Population of Rupert is 107.
What is the Total Female Population of Rupert?
Total Female Population of Rupert is 113.
What is the Ratio of Males per 100 Females in Rupert?
There are 94.69 Males per 100 Females in Rupert.
What is the Ratio of Females per 100 Males in Rupert?
There are 105.61 Females per 100 Males in Rupert.
What is the Median Population Age in Rupert?
Median Population Age in Rupert is 34.8 Years.
What is the Average Family Size in Rupert
Average Family Size in Rupert is 3.3 People.
What is the Average Household Size in Rupert
Average Household Size in Rupert is 3.4 People.
How Large is the Labor Force in Rupert?
There are 109 People in the Labor Forcein in Rupert.
What is the Percentage of People in the Labor Force in Rupert?
69.0% of People are in the Labor Force in Rupert.
What is the Unemployment Rate in Rupert?
Unemployment Rate in Rupert is 7.3%.