Bradenville, PA Map & Demographics
Bradenville Map
Bradenville Overview
$18,115
PER CAPITA INCOME
$95,417
AVG FAMILY INCOME
$48,125
AVG HOUSEHOLD INCOME
46.5%
WAGE / INCOME GAP [ % ]
53.5¢/ $1
WAGE / INCOME GAP [ $ ]
0.42
INEQUALITY / GINI INDEX
449
TOTAL POPULATION
210
MALE POPULATION
239
FEMALE POPULATION
87.87
MALES / 100 FEMALES
113.81
FEMALES / 100 MALES
42.1
MEDIAN AGE
4.5
AVG FAMILY SIZE
2.8
AVG HOUSEHOLD SIZE
132
LABOR FORCE [ PEOPLE ]
42.6%
PERCENT IN LABOR FORCE
Bradenville Zip Codes
Bradenville Area Codes
Income in Bradenville
Income Overview in Bradenville
Per Capita Income in Bradenville is $18,115, while median incomes of families and households are $95,417 and $48,125 respectively.
| Characteristic | Number | Measure |
| Per Capita Income | 449 | $18,115 |
| Median Family Income | 78 | $95,417 |
| Mean Family Income | 78 | $81,054 |
| Median Household Income | 159 | $48,125 |
| Mean Household Income | 159 | $49,357 |
| Income Deficit | 78 | $0 |
| Wage / Income Gap (%) | 449 | 46.48% |
| Wage / Income Gap ($) | 449 | 53.52¢ per $1 |
| Gini / Inequality Index | 449 | 0.42 |
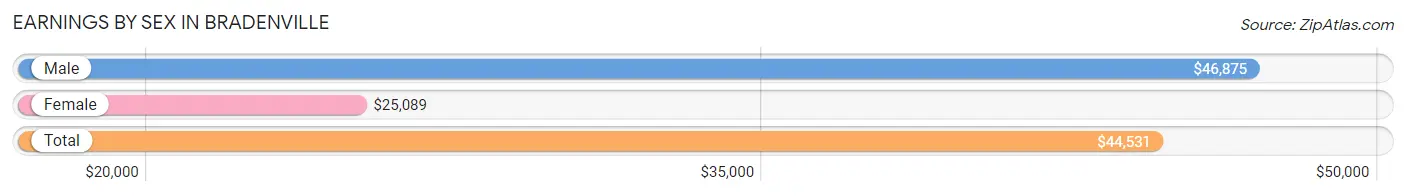
Earnings by Sex in Bradenville
Average Earnings in Bradenville are $44,531, $46,875 for men and $25,089 for women, a difference of 46.5%.
| Sex | Number | Average Earnings |
| Male | 95 (64.2%) | $46,875 |
| Female | 53 (35.8%) | $25,089 |
| Total | 148 (100.0%) | $44,531 |
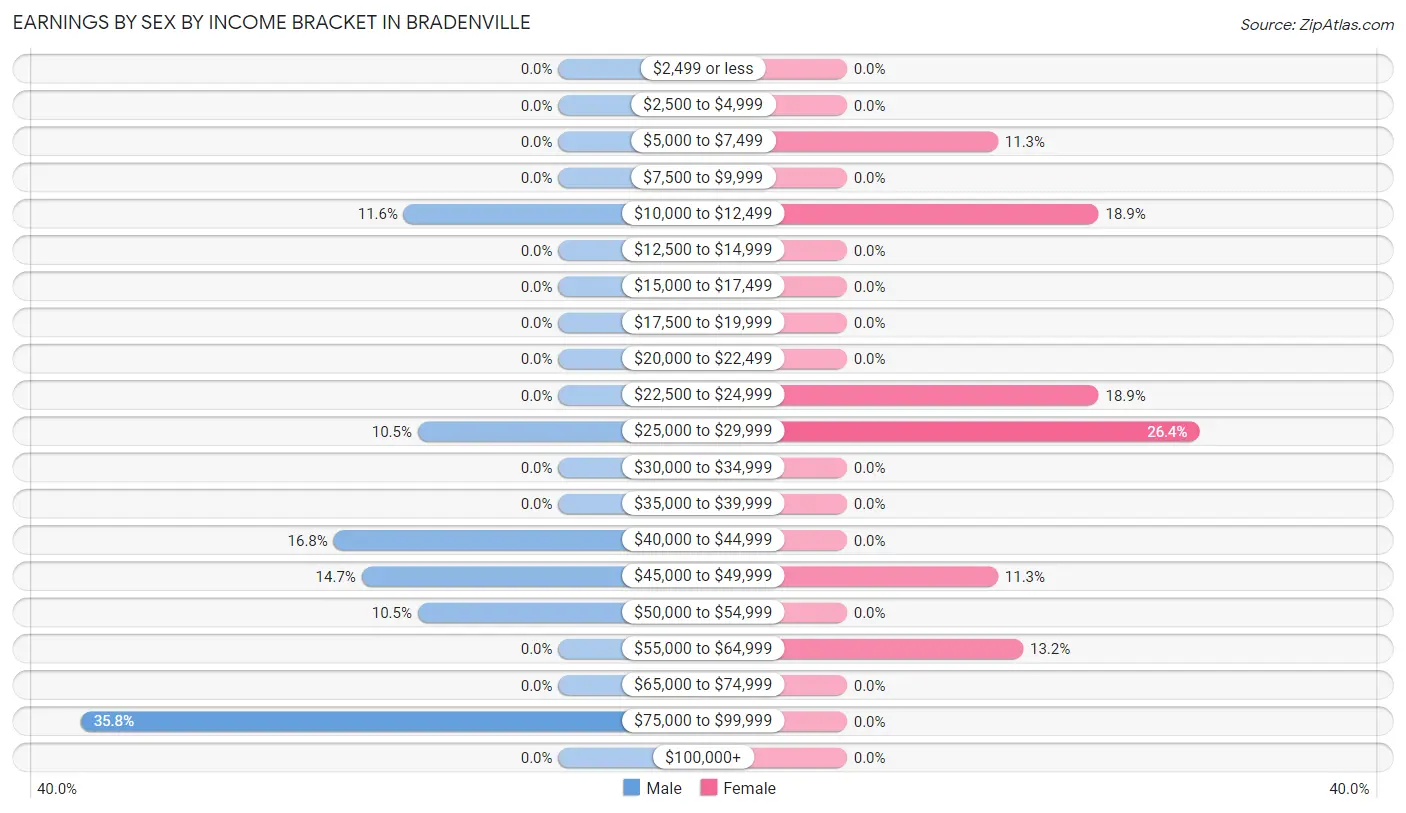
Earnings by Sex by Income Bracket in Bradenville
The most common earnings brackets in Bradenville are $75,000 to $99,999 for men (34 | 35.8%) and $25,000 to $29,999 for women (14 | 26.4%).
| Income | Male | Female |
| $2,499 or less | 0 (0.0%) | 0 (0.0%) |
| $2,500 to $4,999 | 0 (0.0%) | 0 (0.0%) |
| $5,000 to $7,499 | 0 (0.0%) | 6 (11.3%) |
| $7,500 to $9,999 | 0 (0.0%) | 0 (0.0%) |
| $10,000 to $12,499 | 11 (11.6%) | 10 (18.9%) |
| $12,500 to $14,999 | 0 (0.0%) | 0 (0.0%) |
| $15,000 to $17,499 | 0 (0.0%) | 0 (0.0%) |
| $17,500 to $19,999 | 0 (0.0%) | 0 (0.0%) |
| $20,000 to $22,499 | 0 (0.0%) | 0 (0.0%) |
| $22,500 to $24,999 | 0 (0.0%) | 10 (18.9%) |
| $25,000 to $29,999 | 10 (10.5%) | 14 (26.4%) |
| $30,000 to $34,999 | 0 (0.0%) | 0 (0.0%) |
| $35,000 to $39,999 | 0 (0.0%) | 0 (0.0%) |
| $40,000 to $44,999 | 16 (16.8%) | 0 (0.0%) |
| $45,000 to $49,999 | 14 (14.7%) | 6 (11.3%) |
| $50,000 to $54,999 | 10 (10.5%) | 0 (0.0%) |
| $55,000 to $64,999 | 0 (0.0%) | 7 (13.2%) |
| $65,000 to $74,999 | 0 (0.0%) | 0 (0.0%) |
| $75,000 to $99,999 | 34 (35.8%) | 0 (0.0%) |
| $100,000+ | 0 (0.0%) | 0 (0.0%) |
| Total | 95 (100.0%) | 53 (100.0%) |
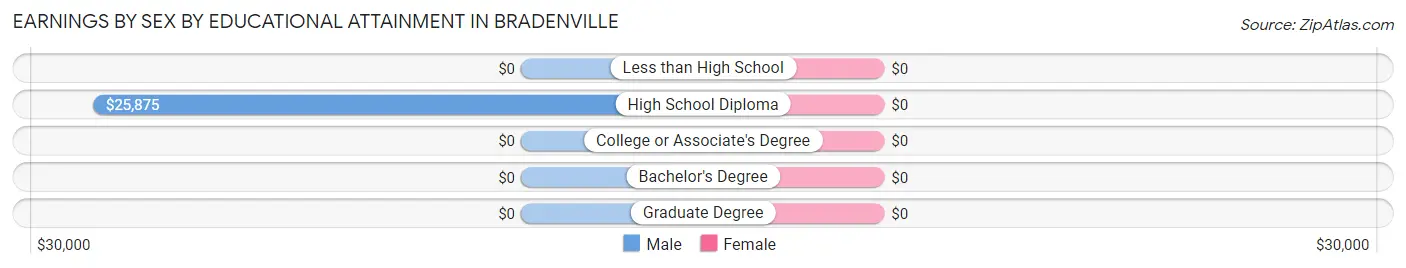
Earnings by Sex by Educational Attainment in Bradenville
| Educational Attainment | Male Income | Female Income |
| Less than High School | - | - |
| High School Diploma | $25,875 | $0 |
| College or Associate's Degree | - | - |
| Bachelor's Degree | - | - |
| Graduate Degree | - | - |
| Total | $46,875 | $25,089 |
Family Income in Bradenville
Family Income Brackets in Bradenville
According to the Bradenville family income data, there are 50 families falling into the $75,000 to $99,999 income range, which is the most common income bracket and makes up 64.1% of all families.
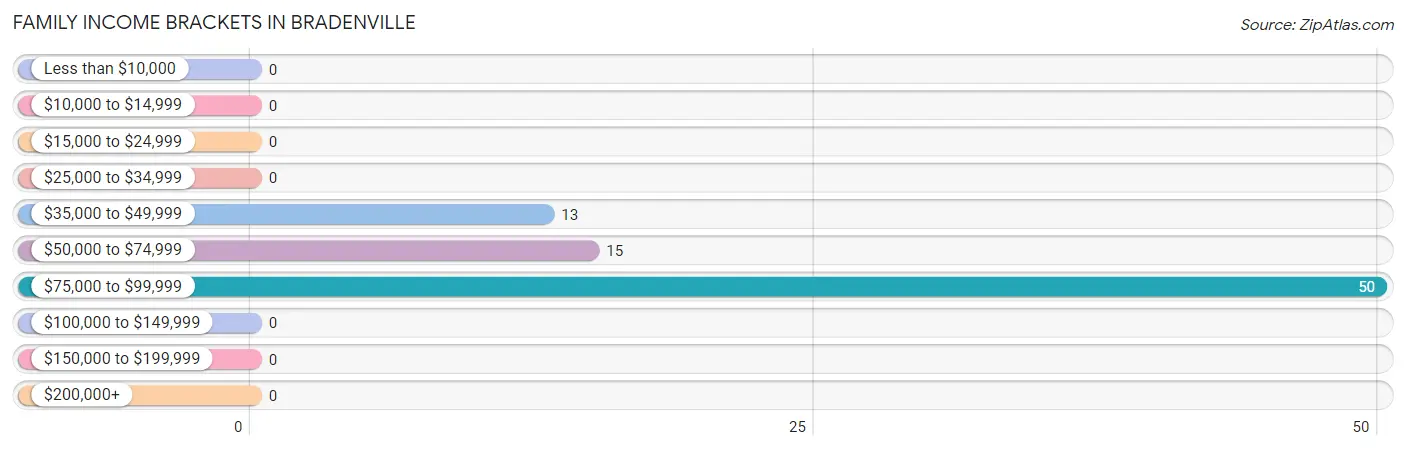
| Income Bracket | # Families | % Families |
| Less than $10,000 | 0 | 0.0% |
| $10,000 to $14,999 | 0 | 0.0% |
| $15,000 to $24,999 | 0 | 0.0% |
| $25,000 to $34,999 | 0 | 0.0% |
| $35,000 to $49,999 | 13 | 16.7% |
| $50,000 to $74,999 | 15 | 19.2% |
| $75,000 to $99,999 | 50 | 64.1% |
| $100,000 to $149,999 | 0 | 0.0% |
| $150,000 to $199,999 | 0 | 0.0% |
| $200,000+ | 0 | 0.0% |
Family Income by Famaliy Size in Bradenville
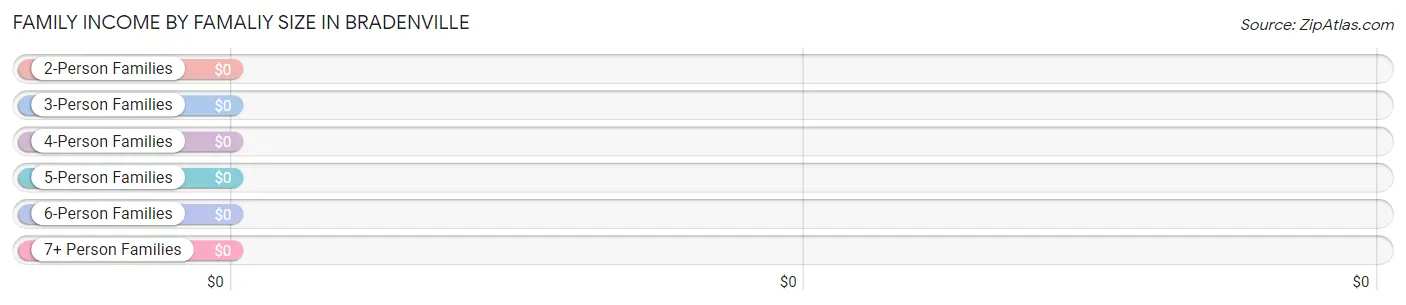
| Income Bracket | # Families | Median Income |
| 2-Person Families | 15 (19.2%) | $0 |
| 3-Person Families | 19 (24.4%) | $0 |
| 4-Person Families | 10 (12.8%) | $0 |
| 5-Person Families | 0 (0.0%) | $0 |
| 6-Person Families | 34 (43.6%) | $0 |
| 7+ Person Families | 0 (0.0%) | $0 |
| Total | 78 (100.0%) | $95,417 |
Family Income by Number of Earners in Bradenville
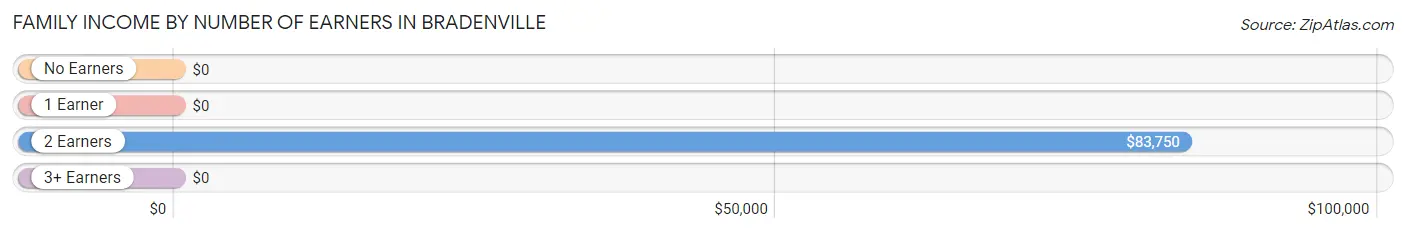
| Number of Earners | # Families | Median Income |
| No Earners | 9 (11.5%) | $0 |
| 1 Earner | 47 (60.3%) | $0 |
| 2 Earners | 22 (28.2%) | $83,750 |
| 3+ Earners | 0 (0.0%) | $0 |
| Total | 78 (100.0%) | $95,417 |
Household Income in Bradenville
Household Income Brackets in Bradenville
With 50 households falling in the category, the $75,000 to $99,999 income range is the most frequent in Bradenville, accounting for 31.5% of all households.
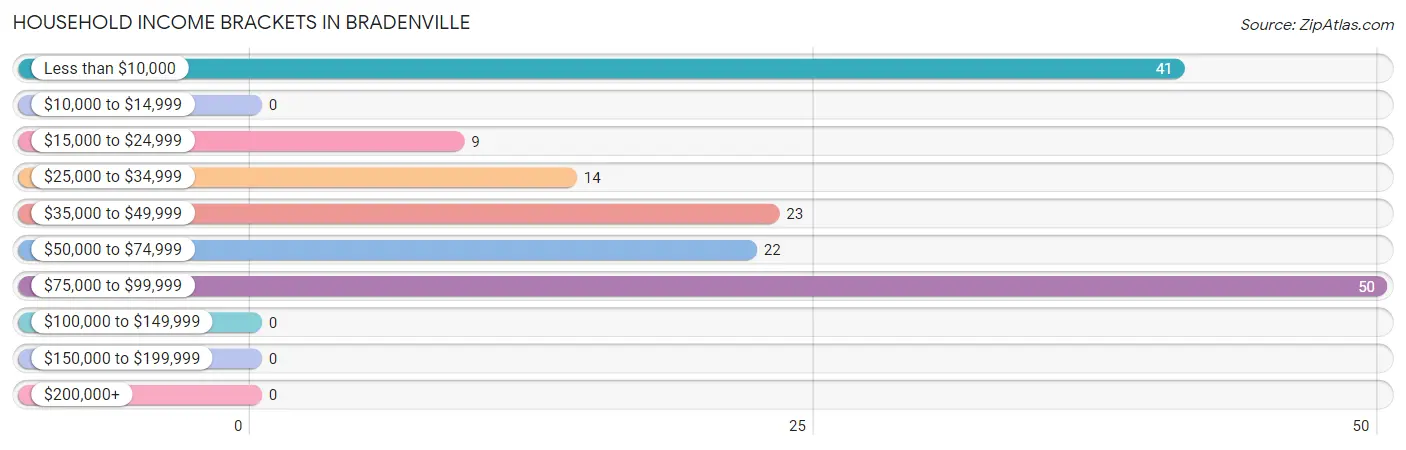
| Income Bracket | # Households | % Households |
| Less than $10,000 | 41 | 25.8% |
| $10,000 to $14,999 | 0 | 0.0% |
| $15,000 to $24,999 | 9 | 5.7% |
| $25,000 to $34,999 | 14 | 8.8% |
| $35,000 to $49,999 | 23 | 14.5% |
| $50,000 to $74,999 | 22 | 13.8% |
| $75,000 to $99,999 | 50 | 31.4% |
| $100,000 to $149,999 | 0 | 0.0% |
| $150,000 to $199,999 | 0 | 0.0% |
| $200,000+ | 0 | 0.0% |
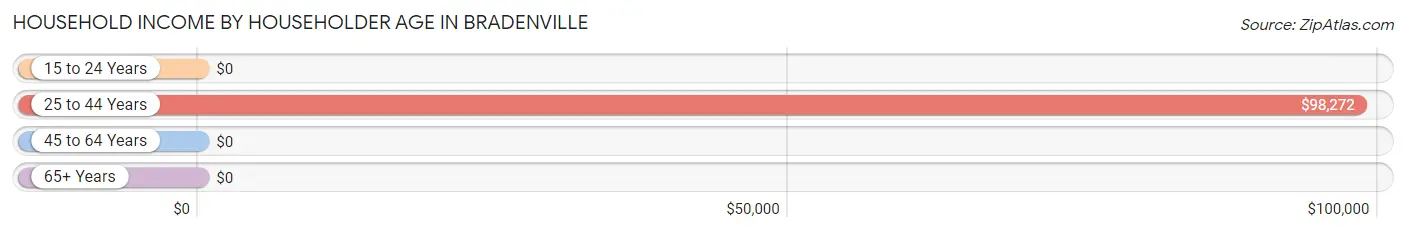
Household Income by Householder Age in Bradenville
The median household income in Bradenville is $48,125, with the highest median household income of $98,272 found in the 25 to 44 years age bracket for the primary householder. A total of 47 households (29.6%) fall into this category.
| Income Bracket | # Households | Median Income |
| 15 to 24 Years | 0 (0.0%) | $0 |
| 25 to 44 Years | 47 (29.6%) | $98,272 |
| 45 to 64 Years | 66 (41.5%) | $0 |
| 65+ Years | 46 (28.9%) | $0 |
| Total | 159 (100.0%) | $48,125 |
Poverty in Bradenville
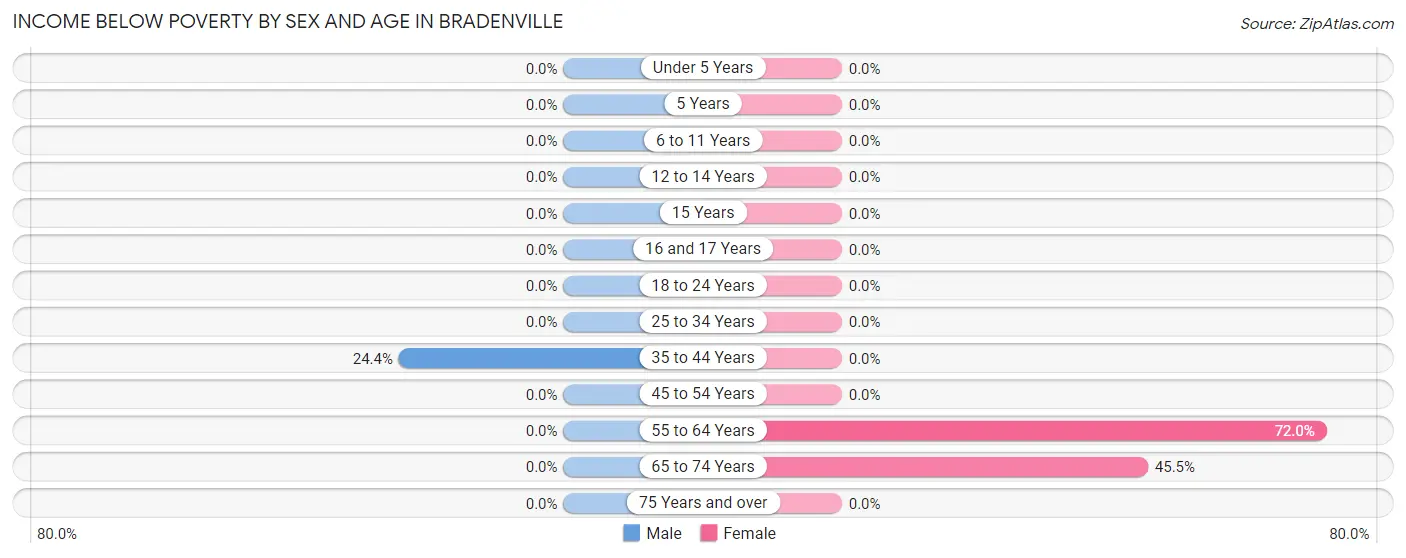
Income Below Poverty by Sex and Age in Bradenville
With 5.2% poverty level for males and 21.3% for females among the residents of Bradenville, 35 to 44 year old males and 55 to 64 year old females are the most vulnerable to poverty, with 11 males (24.4%) and 36 females (72.0%) in their respective age groups living below the poverty level.
| Age Bracket | Male | Female |
| Under 5 Years | 0 (0.0%) | 0 (0.0%) |
| 5 Years | 0 (0.0%) | 0 (0.0%) |
| 6 to 11 Years | 0 (0.0%) | 0 (0.0%) |
| 12 to 14 Years | 0 (0.0%) | 0 (0.0%) |
| 15 Years | 0 (0.0%) | 0 (0.0%) |
| 16 and 17 Years | 0 (0.0%) | 0 (0.0%) |
| 18 to 24 Years | 0 (0.0%) | 0 (0.0%) |
| 25 to 34 Years | 0 (0.0%) | 0 (0.0%) |
| 35 to 44 Years | 11 (24.4%) | 0 (0.0%) |
| 45 to 54 Years | 0 (0.0%) | 0 (0.0%) |
| 55 to 64 Years | 0 (0.0%) | 36 (72.0%) |
| 65 to 74 Years | 0 (0.0%) | 15 (45.5%) |
| 75 Years and over | 0 (0.0%) | 0 (0.0%) |
| Total | 11 (5.2%) | 51 (21.3%) |
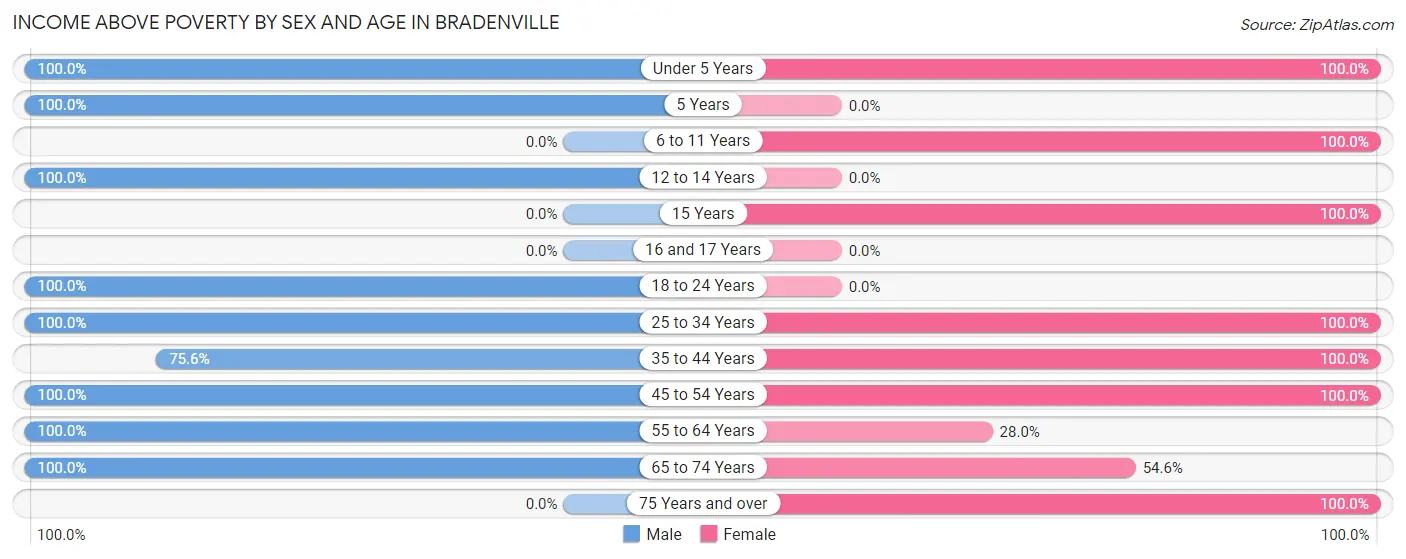
Income Above Poverty by Sex and Age in Bradenville
According to the poverty statistics in Bradenville, males aged under 5 years and females aged under 5 years are the age groups that are most secure financially, with 100.0% of males and 100.0% of females in these age groups living above the poverty line.
| Age Bracket | Male | Female |
| Under 5 Years | 15 (100.0%) | 33 (100.0%) |
| 5 Years | 35 (100.0%) | 0 (0.0%) |
| 6 to 11 Years | 0 (0.0%) | 38 (100.0%) |
| 12 to 14 Years | 9 (100.0%) | 0 (0.0%) |
| 15 Years | 0 (0.0%) | 9 (100.0%) |
| 16 and 17 Years | 0 (0.0%) | 0 (0.0%) |
| 18 to 24 Years | 8 (100.0%) | 0 (0.0%) |
| 25 to 34 Years | 6 (100.0%) | 6 (100.0%) |
| 35 to 44 Years | 34 (75.6%) | 51 (100.0%) |
| 45 to 54 Years | 34 (100.0%) | 6 (100.0%) |
| 55 to 64 Years | 49 (100.0%) | 14 (28.0%) |
| 65 to 74 Years | 9 (100.0%) | 18 (54.5%) |
| 75 Years and over | 0 (0.0%) | 13 (100.0%) |
| Total | 199 (94.8%) | 188 (78.7%) |
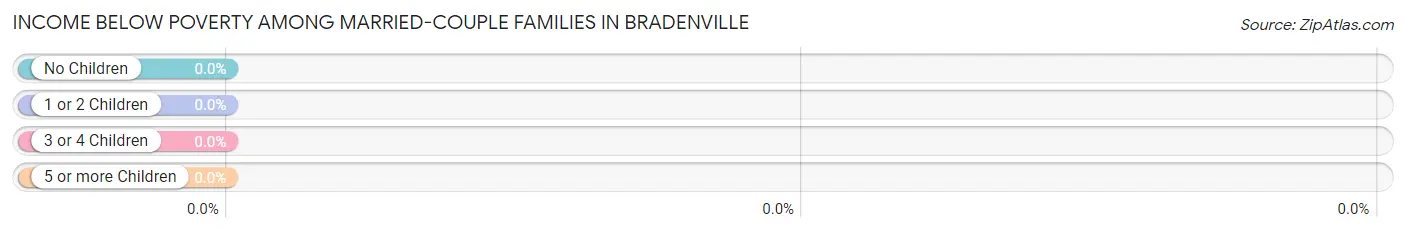
Income Below Poverty Among Married-Couple Families in Bradenville
| Children | Above Poverty | Below Poverty |
| No Children | 21 (100.0%) | 0 (0.0%) |
| 1 or 2 Children | 0 (0.0%) | 0 (0.0%) |
| 3 or 4 Children | 34 (100.0%) | 0 (0.0%) |
| 5 or more Children | 0 (0.0%) | 0 (0.0%) |
| Total | 55 (100.0%) | 0 (0.0%) |
Income Below Poverty Among Single-Parent Households in Bradenville
| Children | Single Father | Single Mother |
| No Children | 0 (0.0%) | 0 (0.0%) |
| 1 or 2 Children | 0 (0.0%) | 0 (0.0%) |
| 3 or 4 Children | 0 (0.0%) | 0 (0.0%) |
| 5 or more Children | 0 (0.0%) | 0 (0.0%) |
| Total | 0 (0.0%) | 0 (0.0%) |
Income Below Poverty Among Married-Couple vs Single-Parent Households in Bradenville
| Children | Married-Couple Families | Single-Parent Households |
| No Children | 0 (0.0%) | 0 (0.0%) |
| 1 or 2 Children | 0 (0.0%) | 0 (0.0%) |
| 3 or 4 Children | 0 (0.0%) | 0 (0.0%) |
| 5 or more Children | 0 (0.0%) | 0 (0.0%) |
| Total | 0 (0.0%) | 0 (0.0%) |
Race in Bradenville
The most populous races in Bradenville are White / Caucasian (418 | 93.1%), and Two or more Races (31 | 6.9%).
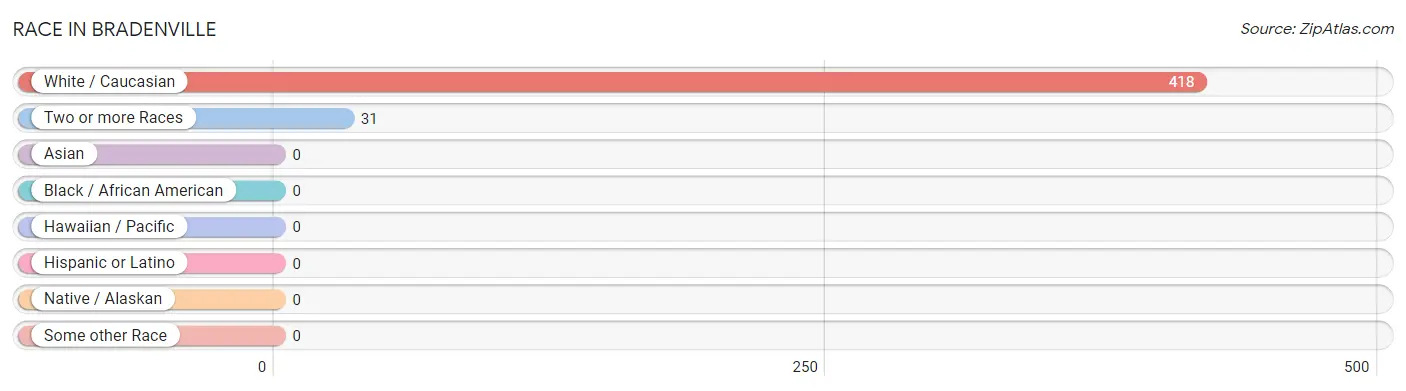
| Race | # Population | % Population |
| Asian | 0 | 0.0% |
| Black / African American | 0 | 0.0% |
| Hawaiian / Pacific | 0 | 0.0% |
| Hispanic or Latino | 0 | 0.0% |
| Native / Alaskan | 0 | 0.0% |
| White / Caucasian | 418 | 93.1% |
| Two or more Races | 31 | 6.9% |
| Some other Race | 0 | 0.0% |
| Total | 449 | 100.0% |
Ancestry in Bradenville
The most populous ancestries reported in Bradenville are German (197 | 43.9%), Italian (183 | 40.8%), Irish (97 | 21.6%), Czech (26 | 5.8%), and Scotch-Irish (15 | 3.3%), together accounting for 115.4% of all Bradenville residents.
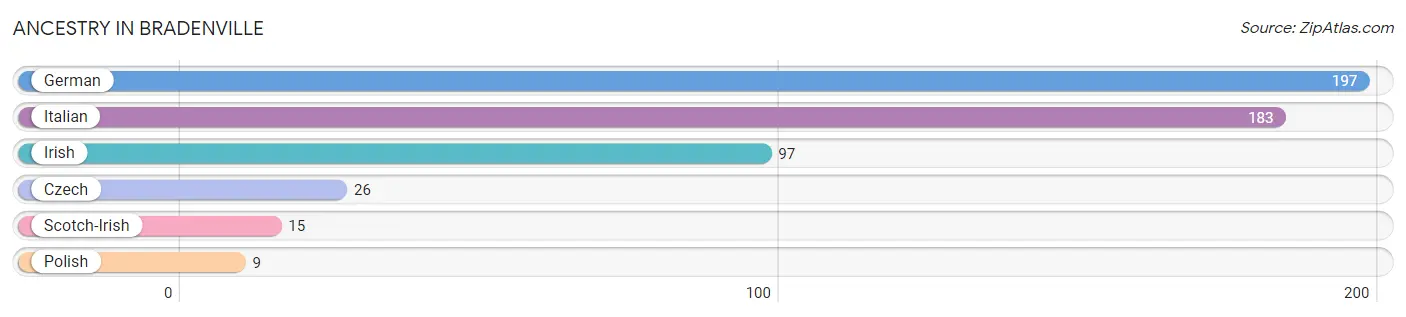
| Ancestry | # Population | % Population |
| Czech | 26 | 5.8% |
| German | 197 | 43.9% |
| Irish | 97 | 21.6% |
| Italian | 183 | 40.8% |
| Polish | 9 | 2.0% |
| Scotch-Irish | 15 | 3.3% | View All 6 Rows |
Immigrants in Bradenville

| Immigration Origin | # Population | % Population | View All 0 Rows |
Sex and Age in Bradenville
Sex and Age in Bradenville
The most populous age groups in Bradenville are 55 to 59 Years (39 | 18.6%) for men and 35 to 39 Years (51 | 21.3%) for women.
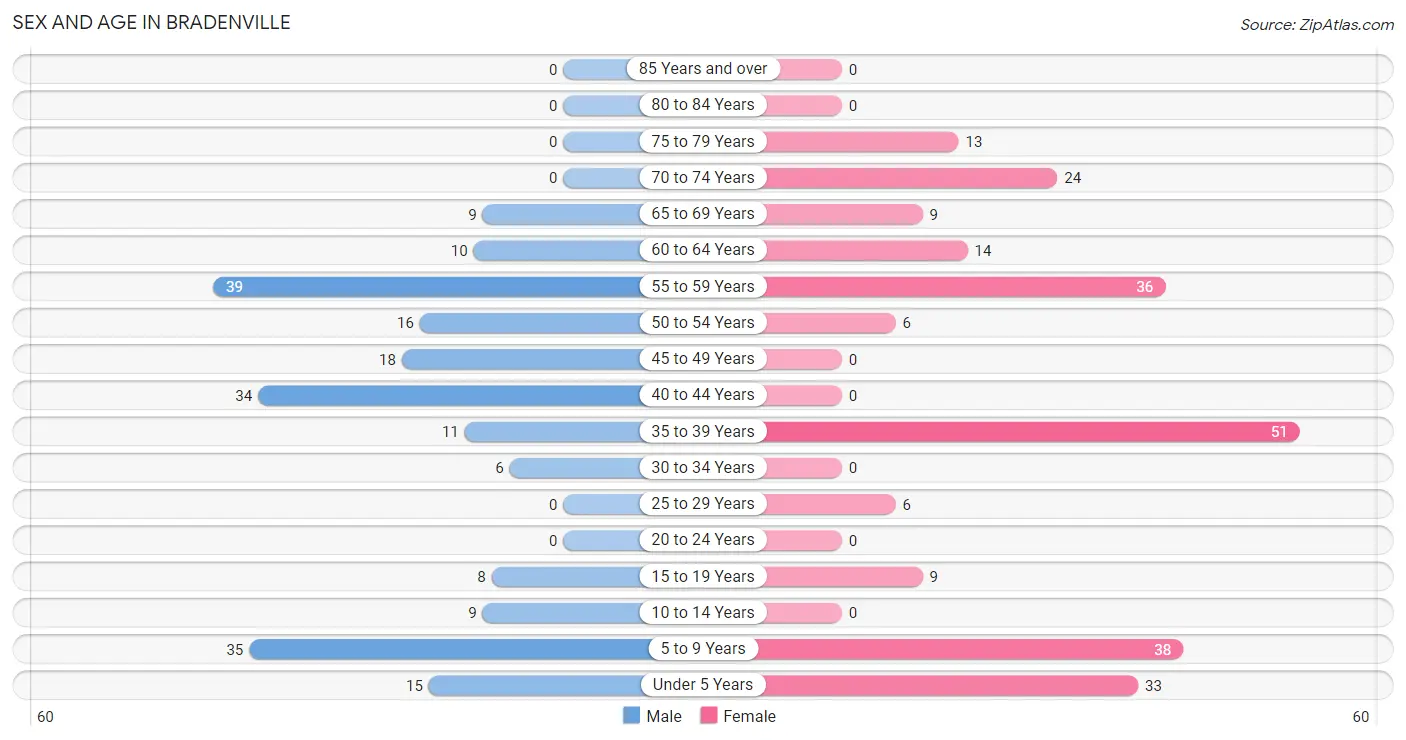
| Age Bracket | Male | Female |
| Under 5 Years | 15 (7.1%) | 33 (13.8%) |
| 5 to 9 Years | 35 (16.7%) | 38 (15.9%) |
| 10 to 14 Years | 9 (4.3%) | 0 (0.0%) |
| 15 to 19 Years | 8 (3.8%) | 9 (3.8%) |
| 20 to 24 Years | 0 (0.0%) | 0 (0.0%) |
| 25 to 29 Years | 0 (0.0%) | 6 (2.5%) |
| 30 to 34 Years | 6 (2.9%) | 0 (0.0%) |
| 35 to 39 Years | 11 (5.2%) | 51 (21.3%) |
| 40 to 44 Years | 34 (16.2%) | 0 (0.0%) |
| 45 to 49 Years | 18 (8.6%) | 0 (0.0%) |
| 50 to 54 Years | 16 (7.6%) | 6 (2.5%) |
| 55 to 59 Years | 39 (18.6%) | 36 (15.1%) |
| 60 to 64 Years | 10 (4.8%) | 14 (5.9%) |
| 65 to 69 Years | 9 (4.3%) | 9 (3.8%) |
| 70 to 74 Years | 0 (0.0%) | 24 (10.0%) |
| 75 to 79 Years | 0 (0.0%) | 13 (5.4%) |
| 80 to 84 Years | 0 (0.0%) | 0 (0.0%) |
| 85 Years and over | 0 (0.0%) | 0 (0.0%) |
| Total | 210 (100.0%) | 239 (100.0%) |
Families and Households in Bradenville
Median Family Size in Bradenville
The median family size in Bradenville is 4.45 persons per family, with married-couple families (55 | 70.5%) accounting for the largest median family size of 4.82 persons per family. On the other hand, single female/mother families (13 | 16.7%) represent the smallest median family size with 3.38 persons per family.
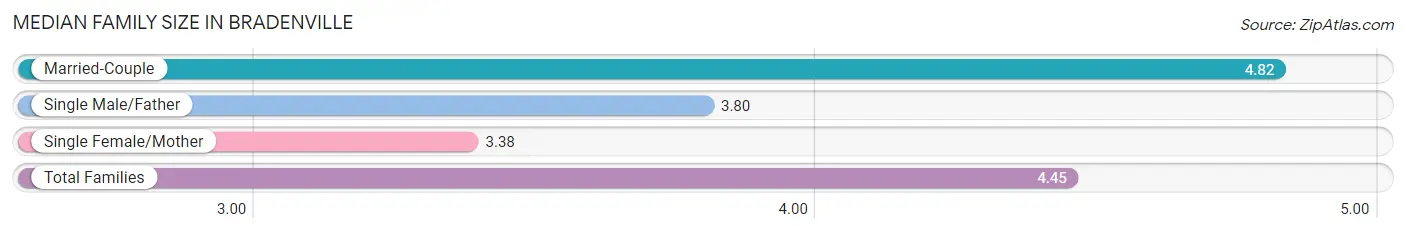
| Family Type | # Families | Family Size |
| Married-Couple | 55 (70.5%) | 4.82 |
| Single Male/Father | 10 (12.8%) | 3.80 |
| Single Female/Mother | 13 (16.7%) | 3.38 |
| Total Families | 78 (100.0%) | 4.45 |
Median Household Size in Bradenville
The median household size in Bradenville is 2.82 persons per household, with married-couple households (55 | 34.6%) accounting for the largest median household size of 4.82 persons per household. non-family households (81 | 50.9%) represent the smallest median household size with 1.26 persons per household.
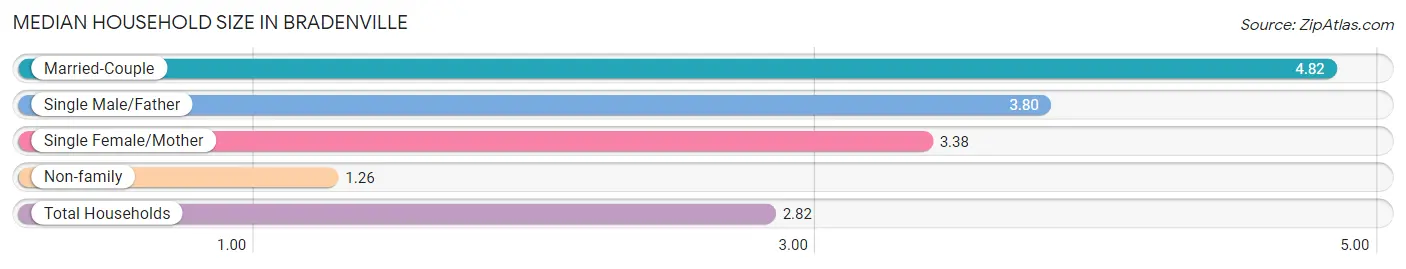
| Household Type | # Households | Household Size |
| Married-Couple | 55 (34.6%) | 4.82 |
| Single Male/Father | 10 (6.3%) | 3.80 |
| Single Female/Mother | 13 (8.2%) | 3.38 |
| Non-family | 81 (50.9%) | 1.26 |
| Total Households | 159 (100.0%) | 2.82 |
Household Size by Marriage Status in Bradenville
Out of a total of 159 households in Bradenville, 78 (49.1%) are family households, while 81 (50.9%) are nonfamily households. The most numerous type of family households are 6-person households, comprising 34, and the most common type of nonfamily households are 1-person households, comprising 71.
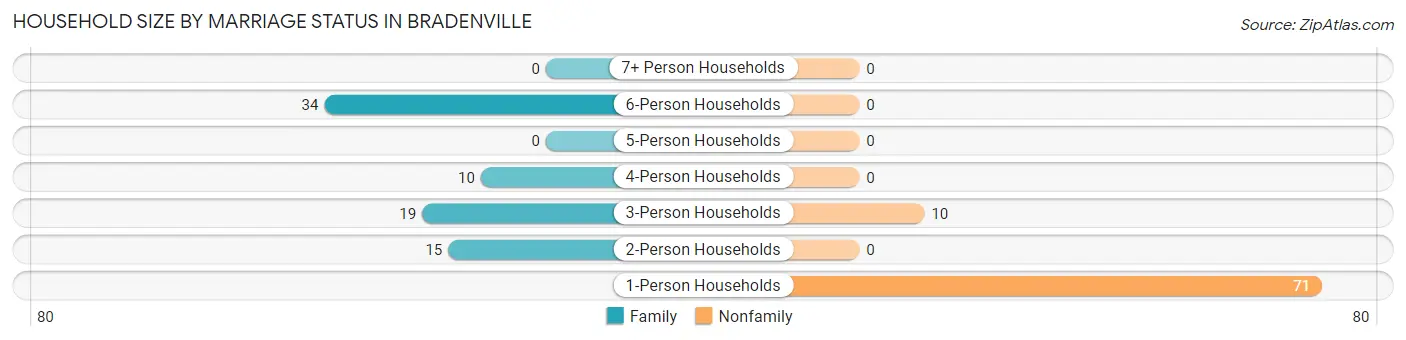
| Household Size | Family Households | Nonfamily Households |
| 1-Person Households | - | 71 (44.7%) |
| 2-Person Households | 15 (9.4%) | 0 (0.0%) |
| 3-Person Households | 19 (11.9%) | 10 (6.3%) |
| 4-Person Households | 10 (6.3%) | 0 (0.0%) |
| 5-Person Households | 0 (0.0%) | 0 (0.0%) |
| 6-Person Households | 34 (21.4%) | 0 (0.0%) |
| 7+ Person Households | 0 (0.0%) | 0 (0.0%) |
| Total | 78 (49.1%) | 81 (50.9%) |
Female Fertility in Bradenville
Fertility by Age in Bradenville
| Age Bracket | Women with Births | Births / 1,000 Women |
| 15 to 19 years | 0 (0.0%) | 0.0 |
| 20 to 34 years | 0 (0.0%) | 0.0 |
| 35 to 50 years | 0 (0.0%) | 0.0 |
| Total | 0 (0.0%) | 0.0 |
Fertility by Age by Marriage Status in Bradenville
| Age Bracket | Married | Unmarried |
| 15 to 19 years | 0 (0.0%) | 0 (0.0%) |
| 20 to 34 years | 0 (0.0%) | 0 (0.0%) |
| 35 to 50 years | 0 (0.0%) | 0 (0.0%) |
| Total | 0 (0.0%) | 0 (0.0%) |
Fertility by Education in Bradenville
| Educational Attainment | Women with Births | Births / 1,000 Women |
| Less than High School | 0 (0.0%) | 0.0 |
| High School Diploma | 0 (0.0%) | 0.0 |
| College or Associate's Degree | 0 (0.0%) | 0.0 |
| Bachelor's Degree | 0 (0.0%) | 0.0 |
| Graduate Degree | 0 (0.0%) | 0.0 |
| Total | 0 (0.0%) | 0.0 |
Fertility by Education by Marriage Status in Bradenville
| Educational Attainment | Married | Unmarried |
| Less than High School | 0 (0.0%) | 0 (0.0%) |
| High School Diploma | 0 (0.0%) | 0 (0.0%) |
| College or Associate's Degree | 0 (0.0%) | 0 (0.0%) |
| Bachelor's Degree | 0 (0.0%) | 0 (0.0%) |
| Graduate Degree | 0 (0.0%) | 0 (0.0%) |
| Total | 0 (0.0%) | 0 (0.0%) |
Employment Characteristics in Bradenville
Employment by Class of Employer in Bradenville
Among the 132 employed individuals in Bradenville, private company employees (122 | 92.4%), and self-employed (not incorporated) (10 | 7.6%) make up the most common classes of employment.
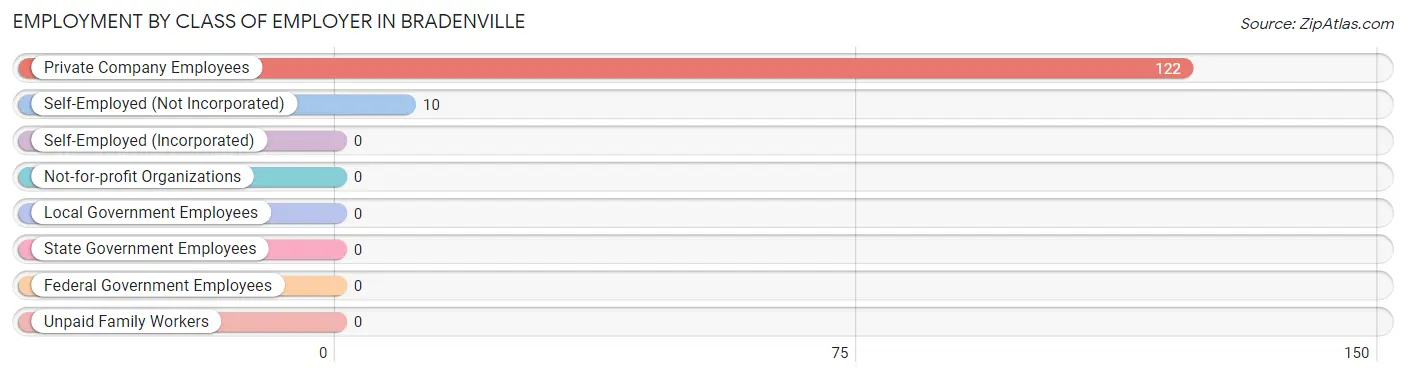
| Employer Class | # Employees | % Employees |
| Private Company Employees | 122 | 92.4% |
| Self-Employed (Incorporated) | 0 | 0.0% |
| Self-Employed (Not Incorporated) | 10 | 7.6% |
| Not-for-profit Organizations | 0 | 0.0% |
| Local Government Employees | 0 | 0.0% |
| State Government Employees | 0 | 0.0% |
| Federal Government Employees | 0 | 0.0% |
| Unpaid Family Workers | 0 | 0.0% |
| Total | 132 | 100.0% |
Employment Status by Age in Bradenville
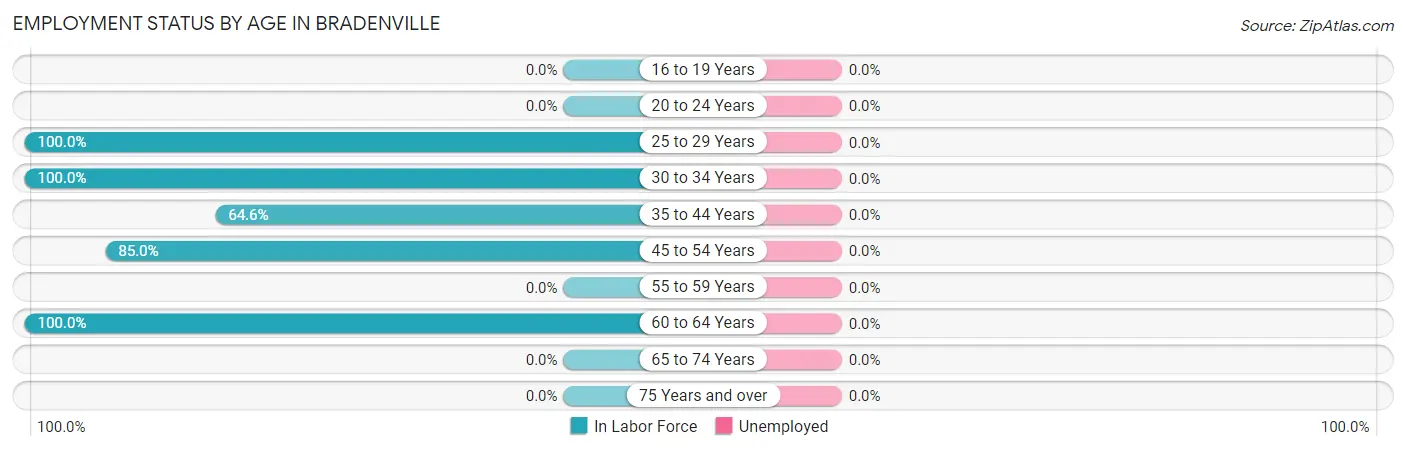
| Age Bracket | In Labor Force | Unemployed |
| 16 to 19 Years | 0 (0.0%) | 0 (0.0%) |
| 20 to 24 Years | 0 (0.0%) | 0 (0.0%) |
| 25 to 29 Years | 6 (100.0%) | 0 (0.0%) |
| 30 to 34 Years | 6 (100.0%) | 0 (0.0%) |
| 35 to 44 Years | 62 (64.6%) | 0 (0.0%) |
| 45 to 54 Years | 34 (85.0%) | 0 (0.0%) |
| 55 to 59 Years | 0 (0.0%) | 0 (0.0%) |
| 60 to 64 Years | 24 (100.0%) | 0 (0.0%) |
| 65 to 74 Years | 0 (0.0%) | 0 (0.0%) |
| 75 Years and over | 0 (0.0%) | 0 (0.0%) |
| Total | 132 (42.6%) | 0 (0.0%) |
Employment Status by Educational Attainment in Bradenville
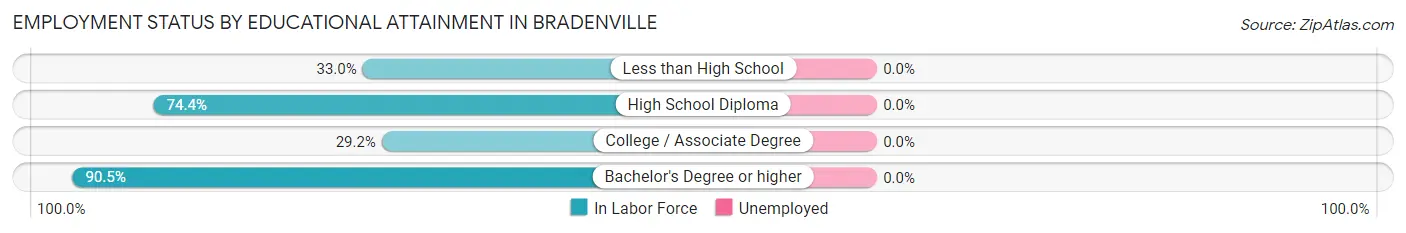
| Educational Attainment | In Labor Force | Unemployed |
| Less than High School | 32 (33.0%) | 0 (0.0%) |
| High School Diploma | 29 (74.4%) | 0 (0.0%) |
| College / Associate Degree | 14 (29.2%) | 0 (0.0%) |
| Bachelor's Degree or higher | 57 (90.5%) | 0 (0.0%) |
| Total | 132 (53.4%) | 0 (0.0%) |
Employment Occupations by Sex in Bradenville
Management, Business, Science and Arts Occupations
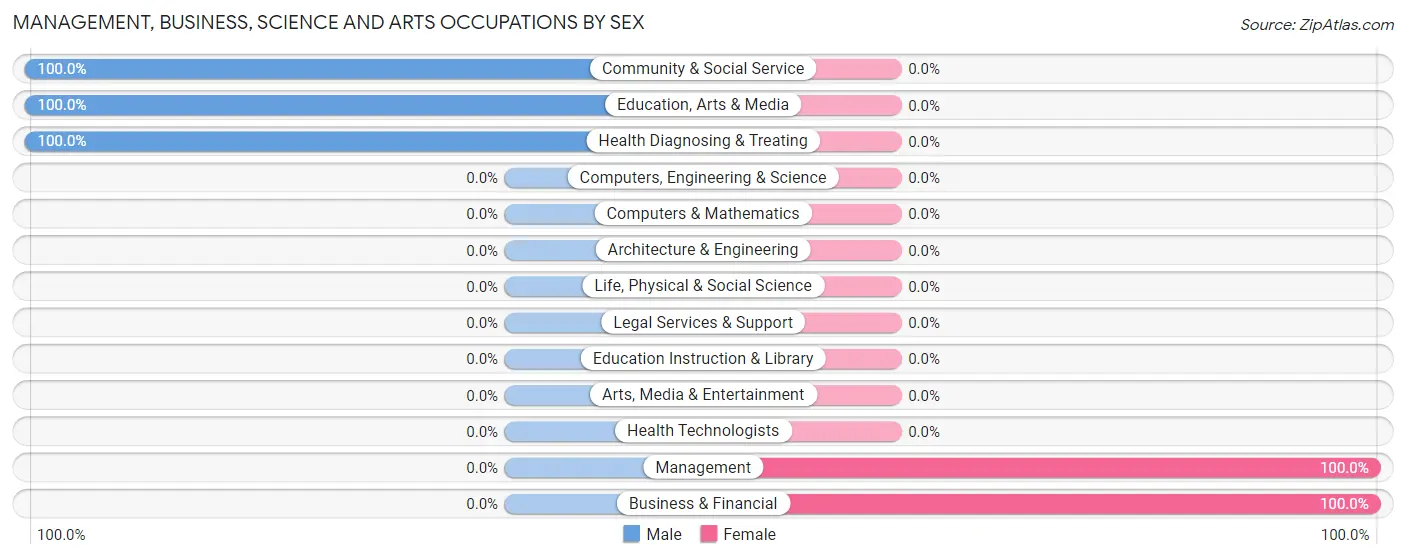
The most common Management, Business, Science and Arts occupations in Bradenville are Community & Social Service (16 | 12.1%), Education, Arts & Media (16 | 12.1%), Health Diagnosing & Treating (10 | 7.6%), Management (7 | 5.3%), and Business & Financial (6 | 4.5%).
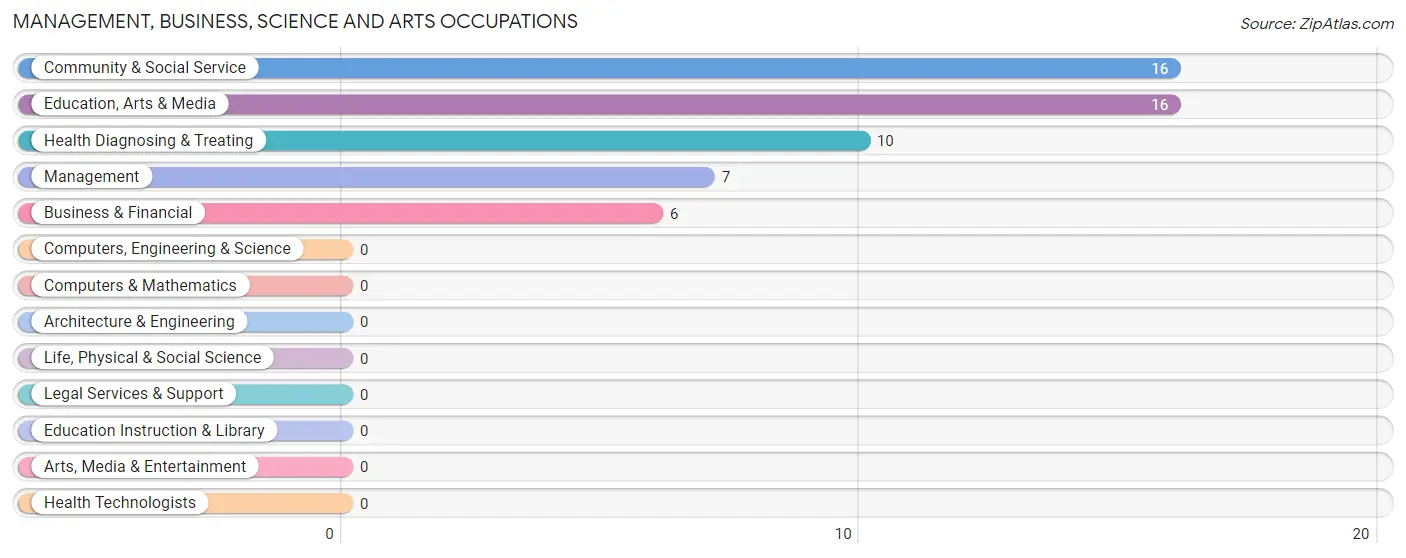
Management, Business, Science and Arts Occupations by Sex
Within the Management, Business, Science and Arts occupations in Bradenville, the most male-oriented occupations are Community & Social Service (100.0%), Education, Arts & Media (100.0%), and Health Diagnosing & Treating (100.0%), while the most female-oriented occupations are Management (100.0%), and Business & Financial (100.0%).
| Occupation | Male | Female |
| Management | 0 (0.0%) | 7 (100.0%) |
| Business & Financial | 0 (0.0%) | 6 (100.0%) |
| Computers, Engineering & Science | 0 (0.0%) | 0 (0.0%) |
| Computers & Mathematics | 0 (0.0%) | 0 (0.0%) |
| Architecture & Engineering | 0 (0.0%) | 0 (0.0%) |
| Life, Physical & Social Science | 0 (0.0%) | 0 (0.0%) |
| Community & Social Service | 16 (100.0%) | 0 (0.0%) |
| Education, Arts & Media | 16 (100.0%) | 0 (0.0%) |
| Legal Services & Support | 0 (0.0%) | 0 (0.0%) |
| Education Instruction & Library | 0 (0.0%) | 0 (0.0%) |
| Arts, Media & Entertainment | 0 (0.0%) | 0 (0.0%) |
| Health Diagnosing & Treating | 10 (100.0%) | 0 (0.0%) |
| Health Technologists | 0 (0.0%) | 0 (0.0%) |
| Total (Category) | 26 (66.7%) | 13 (33.3%) |
| Total (Overall) | 95 (72.0%) | 37 (28.0%) |
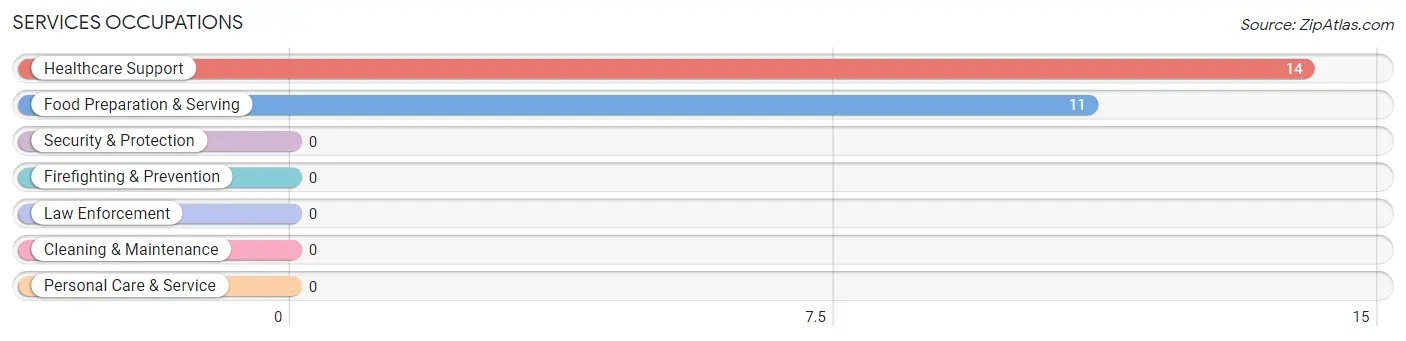
Services Occupations
The most common Services occupations in Bradenville are Healthcare Support (14 | 10.6%), and Food Preparation & Serving (11 | 8.3%).
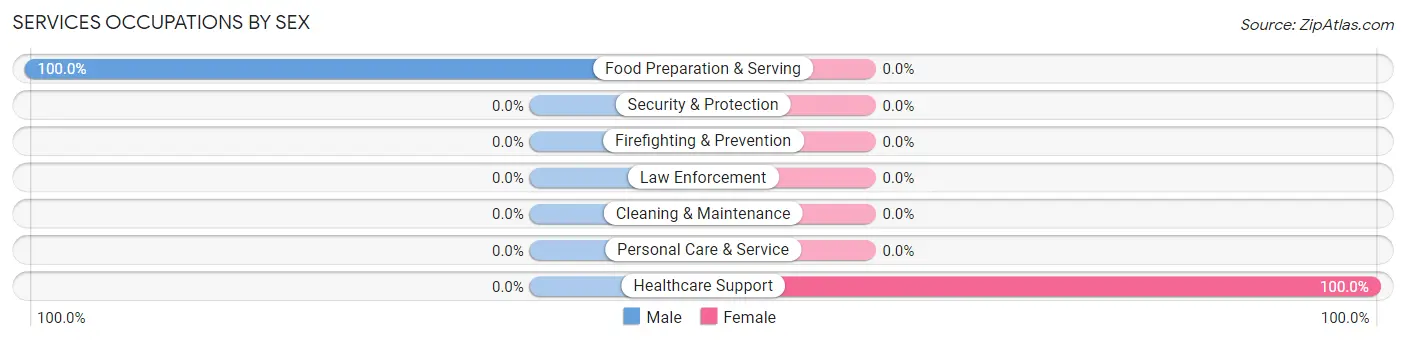
Services Occupations by Sex
| Occupation | Male | Female |
| Healthcare Support | 0 (0.0%) | 14 (100.0%) |
| Security & Protection | 0 (0.0%) | 0 (0.0%) |
| Firefighting & Prevention | 0 (0.0%) | 0 (0.0%) |
| Law Enforcement | 0 (0.0%) | 0 (0.0%) |
| Food Preparation & Serving | 11 (100.0%) | 0 (0.0%) |
| Cleaning & Maintenance | 0 (0.0%) | 0 (0.0%) |
| Personal Care & Service | 0 (0.0%) | 0 (0.0%) |
| Total (Category) | 11 (44.0%) | 14 (56.0%) |
| Total (Overall) | 95 (72.0%) | 37 (28.0%) |
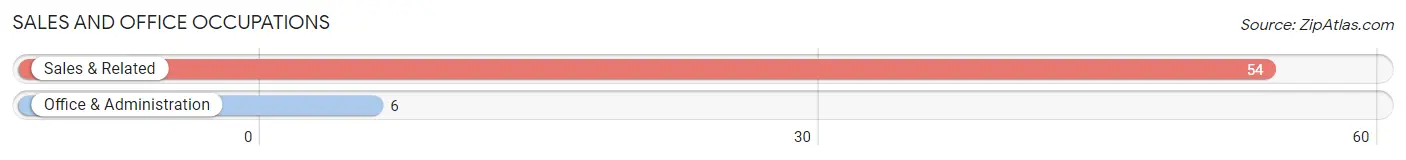
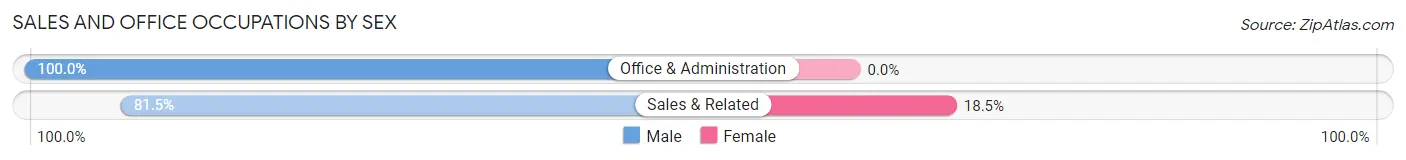
Sales and Office Occupations
The most common Sales and Office occupations in Bradenville are Sales & Related (54 | 40.9%), and Office & Administration (6 | 4.5%).
Sales and Office Occupations by Sex
| Occupation | Male | Female |
| Sales & Related | 44 (81.5%) | 10 (18.5%) |
| Office & Administration | 6 (100.0%) | 0 (0.0%) |
| Total (Category) | 50 (83.3%) | 10 (16.7%) |
| Total (Overall) | 95 (72.0%) | 37 (28.0%) |
Natural Resources, Construction and Maintenance Occupations
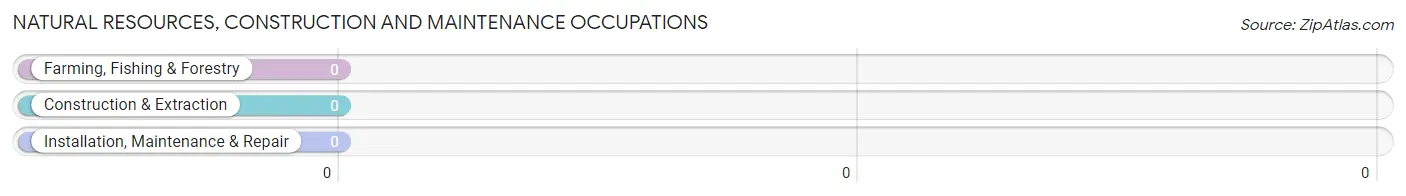
Natural Resources, Construction and Maintenance Occupations by Sex
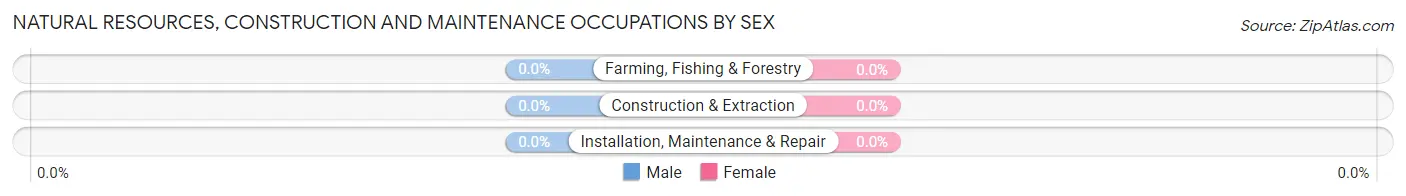
| Occupation | Male | Female |
| Farming, Fishing & Forestry | 0 (0.0%) | 0 (0.0%) |
| Construction & Extraction | 0 (0.0%) | 0 (0.0%) |
| Installation, Maintenance & Repair | 0 (0.0%) | 0 (0.0%) |
| Total (Category) | 0 (0.0%) | 0 (0.0%) |
| Total (Overall) | 95 (72.0%) | 37 (28.0%) |
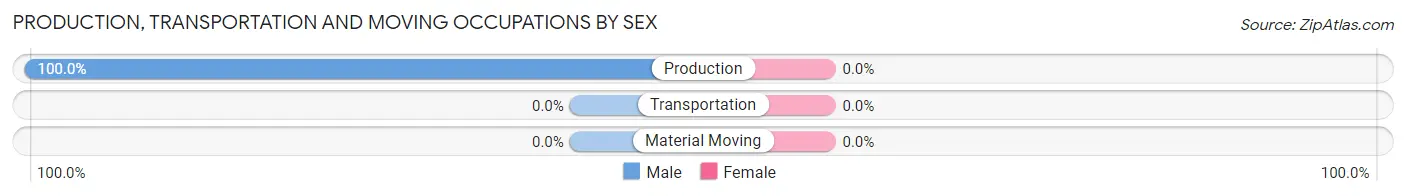
Production, Transportation and Moving Occupations
The most common Production, Transportation and Moving occupations in Bradenville are , and Production (8 | 6.1%).
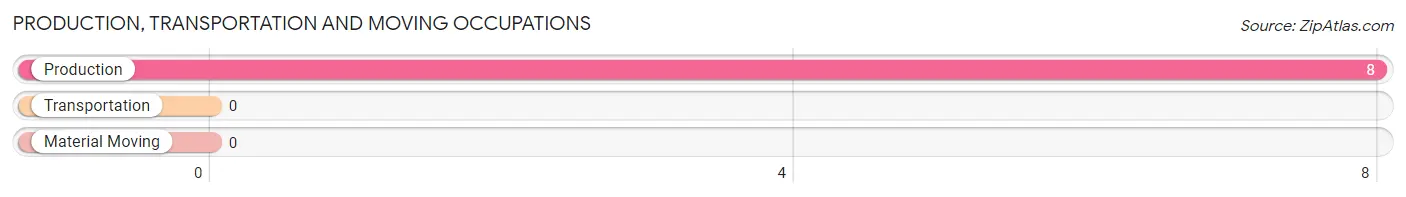
Production, Transportation and Moving Occupations by Sex
| Occupation | Male | Female |
| Production | 8 (100.0%) | 0 (0.0%) |
| Transportation | 0 (0.0%) | 0 (0.0%) |
| Material Moving | 0 (0.0%) | 0 (0.0%) |
| Total (Category) | 8 (100.0%) | 0 (0.0%) |
| Total (Overall) | 95 (72.0%) | 37 (28.0%) |
Employment Industries by Sex in Bradenville
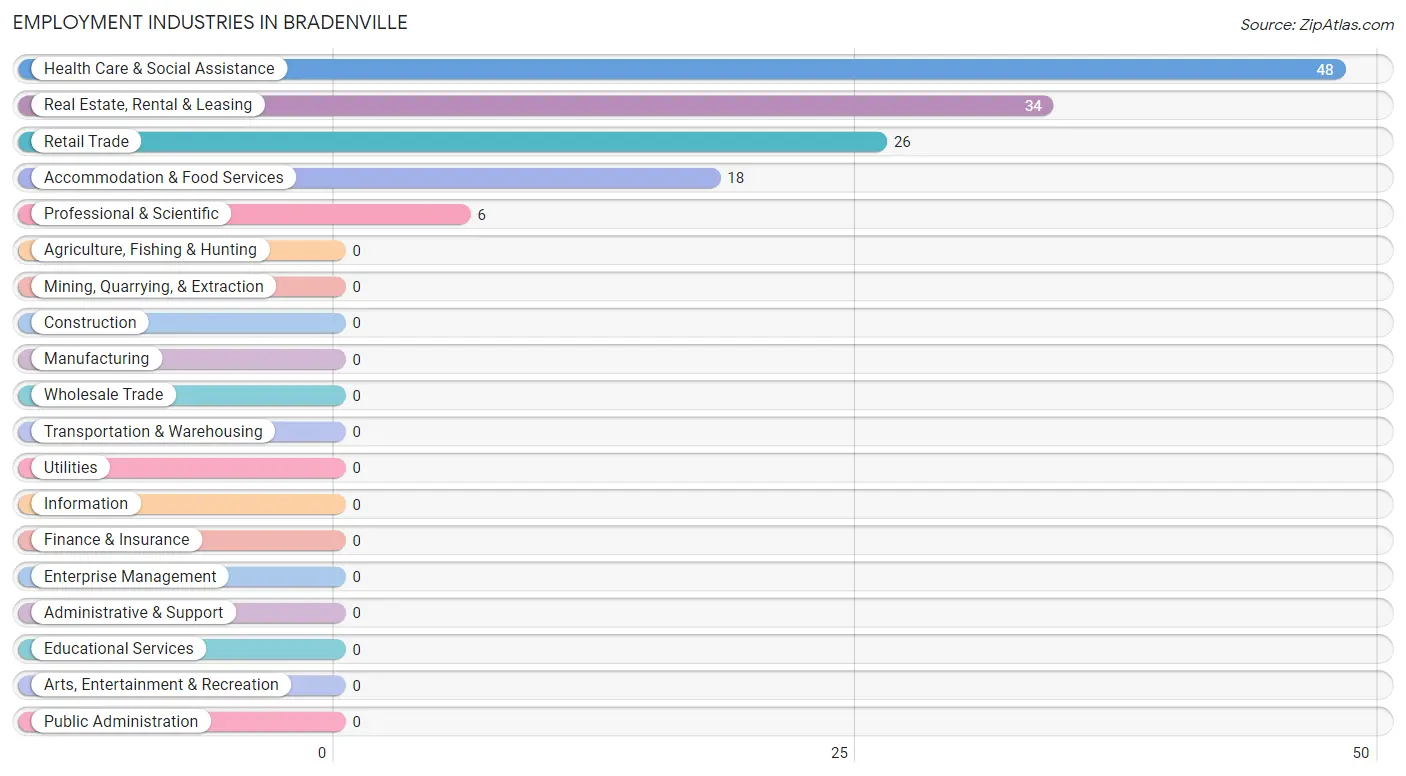
Employment Industries in Bradenville
The major employment industries in Bradenville include Health Care & Social Assistance (48 | 36.4%), Real Estate, Rental & Leasing (34 | 25.8%), Retail Trade (26 | 19.7%), Accommodation & Food Services (18 | 13.6%), and Professional & Scientific (6 | 4.5%).
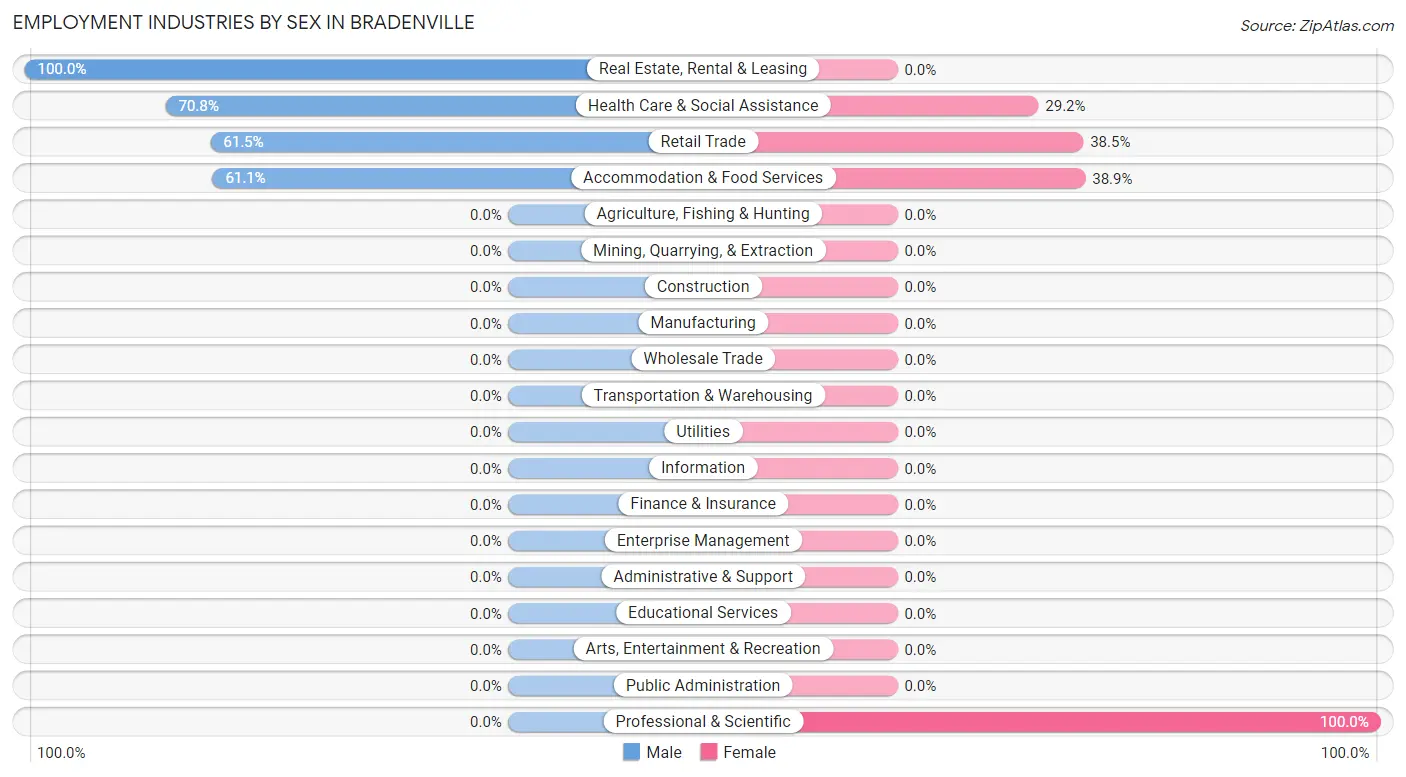
Employment Industries by Sex in Bradenville
The Bradenville industries that see more men than women are Real Estate, Rental & Leasing (100.0%), Health Care & Social Assistance (70.8%), and Retail Trade (61.5%), whereas the industries that tend to have a higher number of women are Professional & Scientific (100.0%), Accommodation & Food Services (38.9%), and Retail Trade (38.5%).
| Industry | Male | Female |
| Agriculture, Fishing & Hunting | 0 (0.0%) | 0 (0.0%) |
| Mining, Quarrying, & Extraction | 0 (0.0%) | 0 (0.0%) |
| Construction | 0 (0.0%) | 0 (0.0%) |
| Manufacturing | 0 (0.0%) | 0 (0.0%) |
| Wholesale Trade | 0 (0.0%) | 0 (0.0%) |
| Retail Trade | 16 (61.5%) | 10 (38.5%) |
| Transportation & Warehousing | 0 (0.0%) | 0 (0.0%) |
| Utilities | 0 (0.0%) | 0 (0.0%) |
| Information | 0 (0.0%) | 0 (0.0%) |
| Finance & Insurance | 0 (0.0%) | 0 (0.0%) |
| Real Estate, Rental & Leasing | 34 (100.0%) | 0 (0.0%) |
| Professional & Scientific | 0 (0.0%) | 6 (100.0%) |
| Enterprise Management | 0 (0.0%) | 0 (0.0%) |
| Administrative & Support | 0 (0.0%) | 0 (0.0%) |
| Educational Services | 0 (0.0%) | 0 (0.0%) |
| Health Care & Social Assistance | 34 (70.8%) | 14 (29.2%) |
| Arts, Entertainment & Recreation | 0 (0.0%) | 0 (0.0%) |
| Accommodation & Food Services | 11 (61.1%) | 7 (38.9%) |
| Public Administration | 0 (0.0%) | 0 (0.0%) |
| Total | 95 (72.0%) | 37 (28.0%) |
Education in Bradenville
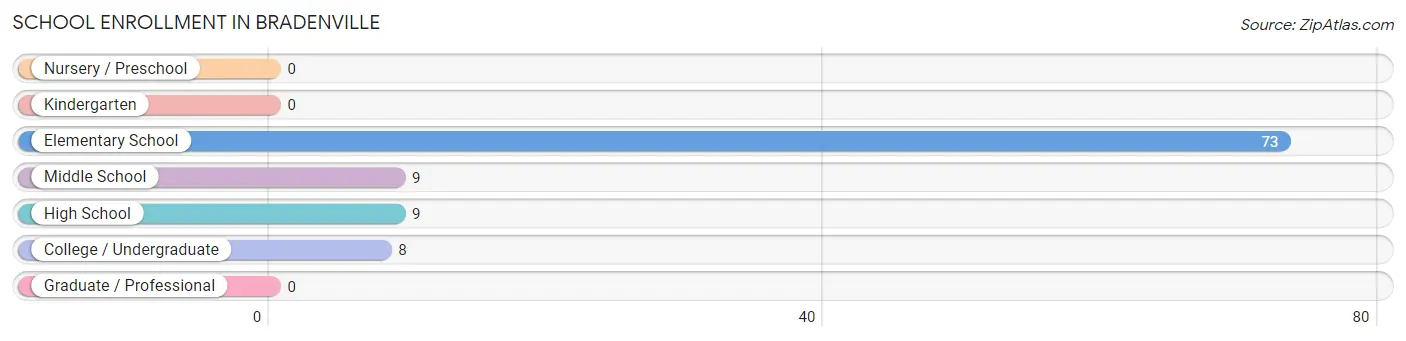
School Enrollment in Bradenville
The most common levels of schooling among the 99 students in Bradenville are elementary school (73 | 73.7%), middle school (9 | 9.1%), and high school (9 | 9.1%).
| School Level | # Students | % Students |
| Nursery / Preschool | 0 | 0.0% |
| Kindergarten | 0 | 0.0% |
| Elementary School | 73 | 73.7% |
| Middle School | 9 | 9.1% |
| High School | 9 | 9.1% |
| College / Undergraduate | 8 | 8.1% |
| Graduate / Professional | 0 | 0.0% |
| Total | 99 | 100.0% |
School Enrollment by Age by Funding Source in Bradenville
Out of a total of 99 students who are enrolled in schools in Bradenville, 73 (73.7%) attend a private institution, while the remaining 26 (26.3%) are enrolled in public schools. The age group of 5 to 9 year old has the highest likelihood of being enrolled in private schools, with 73 (100.0% in the age bracket) enrolled. Conversely, the age group of 10 to 14 year olds has the lowest likelihood of being enrolled in a private school, with 9 (100.0% in the age bracket) attending a public institution.
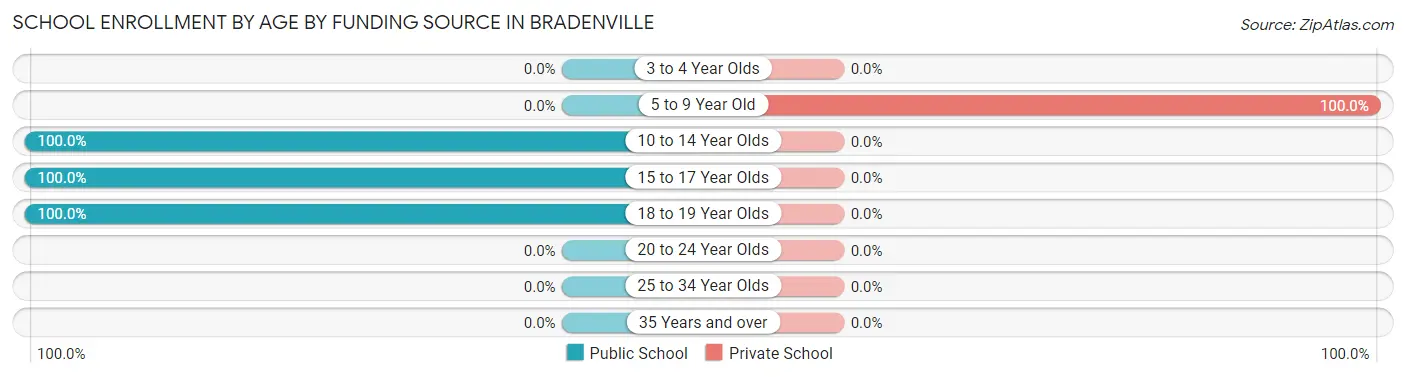
| Age Bracket | Public School | Private School |
| 3 to 4 Year Olds | 0 (0.0%) | 0 (0.0%) |
| 5 to 9 Year Old | 0 (0.0%) | 73 (100.0%) |
| 10 to 14 Year Olds | 9 (100.0%) | 0 (0.0%) |
| 15 to 17 Year Olds | 9 (100.0%) | 0 (0.0%) |
| 18 to 19 Year Olds | 8 (100.0%) | 0 (0.0%) |
| 20 to 24 Year Olds | 0 (0.0%) | 0 (0.0%) |
| 25 to 34 Year Olds | 0 (0.0%) | 0 (0.0%) |
| 35 Years and over | 0 (0.0%) | 0 (0.0%) |
| Total | 26 (26.3%) | 73 (73.7%) |
Educational Attainment by Field of Study in Bradenville
Education (34 | 54.0%), science & technology (16 | 25.4%), visual & performing arts (7 | 11.1%), and psychology (6 | 9.5%) are the most common fields of study among 63 individuals in Bradenville who have obtained a bachelor's degree or higher.
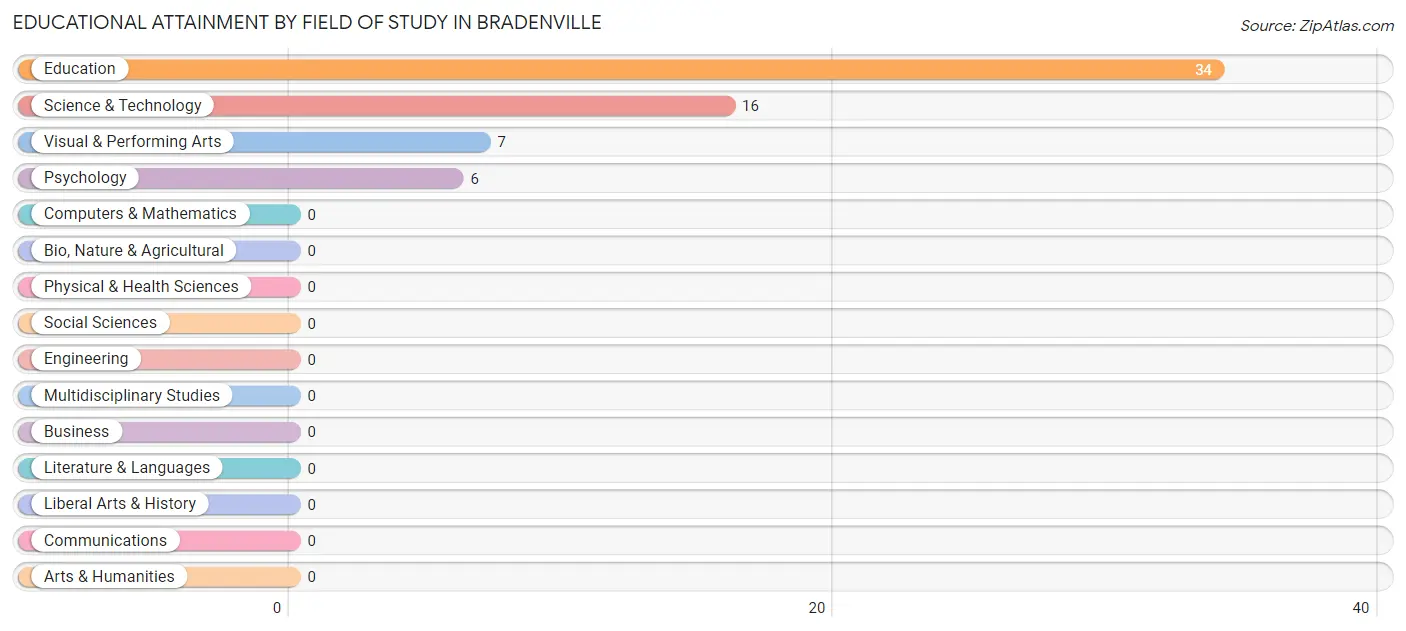
| Field of Study | # Graduates | % Graduates |
| Computers & Mathematics | 0 | 0.0% |
| Bio, Nature & Agricultural | 0 | 0.0% |
| Physical & Health Sciences | 0 | 0.0% |
| Psychology | 6 | 9.5% |
| Social Sciences | 0 | 0.0% |
| Engineering | 0 | 0.0% |
| Multidisciplinary Studies | 0 | 0.0% |
| Science & Technology | 16 | 25.4% |
| Business | 0 | 0.0% |
| Education | 34 | 54.0% |
| Literature & Languages | 0 | 0.0% |
| Liberal Arts & History | 0 | 0.0% |
| Visual & Performing Arts | 7 | 11.1% |
| Communications | 0 | 0.0% |
| Arts & Humanities | 0 | 0.0% |
| Total | 63 | 100.0% |
Transportation & Commute in Bradenville
Vehicle Availability by Sex in Bradenville
The most prevalent vehicle ownership categories in Bradenville are males with 2 vehicles (79, accounting for 83.2%) and females with 2 vehicles (0, making up 213.5%).
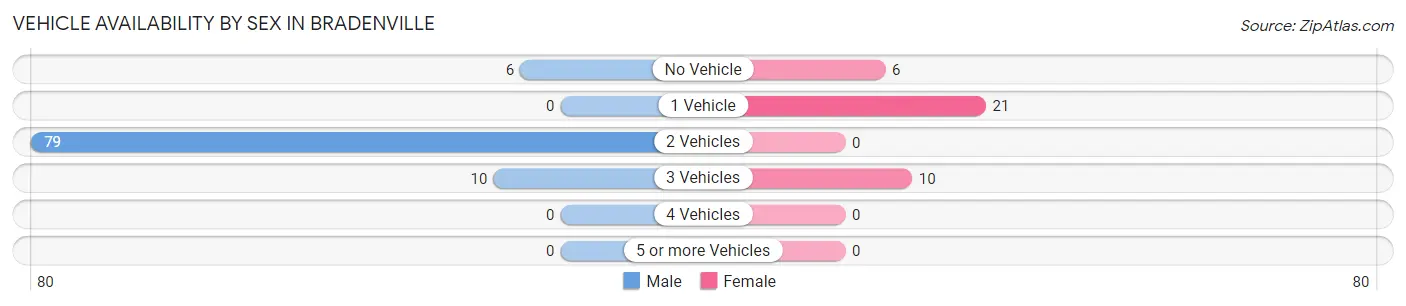
| Vehicles Available | Male | Female |
| No Vehicle | 6 (6.3%) | 6 (16.2%) |
| 1 Vehicle | 0 (0.0%) | 21 (56.8%) |
| 2 Vehicles | 79 (83.2%) | 0 (0.0%) |
| 3 Vehicles | 10 (10.5%) | 10 (27.0%) |
| 4 Vehicles | 0 (0.0%) | 0 (0.0%) |
| 5 or more Vehicles | 0 (0.0%) | 0 (0.0%) |
| Total | 95 (100.0%) | 37 (100.0%) |
Commute Time in Bradenville
The most frequently occuring commute durations in Bradenville are 40 to 44 minutes (34 commuters, 27.0%), 20 to 24 minutes (24 commuters, 19.1%), and less than 5 minutes (22 commuters, 17.5%).
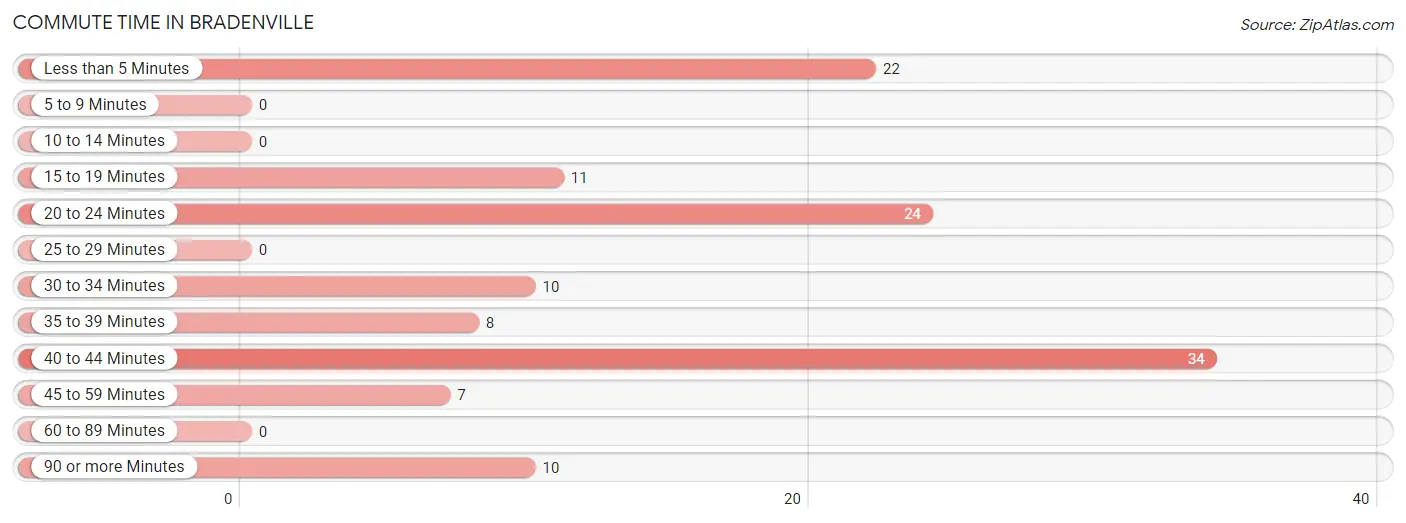
| Commute Time | # Commuters | % Commuters |
| Less than 5 Minutes | 22 | 17.5% |
| 5 to 9 Minutes | 0 | 0.0% |
| 10 to 14 Minutes | 0 | 0.0% |
| 15 to 19 Minutes | 11 | 8.7% |
| 20 to 24 Minutes | 24 | 19.1% |
| 25 to 29 Minutes | 0 | 0.0% |
| 30 to 34 Minutes | 10 | 7.9% |
| 35 to 39 Minutes | 8 | 6.4% |
| 40 to 44 Minutes | 34 | 27.0% |
| 45 to 59 Minutes | 7 | 5.6% |
| 60 to 89 Minutes | 0 | 0.0% |
| 90 or more Minutes | 10 | 7.9% |
Commute Time by Sex in Bradenville
The most common commute times in Bradenville are 40 to 44 minutes (34 commuters, 38.2%) for males and 20 to 24 minutes (14 commuters, 37.8%) for females.
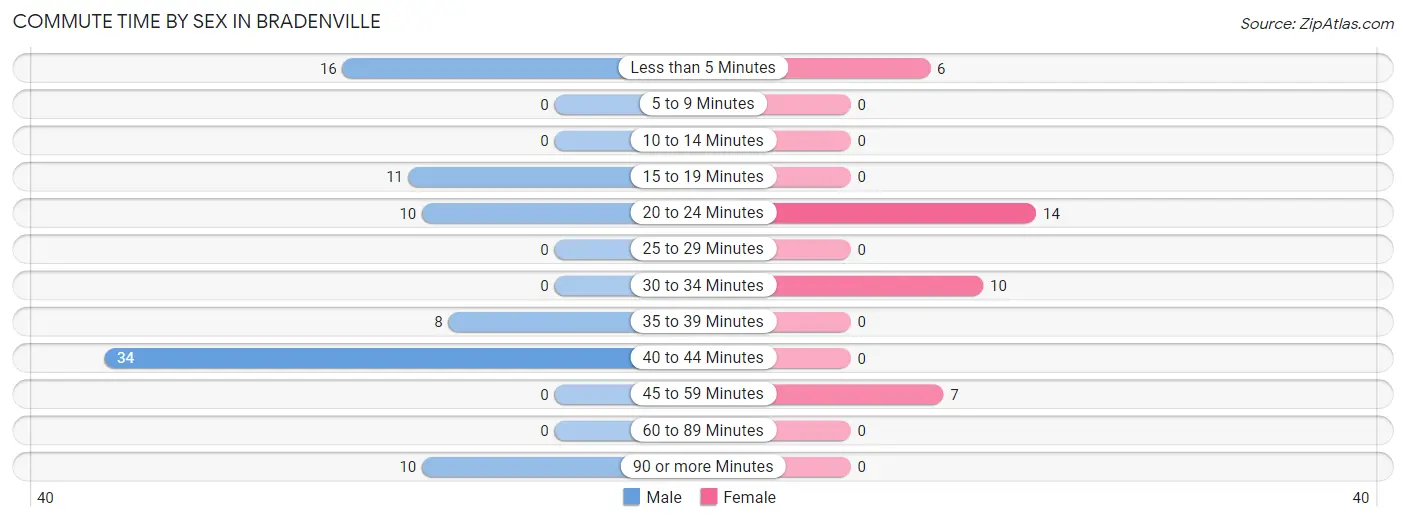
| Commute Time | Male | Female |
| Less than 5 Minutes | 16 (18.0%) | 6 (16.2%) |
| 5 to 9 Minutes | 0 (0.0%) | 0 (0.0%) |
| 10 to 14 Minutes | 0 (0.0%) | 0 (0.0%) |
| 15 to 19 Minutes | 11 (12.4%) | 0 (0.0%) |
| 20 to 24 Minutes | 10 (11.2%) | 14 (37.8%) |
| 25 to 29 Minutes | 0 (0.0%) | 0 (0.0%) |
| 30 to 34 Minutes | 0 (0.0%) | 10 (27.0%) |
| 35 to 39 Minutes | 8 (9.0%) | 0 (0.0%) |
| 40 to 44 Minutes | 34 (38.2%) | 0 (0.0%) |
| 45 to 59 Minutes | 0 (0.0%) | 7 (18.9%) |
| 60 to 89 Minutes | 0 (0.0%) | 0 (0.0%) |
| 90 or more Minutes | 10 (11.2%) | 0 (0.0%) |
Time of Departure to Work by Sex in Bradenville
The most frequent times of departure to work in Bradenville are 7:30 AM to 7:59 AM (34, 38.2%) for males and 5:30 AM to 5:59 AM (14, 37.8%) for females.
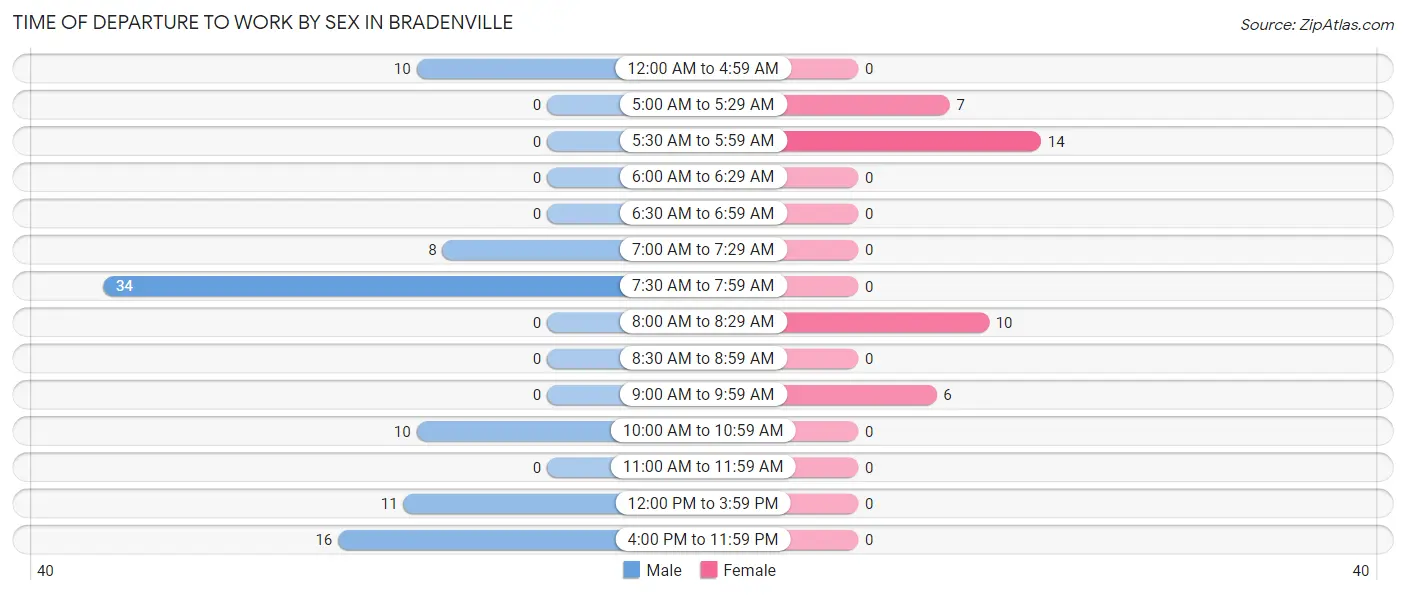
| Time of Departure | Male | Female |
| 12:00 AM to 4:59 AM | 10 (11.2%) | 0 (0.0%) |
| 5:00 AM to 5:29 AM | 0 (0.0%) | 7 (18.9%) |
| 5:30 AM to 5:59 AM | 0 (0.0%) | 14 (37.8%) |
| 6:00 AM to 6:29 AM | 0 (0.0%) | 0 (0.0%) |
| 6:30 AM to 6:59 AM | 0 (0.0%) | 0 (0.0%) |
| 7:00 AM to 7:29 AM | 8 (9.0%) | 0 (0.0%) |
| 7:30 AM to 7:59 AM | 34 (38.2%) | 0 (0.0%) |
| 8:00 AM to 8:29 AM | 0 (0.0%) | 10 (27.0%) |
| 8:30 AM to 8:59 AM | 0 (0.0%) | 0 (0.0%) |
| 9:00 AM to 9:59 AM | 0 (0.0%) | 6 (16.2%) |
| 10:00 AM to 10:59 AM | 10 (11.2%) | 0 (0.0%) |
| 11:00 AM to 11:59 AM | 0 (0.0%) | 0 (0.0%) |
| 12:00 PM to 3:59 PM | 11 (12.4%) | 0 (0.0%) |
| 4:00 PM to 11:59 PM | 16 (18.0%) | 0 (0.0%) |
| Total | 89 (100.0%) | 37 (100.0%) |
Housing Occupancy in Bradenville
Occupancy by Ownership in Bradenville
Of the total 159 dwellings in Bradenville, owner-occupied units account for 122 (76.7%), while renter-occupied units make up 37 (23.3%).
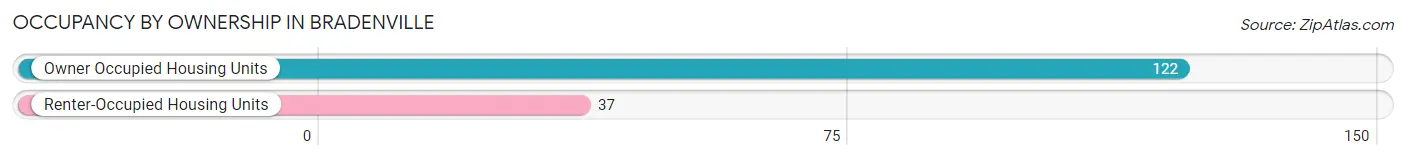
| Occupancy | # Housing Units | % Housing Units |
| Owner Occupied Housing Units | 122 | 76.7% |
| Renter-Occupied Housing Units | 37 | 23.3% |
| Total Occupied Housing Units | 159 | 100.0% |
Occupancy by Household Size in Bradenville
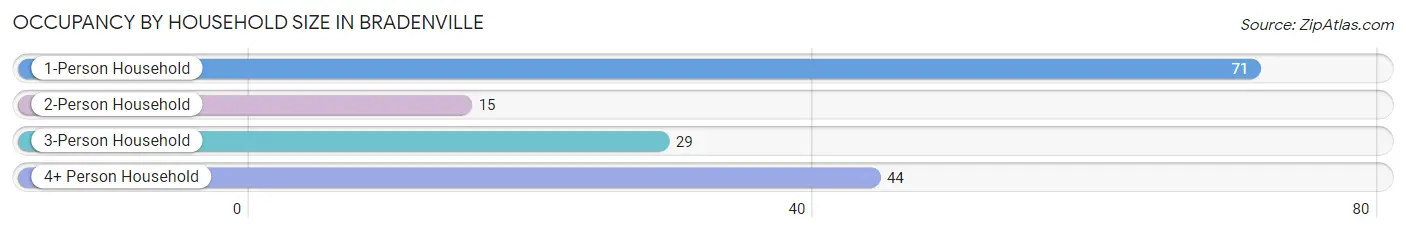
| Household Size | # Housing Units | % Housing Units |
| 1-Person Household | 71 | 44.7% |
| 2-Person Household | 15 | 9.4% |
| 3-Person Household | 29 | 18.2% |
| 4+ Person Household | 44 | 27.7% |
| Total Housing Units | 159 | 100.0% |
Occupancy by Ownership by Household Size in Bradenville
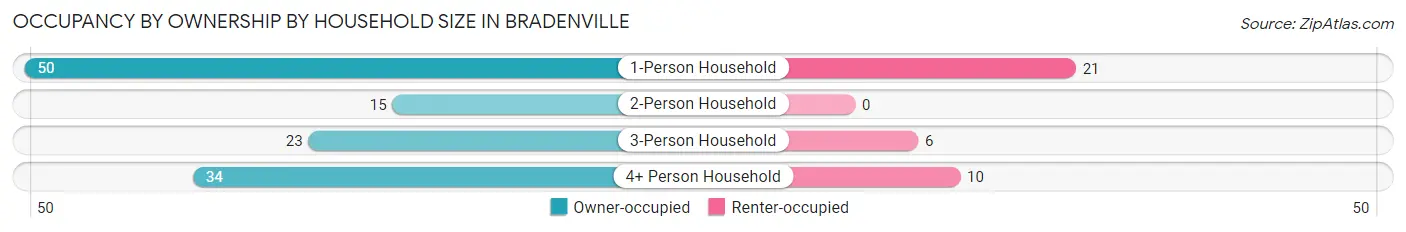
| Household Size | Owner-occupied | Renter-occupied |
| 1-Person Household | 50 (70.4%) | 21 (29.6%) |
| 2-Person Household | 15 (100.0%) | 0 (0.0%) |
| 3-Person Household | 23 (79.3%) | 6 (20.7%) |
| 4+ Person Household | 34 (77.3%) | 10 (22.7%) |
| Total Housing Units | 122 (76.7%) | 37 (23.3%) |
Occupancy by Educational Attainment in Bradenville
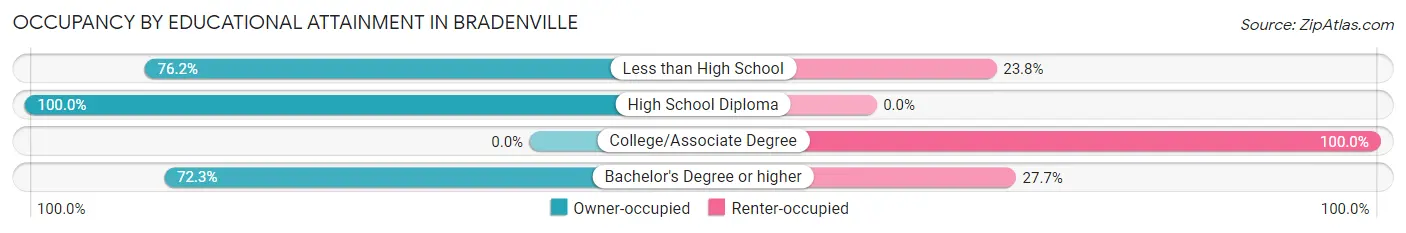
| Household Size | Owner-occupied | Renter-occupied |
| Less than High School | 32 (76.2%) | 10 (23.8%) |
| High School Diploma | 56 (100.0%) | 0 (0.0%) |
| College/Associate Degree | 0 (0.0%) | 14 (100.0%) |
| Bachelor's Degree or higher | 34 (72.3%) | 13 (27.7%) |
Occupancy by Age of Householder in Bradenville
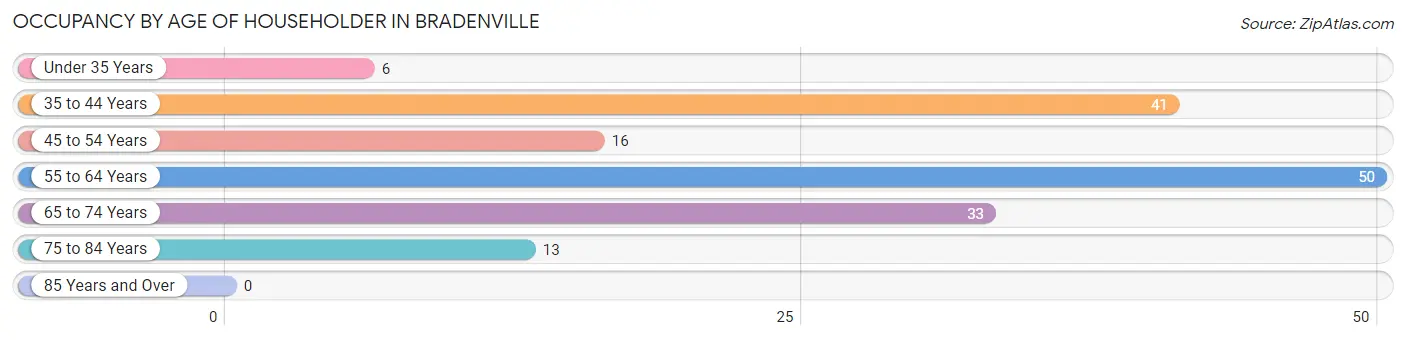
| Age Bracket | # Households | % Households |
| Under 35 Years | 6 | 3.8% |
| 35 to 44 Years | 41 | 25.8% |
| 45 to 54 Years | 16 | 10.1% |
| 55 to 64 Years | 50 | 31.5% |
| 65 to 74 Years | 33 | 20.7% |
| 75 to 84 Years | 13 | 8.2% |
| 85 Years and Over | 0 | 0.0% |
| Total | 159 | 100.0% |
Housing Finances in Bradenville
Median Income by Occupancy in Bradenville
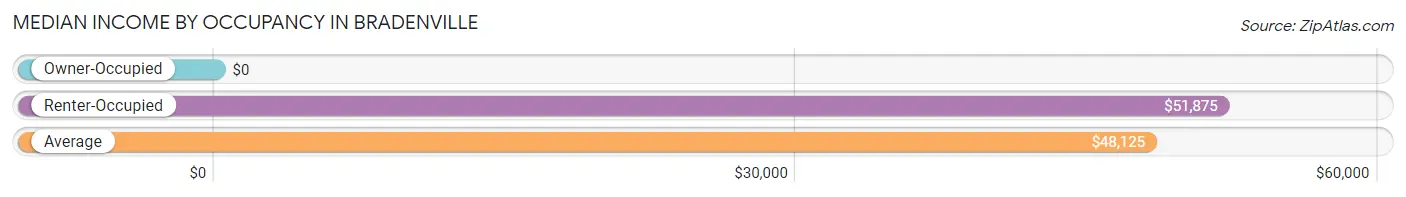
| Occupancy Type | # Households | Median Income |
| Owner-Occupied | 122 (76.7%) | $0 |
| Renter-Occupied | 37 (23.3%) | $51,875 |
| Average | 159 (100.0%) | $48,125 |
Occupancy by Householder Income Bracket in Bradenville
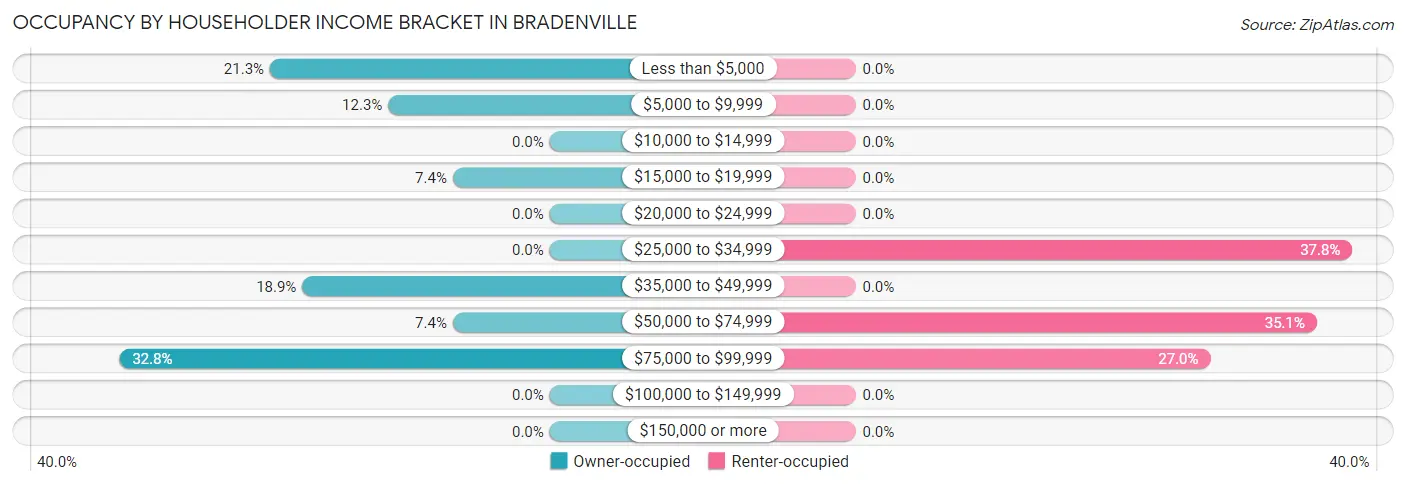
| Income Bracket | Owner-occupied | Renter-occupied |
| Less than $5,000 | 26 (21.3%) | 0 (0.0%) |
| $5,000 to $9,999 | 15 (12.3%) | 0 (0.0%) |
| $10,000 to $14,999 | 0 (0.0%) | 0 (0.0%) |
| $15,000 to $19,999 | 9 (7.4%) | 0 (0.0%) |
| $20,000 to $24,999 | 0 (0.0%) | 0 (0.0%) |
| $25,000 to $34,999 | 0 (0.0%) | 14 (37.8%) |
| $35,000 to $49,999 | 23 (18.9%) | 0 (0.0%) |
| $50,000 to $74,999 | 9 (7.4%) | 13 (35.1%) |
| $75,000 to $99,999 | 40 (32.8%) | 10 (27.0%) |
| $100,000 to $149,999 | 0 (0.0%) | 0 (0.0%) |
| $150,000 or more | 0 (0.0%) | 0 (0.0%) |
| Total | 122 (100.0%) | 37 (100.0%) |
Monthly Housing Cost Tiers in Bradenville
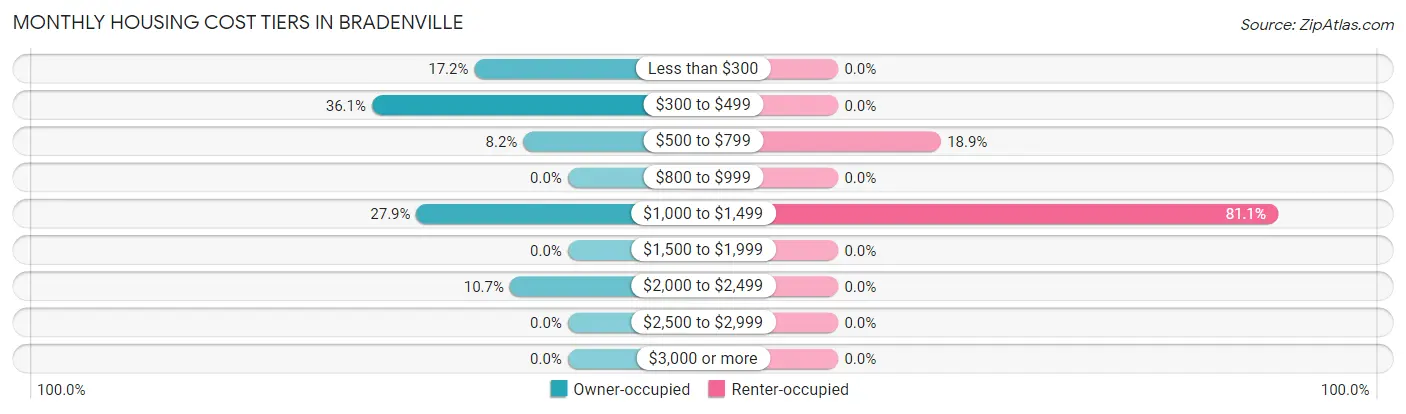
| Monthly Cost | Owner-occupied | Renter-occupied |
| Less than $300 | 21 (17.2%) | 0 (0.0%) |
| $300 to $499 | 44 (36.1%) | 0 (0.0%) |
| $500 to $799 | 10 (8.2%) | 7 (18.9%) |
| $800 to $999 | 0 (0.0%) | 0 (0.0%) |
| $1,000 to $1,499 | 34 (27.9%) | 30 (81.1%) |
| $1,500 to $1,999 | 0 (0.0%) | 0 (0.0%) |
| $2,000 to $2,499 | 13 (10.7%) | 0 (0.0%) |
| $2,500 to $2,999 | 0 (0.0%) | 0 (0.0%) |
| $3,000 or more | 0 (0.0%) | 0 (0.0%) |
| Total | 122 (100.0%) | 37 (100.0%) |
Physical Housing Characteristics in Bradenville
Housing Structures in Bradenville
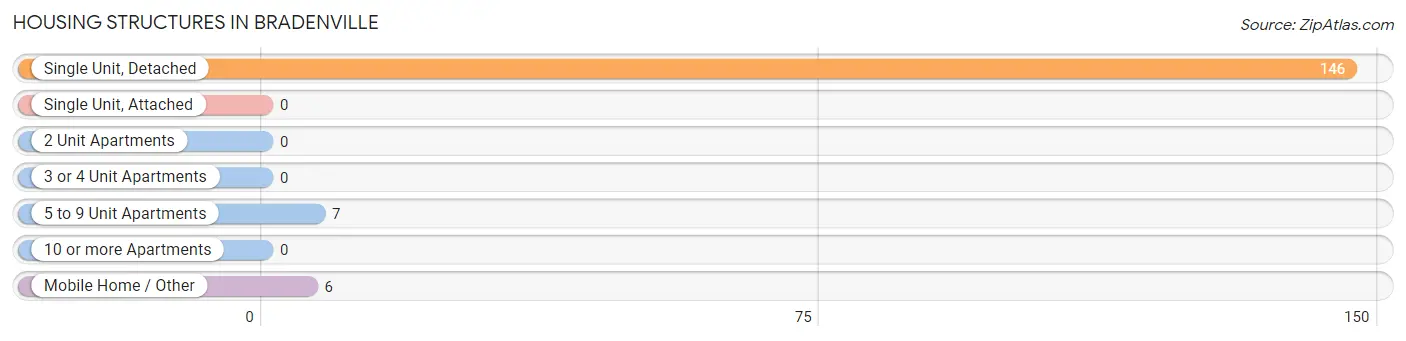
| Structure Type | # Housing Units | % Housing Units |
| Single Unit, Detached | 146 | 91.8% |
| Single Unit, Attached | 0 | 0.0% |
| 2 Unit Apartments | 0 | 0.0% |
| 3 or 4 Unit Apartments | 0 | 0.0% |
| 5 to 9 Unit Apartments | 7 | 4.4% |
| 10 or more Apartments | 0 | 0.0% |
| Mobile Home / Other | 6 | 3.8% |
| Total | 159 | 100.0% |
Housing Structures by Occupancy in Bradenville
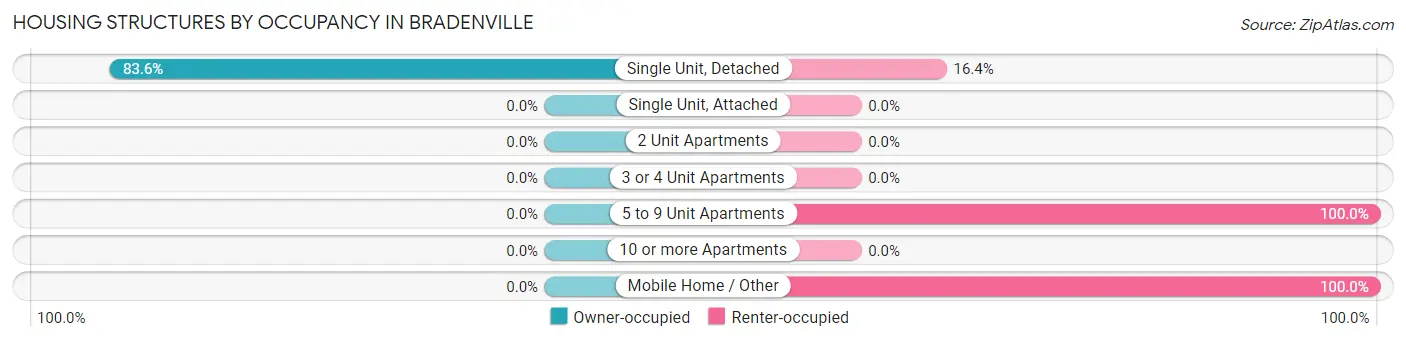
| Structure Type | Owner-occupied | Renter-occupied |
| Single Unit, Detached | 122 (83.6%) | 24 (16.4%) |
| Single Unit, Attached | 0 (0.0%) | 0 (0.0%) |
| 2 Unit Apartments | 0 (0.0%) | 0 (0.0%) |
| 3 or 4 Unit Apartments | 0 (0.0%) | 0 (0.0%) |
| 5 to 9 Unit Apartments | 0 (0.0%) | 7 (100.0%) |
| 10 or more Apartments | 0 (0.0%) | 0 (0.0%) |
| Mobile Home / Other | 0 (0.0%) | 6 (100.0%) |
| Total | 122 (76.7%) | 37 (23.3%) |
Housing Structures by Number of Rooms in Bradenville
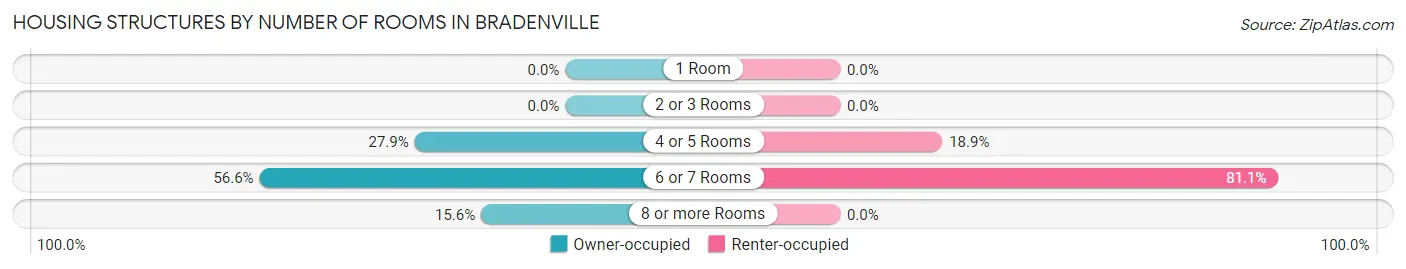
| Number of Rooms | Owner-occupied | Renter-occupied |
| 1 Room | 0 (0.0%) | 0 (0.0%) |
| 2 or 3 Rooms | 0 (0.0%) | 0 (0.0%) |
| 4 or 5 Rooms | 34 (27.9%) | 7 (18.9%) |
| 6 or 7 Rooms | 69 (56.6%) | 30 (81.1%) |
| 8 or more Rooms | 19 (15.6%) | 0 (0.0%) |
| Total | 122 (100.0%) | 37 (100.0%) |
Housing Structure by Heating Type in Bradenville
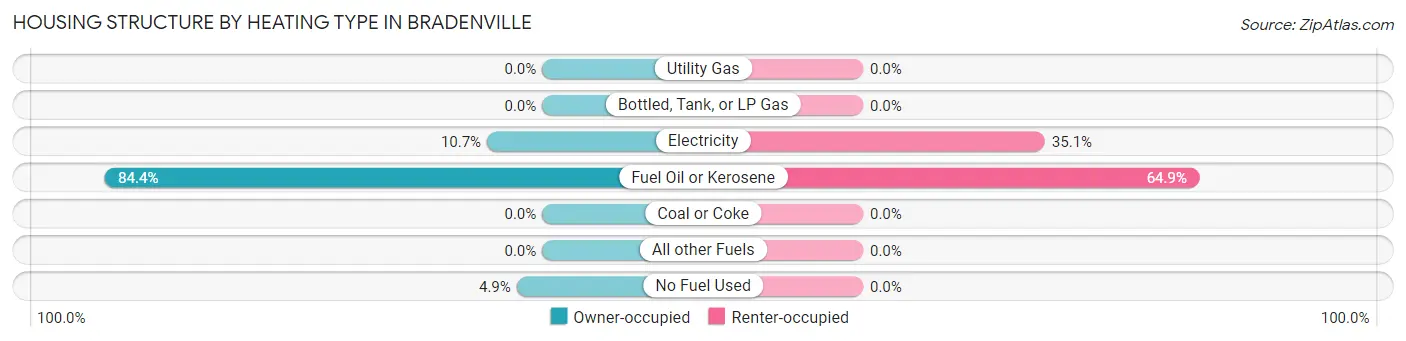
| Heating Type | Owner-occupied | Renter-occupied |
| Utility Gas | 0 (0.0%) | 0 (0.0%) |
| Bottled, Tank, or LP Gas | 0 (0.0%) | 0 (0.0%) |
| Electricity | 13 (10.7%) | 13 (35.1%) |
| Fuel Oil or Kerosene | 103 (84.4%) | 24 (64.9%) |
| Coal or Coke | 0 (0.0%) | 0 (0.0%) |
| All other Fuels | 0 (0.0%) | 0 (0.0%) |
| No Fuel Used | 6 (4.9%) | 0 (0.0%) |
| Total | 122 (100.0%) | 37 (100.0%) |
Household Vehicle Usage in Bradenville
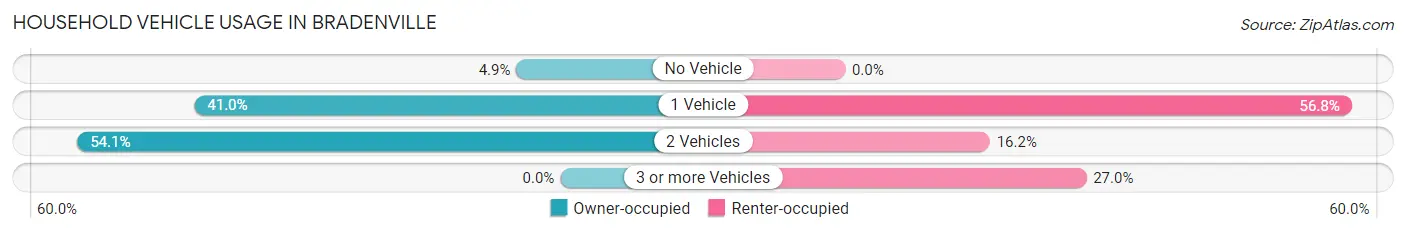
| Vehicles per Household | Owner-occupied | Renter-occupied |
| No Vehicle | 6 (4.9%) | 0 (0.0%) |
| 1 Vehicle | 50 (41.0%) | 21 (56.8%) |
| 2 Vehicles | 66 (54.1%) | 6 (16.2%) |
| 3 or more Vehicles | 0 (0.0%) | 10 (27.0%) |
| Total | 122 (100.0%) | 37 (100.0%) |
Real Estate & Mortgages in Bradenville
Real Estate and Mortgage Overview in Bradenville
| Characteristic | Without Mortgage | With Mortgage |
| Housing Units | 65 | 57 |
| Median Property Value | $112,500 | $163,600 |
| Median Household Income | - | - |
| Monthly Housing Costs | $322 | $0 |
| Real Estate Taxes | $842 | $0 |
Property Value by Mortgage Status in Bradenville
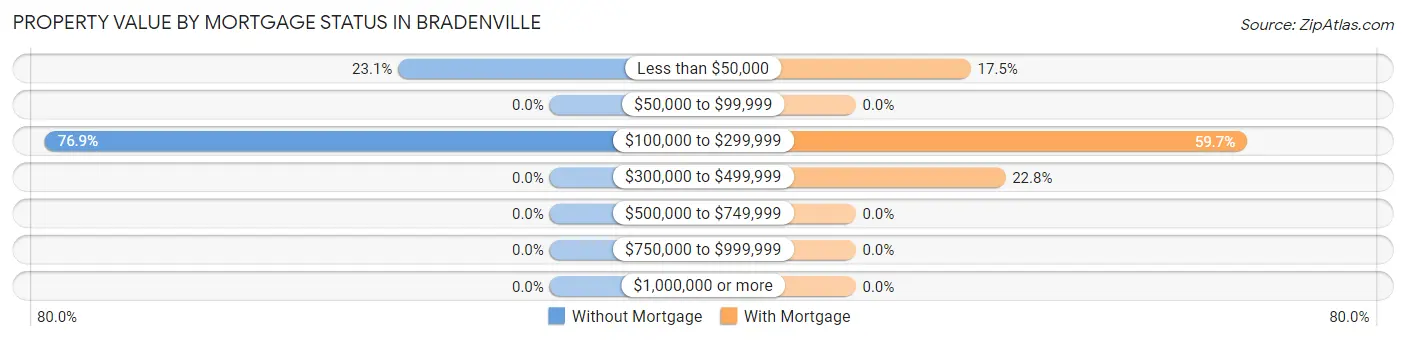
| Property Value | Without Mortgage | With Mortgage |
| Less than $50,000 | 15 (23.1%) | 10 (17.5%) |
| $50,000 to $99,999 | 0 (0.0%) | 0 (0.0%) |
| $100,000 to $299,999 | 50 (76.9%) | 34 (59.7%) |
| $300,000 to $499,999 | 0 (0.0%) | 13 (22.8%) |
| $500,000 to $749,999 | 0 (0.0%) | 0 (0.0%) |
| $750,000 to $999,999 | 0 (0.0%) | 0 (0.0%) |
| $1,000,000 or more | 0 (0.0%) | 0 (0.0%) |
| Total | 65 (100.0%) | 57 (100.0%) |
Household Income by Mortgage Status in Bradenville
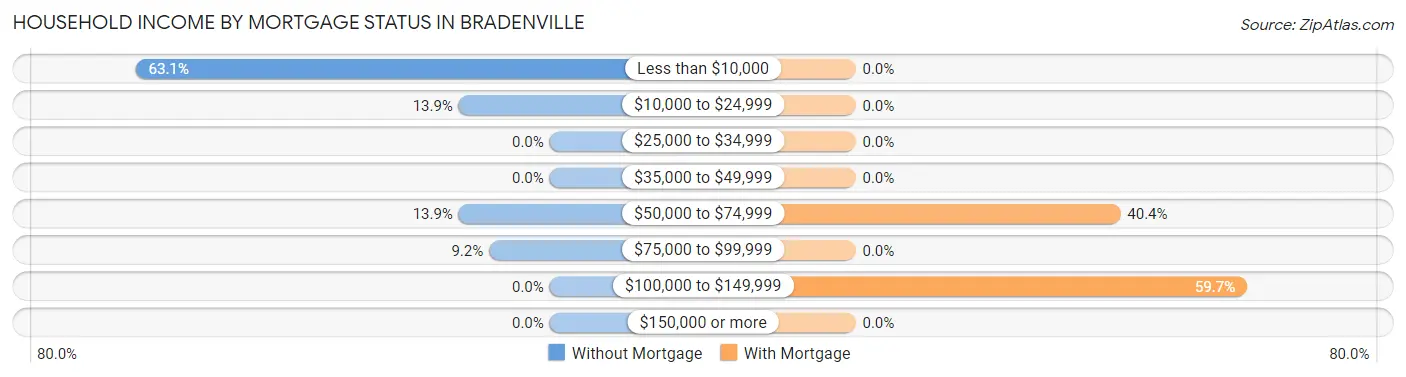
| Household Income | Without Mortgage | With Mortgage |
| Less than $10,000 | 41 (63.1%) | 0 (0.0%) |
| $10,000 to $24,999 | 9 (13.9%) | 0 (0.0%) |
| $25,000 to $34,999 | 0 (0.0%) | 0 (0.0%) |
| $35,000 to $49,999 | 0 (0.0%) | 0 (0.0%) |
| $50,000 to $74,999 | 9 (13.9%) | 23 (40.4%) |
| $75,000 to $99,999 | 6 (9.2%) | 0 (0.0%) |
| $100,000 to $149,999 | 0 (0.0%) | 34 (59.7%) |
| $150,000 or more | 0 (0.0%) | 0 (0.0%) |
| Total | 65 (100.0%) | 57 (100.0%) |
Property Value to Household Income Ratio in Bradenville
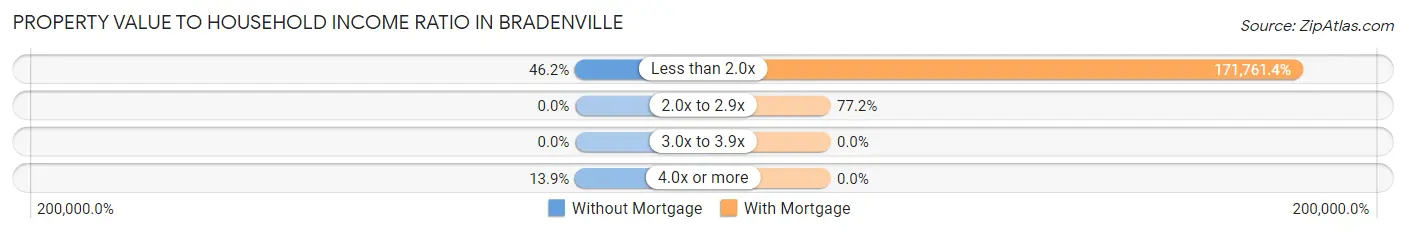
| Value-to-Income Ratio | Without Mortgage | With Mortgage |
| Less than 2.0x | 30 (46.2%) | 97,904 (171,761.4%) |
| 2.0x to 2.9x | 0 (0.0%) | 44 (77.2%) |
| 3.0x to 3.9x | 0 (0.0%) | 0 (0.0%) |
| 4.0x or more | 9 (13.9%) | 0 (0.0%) |
| Total | 65 (100.0%) | 57 (100.0%) |
Real Estate Taxes by Mortgage Status in Bradenville
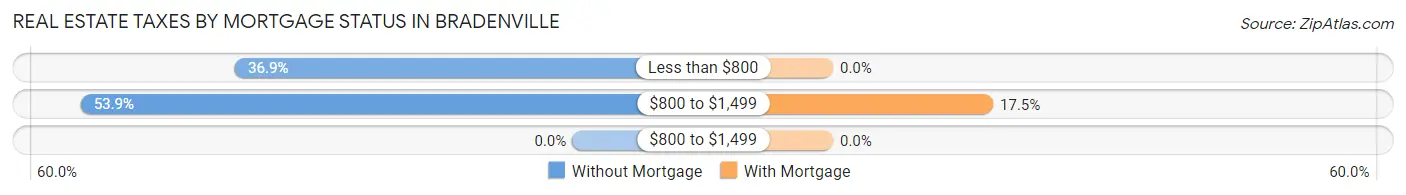
| Property Taxes | Without Mortgage | With Mortgage |
| Less than $800 | 24 (36.9%) | 0 (0.0%) |
| $800 to $1,499 | 35 (53.8%) | 10 (17.5%) |
| $800 to $1,499 | 0 (0.0%) | 0 (0.0%) |
| Total | 65 (100.0%) | 57 (100.0%) |
Health & Disability in Bradenville
Health Insurance Coverage by Age in Bradenville
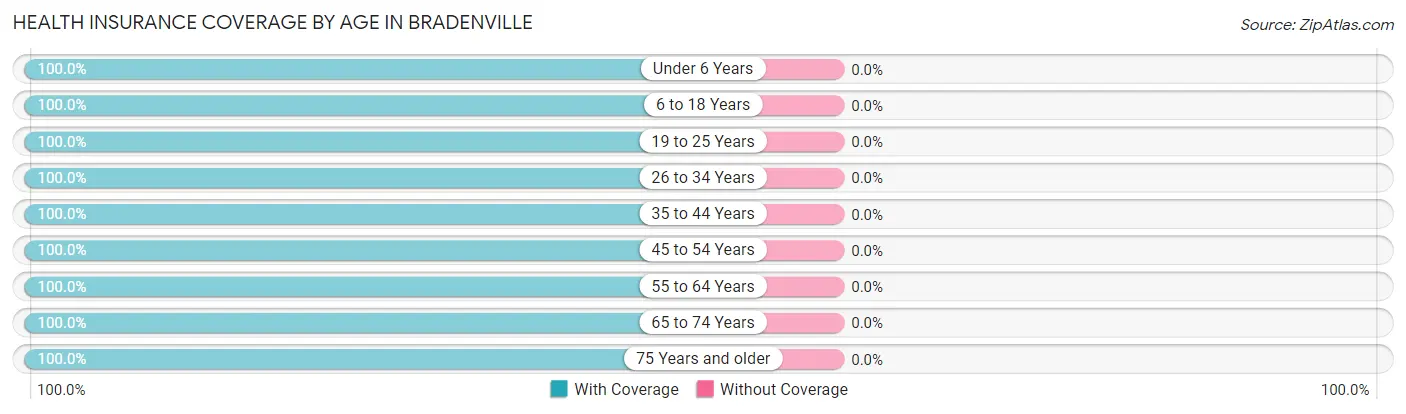
| Age Bracket | With Coverage | Without Coverage |
| Under 6 Years | 83 (100.0%) | 0 (0.0%) |
| 6 to 18 Years | 56 (100.0%) | 0 (0.0%) |
| 19 to 25 Years | 8 (100.0%) | 0 (0.0%) |
| 26 to 34 Years | 12 (100.0%) | 0 (0.0%) |
| 35 to 44 Years | 96 (100.0%) | 0 (0.0%) |
| 45 to 54 Years | 40 (100.0%) | 0 (0.0%) |
| 55 to 64 Years | 99 (100.0%) | 0 (0.0%) |
| 65 to 74 Years | 42 (100.0%) | 0 (0.0%) |
| 75 Years and older | 13 (100.0%) | 0 (0.0%) |
| Total | 449 (100.0%) | 0 (0.0%) |
Health Insurance Coverage by Citizenship Status in Bradenville
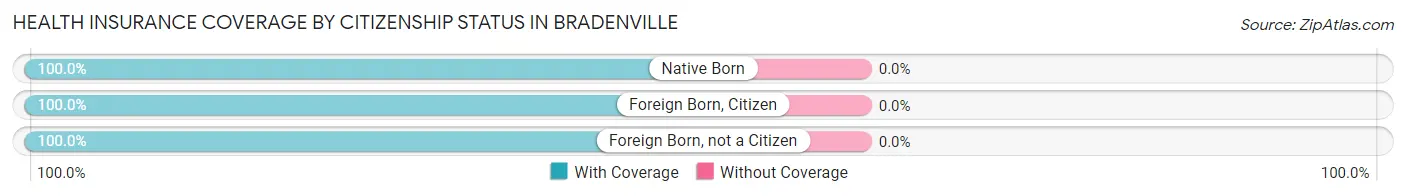
| Citizenship Status | With Coverage | Without Coverage |
| Native Born | 83 (100.0%) | 0 (0.0%) |
| Foreign Born, Citizen | 56 (100.0%) | 0 (0.0%) |
| Foreign Born, not a Citizen | 8 (100.0%) | 0 (0.0%) |
Health Insurance Coverage by Household Income in Bradenville
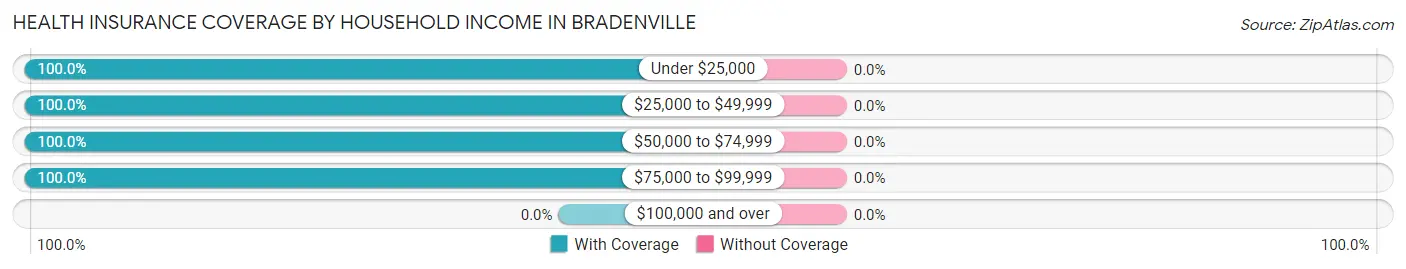
| Household Income | With Coverage | Without Coverage |
| Under $25,000 | 50 (100.0%) | 0 (0.0%) |
| $25,000 to $49,999 | 89 (100.0%) | 0 (0.0%) |
| $50,000 to $74,999 | 47 (100.0%) | 0 (0.0%) |
| $75,000 to $99,999 | 263 (100.0%) | 0 (0.0%) |
| $100,000 and over | 0 (0.0%) | 0 (0.0%) |
Public vs Private Health Insurance Coverage by Age in Bradenville
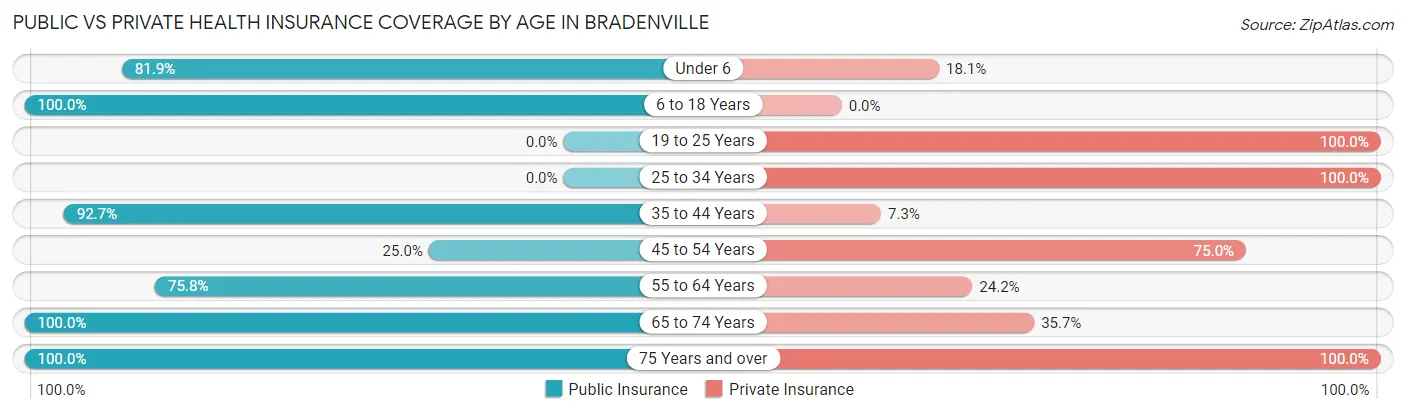
| Age Bracket | Public Insurance | Private Insurance |
| Under 6 | 68 (81.9%) | 15 (18.1%) |
| 6 to 18 Years | 56 (100.0%) | 0 (0.0%) |
| 19 to 25 Years | 0 (0.0%) | 8 (100.0%) |
| 25 to 34 Years | 0 (0.0%) | 12 (100.0%) |
| 35 to 44 Years | 89 (92.7%) | 7 (7.3%) |
| 45 to 54 Years | 10 (25.0%) | 30 (75.0%) |
| 55 to 64 Years | 75 (75.8%) | 24 (24.2%) |
| 65 to 74 Years | 42 (100.0%) | 15 (35.7%) |
| 75 Years and over | 13 (100.0%) | 13 (100.0%) |
| Total | 353 (78.6%) | 124 (27.6%) |
Disability Status by Sex by Age in Bradenville
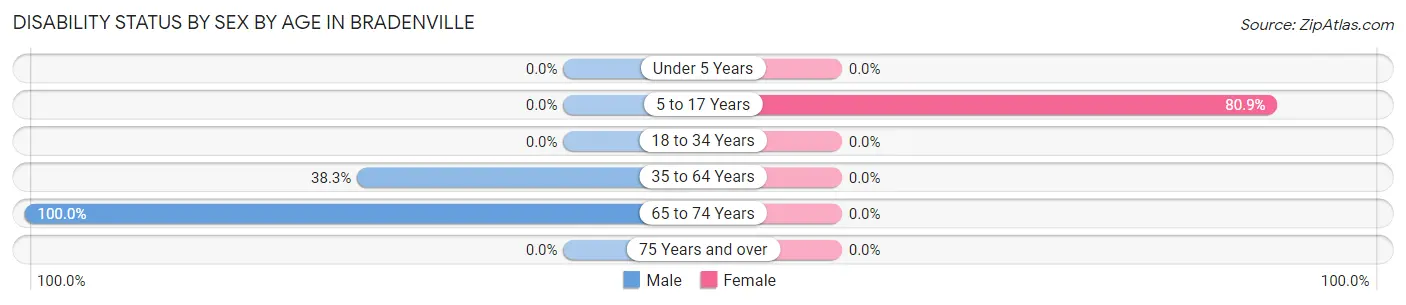
| Age Bracket | Male | Female |
| Under 5 Years | 0 (0.0%) | 0 (0.0%) |
| 5 to 17 Years | 0 (0.0%) | 38 (80.8%) |
| 18 to 34 Years | 0 (0.0%) | 0 (0.0%) |
| 35 to 64 Years | 49 (38.3%) | 0 (0.0%) |
| 65 to 74 Years | 9 (100.0%) | 0 (0.0%) |
| 75 Years and over | 0 (0.0%) | 0 (0.0%) |
Disability Class by Sex by Age in Bradenville
Disability Class: Hearing Difficulty
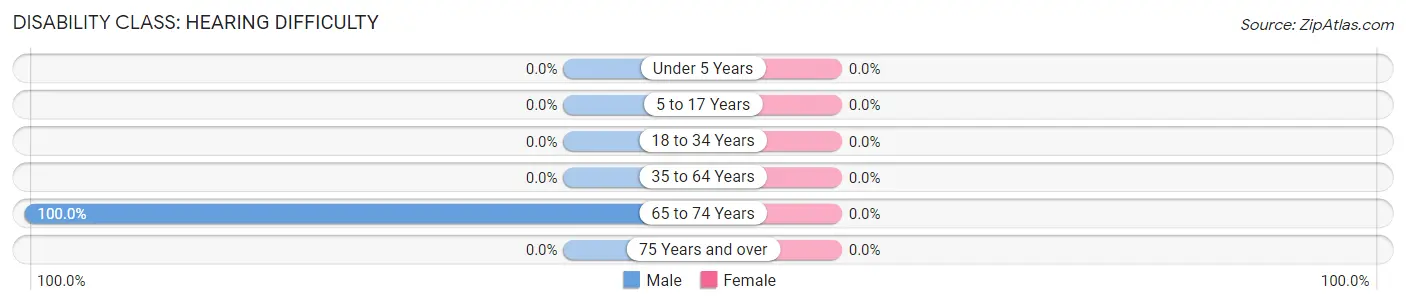
| Age Bracket | Male | Female |
| Under 5 Years | 0 (0.0%) | 0 (0.0%) |
| 5 to 17 Years | 0 (0.0%) | 0 (0.0%) |
| 18 to 34 Years | 0 (0.0%) | 0 (0.0%) |
| 35 to 64 Years | 0 (0.0%) | 0 (0.0%) |
| 65 to 74 Years | 9 (100.0%) | 0 (0.0%) |
| 75 Years and over | 0 (0.0%) | 0 (0.0%) |
Disability Class: Vision Difficulty
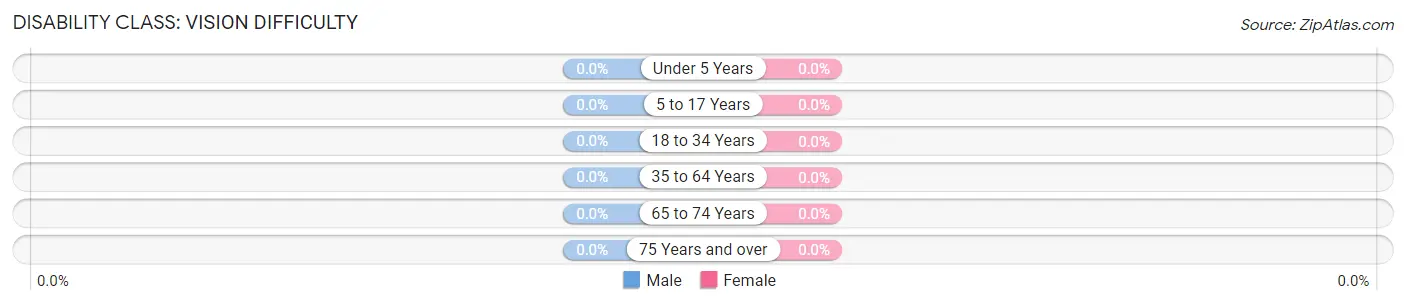
| Age Bracket | Male | Female |
| Under 5 Years | 0 (0.0%) | 0 (0.0%) |
| 5 to 17 Years | 0 (0.0%) | 0 (0.0%) |
| 18 to 34 Years | 0 (0.0%) | 0 (0.0%) |
| 35 to 64 Years | 0 (0.0%) | 0 (0.0%) |
| 65 to 74 Years | 0 (0.0%) | 0 (0.0%) |
| 75 Years and over | 0 (0.0%) | 0 (0.0%) |
Disability Class: Cognitive Difficulty
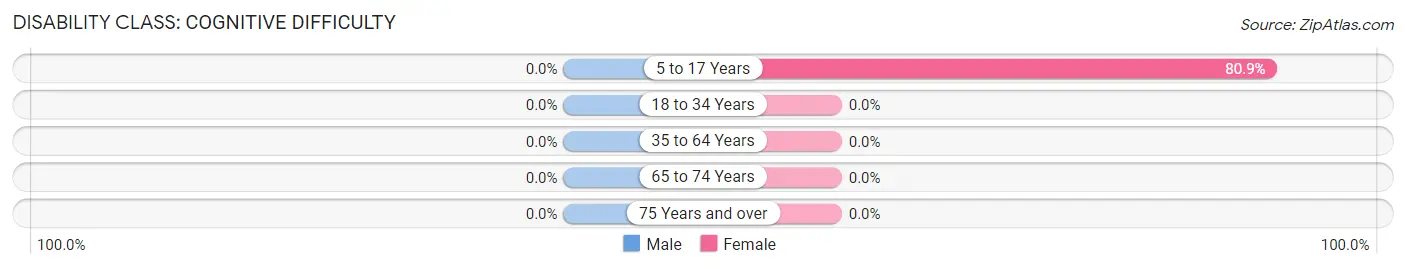
| Age Bracket | Male | Female |
| 5 to 17 Years | 0 (0.0%) | 38 (80.8%) |
| 18 to 34 Years | 0 (0.0%) | 0 (0.0%) |
| 35 to 64 Years | 0 (0.0%) | 0 (0.0%) |
| 65 to 74 Years | 0 (0.0%) | 0 (0.0%) |
| 75 Years and over | 0 (0.0%) | 0 (0.0%) |
Disability Class: Ambulatory Difficulty
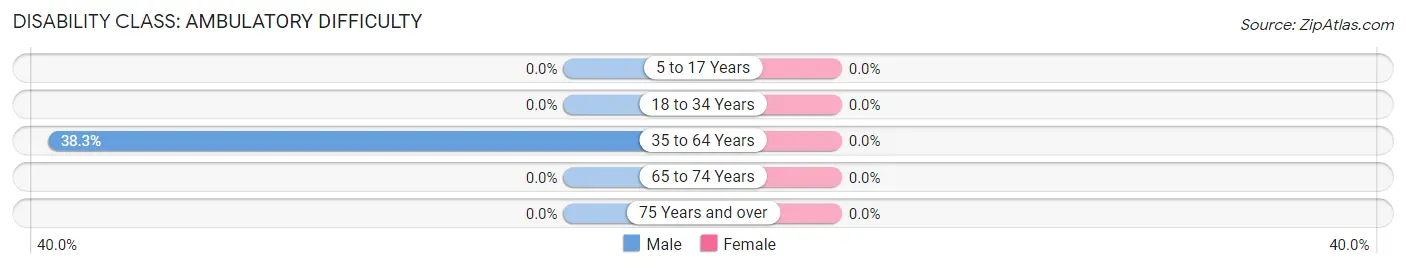
| Age Bracket | Male | Female |
| 5 to 17 Years | 0 (0.0%) | 0 (0.0%) |
| 18 to 34 Years | 0 (0.0%) | 0 (0.0%) |
| 35 to 64 Years | 49 (38.3%) | 0 (0.0%) |
| 65 to 74 Years | 0 (0.0%) | 0 (0.0%) |
| 75 Years and over | 0 (0.0%) | 0 (0.0%) |
Disability Class: Self-Care Difficulty
| Age Bracket | Male | Female |
| 5 to 17 Years | 0 (0.0%) | 0 (0.0%) |
| 18 to 34 Years | 0 (0.0%) | 0 (0.0%) |
| 35 to 64 Years | 0 (0.0%) | 0 (0.0%) |
| 65 to 74 Years | 0 (0.0%) | 0 (0.0%) |
| 75 Years and over | 0 (0.0%) | 0 (0.0%) |
Technology Access in Bradenville
Computing Device Access in Bradenville
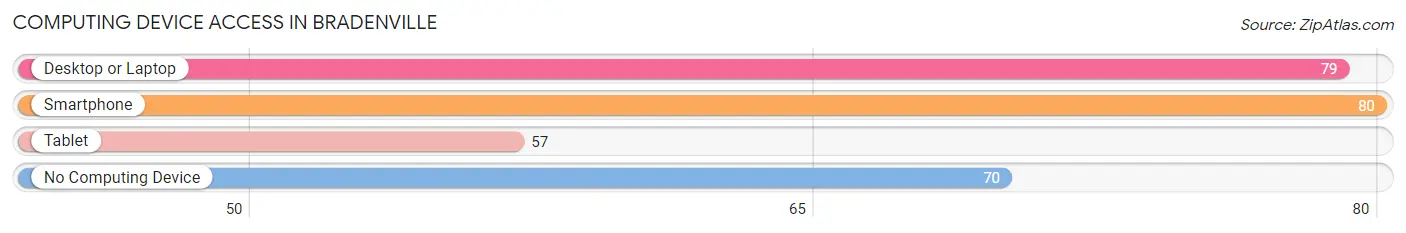
| Device Type | # Households | % Households |
| Desktop or Laptop | 79 | 49.7% |
| Smartphone | 80 | 50.3% |
| Tablet | 57 | 35.8% |
| No Computing Device | 70 | 44.0% |
| Total | 159 | 100.0% |
Internet Access in Bradenville
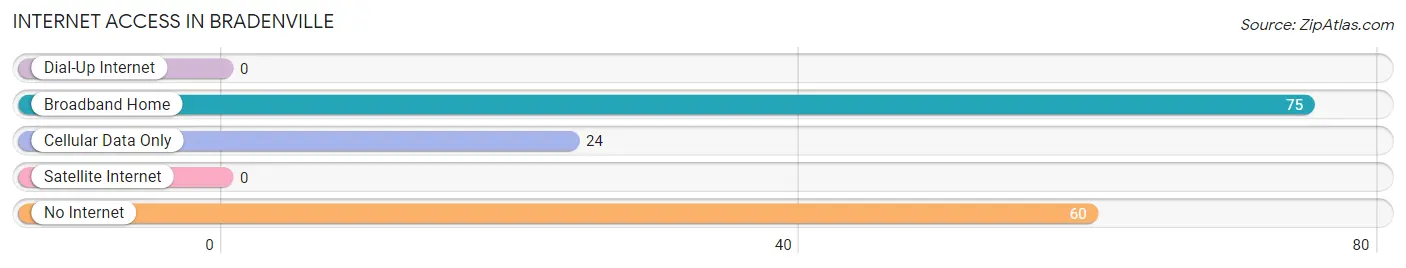
| Internet Type | # Households | % Households |
| Dial-Up Internet | 0 | 0.0% |
| Broadband Home | 75 | 47.2% |
| Cellular Data Only | 24 | 15.1% |
| Satellite Internet | 0 | 0.0% |
| No Internet | 60 | 37.7% |
| Total | 159 | 100.0% |
Bradenville Summary
Bradenville is a small borough located in Westmoreland County, Pennsylvania. It is situated in the Laurel Highlands region of the state, approximately 40 miles southeast of Pittsburgh. The borough is home to a population of just over 1,000 people, and is part of the Greater Pittsburgh Metropolitan Area.
History
Bradenville was founded in 1845 by William Braden, a local landowner. The town was originally known as Braden’s Crossroads, and was later renamed Bradenville. The town was incorporated in 1872, and has remained relatively unchanged since then.
Geography
Bradenville is located in the Laurel Highlands region of Pennsylvania, approximately 40 miles southeast of Pittsburgh. The borough is situated in the foothills of the Allegheny Mountains, and is surrounded by rolling hills and forests. The borough is located along the Loyalhanna Creek, and is home to several small lakes and ponds.
Economy
The economy of Bradenville is largely based on agriculture and tourism. The borough is home to several small farms, which produce a variety of crops, including corn, soybeans, and hay. The town is also home to several small businesses, including restaurants, shops, and a local winery.
Tourism is an important part of the local economy, as the borough is home to several popular attractions, including the Bradenville Historical Society Museum, the Bradenville Arts Center, and the Bradenville Country Club. The town is also home to several popular festivals, including the Bradenville Summer Festival and the Bradenville Fall Festival.
Demographics
As of the 2010 census, Bradenville had a population of 1,072 people. The racial makeup of the borough was 97.2% White, 0.9% African American, 0.3% Native American, 0.3% Asian, 0.2% from other races, and 0.9% from two or more races. Hispanic or Latino of any race were 0.7% of the population.
The median household income in Bradenville was $41,250, and the median family income was $50,000. The per capita income for the borough was $20,845. About 8.2% of families and 10.2% of the population were below the poverty line, including 14.3% of those under age 18 and 6.3% of those age 65 or over.
Overall, Bradenville is a small, rural borough with a rich history and a strong agricultural and tourism-based economy. The borough is home to a diverse population, and is a popular destination for visitors looking to explore the Laurel Highlands region of Pennsylvania.
Common Questions
What is Per Capita Income in Bradenville?
Per Capita income in Bradenville is $18,115.
What is the Median Family Income in Bradenville?
Median Family Income in Bradenville is $95,417.
What is the Median Household income in Bradenville?
Median Household Income in Bradenville is $48,125.
What is Income or Wage Gap in Bradenville?
Income or Wage Gap in Bradenville is 46.5%.
Women in Bradenville earn 53.5 cents for every dollar earned by a man.
What is Inequality or Gini Index in Bradenville?
Inequality or Gini Index in Bradenville is 0.42.
What is the Total Population of Bradenville?
Total Population of Bradenville is 449.
What is the Total Male Population of Bradenville?
Total Male Population of Bradenville is 210.
What is the Total Female Population of Bradenville?
Total Female Population of Bradenville is 239.
What is the Ratio of Males per 100 Females in Bradenville?
There are 87.87 Males per 100 Females in Bradenville.
What is the Ratio of Females per 100 Males in Bradenville?
There are 113.81 Females per 100 Males in Bradenville.
What is the Median Population Age in Bradenville?
Median Population Age in Bradenville is 42.1 Years.
What is the Average Family Size in Bradenville
Average Family Size in Bradenville is 4.5 People.
What is the Average Household Size in Bradenville
Average Household Size in Bradenville is 2.8 People.
How Large is the Labor Force in Bradenville?
There are 132 People in the Labor Forcein in Bradenville.
What is the Percentage of People in the Labor Force in Bradenville?
42.6% of People are in the Labor Force in Bradenville.