Starbrick, PA Map & Demographics
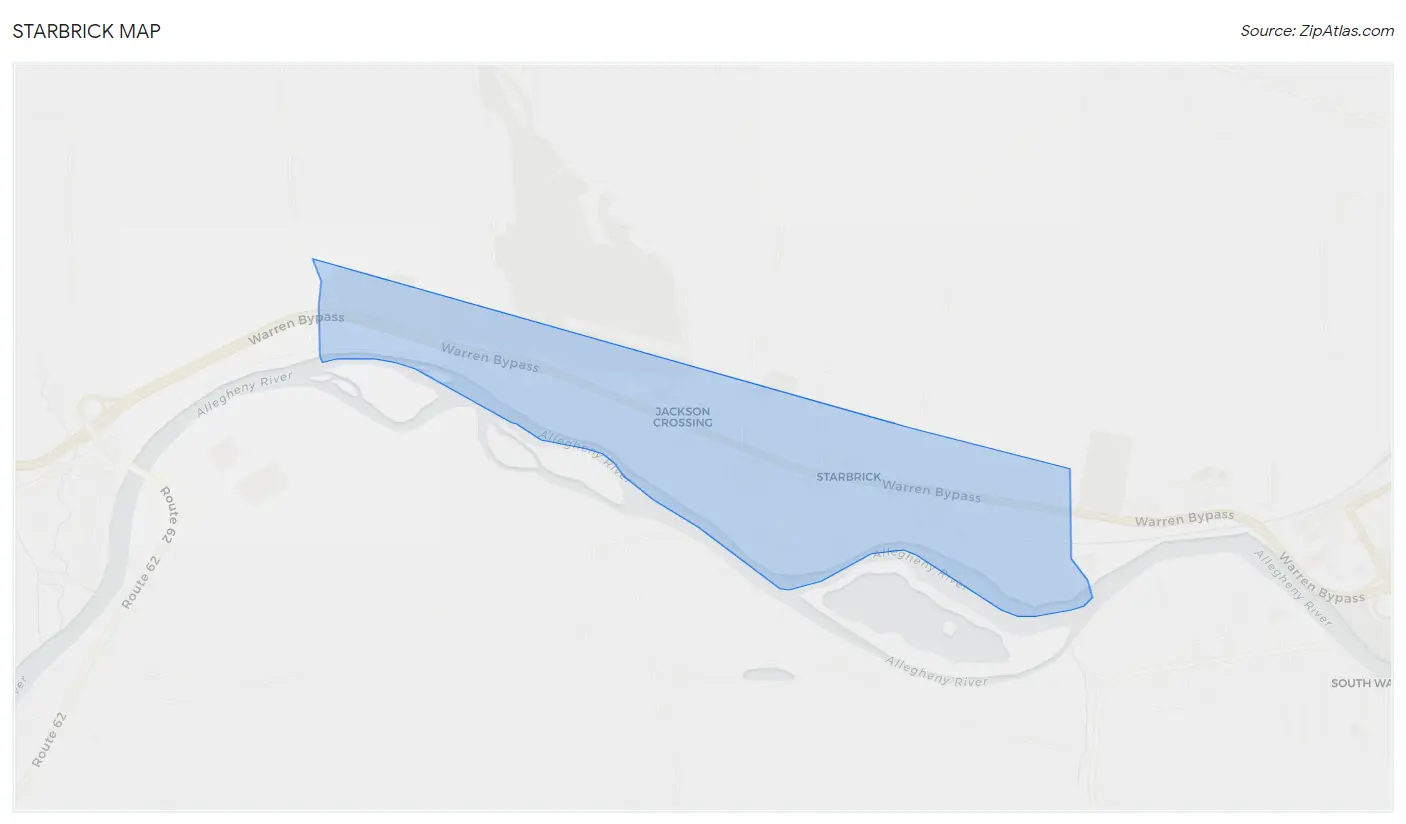
Starbrick Map
Starbrick Overview
$23,840
PER CAPITA INCOME
$50,287
AVG HOUSEHOLD INCOME
0.38
INEQUALITY / GINI INDEX
677
TOTAL POPULATION
341
MALE POPULATION
336
FEMALE POPULATION
101.49
MALES / 100 FEMALES
98.53
FEMALES / 100 MALES
44.1
MEDIAN AGE
2.8
AVG FAMILY SIZE
2.2
AVG HOUSEHOLD SIZE
271
LABOR FORCE [ PEOPLE ]
59.6%
PERCENT IN LABOR FORCE
Income in Starbrick
Income Overview in Starbrick
| Characteristic | Number | Measure |
| Per Capita Income | 677 | $23,840 |
| Median Family Income | 186 | $0 |
| Mean Family Income | 186 | $63,230 |
| Median Household Income | 302 | $50,287 |
| Mean Household Income | 302 | $51,992 |
| Income Deficit | 186 | $0 |
| Wage / Income Gap (%) | 677 | 0.00% |
| Wage / Income Gap ($) | 677 | 100.00¢ per $1 |
| Gini / Inequality Index | 677 | 0.38 |
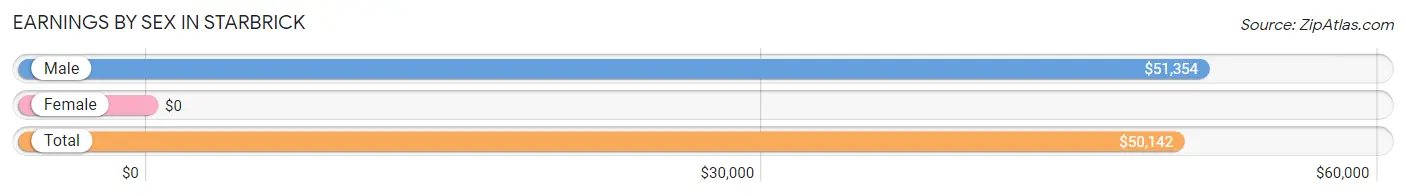
Earnings by Sex in Starbrick
| Sex | Number | Average Earnings |
| Male | 114 (42.1%) | $51,354 |
| Female | 157 (57.9%) | $0 |
| Total | 271 (100.0%) | $50,142 |
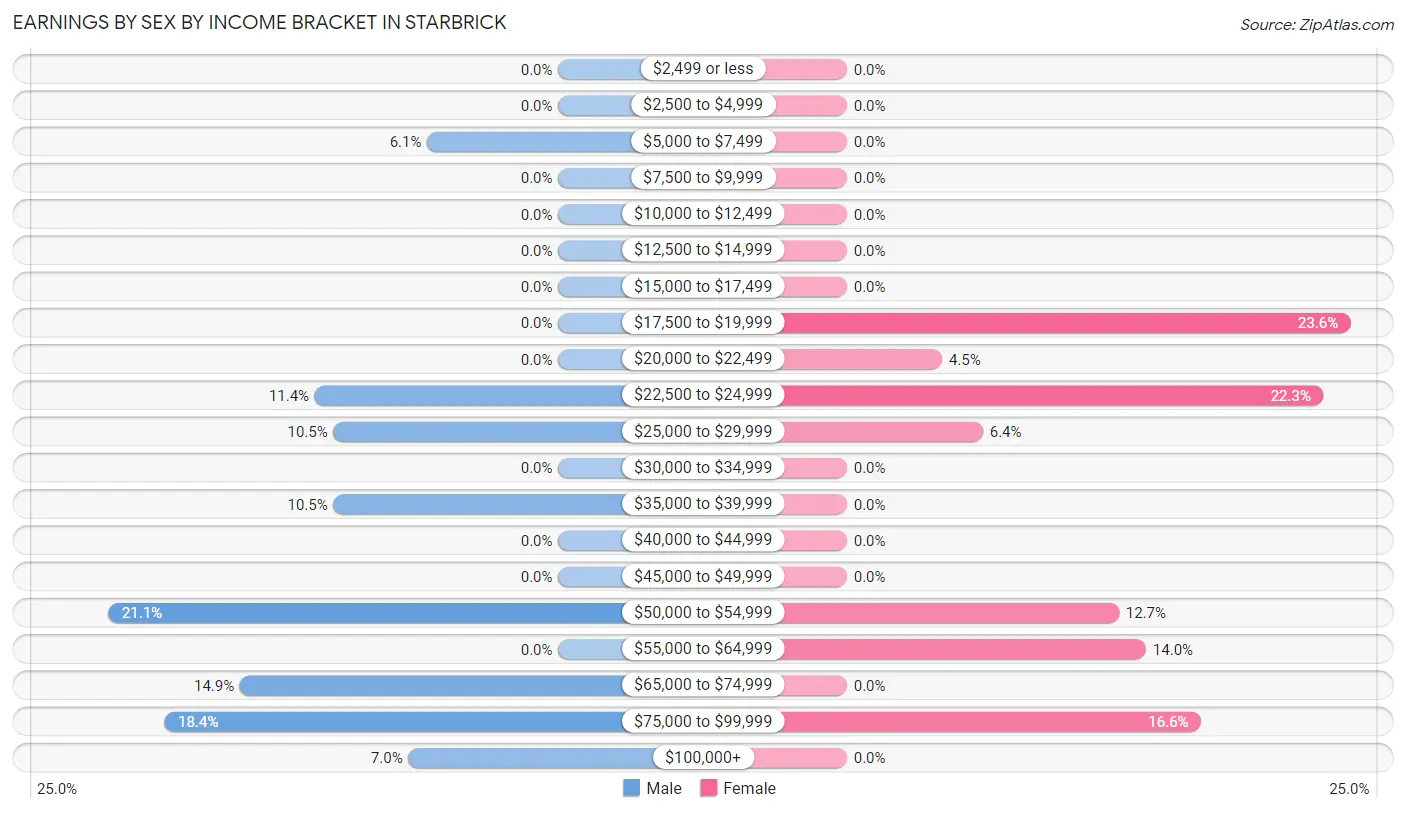
Earnings by Sex by Income Bracket in Starbrick
The most common earnings brackets in Starbrick are $50,000 to $54,999 for men (24 | 21.0%) and $17,500 to $19,999 for women (37 | 23.6%).
| Income | Male | Female |
| $2,499 or less | 0 (0.0%) | 0 (0.0%) |
| $2,500 to $4,999 | 0 (0.0%) | 0 (0.0%) |
| $5,000 to $7,499 | 7 (6.1%) | 0 (0.0%) |
| $7,500 to $9,999 | 0 (0.0%) | 0 (0.0%) |
| $10,000 to $12,499 | 0 (0.0%) | 0 (0.0%) |
| $12,500 to $14,999 | 0 (0.0%) | 0 (0.0%) |
| $15,000 to $17,499 | 0 (0.0%) | 0 (0.0%) |
| $17,500 to $19,999 | 0 (0.0%) | 37 (23.6%) |
| $20,000 to $22,499 | 0 (0.0%) | 7 (4.5%) |
| $22,500 to $24,999 | 13 (11.4%) | 35 (22.3%) |
| $25,000 to $29,999 | 12 (10.5%) | 10 (6.4%) |
| $30,000 to $34,999 | 0 (0.0%) | 0 (0.0%) |
| $35,000 to $39,999 | 12 (10.5%) | 0 (0.0%) |
| $40,000 to $44,999 | 0 (0.0%) | 0 (0.0%) |
| $45,000 to $49,999 | 0 (0.0%) | 0 (0.0%) |
| $50,000 to $54,999 | 24 (21.0%) | 20 (12.7%) |
| $55,000 to $64,999 | 0 (0.0%) | 22 (14.0%) |
| $65,000 to $74,999 | 17 (14.9%) | 0 (0.0%) |
| $75,000 to $99,999 | 21 (18.4%) | 26 (16.6%) |
| $100,000+ | 8 (7.0%) | 0 (0.0%) |
| Total | 114 (100.0%) | 157 (100.0%) |
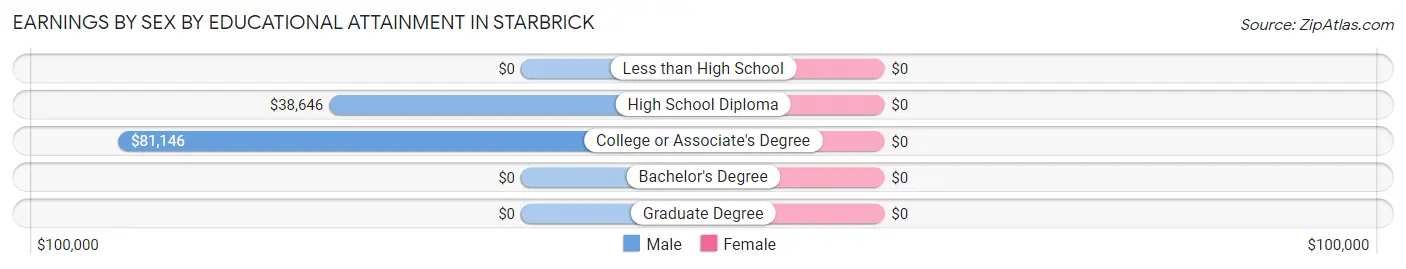
Earnings by Sex by Educational Attainment in Starbrick
| Educational Attainment | Male Income | Female Income |
| Less than High School | - | - |
| High School Diploma | $38,646 | $0 |
| College or Associate's Degree | $81,146 | $0 |
| Bachelor's Degree | - | - |
| Graduate Degree | - | - |
| Total | $50,833 | $51,000 |
Family Income in Starbrick
Family Income Brackets in Starbrick
According to the Starbrick family income data, there are 65 families falling into the $25,000 to $34,999 income range, which is the most common income bracket and makes up 34.9% of all families.
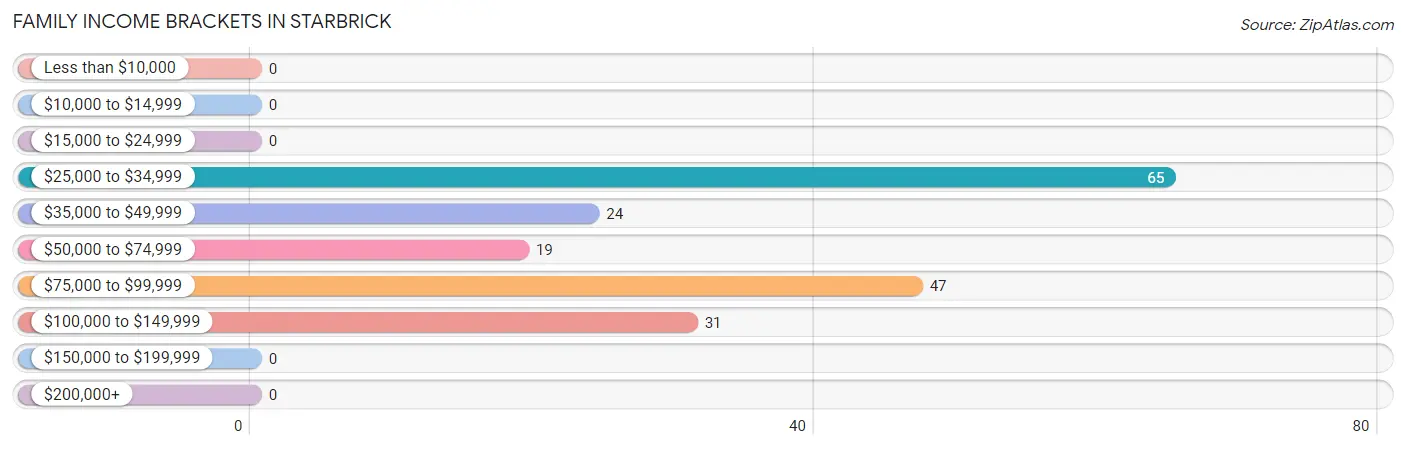
| Income Bracket | # Families | % Families |
| Less than $10,000 | 0 | 0.0% |
| $10,000 to $14,999 | 0 | 0.0% |
| $15,000 to $24,999 | 0 | 0.0% |
| $25,000 to $34,999 | 65 | 34.9% |
| $35,000 to $49,999 | 24 | 12.9% |
| $50,000 to $74,999 | 19 | 10.2% |
| $75,000 to $99,999 | 47 | 25.3% |
| $100,000 to $149,999 | 31 | 16.7% |
| $150,000 to $199,999 | 0 | 0.0% |
| $200,000+ | 0 | 0.0% |
Family Income by Famaliy Size in Starbrick
2-person families (108 | 58.1%) account for the highest median family income in Starbrick with $66,389 per family, while 2-person families (108 | 58.1%) have the highest median income of $33,194 per family member.
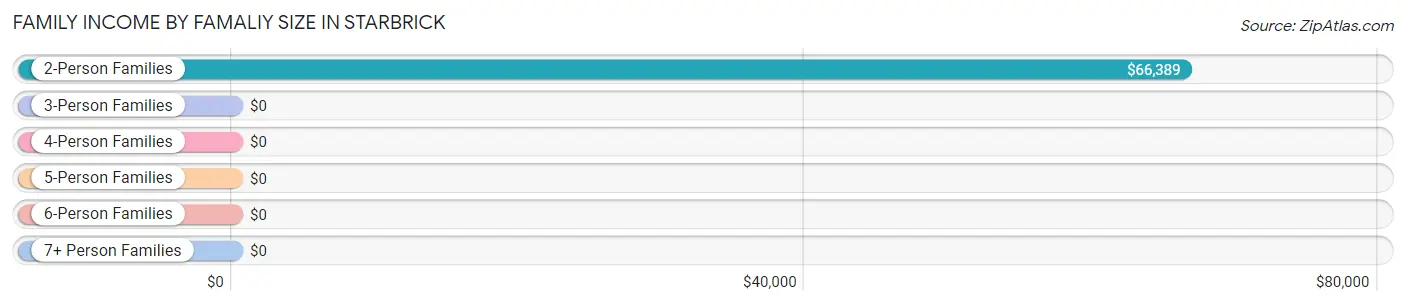
| Income Bracket | # Families | Median Income |
| 2-Person Families | 108 (58.1%) | $66,389 |
| 3-Person Families | 9 (4.8%) | $0 |
| 4-Person Families | 69 (37.1%) | $0 |
| 5-Person Families | 0 (0.0%) | $0 |
| 6-Person Families | 0 (0.0%) | $0 |
| 7+ Person Families | 0 (0.0%) | $0 |
| Total | 186 (100.0%) | $0 |
Family Income by Number of Earners in Starbrick
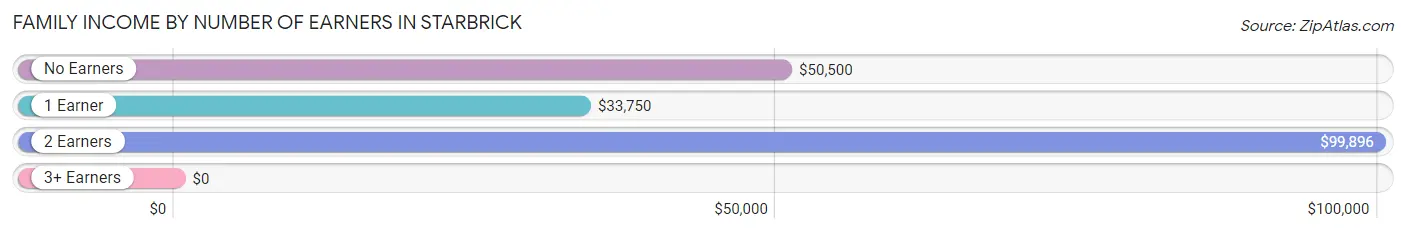
| Number of Earners | # Families | Median Income |
| No Earners | 34 (18.3%) | $50,500 |
| 1 Earner | 100 (53.8%) | $33,750 |
| 2 Earners | 41 (22.0%) | $99,896 |
| 3+ Earners | 11 (5.9%) | $0 |
| Total | 186 (100.0%) | $0 |
Household Income in Starbrick
Household Income Brackets in Starbrick
With 80 households falling in the category, the $50,000 to $74,999 income range is the most frequent in Starbrick, accounting for 26.5% of all households.
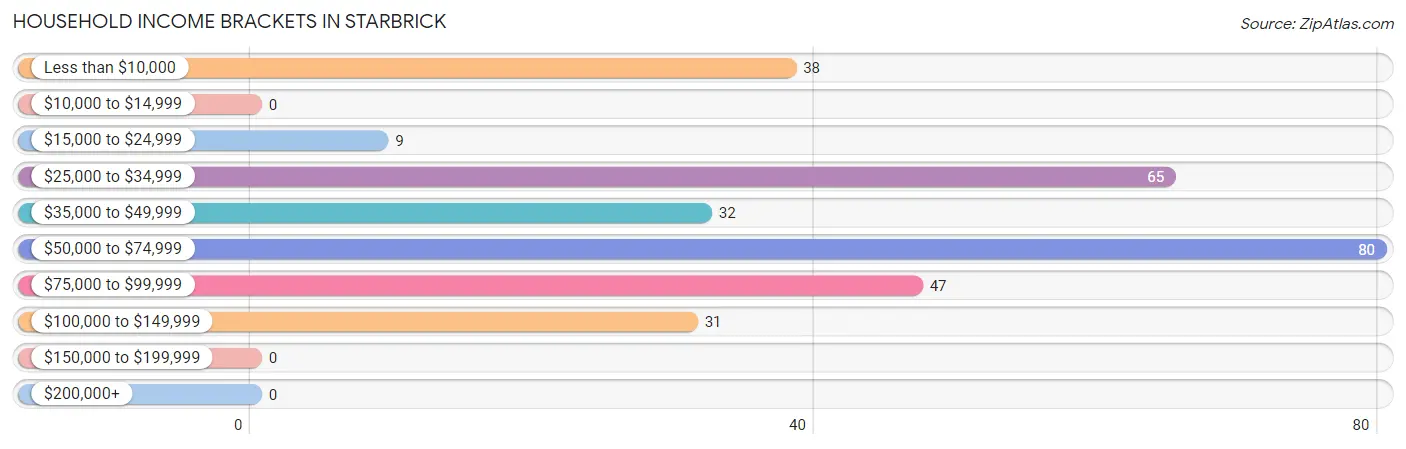
| Income Bracket | # Households | % Households |
| Less than $10,000 | 38 | 12.6% |
| $10,000 to $14,999 | 0 | 0.0% |
| $15,000 to $24,999 | 9 | 3.0% |
| $25,000 to $34,999 | 65 | 21.5% |
| $35,000 to $49,999 | 32 | 10.6% |
| $50,000 to $74,999 | 80 | 26.5% |
| $75,000 to $99,999 | 47 | 15.6% |
| $100,000 to $149,999 | 31 | 10.3% |
| $150,000 to $199,999 | 0 | 0.0% |
| $200,000+ | 0 | 0.0% |
Household Income by Householder Age in Starbrick
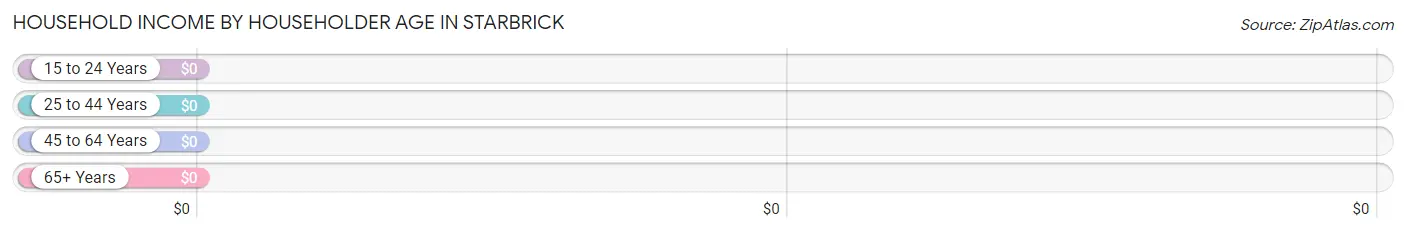
| Income Bracket | # Households | Median Income |
| 15 to 24 Years | 37 (12.2%) | $0 |
| 25 to 44 Years | 23 (7.6%) | $0 |
| 45 to 64 Years | 169 (56.0%) | $0 |
| 65+ Years | 73 (24.2%) | $0 |
| Total | 302 (100.0%) | $50,287 |
Poverty in Starbrick
Income Below Poverty by Sex and Age in Starbrick
With 34.9% poverty level for males and 45.8% for females among the residents of Starbrick, 5 year old males and under 5 year old females are the most vulnerable to poverty, with 34 males (100.0%) and 34 females (100.0%) in their respective age groups living below the poverty level.
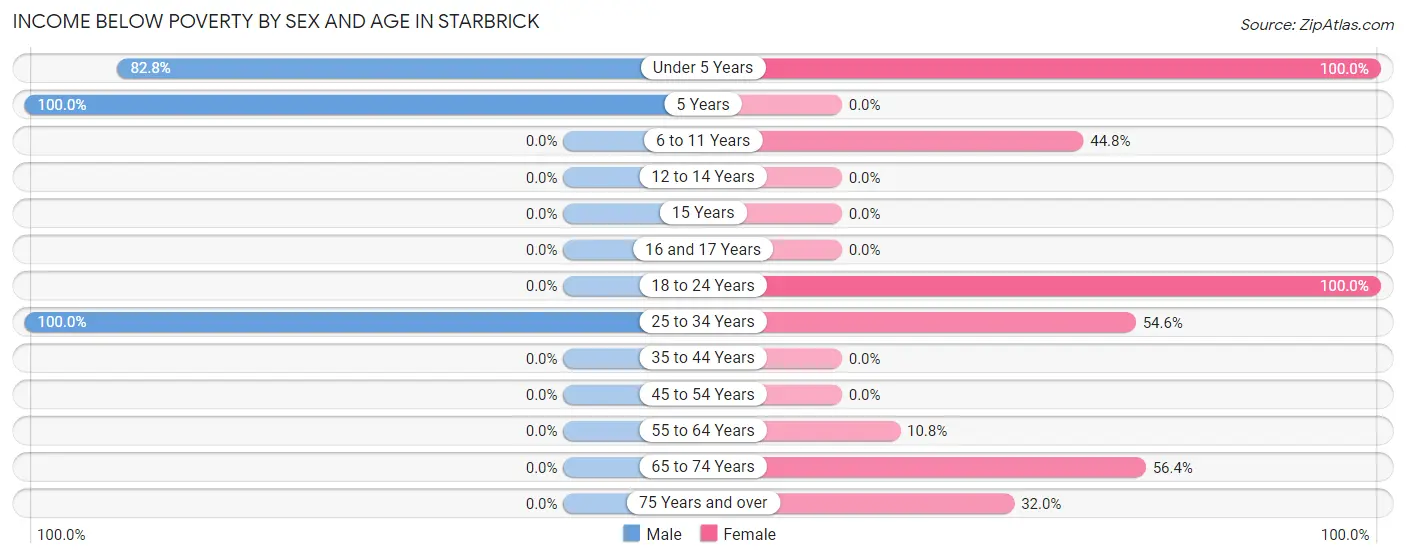
| Age Bracket | Male | Female |
| Under 5 Years | 72 (82.8%) | 34 (100.0%) |
| 5 Years | 34 (100.0%) | 0 (0.0%) |
| 6 to 11 Years | 0 (0.0%) | 13 (44.8%) |
| 12 to 14 Years | 0 (0.0%) | 0 (0.0%) |
| 15 Years | 0 (0.0%) | 0 (0.0%) |
| 16 and 17 Years | 0 (0.0%) | 0 (0.0%) |
| 18 to 24 Years | 0 (0.0%) | 57 (100.0%) |
| 25 to 34 Years | 13 (100.0%) | 12 (54.5%) |
| 35 to 44 Years | 0 (0.0%) | 0 (0.0%) |
| 45 to 54 Years | 0 (0.0%) | 0 (0.0%) |
| 55 to 64 Years | 0 (0.0%) | 8 (10.8%) |
| 65 to 74 Years | 0 (0.0%) | 22 (56.4%) |
| 75 Years and over | 0 (0.0%) | 8 (32.0%) |
| Total | 119 (34.9%) | 154 (45.8%) |
Income Above Poverty by Sex and Age in Starbrick
According to the poverty statistics in Starbrick, males aged 12 to 14 years and females aged 35 to 44 years are the age groups that are most secure financially, with 100.0% of males and 100.0% of females in these age groups living above the poverty line.
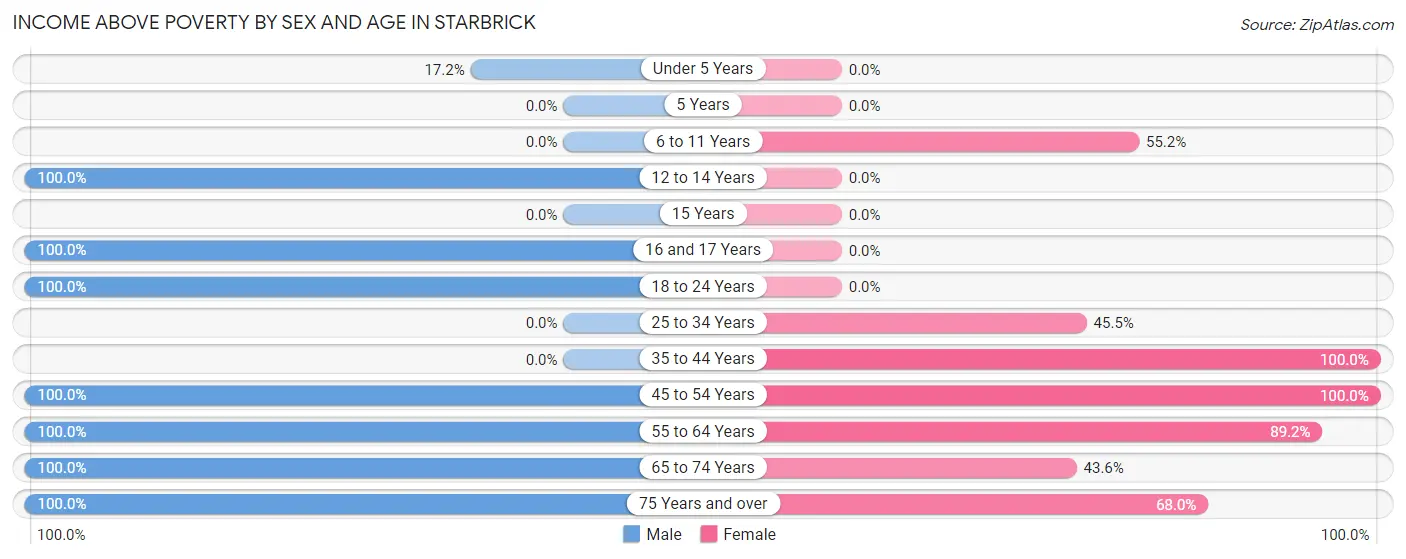
| Age Bracket | Male | Female |
| Under 5 Years | 15 (17.2%) | 0 (0.0%) |
| 5 Years | 0 (0.0%) | 0 (0.0%) |
| 6 to 11 Years | 0 (0.0%) | 16 (55.2%) |
| 12 to 14 Years | 38 (100.0%) | 0 (0.0%) |
| 15 Years | 0 (0.0%) | 0 (0.0%) |
| 16 and 17 Years | 7 (100.0%) | 0 (0.0%) |
| 18 to 24 Years | 17 (100.0%) | 0 (0.0%) |
| 25 to 34 Years | 0 (0.0%) | 10 (45.5%) |
| 35 to 44 Years | 0 (0.0%) | 7 (100.0%) |
| 45 to 54 Years | 65 (100.0%) | 49 (100.0%) |
| 55 to 64 Years | 27 (100.0%) | 66 (89.2%) |
| 65 to 74 Years | 43 (100.0%) | 17 (43.6%) |
| 75 Years and over | 10 (100.0%) | 17 (68.0%) |
| Total | 222 (65.1%) | 182 (54.2%) |
Income Below Poverty Among Married-Couple Families in Starbrick
| Children | Above Poverty | Below Poverty |
| No Children | 82 (100.0%) | 0 (0.0%) |
| 1 or 2 Children | 19 (100.0%) | 0 (0.0%) |
| 3 or 4 Children | 0 (0.0%) | 0 (0.0%) |
| 5 or more Children | 0 (0.0%) | 0 (0.0%) |
| Total | 101 (100.0%) | 0 (0.0%) |
Income Below Poverty Among Single-Parent Households in Starbrick
According to the poverty data in Starbrick, 59.1% or 13 single-father households and 58.7% or 37 single-mother households are living below the poverty line. Among single-father households, those with 3 or 4 children have the highest poverty rate, with 13 households (100.0%) experiencing poverty. Likewise, among single-mother households, those with 3 or 4 children have the highest poverty rate, with 37 households (100.0%) falling below the poverty line.
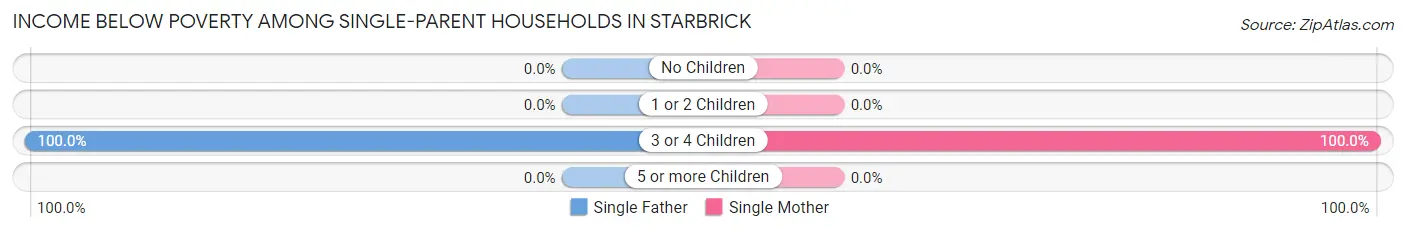
| Children | Single Father | Single Mother |
| No Children | 0 (0.0%) | 0 (0.0%) |
| 1 or 2 Children | 0 (0.0%) | 0 (0.0%) |
| 3 or 4 Children | 13 (100.0%) | 37 (100.0%) |
| 5 or more Children | 0 (0.0%) | 0 (0.0%) |
| Total | 13 (59.1%) | 37 (58.7%) |
Income Below Poverty Among Married-Couple vs Single-Parent Households in Starbrick
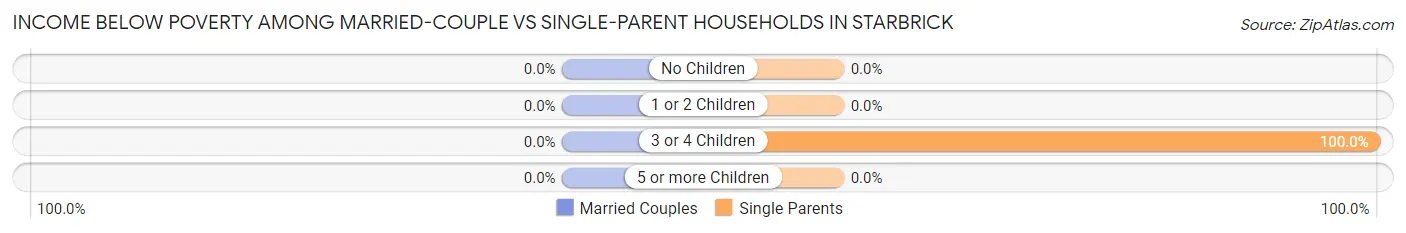
| Children | Married-Couple Families | Single-Parent Households |
| No Children | 0 (0.0%) | 0 (0.0%) |
| 1 or 2 Children | 0 (0.0%) | 0 (0.0%) |
| 3 or 4 Children | 0 (0.0%) | 50 (100.0%) |
| 5 or more Children | 0 (0.0%) | 0 (0.0%) |
| Total | 0 (0.0%) | 50 (58.8%) |
Race in Starbrick
The most populous races in Starbrick are White / Caucasian (646 | 95.4%), and Two or more Races (31 | 4.6%).
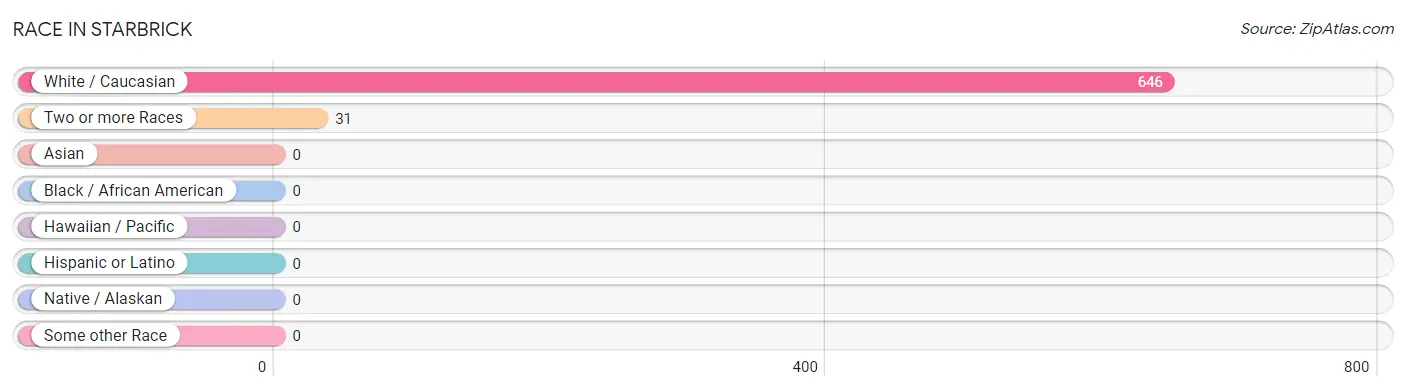
| Race | # Population | % Population |
| Asian | 0 | 0.0% |
| Black / African American | 0 | 0.0% |
| Hawaiian / Pacific | 0 | 0.0% |
| Hispanic or Latino | 0 | 0.0% |
| Native / Alaskan | 0 | 0.0% |
| White / Caucasian | 646 | 95.4% |
| Two or more Races | 31 | 4.6% |
| Some other Race | 0 | 0.0% |
| Total | 677 | 100.0% |
Ancestry in Starbrick
The most populous ancestries reported in Starbrick are German (120 | 17.7%), Swedish (96 | 14.2%), Irish (79 | 11.7%), American (51 | 7.5%), and Danish (42 | 6.2%), together accounting for 57.3% of all Starbrick residents.
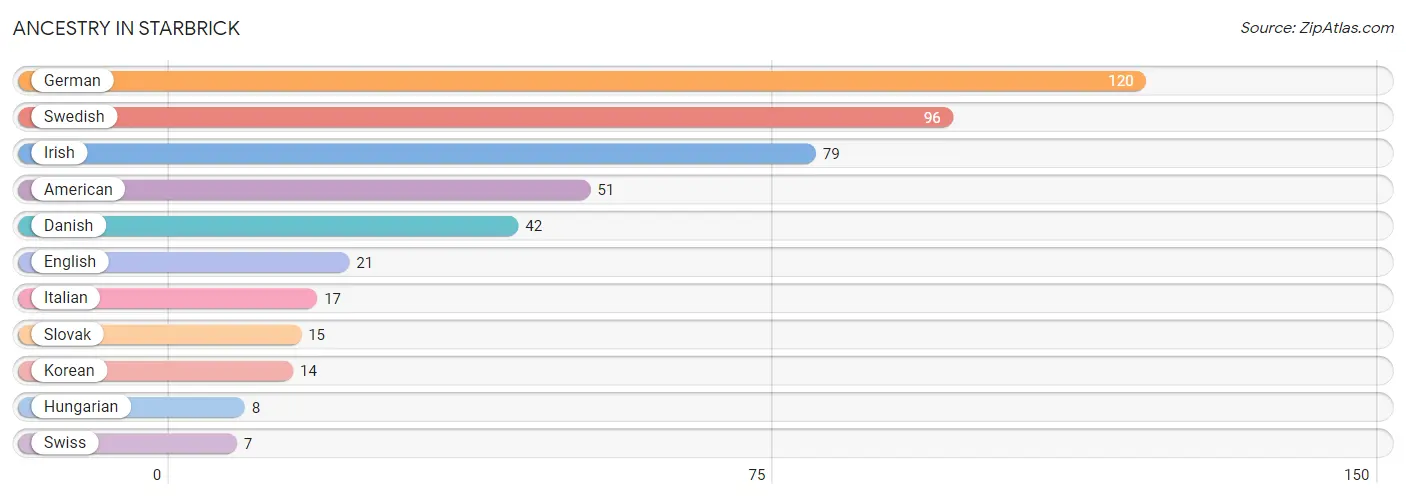
| Ancestry | # Population | % Population |
| American | 51 | 7.5% |
| Danish | 42 | 6.2% |
| English | 21 | 3.1% |
| German | 120 | 17.7% |
| Hungarian | 8 | 1.2% |
| Irish | 79 | 11.7% |
| Italian | 17 | 2.5% |
| Korean | 14 | 2.1% |
| Slovak | 15 | 2.2% |
| Swedish | 96 | 14.2% |
| Swiss | 7 | 1.0% | View All 11 Rows |
Immigrants in Starbrick

| Immigration Origin | # Population | % Population | View All 0 Rows |
Sex and Age in Starbrick
Sex and Age in Starbrick
The most populous age groups in Starbrick are Under 5 Years (87 | 25.5%) for men and 20 to 24 Years (57 | 17.0%) for women.
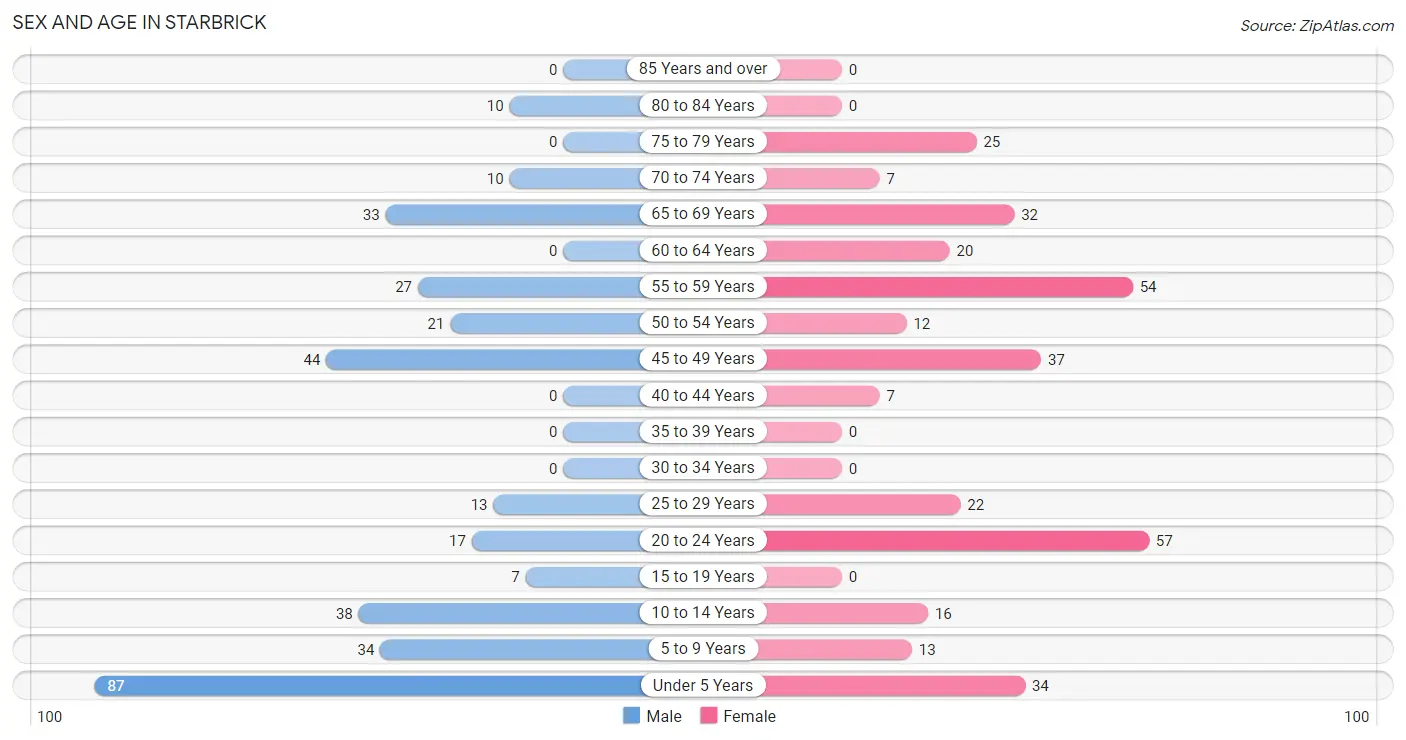
| Age Bracket | Male | Female |
| Under 5 Years | 87 (25.5%) | 34 (10.1%) |
| 5 to 9 Years | 34 (10.0%) | 13 (3.9%) |
| 10 to 14 Years | 38 (11.1%) | 16 (4.8%) |
| 15 to 19 Years | 7 (2.1%) | 0 (0.0%) |
| 20 to 24 Years | 17 (5.0%) | 57 (17.0%) |
| 25 to 29 Years | 13 (3.8%) | 22 (6.6%) |
| 30 to 34 Years | 0 (0.0%) | 0 (0.0%) |
| 35 to 39 Years | 0 (0.0%) | 0 (0.0%) |
| 40 to 44 Years | 0 (0.0%) | 7 (2.1%) |
| 45 to 49 Years | 44 (12.9%) | 37 (11.0%) |
| 50 to 54 Years | 21 (6.2%) | 12 (3.6%) |
| 55 to 59 Years | 27 (7.9%) | 54 (16.1%) |
| 60 to 64 Years | 0 (0.0%) | 20 (5.9%) |
| 65 to 69 Years | 33 (9.7%) | 32 (9.5%) |
| 70 to 74 Years | 10 (2.9%) | 7 (2.1%) |
| 75 to 79 Years | 0 (0.0%) | 25 (7.4%) |
| 80 to 84 Years | 10 (2.9%) | 0 (0.0%) |
| 85 Years and over | 0 (0.0%) | 0 (0.0%) |
| Total | 341 (100.0%) | 336 (100.0%) |
Families and Households in Starbrick
Median Family Size in Starbrick
The median family size in Starbrick is 2.84 persons per family, with single male/father families (22 | 11.8%) accounting for the largest median family size of 3.64 persons per family. On the other hand, married-couple families (101 | 54.3%) represent the smallest median family size with 2.46 persons per family.
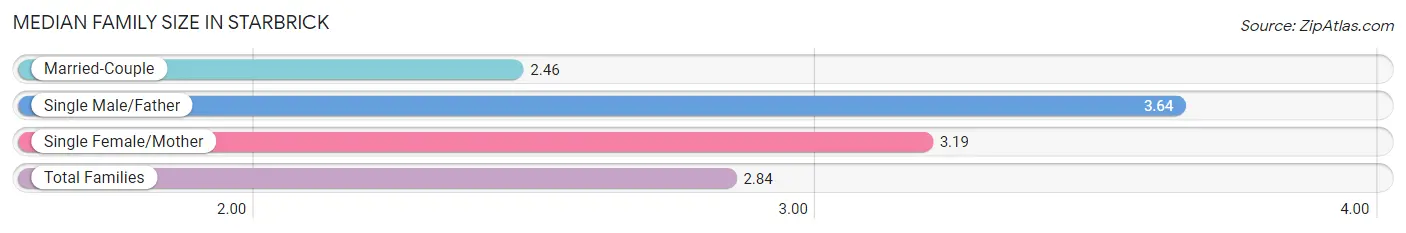
| Family Type | # Families | Family Size |
| Married-Couple | 101 (54.3%) | 2.46 |
| Single Male/Father | 22 (11.8%) | 3.64 |
| Single Female/Mother | 63 (33.9%) | 3.19 |
| Total Families | 186 (100.0%) | 2.84 |
Median Household Size in Starbrick
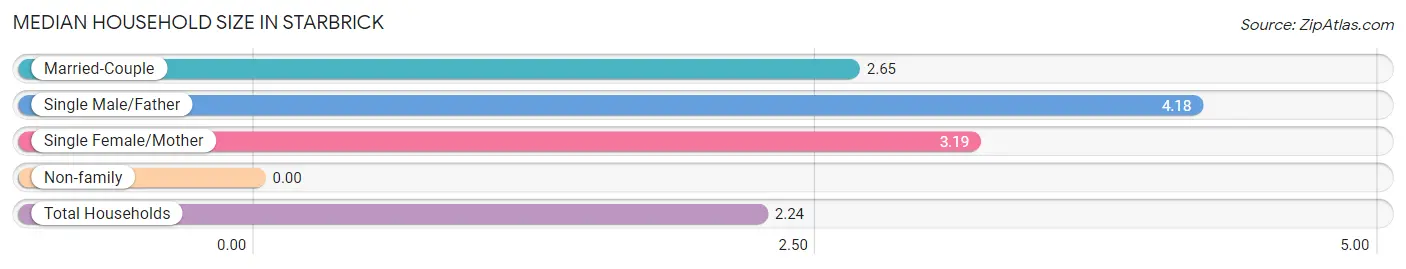
| Household Type | # Households | Household Size |
| Married-Couple | 101 (33.4%) | 2.65 |
| Single Male/Father | 22 (7.3%) | 4.18 |
| Single Female/Mother | 63 (20.9%) | 3.19 |
| Non-family | 116 (38.4%) | - |
| Total Households | 302 (100.0%) | 2.24 |
Household Size by Marriage Status in Starbrick
Out of a total of 302 households in Starbrick, 186 (61.6%) are family households, while 116 (38.4%) are nonfamily households. The most numerous type of family households are 2-person households, comprising 108, and the most common type of nonfamily households are 1-person households, comprising 116.
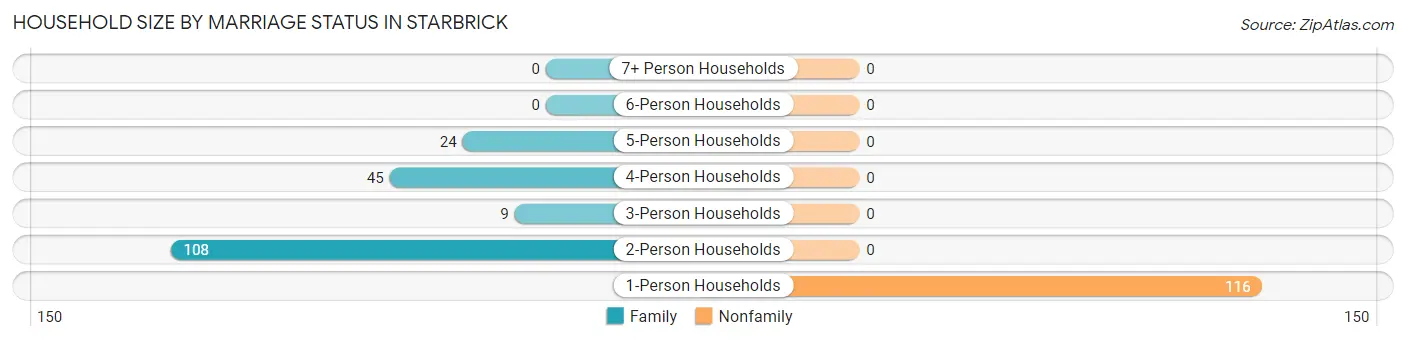
| Household Size | Family Households | Nonfamily Households |
| 1-Person Households | - | 116 (38.4%) |
| 2-Person Households | 108 (35.8%) | 0 (0.0%) |
| 3-Person Households | 9 (3.0%) | 0 (0.0%) |
| 4-Person Households | 45 (14.9%) | 0 (0.0%) |
| 5-Person Households | 24 (8.0%) | 0 (0.0%) |
| 6-Person Households | 0 (0.0%) | 0 (0.0%) |
| 7+ Person Households | 0 (0.0%) | 0 (0.0%) |
| Total | 186 (61.6%) | 116 (38.4%) |
Female Fertility in Starbrick
Fertility by Age in Starbrick
Average fertility rate in Starbrick is 301.0 births per 1,000 women. Women in the age bracket of 20 to 34 years have the highest fertility rate with 468.0 births per 1,000 women. Women in the age bracket of 20 to 34 years acount for 100.0% of all women with births.
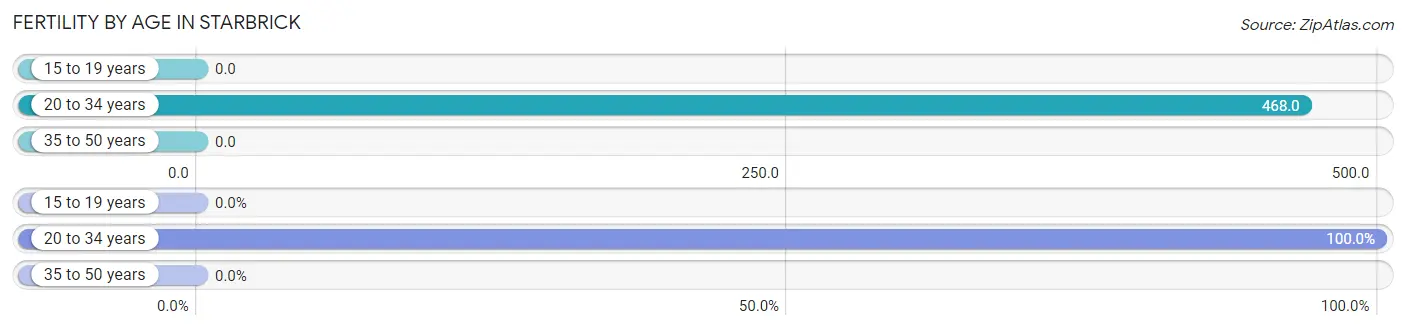
| Age Bracket | Women with Births | Births / 1,000 Women |
| 15 to 19 years | 0 (0.0%) | 0.0 |
| 20 to 34 years | 37 (100.0%) | 468.0 |
| 35 to 50 years | 0 (0.0%) | 0.0 |
| Total | 37 (100.0%) | 301.0 |
Fertility by Age by Marriage Status in Starbrick
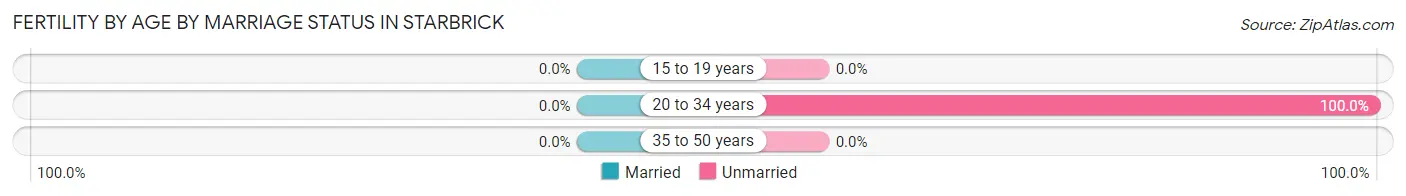
| Age Bracket | Married | Unmarried |
| 15 to 19 years | 0 (0.0%) | 0 (0.0%) |
| 20 to 34 years | 0 (0.0%) | 37 (100.0%) |
| 35 to 50 years | 0 (0.0%) | 0 (0.0%) |
| Total | 0 (0.0%) | 37 (100.0%) |
Fertility by Education in Starbrick
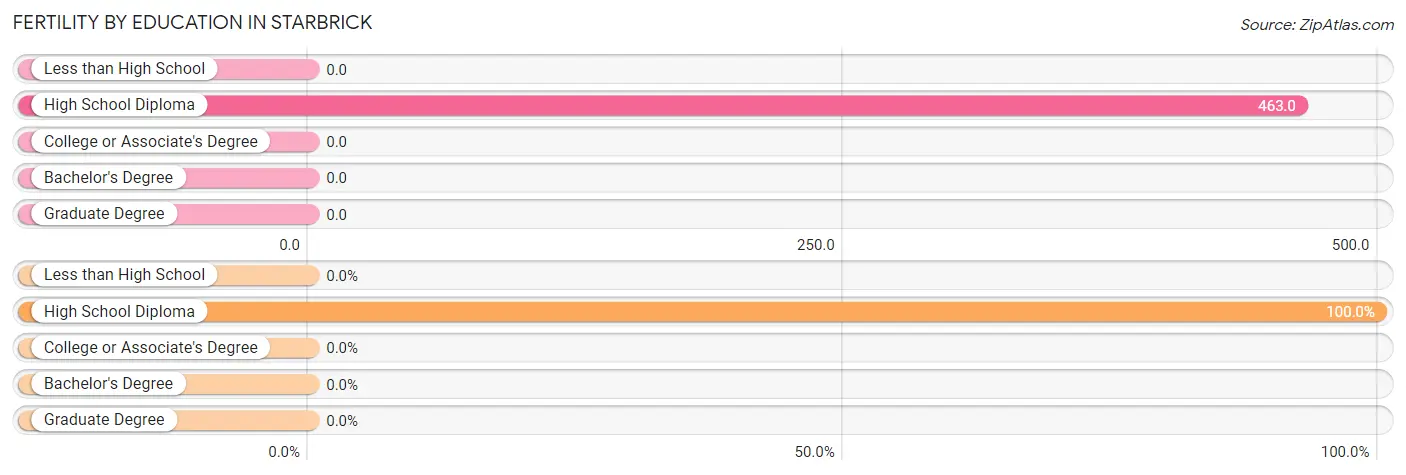
| Educational Attainment | Women with Births | Births / 1,000 Women |
| Less than High School | 0 (0.0%) | 0.0 |
| High School Diploma | 37 (100.0%) | 463.0 |
| College or Associate's Degree | 0 (0.0%) | 0.0 |
| Bachelor's Degree | 0 (0.0%) | 0.0 |
| Graduate Degree | 0 (0.0%) | 0.0 |
| Total | 37 (100.0%) | 301.0 |
Fertility by Education by Marriage Status in Starbrick
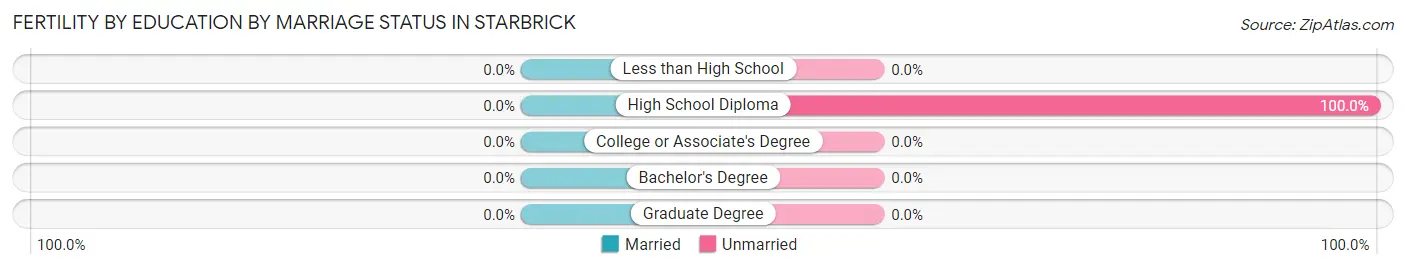
| Educational Attainment | Married | Unmarried |
| Less than High School | 0 (0.0%) | 0 (0.0%) |
| High School Diploma | 0 (0.0%) | 37 (100.0%) |
| College or Associate's Degree | 0 (0.0%) | 0 (0.0%) |
| Bachelor's Degree | 0 (0.0%) | 0 (0.0%) |
| Graduate Degree | 0 (0.0%) | 0 (0.0%) |
| Total | 0 (0.0%) | 37 (100.0%) |
Employment Characteristics in Starbrick
Employment by Class of Employer in Starbrick
Among the 271 employed individuals in Starbrick, private company employees (201 | 74.2%), not-for-profit organizations (36 | 13.3%), and local government employees (34 | 12.6%) make up the most common classes of employment.
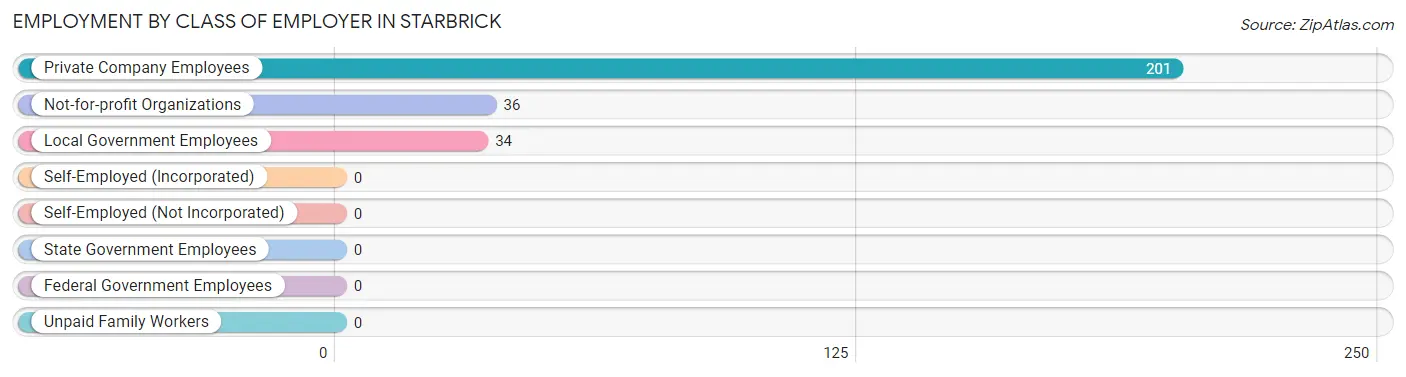
| Employer Class | # Employees | % Employees |
| Private Company Employees | 201 | 74.2% |
| Self-Employed (Incorporated) | 0 | 0.0% |
| Self-Employed (Not Incorporated) | 0 | 0.0% |
| Not-for-profit Organizations | 36 | 13.3% |
| Local Government Employees | 34 | 12.6% |
| State Government Employees | 0 | 0.0% |
| Federal Government Employees | 0 | 0.0% |
| Unpaid Family Workers | 0 | 0.0% |
| Total | 271 | 100.0% |
Employment Status by Age in Starbrick
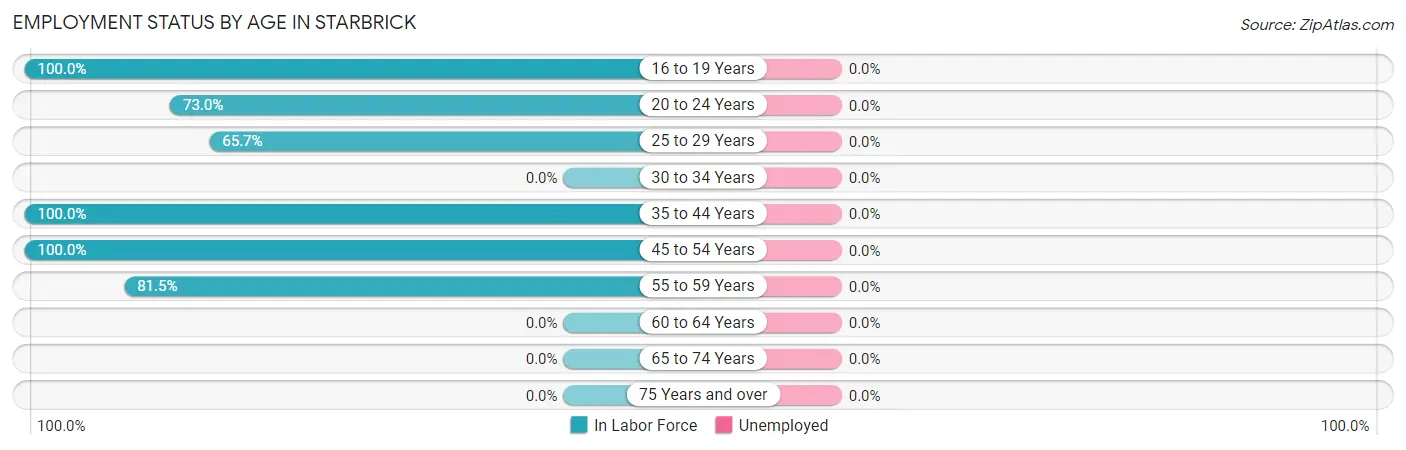
| Age Bracket | In Labor Force | Unemployed |
| 16 to 19 Years | 7 (100.0%) | 0 (0.0%) |
| 20 to 24 Years | 54 (73.0%) | 0 (0.0%) |
| 25 to 29 Years | 23 (65.7%) | 0 (0.0%) |
| 30 to 34 Years | 0 (0.0%) | 0 (0.0%) |
| 35 to 44 Years | 7 (100.0%) | 0 (0.0%) |
| 45 to 54 Years | 114 (100.0%) | 0 (0.0%) |
| 55 to 59 Years | 66 (81.5%) | 0 (0.0%) |
| 60 to 64 Years | 0 (0.0%) | 0 (0.0%) |
| 65 to 74 Years | 0 (0.0%) | 0 (0.0%) |
| 75 Years and over | 0 (0.0%) | 0 (0.0%) |
| Total | 271 (59.6%) | 0 (0.0%) |
Employment Status by Educational Attainment in Starbrick
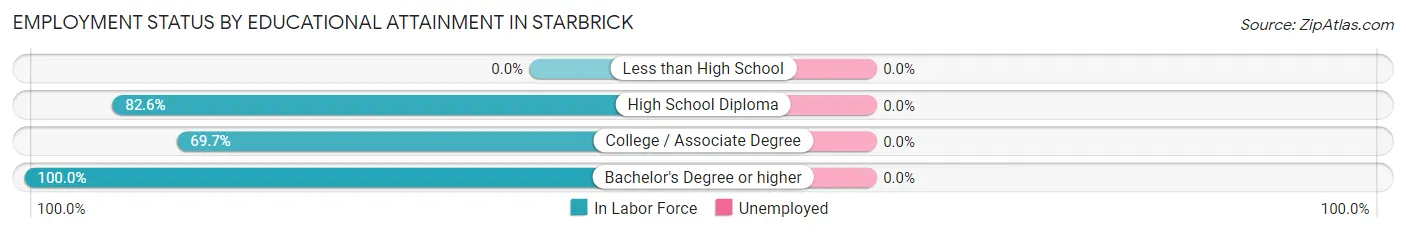
| Educational Attainment | In Labor Force | Unemployed |
| Less than High School | 0 (0.0%) | 0 (0.0%) |
| High School Diploma | 128 (82.6%) | 0 (0.0%) |
| College / Associate Degree | 46 (69.7%) | 0 (0.0%) |
| Bachelor's Degree or higher | 36 (100.0%) | 0 (0.0%) |
| Total | 210 (81.7%) | 0 (0.0%) |
Employment Occupations by Sex in Starbrick
Management, Business, Science and Arts Occupations
The most common Management, Business, Science and Arts occupations in Starbrick are Health Diagnosing & Treating (30 | 11.1%), Business & Financial (26 | 9.6%), Community & Social Service (22 | 8.1%), Arts, Media & Entertainment (12 | 4.4%), and Education Instruction & Library (10 | 3.7%).
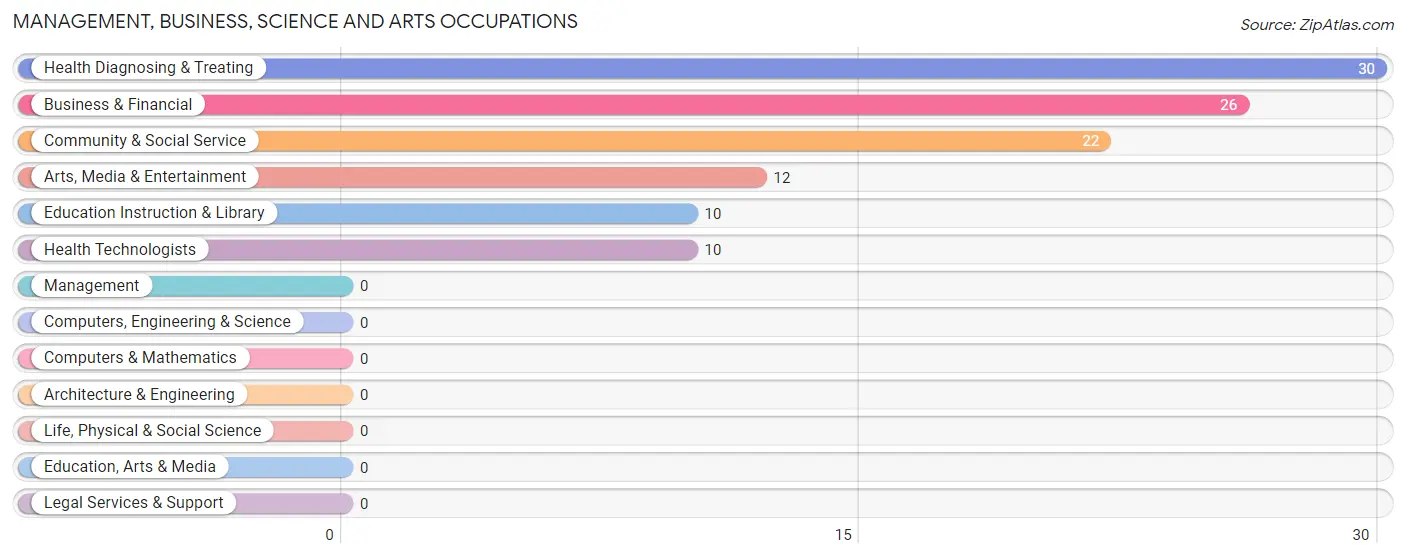
Management, Business, Science and Arts Occupations by Sex
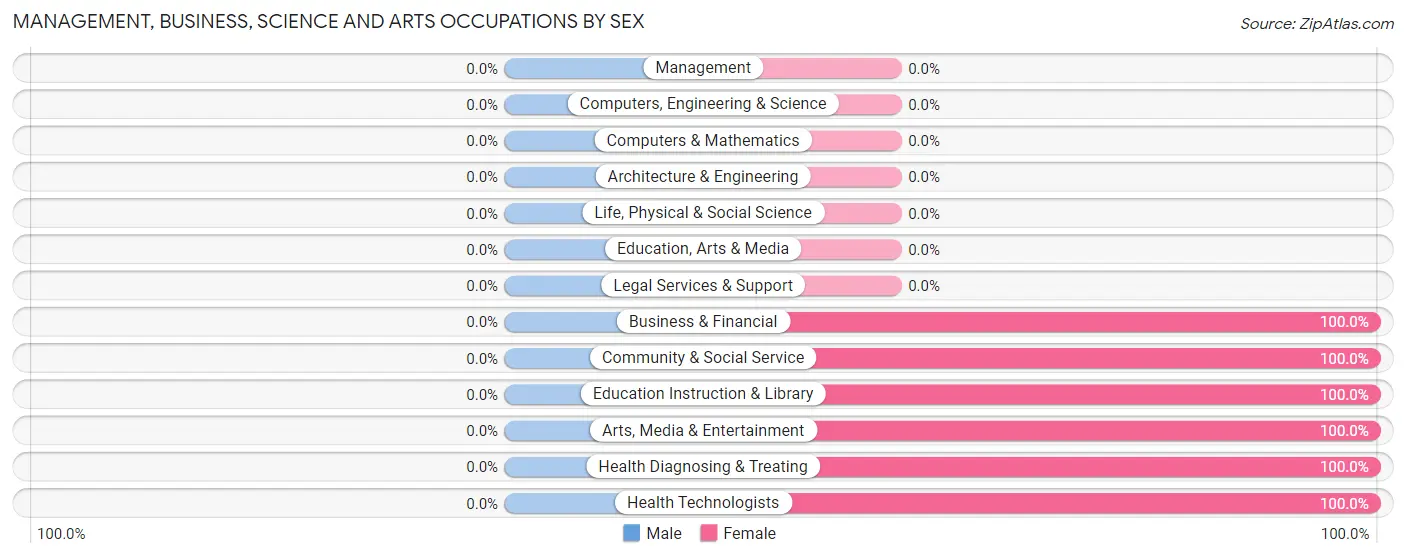
| Occupation | Male | Female |
| Management | 0 (0.0%) | 0 (0.0%) |
| Business & Financial | 0 (0.0%) | 26 (100.0%) |
| Computers, Engineering & Science | 0 (0.0%) | 0 (0.0%) |
| Computers & Mathematics | 0 (0.0%) | 0 (0.0%) |
| Architecture & Engineering | 0 (0.0%) | 0 (0.0%) |
| Life, Physical & Social Science | 0 (0.0%) | 0 (0.0%) |
| Community & Social Service | 0 (0.0%) | 22 (100.0%) |
| Education, Arts & Media | 0 (0.0%) | 0 (0.0%) |
| Legal Services & Support | 0 (0.0%) | 0 (0.0%) |
| Education Instruction & Library | 0 (0.0%) | 10 (100.0%) |
| Arts, Media & Entertainment | 0 (0.0%) | 12 (100.0%) |
| Health Diagnosing & Treating | 0 (0.0%) | 30 (100.0%) |
| Health Technologists | 0 (0.0%) | 10 (100.0%) |
| Total (Category) | 0 (0.0%) | 78 (100.0%) |
| Total (Overall) | 114 (42.1%) | 157 (57.9%) |
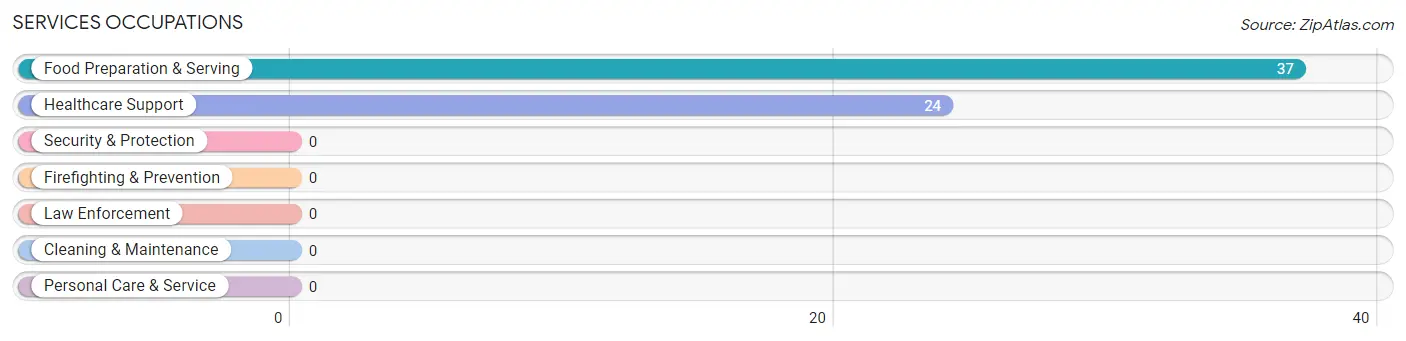
Services Occupations
The most common Services occupations in Starbrick are Food Preparation & Serving (37 | 13.7%), and Healthcare Support (24 | 8.9%).
Services Occupations by Sex
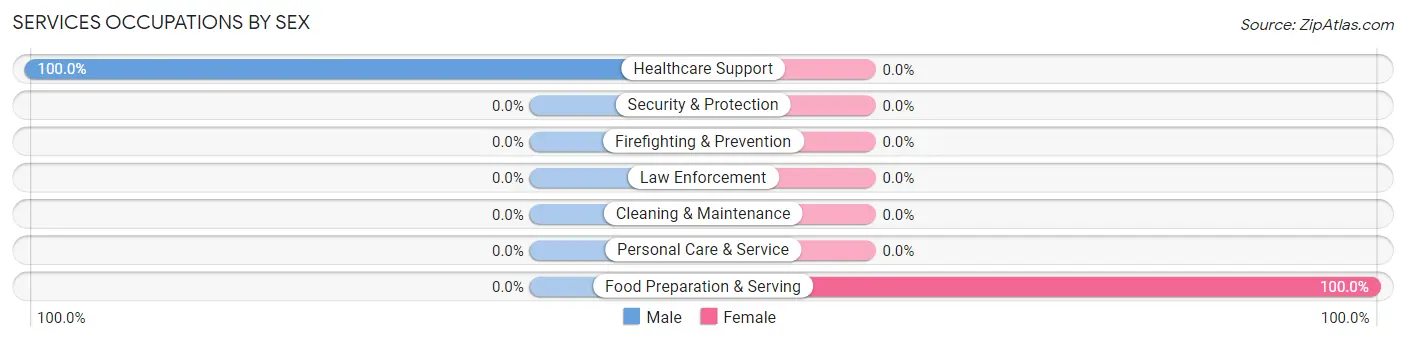
| Occupation | Male | Female |
| Healthcare Support | 24 (100.0%) | 0 (0.0%) |
| Security & Protection | 0 (0.0%) | 0 (0.0%) |
| Firefighting & Prevention | 0 (0.0%) | 0 (0.0%) |
| Law Enforcement | 0 (0.0%) | 0 (0.0%) |
| Food Preparation & Serving | 0 (0.0%) | 37 (100.0%) |
| Cleaning & Maintenance | 0 (0.0%) | 0 (0.0%) |
| Personal Care & Service | 0 (0.0%) | 0 (0.0%) |
| Total (Category) | 24 (39.3%) | 37 (60.7%) |
| Total (Overall) | 114 (42.1%) | 157 (57.9%) |
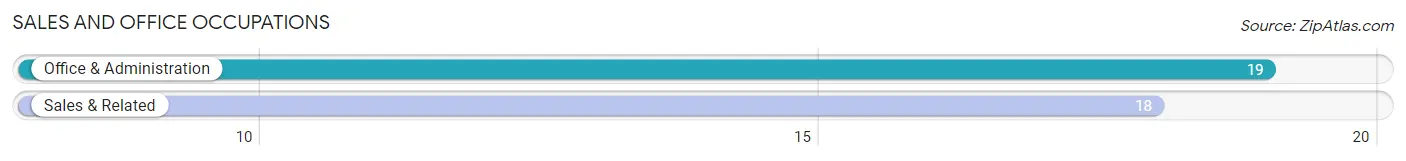
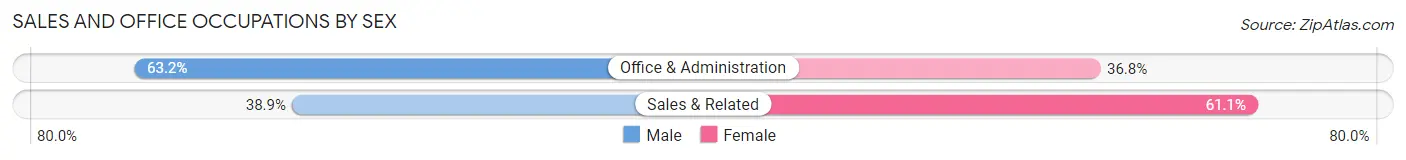
Sales and Office Occupations
The most common Sales and Office occupations in Starbrick are Office & Administration (19 | 7.0%), and Sales & Related (18 | 6.6%).
Sales and Office Occupations by Sex
| Occupation | Male | Female |
| Sales & Related | 7 (38.9%) | 11 (61.1%) |
| Office & Administration | 12 (63.2%) | 7 (36.8%) |
| Total (Category) | 19 (51.3%) | 18 (48.6%) |
| Total (Overall) | 114 (42.1%) | 157 (57.9%) |
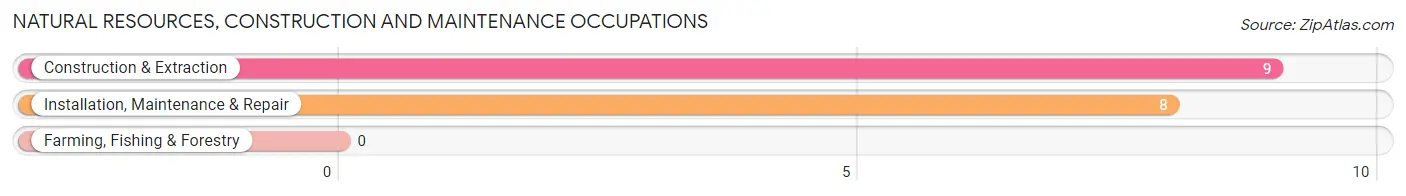
Natural Resources, Construction and Maintenance Occupations
The most common Natural Resources, Construction and Maintenance occupations in Starbrick are Construction & Extraction (9 | 3.3%), and Installation, Maintenance & Repair (8 | 2.9%).
Natural Resources, Construction and Maintenance Occupations by Sex
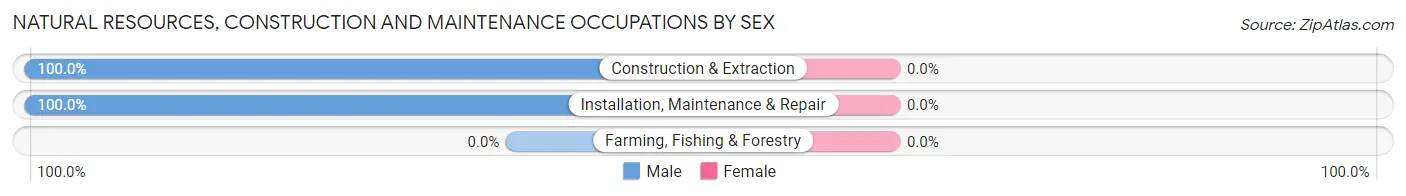
| Occupation | Male | Female |
| Farming, Fishing & Forestry | 0 (0.0%) | 0 (0.0%) |
| Construction & Extraction | 9 (100.0%) | 0 (0.0%) |
| Installation, Maintenance & Repair | 8 (100.0%) | 0 (0.0%) |
| Total (Category) | 17 (100.0%) | 0 (0.0%) |
| Total (Overall) | 114 (42.1%) | 157 (57.9%) |
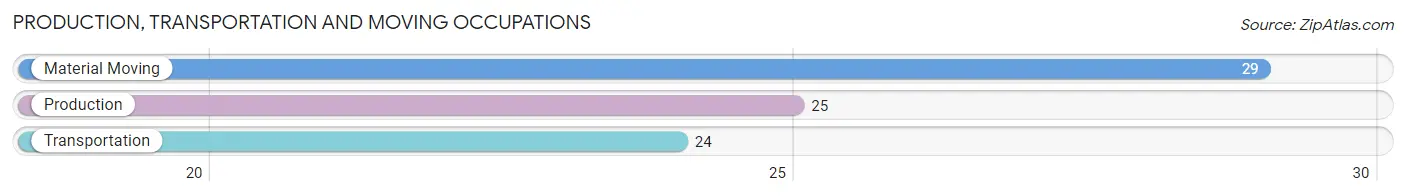
Production, Transportation and Moving Occupations
The most common Production, Transportation and Moving occupations in Starbrick are Material Moving (29 | 10.7%), Production (25 | 9.2%), and Transportation (24 | 8.9%).
Production, Transportation and Moving Occupations by Sex
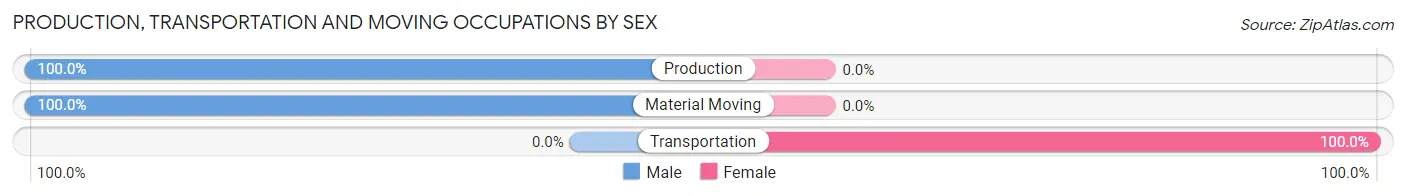
| Occupation | Male | Female |
| Production | 25 (100.0%) | 0 (0.0%) |
| Transportation | 0 (0.0%) | 24 (100.0%) |
| Material Moving | 29 (100.0%) | 0 (0.0%) |
| Total (Category) | 54 (69.2%) | 24 (30.8%) |
| Total (Overall) | 114 (42.1%) | 157 (57.9%) |
Employment Industries by Sex in Starbrick
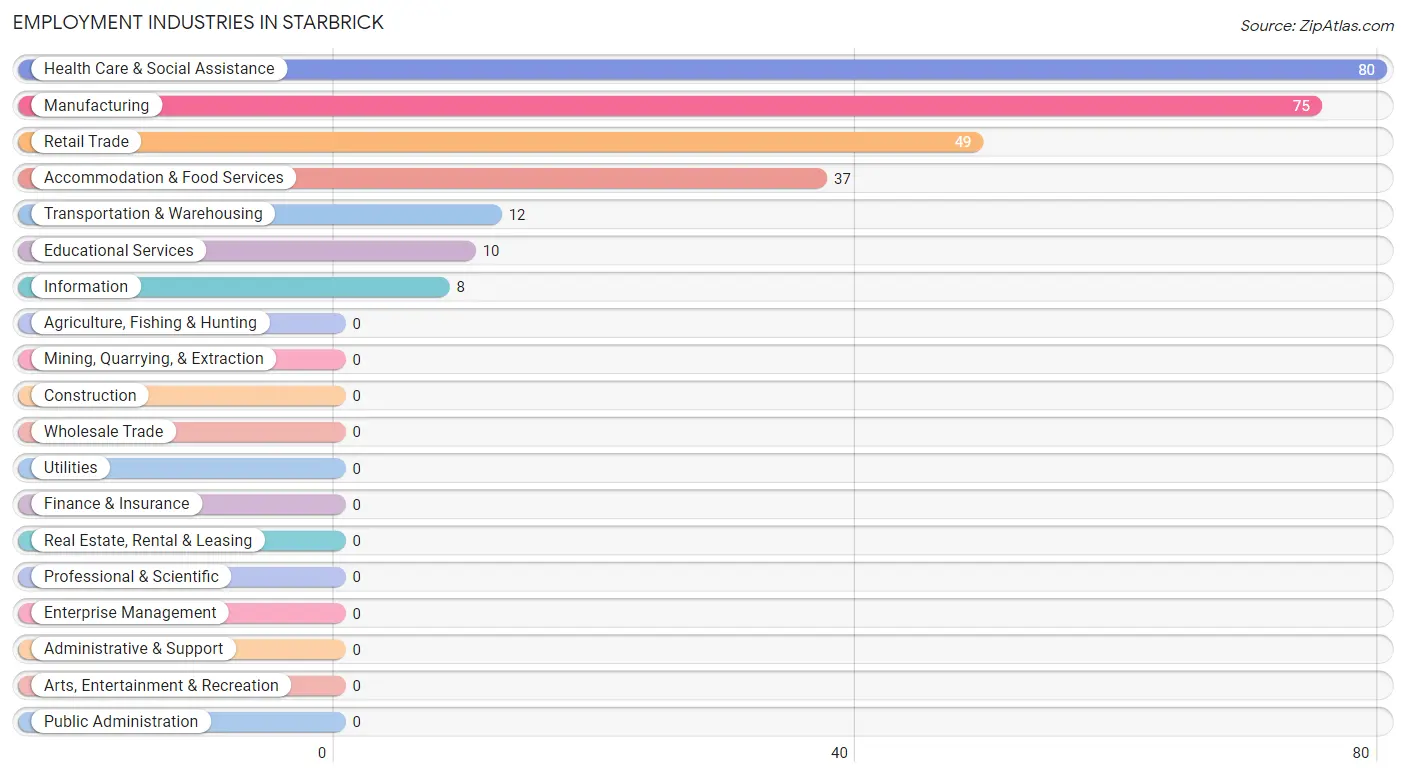
Employment Industries in Starbrick
The major employment industries in Starbrick include Health Care & Social Assistance (80 | 29.5%), Manufacturing (75 | 27.7%), Retail Trade (49 | 18.1%), Accommodation & Food Services (37 | 13.7%), and Transportation & Warehousing (12 | 4.4%).
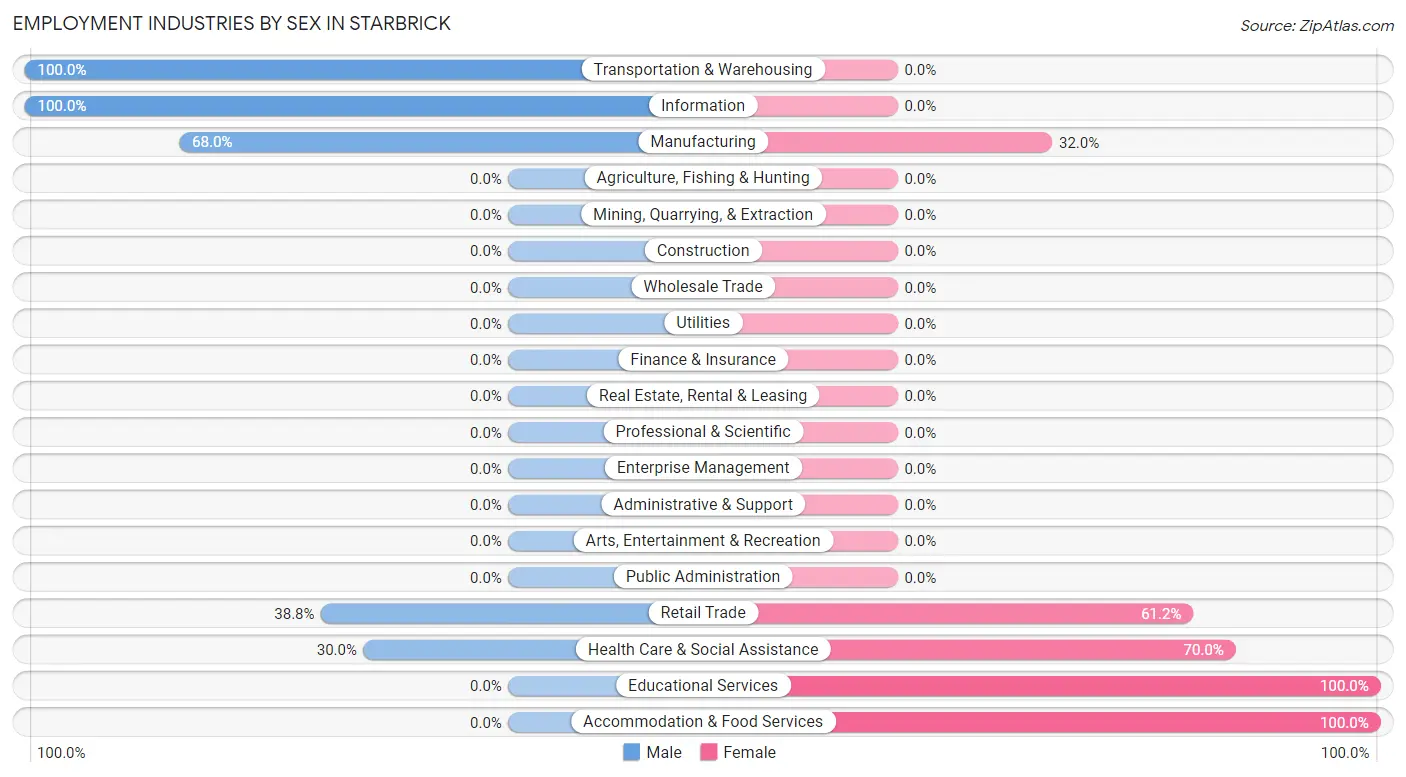
Employment Industries by Sex in Starbrick
The Starbrick industries that see more men than women are Transportation & Warehousing (100.0%), Information (100.0%), and Manufacturing (68.0%), whereas the industries that tend to have a higher number of women are Educational Services (100.0%), Accommodation & Food Services (100.0%), and Health Care & Social Assistance (70.0%).
| Industry | Male | Female |
| Agriculture, Fishing & Hunting | 0 (0.0%) | 0 (0.0%) |
| Mining, Quarrying, & Extraction | 0 (0.0%) | 0 (0.0%) |
| Construction | 0 (0.0%) | 0 (0.0%) |
| Manufacturing | 51 (68.0%) | 24 (32.0%) |
| Wholesale Trade | 0 (0.0%) | 0 (0.0%) |
| Retail Trade | 19 (38.8%) | 30 (61.2%) |
| Transportation & Warehousing | 12 (100.0%) | 0 (0.0%) |
| Utilities | 0 (0.0%) | 0 (0.0%) |
| Information | 8 (100.0%) | 0 (0.0%) |
| Finance & Insurance | 0 (0.0%) | 0 (0.0%) |
| Real Estate, Rental & Leasing | 0 (0.0%) | 0 (0.0%) |
| Professional & Scientific | 0 (0.0%) | 0 (0.0%) |
| Enterprise Management | 0 (0.0%) | 0 (0.0%) |
| Administrative & Support | 0 (0.0%) | 0 (0.0%) |
| Educational Services | 0 (0.0%) | 10 (100.0%) |
| Health Care & Social Assistance | 24 (30.0%) | 56 (70.0%) |
| Arts, Entertainment & Recreation | 0 (0.0%) | 0 (0.0%) |
| Accommodation & Food Services | 0 (0.0%) | 37 (100.0%) |
| Public Administration | 0 (0.0%) | 0 (0.0%) |
| Total | 114 (42.1%) | 157 (57.9%) |
Education in Starbrick
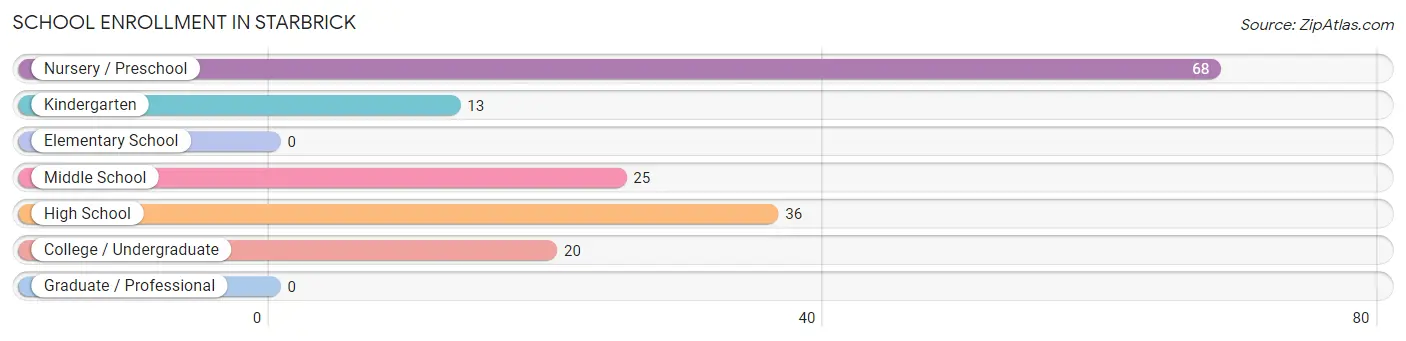
School Enrollment in Starbrick
The most common levels of schooling among the 162 students in Starbrick are nursery / preschool (68 | 42.0%), high school (36 | 22.2%), and middle school (25 | 15.4%).
| School Level | # Students | % Students |
| Nursery / Preschool | 68 | 42.0% |
| Kindergarten | 13 | 8.0% |
| Elementary School | 0 | 0.0% |
| Middle School | 25 | 15.4% |
| High School | 36 | 22.2% |
| College / Undergraduate | 20 | 12.3% |
| Graduate / Professional | 0 | 0.0% |
| Total | 162 | 100.0% |
School Enrollment by Age by Funding Source in Starbrick
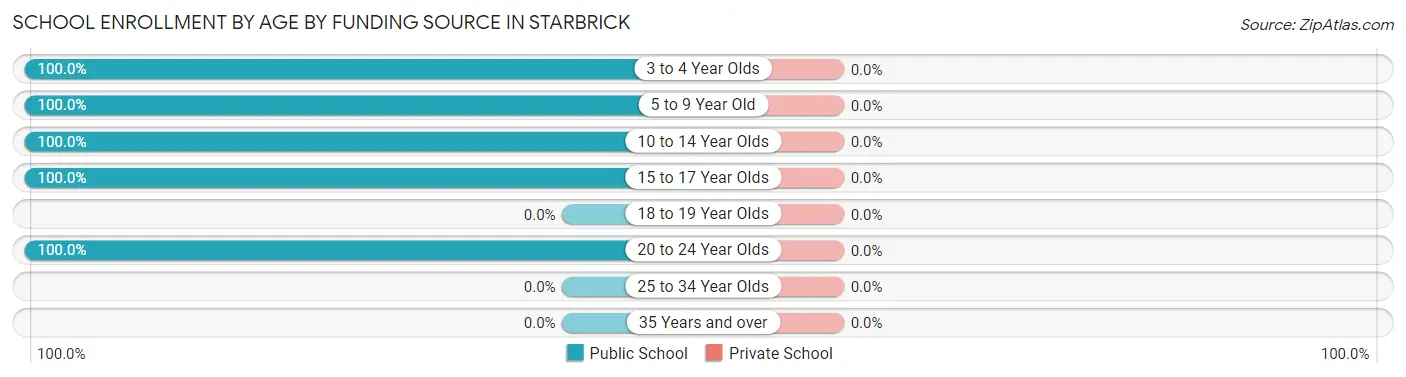
| Age Bracket | Public School | Private School |
| 3 to 4 Year Olds | 34 (100.0%) | 0 (0.0%) |
| 5 to 9 Year Old | 47 (100.0%) | 0 (0.0%) |
| 10 to 14 Year Olds | 54 (100.0%) | 0 (0.0%) |
| 15 to 17 Year Olds | 7 (100.0%) | 0 (0.0%) |
| 18 to 19 Year Olds | 0 (0.0%) | 0 (0.0%) |
| 20 to 24 Year Olds | 20 (100.0%) | 0 (0.0%) |
| 25 to 34 Year Olds | 0 (0.0%) | 0 (0.0%) |
| 35 Years and over | 0 (0.0%) | 0 (0.0%) |
| Total | 162 (100.0%) | 0 (0.0%) |
Educational Attainment by Field of Study in Starbrick
Bio, nature & agricultural (26 | 44.8%), literature & languages (22 | 37.9%), and science & technology (10 | 17.2%) are the most common fields of study among 58 individuals in Starbrick who have obtained a bachelor's degree or higher.
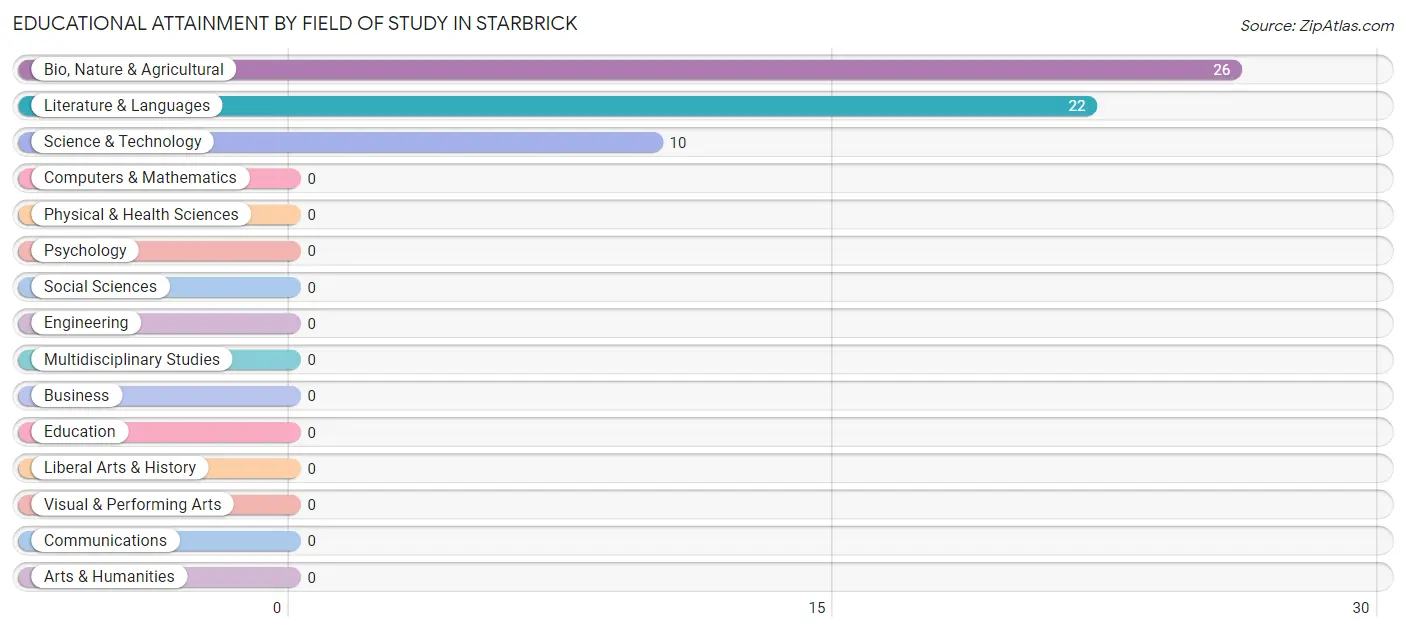
| Field of Study | # Graduates | % Graduates |
| Computers & Mathematics | 0 | 0.0% |
| Bio, Nature & Agricultural | 26 | 44.8% |
| Physical & Health Sciences | 0 | 0.0% |
| Psychology | 0 | 0.0% |
| Social Sciences | 0 | 0.0% |
| Engineering | 0 | 0.0% |
| Multidisciplinary Studies | 0 | 0.0% |
| Science & Technology | 10 | 17.2% |
| Business | 0 | 0.0% |
| Education | 0 | 0.0% |
| Literature & Languages | 22 | 37.9% |
| Liberal Arts & History | 0 | 0.0% |
| Visual & Performing Arts | 0 | 0.0% |
| Communications | 0 | 0.0% |
| Arts & Humanities | 0 | 0.0% |
| Total | 58 | 100.0% |
Transportation & Commute in Starbrick
Vehicle Availability by Sex in Starbrick
The most prevalent vehicle ownership categories in Starbrick are males with 1 vehicle (49, accounting for 43.0%) and females with 1 vehicle (59, making up 31.2%).
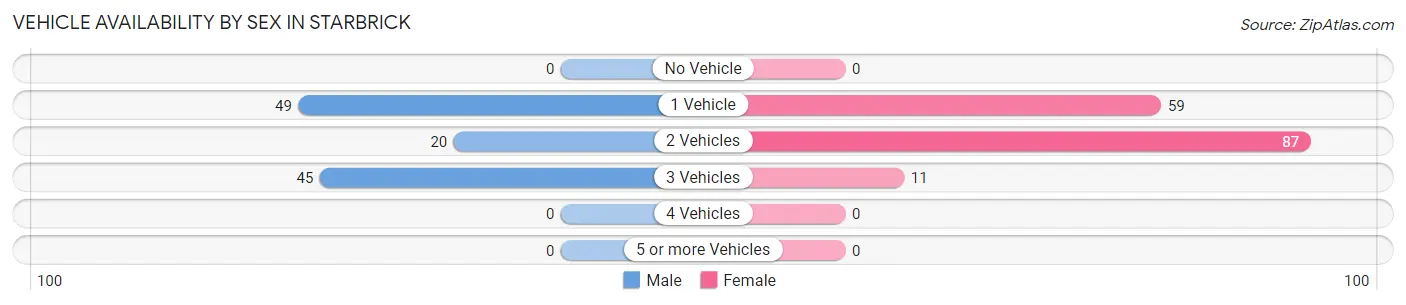
| Vehicles Available | Male | Female |
| No Vehicle | 0 (0.0%) | 0 (0.0%) |
| 1 Vehicle | 49 (43.0%) | 59 (37.6%) |
| 2 Vehicles | 20 (17.5%) | 87 (55.4%) |
| 3 Vehicles | 45 (39.5%) | 11 (7.0%) |
| 4 Vehicles | 0 (0.0%) | 0 (0.0%) |
| 5 or more Vehicles | 0 (0.0%) | 0 (0.0%) |
| Total | 114 (100.0%) | 157 (100.0%) |
Commute Time in Starbrick
The most frequently occuring commute durations in Starbrick are 10 to 14 minutes (90 commuters, 33.2%), 5 to 9 minutes (70 commuters, 25.8%), and 15 to 19 minutes (64 commuters, 23.6%).
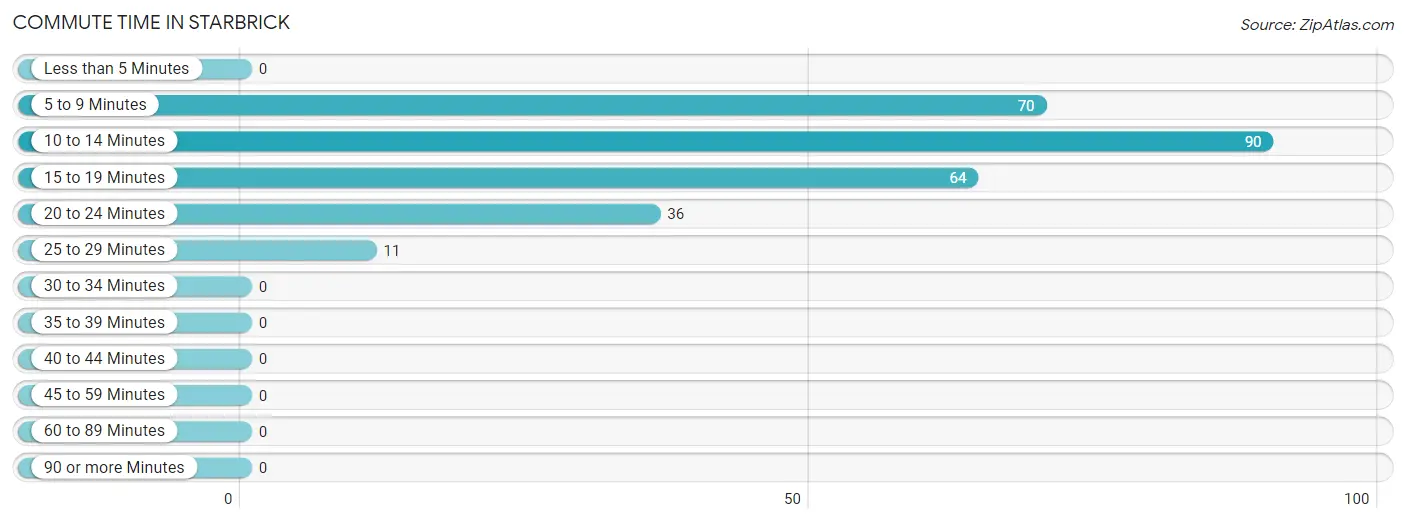
| Commute Time | # Commuters | % Commuters |
| Less than 5 Minutes | 0 | 0.0% |
| 5 to 9 Minutes | 70 | 25.8% |
| 10 to 14 Minutes | 90 | 33.2% |
| 15 to 19 Minutes | 64 | 23.6% |
| 20 to 24 Minutes | 36 | 13.3% |
| 25 to 29 Minutes | 11 | 4.1% |
| 30 to 34 Minutes | 0 | 0.0% |
| 35 to 39 Minutes | 0 | 0.0% |
| 40 to 44 Minutes | 0 | 0.0% |
| 45 to 59 Minutes | 0 | 0.0% |
| 60 to 89 Minutes | 0 | 0.0% |
| 90 or more Minutes | 0 | 0.0% |
Commute Time by Sex in Starbrick
The most common commute times in Starbrick are 15 to 19 minutes (45 commuters, 39.5%) for males and 10 to 14 minutes (90 commuters, 57.3%) for females.
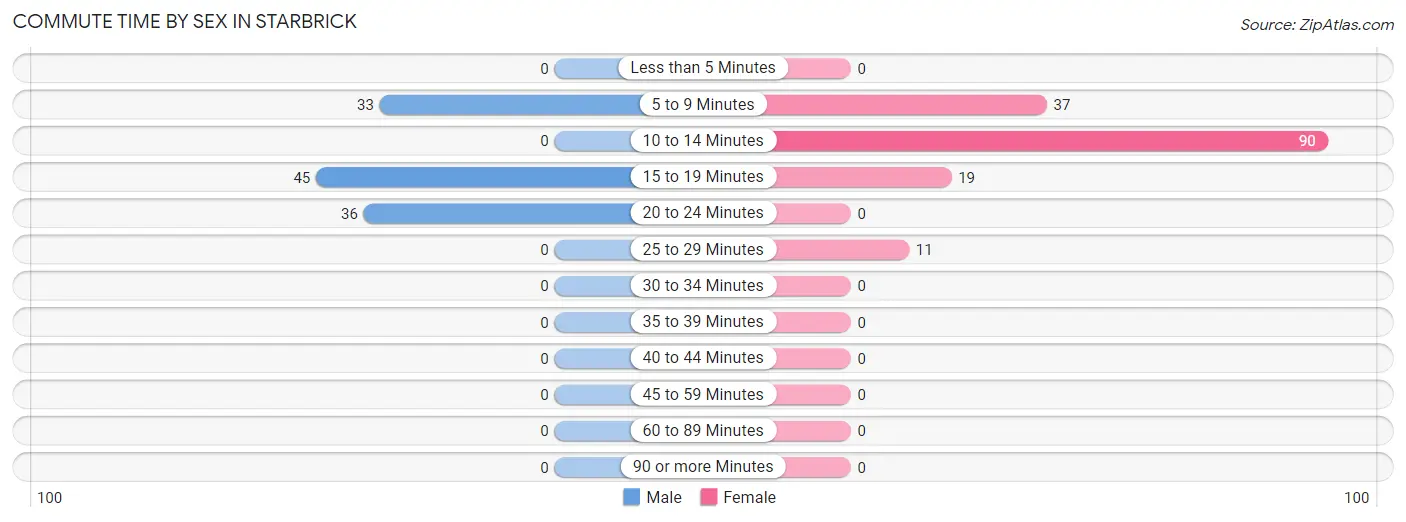
| Commute Time | Male | Female |
| Less than 5 Minutes | 0 (0.0%) | 0 (0.0%) |
| 5 to 9 Minutes | 33 (28.9%) | 37 (23.6%) |
| 10 to 14 Minutes | 0 (0.0%) | 90 (57.3%) |
| 15 to 19 Minutes | 45 (39.5%) | 19 (12.1%) |
| 20 to 24 Minutes | 36 (31.6%) | 0 (0.0%) |
| 25 to 29 Minutes | 0 (0.0%) | 11 (7.0%) |
| 30 to 34 Minutes | 0 (0.0%) | 0 (0.0%) |
| 35 to 39 Minutes | 0 (0.0%) | 0 (0.0%) |
| 40 to 44 Minutes | 0 (0.0%) | 0 (0.0%) |
| 45 to 59 Minutes | 0 (0.0%) | 0 (0.0%) |
| 60 to 89 Minutes | 0 (0.0%) | 0 (0.0%) |
| 90 or more Minutes | 0 (0.0%) | 0 (0.0%) |
Time of Departure to Work by Sex in Starbrick
The most frequent times of departure to work in Starbrick are 5:30 AM to 5:59 AM (29, 25.4%) for males and 12:00 AM to 4:59 AM (63, 40.1%) for females.
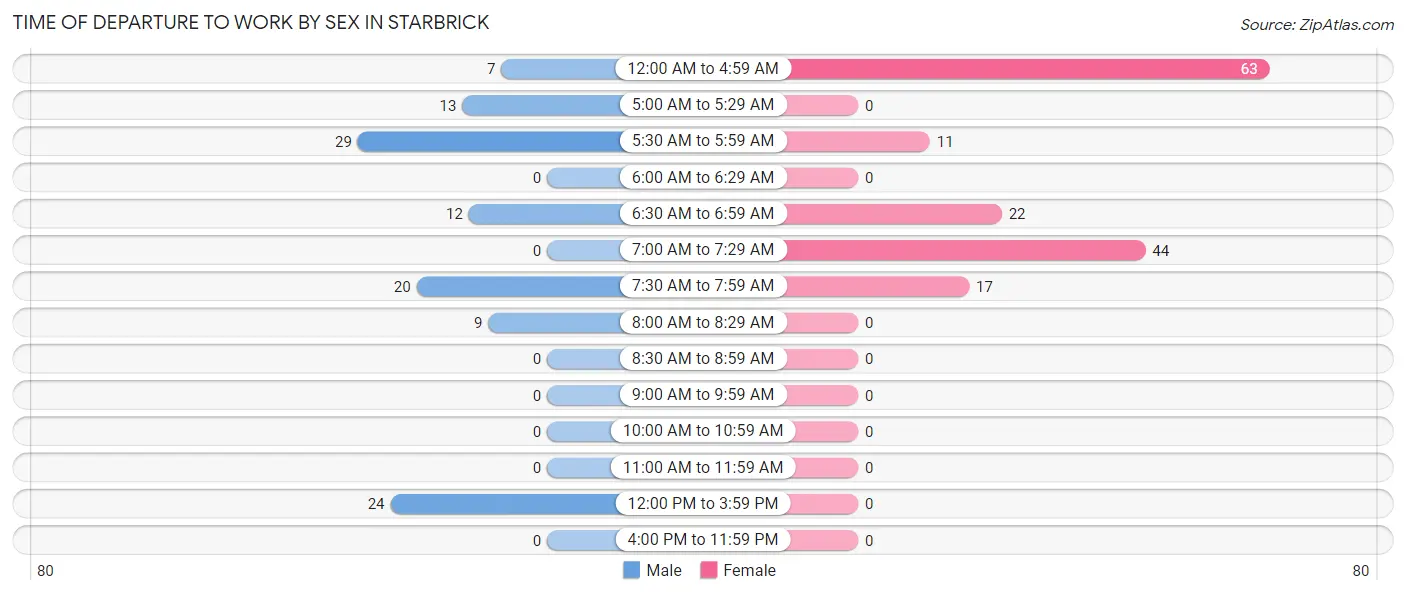
| Time of Departure | Male | Female |
| 12:00 AM to 4:59 AM | 7 (6.1%) | 63 (40.1%) |
| 5:00 AM to 5:29 AM | 13 (11.4%) | 0 (0.0%) |
| 5:30 AM to 5:59 AM | 29 (25.4%) | 11 (7.0%) |
| 6:00 AM to 6:29 AM | 0 (0.0%) | 0 (0.0%) |
| 6:30 AM to 6:59 AM | 12 (10.5%) | 22 (14.0%) |
| 7:00 AM to 7:29 AM | 0 (0.0%) | 44 (28.0%) |
| 7:30 AM to 7:59 AM | 20 (17.5%) | 17 (10.8%) |
| 8:00 AM to 8:29 AM | 9 (7.9%) | 0 (0.0%) |
| 8:30 AM to 8:59 AM | 0 (0.0%) | 0 (0.0%) |
| 9:00 AM to 9:59 AM | 0 (0.0%) | 0 (0.0%) |
| 10:00 AM to 10:59 AM | 0 (0.0%) | 0 (0.0%) |
| 11:00 AM to 11:59 AM | 0 (0.0%) | 0 (0.0%) |
| 12:00 PM to 3:59 PM | 24 (21.0%) | 0 (0.0%) |
| 4:00 PM to 11:59 PM | 0 (0.0%) | 0 (0.0%) |
| Total | 114 (100.0%) | 157 (100.0%) |
Housing Occupancy in Starbrick
Occupancy by Ownership in Starbrick
Of the total 302 dwellings in Starbrick, owner-occupied units account for 212 (70.2%), while renter-occupied units make up 90 (29.8%).
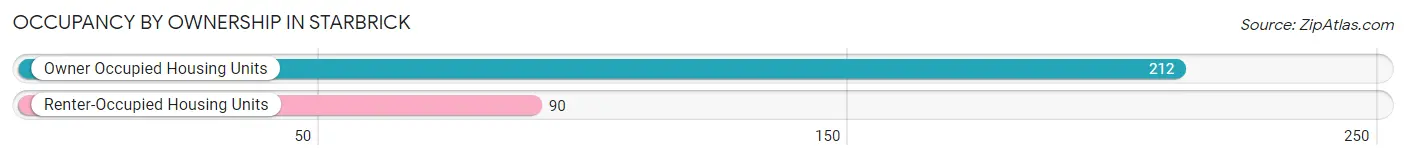
| Occupancy | # Housing Units | % Housing Units |
| Owner Occupied Housing Units | 212 | 70.2% |
| Renter-Occupied Housing Units | 90 | 29.8% |
| Total Occupied Housing Units | 302 | 100.0% |
Occupancy by Household Size in Starbrick
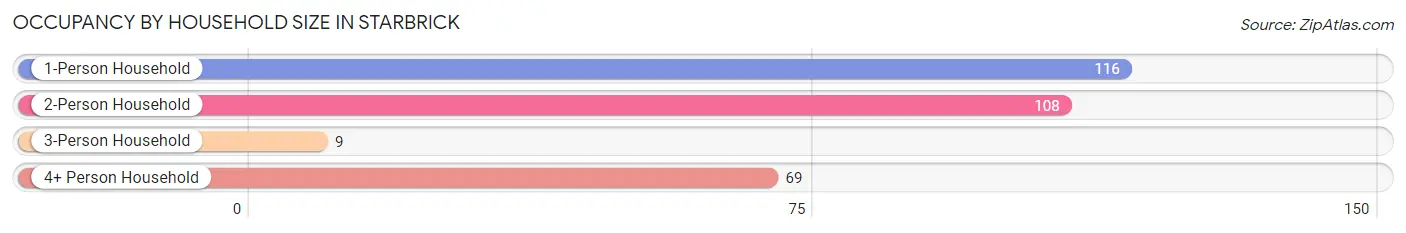
| Household Size | # Housing Units | % Housing Units |
| 1-Person Household | 116 | 38.4% |
| 2-Person Household | 108 | 35.8% |
| 3-Person Household | 9 | 3.0% |
| 4+ Person Household | 69 | 22.9% |
| Total Housing Units | 302 | 100.0% |
Occupancy by Ownership by Household Size in Starbrick
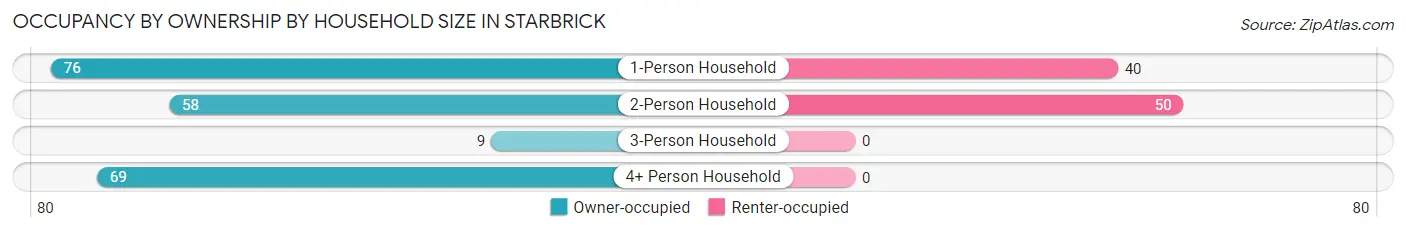
| Household Size | Owner-occupied | Renter-occupied |
| 1-Person Household | 76 (65.5%) | 40 (34.5%) |
| 2-Person Household | 58 (53.7%) | 50 (46.3%) |
| 3-Person Household | 9 (100.0%) | 0 (0.0%) |
| 4+ Person Household | 69 (100.0%) | 0 (0.0%) |
| Total Housing Units | 212 (70.2%) | 90 (29.8%) |
Occupancy by Educational Attainment in Starbrick
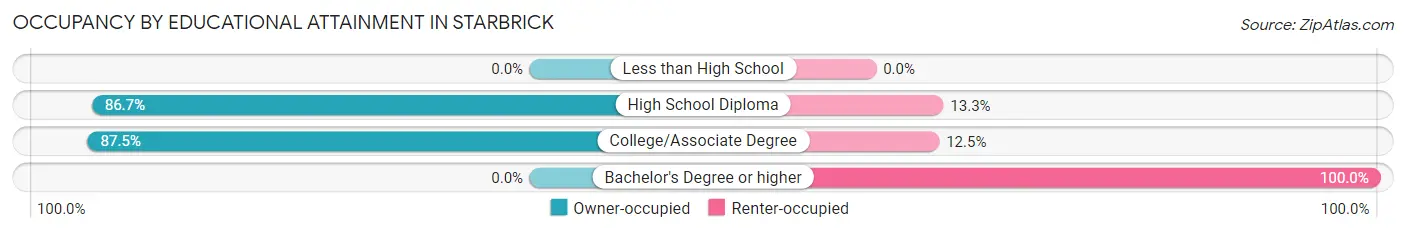
| Household Size | Owner-occupied | Renter-occupied |
| Less than High School | 0 (0.0%) | 0 (0.0%) |
| High School Diploma | 156 (86.7%) | 24 (13.3%) |
| College/Associate Degree | 56 (87.5%) | 8 (12.5%) |
| Bachelor's Degree or higher | 0 (0.0%) | 58 (100.0%) |
Occupancy by Age of Householder in Starbrick
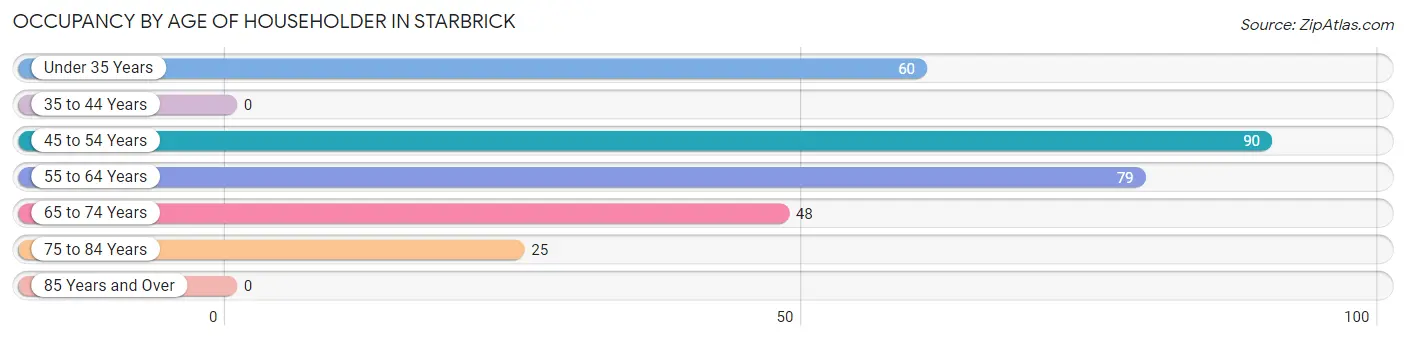
| Age Bracket | # Households | % Households |
| Under 35 Years | 60 | 19.9% |
| 35 to 44 Years | 0 | 0.0% |
| 45 to 54 Years | 90 | 29.8% |
| 55 to 64 Years | 79 | 26.2% |
| 65 to 74 Years | 48 | 15.9% |
| 75 to 84 Years | 25 | 8.3% |
| 85 Years and Over | 0 | 0.0% |
| Total | 302 | 100.0% |
Housing Finances in Starbrick
Median Income by Occupancy in Starbrick
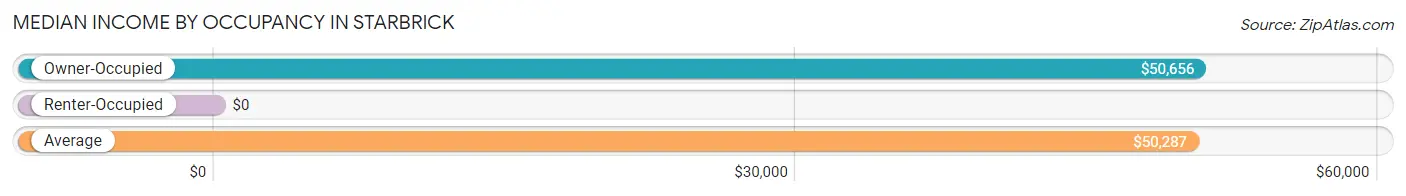
| Occupancy Type | # Households | Median Income |
| Owner-Occupied | 212 (70.2%) | $50,656 |
| Renter-Occupied | 90 (29.8%) | $0 |
| Average | 302 (100.0%) | $50,287 |
Occupancy by Householder Income Bracket in Starbrick
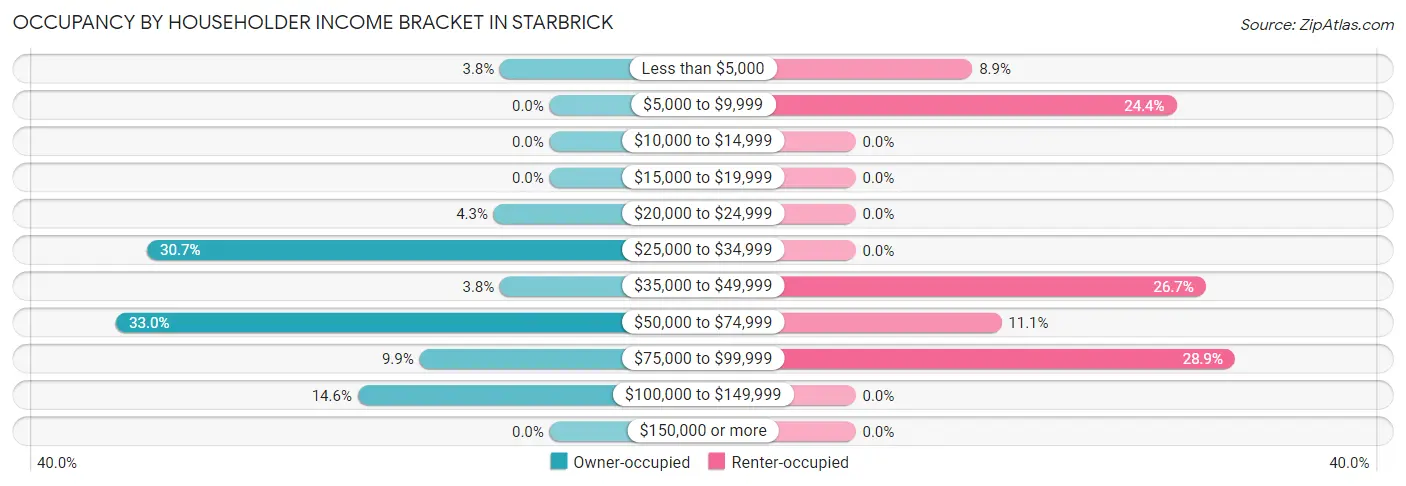
| Income Bracket | Owner-occupied | Renter-occupied |
| Less than $5,000 | 8 (3.8%) | 8 (8.9%) |
| $5,000 to $9,999 | 0 (0.0%) | 22 (24.4%) |
| $10,000 to $14,999 | 0 (0.0%) | 0 (0.0%) |
| $15,000 to $19,999 | 0 (0.0%) | 0 (0.0%) |
| $20,000 to $24,999 | 9 (4.3%) | 0 (0.0%) |
| $25,000 to $34,999 | 65 (30.7%) | 0 (0.0%) |
| $35,000 to $49,999 | 8 (3.8%) | 24 (26.7%) |
| $50,000 to $74,999 | 70 (33.0%) | 10 (11.1%) |
| $75,000 to $99,999 | 21 (9.9%) | 26 (28.9%) |
| $100,000 to $149,999 | 31 (14.6%) | 0 (0.0%) |
| $150,000 or more | 0 (0.0%) | 0 (0.0%) |
| Total | 212 (100.0%) | 90 (100.0%) |
Monthly Housing Cost Tiers in Starbrick
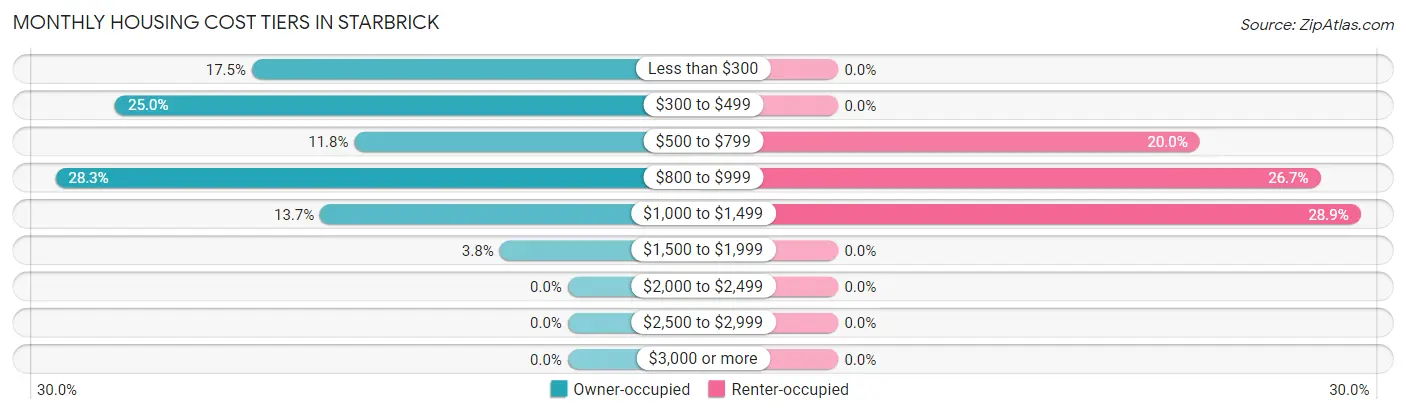
| Monthly Cost | Owner-occupied | Renter-occupied |
| Less than $300 | 37 (17.4%) | 0 (0.0%) |
| $300 to $499 | 53 (25.0%) | 0 (0.0%) |
| $500 to $799 | 25 (11.8%) | 18 (20.0%) |
| $800 to $999 | 60 (28.3%) | 24 (26.7%) |
| $1,000 to $1,499 | 29 (13.7%) | 26 (28.9%) |
| $1,500 to $1,999 | 8 (3.8%) | 0 (0.0%) |
| $2,000 to $2,499 | 0 (0.0%) | 0 (0.0%) |
| $2,500 to $2,999 | 0 (0.0%) | 0 (0.0%) |
| $3,000 or more | 0 (0.0%) | 0 (0.0%) |
| Total | 212 (100.0%) | 90 (100.0%) |
Physical Housing Characteristics in Starbrick
Housing Structures in Starbrick
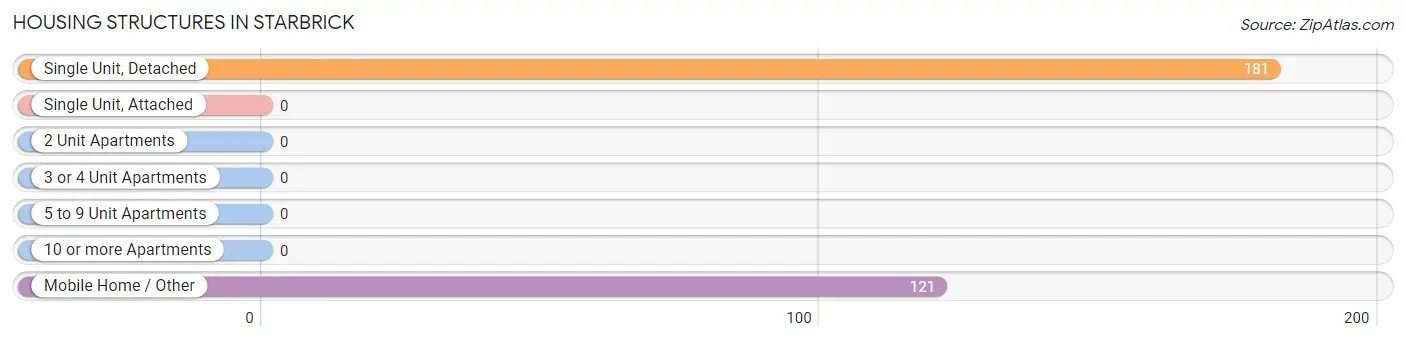
| Structure Type | # Housing Units | % Housing Units |
| Single Unit, Detached | 181 | 59.9% |
| Single Unit, Attached | 0 | 0.0% |
| 2 Unit Apartments | 0 | 0.0% |
| 3 or 4 Unit Apartments | 0 | 0.0% |
| 5 to 9 Unit Apartments | 0 | 0.0% |
| 10 or more Apartments | 0 | 0.0% |
| Mobile Home / Other | 121 | 40.1% |
| Total | 302 | 100.0% |
Housing Structures by Occupancy in Starbrick
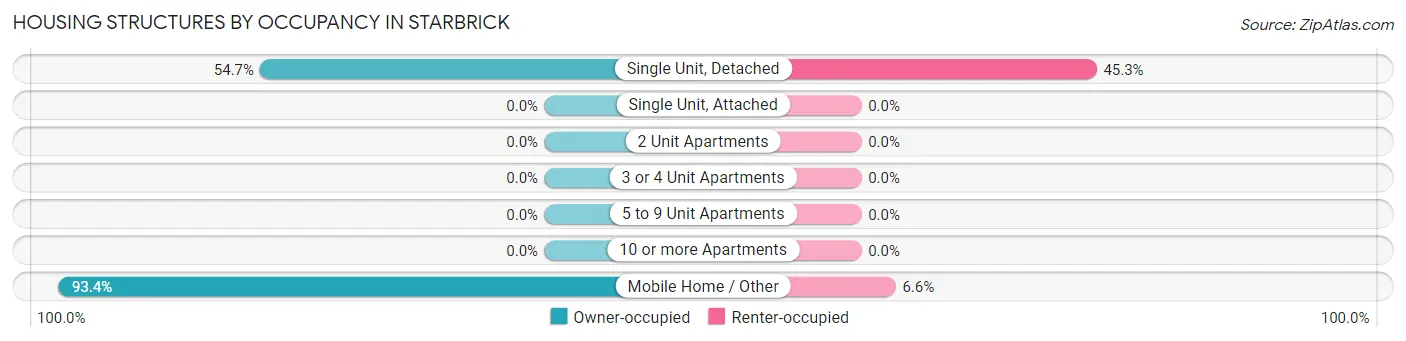
| Structure Type | Owner-occupied | Renter-occupied |
| Single Unit, Detached | 99 (54.7%) | 82 (45.3%) |
| Single Unit, Attached | 0 (0.0%) | 0 (0.0%) |
| 2 Unit Apartments | 0 (0.0%) | 0 (0.0%) |
| 3 or 4 Unit Apartments | 0 (0.0%) | 0 (0.0%) |
| 5 to 9 Unit Apartments | 0 (0.0%) | 0 (0.0%) |
| 10 or more Apartments | 0 (0.0%) | 0 (0.0%) |
| Mobile Home / Other | 113 (93.4%) | 8 (6.6%) |
| Total | 212 (70.2%) | 90 (29.8%) |
Housing Structures by Number of Rooms in Starbrick
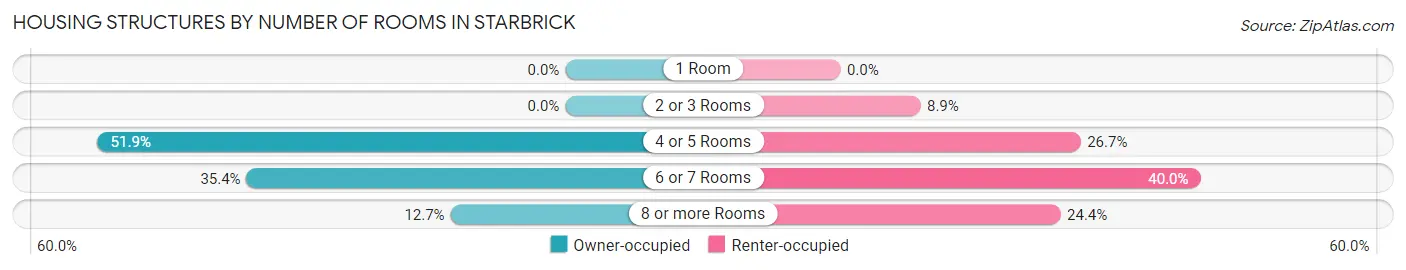
| Number of Rooms | Owner-occupied | Renter-occupied |
| 1 Room | 0 (0.0%) | 0 (0.0%) |
| 2 or 3 Rooms | 0 (0.0%) | 8 (8.9%) |
| 4 or 5 Rooms | 110 (51.9%) | 24 (26.7%) |
| 6 or 7 Rooms | 75 (35.4%) | 36 (40.0%) |
| 8 or more Rooms | 27 (12.7%) | 22 (24.4%) |
| Total | 212 (100.0%) | 90 (100.0%) |
Housing Structure by Heating Type in Starbrick
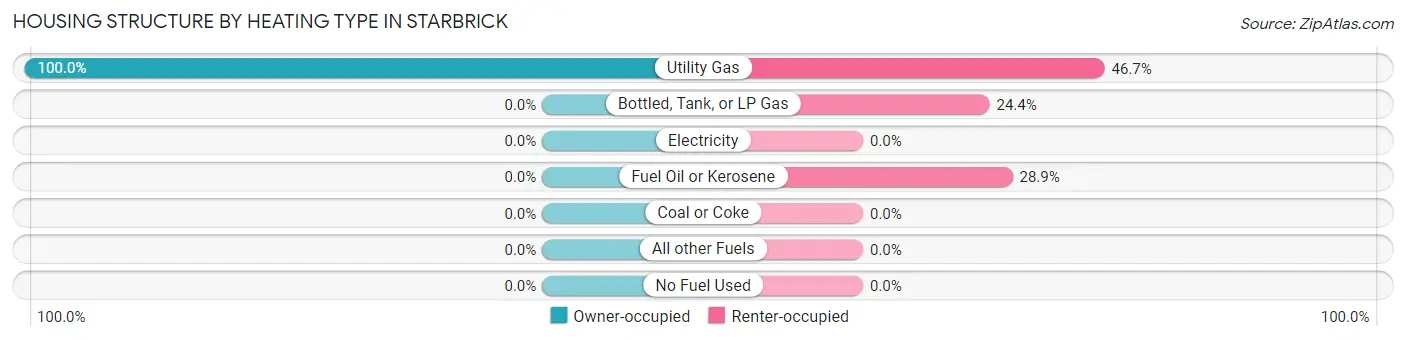
| Heating Type | Owner-occupied | Renter-occupied |
| Utility Gas | 212 (100.0%) | 42 (46.7%) |
| Bottled, Tank, or LP Gas | 0 (0.0%) | 22 (24.4%) |
| Electricity | 0 (0.0%) | 0 (0.0%) |
| Fuel Oil or Kerosene | 0 (0.0%) | 26 (28.9%) |
| Coal or Coke | 0 (0.0%) | 0 (0.0%) |
| All other Fuels | 0 (0.0%) | 0 (0.0%) |
| No Fuel Used | 0 (0.0%) | 0 (0.0%) |
| Total | 212 (100.0%) | 90 (100.0%) |
Household Vehicle Usage in Starbrick
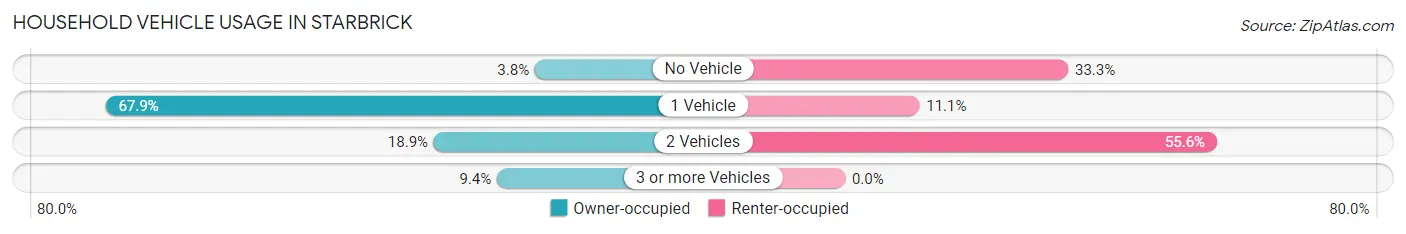
| Vehicles per Household | Owner-occupied | Renter-occupied |
| No Vehicle | 8 (3.8%) | 30 (33.3%) |
| 1 Vehicle | 144 (67.9%) | 10 (11.1%) |
| 2 Vehicles | 40 (18.9%) | 50 (55.6%) |
| 3 or more Vehicles | 20 (9.4%) | 0 (0.0%) |
| Total | 212 (100.0%) | 90 (100.0%) |
Real Estate & Mortgages in Starbrick
Real Estate and Mortgage Overview in Starbrick
| Characteristic | Without Mortgage | With Mortgage |
| Housing Units | 161 | 51 |
| Median Property Value | $18,000 | $130,600 |
| Median Household Income | - | - |
| Monthly Housing Costs | $470 | $0 |
| Real Estate Taxes | - | - |
Property Value by Mortgage Status in Starbrick
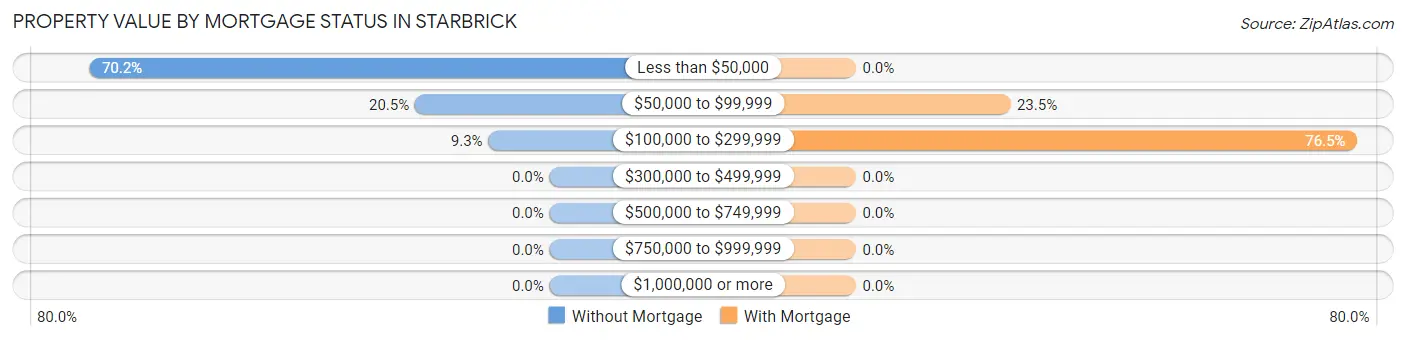
| Property Value | Without Mortgage | With Mortgage |
| Less than $50,000 | 113 (70.2%) | 0 (0.0%) |
| $50,000 to $99,999 | 33 (20.5%) | 12 (23.5%) |
| $100,000 to $299,999 | 15 (9.3%) | 39 (76.5%) |
| $300,000 to $499,999 | 0 (0.0%) | 0 (0.0%) |
| $500,000 to $749,999 | 0 (0.0%) | 0 (0.0%) |
| $750,000 to $999,999 | 0 (0.0%) | 0 (0.0%) |
| $1,000,000 or more | 0 (0.0%) | 0 (0.0%) |
| Total | 161 (100.0%) | 51 (100.0%) |
Household Income by Mortgage Status in Starbrick
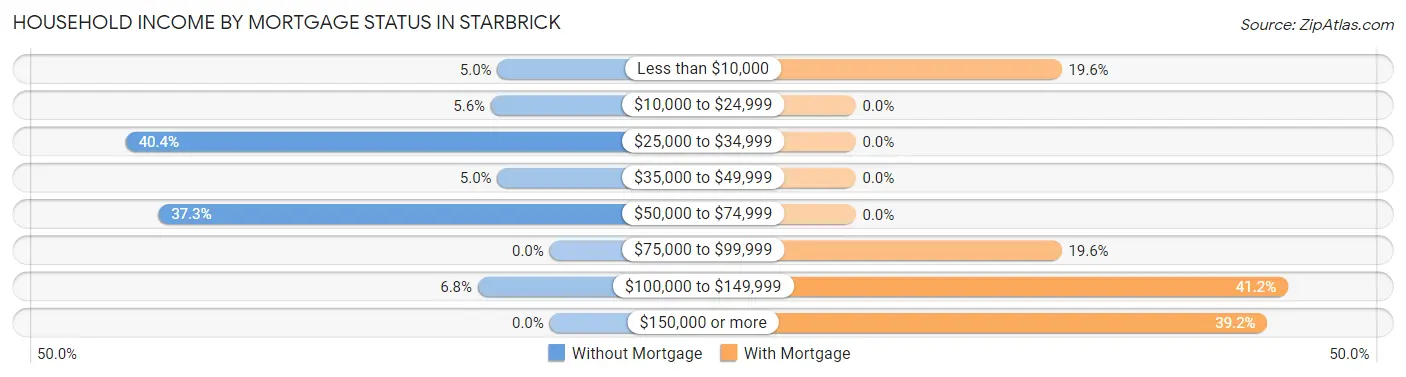
| Household Income | Without Mortgage | With Mortgage |
| Less than $10,000 | 8 (5.0%) | 10 (19.6%) |
| $10,000 to $24,999 | 9 (5.6%) | 0 (0.0%) |
| $25,000 to $34,999 | 65 (40.4%) | 0 (0.0%) |
| $35,000 to $49,999 | 8 (5.0%) | 0 (0.0%) |
| $50,000 to $74,999 | 60 (37.3%) | 0 (0.0%) |
| $75,000 to $99,999 | 0 (0.0%) | 10 (19.6%) |
| $100,000 to $149,999 | 11 (6.8%) | 21 (41.2%) |
| $150,000 or more | 0 (0.0%) | 20 (39.2%) |
| Total | 161 (100.0%) | 51 (100.0%) |
Property Value to Household Income Ratio in Starbrick
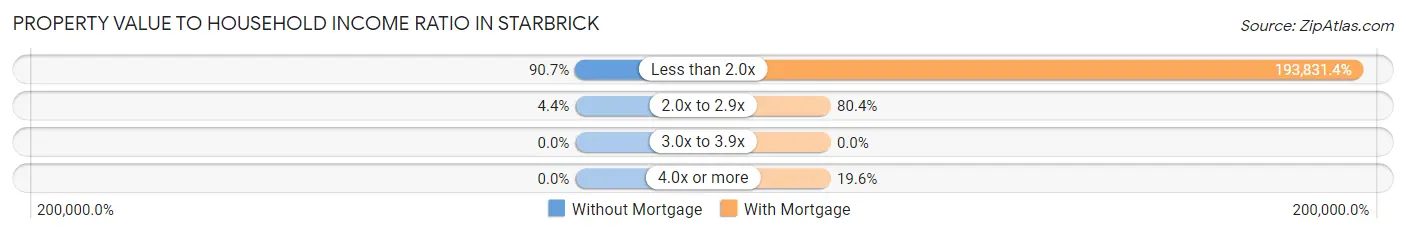
| Value-to-Income Ratio | Without Mortgage | With Mortgage |
| Less than 2.0x | 146 (90.7%) | 98,854 (193,831.4%) |
| 2.0x to 2.9x | 7 (4.3%) | 41 (80.4%) |
| 3.0x to 3.9x | 0 (0.0%) | 0 (0.0%) |
| 4.0x or more | 0 (0.0%) | 10 (19.6%) |
| Total | 161 (100.0%) | 51 (100.0%) |
Real Estate Taxes by Mortgage Status in Starbrick
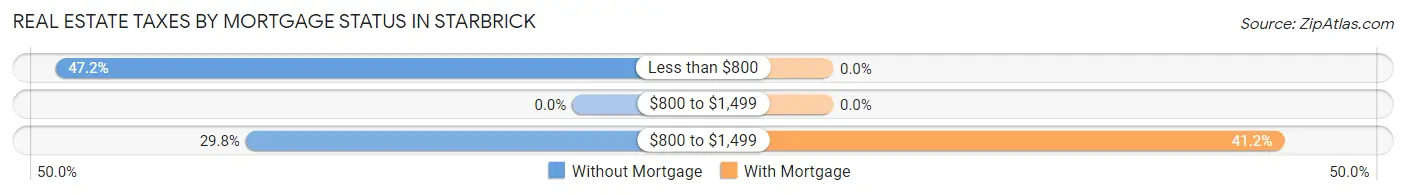
| Property Taxes | Without Mortgage | With Mortgage |
| Less than $800 | 76 (47.2%) | 0 (0.0%) |
| $800 to $1,499 | 0 (0.0%) | 0 (0.0%) |
| $800 to $1,499 | 48 (29.8%) | 21 (41.2%) |
| Total | 161 (100.0%) | 51 (100.0%) |
Health & Disability in Starbrick
Health Insurance Coverage by Age in Starbrick
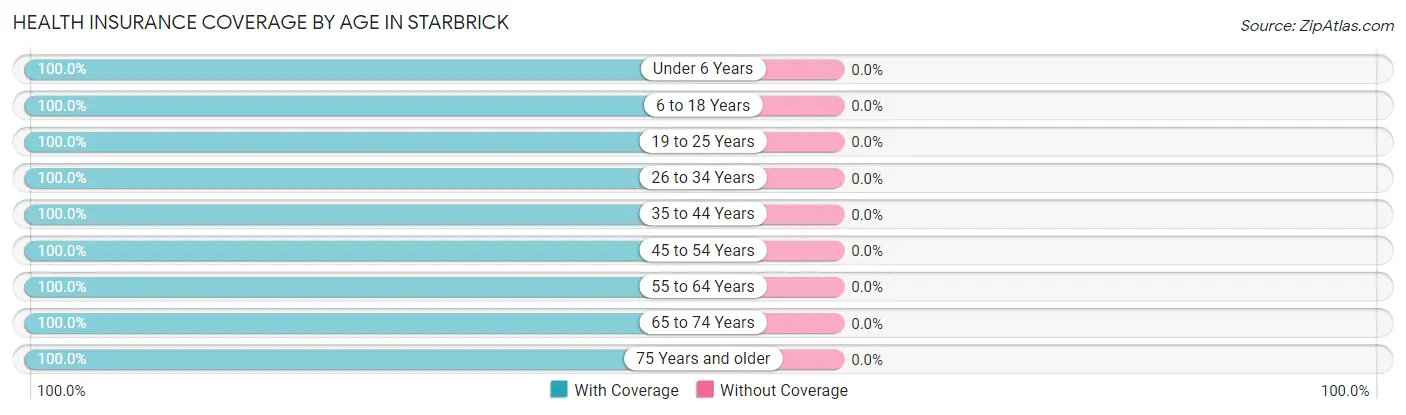
| Age Bracket | With Coverage | Without Coverage |
| Under 6 Years | 155 (100.0%) | 0 (0.0%) |
| 6 to 18 Years | 74 (100.0%) | 0 (0.0%) |
| 19 to 25 Years | 86 (100.0%) | 0 (0.0%) |
| 26 to 34 Years | 23 (100.0%) | 0 (0.0%) |
| 35 to 44 Years | 7 (100.0%) | 0 (0.0%) |
| 45 to 54 Years | 114 (100.0%) | 0 (0.0%) |
| 55 to 64 Years | 101 (100.0%) | 0 (0.0%) |
| 65 to 74 Years | 82 (100.0%) | 0 (0.0%) |
| 75 Years and older | 35 (100.0%) | 0 (0.0%) |
| Total | 677 (100.0%) | 0 (0.0%) |
Health Insurance Coverage by Citizenship Status in Starbrick
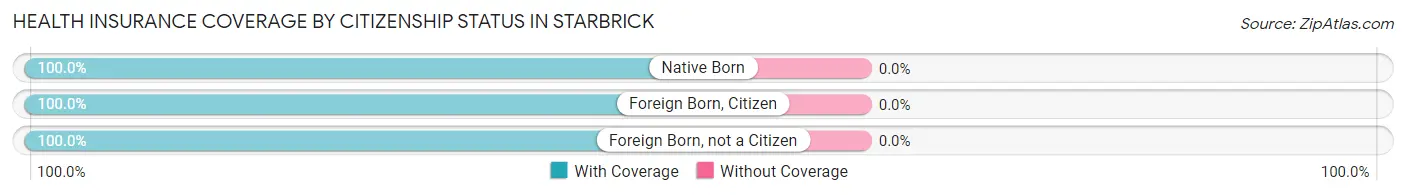
| Citizenship Status | With Coverage | Without Coverage |
| Native Born | 155 (100.0%) | 0 (0.0%) |
| Foreign Born, Citizen | 74 (100.0%) | 0 (0.0%) |
| Foreign Born, not a Citizen | 86 (100.0%) | 0 (0.0%) |
Health Insurance Coverage by Household Income in Starbrick
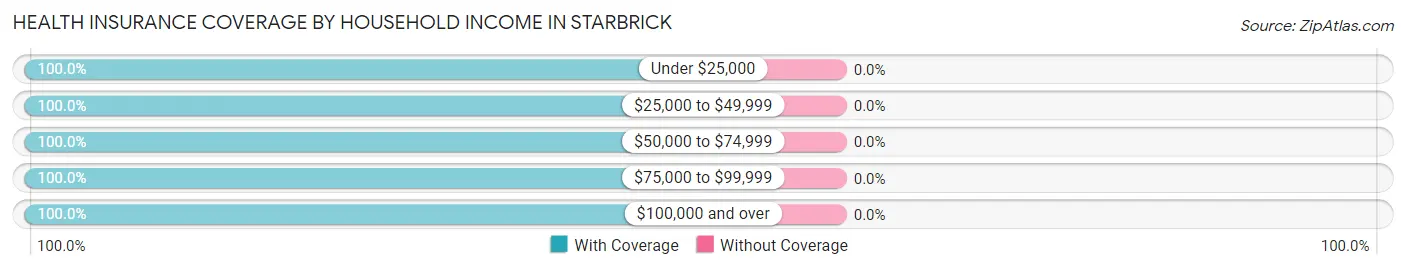
| Household Income | With Coverage | Without Coverage |
| Under $25,000 | 47 (100.0%) | 0 (0.0%) |
| $25,000 to $49,999 | 298 (100.0%) | 0 (0.0%) |
| $50,000 to $74,999 | 100 (100.0%) | 0 (0.0%) |
| $75,000 to $99,999 | 102 (100.0%) | 0 (0.0%) |
| $100,000 and over | 130 (100.0%) | 0 (0.0%) |
Public vs Private Health Insurance Coverage by Age in Starbrick
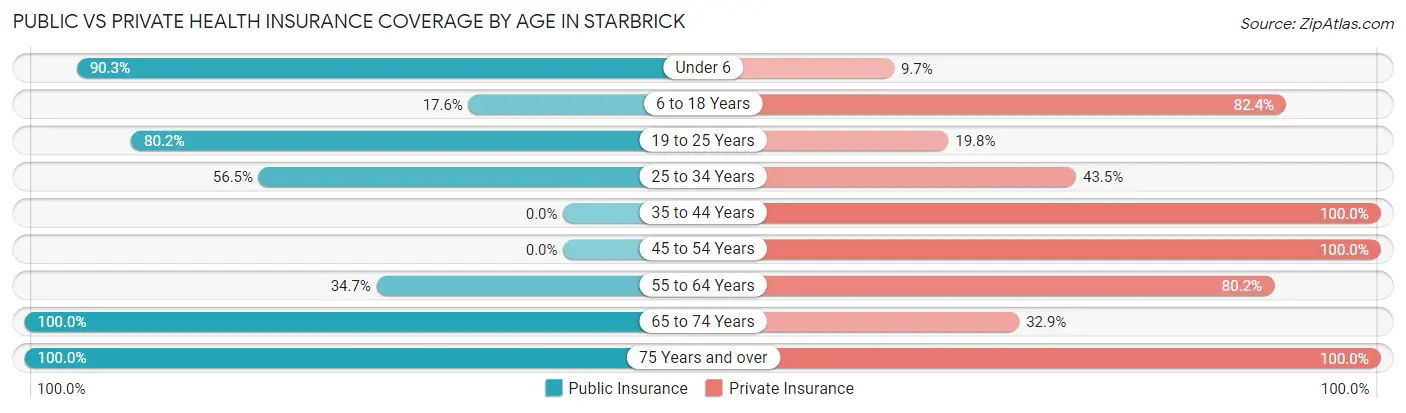
| Age Bracket | Public Insurance | Private Insurance |
| Under 6 | 140 (90.3%) | 15 (9.7%) |
| 6 to 18 Years | 13 (17.6%) | 61 (82.4%) |
| 19 to 25 Years | 69 (80.2%) | 17 (19.8%) |
| 25 to 34 Years | 13 (56.5%) | 10 (43.5%) |
| 35 to 44 Years | 0 (0.0%) | 7 (100.0%) |
| 45 to 54 Years | 0 (0.0%) | 114 (100.0%) |
| 55 to 64 Years | 35 (34.6%) | 81 (80.2%) |
| 65 to 74 Years | 82 (100.0%) | 27 (32.9%) |
| 75 Years and over | 35 (100.0%) | 35 (100.0%) |
| Total | 387 (57.2%) | 367 (54.2%) |
Disability Status by Sex by Age in Starbrick
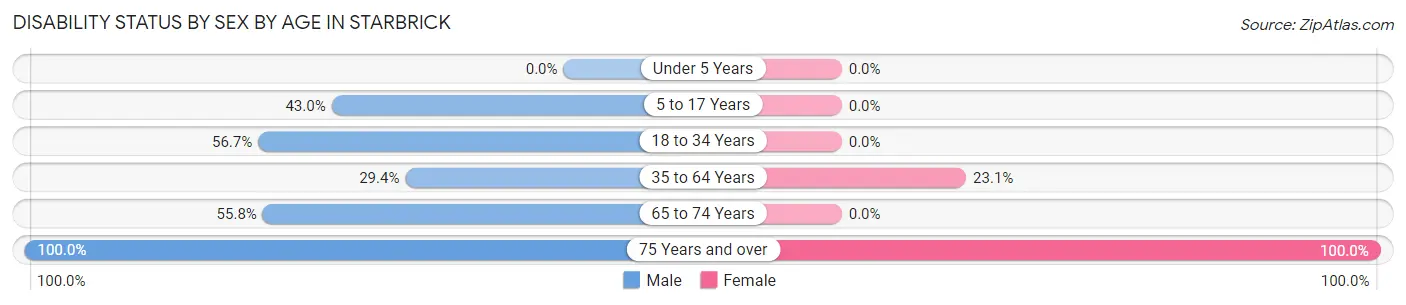
| Age Bracket | Male | Female |
| Under 5 Years | 0 (0.0%) | 0 (0.0%) |
| 5 to 17 Years | 34 (43.0%) | 0 (0.0%) |
| 18 to 34 Years | 17 (56.7%) | 0 (0.0%) |
| 35 to 64 Years | 27 (29.3%) | 30 (23.1%) |
| 65 to 74 Years | 24 (55.8%) | 0 (0.0%) |
| 75 Years and over | 10 (100.0%) | 25 (100.0%) |
Disability Class by Sex by Age in Starbrick
Disability Class: Hearing Difficulty
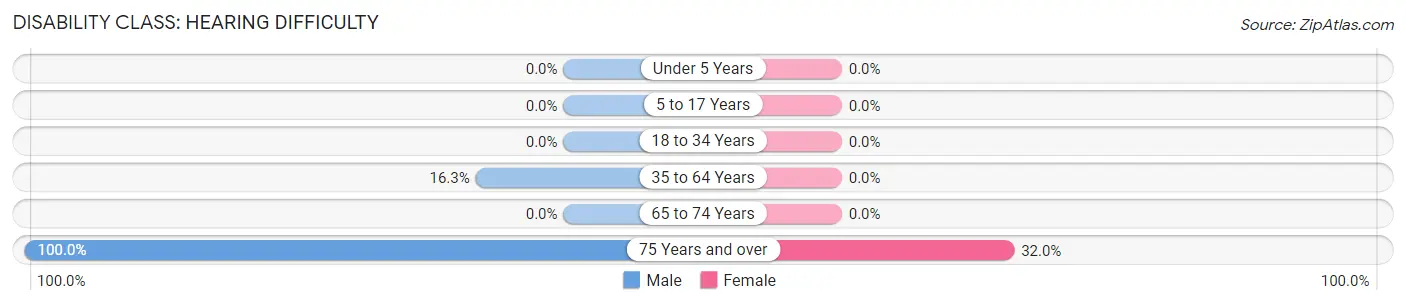
| Age Bracket | Male | Female |
| Under 5 Years | 0 (0.0%) | 0 (0.0%) |
| 5 to 17 Years | 0 (0.0%) | 0 (0.0%) |
| 18 to 34 Years | 0 (0.0%) | 0 (0.0%) |
| 35 to 64 Years | 15 (16.3%) | 0 (0.0%) |
| 65 to 74 Years | 0 (0.0%) | 0 (0.0%) |
| 75 Years and over | 10 (100.0%) | 8 (32.0%) |
Disability Class: Vision Difficulty
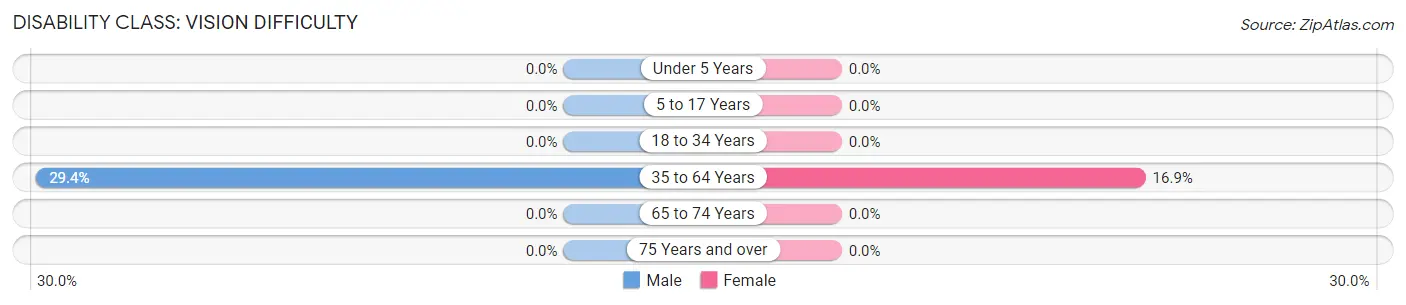
| Age Bracket | Male | Female |
| Under 5 Years | 0 (0.0%) | 0 (0.0%) |
| 5 to 17 Years | 0 (0.0%) | 0 (0.0%) |
| 18 to 34 Years | 0 (0.0%) | 0 (0.0%) |
| 35 to 64 Years | 27 (29.3%) | 22 (16.9%) |
| 65 to 74 Years | 0 (0.0%) | 0 (0.0%) |
| 75 Years and over | 0 (0.0%) | 0 (0.0%) |
Disability Class: Cognitive Difficulty
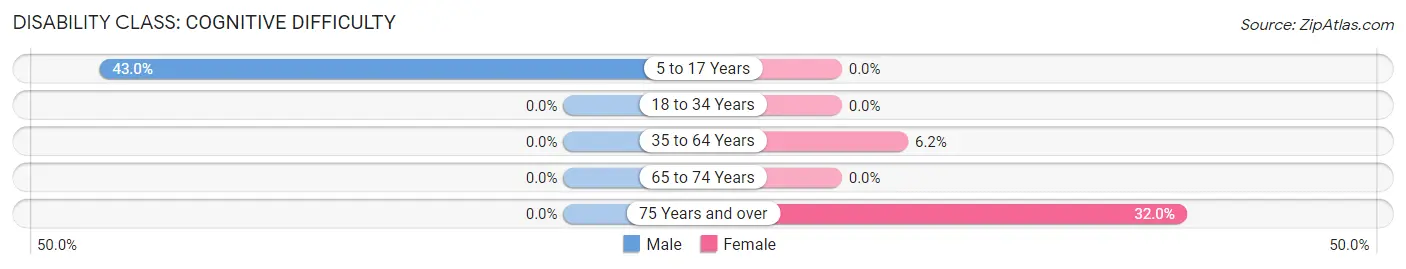
| Age Bracket | Male | Female |
| 5 to 17 Years | 34 (43.0%) | 0 (0.0%) |
| 18 to 34 Years | 0 (0.0%) | 0 (0.0%) |
| 35 to 64 Years | 0 (0.0%) | 8 (6.1%) |
| 65 to 74 Years | 0 (0.0%) | 0 (0.0%) |
| 75 Years and over | 0 (0.0%) | 8 (32.0%) |
Disability Class: Ambulatory Difficulty
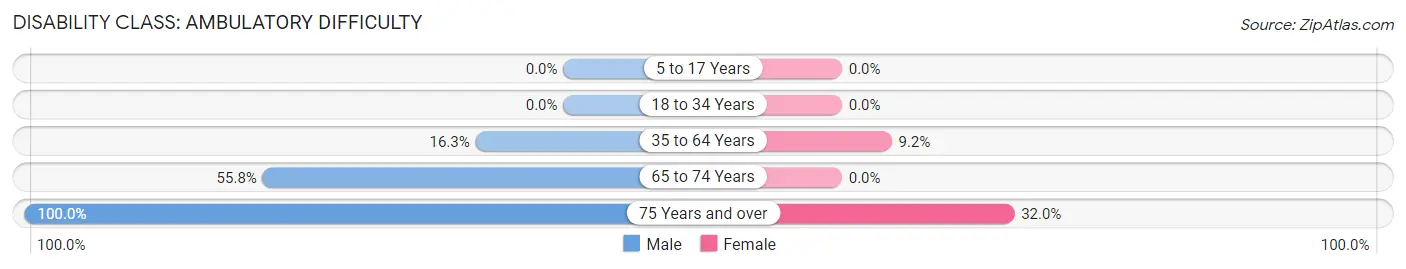
| Age Bracket | Male | Female |
| 5 to 17 Years | 0 (0.0%) | 0 (0.0%) |
| 18 to 34 Years | 0 (0.0%) | 0 (0.0%) |
| 35 to 64 Years | 15 (16.3%) | 12 (9.2%) |
| 65 to 74 Years | 24 (55.8%) | 0 (0.0%) |
| 75 Years and over | 10 (100.0%) | 8 (32.0%) |
Disability Class: Self-Care Difficulty
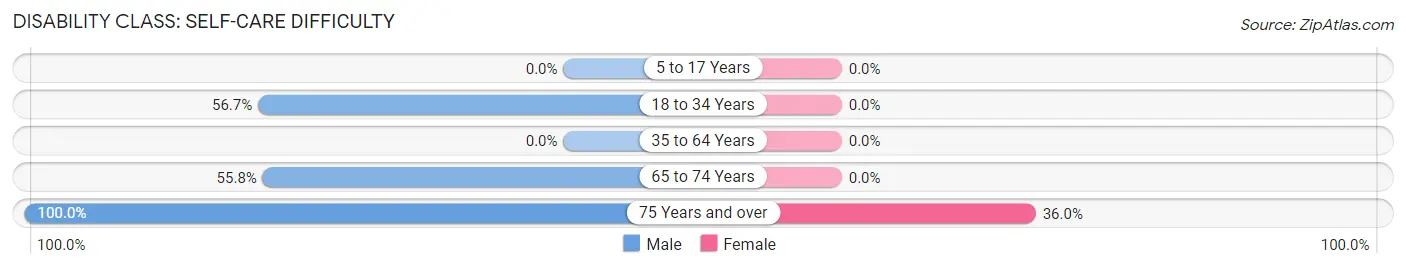
| Age Bracket | Male | Female |
| 5 to 17 Years | 0 (0.0%) | 0 (0.0%) |
| 18 to 34 Years | 17 (56.7%) | 0 (0.0%) |
| 35 to 64 Years | 0 (0.0%) | 0 (0.0%) |
| 65 to 74 Years | 24 (55.8%) | 0 (0.0%) |
| 75 Years and over | 10 (100.0%) | 9 (36.0%) |
Technology Access in Starbrick
Computing Device Access in Starbrick
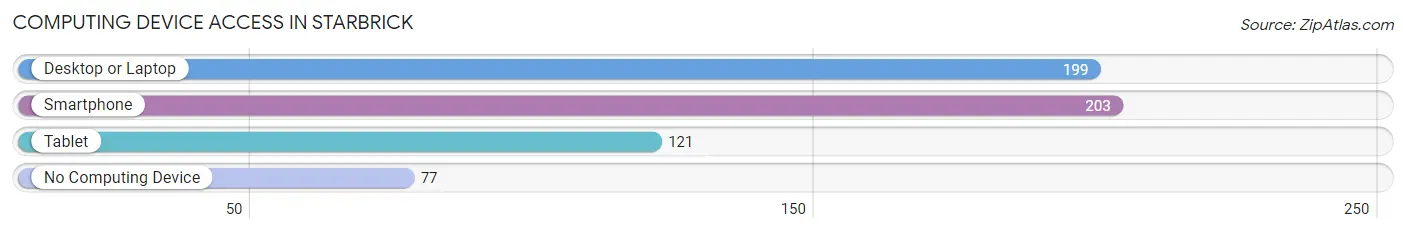
| Device Type | # Households | % Households |
| Desktop or Laptop | 199 | 65.9% |
| Smartphone | 203 | 67.2% |
| Tablet | 121 | 40.1% |
| No Computing Device | 77 | 25.5% |
| Total | 302 | 100.0% |
Internet Access in Starbrick
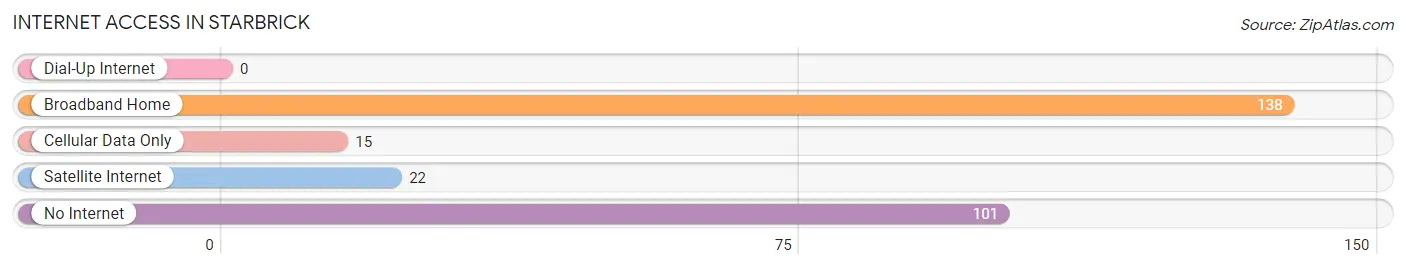
| Internet Type | # Households | % Households |
| Dial-Up Internet | 0 | 0.0% |
| Broadband Home | 138 | 45.7% |
| Cellular Data Only | 15 | 5.0% |
| Satellite Internet | 22 | 7.3% |
| No Internet | 101 | 33.4% |
| Total | 302 | 100.0% |
Starbrick Summary
Starbrick is a small borough located in Warren County, Pennsylvania. It is situated in the northwestern corner of the state, near the border of New York. The population of Starbrick was estimated to be 545 in the 2010 census.
Geography
Starbrick is located at 41°45'N 79°37'W (41.75, -79.62). It is situated in the northwestern corner of Pennsylvania, near the border of New York. The borough is located in the Allegheny Plateau region of the state, and is surrounded by the Allegheny National Forest. The terrain is mostly hilly, with some flat areas. The highest point in the borough is 1,890 feet above sea level.
The climate in Starbrick is humid continental, with cold winters and warm summers. The average annual temperature is around 50°F, and the average annual precipitation is around 40 inches.
Economy
The economy of Starbrick is largely based on tourism and recreation. The borough is home to several recreational areas, including the Allegheny National Forest, which offers camping, fishing, hunting, and other outdoor activities. The borough also has several small businesses, including restaurants, shops, and a few small manufacturing companies.
Demographics
As of the 2010 census, the population of Starbrick was 545. The racial makeup of the borough was 97.3% White, 0.7% African American, 0.2% Native American, 0.2% Asian, and 1.6% from two or more races. The median household income was $37,500, and the median family income was $41,250. The per capita income was $17,857.
The population of Starbrick is largely rural, with most of the residents living in single-family homes. The borough is served by the Warren County School District, which includes two elementary schools, one middle school, and one high school.
Conclusion
Starbrick is a small borough located in Warren County, Pennsylvania. It is situated in the northwestern corner of the state, near the border of New York. The population of Starbrick was estimated to be 545 in the 2010 census. The economy of Starbrick is largely based on tourism and recreation, and the borough is home to several recreational areas. The population of Starbrick is largely rural, with most of the residents living in single-family homes. The borough is served by the Warren County School District.
Common Questions
What is Per Capita Income in Starbrick?
Per Capita income in Starbrick is $23,840.
What is the Median Household income in Starbrick?
Median Household Income in Starbrick is $50,287.
What is Inequality or Gini Index in Starbrick?
Inequality or Gini Index in Starbrick is 0.38.
What is the Total Population of Starbrick?
Total Population of Starbrick is 677.
What is the Total Male Population of Starbrick?
Total Male Population of Starbrick is 341.
What is the Total Female Population of Starbrick?
Total Female Population of Starbrick is 336.
What is the Ratio of Males per 100 Females in Starbrick?
There are 101.49 Males per 100 Females in Starbrick.
What is the Ratio of Females per 100 Males in Starbrick?
There are 98.53 Females per 100 Males in Starbrick.
What is the Median Population Age in Starbrick?
Median Population Age in Starbrick is 44.1 Years.
What is the Average Family Size in Starbrick
Average Family Size in Starbrick is 2.8 People.
What is the Average Household Size in Starbrick
Average Household Size in Starbrick is 2.2 People.
How Large is the Labor Force in Starbrick?
There are 271 People in the Labor Forcein in Starbrick.
What is the Percentage of People in the Labor Force in Starbrick?
59.6% of People are in the Labor Force in Starbrick.