Riceville, PA Map & Demographics
Riceville Map
Riceville Overview
$25,705
PER CAPITA INCOME
$58,438
AVG FAMILY INCOME
$58,438
AVG HOUSEHOLD INCOME
0.39
INEQUALITY / GINI INDEX
55
TOTAL POPULATION
20
MALE POPULATION
35
FEMALE POPULATION
57.14
MALES / 100 FEMALES
175.00
FEMALES / 100 MALES
52.3
MEDIAN AGE
3.3
AVG FAMILY SIZE
2.6
AVG HOUSEHOLD SIZE
35
LABOR FORCE [ PEOPLE ]
70.0%
PERCENT IN LABOR FORCE
Riceville Area Codes
Income in Riceville
Income Overview in Riceville
Per Capita Income in Riceville is $25,705, while median incomes of families and households are $58,438 and $58,438 respectively.
| Characteristic | Number | Measure |
| Per Capita Income | 55 | $25,705 |
| Median Family Income | 15 | $58,438 |
| Mean Family Income | 15 | $58,500 |
| Median Household Income | 21 | $58,438 |
| Mean Household Income | 21 | $60,881 |
| Income Deficit | 15 | $0 |
| Wage / Income Gap (%) | 55 | 0.00% |
| Wage / Income Gap ($) | 55 | 100.00¢ per $1 |
| Gini / Inequality Index | 55 | 0.39 |
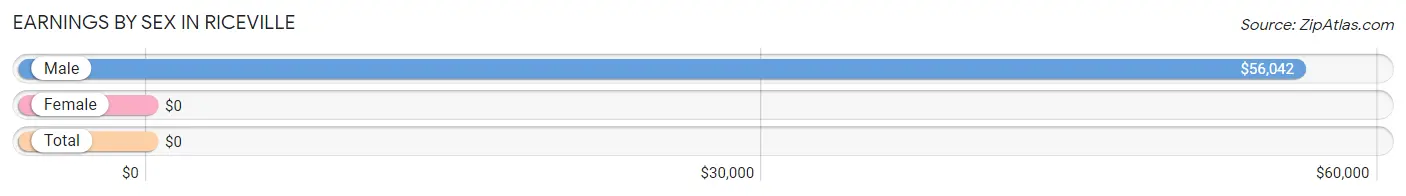
Earnings by Sex in Riceville
| Sex | Number | Average Earnings |
| Male | 17 (48.6%) | $56,042 |
| Female | 18 (51.4%) | $0 |
| Total | 35 (100.0%) | $0 |
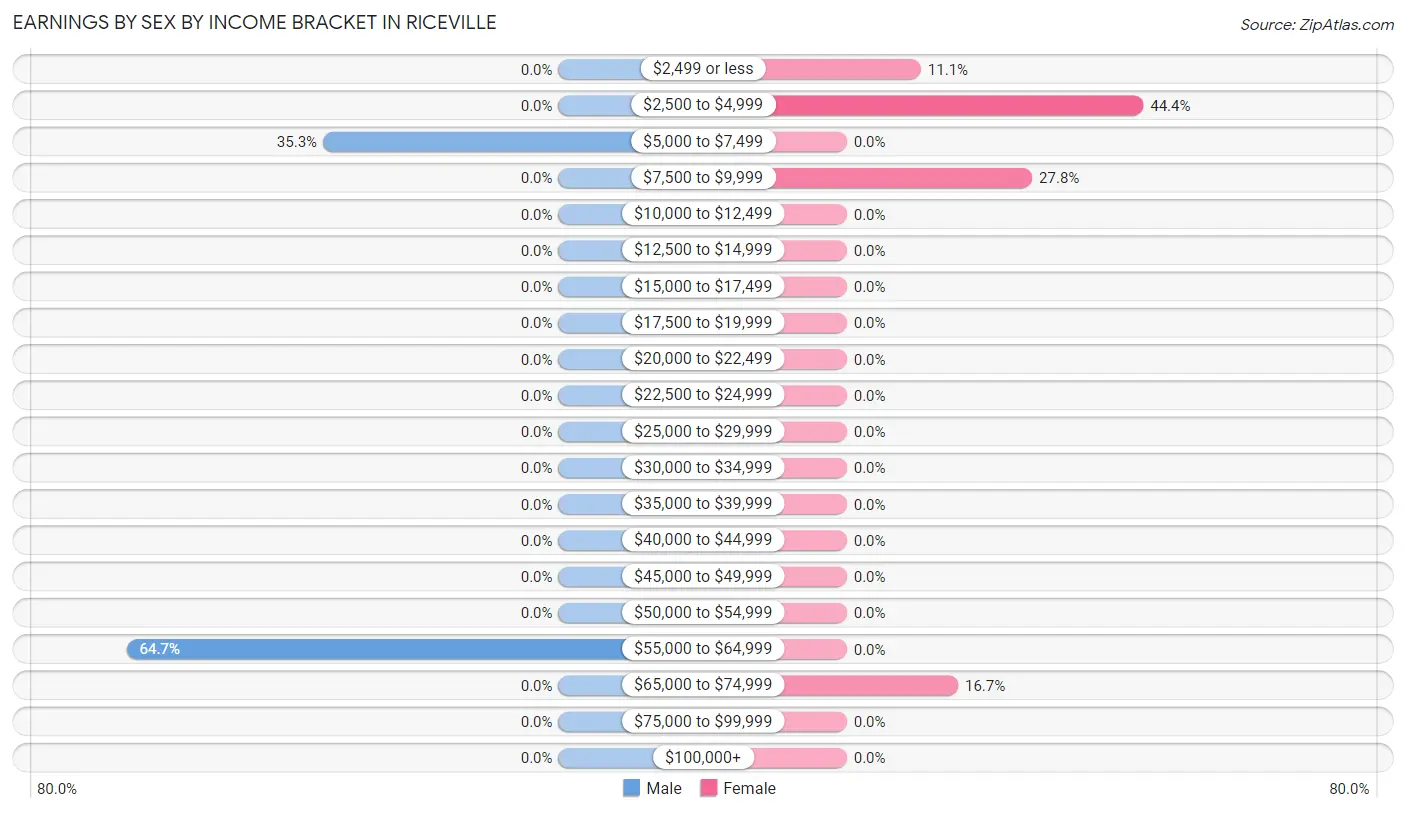
Earnings by Sex by Income Bracket in Riceville
The most common earnings brackets in Riceville are $55,000 to $64,999 for men (11 | 64.7%) and $2,500 to $4,999 for women (8 | 44.4%).
| Income | Male | Female |
| $2,499 or less | 0 (0.0%) | 2 (11.1%) |
| $2,500 to $4,999 | 0 (0.0%) | 8 (44.4%) |
| $5,000 to $7,499 | 6 (35.3%) | 0 (0.0%) |
| $7,500 to $9,999 | 0 (0.0%) | 5 (27.8%) |
| $10,000 to $12,499 | 0 (0.0%) | 0 (0.0%) |
| $12,500 to $14,999 | 0 (0.0%) | 0 (0.0%) |
| $15,000 to $17,499 | 0 (0.0%) | 0 (0.0%) |
| $17,500 to $19,999 | 0 (0.0%) | 0 (0.0%) |
| $20,000 to $22,499 | 0 (0.0%) | 0 (0.0%) |
| $22,500 to $24,999 | 0 (0.0%) | 0 (0.0%) |
| $25,000 to $29,999 | 0 (0.0%) | 0 (0.0%) |
| $30,000 to $34,999 | 0 (0.0%) | 0 (0.0%) |
| $35,000 to $39,999 | 0 (0.0%) | 0 (0.0%) |
| $40,000 to $44,999 | 0 (0.0%) | 0 (0.0%) |
| $45,000 to $49,999 | 0 (0.0%) | 0 (0.0%) |
| $50,000 to $54,999 | 0 (0.0%) | 0 (0.0%) |
| $55,000 to $64,999 | 11 (64.7%) | 0 (0.0%) |
| $65,000 to $74,999 | 0 (0.0%) | 3 (16.7%) |
| $75,000 to $99,999 | 0 (0.0%) | 0 (0.0%) |
| $100,000+ | 0 (0.0%) | 0 (0.0%) |
| Total | 17 (100.0%) | 18 (100.0%) |
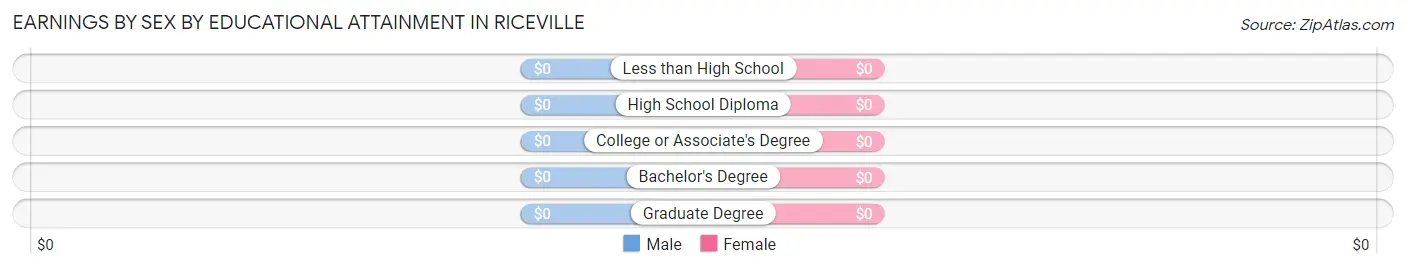
Earnings by Sex by Educational Attainment in Riceville
| Educational Attainment | Male Income | Female Income |
| Less than High School | - | - |
| High School Diploma | - | - |
| College or Associate's Degree | - | - |
| Bachelor's Degree | - | - |
| Graduate Degree | - | - |
| Total | $56,042 | $0 |
Family Income in Riceville
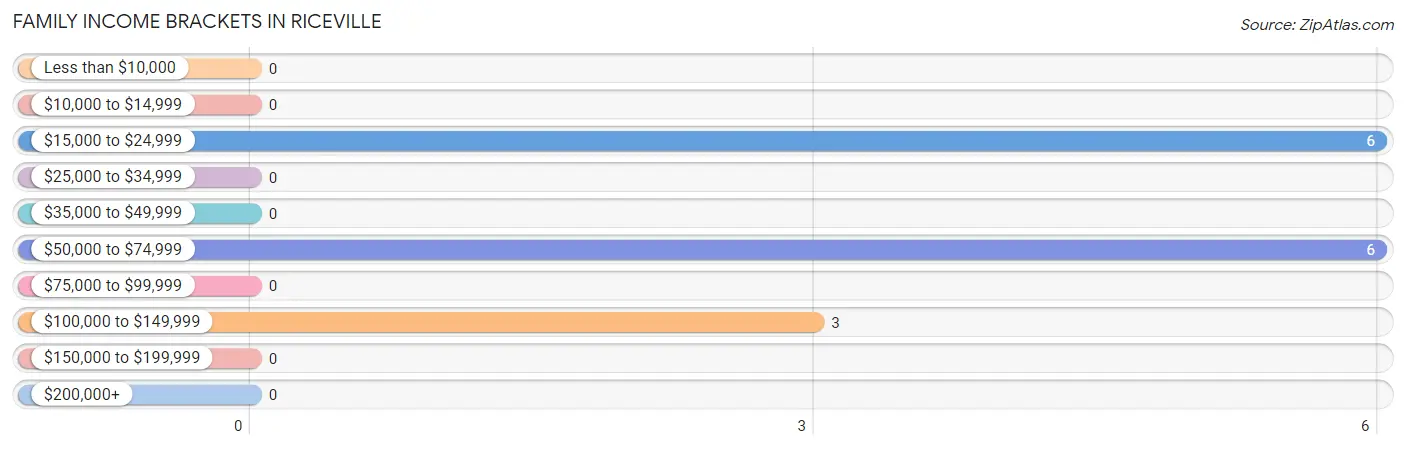
Family Income Brackets in Riceville
According to the Riceville family income data, there are 6 families falling into the $15,000 to $24,999 income range, which is the most common income bracket and makes up 40.0% of all families.
| Income Bracket | # Families | % Families |
| Less than $10,000 | 0 | 0.0% |
| $10,000 to $14,999 | 0 | 0.0% |
| $15,000 to $24,999 | 6 | 40.0% |
| $25,000 to $34,999 | 0 | 0.0% |
| $35,000 to $49,999 | 0 | 0.0% |
| $50,000 to $74,999 | 6 | 40.0% |
| $75,000 to $99,999 | 0 | 0.0% |
| $100,000 to $149,999 | 3 | 20.0% |
| $150,000 to $199,999 | 0 | 0.0% |
| $200,000+ | 0 | 0.0% |
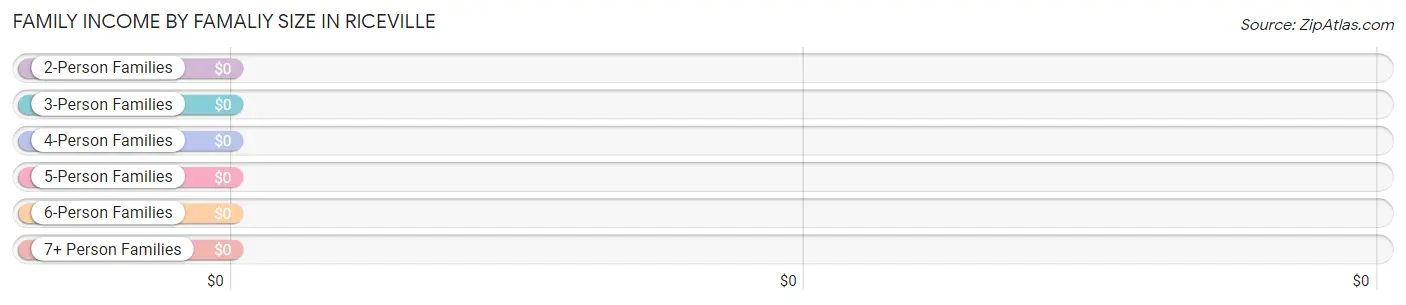
Family Income by Famaliy Size in Riceville
| Income Bracket | # Families | Median Income |
| 2-Person Families | 6 (40.0%) | $0 |
| 3-Person Families | 4 (26.7%) | $0 |
| 4-Person Families | 5 (33.3%) | $0 |
| 5-Person Families | 0 (0.0%) | $0 |
| 6-Person Families | 0 (0.0%) | $0 |
| 7+ Person Families | 0 (0.0%) | $0 |
| Total | 15 (100.0%) | $58,438 |
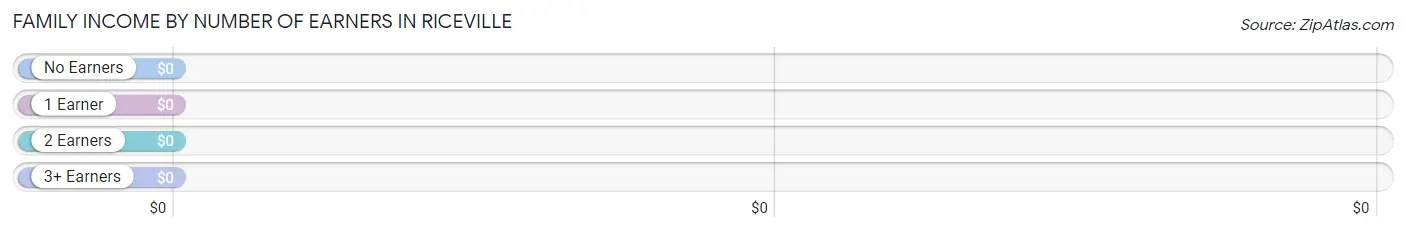
Family Income by Number of Earners in Riceville
| Number of Earners | # Families | Median Income |
| No Earners | 0 (0.0%) | $0 |
| 1 Earner | 6 (40.0%) | $0 |
| 2 Earners | 6 (40.0%) | $0 |
| 3+ Earners | 3 (20.0%) | $0 |
| Total | 15 (100.0%) | $58,438 |
Household Income in Riceville
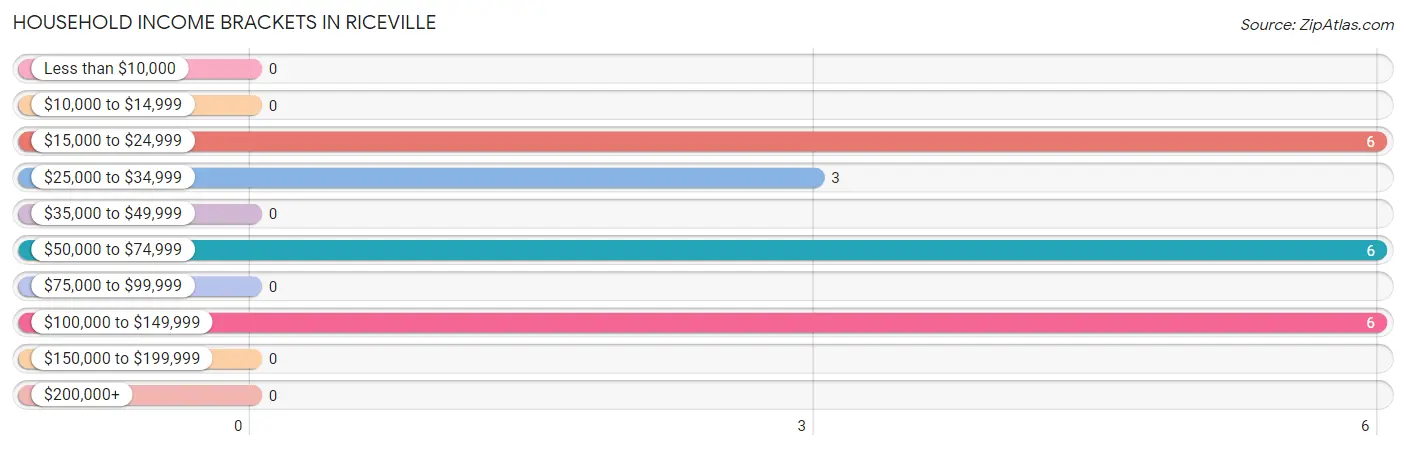
Household Income Brackets in Riceville
With 6 households falling in the category, the $15,000 to $24,999 income range is the most frequent in Riceville, accounting for 28.6% of all households.
| Income Bracket | # Households | % Households |
| Less than $10,000 | 0 | 0.0% |
| $10,000 to $14,999 | 0 | 0.0% |
| $15,000 to $24,999 | 6 | 28.6% |
| $25,000 to $34,999 | 3 | 14.3% |
| $35,000 to $49,999 | 0 | 0.0% |
| $50,000 to $74,999 | 6 | 28.6% |
| $75,000 to $99,999 | 0 | 0.0% |
| $100,000 to $149,999 | 6 | 28.6% |
| $150,000 to $199,999 | 0 | 0.0% |
| $200,000+ | 0 | 0.0% |
Household Income by Householder Age in Riceville
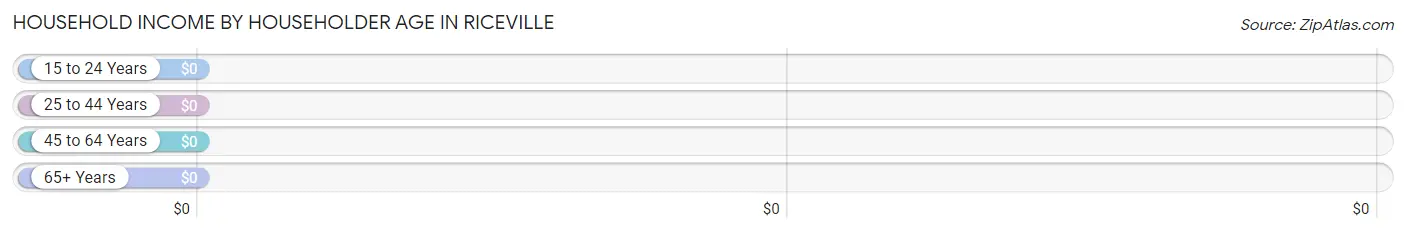
| Income Bracket | # Households | Median Income |
| 15 to 24 Years | 0 (0.0%) | $0 |
| 25 to 44 Years | 4 (19.1%) | $0 |
| 45 to 64 Years | 5 (23.8%) | $0 |
| 65+ Years | 12 (57.1%) | $0 |
| Total | 21 (100.0%) | $58,438 |
Poverty in Riceville
Income Below Poverty by Sex and Age in Riceville
With 30.0% poverty level for males and 17.1% for females among the residents of Riceville, 65 to 74 year old males and 65 to 74 year old females are the most vulnerable to poverty, with 6 males (100.0%) and 6 females (40.0%) in their respective age groups living below the poverty level.
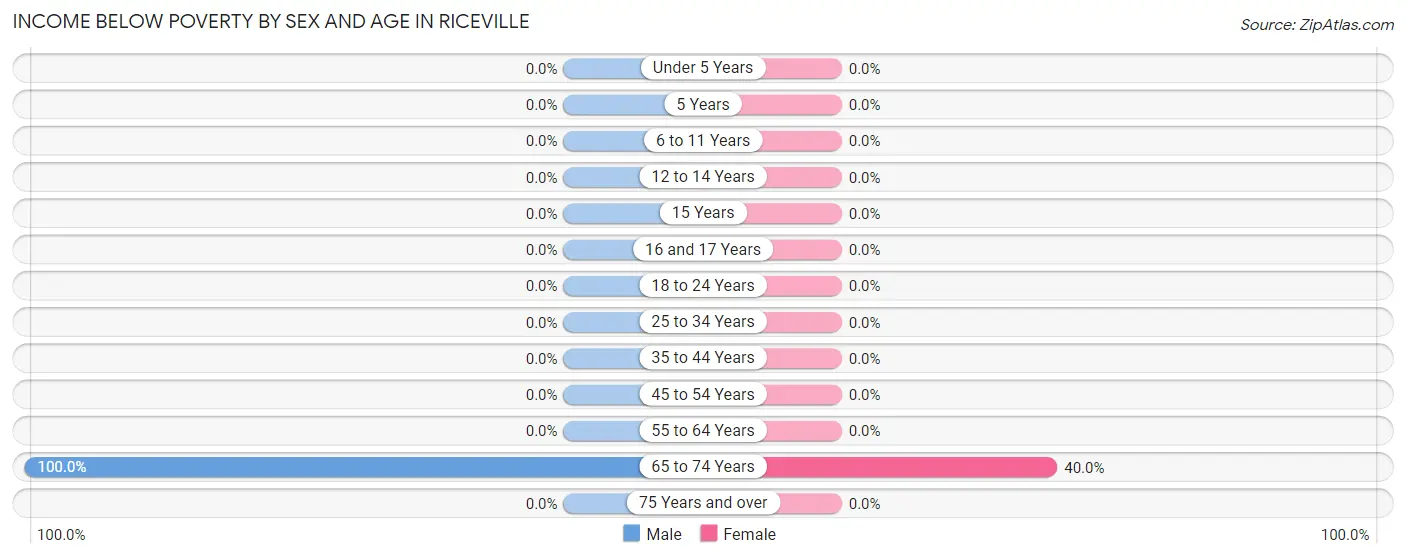
| Age Bracket | Male | Female |
| Under 5 Years | 0 (0.0%) | 0 (0.0%) |
| 5 Years | 0 (0.0%) | 0 (0.0%) |
| 6 to 11 Years | 0 (0.0%) | 0 (0.0%) |
| 12 to 14 Years | 0 (0.0%) | 0 (0.0%) |
| 15 Years | 0 (0.0%) | 0 (0.0%) |
| 16 and 17 Years | 0 (0.0%) | 0 (0.0%) |
| 18 to 24 Years | 0 (0.0%) | 0 (0.0%) |
| 25 to 34 Years | 0 (0.0%) | 0 (0.0%) |
| 35 to 44 Years | 0 (0.0%) | 0 (0.0%) |
| 45 to 54 Years | 0 (0.0%) | 0 (0.0%) |
| 55 to 64 Years | 0 (0.0%) | 0 (0.0%) |
| 65 to 74 Years | 6 (100.0%) | 6 (40.0%) |
| 75 Years and over | 0 (0.0%) | 0 (0.0%) |
| Total | 6 (30.0%) | 6 (17.1%) |
Income Above Poverty by Sex and Age in Riceville
According to the poverty statistics in Riceville, males aged 6 to 11 years and females aged 12 to 14 years are the age groups that are most secure financially, with 100.0% of males and 100.0% of females in these age groups living above the poverty line.
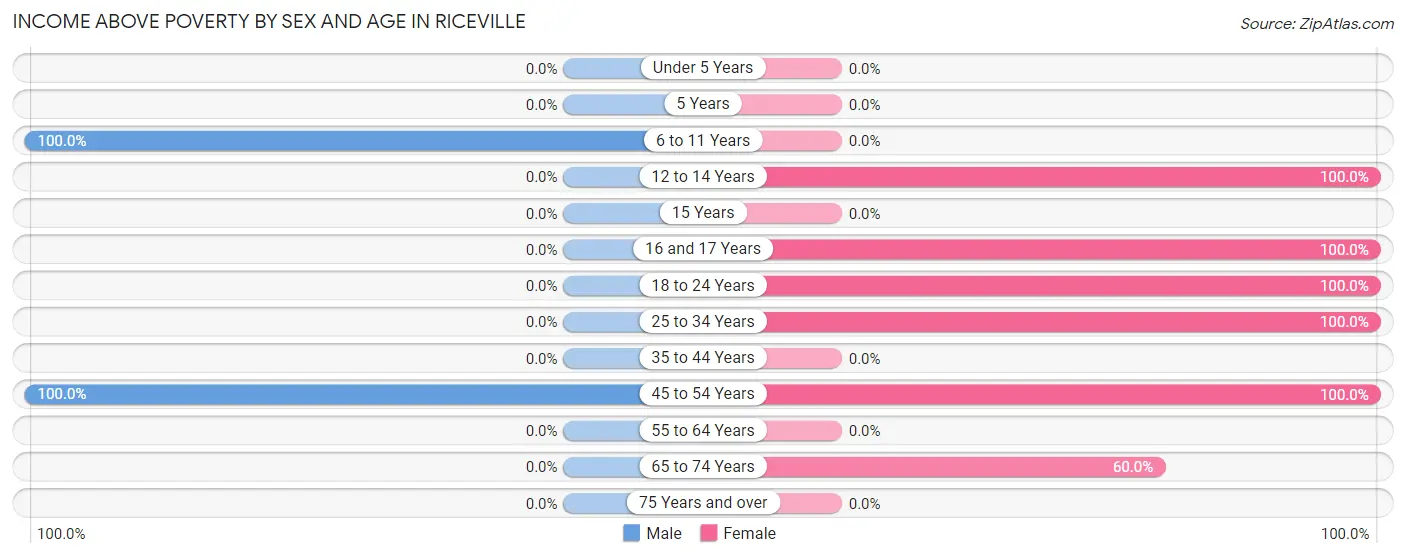
| Age Bracket | Male | Female |
| Under 5 Years | 0 (0.0%) | 0 (0.0%) |
| 5 Years | 0 (0.0%) | 0 (0.0%) |
| 6 to 11 Years | 3 (100.0%) | 0 (0.0%) |
| 12 to 14 Years | 0 (0.0%) | 2 (100.0%) |
| 15 Years | 0 (0.0%) | 0 (0.0%) |
| 16 and 17 Years | 0 (0.0%) | 2 (100.0%) |
| 18 to 24 Years | 0 (0.0%) | 9 (100.0%) |
| 25 to 34 Years | 0 (0.0%) | 4 (100.0%) |
| 35 to 44 Years | 0 (0.0%) | 0 (0.0%) |
| 45 to 54 Years | 11 (100.0%) | 3 (100.0%) |
| 55 to 64 Years | 0 (0.0%) | 0 (0.0%) |
| 65 to 74 Years | 0 (0.0%) | 9 (60.0%) |
| 75 Years and over | 0 (0.0%) | 0 (0.0%) |
| Total | 14 (70.0%) | 29 (82.9%) |
Income Below Poverty Among Married-Couple Families in Riceville
The poverty statistics for married-couple families in Riceville show that 46.2% or 6 of the total 13 families live below the poverty line. Families with no children have the highest poverty rate of 66.7%, comprising of 6 families. On the other hand, families with 1 or 2 children have the lowest poverty rate of 0.0%, which includes 0 families.
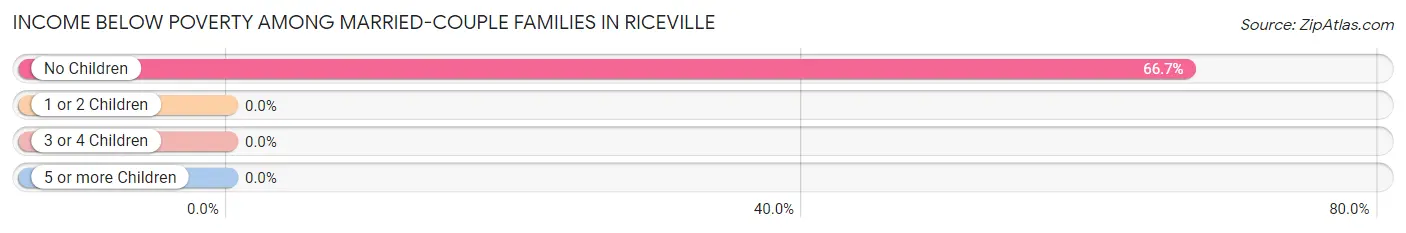
| Children | Above Poverty | Below Poverty |
| No Children | 3 (33.3%) | 6 (66.7%) |
| 1 or 2 Children | 4 (100.0%) | 0 (0.0%) |
| 3 or 4 Children | 0 (0.0%) | 0 (0.0%) |
| 5 or more Children | 0 (0.0%) | 0 (0.0%) |
| Total | 7 (53.8%) | 6 (46.2%) |
Income Below Poverty Among Single-Parent Households in Riceville
| Children | Single Father | Single Mother |
| No Children | 0 (0.0%) | 0 (0.0%) |
| 1 or 2 Children | 0 (0.0%) | 0 (0.0%) |
| 3 or 4 Children | 0 (0.0%) | 0 (0.0%) |
| 5 or more Children | 0 (0.0%) | 0 (0.0%) |
| Total | 0 (0.0%) | 0 (0.0%) |
Income Below Poverty Among Married-Couple vs Single-Parent Households in Riceville
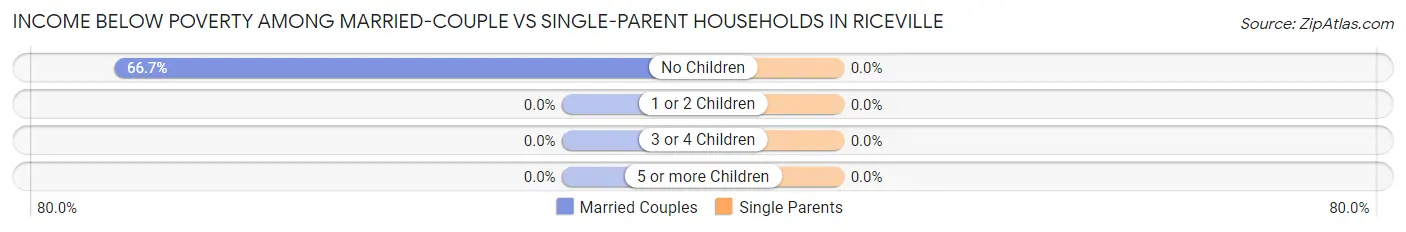
| Children | Married-Couple Families | Single-Parent Households |
| No Children | 6 (66.7%) | 0 (0.0%) |
| 1 or 2 Children | 0 (0.0%) | 0 (0.0%) |
| 3 or 4 Children | 0 (0.0%) | 0 (0.0%) |
| 5 or more Children | 0 (0.0%) | 0 (0.0%) |
| Total | 6 (46.2%) | 0 (0.0%) |
Race in Riceville
The most populous races in Riceville are , and White / Caucasian (55 | 100.0%).
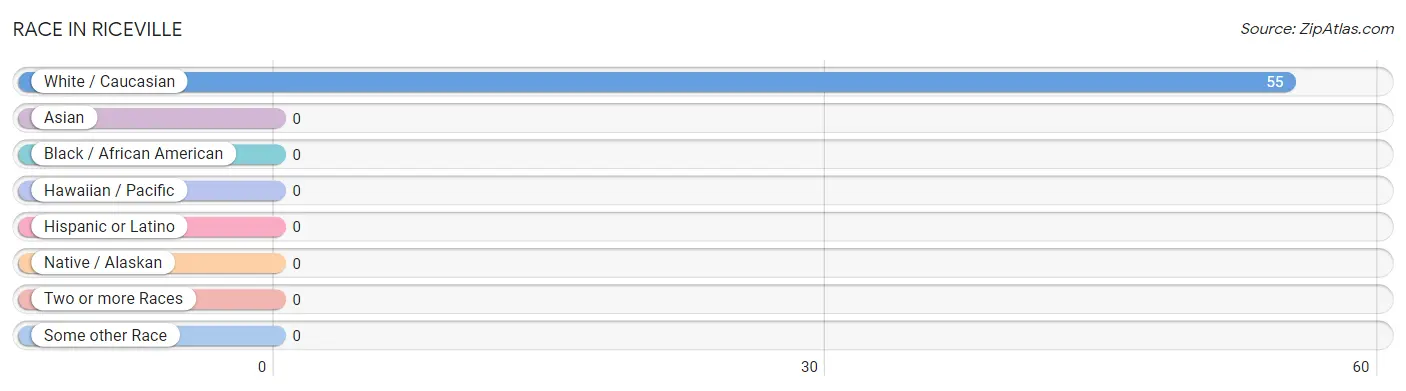
| Race | # Population | % Population |
| Asian | 0 | 0.0% |
| Black / African American | 0 | 0.0% |
| Hawaiian / Pacific | 0 | 0.0% |
| Hispanic or Latino | 0 | 0.0% |
| Native / Alaskan | 0 | 0.0% |
| White / Caucasian | 55 | 100.0% |
| Two or more Races | 0 | 0.0% |
| Some other Race | 0 | 0.0% |
| Total | 55 | 100.0% |
Ancestry in Riceville
The most populous ancestries reported in Riceville are English (15 | 27.3%), Irish (15 | 27.3%), European (9 | 16.4%), Dutch (6 | 10.9%), and Swedish (6 | 10.9%), together accounting for 92.7% of all Riceville residents.
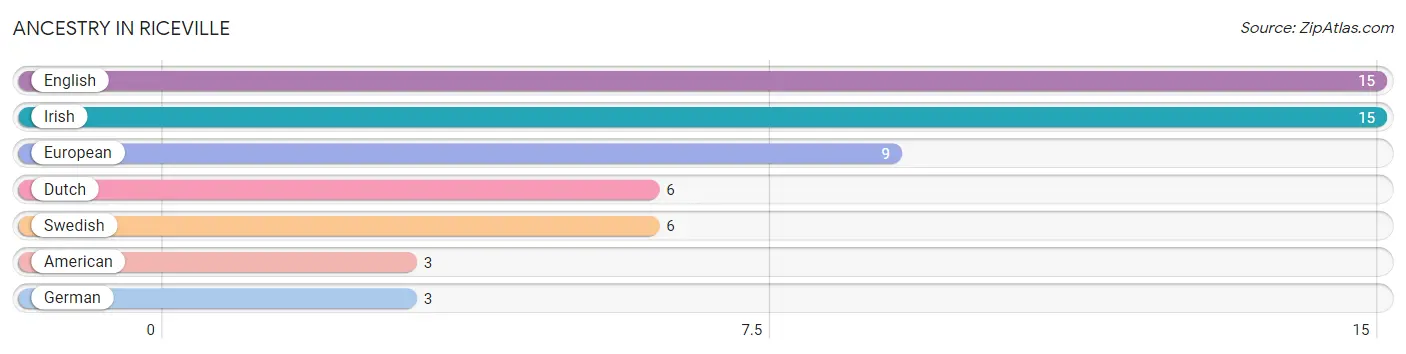
| Ancestry | # Population | % Population |
| American | 3 | 5.4% |
| Dutch | 6 | 10.9% |
| English | 15 | 27.3% |
| European | 9 | 16.4% |
| German | 3 | 5.4% |
| Irish | 15 | 27.3% |
| Swedish | 6 | 10.9% | View All 7 Rows |
Immigrants in Riceville

| Immigration Origin | # Population | % Population | View All 0 Rows |
Sex and Age in Riceville
Sex and Age in Riceville
The most populous age groups in Riceville are 45 to 49 Years (6 | 30.0%) for men and 65 to 69 Years (9 | 25.7%) for women.
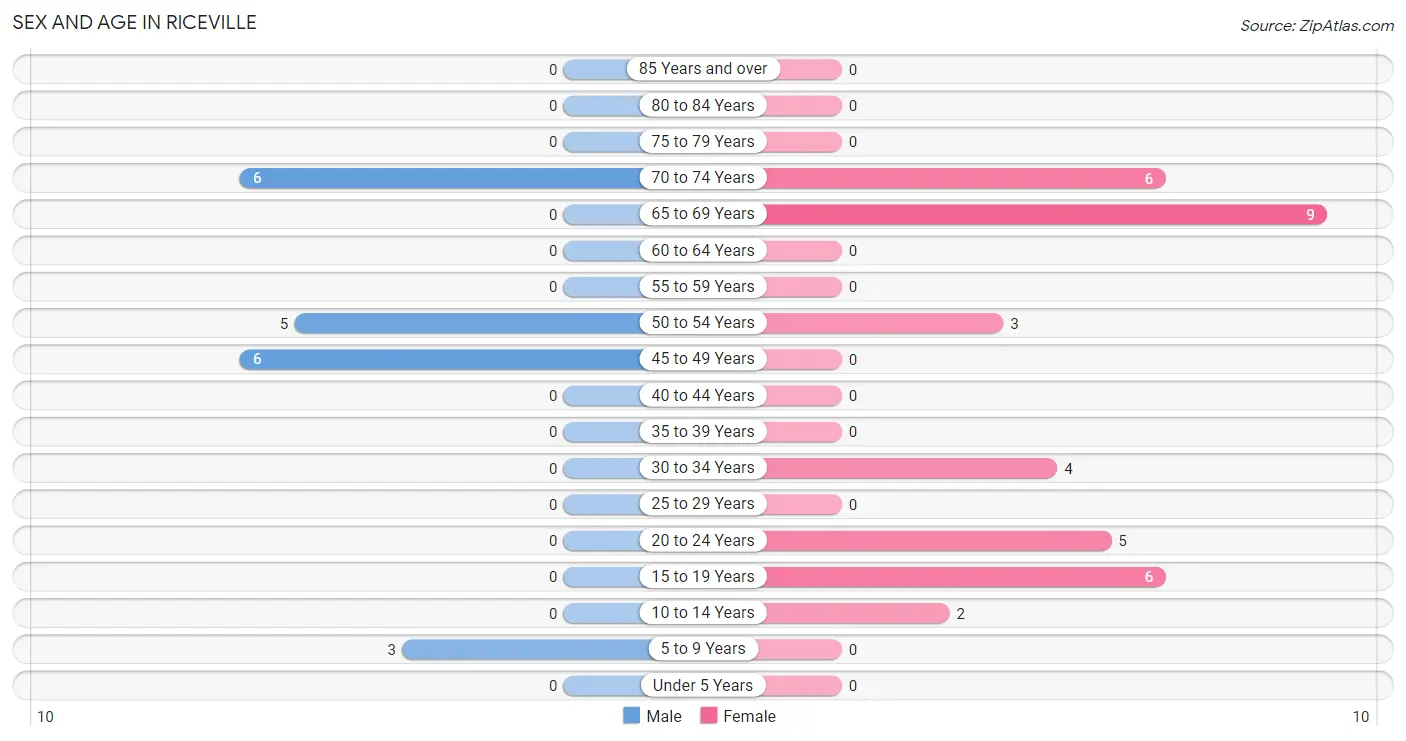
| Age Bracket | Male | Female |
| Under 5 Years | 0 (0.0%) | 0 (0.0%) |
| 5 to 9 Years | 3 (15.0%) | 0 (0.0%) |
| 10 to 14 Years | 0 (0.0%) | 2 (5.7%) |
| 15 to 19 Years | 0 (0.0%) | 6 (17.1%) |
| 20 to 24 Years | 0 (0.0%) | 5 (14.3%) |
| 25 to 29 Years | 0 (0.0%) | 0 (0.0%) |
| 30 to 34 Years | 0 (0.0%) | 4 (11.4%) |
| 35 to 39 Years | 0 (0.0%) | 0 (0.0%) |
| 40 to 44 Years | 0 (0.0%) | 0 (0.0%) |
| 45 to 49 Years | 6 (30.0%) | 0 (0.0%) |
| 50 to 54 Years | 5 (25.0%) | 3 (8.6%) |
| 55 to 59 Years | 0 (0.0%) | 0 (0.0%) |
| 60 to 64 Years | 0 (0.0%) | 0 (0.0%) |
| 65 to 69 Years | 0 (0.0%) | 9 (25.7%) |
| 70 to 74 Years | 6 (30.0%) | 6 (17.1%) |
| 75 to 79 Years | 0 (0.0%) | 0 (0.0%) |
| 80 to 84 Years | 0 (0.0%) | 0 (0.0%) |
| 85 Years and over | 0 (0.0%) | 0 (0.0%) |
| Total | 20 (100.0%) | 35 (100.0%) |
Families and Households in Riceville
Median Family Size in Riceville
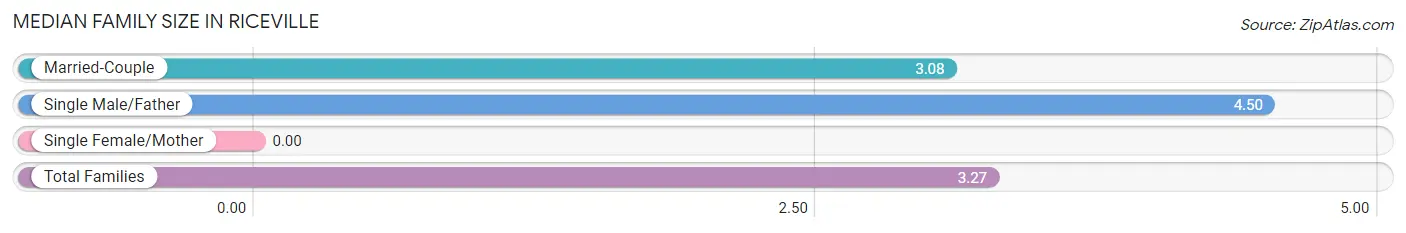
| Family Type | # Families | Family Size |
| Married-Couple | 13 (86.7%) | 3.08 |
| Single Male/Father | 2 (13.3%) | 4.50 |
| Single Female/Mother | 0 (0.0%) | - |
| Total Families | 15 (100.0%) | 3.27 |
Median Household Size in Riceville
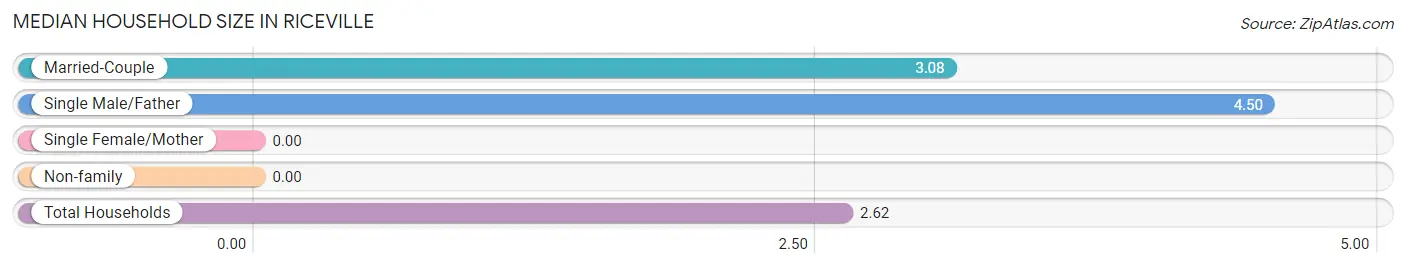
| Household Type | # Households | Household Size |
| Married-Couple | 13 (61.9%) | 3.08 |
| Single Male/Father | 2 (9.5%) | 4.50 |
| Single Female/Mother | 0 (0.0%) | - |
| Non-family | 6 (28.6%) | - |
| Total Households | 21 (100.0%) | 2.62 |
Household Size by Marriage Status in Riceville
Out of a total of 21 households in Riceville, 15 (71.4%) are family households, while 6 (28.6%) are nonfamily households. The most numerous type of family households are 2-person households, comprising 6, and the most common type of nonfamily households are 1-person households, comprising 6.
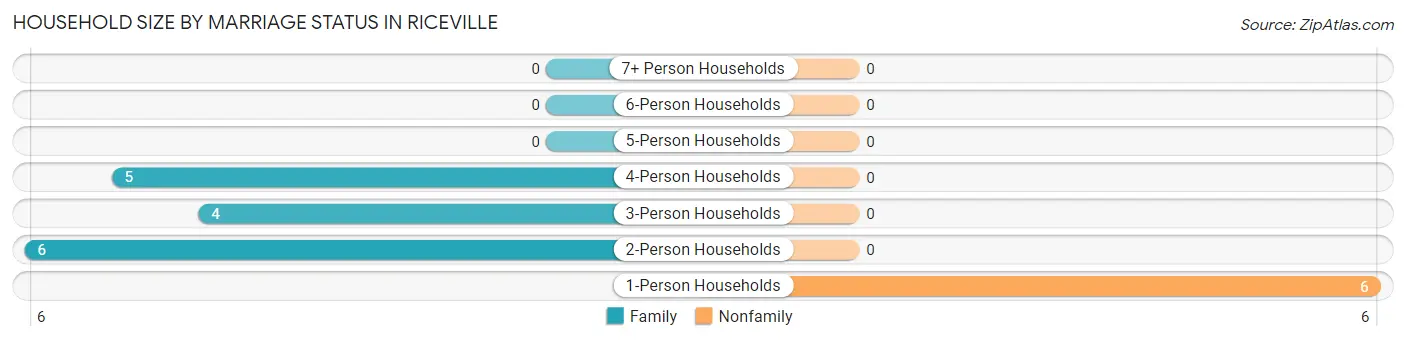
| Household Size | Family Households | Nonfamily Households |
| 1-Person Households | - | 6 (28.6%) |
| 2-Person Households | 6 (28.6%) | 0 (0.0%) |
| 3-Person Households | 4 (19.1%) | 0 (0.0%) |
| 4-Person Households | 5 (23.8%) | 0 (0.0%) |
| 5-Person Households | 0 (0.0%) | 0 (0.0%) |
| 6-Person Households | 0 (0.0%) | 0 (0.0%) |
| 7+ Person Households | 0 (0.0%) | 0 (0.0%) |
| Total | 15 (71.4%) | 6 (28.6%) |
Female Fertility in Riceville
Fertility by Age in Riceville
| Age Bracket | Women with Births | Births / 1,000 Women |
| 15 to 19 years | 0 (0.0%) | 0.0 |
| 20 to 34 years | 0 (0.0%) | 0.0 |
| 35 to 50 years | 0 (0.0%) | 0.0 |
| Total | 0 (0.0%) | 0.0 |
Fertility by Age by Marriage Status in Riceville
| Age Bracket | Married | Unmarried |
| 15 to 19 years | 0 (0.0%) | 0 (0.0%) |
| 20 to 34 years | 0 (0.0%) | 0 (0.0%) |
| 35 to 50 years | 0 (0.0%) | 0 (0.0%) |
| Total | 0 (0.0%) | 0 (0.0%) |
Fertility by Education in Riceville
| Educational Attainment | Women with Births | Births / 1,000 Women |
| Less than High School | 0 (0.0%) | 0.0 |
| High School Diploma | 0 (0.0%) | 0.0 |
| College or Associate's Degree | 0 (0.0%) | 0.0 |
| Bachelor's Degree | 0 (0.0%) | 0.0 |
| Graduate Degree | 0 (0.0%) | 0.0 |
| Total | 0 (0.0%) | 0.0 |
Fertility by Education by Marriage Status in Riceville
| Educational Attainment | Married | Unmarried |
| Less than High School | 0 (0.0%) | 0 (0.0%) |
| High School Diploma | 0 (0.0%) | 0 (0.0%) |
| College or Associate's Degree | 0 (0.0%) | 0 (0.0%) |
| Bachelor's Degree | 0 (0.0%) | 0 (0.0%) |
| Graduate Degree | 0 (0.0%) | 0 (0.0%) |
| Total | 0 (0.0%) | 0 (0.0%) |
Employment Characteristics in Riceville
Employment by Class of Employer in Riceville
Among the 35 employed individuals in Riceville, private company employees (28 | 80.0%), local government employees (3 | 8.6%), and self-employed (not incorporated) (2 | 5.7%) make up the most common classes of employment.
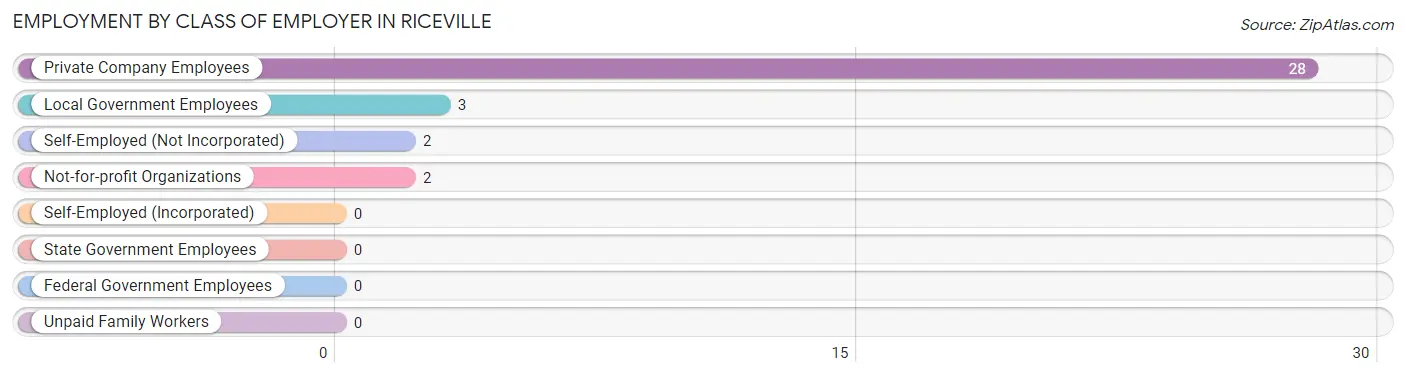
| Employer Class | # Employees | % Employees |
| Private Company Employees | 28 | 80.0% |
| Self-Employed (Incorporated) | 0 | 0.0% |
| Self-Employed (Not Incorporated) | 2 | 5.7% |
| Not-for-profit Organizations | 2 | 5.7% |
| Local Government Employees | 3 | 8.6% |
| State Government Employees | 0 | 0.0% |
| Federal Government Employees | 0 | 0.0% |
| Unpaid Family Workers | 0 | 0.0% |
| Total | 35 | 100.0% |
Employment Status by Age in Riceville
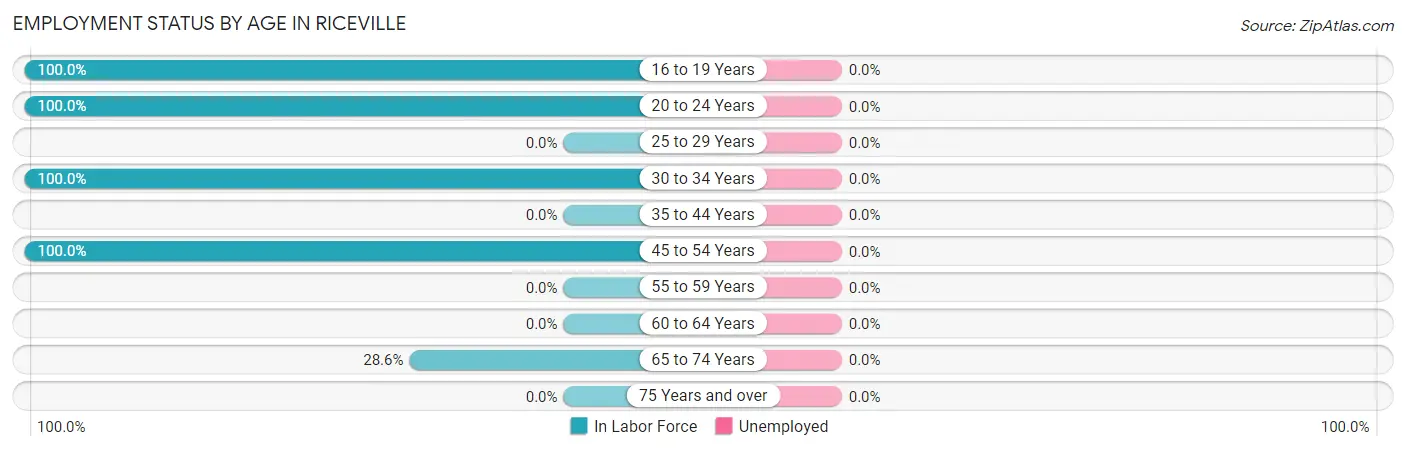
| Age Bracket | In Labor Force | Unemployed |
| 16 to 19 Years | 6 (100.0%) | 0 (0.0%) |
| 20 to 24 Years | 5 (100.0%) | 0 (0.0%) |
| 25 to 29 Years | 0 (0.0%) | 0 (0.0%) |
| 30 to 34 Years | 4 (100.0%) | 0 (0.0%) |
| 35 to 44 Years | 0 (0.0%) | 0 (0.0%) |
| 45 to 54 Years | 14 (100.0%) | 0 (0.0%) |
| 55 to 59 Years | 0 (0.0%) | 0 (0.0%) |
| 60 to 64 Years | 0 (0.0%) | 0 (0.0%) |
| 65 to 74 Years | 6 (28.6%) | 0 (0.0%) |
| 75 Years and over | 0 (0.0%) | 0 (0.0%) |
| Total | 35 (70.0%) | 0 (0.0%) |
Employment Status by Educational Attainment in Riceville
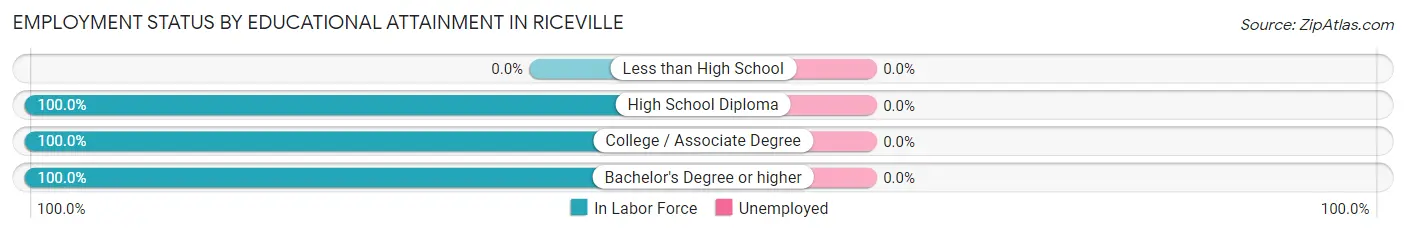
| Educational Attainment | In Labor Force | Unemployed |
| Less than High School | 0 (0.0%) | 0 (0.0%) |
| High School Diploma | 6 (100.0%) | 0 (0.0%) |
| College / Associate Degree | 7 (100.0%) | 0 (0.0%) |
| Bachelor's Degree or higher | 5 (100.0%) | 0 (0.0%) |
| Total | 18 (100.0%) | 0 (0.0%) |
Employment Occupations by Sex in Riceville
Management, Business, Science and Arts Occupations
The most common Management, Business, Science and Arts occupations in Riceville are Computers, Engineering & Science (3 | 8.6%), Architecture & Engineering (3 | 8.6%), Community & Social Service (3 | 8.6%), Education Instruction & Library (3 | 8.6%), and Business & Financial (2 | 5.7%).
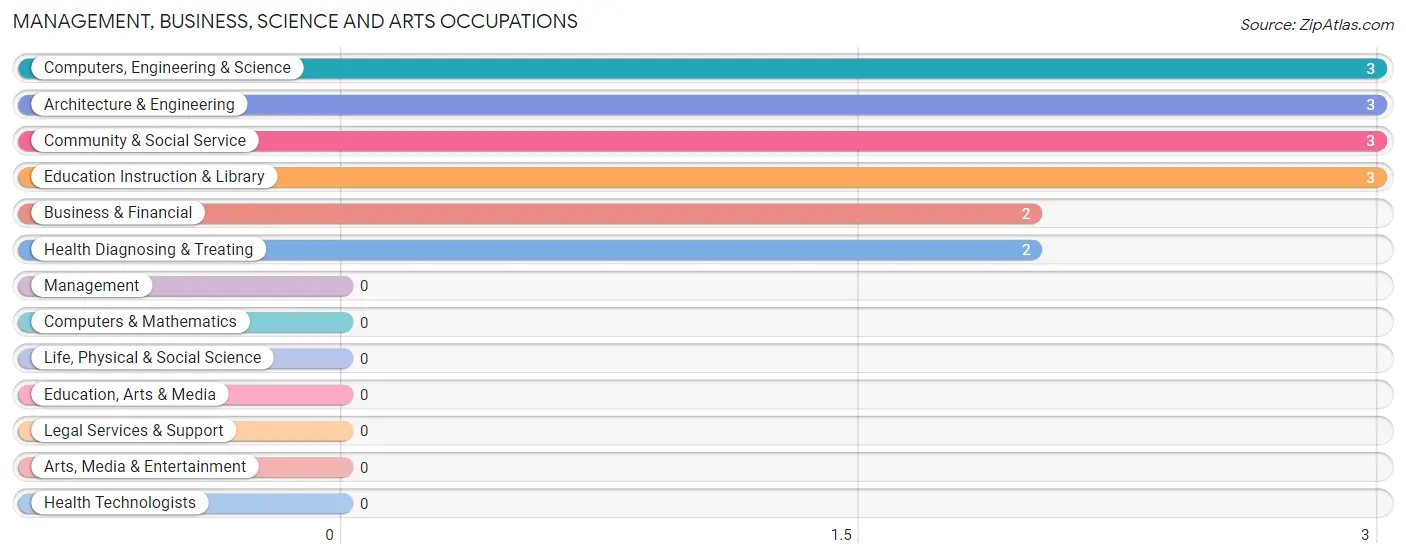
Management, Business, Science and Arts Occupations by Sex
Within the Management, Business, Science and Arts occupations in Riceville, the most male-oriented occupations are Business & Financial (100.0%), Computers, Engineering & Science (100.0%), and Architecture & Engineering (100.0%), while the most female-oriented occupations are Community & Social Service (100.0%), Education Instruction & Library (100.0%), and Health Diagnosing & Treating (100.0%).
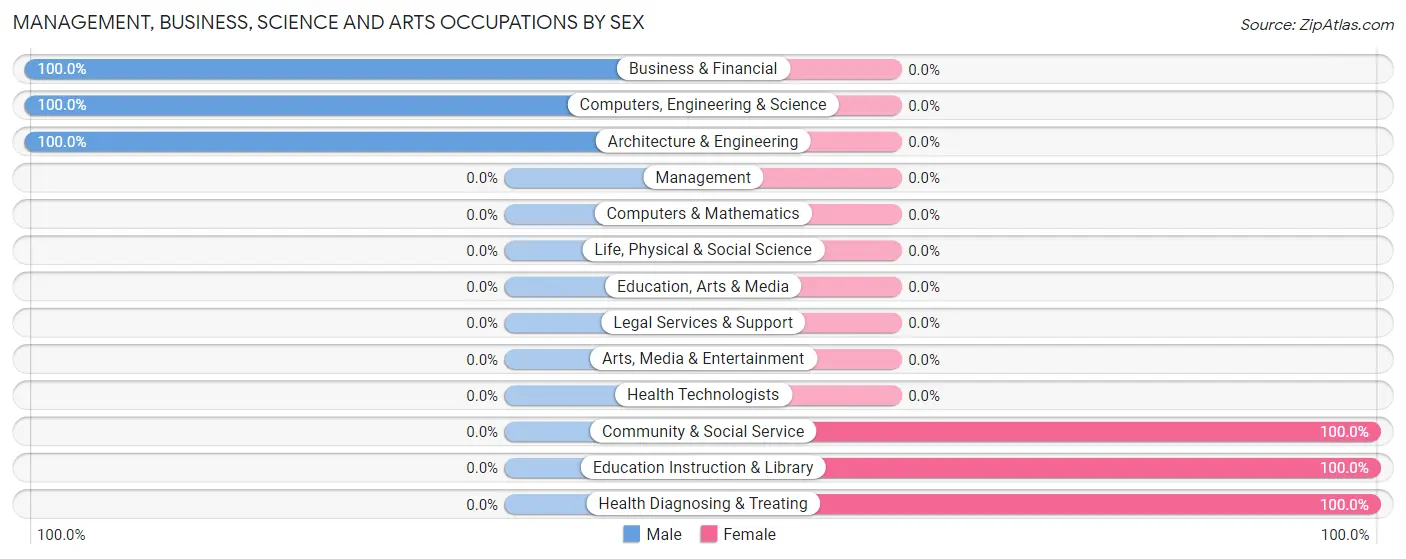
| Occupation | Male | Female |
| Management | 0 (0.0%) | 0 (0.0%) |
| Business & Financial | 2 (100.0%) | 0 (0.0%) |
| Computers, Engineering & Science | 3 (100.0%) | 0 (0.0%) |
| Computers & Mathematics | 0 (0.0%) | 0 (0.0%) |
| Architecture & Engineering | 3 (100.0%) | 0 (0.0%) |
| Life, Physical & Social Science | 0 (0.0%) | 0 (0.0%) |
| Community & Social Service | 0 (0.0%) | 3 (100.0%) |
| Education, Arts & Media | 0 (0.0%) | 0 (0.0%) |
| Legal Services & Support | 0 (0.0%) | 0 (0.0%) |
| Education Instruction & Library | 0 (0.0%) | 3 (100.0%) |
| Arts, Media & Entertainment | 0 (0.0%) | 0 (0.0%) |
| Health Diagnosing & Treating | 0 (0.0%) | 2 (100.0%) |
| Health Technologists | 0 (0.0%) | 0 (0.0%) |
| Total (Category) | 5 (50.0%) | 5 (50.0%) |
| Total (Overall) | 17 (48.6%) | 18 (51.4%) |
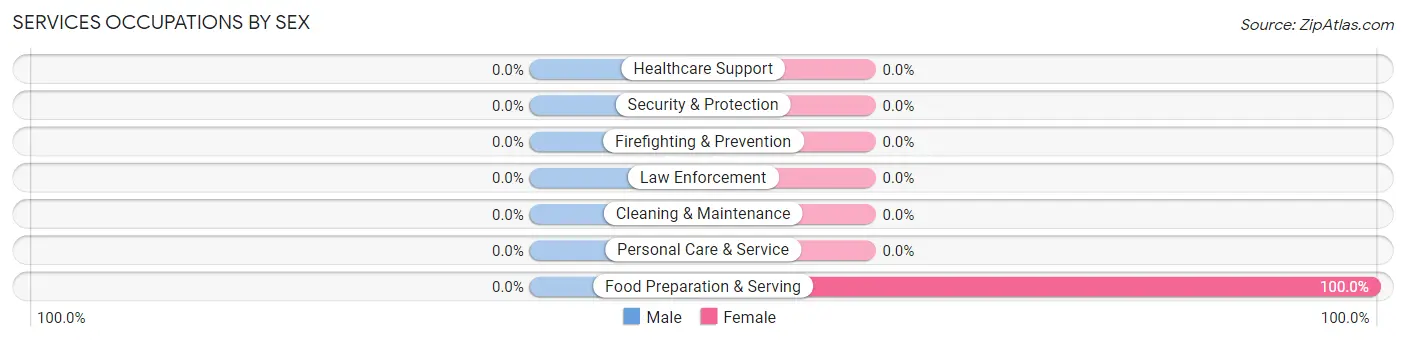
Services Occupations
The most common Services occupations in Riceville are , and Food Preparation & Serving (4 | 11.4%).

Services Occupations by Sex
| Occupation | Male | Female |
| Healthcare Support | 0 (0.0%) | 0 (0.0%) |
| Security & Protection | 0 (0.0%) | 0 (0.0%) |
| Firefighting & Prevention | 0 (0.0%) | 0 (0.0%) |
| Law Enforcement | 0 (0.0%) | 0 (0.0%) |
| Food Preparation & Serving | 0 (0.0%) | 4 (100.0%) |
| Cleaning & Maintenance | 0 (0.0%) | 0 (0.0%) |
| Personal Care & Service | 0 (0.0%) | 0 (0.0%) |
| Total (Category) | 0 (0.0%) | 4 (100.0%) |
| Total (Overall) | 17 (48.6%) | 18 (51.4%) |
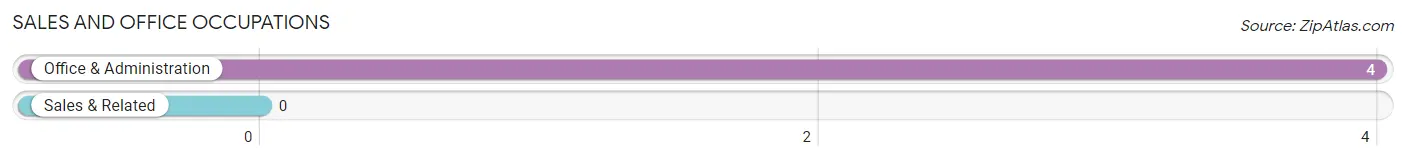
Sales and Office Occupations
The most common Sales and Office occupations in Riceville are , and Office & Administration (4 | 11.4%).
Sales and Office Occupations by Sex
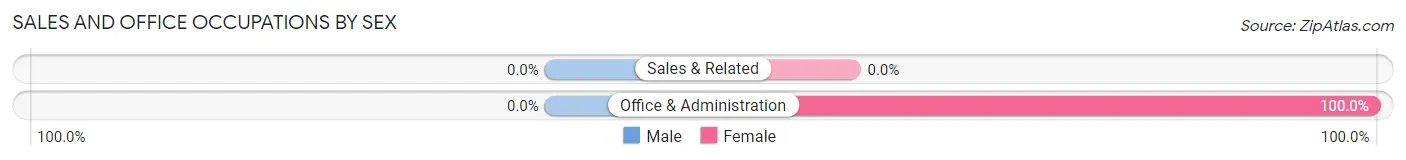
| Occupation | Male | Female |
| Sales & Related | 0 (0.0%) | 0 (0.0%) |
| Office & Administration | 0 (0.0%) | 4 (100.0%) |
| Total (Category) | 0 (0.0%) | 4 (100.0%) |
| Total (Overall) | 17 (48.6%) | 18 (51.4%) |
Natural Resources, Construction and Maintenance Occupations
Natural Resources, Construction and Maintenance Occupations by Sex
| Occupation | Male | Female |
| Farming, Fishing & Forestry | 0 (0.0%) | 0 (0.0%) |
| Construction & Extraction | 0 (0.0%) | 0 (0.0%) |
| Installation, Maintenance & Repair | 0 (0.0%) | 0 (0.0%) |
| Total (Category) | 0 (0.0%) | 0 (0.0%) |
| Total (Overall) | 17 (48.6%) | 18 (51.4%) |
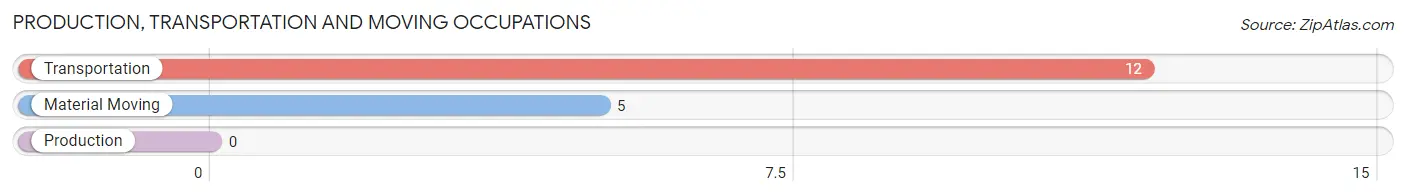
Production, Transportation and Moving Occupations
The most common Production, Transportation and Moving occupations in Riceville are Transportation (12 | 34.3%), and Material Moving (5 | 14.3%).
Production, Transportation and Moving Occupations by Sex
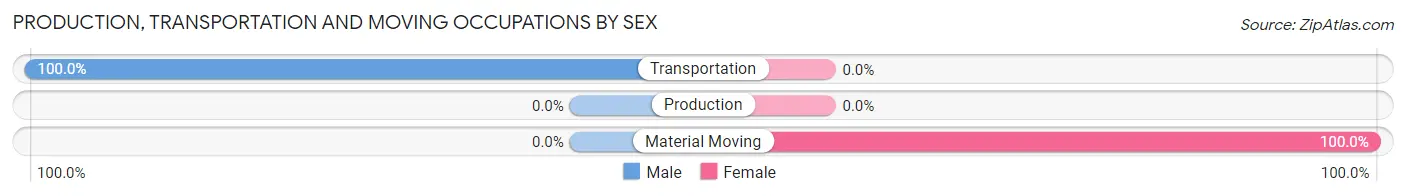
| Occupation | Male | Female |
| Production | 0 (0.0%) | 0 (0.0%) |
| Transportation | 12 (100.0%) | 0 (0.0%) |
| Material Moving | 0 (0.0%) | 5 (100.0%) |
| Total (Category) | 12 (70.6%) | 5 (29.4%) |
| Total (Overall) | 17 (48.6%) | 18 (51.4%) |
Employment Industries by Sex in Riceville
Employment Industries in Riceville
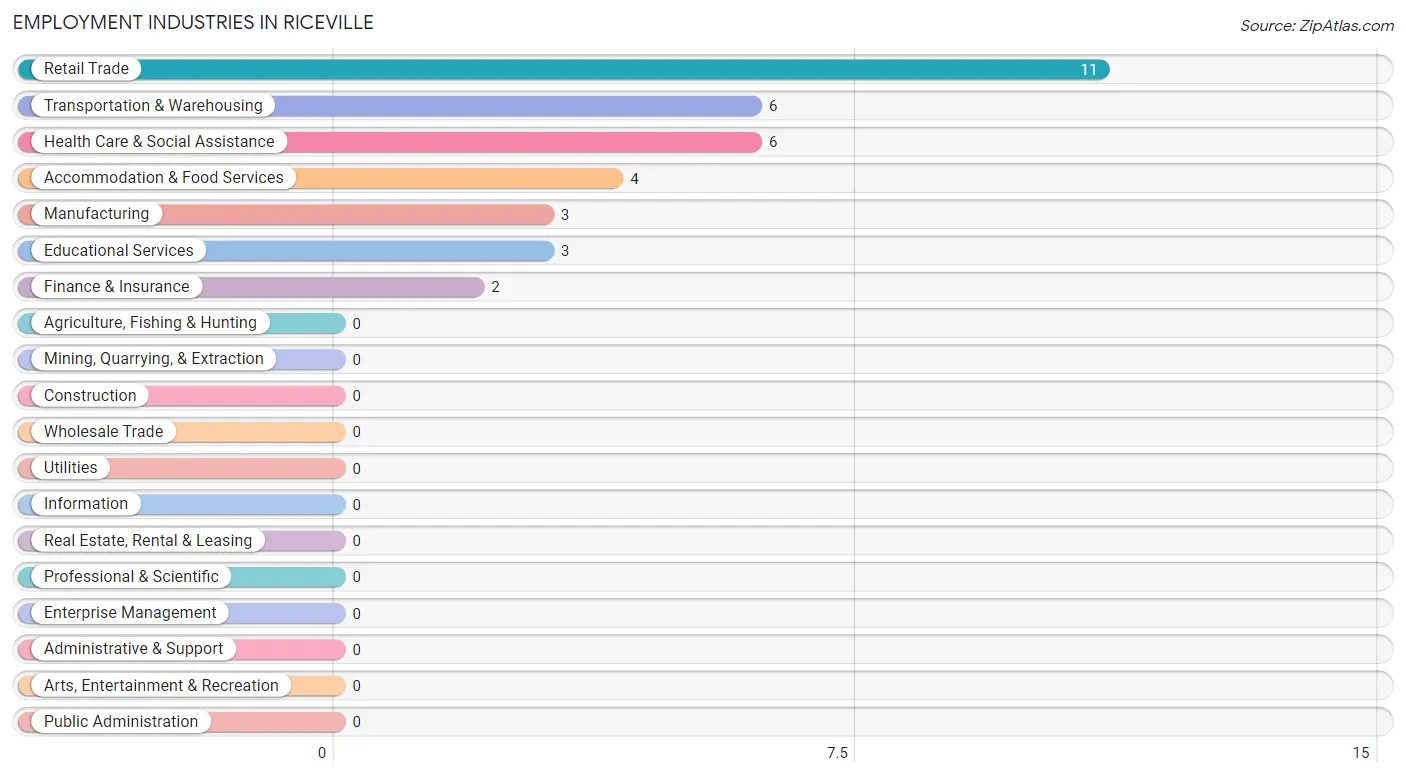
The major employment industries in Riceville include Retail Trade (11 | 31.4%), Transportation & Warehousing (6 | 17.1%), Health Care & Social Assistance (6 | 17.1%), Accommodation & Food Services (4 | 11.4%), and Manufacturing (3 | 8.6%).
Employment Industries by Sex in Riceville
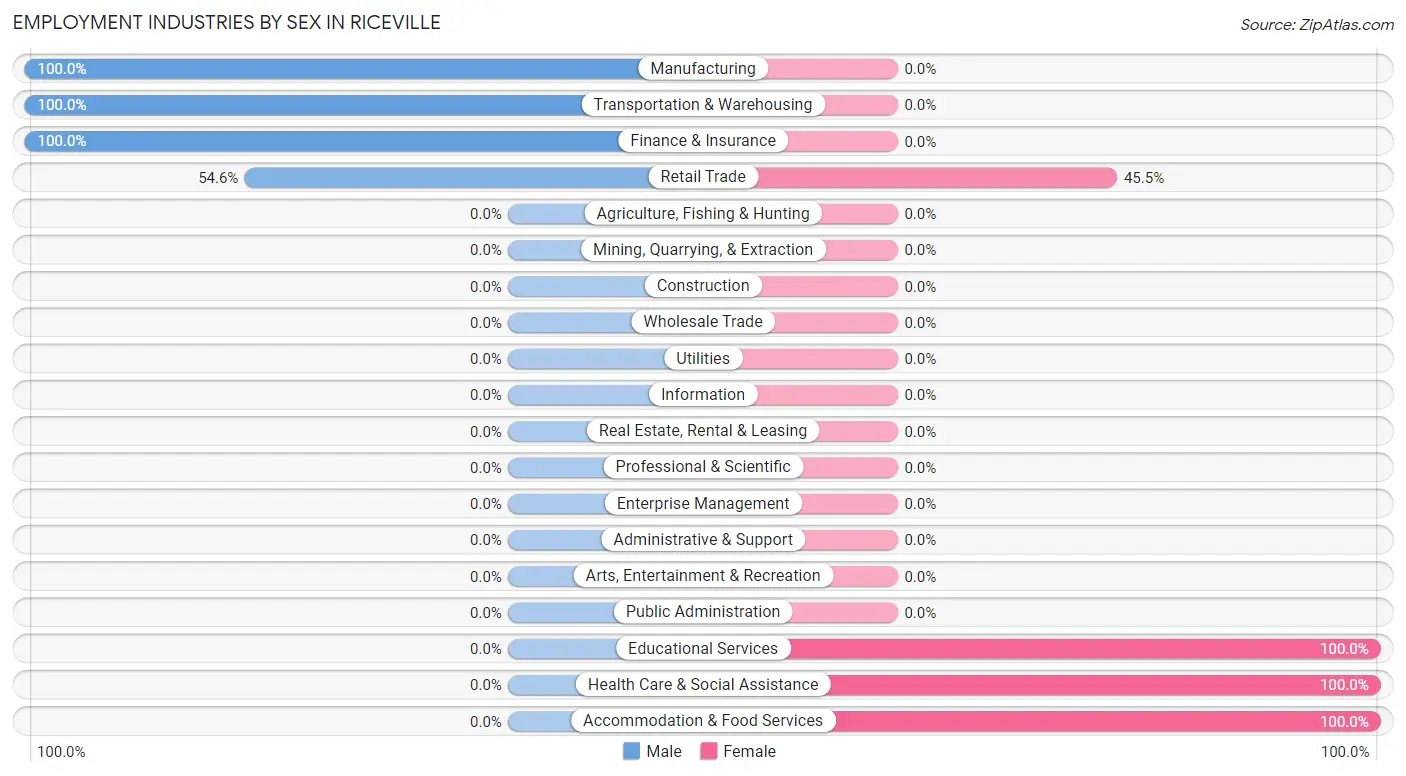
The Riceville industries that see more men than women are Manufacturing (100.0%), Transportation & Warehousing (100.0%), and Finance & Insurance (100.0%), whereas the industries that tend to have a higher number of women are Educational Services (100.0%), Health Care & Social Assistance (100.0%), and Accommodation & Food Services (100.0%).
| Industry | Male | Female |
| Agriculture, Fishing & Hunting | 0 (0.0%) | 0 (0.0%) |
| Mining, Quarrying, & Extraction | 0 (0.0%) | 0 (0.0%) |
| Construction | 0 (0.0%) | 0 (0.0%) |
| Manufacturing | 3 (100.0%) | 0 (0.0%) |
| Wholesale Trade | 0 (0.0%) | 0 (0.0%) |
| Retail Trade | 6 (54.5%) | 5 (45.5%) |
| Transportation & Warehousing | 6 (100.0%) | 0 (0.0%) |
| Utilities | 0 (0.0%) | 0 (0.0%) |
| Information | 0 (0.0%) | 0 (0.0%) |
| Finance & Insurance | 2 (100.0%) | 0 (0.0%) |
| Real Estate, Rental & Leasing | 0 (0.0%) | 0 (0.0%) |
| Professional & Scientific | 0 (0.0%) | 0 (0.0%) |
| Enterprise Management | 0 (0.0%) | 0 (0.0%) |
| Administrative & Support | 0 (0.0%) | 0 (0.0%) |
| Educational Services | 0 (0.0%) | 3 (100.0%) |
| Health Care & Social Assistance | 0 (0.0%) | 6 (100.0%) |
| Arts, Entertainment & Recreation | 0 (0.0%) | 0 (0.0%) |
| Accommodation & Food Services | 0 (0.0%) | 4 (100.0%) |
| Public Administration | 0 (0.0%) | 0 (0.0%) |
| Total | 17 (48.6%) | 18 (51.4%) |
Education in Riceville
School Enrollment in Riceville
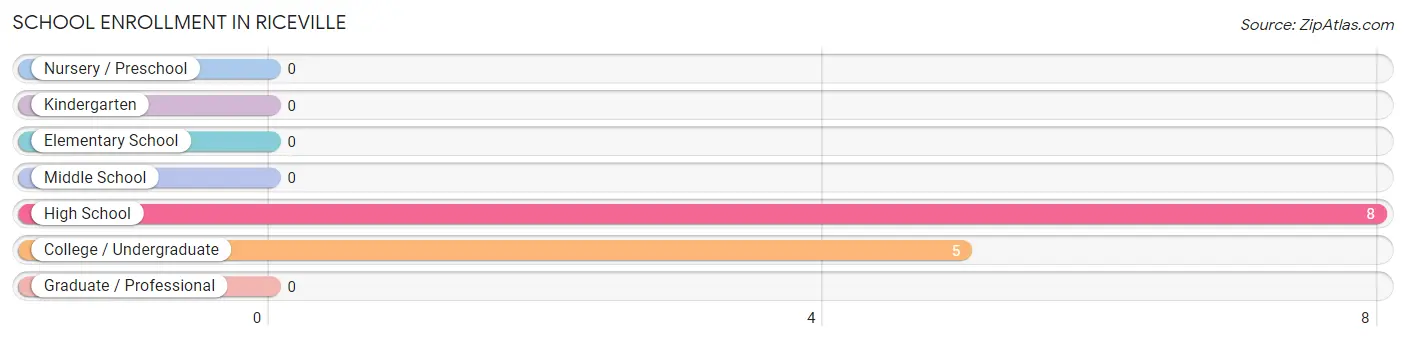
The most common levels of schooling among the 13 students in Riceville are high school (8 | 61.5%), and college / undergraduate (5 | 38.5%).
| School Level | # Students | % Students |
| Nursery / Preschool | 0 | 0.0% |
| Kindergarten | 0 | 0.0% |
| Elementary School | 0 | 0.0% |
| Middle School | 0 | 0.0% |
| High School | 8 | 61.5% |
| College / Undergraduate | 5 | 38.5% |
| Graduate / Professional | 0 | 0.0% |
| Total | 13 | 100.0% |
School Enrollment by Age by Funding Source in Riceville
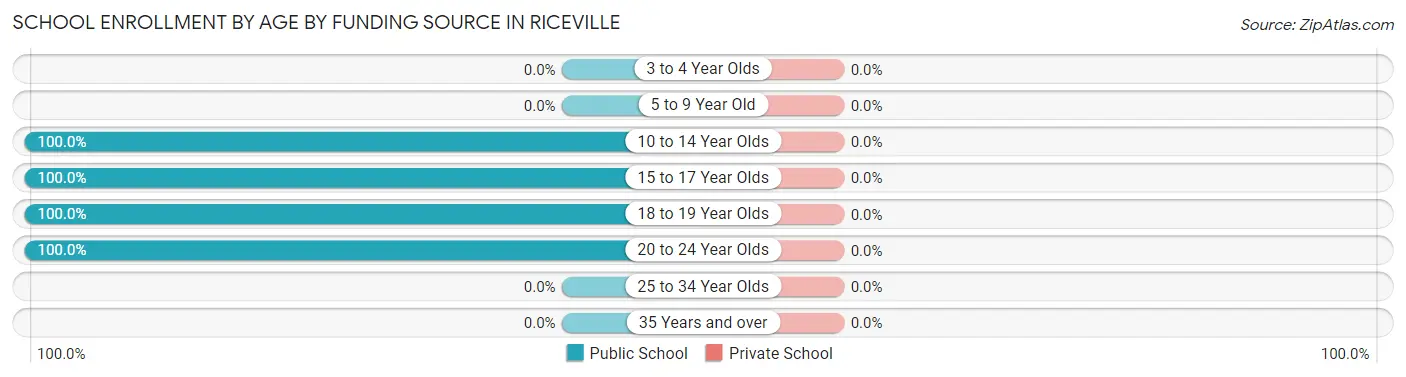
| Age Bracket | Public School | Private School |
| 3 to 4 Year Olds | 0 (0.0%) | 0 (0.0%) |
| 5 to 9 Year Old | 0 (0.0%) | 0 (0.0%) |
| 10 to 14 Year Olds | 2 (100.0%) | 0 (0.0%) |
| 15 to 17 Year Olds | 2 (100.0%) | 0 (0.0%) |
| 18 to 19 Year Olds | 4 (100.0%) | 0 (0.0%) |
| 20 to 24 Year Olds | 5 (100.0%) | 0 (0.0%) |
| 25 to 34 Year Olds | 0 (0.0%) | 0 (0.0%) |
| 35 Years and over | 0 (0.0%) | 0 (0.0%) |
| Total | 13 (100.0%) | 0 (0.0%) |
Educational Attainment by Field of Study in Riceville
Education (6 | 75.0%), and social sciences (2 | 25.0%) are the most common fields of study among 8 individuals in Riceville who have obtained a bachelor's degree or higher.
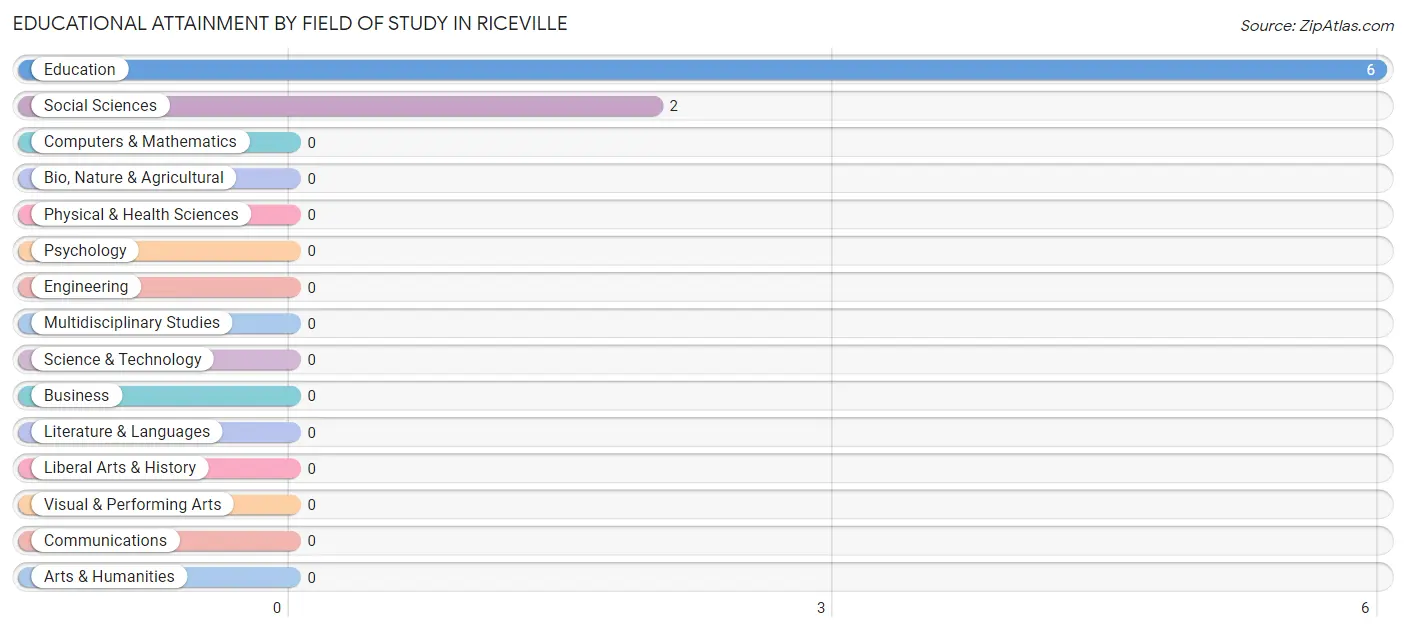
| Field of Study | # Graduates | % Graduates |
| Computers & Mathematics | 0 | 0.0% |
| Bio, Nature & Agricultural | 0 | 0.0% |
| Physical & Health Sciences | 0 | 0.0% |
| Psychology | 0 | 0.0% |
| Social Sciences | 2 | 25.0% |
| Engineering | 0 | 0.0% |
| Multidisciplinary Studies | 0 | 0.0% |
| Science & Technology | 0 | 0.0% |
| Business | 0 | 0.0% |
| Education | 6 | 75.0% |
| Literature & Languages | 0 | 0.0% |
| Liberal Arts & History | 0 | 0.0% |
| Visual & Performing Arts | 0 | 0.0% |
| Communications | 0 | 0.0% |
| Arts & Humanities | 0 | 0.0% |
| Total | 8 | 100.0% |
Transportation & Commute in Riceville
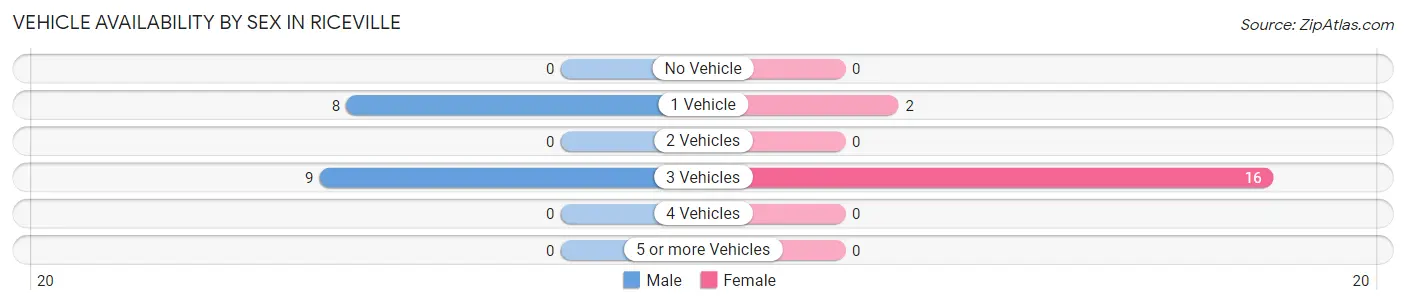
Vehicle Availability by Sex in Riceville
The most prevalent vehicle ownership categories in Riceville are males with 3 vehicles (9, accounting for 52.9%) and females with 3 vehicles (16, making up 50.0%).
| Vehicles Available | Male | Female |
| No Vehicle | 0 (0.0%) | 0 (0.0%) |
| 1 Vehicle | 8 (47.1%) | 2 (11.1%) |
| 2 Vehicles | 0 (0.0%) | 0 (0.0%) |
| 3 Vehicles | 9 (52.9%) | 16 (88.9%) |
| 4 Vehicles | 0 (0.0%) | 0 (0.0%) |
| 5 or more Vehicles | 0 (0.0%) | 0 (0.0%) |
| Total | 17 (100.0%) | 18 (100.0%) |
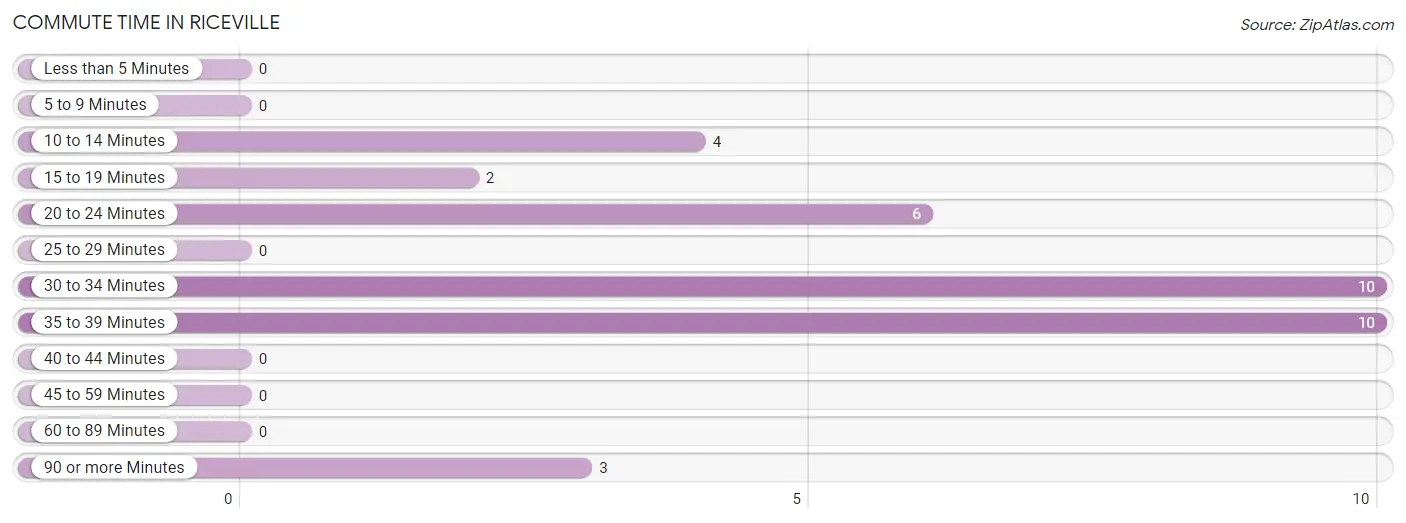
Commute Time in Riceville
The most frequently occuring commute durations in Riceville are 30 to 34 minutes (10 commuters, 28.6%), 35 to 39 minutes (10 commuters, 28.6%), and 20 to 24 minutes (6 commuters, 17.1%).
| Commute Time | # Commuters | % Commuters |
| Less than 5 Minutes | 0 | 0.0% |
| 5 to 9 Minutes | 0 | 0.0% |
| 10 to 14 Minutes | 4 | 11.4% |
| 15 to 19 Minutes | 2 | 5.7% |
| 20 to 24 Minutes | 6 | 17.1% |
| 25 to 29 Minutes | 0 | 0.0% |
| 30 to 34 Minutes | 10 | 28.6% |
| 35 to 39 Minutes | 10 | 28.6% |
| 40 to 44 Minutes | 0 | 0.0% |
| 45 to 59 Minutes | 0 | 0.0% |
| 60 to 89 Minutes | 0 | 0.0% |
| 90 or more Minutes | 3 | 8.6% |
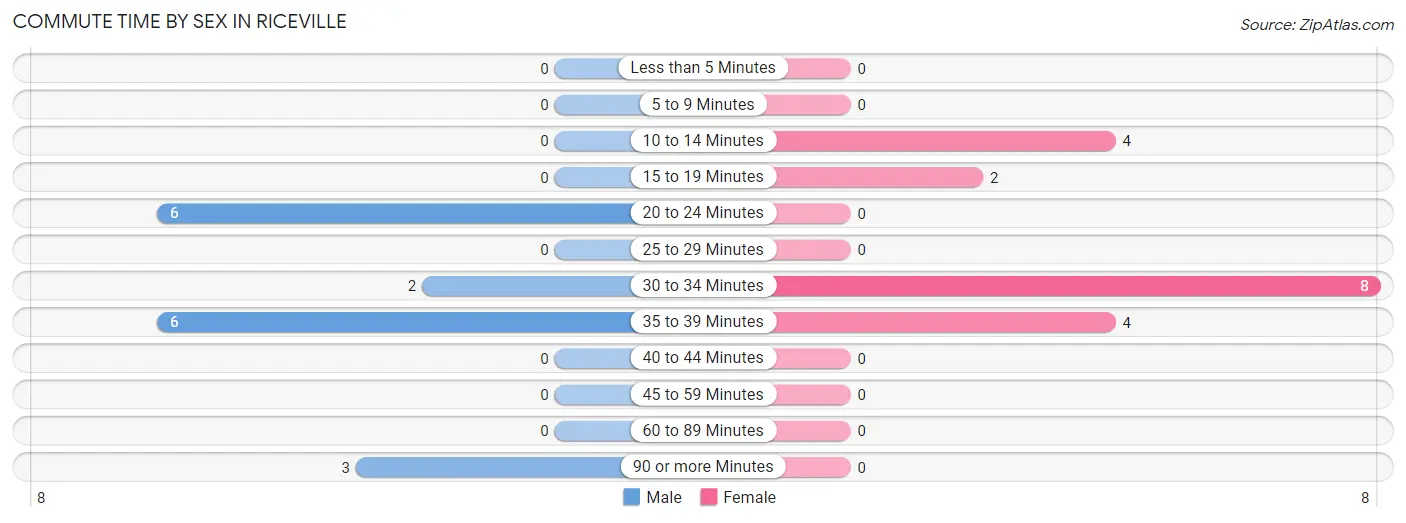
Commute Time by Sex in Riceville
The most common commute times in Riceville are 20 to 24 minutes (6 commuters, 35.3%) for males and 30 to 34 minutes (8 commuters, 44.4%) for females.
| Commute Time | Male | Female |
| Less than 5 Minutes | 0 (0.0%) | 0 (0.0%) |
| 5 to 9 Minutes | 0 (0.0%) | 0 (0.0%) |
| 10 to 14 Minutes | 0 (0.0%) | 4 (22.2%) |
| 15 to 19 Minutes | 0 (0.0%) | 2 (11.1%) |
| 20 to 24 Minutes | 6 (35.3%) | 0 (0.0%) |
| 25 to 29 Minutes | 0 (0.0%) | 0 (0.0%) |
| 30 to 34 Minutes | 2 (11.8%) | 8 (44.4%) |
| 35 to 39 Minutes | 6 (35.3%) | 4 (22.2%) |
| 40 to 44 Minutes | 0 (0.0%) | 0 (0.0%) |
| 45 to 59 Minutes | 0 (0.0%) | 0 (0.0%) |
| 60 to 89 Minutes | 0 (0.0%) | 0 (0.0%) |
| 90 or more Minutes | 3 (17.6%) | 0 (0.0%) |
Time of Departure to Work by Sex in Riceville
The most frequent times of departure to work in Riceville are 6:00 AM to 6:29 AM (6, 35.3%) for males and 7:30 AM to 7:59 AM (8, 44.4%) for females.
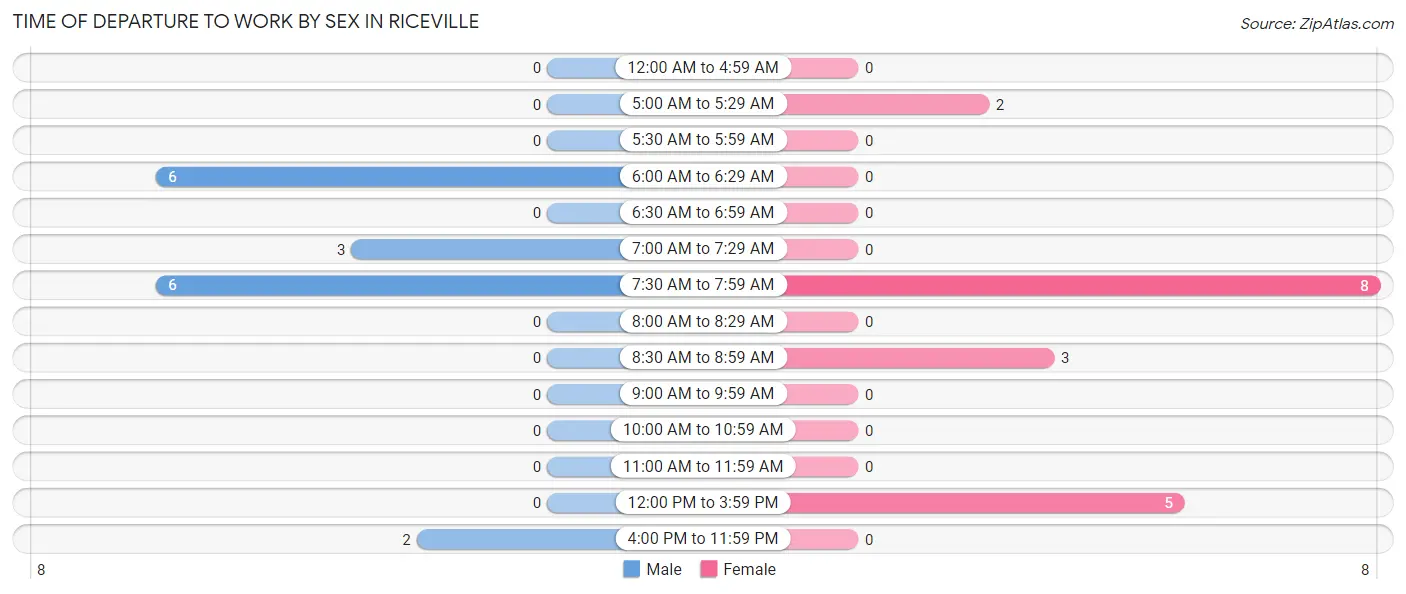
| Time of Departure | Male | Female |
| 12:00 AM to 4:59 AM | 0 (0.0%) | 0 (0.0%) |
| 5:00 AM to 5:29 AM | 0 (0.0%) | 2 (11.1%) |
| 5:30 AM to 5:59 AM | 0 (0.0%) | 0 (0.0%) |
| 6:00 AM to 6:29 AM | 6 (35.3%) | 0 (0.0%) |
| 6:30 AM to 6:59 AM | 0 (0.0%) | 0 (0.0%) |
| 7:00 AM to 7:29 AM | 3 (17.6%) | 0 (0.0%) |
| 7:30 AM to 7:59 AM | 6 (35.3%) | 8 (44.4%) |
| 8:00 AM to 8:29 AM | 0 (0.0%) | 0 (0.0%) |
| 8:30 AM to 8:59 AM | 0 (0.0%) | 3 (16.7%) |
| 9:00 AM to 9:59 AM | 0 (0.0%) | 0 (0.0%) |
| 10:00 AM to 10:59 AM | 0 (0.0%) | 0 (0.0%) |
| 11:00 AM to 11:59 AM | 0 (0.0%) | 0 (0.0%) |
| 12:00 PM to 3:59 PM | 0 (0.0%) | 5 (27.8%) |
| 4:00 PM to 11:59 PM | 2 (11.8%) | 0 (0.0%) |
| Total | 17 (100.0%) | 18 (100.0%) |
Housing Occupancy in Riceville
Occupancy by Ownership in Riceville
Of the total 21 dwellings in Riceville, owner-occupied units account for 21 (100.0%), while renter-occupied units make up 0 (0.0%).
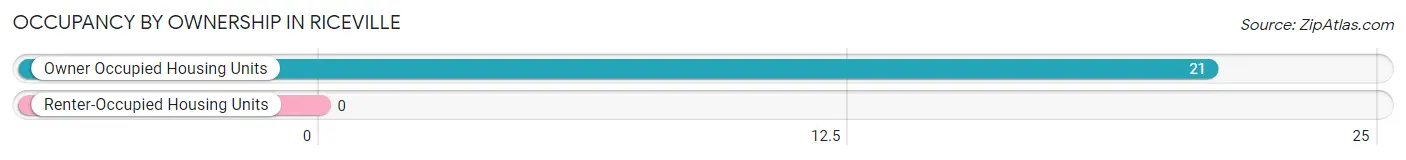
| Occupancy | # Housing Units | % Housing Units |
| Owner Occupied Housing Units | 21 | 100.0% |
| Renter-Occupied Housing Units | 0 | 0.0% |
| Total Occupied Housing Units | 21 | 100.0% |
Occupancy by Household Size in Riceville
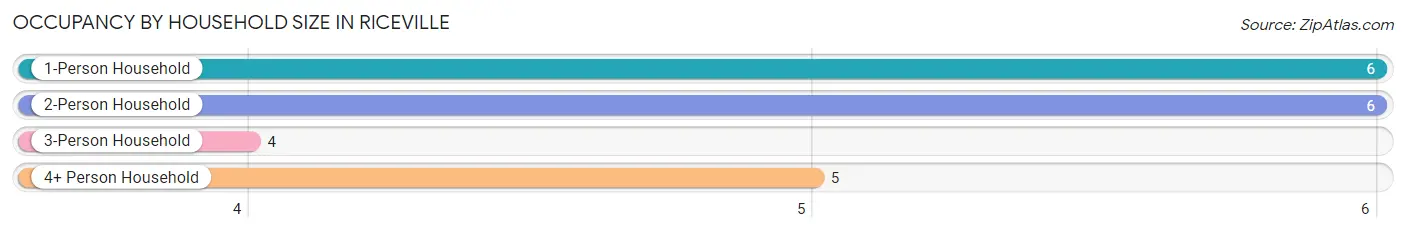
| Household Size | # Housing Units | % Housing Units |
| 1-Person Household | 6 | 28.6% |
| 2-Person Household | 6 | 28.6% |
| 3-Person Household | 4 | 19.1% |
| 4+ Person Household | 5 | 23.8% |
| Total Housing Units | 21 | 100.0% |
Occupancy by Ownership by Household Size in Riceville
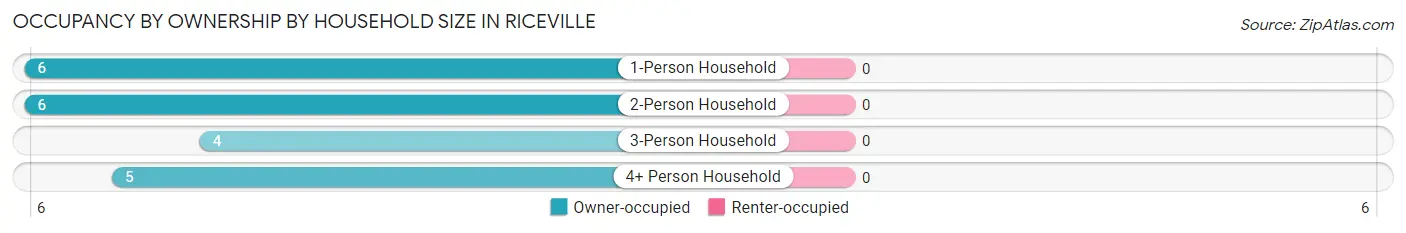
| Household Size | Owner-occupied | Renter-occupied |
| 1-Person Household | 6 (100.0%) | 0 (0.0%) |
| 2-Person Household | 6 (100.0%) | 0 (0.0%) |
| 3-Person Household | 4 (100.0%) | 0 (0.0%) |
| 4+ Person Household | 5 (100.0%) | 0 (0.0%) |
| Total Housing Units | 21 (100.0%) | 0 (0.0%) |
Occupancy by Educational Attainment in Riceville
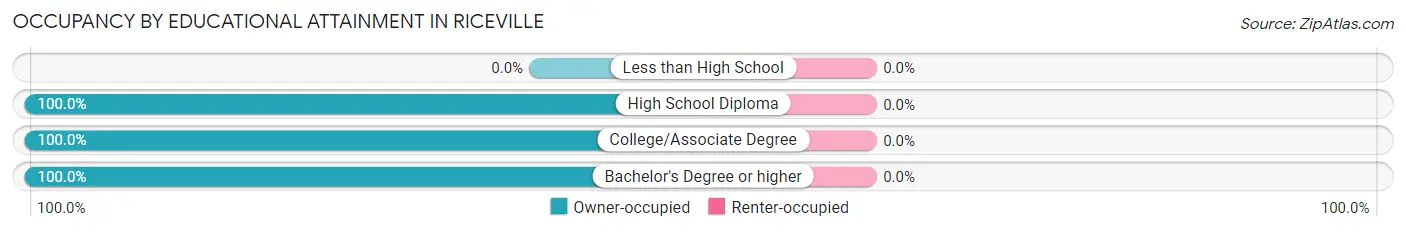
| Household Size | Owner-occupied | Renter-occupied |
| Less than High School | 0 (0.0%) | 0 (0.0%) |
| High School Diploma | 6 (100.0%) | 0 (0.0%) |
| College/Associate Degree | 10 (100.0%) | 0 (0.0%) |
| Bachelor's Degree or higher | 5 (100.0%) | 0 (0.0%) |
Occupancy by Age of Householder in Riceville
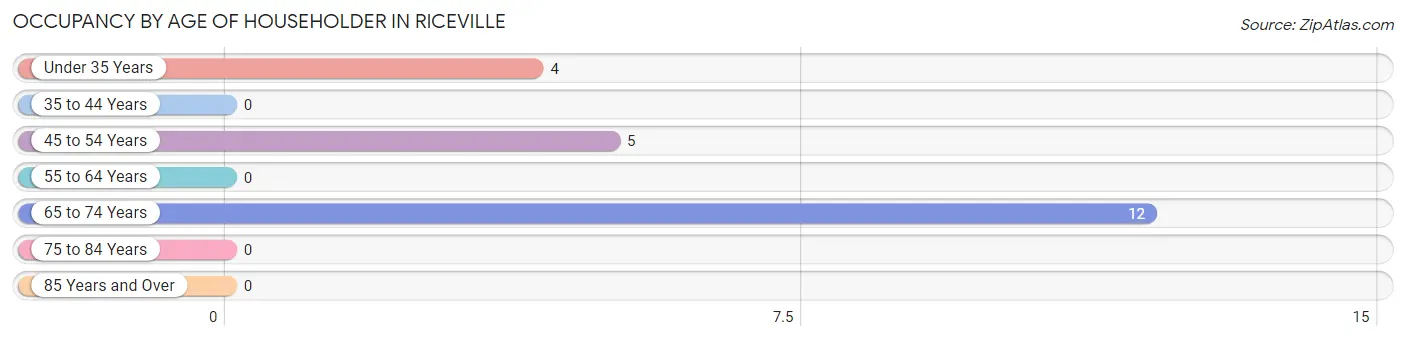
| Age Bracket | # Households | % Households |
| Under 35 Years | 4 | 19.1% |
| 35 to 44 Years | 0 | 0.0% |
| 45 to 54 Years | 5 | 23.8% |
| 55 to 64 Years | 0 | 0.0% |
| 65 to 74 Years | 12 | 57.1% |
| 75 to 84 Years | 0 | 0.0% |
| 85 Years and Over | 0 | 0.0% |
| Total | 21 | 100.0% |
Housing Finances in Riceville
Median Income by Occupancy in Riceville
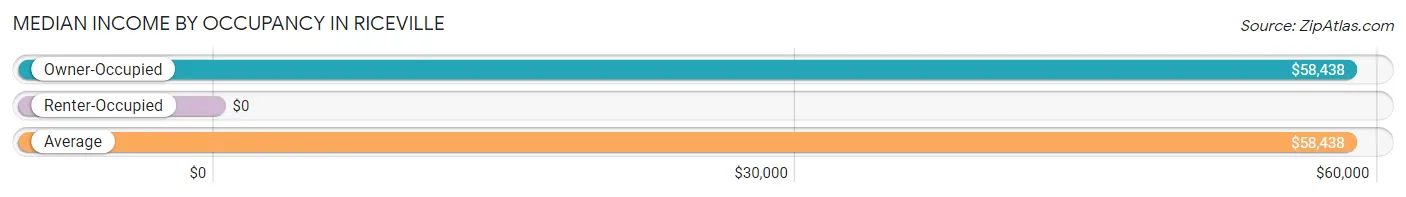
| Occupancy Type | # Households | Median Income |
| Owner-Occupied | 21 (100.0%) | $58,438 |
| Renter-Occupied | 0 (0.0%) | $0 |
| Average | 21 (100.0%) | $58,438 |
Occupancy by Householder Income Bracket in Riceville
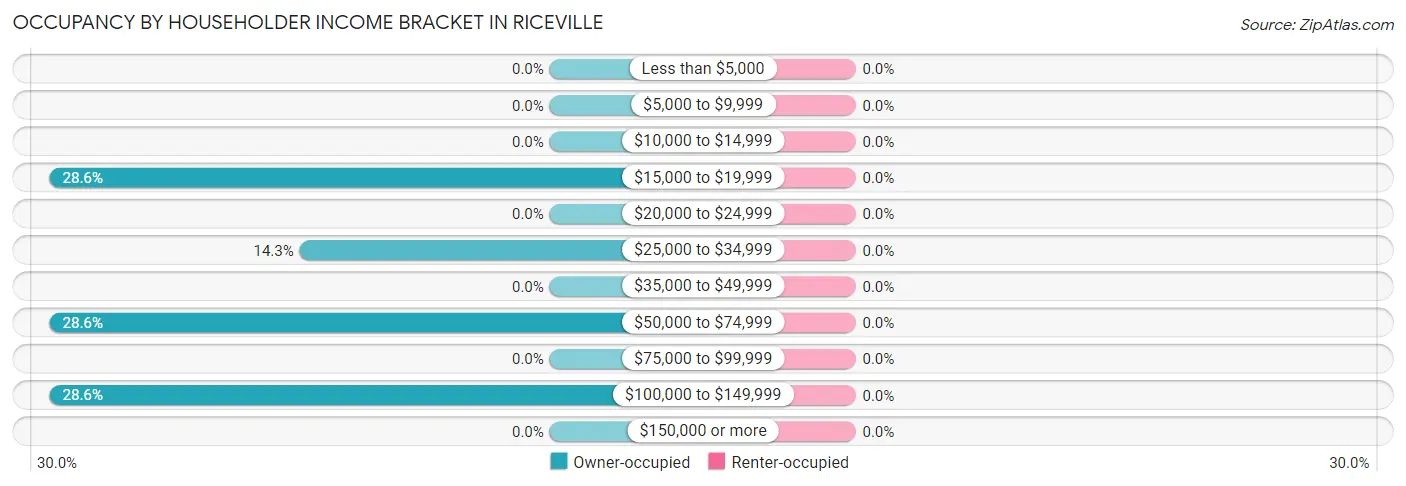
| Income Bracket | Owner-occupied | Renter-occupied |
| Less than $5,000 | 0 (0.0%) | 0 (0.0%) |
| $5,000 to $9,999 | 0 (0.0%) | 0 (0.0%) |
| $10,000 to $14,999 | 0 (0.0%) | 0 (0.0%) |
| $15,000 to $19,999 | 6 (28.6%) | 0 (0.0%) |
| $20,000 to $24,999 | 0 (0.0%) | 0 (0.0%) |
| $25,000 to $34,999 | 3 (14.3%) | 0 (0.0%) |
| $35,000 to $49,999 | 0 (0.0%) | 0 (0.0%) |
| $50,000 to $74,999 | 6 (28.6%) | 0 (0.0%) |
| $75,000 to $99,999 | 0 (0.0%) | 0 (0.0%) |
| $100,000 to $149,999 | 6 (28.6%) | 0 (0.0%) |
| $150,000 or more | 0 (0.0%) | 0 (0.0%) |
| Total | 21 (100.0%) | 0 (0.0%) |
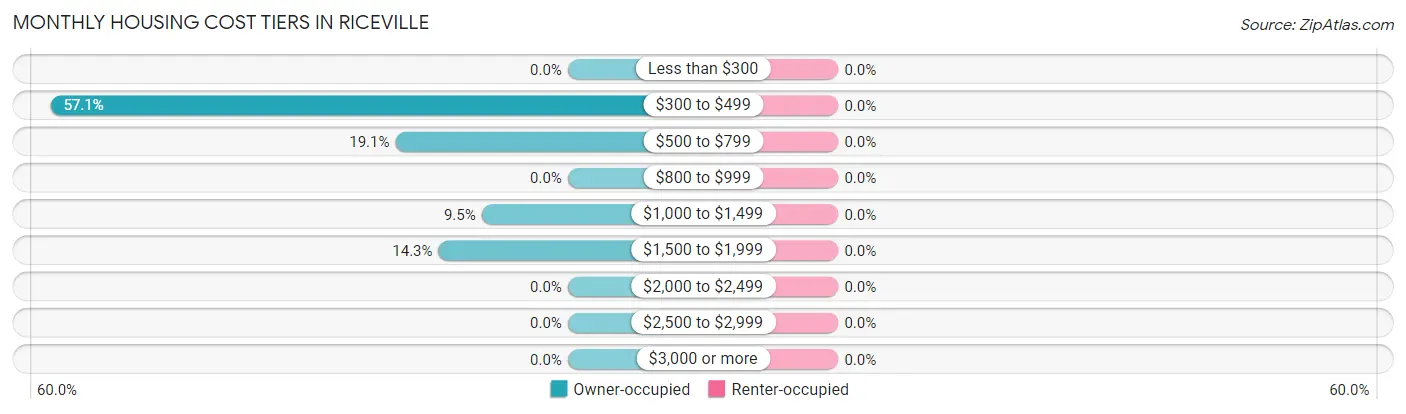
Monthly Housing Cost Tiers in Riceville
| Monthly Cost | Owner-occupied | Renter-occupied |
| Less than $300 | 0 (0.0%) | 0 (0.0%) |
| $300 to $499 | 12 (57.1%) | 0 (0.0%) |
| $500 to $799 | 4 (19.1%) | 0 (0.0%) |
| $800 to $999 | 0 (0.0%) | 0 (0.0%) |
| $1,000 to $1,499 | 2 (9.5%) | 0 (0.0%) |
| $1,500 to $1,999 | 3 (14.3%) | 0 (0.0%) |
| $2,000 to $2,499 | 0 (0.0%) | 0 (0.0%) |
| $2,500 to $2,999 | 0 (0.0%) | 0 (0.0%) |
| $3,000 or more | 0 (0.0%) | 0 (0.0%) |
| Total | 21 (100.0%) | 0 (0.0%) |
Physical Housing Characteristics in Riceville
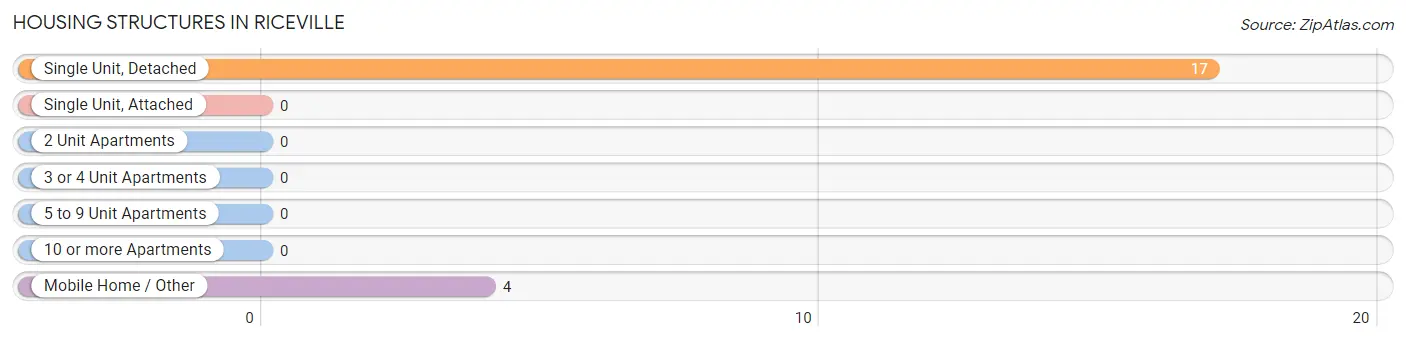
Housing Structures in Riceville
| Structure Type | # Housing Units | % Housing Units |
| Single Unit, Detached | 17 | 80.9% |
| Single Unit, Attached | 0 | 0.0% |
| 2 Unit Apartments | 0 | 0.0% |
| 3 or 4 Unit Apartments | 0 | 0.0% |
| 5 to 9 Unit Apartments | 0 | 0.0% |
| 10 or more Apartments | 0 | 0.0% |
| Mobile Home / Other | 4 | 19.1% |
| Total | 21 | 100.0% |
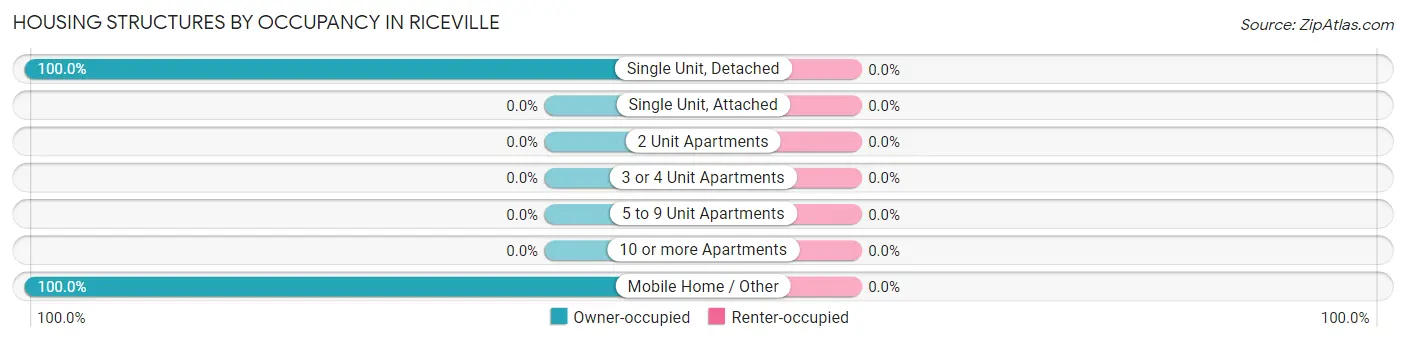
Housing Structures by Occupancy in Riceville
| Structure Type | Owner-occupied | Renter-occupied |
| Single Unit, Detached | 17 (100.0%) | 0 (0.0%) |
| Single Unit, Attached | 0 (0.0%) | 0 (0.0%) |
| 2 Unit Apartments | 0 (0.0%) | 0 (0.0%) |
| 3 or 4 Unit Apartments | 0 (0.0%) | 0 (0.0%) |
| 5 to 9 Unit Apartments | 0 (0.0%) | 0 (0.0%) |
| 10 or more Apartments | 0 (0.0%) | 0 (0.0%) |
| Mobile Home / Other | 4 (100.0%) | 0 (0.0%) |
| Total | 21 (100.0%) | 0 (0.0%) |
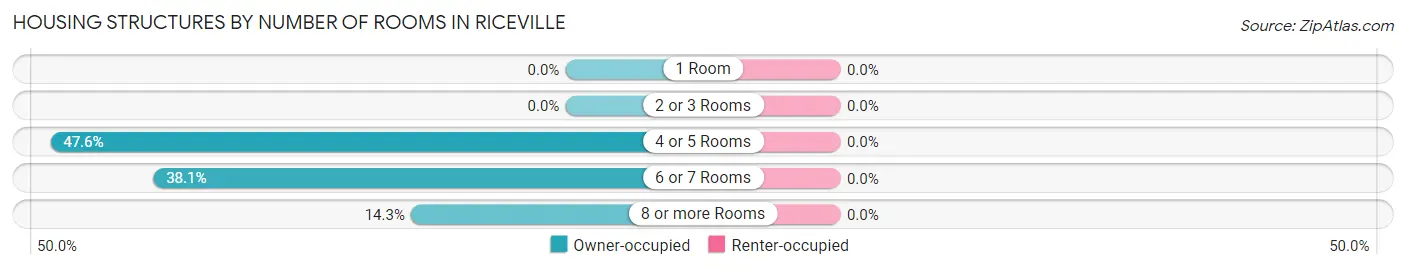
Housing Structures by Number of Rooms in Riceville
| Number of Rooms | Owner-occupied | Renter-occupied |
| 1 Room | 0 (0.0%) | 0 (0.0%) |
| 2 or 3 Rooms | 0 (0.0%) | 0 (0.0%) |
| 4 or 5 Rooms | 10 (47.6%) | 0 (0.0%) |
| 6 or 7 Rooms | 8 (38.1%) | 0 (0.0%) |
| 8 or more Rooms | 3 (14.3%) | 0 (0.0%) |
| Total | 21 (100.0%) | 0 (0.0%) |
Housing Structure by Heating Type in Riceville
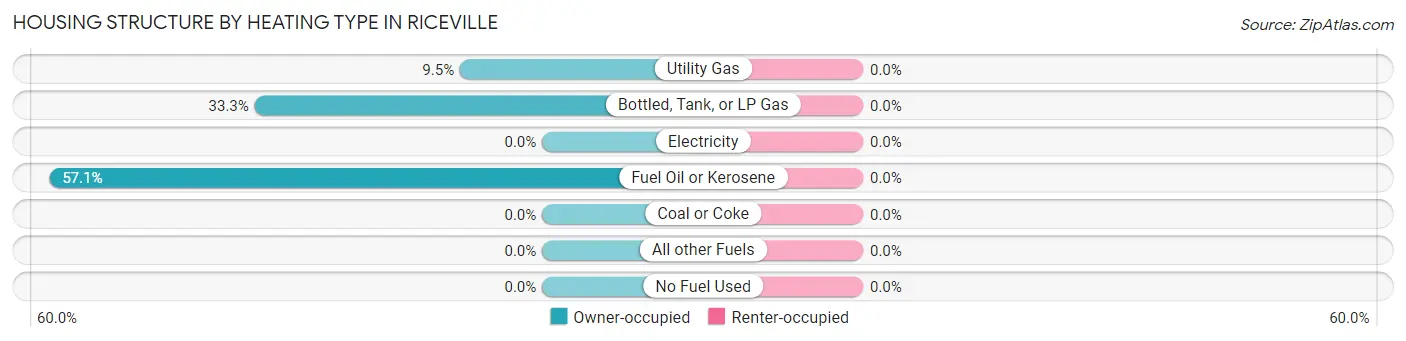
| Heating Type | Owner-occupied | Renter-occupied |
| Utility Gas | 2 (9.5%) | 0 (0.0%) |
| Bottled, Tank, or LP Gas | 7 (33.3%) | 0 (0.0%) |
| Electricity | 0 (0.0%) | 0 (0.0%) |
| Fuel Oil or Kerosene | 12 (57.1%) | 0 (0.0%) |
| Coal or Coke | 0 (0.0%) | 0 (0.0%) |
| All other Fuels | 0 (0.0%) | 0 (0.0%) |
| No Fuel Used | 0 (0.0%) | 0 (0.0%) |
| Total | 21 (100.0%) | 0 (0.0%) |
Household Vehicle Usage in Riceville
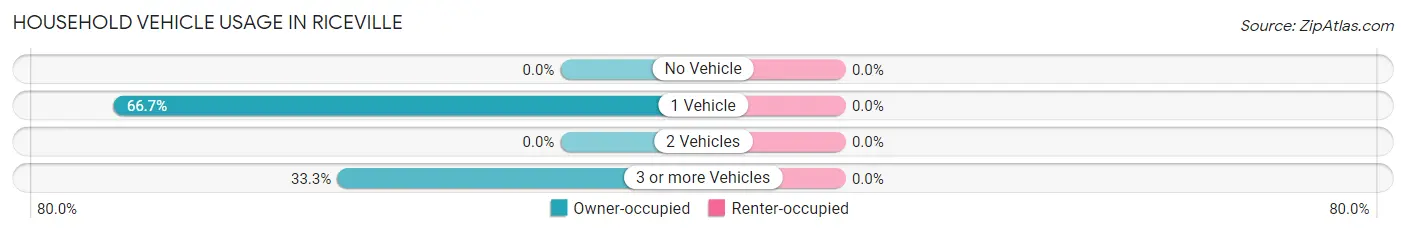
| Vehicles per Household | Owner-occupied | Renter-occupied |
| No Vehicle | 0 (0.0%) | 0 (0.0%) |
| 1 Vehicle | 14 (66.7%) | 0 (0.0%) |
| 2 Vehicles | 0 (0.0%) | 0 (0.0%) |
| 3 or more Vehicles | 7 (33.3%) | 0 (0.0%) |
| Total | 21 (100.0%) | 0 (0.0%) |
Real Estate & Mortgages in Riceville
Real Estate and Mortgage Overview in Riceville
| Characteristic | Without Mortgage | With Mortgage |
| Housing Units | 16 | 5 |
| Median Property Value | $102,800 | $0 |
| Median Household Income | - | - |
| Monthly Housing Costs | $456 | $0 |
| Real Estate Taxes | $1,083 | $0 |
Property Value by Mortgage Status in Riceville
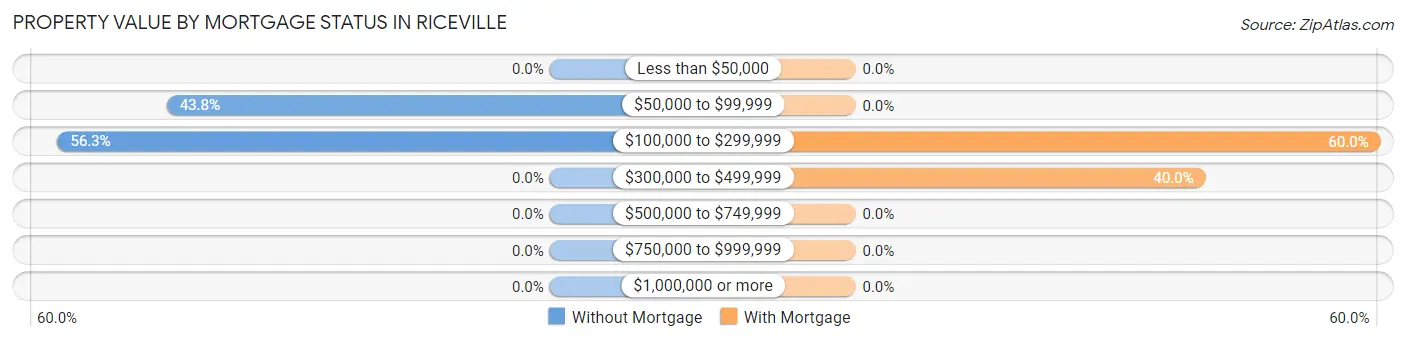
| Property Value | Without Mortgage | With Mortgage |
| Less than $50,000 | 0 (0.0%) | 0 (0.0%) |
| $50,000 to $99,999 | 7 (43.8%) | 0 (0.0%) |
| $100,000 to $299,999 | 9 (56.2%) | 3 (60.0%) |
| $300,000 to $499,999 | 0 (0.0%) | 2 (40.0%) |
| $500,000 to $749,999 | 0 (0.0%) | 0 (0.0%) |
| $750,000 to $999,999 | 0 (0.0%) | 0 (0.0%) |
| $1,000,000 or more | 0 (0.0%) | 0 (0.0%) |
| Total | 16 (100.0%) | 5 (100.0%) |
Household Income by Mortgage Status in Riceville
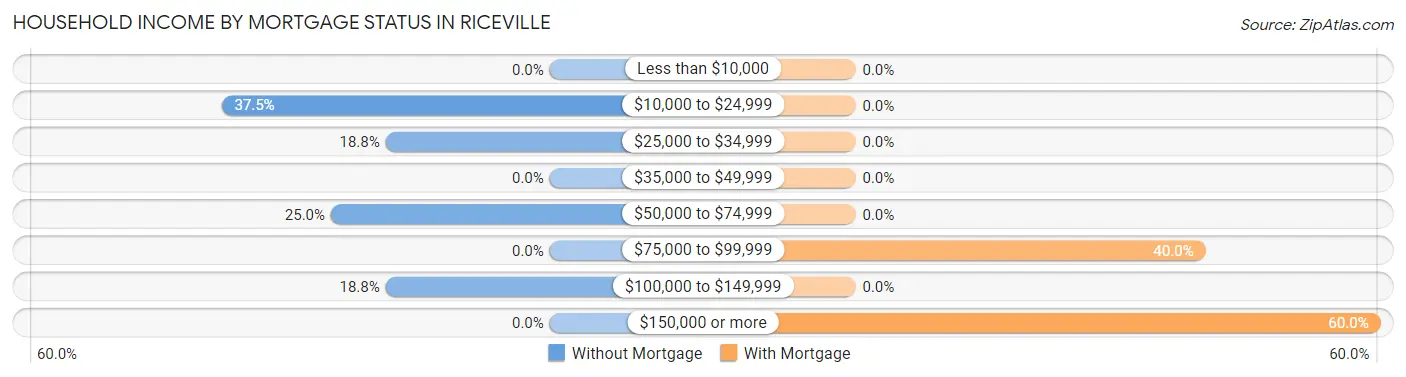
| Household Income | Without Mortgage | With Mortgage |
| Less than $10,000 | 0 (0.0%) | 0 (0.0%) |
| $10,000 to $24,999 | 6 (37.5%) | 0 (0.0%) |
| $25,000 to $34,999 | 3 (18.8%) | 0 (0.0%) |
| $35,000 to $49,999 | 0 (0.0%) | 0 (0.0%) |
| $50,000 to $74,999 | 4 (25.0%) | 0 (0.0%) |
| $75,000 to $99,999 | 0 (0.0%) | 2 (40.0%) |
| $100,000 to $149,999 | 3 (18.8%) | 0 (0.0%) |
| $150,000 or more | 0 (0.0%) | 3 (60.0%) |
| Total | 16 (100.0%) | 5 (100.0%) |
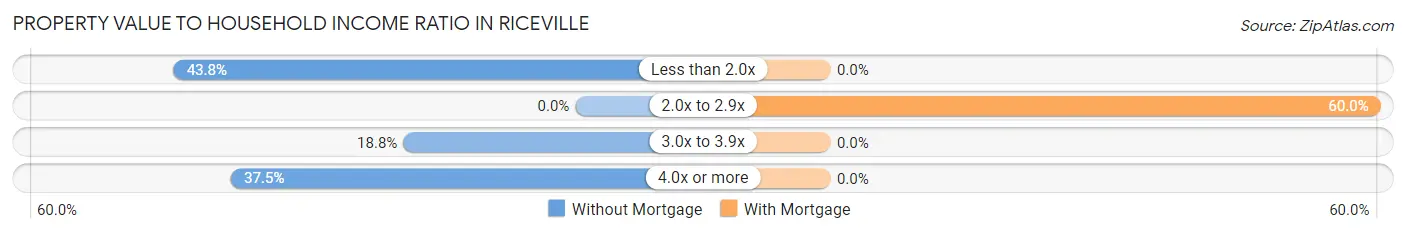
Property Value to Household Income Ratio in Riceville
| Value-to-Income Ratio | Without Mortgage | With Mortgage |
| Less than 2.0x | 7 (43.8%) | 0 (0.0%) |
| 2.0x to 2.9x | 0 (0.0%) | 3 (60.0%) |
| 3.0x to 3.9x | 3 (18.8%) | 0 (0.0%) |
| 4.0x or more | 6 (37.5%) | 0 (0.0%) |
| Total | 16 (100.0%) | 5 (100.0%) |
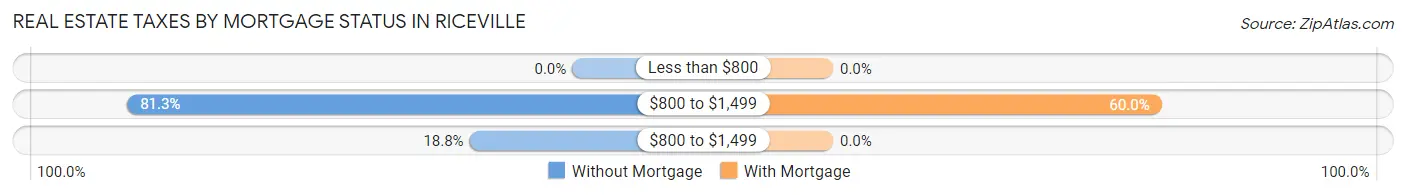
Real Estate Taxes by Mortgage Status in Riceville
| Property Taxes | Without Mortgage | With Mortgage |
| Less than $800 | 0 (0.0%) | 0 (0.0%) |
| $800 to $1,499 | 13 (81.2%) | 3 (60.0%) |
| $800 to $1,499 | 3 (18.8%) | 0 (0.0%) |
| Total | 16 (100.0%) | 5 (100.0%) |
Health & Disability in Riceville
Health Insurance Coverage by Age in Riceville
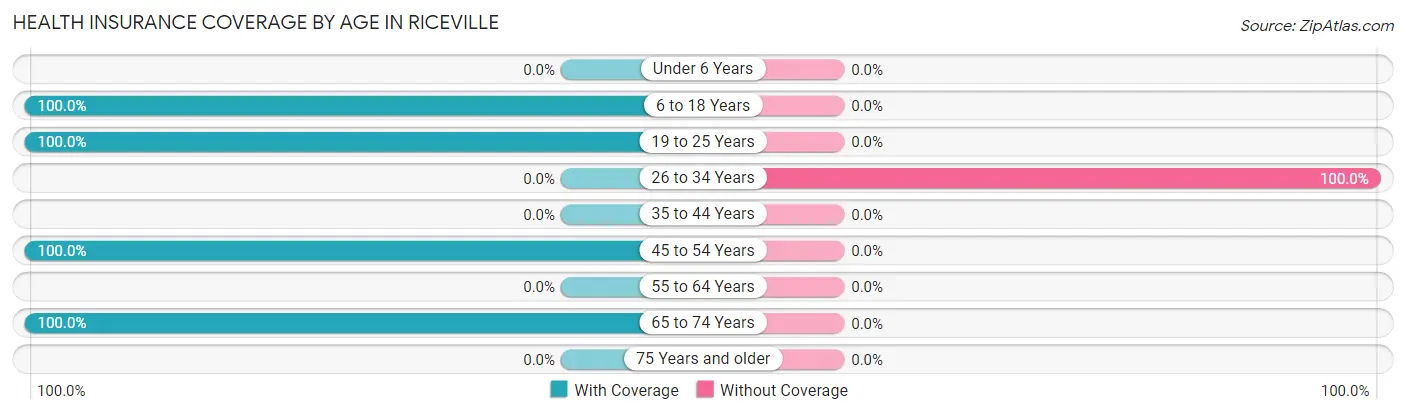
| Age Bracket | With Coverage | Without Coverage |
| Under 6 Years | 0 (0.0%) | 0 (0.0%) |
| 6 to 18 Years | 11 (100.0%) | 0 (0.0%) |
| 19 to 25 Years | 5 (100.0%) | 0 (0.0%) |
| 26 to 34 Years | 0 (0.0%) | 4 (100.0%) |
| 35 to 44 Years | 0 (0.0%) | 0 (0.0%) |
| 45 to 54 Years | 14 (100.0%) | 0 (0.0%) |
| 55 to 64 Years | 0 (0.0%) | 0 (0.0%) |
| 65 to 74 Years | 21 (100.0%) | 0 (0.0%) |
| 75 Years and older | 0 (0.0%) | 0 (0.0%) |
| Total | 51 (92.7%) | 4 (7.3%) |
Health Insurance Coverage by Citizenship Status in Riceville
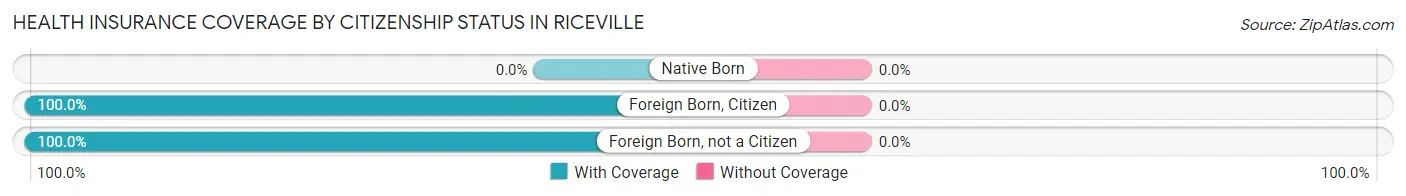
| Citizenship Status | With Coverage | Without Coverage |
| Native Born | 0 (0.0%) | 0 (0.0%) |
| Foreign Born, Citizen | 11 (100.0%) | 0 (0.0%) |
| Foreign Born, not a Citizen | 5 (100.0%) | 0 (0.0%) |
Health Insurance Coverage by Household Income in Riceville
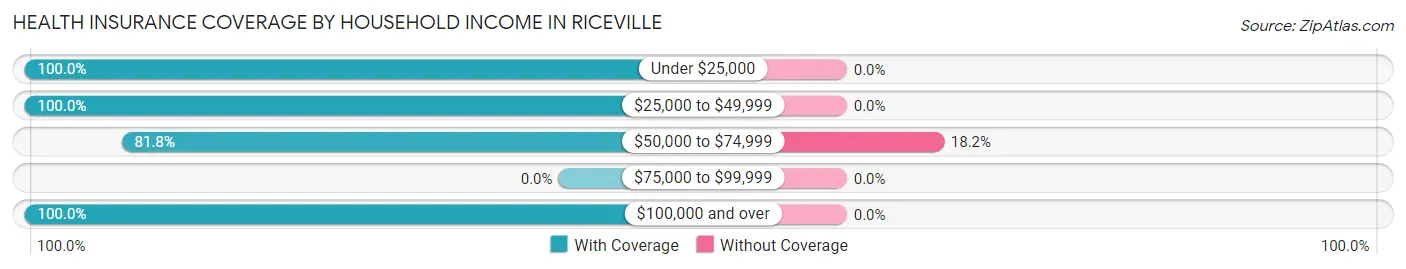
| Household Income | With Coverage | Without Coverage |
| Under $25,000 | 12 (100.0%) | 0 (0.0%) |
| $25,000 to $49,999 | 3 (100.0%) | 0 (0.0%) |
| $50,000 to $74,999 | 18 (81.8%) | 4 (18.2%) |
| $75,000 to $99,999 | 0 (0.0%) | 0 (0.0%) |
| $100,000 and over | 18 (100.0%) | 0 (0.0%) |
Public vs Private Health Insurance Coverage by Age in Riceville
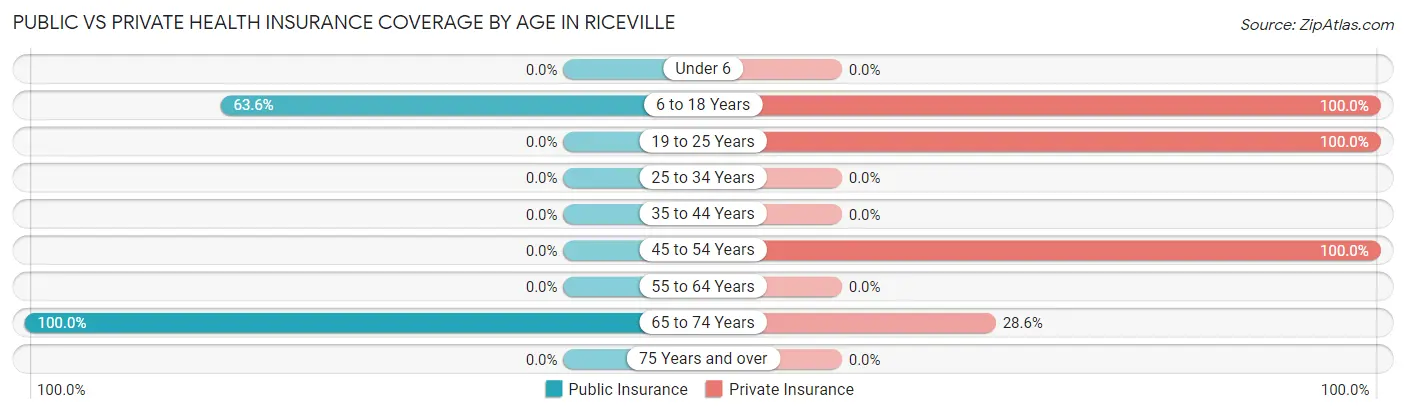
| Age Bracket | Public Insurance | Private Insurance |
| Under 6 | 0 (0.0%) | 0 (0.0%) |
| 6 to 18 Years | 7 (63.6%) | 11 (100.0%) |
| 19 to 25 Years | 0 (0.0%) | 5 (100.0%) |
| 25 to 34 Years | 0 (0.0%) | 0 (0.0%) |
| 35 to 44 Years | 0 (0.0%) | 0 (0.0%) |
| 45 to 54 Years | 0 (0.0%) | 14 (100.0%) |
| 55 to 64 Years | 0 (0.0%) | 0 (0.0%) |
| 65 to 74 Years | 21 (100.0%) | 6 (28.6%) |
| 75 Years and over | 0 (0.0%) | 0 (0.0%) |
| Total | 28 (50.9%) | 36 (65.4%) |
Disability Status by Sex by Age in Riceville
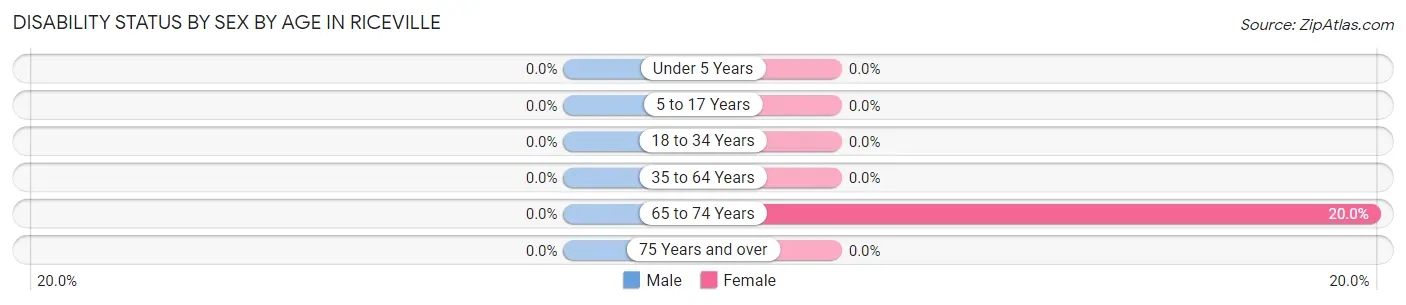
| Age Bracket | Male | Female |
| Under 5 Years | 0 (0.0%) | 0 (0.0%) |
| 5 to 17 Years | 0 (0.0%) | 0 (0.0%) |
| 18 to 34 Years | 0 (0.0%) | 0 (0.0%) |
| 35 to 64 Years | 0 (0.0%) | 0 (0.0%) |
| 65 to 74 Years | 0 (0.0%) | 3 (20.0%) |
| 75 Years and over | 0 (0.0%) | 0 (0.0%) |
Disability Class by Sex by Age in Riceville
Disability Class: Hearing Difficulty
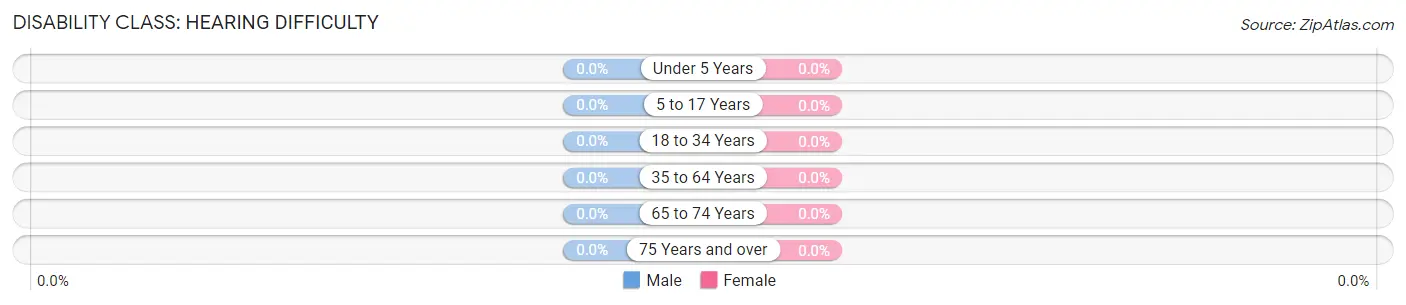
| Age Bracket | Male | Female |
| Under 5 Years | 0 (0.0%) | 0 (0.0%) |
| 5 to 17 Years | 0 (0.0%) | 0 (0.0%) |
| 18 to 34 Years | 0 (0.0%) | 0 (0.0%) |
| 35 to 64 Years | 0 (0.0%) | 0 (0.0%) |
| 65 to 74 Years | 0 (0.0%) | 0 (0.0%) |
| 75 Years and over | 0 (0.0%) | 0 (0.0%) |
Disability Class: Vision Difficulty
| Age Bracket | Male | Female |
| Under 5 Years | 0 (0.0%) | 0 (0.0%) |
| 5 to 17 Years | 0 (0.0%) | 0 (0.0%) |
| 18 to 34 Years | 0 (0.0%) | 0 (0.0%) |
| 35 to 64 Years | 0 (0.0%) | 0 (0.0%) |
| 65 to 74 Years | 0 (0.0%) | 0 (0.0%) |
| 75 Years and over | 0 (0.0%) | 0 (0.0%) |
Disability Class: Cognitive Difficulty
| Age Bracket | Male | Female |
| 5 to 17 Years | 0 (0.0%) | 0 (0.0%) |
| 18 to 34 Years | 0 (0.0%) | 0 (0.0%) |
| 35 to 64 Years | 0 (0.0%) | 0 (0.0%) |
| 65 to 74 Years | 0 (0.0%) | 3 (20.0%) |
| 75 Years and over | 0 (0.0%) | 0 (0.0%) |
Disability Class: Ambulatory Difficulty
| Age Bracket | Male | Female |
| 5 to 17 Years | 0 (0.0%) | 0 (0.0%) |
| 18 to 34 Years | 0 (0.0%) | 0 (0.0%) |
| 35 to 64 Years | 0 (0.0%) | 0 (0.0%) |
| 65 to 74 Years | 0 (0.0%) | 3 (20.0%) |
| 75 Years and over | 0 (0.0%) | 0 (0.0%) |
Disability Class: Self-Care Difficulty
| Age Bracket | Male | Female |
| 5 to 17 Years | 0 (0.0%) | 0 (0.0%) |
| 18 to 34 Years | 0 (0.0%) | 0 (0.0%) |
| 35 to 64 Years | 0 (0.0%) | 0 (0.0%) |
| 65 to 74 Years | 0 (0.0%) | 0 (0.0%) |
| 75 Years and over | 0 (0.0%) | 0 (0.0%) |
Technology Access in Riceville
Computing Device Access in Riceville
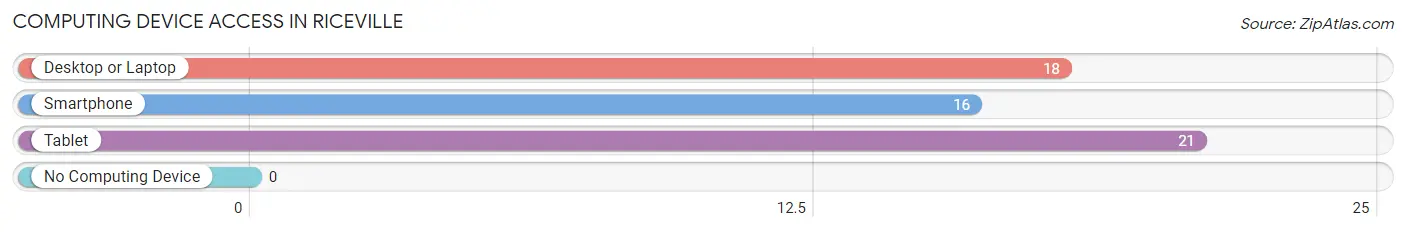
| Device Type | # Households | % Households |
| Desktop or Laptop | 18 | 85.7% |
| Smartphone | 16 | 76.2% |
| Tablet | 21 | 100.0% |
| No Computing Device | 0 | 0.0% |
| Total | 21 | 100.0% |
Internet Access in Riceville
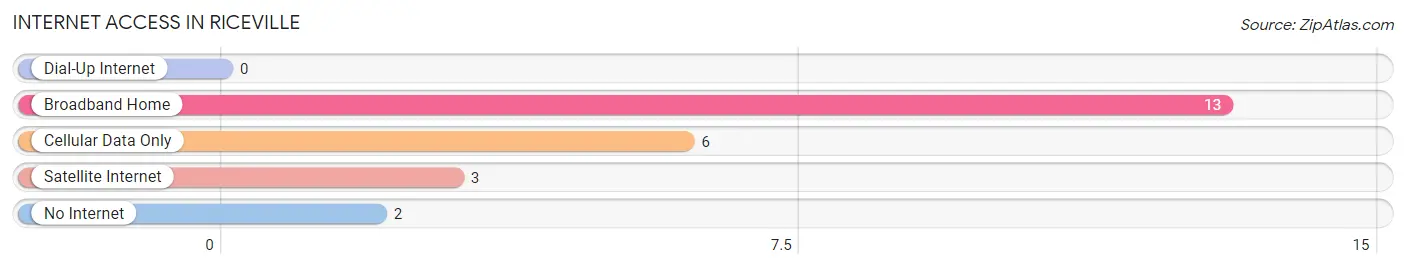
| Internet Type | # Households | % Households |
| Dial-Up Internet | 0 | 0.0% |
| Broadband Home | 13 | 61.9% |
| Cellular Data Only | 6 | 28.6% |
| Satellite Internet | 3 | 14.3% |
| No Internet | 2 | 9.5% |
| Total | 21 | 100.0% |
Riceville Summary
Riceville is a small borough located in the Allegheny Mountains of Pennsylvania. It is situated in the northern part of the state, in the county of McKean. The population of Riceville was estimated to be around 1,000 people in the year 2000.
Geography
Riceville is located in the Allegheny Mountains of Pennsylvania. It is situated in the northern part of the state, in the county of McKean. The borough is surrounded by the townships of Corydon, Norwich, and Norwich. The borough is located at an elevation of 1,890 feet above sea level. The terrain of the area is mostly hilly and forested. The borough is located in the Allegheny Plateau region of Pennsylvania.
The climate of Riceville is classified as humid continental. The average temperature in the summer is around 70 degrees Fahrenheit, while the average temperature in the winter is around 30 degrees Fahrenheit. The average annual precipitation is around 40 inches.
Economy
The economy of Riceville is largely based on agriculture and tourism. The borough is home to several small farms, which produce a variety of crops, including corn, soybeans, and hay. The borough also has several small businesses, including a grocery store, a hardware store, and a restaurant.
Tourism is also an important part of the economy of Riceville. The borough is home to several attractions, including the Riceville Historical Society Museum, the Riceville Railroad Museum, and the Riceville Nature Center. The borough also hosts several annual events, such as the Riceville Fall Festival and the Riceville Christmas Parade.
Demographics
The population of Riceville was estimated to be around 1,000 people in the year 2000. The racial makeup of the borough was 97.2% White, 0.7% African American, 0.3% Native American, 0.3% Asian, and 1.5% from other races. The median household income in Riceville was $35,000 in the year 2000.
The majority of the population of Riceville is affiliated with the Christian faith. The largest denominations are the United Methodist Church, the Presbyterian Church, and the Roman Catholic Church.
Conclusion
Riceville is a small borough located in the Allegheny Mountains of Pennsylvania. It is situated in the northern part of the state, in the county of McKean. The population of Riceville was estimated to be around 1,000 people in the year 2000. The economy of Riceville is largely based on agriculture and tourism. The racial makeup of the borough was 97.2% White, 0.7% African American, 0.3% Native American, 0.3% Asian, and 1.5% from other races. The majority of the population of Riceville is affiliated with the Christian faith.
Common Questions
What is Per Capita Income in Riceville?
Per Capita income in Riceville is $25,705.
What is the Median Family Income in Riceville?
Median Family Income in Riceville is $58,438.
What is the Median Household income in Riceville?
Median Household Income in Riceville is $58,438.
What is Inequality or Gini Index in Riceville?
Inequality or Gini Index in Riceville is 0.39.
What is the Total Population of Riceville?
Total Population of Riceville is 55.
What is the Total Male Population of Riceville?
Total Male Population of Riceville is 20.
What is the Total Female Population of Riceville?
Total Female Population of Riceville is 35.
What is the Ratio of Males per 100 Females in Riceville?
There are 57.14 Males per 100 Females in Riceville.
What is the Ratio of Females per 100 Males in Riceville?
There are 175.00 Females per 100 Males in Riceville.
What is the Median Population Age in Riceville?
Median Population Age in Riceville is 52.3 Years.
What is the Average Family Size in Riceville
Average Family Size in Riceville is 3.3 People.
What is the Average Household Size in Riceville
Average Household Size in Riceville is 2.6 People.
How Large is the Labor Force in Riceville?
There are 35 People in the Labor Forcein in Riceville.
What is the Percentage of People in the Labor Force in Riceville?
70.0% of People are in the Labor Force in Riceville.