Ronks, PA Map & Demographics
Ronks Map
Ronks Overview
$25,679
PER CAPITA INCOME
$75,074
AVG FAMILY INCOME
$70,625
AVG HOUSEHOLD INCOME
0.38
INEQUALITY / GINI INDEX
227
TOTAL POPULATION
101
MALE POPULATION
126
FEMALE POPULATION
80.16
MALES / 100 FEMALES
124.75
FEMALES / 100 MALES
29.3
MEDIAN AGE
3.1
AVG FAMILY SIZE
2.4
AVG HOUSEHOLD SIZE
107
LABOR FORCE [ PEOPLE ]
76.4%
PERCENT IN LABOR FORCE
Ronks Zip Codes
Ronks Area Codes
Income in Ronks
Income Overview in Ronks
Per Capita Income in Ronks is $25,679, while median incomes of families and households are $75,074 and $70,625 respectively.
| Characteristic | Number | Measure |
| Per Capita Income | 227 | $25,679 |
| Median Family Income | 65 | $75,074 |
| Mean Family Income | 65 | $82,711 |
| Median Household Income | 93 | $70,625 |
| Mean Household Income | 93 | $65,362 |
| Income Deficit | 65 | $0 |
| Wage / Income Gap (%) | 227 | 0.00% |
| Wage / Income Gap ($) | 227 | 100.00¢ per $1 |
| Gini / Inequality Index | 227 | 0.38 |
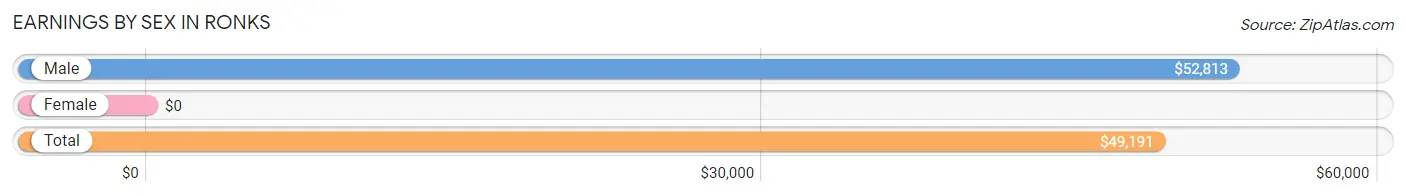
Earnings by Sex in Ronks
| Sex | Number | Average Earnings |
| Male | 64 (59.8%) | $52,813 |
| Female | 43 (40.2%) | $0 |
| Total | 107 (100.0%) | $49,191 |
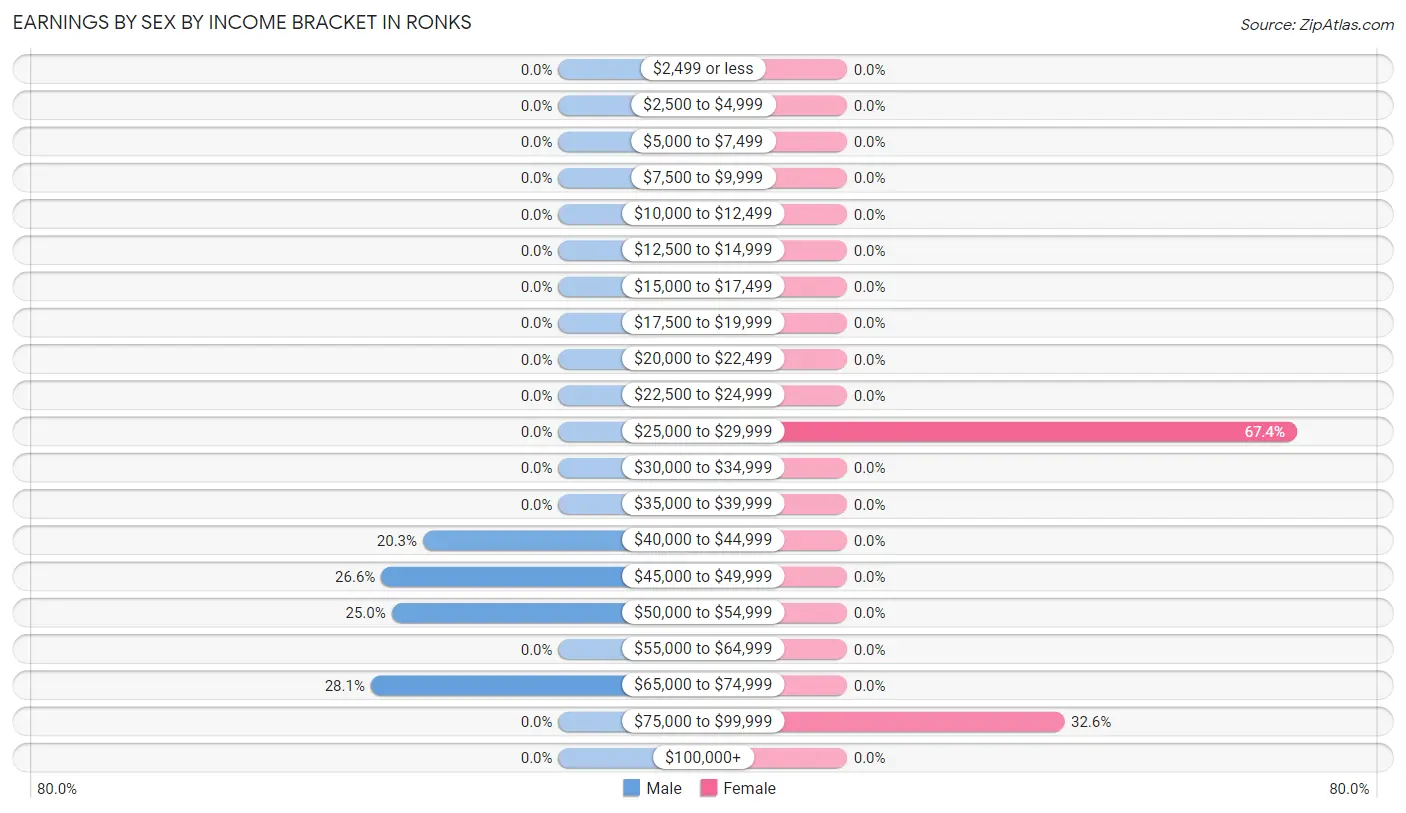
Earnings by Sex by Income Bracket in Ronks
The most common earnings brackets in Ronks are $65,000 to $74,999 for men (18 | 28.1%) and $25,000 to $29,999 for women (29 | 67.4%).
| Income | Male | Female |
| $2,499 or less | 0 (0.0%) | 0 (0.0%) |
| $2,500 to $4,999 | 0 (0.0%) | 0 (0.0%) |
| $5,000 to $7,499 | 0 (0.0%) | 0 (0.0%) |
| $7,500 to $9,999 | 0 (0.0%) | 0 (0.0%) |
| $10,000 to $12,499 | 0 (0.0%) | 0 (0.0%) |
| $12,500 to $14,999 | 0 (0.0%) | 0 (0.0%) |
| $15,000 to $17,499 | 0 (0.0%) | 0 (0.0%) |
| $17,500 to $19,999 | 0 (0.0%) | 0 (0.0%) |
| $20,000 to $22,499 | 0 (0.0%) | 0 (0.0%) |
| $22,500 to $24,999 | 0 (0.0%) | 0 (0.0%) |
| $25,000 to $29,999 | 0 (0.0%) | 29 (67.4%) |
| $30,000 to $34,999 | 0 (0.0%) | 0 (0.0%) |
| $35,000 to $39,999 | 0 (0.0%) | 0 (0.0%) |
| $40,000 to $44,999 | 13 (20.3%) | 0 (0.0%) |
| $45,000 to $49,999 | 17 (26.6%) | 0 (0.0%) |
| $50,000 to $54,999 | 16 (25.0%) | 0 (0.0%) |
| $55,000 to $64,999 | 0 (0.0%) | 0 (0.0%) |
| $65,000 to $74,999 | 18 (28.1%) | 0 (0.0%) |
| $75,000 to $99,999 | 0 (0.0%) | 14 (32.6%) |
| $100,000+ | 0 (0.0%) | 0 (0.0%) |
| Total | 64 (100.0%) | 43 (100.0%) |
Earnings by Sex by Educational Attainment in Ronks
| Educational Attainment | Male Income | Female Income |
| Less than High School | - | - |
| High School Diploma | - | - |
| College or Associate's Degree | - | - |
| Bachelor's Degree | - | - |
| Graduate Degree | - | - |
| Total | $52,813 | $0 |
Family Income in Ronks
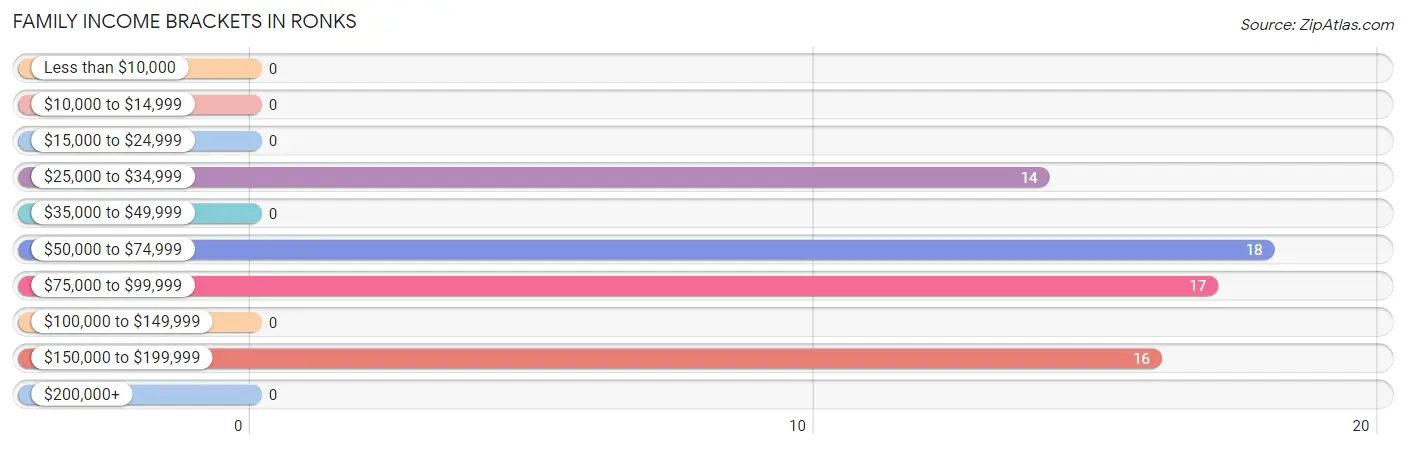
Family Income Brackets in Ronks
According to the Ronks family income data, there are 18 families falling into the $50,000 to $74,999 income range, which is the most common income bracket and makes up 27.7% of all families.
| Income Bracket | # Families | % Families |
| Less than $10,000 | 0 | 0.0% |
| $10,000 to $14,999 | 0 | 0.0% |
| $15,000 to $24,999 | 0 | 0.0% |
| $25,000 to $34,999 | 14 | 21.5% |
| $35,000 to $49,999 | 0 | 0.0% |
| $50,000 to $74,999 | 18 | 27.7% |
| $75,000 to $99,999 | 17 | 26.2% |
| $100,000 to $149,999 | 0 | 0.0% |
| $150,000 to $199,999 | 16 | 24.6% |
| $200,000+ | 0 | 0.0% |
Family Income by Famaliy Size in Ronks
| Income Bracket | # Families | Median Income |
| 2-Person Families | 17 (26.2%) | $0 |
| 3-Person Families | 30 (46.2%) | $0 |
| 4-Person Families | 18 (27.7%) | $0 |
| 5-Person Families | 0 (0.0%) | $0 |
| 6-Person Families | 0 (0.0%) | $0 |
| 7+ Person Families | 0 (0.0%) | $0 |
| Total | 65 (100.0%) | $75,074 |
Family Income by Number of Earners in Ronks
| Number of Earners | # Families | Median Income |
| No Earners | 0 (0.0%) | $0 |
| 1 Earner | 32 (49.2%) | $0 |
| 2 Earners | 33 (50.8%) | $0 |
| 3+ Earners | 0 (0.0%) | $0 |
| Total | 65 (100.0%) | $75,074 |
Household Income in Ronks
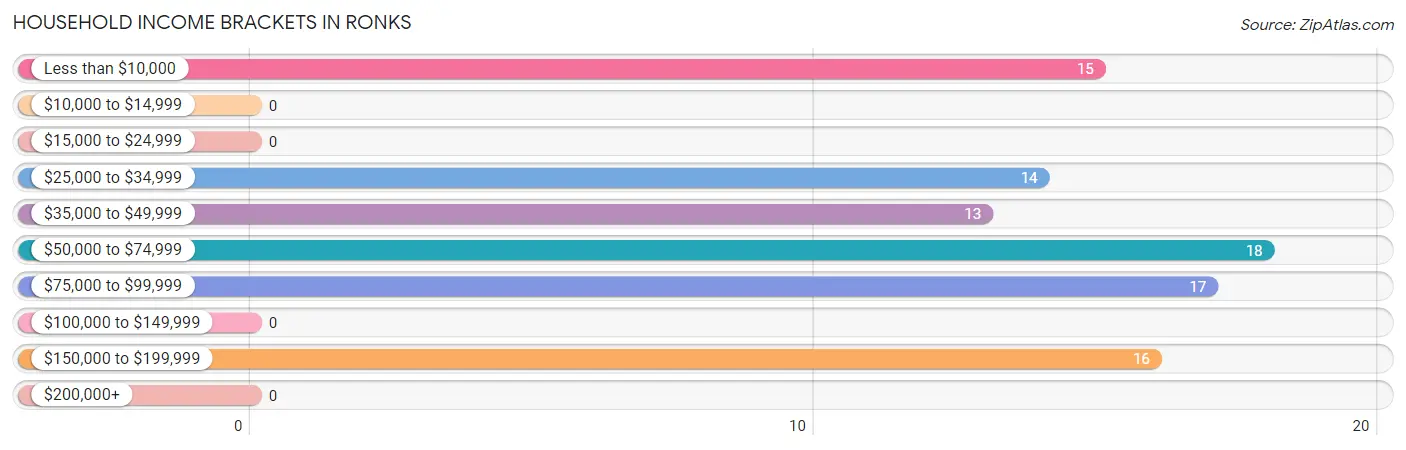
Household Income Brackets in Ronks
With 18 households falling in the category, the $50,000 to $74,999 income range is the most frequent in Ronks, accounting for 19.4% of all households.
| Income Bracket | # Households | % Households |
| Less than $10,000 | 15 | 16.1% |
| $10,000 to $14,999 | 0 | 0.0% |
| $15,000 to $24,999 | 0 | 0.0% |
| $25,000 to $34,999 | 14 | 15.1% |
| $35,000 to $49,999 | 13 | 14.0% |
| $50,000 to $74,999 | 18 | 19.4% |
| $75,000 to $99,999 | 17 | 18.3% |
| $100,000 to $149,999 | 0 | 0.0% |
| $150,000 to $199,999 | 16 | 17.2% |
| $200,000+ | 0 | 0.0% |
Household Income by Householder Age in Ronks
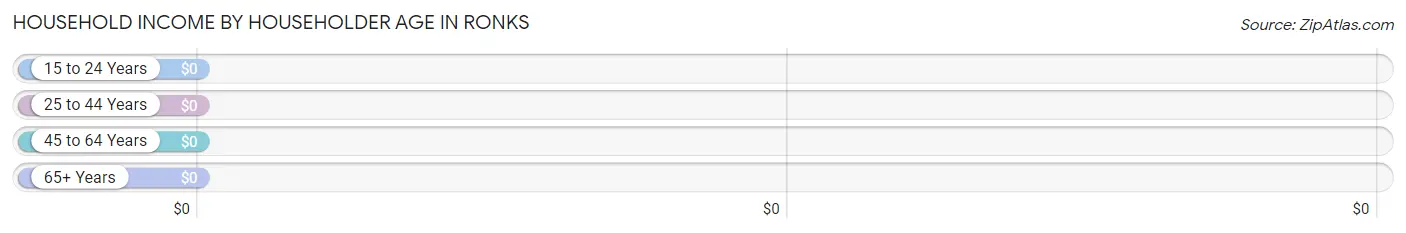
| Income Bracket | # Households | Median Income |
| 15 to 24 Years | 0 (0.0%) | $0 |
| 25 to 44 Years | 45 (48.4%) | $0 |
| 45 to 64 Years | 16 (17.2%) | $0 |
| 65+ Years | 32 (34.4%) | $0 |
| Total | 93 (100.0%) | $70,625 |
Poverty in Ronks
Income Below Poverty by Sex and Age in Ronks
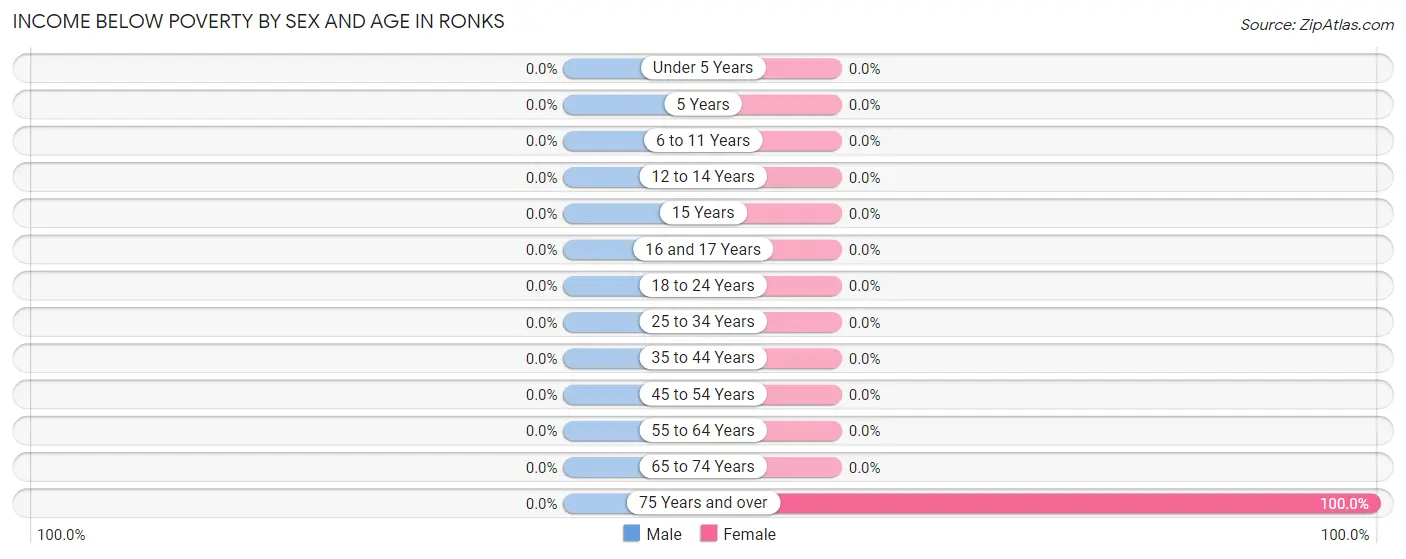
| Age Bracket | Male | Female |
| Under 5 Years | 0 (0.0%) | 0 (0.0%) |
| 5 Years | 0 (0.0%) | 0 (0.0%) |
| 6 to 11 Years | 0 (0.0%) | 0 (0.0%) |
| 12 to 14 Years | 0 (0.0%) | 0 (0.0%) |
| 15 Years | 0 (0.0%) | 0 (0.0%) |
| 16 and 17 Years | 0 (0.0%) | 0 (0.0%) |
| 18 to 24 Years | 0 (0.0%) | 0 (0.0%) |
| 25 to 34 Years | 0 (0.0%) | 0 (0.0%) |
| 35 to 44 Years | 0 (0.0%) | 0 (0.0%) |
| 45 to 54 Years | 0 (0.0%) | 0 (0.0%) |
| 55 to 64 Years | 0 (0.0%) | 0 (0.0%) |
| 65 to 74 Years | 0 (0.0%) | 0 (0.0%) |
| 75 Years and over | 0 (0.0%) | 15 (100.0%) |
| Total | 0 (0.0%) | 15 (11.9%) |
Income Above Poverty by Sex and Age in Ronks
According to the poverty statistics in Ronks, males aged under 5 years and females aged under 5 years are the age groups that are most secure financially, with 100.0% of males and 100.0% of females in these age groups living above the poverty line.
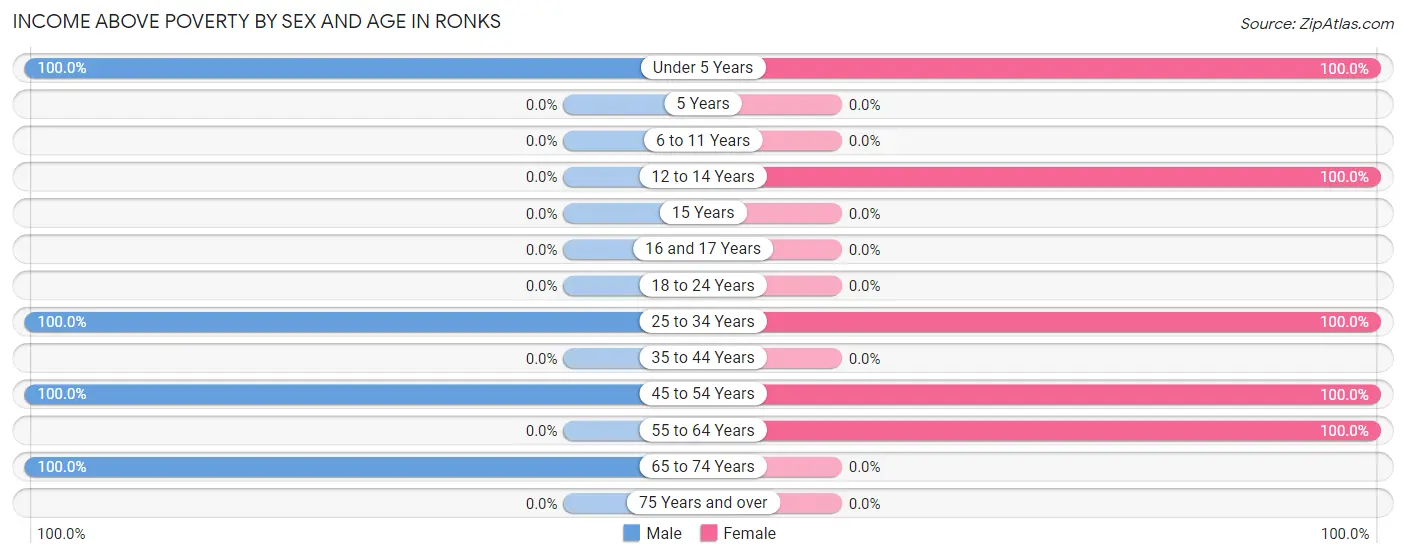
| Age Bracket | Male | Female |
| Under 5 Years | 37 (100.0%) | 38 (100.0%) |
| 5 Years | 0 (0.0%) | 0 (0.0%) |
| 6 to 11 Years | 0 (0.0%) | 0 (0.0%) |
| 12 to 14 Years | 0 (0.0%) | 12 (100.0%) |
| 15 Years | 0 (0.0%) | 0 (0.0%) |
| 16 and 17 Years | 0 (0.0%) | 0 (0.0%) |
| 18 to 24 Years | 0 (0.0%) | 0 (0.0%) |
| 25 to 34 Years | 31 (100.0%) | 32 (100.0%) |
| 35 to 44 Years | 0 (0.0%) | 0 (0.0%) |
| 45 to 54 Years | 16 (100.0%) | 14 (100.0%) |
| 55 to 64 Years | 0 (0.0%) | 15 (100.0%) |
| 65 to 74 Years | 17 (100.0%) | 0 (0.0%) |
| 75 Years and over | 0 (0.0%) | 0 (0.0%) |
| Total | 101 (100.0%) | 111 (88.1%) |
Income Below Poverty Among Married-Couple Families in Ronks
| Children | Above Poverty | Below Poverty |
| No Children | 17 (100.0%) | 0 (0.0%) |
| 1 or 2 Children | 34 (100.0%) | 0 (0.0%) |
| 3 or 4 Children | 0 (0.0%) | 0 (0.0%) |
| 5 or more Children | 0 (0.0%) | 0 (0.0%) |
| Total | 51 (100.0%) | 0 (0.0%) |
Income Below Poverty Among Single-Parent Households in Ronks
| Children | Single Father | Single Mother |
| No Children | 0 (0.0%) | 0 (0.0%) |
| 1 or 2 Children | 0 (0.0%) | 0 (0.0%) |
| 3 or 4 Children | 0 (0.0%) | 0 (0.0%) |
| 5 or more Children | 0 (0.0%) | 0 (0.0%) |
| Total | 0 (0.0%) | 0 (0.0%) |
Income Below Poverty Among Married-Couple vs Single-Parent Households in Ronks
| Children | Married-Couple Families | Single-Parent Households |
| No Children | 0 (0.0%) | 0 (0.0%) |
| 1 or 2 Children | 0 (0.0%) | 0 (0.0%) |
| 3 or 4 Children | 0 (0.0%) | 0 (0.0%) |
| 5 or more Children | 0 (0.0%) | 0 (0.0%) |
| Total | 0 (0.0%) | 0 (0.0%) |
Race in Ronks
The most populous races in Ronks are White / Caucasian (189 | 83.3%), and Two or more Races (38 | 16.7%).
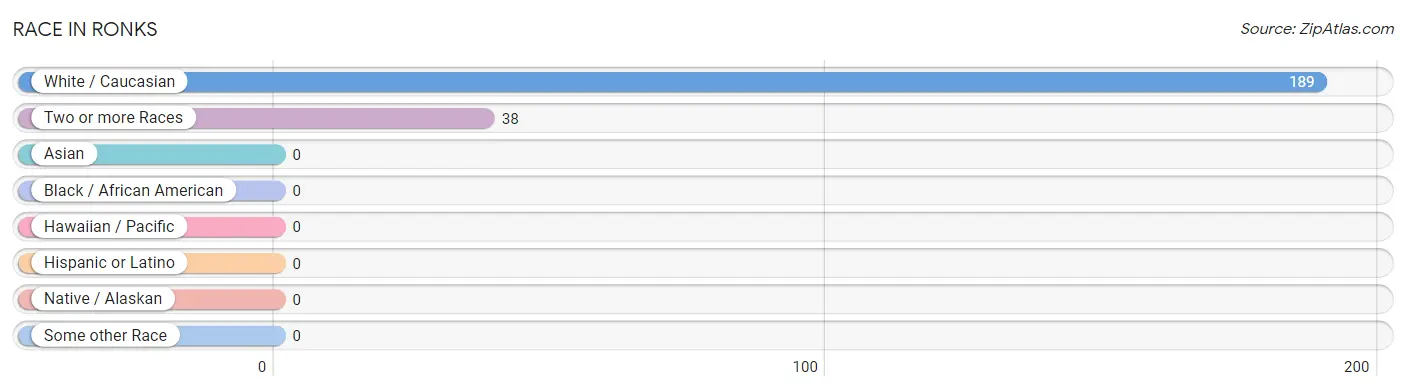
| Race | # Population | % Population |
| Asian | 0 | 0.0% |
| Black / African American | 0 | 0.0% |
| Hawaiian / Pacific | 0 | 0.0% |
| Hispanic or Latino | 0 | 0.0% |
| Native / Alaskan | 0 | 0.0% |
| White / Caucasian | 189 | 83.3% |
| Two or more Races | 38 | 16.7% |
| Some other Race | 0 | 0.0% |
| Total | 227 | 100.0% |
Ancestry in Ronks
The most populous ancestries reported in Ronks are Irish (109 | 48.0%), Polish (80 | 35.2%), American (73 | 32.2%), German (30 | 13.2%), and Lithuanian (15 | 6.6%), together accounting for 135.3% of all Ronks residents.
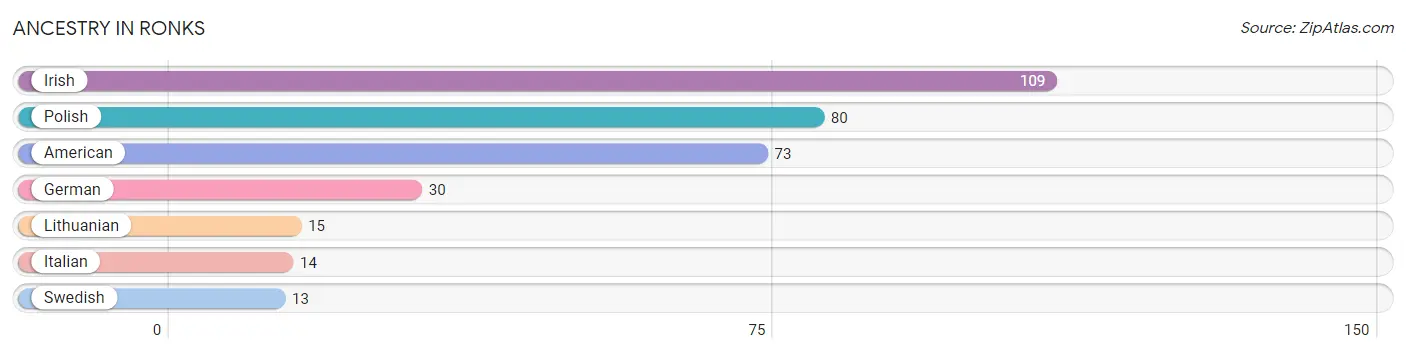
| Ancestry | # Population | % Population |
| American | 73 | 32.2% |
| German | 30 | 13.2% |
| Irish | 109 | 48.0% |
| Italian | 14 | 6.2% |
| Lithuanian | 15 | 6.6% |
| Polish | 80 | 35.2% |
| Swedish | 13 | 5.7% | View All 7 Rows |
Immigrants in Ronks

| Immigration Origin | # Population | % Population | View All 0 Rows |
Sex and Age in Ronks
Sex and Age in Ronks
The most populous age groups in Ronks are Under 5 Years (37 | 36.6%) for men and Under 5 Years (38 | 30.2%) for women.
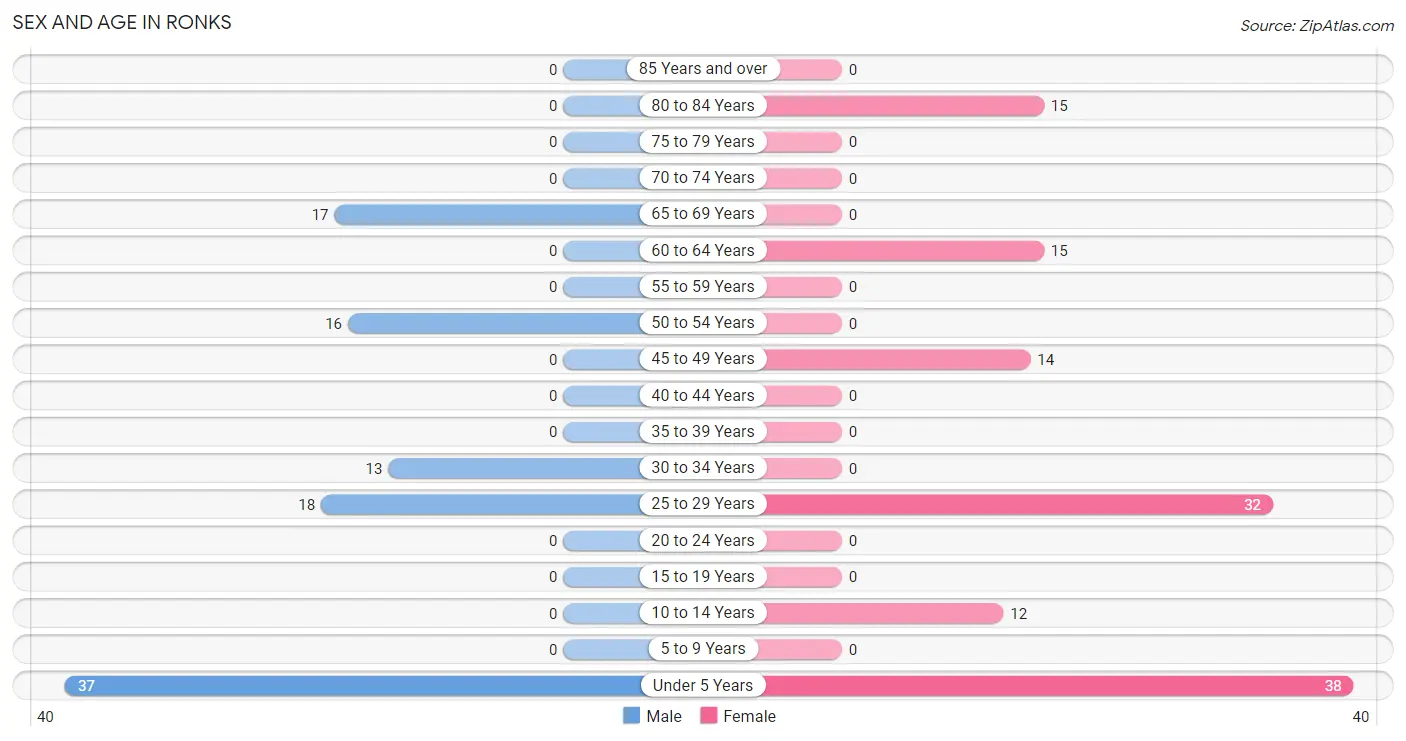
| Age Bracket | Male | Female |
| Under 5 Years | 37 (36.6%) | 38 (30.2%) |
| 5 to 9 Years | 0 (0.0%) | 0 (0.0%) |
| 10 to 14 Years | 0 (0.0%) | 12 (9.5%) |
| 15 to 19 Years | 0 (0.0%) | 0 (0.0%) |
| 20 to 24 Years | 0 (0.0%) | 0 (0.0%) |
| 25 to 29 Years | 18 (17.8%) | 32 (25.4%) |
| 30 to 34 Years | 13 (12.9%) | 0 (0.0%) |
| 35 to 39 Years | 0 (0.0%) | 0 (0.0%) |
| 40 to 44 Years | 0 (0.0%) | 0 (0.0%) |
| 45 to 49 Years | 0 (0.0%) | 14 (11.1%) |
| 50 to 54 Years | 16 (15.8%) | 0 (0.0%) |
| 55 to 59 Years | 0 (0.0%) | 0 (0.0%) |
| 60 to 64 Years | 0 (0.0%) | 15 (11.9%) |
| 65 to 69 Years | 17 (16.8%) | 0 (0.0%) |
| 70 to 74 Years | 0 (0.0%) | 0 (0.0%) |
| 75 to 79 Years | 0 (0.0%) | 0 (0.0%) |
| 80 to 84 Years | 0 (0.0%) | 15 (11.9%) |
| 85 Years and over | 0 (0.0%) | 0 (0.0%) |
| Total | 101 (100.0%) | 126 (100.0%) |
Families and Households in Ronks
Median Family Size in Ronks
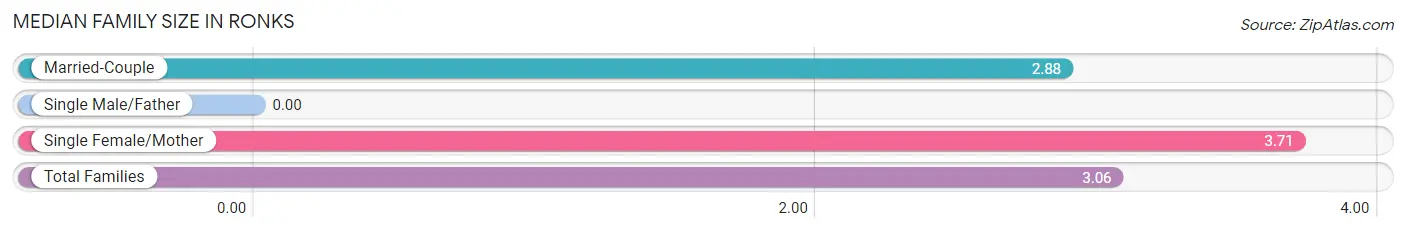
| Family Type | # Families | Family Size |
| Married-Couple | 51 (78.5%) | 2.88 |
| Single Male/Father | 0 (0.0%) | - |
| Single Female/Mother | 14 (21.5%) | 3.71 |
| Total Families | 65 (100.0%) | 3.06 |
Median Household Size in Ronks
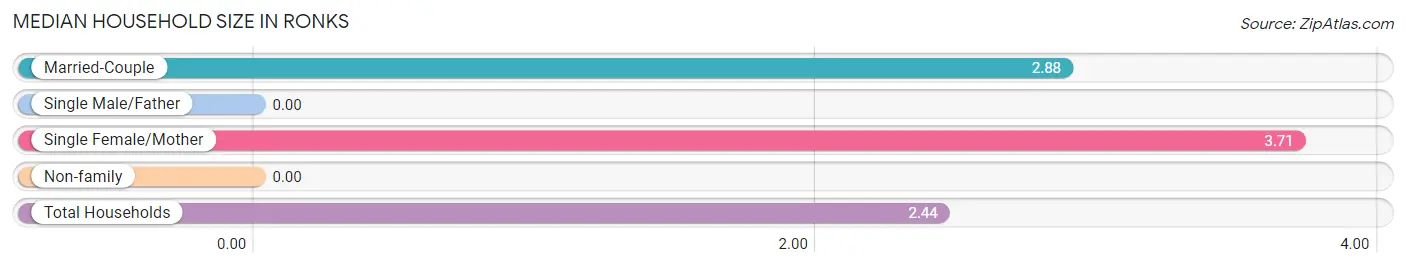
| Household Type | # Households | Household Size |
| Married-Couple | 51 (54.8%) | 2.88 |
| Single Male/Father | 0 (0.0%) | - |
| Single Female/Mother | 14 (15.0%) | 3.71 |
| Non-family | 28 (30.1%) | - |
| Total Households | 93 (100.0%) | 2.44 |
Household Size by Marriage Status in Ronks
Out of a total of 93 households in Ronks, 65 (69.9%) are family households, while 28 (30.1%) are nonfamily households. The most numerous type of family households are 3-person households, comprising 30, and the most common type of nonfamily households are 1-person households, comprising 28.
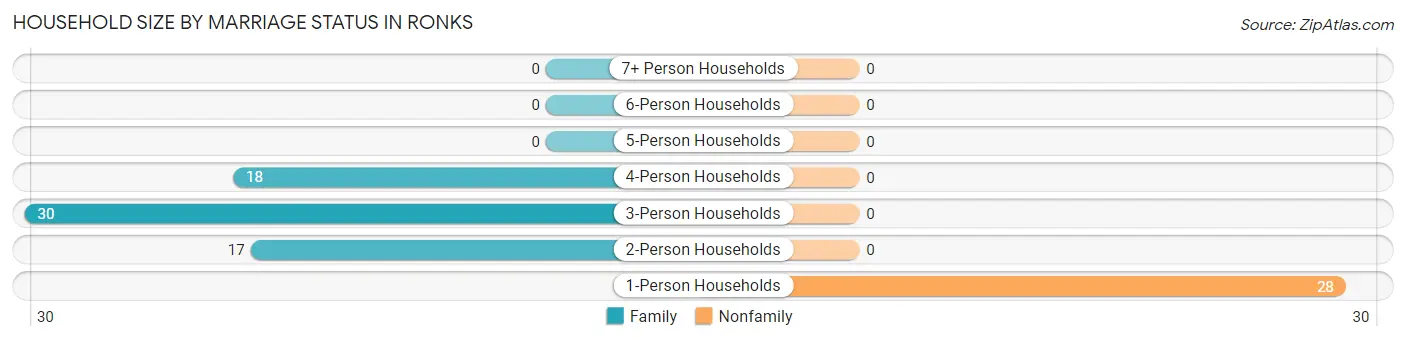
| Household Size | Family Households | Nonfamily Households |
| 1-Person Households | - | 28 (30.1%) |
| 2-Person Households | 17 (18.3%) | 0 (0.0%) |
| 3-Person Households | 30 (32.3%) | 0 (0.0%) |
| 4-Person Households | 18 (19.4%) | 0 (0.0%) |
| 5-Person Households | 0 (0.0%) | 0 (0.0%) |
| 6-Person Households | 0 (0.0%) | 0 (0.0%) |
| 7+ Person Households | 0 (0.0%) | 0 (0.0%) |
| Total | 65 (69.9%) | 28 (30.1%) |
Female Fertility in Ronks
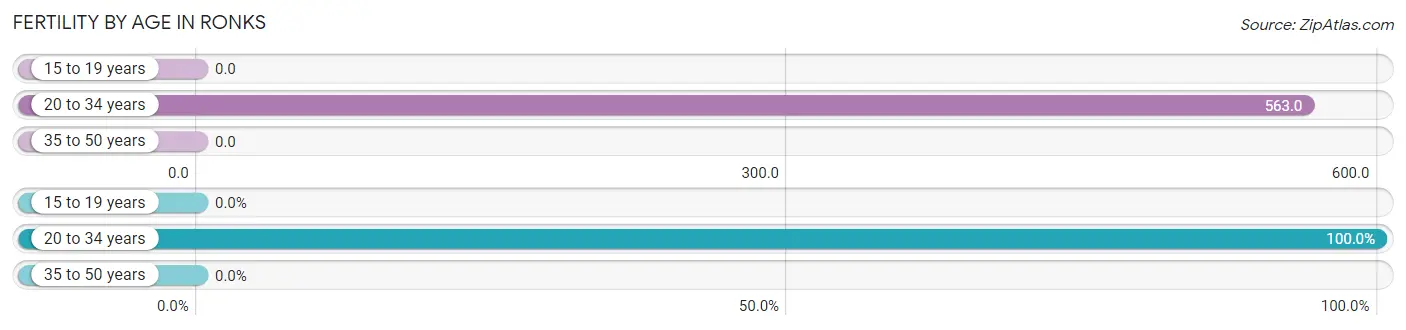
Fertility by Age in Ronks
Average fertility rate in Ronks is 391.0 births per 1,000 women. Women in the age bracket of 20 to 34 years have the highest fertility rate with 563.0 births per 1,000 women. Women in the age bracket of 20 to 34 years acount for 100.0% of all women with births.
| Age Bracket | Women with Births | Births / 1,000 Women |
| 15 to 19 years | 0 (0.0%) | 0.0 |
| 20 to 34 years | 18 (100.0%) | 563.0 |
| 35 to 50 years | 0 (0.0%) | 0.0 |
| Total | 18 (100.0%) | 391.0 |
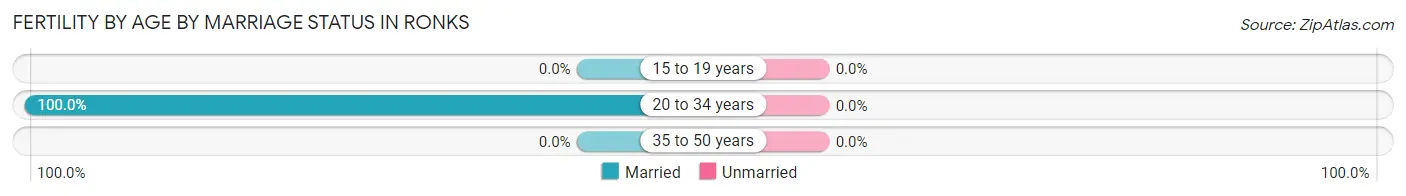
Fertility by Age by Marriage Status in Ronks
| Age Bracket | Married | Unmarried |
| 15 to 19 years | 0 (0.0%) | 0 (0.0%) |
| 20 to 34 years | 18 (100.0%) | 0 (0.0%) |
| 35 to 50 years | 0 (0.0%) | 0 (0.0%) |
| Total | 18 (100.0%) | 0 (0.0%) |
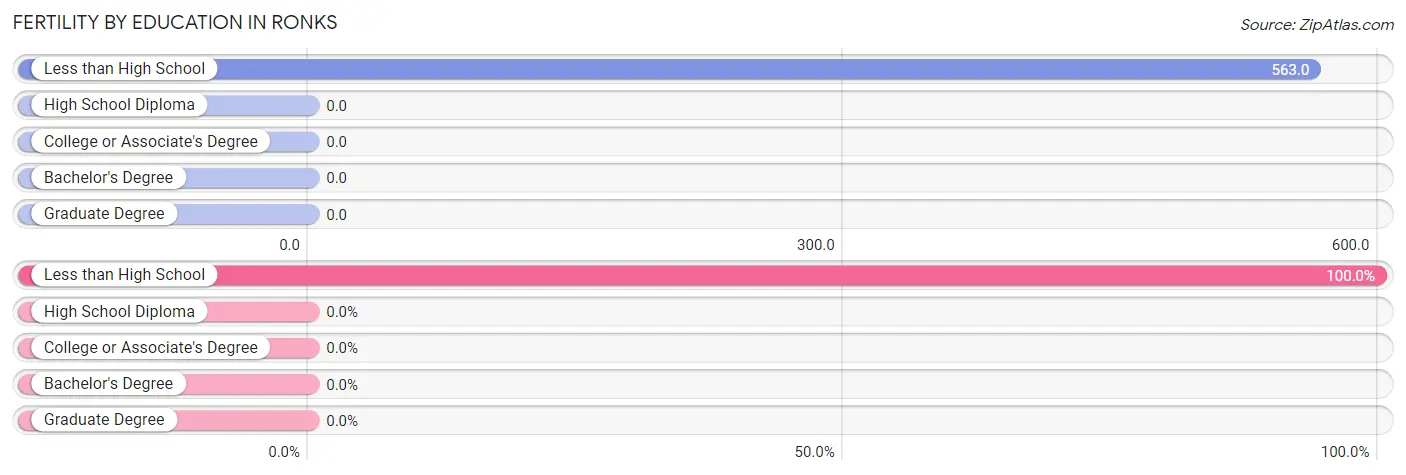
Fertility by Education in Ronks
| Educational Attainment | Women with Births | Births / 1,000 Women |
| Less than High School | 18 (100.0%) | 563.0 |
| High School Diploma | 0 (0.0%) | 0.0 |
| College or Associate's Degree | 0 (0.0%) | 0.0 |
| Bachelor's Degree | 0 (0.0%) | 0.0 |
| Graduate Degree | 0 (0.0%) | 0.0 |
| Total | 18 (100.0%) | 391.0 |
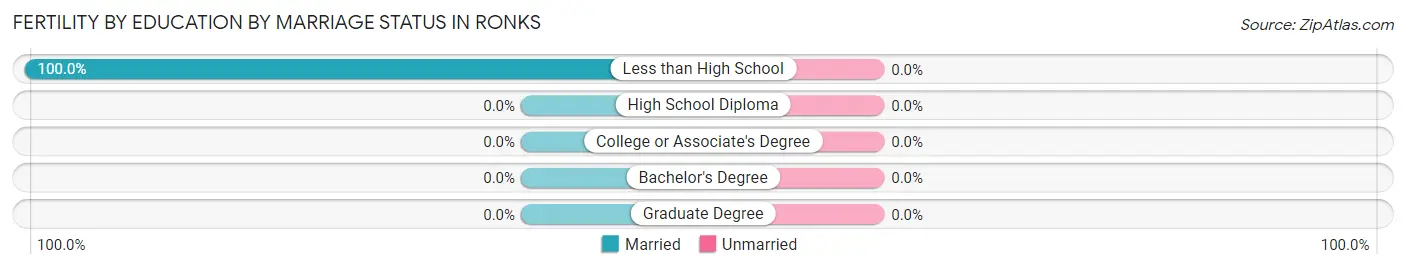
Fertility by Education by Marriage Status in Ronks
| Educational Attainment | Married | Unmarried |
| Less than High School | 18 (100.0%) | 0 (0.0%) |
| High School Diploma | 0 (0.0%) | 0 (0.0%) |
| College or Associate's Degree | 0 (0.0%) | 0 (0.0%) |
| Bachelor's Degree | 0 (0.0%) | 0 (0.0%) |
| Graduate Degree | 0 (0.0%) | 0 (0.0%) |
| Total | 18 (100.0%) | 0 (0.0%) |
Employment Characteristics in Ronks
Employment by Class of Employer in Ronks
Among the 107 employed individuals in Ronks, , and private company employees (107 | 100.0%) make up the most common classes of employment.
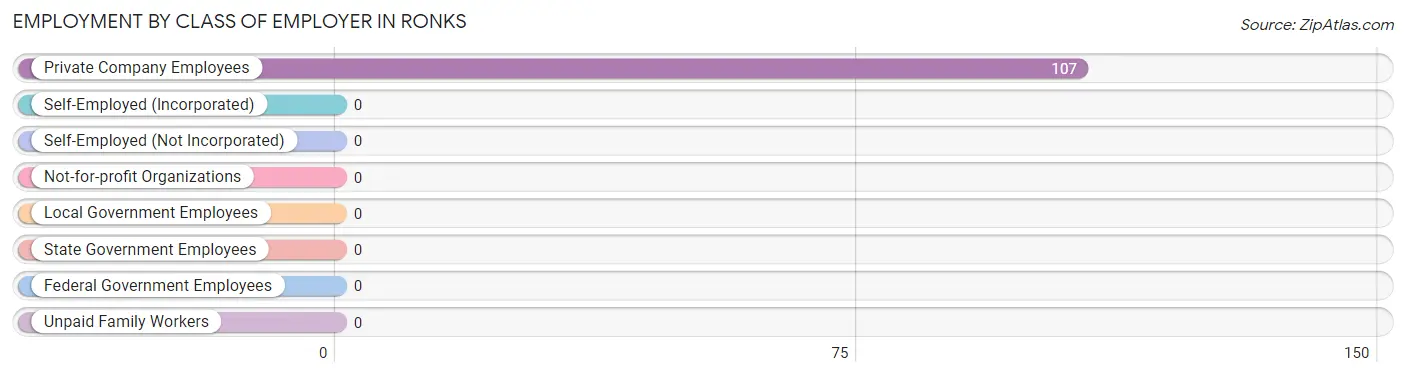
| Employer Class | # Employees | % Employees |
| Private Company Employees | 107 | 100.0% |
| Self-Employed (Incorporated) | 0 | 0.0% |
| Self-Employed (Not Incorporated) | 0 | 0.0% |
| Not-for-profit Organizations | 0 | 0.0% |
| Local Government Employees | 0 | 0.0% |
| State Government Employees | 0 | 0.0% |
| Federal Government Employees | 0 | 0.0% |
| Unpaid Family Workers | 0 | 0.0% |
| Total | 107 | 100.0% |
Employment Status by Age in Ronks
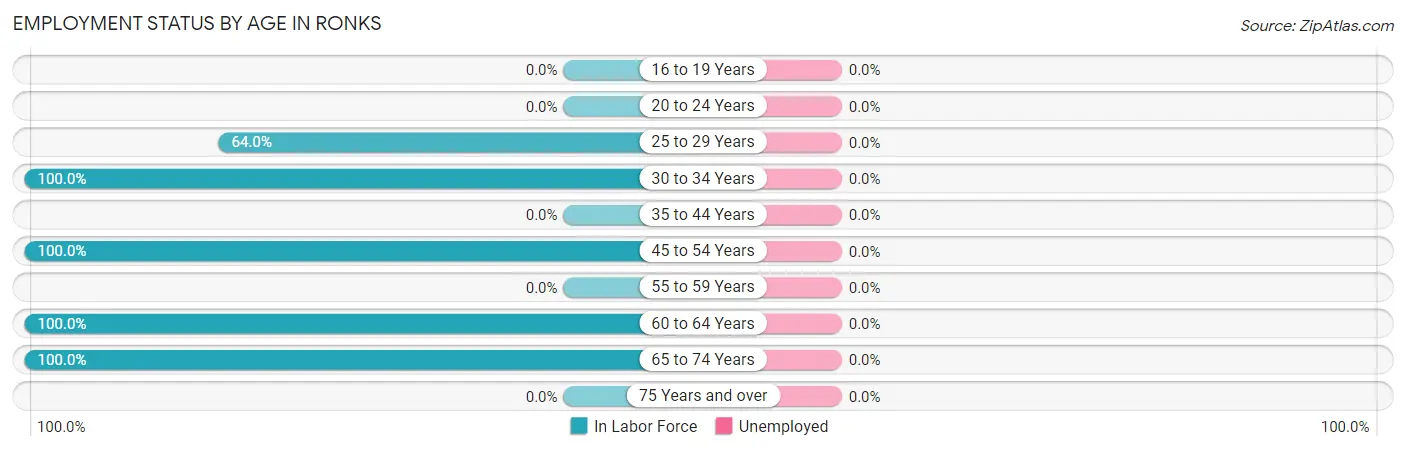
| Age Bracket | In Labor Force | Unemployed |
| 16 to 19 Years | 0 (0.0%) | 0 (0.0%) |
| 20 to 24 Years | 0 (0.0%) | 0 (0.0%) |
| 25 to 29 Years | 32 (64.0%) | 0 (0.0%) |
| 30 to 34 Years | 13 (100.0%) | 0 (0.0%) |
| 35 to 44 Years | 0 (0.0%) | 0 (0.0%) |
| 45 to 54 Years | 30 (100.0%) | 0 (0.0%) |
| 55 to 59 Years | 0 (0.0%) | 0 (0.0%) |
| 60 to 64 Years | 15 (100.0%) | 0 (0.0%) |
| 65 to 74 Years | 17 (100.0%) | 0 (0.0%) |
| 75 Years and over | 0 (0.0%) | 0 (0.0%) |
| Total | 107 (76.4%) | 0 (0.0%) |
Employment Status by Educational Attainment in Ronks
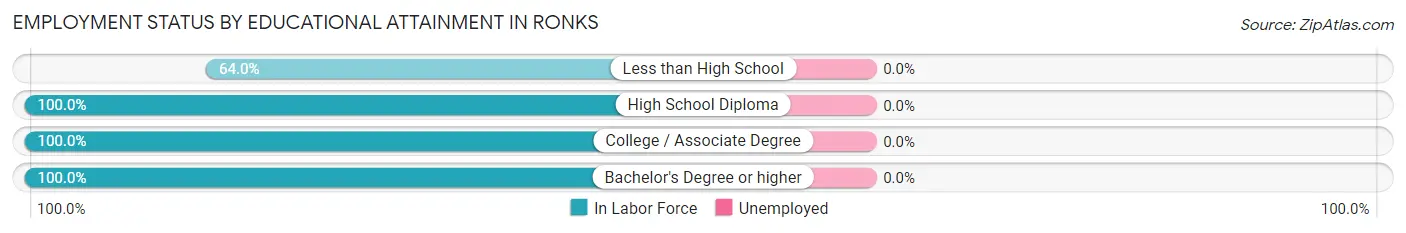
| Educational Attainment | In Labor Force | Unemployed |
| Less than High School | 32 (64.0%) | 0 (0.0%) |
| High School Diploma | 29 (100.0%) | 0 (0.0%) |
| College / Associate Degree | 16 (100.0%) | 0 (0.0%) |
| Bachelor's Degree or higher | 13 (100.0%) | 0 (0.0%) |
| Total | 90 (83.3%) | 0 (0.0%) |
Employment Occupations by Sex in Ronks
Management, Business, Science and Arts Occupations
The most common Management, Business, Science and Arts occupations in Ronks are Business & Financial (16 | 14.9%), Computers, Engineering & Science (13 | 12.1%), and Computers & Mathematics (13 | 12.1%).
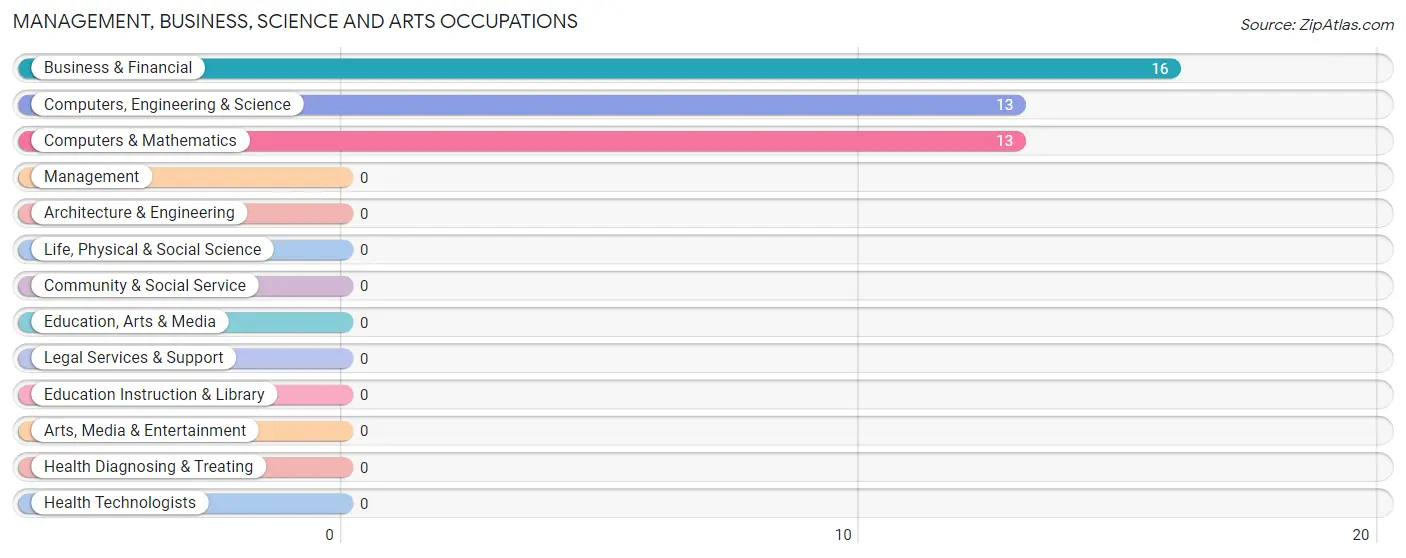
Management, Business, Science and Arts Occupations by Sex
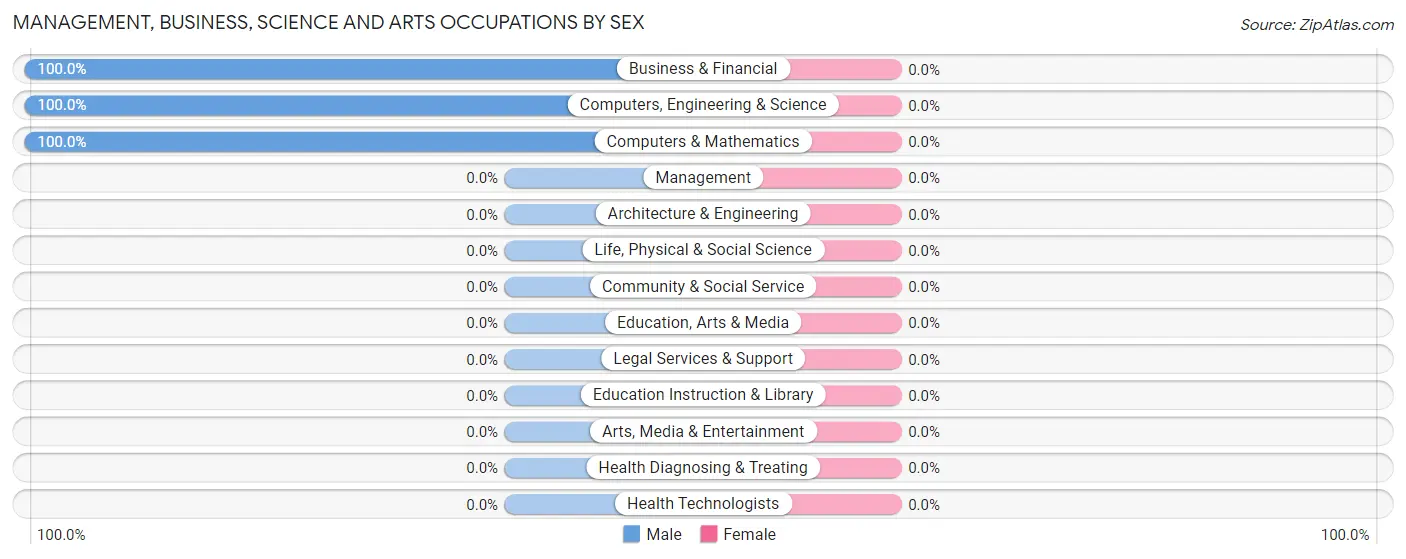
| Occupation | Male | Female |
| Management | 0 (0.0%) | 0 (0.0%) |
| Business & Financial | 16 (100.0%) | 0 (0.0%) |
| Computers, Engineering & Science | 13 (100.0%) | 0 (0.0%) |
| Computers & Mathematics | 13 (100.0%) | 0 (0.0%) |
| Architecture & Engineering | 0 (0.0%) | 0 (0.0%) |
| Life, Physical & Social Science | 0 (0.0%) | 0 (0.0%) |
| Community & Social Service | 0 (0.0%) | 0 (0.0%) |
| Education, Arts & Media | 0 (0.0%) | 0 (0.0%) |
| Legal Services & Support | 0 (0.0%) | 0 (0.0%) |
| Education Instruction & Library | 0 (0.0%) | 0 (0.0%) |
| Arts, Media & Entertainment | 0 (0.0%) | 0 (0.0%) |
| Health Diagnosing & Treating | 0 (0.0%) | 0 (0.0%) |
| Health Technologists | 0 (0.0%) | 0 (0.0%) |
| Total (Category) | 29 (100.0%) | 0 (0.0%) |
| Total (Overall) | 64 (59.8%) | 43 (40.2%) |
Services Occupations
The most common Services occupations in Ronks are , and Food Preparation & Serving (14 | 13.1%).
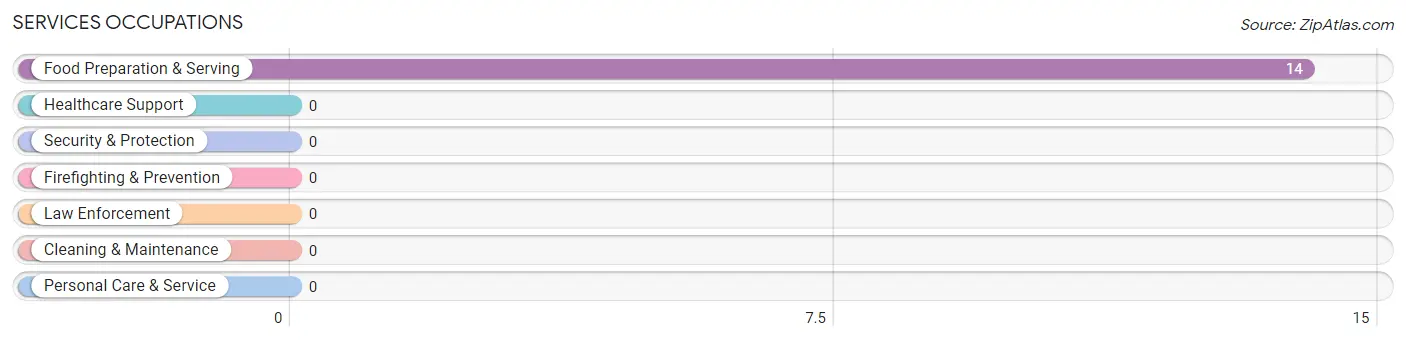
Services Occupations by Sex
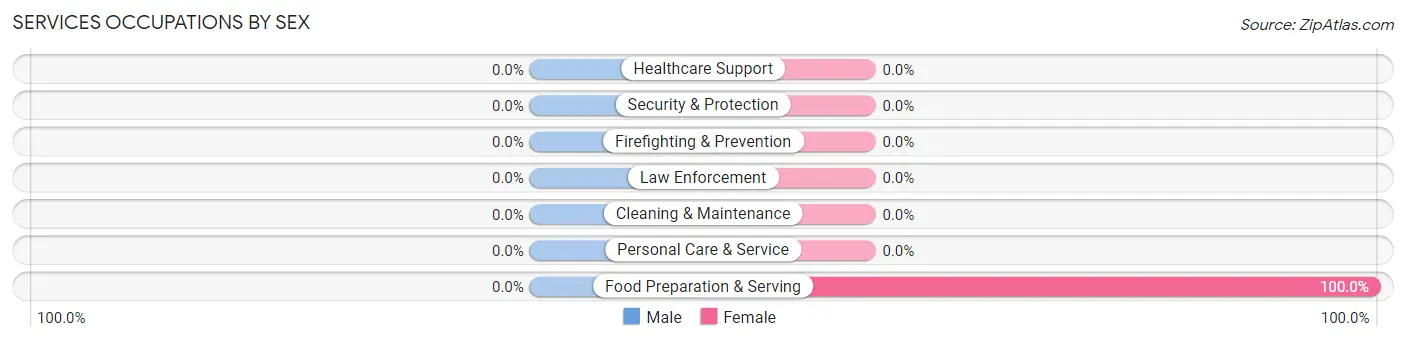
| Occupation | Male | Female |
| Healthcare Support | 0 (0.0%) | 0 (0.0%) |
| Security & Protection | 0 (0.0%) | 0 (0.0%) |
| Firefighting & Prevention | 0 (0.0%) | 0 (0.0%) |
| Law Enforcement | 0 (0.0%) | 0 (0.0%) |
| Food Preparation & Serving | 0 (0.0%) | 14 (100.0%) |
| Cleaning & Maintenance | 0 (0.0%) | 0 (0.0%) |
| Personal Care & Service | 0 (0.0%) | 0 (0.0%) |
| Total (Category) | 0 (0.0%) | 14 (100.0%) |
| Total (Overall) | 64 (59.8%) | 43 (40.2%) |
Sales and Office Occupations
The most common Sales and Office occupations in Ronks are , and Office & Administration (15 | 14.0%).
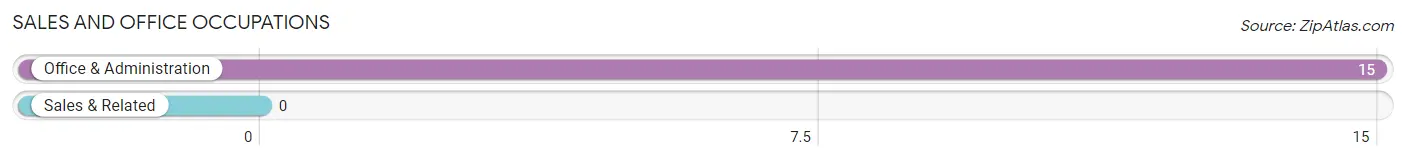
Sales and Office Occupations by Sex
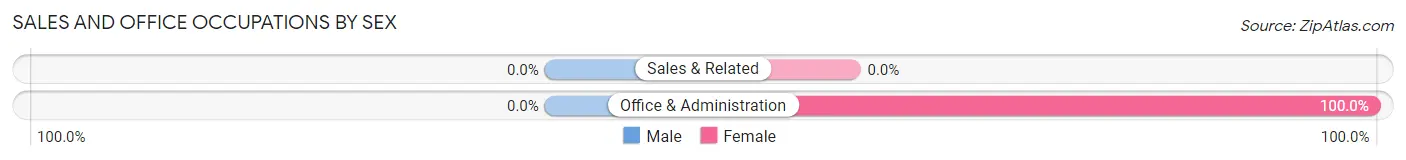
| Occupation | Male | Female |
| Sales & Related | 0 (0.0%) | 0 (0.0%) |
| Office & Administration | 0 (0.0%) | 15 (100.0%) |
| Total (Category) | 0 (0.0%) | 15 (100.0%) |
| Total (Overall) | 64 (59.8%) | 43 (40.2%) |
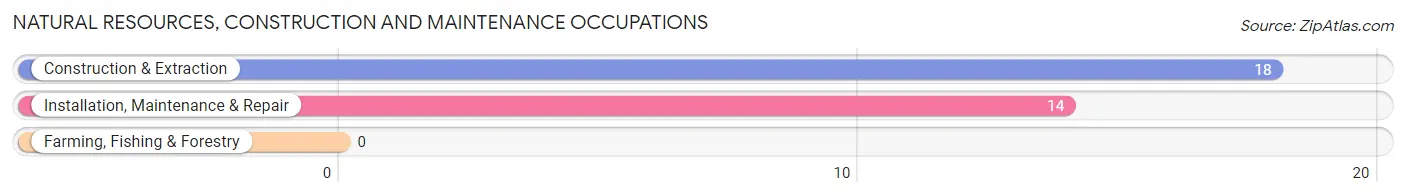
Natural Resources, Construction and Maintenance Occupations
The most common Natural Resources, Construction and Maintenance occupations in Ronks are Construction & Extraction (18 | 16.8%), and Installation, Maintenance & Repair (14 | 13.1%).
Natural Resources, Construction and Maintenance Occupations by Sex
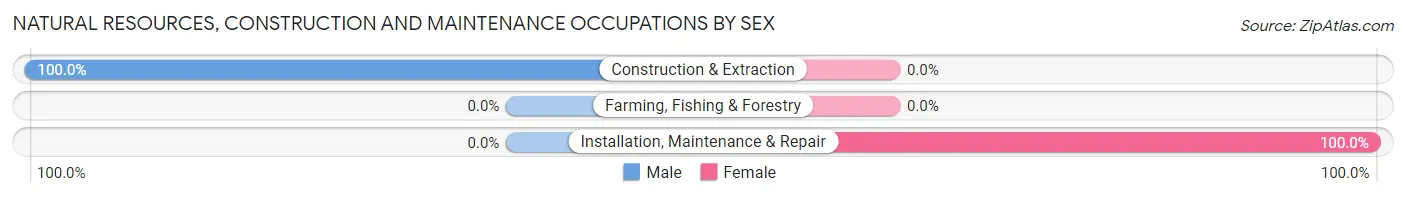
| Occupation | Male | Female |
| Farming, Fishing & Forestry | 0 (0.0%) | 0 (0.0%) |
| Construction & Extraction | 18 (100.0%) | 0 (0.0%) |
| Installation, Maintenance & Repair | 0 (0.0%) | 14 (100.0%) |
| Total (Category) | 18 (56.2%) | 14 (43.8%) |
| Total (Overall) | 64 (59.8%) | 43 (40.2%) |
Production, Transportation and Moving Occupations
The most common Production, Transportation and Moving occupations in Ronks are , and Material Moving (17 | 15.9%).
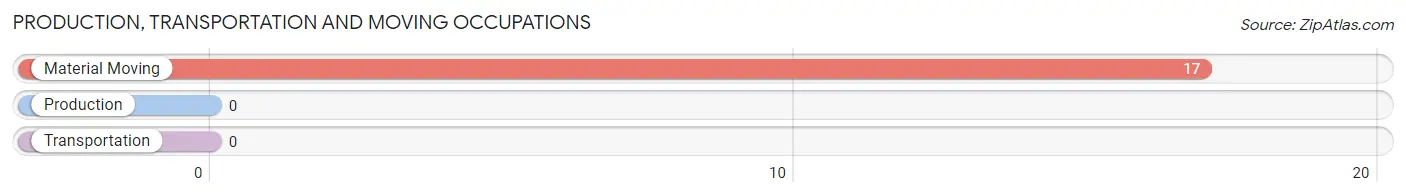
Production, Transportation and Moving Occupations by Sex
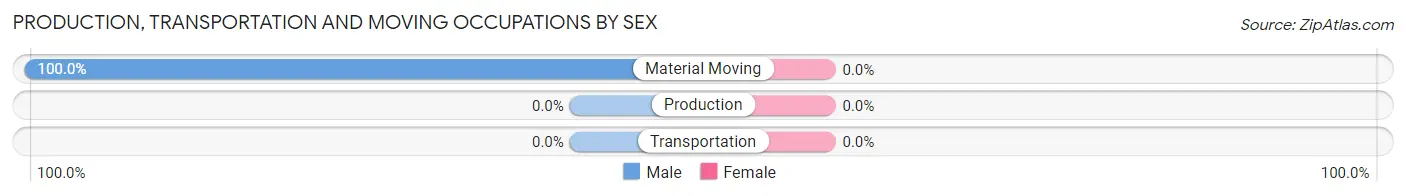
| Occupation | Male | Female |
| Production | 0 (0.0%) | 0 (0.0%) |
| Transportation | 0 (0.0%) | 0 (0.0%) |
| Material Moving | 17 (100.0%) | 0 (0.0%) |
| Total (Category) | 17 (100.0%) | 0 (0.0%) |
| Total (Overall) | 64 (59.8%) | 43 (40.2%) |
Employment Industries by Sex in Ronks
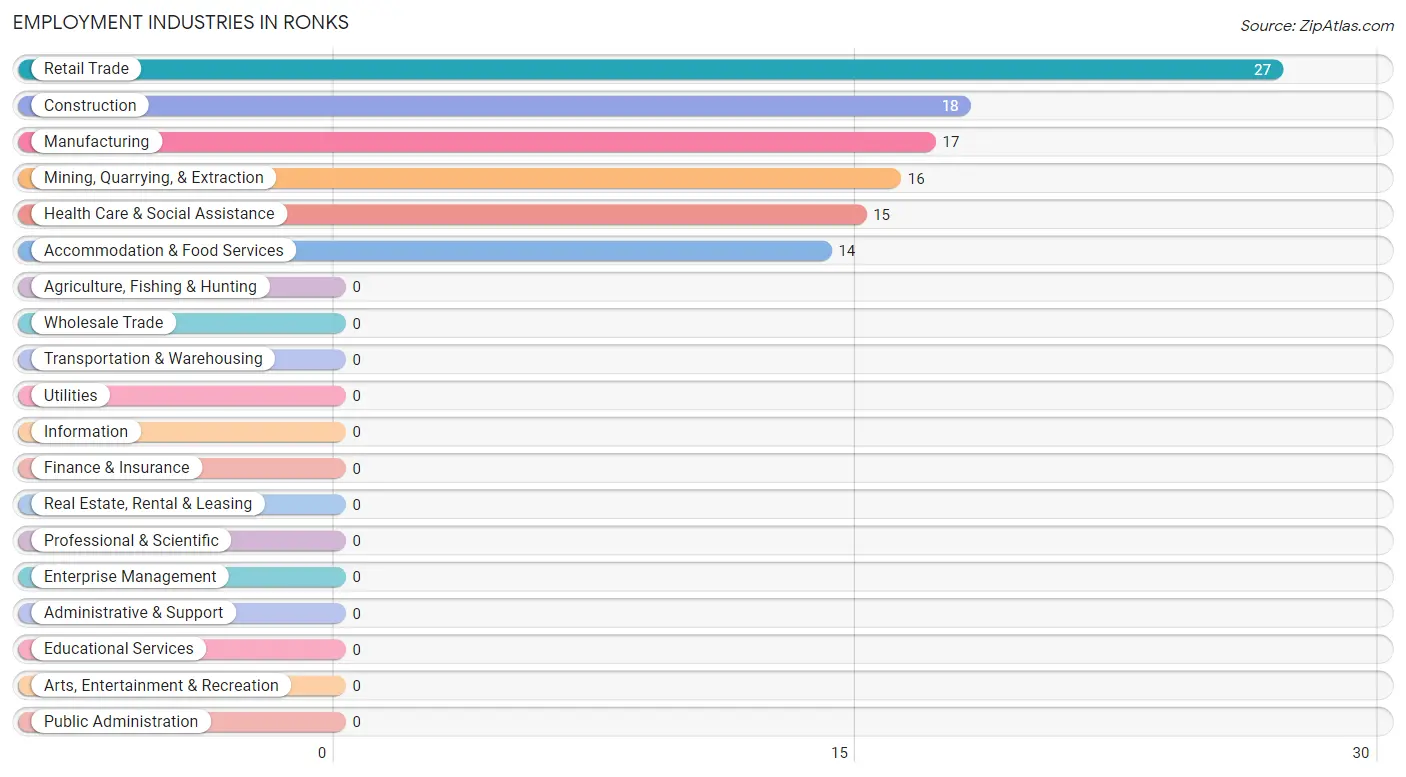
Employment Industries in Ronks
The major employment industries in Ronks include Retail Trade (27 | 25.2%), Construction (18 | 16.8%), Manufacturing (17 | 15.9%), Mining, Quarrying, & Extraction (16 | 14.9%), and Health Care & Social Assistance (15 | 14.0%).
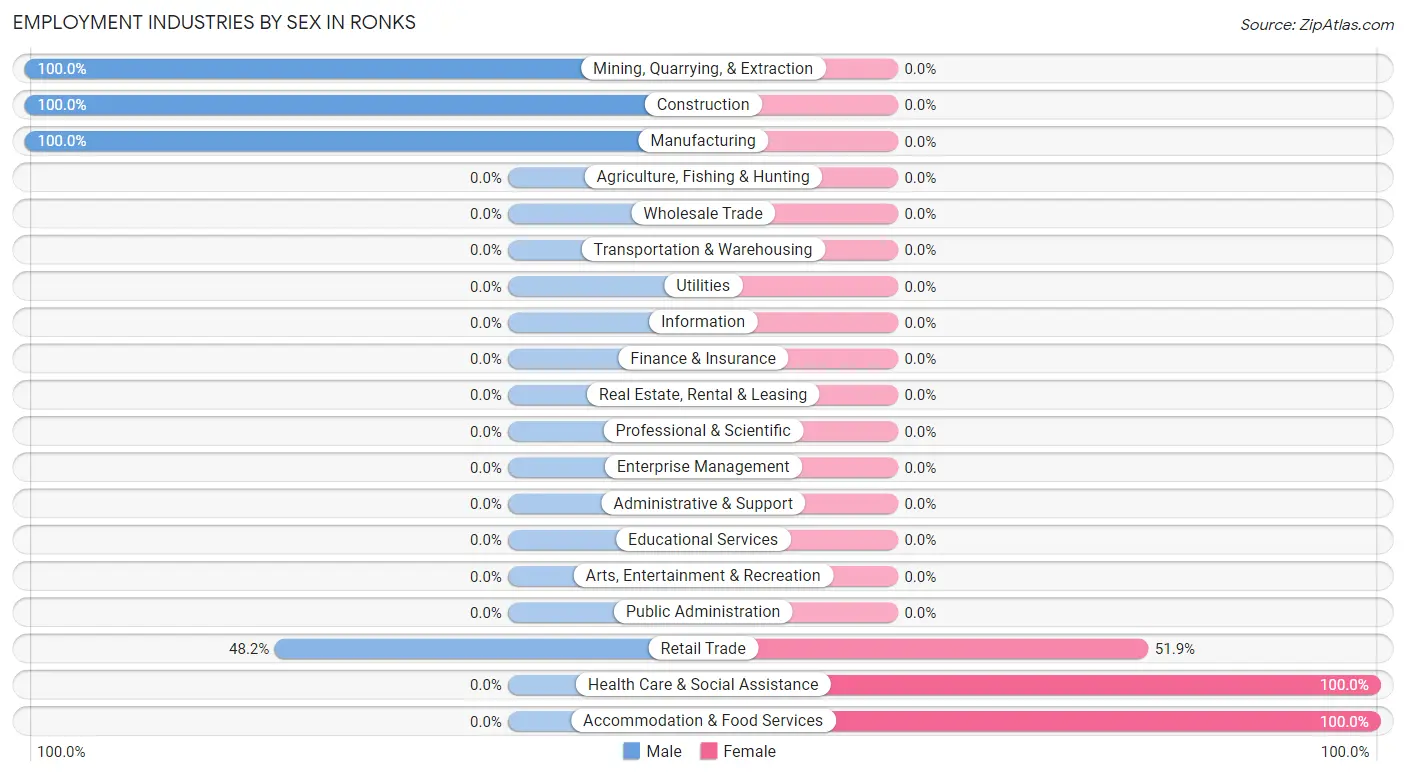
Employment Industries by Sex in Ronks
The Ronks industries that see more men than women are Mining, Quarrying, & Extraction (100.0%), Construction (100.0%), and Manufacturing (100.0%), whereas the industries that tend to have a higher number of women are Health Care & Social Assistance (100.0%), Accommodation & Food Services (100.0%), and Retail Trade (51.8%).
| Industry | Male | Female |
| Agriculture, Fishing & Hunting | 0 (0.0%) | 0 (0.0%) |
| Mining, Quarrying, & Extraction | 16 (100.0%) | 0 (0.0%) |
| Construction | 18 (100.0%) | 0 (0.0%) |
| Manufacturing | 17 (100.0%) | 0 (0.0%) |
| Wholesale Trade | 0 (0.0%) | 0 (0.0%) |
| Retail Trade | 13 (48.1%) | 14 (51.8%) |
| Transportation & Warehousing | 0 (0.0%) | 0 (0.0%) |
| Utilities | 0 (0.0%) | 0 (0.0%) |
| Information | 0 (0.0%) | 0 (0.0%) |
| Finance & Insurance | 0 (0.0%) | 0 (0.0%) |
| Real Estate, Rental & Leasing | 0 (0.0%) | 0 (0.0%) |
| Professional & Scientific | 0 (0.0%) | 0 (0.0%) |
| Enterprise Management | 0 (0.0%) | 0 (0.0%) |
| Administrative & Support | 0 (0.0%) | 0 (0.0%) |
| Educational Services | 0 (0.0%) | 0 (0.0%) |
| Health Care & Social Assistance | 0 (0.0%) | 15 (100.0%) |
| Arts, Entertainment & Recreation | 0 (0.0%) | 0 (0.0%) |
| Accommodation & Food Services | 0 (0.0%) | 14 (100.0%) |
| Public Administration | 0 (0.0%) | 0 (0.0%) |
| Total | 64 (59.8%) | 43 (40.2%) |
Education in Ronks
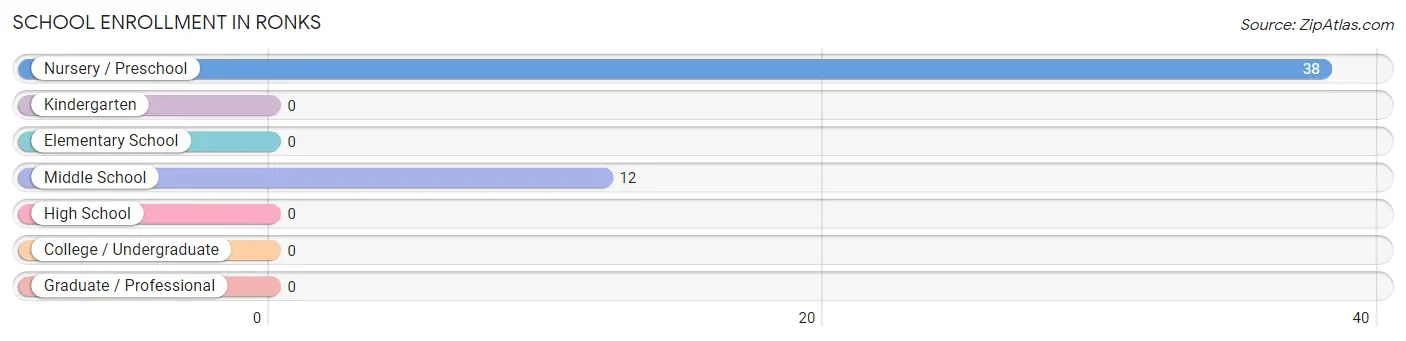
School Enrollment in Ronks
The most common levels of schooling among the 50 students in Ronks are nursery / preschool (38 | 76.0%), and middle school (12 | 24.0%).
| School Level | # Students | % Students |
| Nursery / Preschool | 38 | 76.0% |
| Kindergarten | 0 | 0.0% |
| Elementary School | 0 | 0.0% |
| Middle School | 12 | 24.0% |
| High School | 0 | 0.0% |
| College / Undergraduate | 0 | 0.0% |
| Graduate / Professional | 0 | 0.0% |
| Total | 50 | 100.0% |
School Enrollment by Age by Funding Source in Ronks
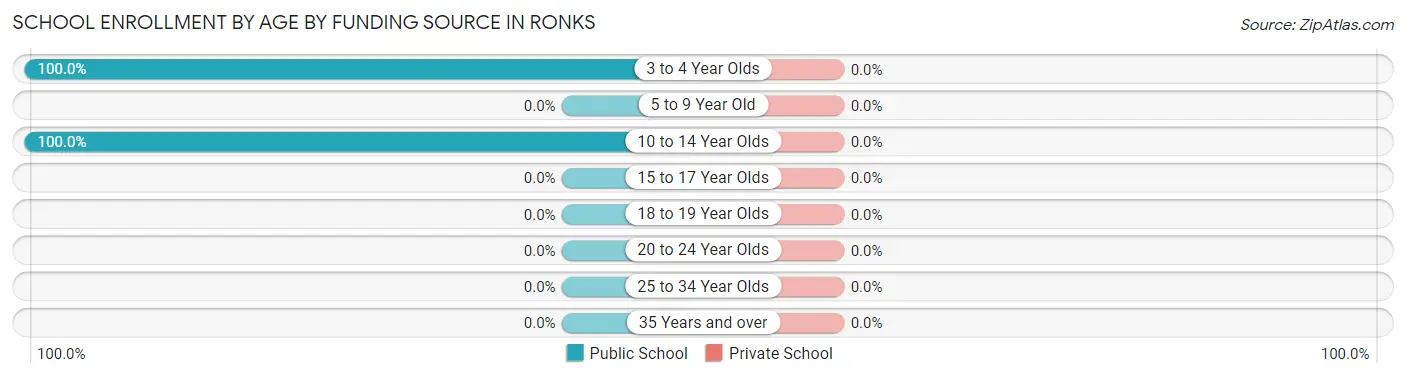
| Age Bracket | Public School | Private School |
| 3 to 4 Year Olds | 38 (100.0%) | 0 (0.0%) |
| 5 to 9 Year Old | 0 (0.0%) | 0 (0.0%) |
| 10 to 14 Year Olds | 12 (100.0%) | 0 (0.0%) |
| 15 to 17 Year Olds | 0 (0.0%) | 0 (0.0%) |
| 18 to 19 Year Olds | 0 (0.0%) | 0 (0.0%) |
| 20 to 24 Year Olds | 0 (0.0%) | 0 (0.0%) |
| 25 to 34 Year Olds | 0 (0.0%) | 0 (0.0%) |
| 35 Years and over | 0 (0.0%) | 0 (0.0%) |
| Total | 50 (100.0%) | 0 (0.0%) |
Educational Attainment by Field of Study in Ronks
Business (17 | 56.7%), and visual & performing arts (13 | 43.3%) are the most common fields of study among 30 individuals in Ronks who have obtained a bachelor's degree or higher.
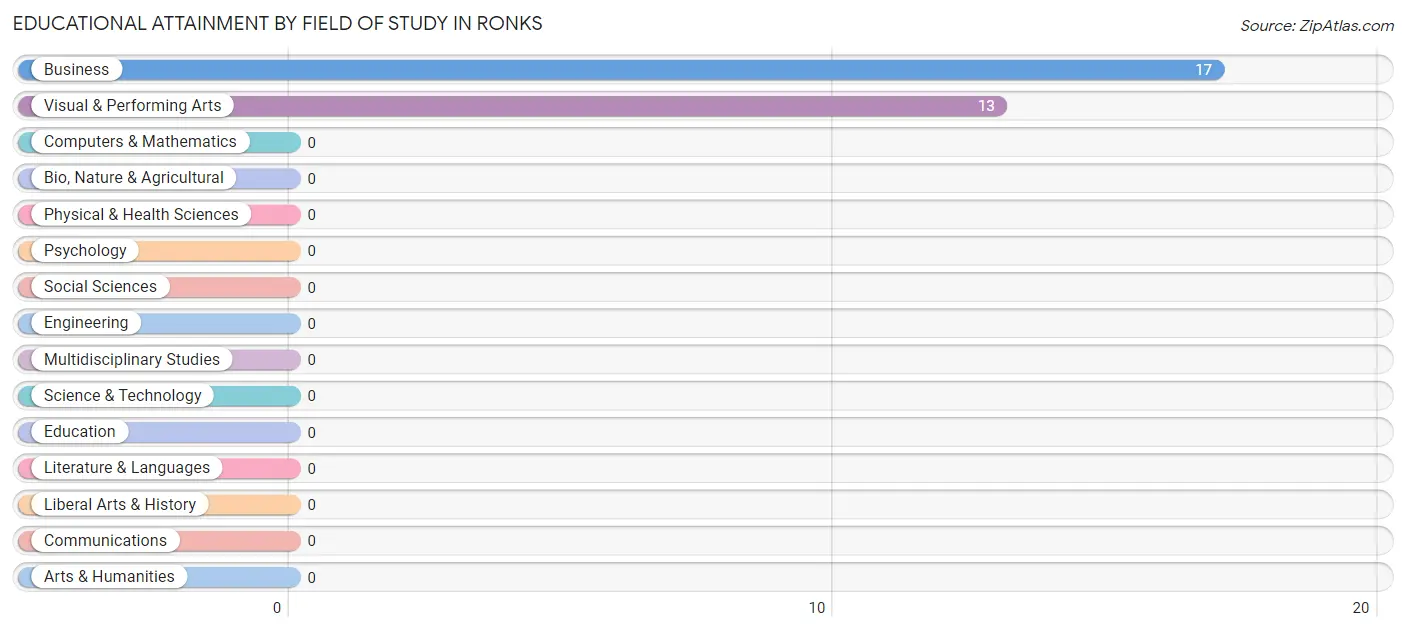
| Field of Study | # Graduates | % Graduates |
| Computers & Mathematics | 0 | 0.0% |
| Bio, Nature & Agricultural | 0 | 0.0% |
| Physical & Health Sciences | 0 | 0.0% |
| Psychology | 0 | 0.0% |
| Social Sciences | 0 | 0.0% |
| Engineering | 0 | 0.0% |
| Multidisciplinary Studies | 0 | 0.0% |
| Science & Technology | 0 | 0.0% |
| Business | 17 | 56.7% |
| Education | 0 | 0.0% |
| Literature & Languages | 0 | 0.0% |
| Liberal Arts & History | 0 | 0.0% |
| Visual & Performing Arts | 13 | 43.3% |
| Communications | 0 | 0.0% |
| Arts & Humanities | 0 | 0.0% |
| Total | 30 | 100.0% |
Transportation & Commute in Ronks
Vehicle Availability by Sex in Ronks
The most prevalent vehicle ownership categories in Ronks are males with 2 vehicles (35, accounting for 54.7%) and females with 2 vehicles (15, making up 81.4%).
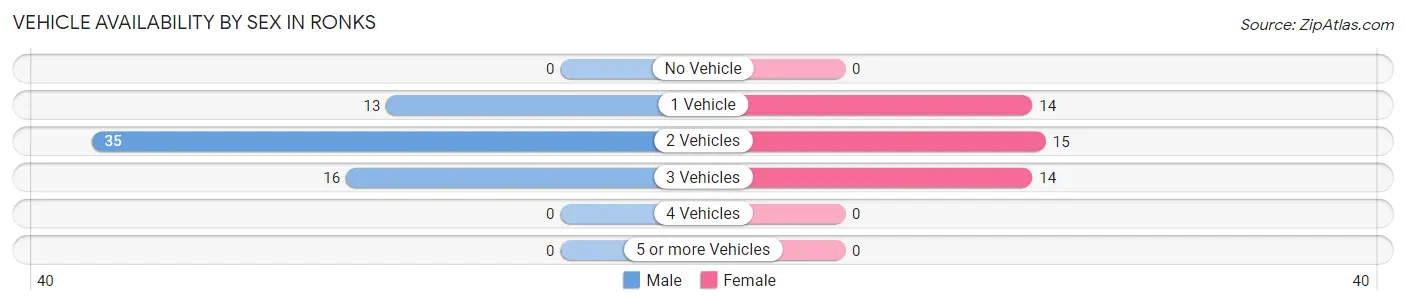
| Vehicles Available | Male | Female |
| No Vehicle | 0 (0.0%) | 0 (0.0%) |
| 1 Vehicle | 13 (20.3%) | 14 (32.6%) |
| 2 Vehicles | 35 (54.7%) | 15 (34.9%) |
| 3 Vehicles | 16 (25.0%) | 14 (32.6%) |
| 4 Vehicles | 0 (0.0%) | 0 (0.0%) |
| 5 or more Vehicles | 0 (0.0%) | 0 (0.0%) |
| Total | 64 (100.0%) | 43 (100.0%) |
Commute Time in Ronks
The most frequently occuring commute durations in Ronks are 5 to 9 minutes (31 commuters, 29.0%), 60 to 89 minutes (18 commuters, 16.8%), and 25 to 29 minutes (16 commuters, 14.9%).
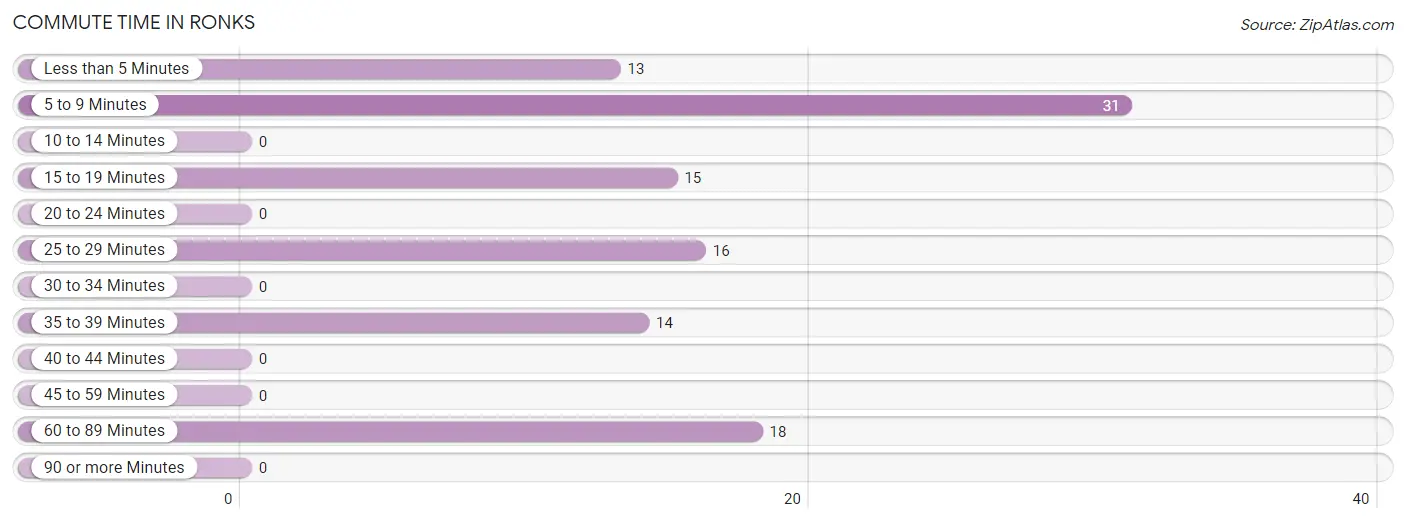
| Commute Time | # Commuters | % Commuters |
| Less than 5 Minutes | 13 | 12.1% |
| 5 to 9 Minutes | 31 | 29.0% |
| 10 to 14 Minutes | 0 | 0.0% |
| 15 to 19 Minutes | 15 | 14.0% |
| 20 to 24 Minutes | 0 | 0.0% |
| 25 to 29 Minutes | 16 | 14.9% |
| 30 to 34 Minutes | 0 | 0.0% |
| 35 to 39 Minutes | 14 | 13.1% |
| 40 to 44 Minutes | 0 | 0.0% |
| 45 to 59 Minutes | 0 | 0.0% |
| 60 to 89 Minutes | 18 | 16.8% |
| 90 or more Minutes | 0 | 0.0% |
Commute Time by Sex in Ronks
The most common commute times in Ronks are 60 to 89 minutes (18 commuters, 28.1%) for males and 15 to 19 minutes (15 commuters, 34.9%) for females.
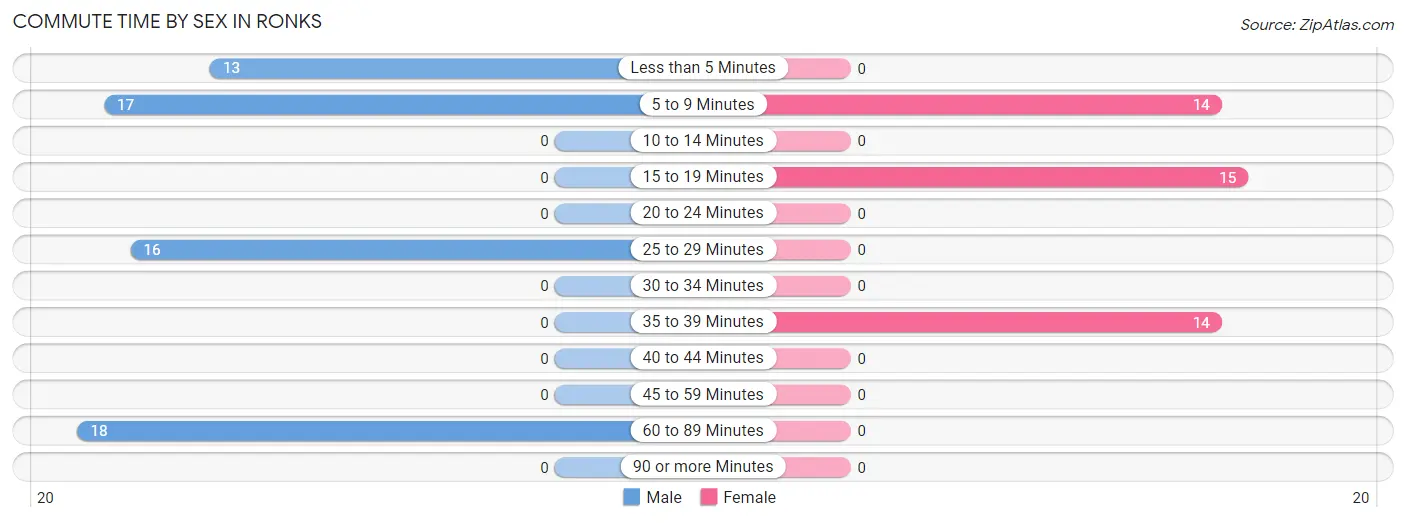
| Commute Time | Male | Female |
| Less than 5 Minutes | 13 (20.3%) | 0 (0.0%) |
| 5 to 9 Minutes | 17 (26.6%) | 14 (32.6%) |
| 10 to 14 Minutes | 0 (0.0%) | 0 (0.0%) |
| 15 to 19 Minutes | 0 (0.0%) | 15 (34.9%) |
| 20 to 24 Minutes | 0 (0.0%) | 0 (0.0%) |
| 25 to 29 Minutes | 16 (25.0%) | 0 (0.0%) |
| 30 to 34 Minutes | 0 (0.0%) | 0 (0.0%) |
| 35 to 39 Minutes | 0 (0.0%) | 14 (32.6%) |
| 40 to 44 Minutes | 0 (0.0%) | 0 (0.0%) |
| 45 to 59 Minutes | 0 (0.0%) | 0 (0.0%) |
| 60 to 89 Minutes | 18 (28.1%) | 0 (0.0%) |
| 90 or more Minutes | 0 (0.0%) | 0 (0.0%) |
Time of Departure to Work by Sex in Ronks
The most frequent times of departure to work in Ronks are 6:00 AM to 6:29 AM (51, 79.7%) for males and 7:00 AM to 7:29 AM (15, 34.9%) for females.
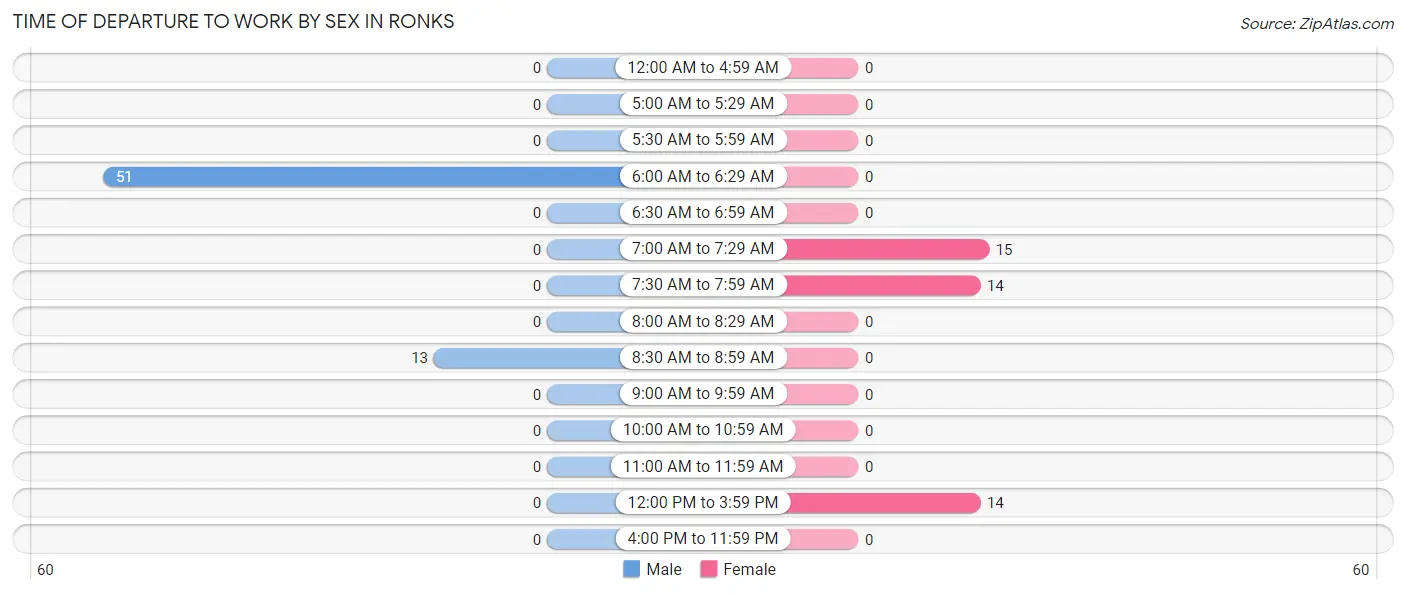
| Time of Departure | Male | Female |
| 12:00 AM to 4:59 AM | 0 (0.0%) | 0 (0.0%) |
| 5:00 AM to 5:29 AM | 0 (0.0%) | 0 (0.0%) |
| 5:30 AM to 5:59 AM | 0 (0.0%) | 0 (0.0%) |
| 6:00 AM to 6:29 AM | 51 (79.7%) | 0 (0.0%) |
| 6:30 AM to 6:59 AM | 0 (0.0%) | 0 (0.0%) |
| 7:00 AM to 7:29 AM | 0 (0.0%) | 15 (34.9%) |
| 7:30 AM to 7:59 AM | 0 (0.0%) | 14 (32.6%) |
| 8:00 AM to 8:29 AM | 0 (0.0%) | 0 (0.0%) |
| 8:30 AM to 8:59 AM | 13 (20.3%) | 0 (0.0%) |
| 9:00 AM to 9:59 AM | 0 (0.0%) | 0 (0.0%) |
| 10:00 AM to 10:59 AM | 0 (0.0%) | 0 (0.0%) |
| 11:00 AM to 11:59 AM | 0 (0.0%) | 0 (0.0%) |
| 12:00 PM to 3:59 PM | 0 (0.0%) | 14 (32.6%) |
| 4:00 PM to 11:59 PM | 0 (0.0%) | 0 (0.0%) |
| Total | 64 (100.0%) | 43 (100.0%) |
Housing Occupancy in Ronks
Occupancy by Ownership in Ronks
Of the total 93 dwellings in Ronks, owner-occupied units account for 66 (71.0%), while renter-occupied units make up 27 (29.0%).
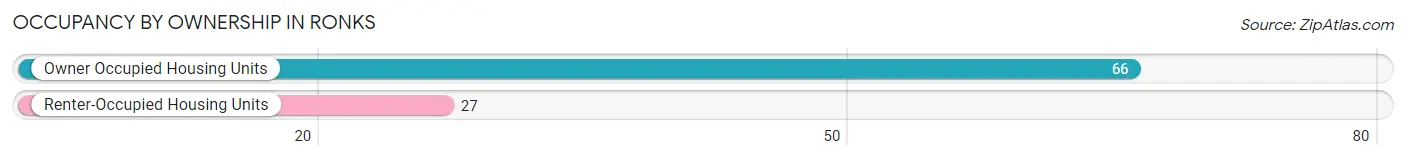
| Occupancy | # Housing Units | % Housing Units |
| Owner Occupied Housing Units | 66 | 71.0% |
| Renter-Occupied Housing Units | 27 | 29.0% |
| Total Occupied Housing Units | 93 | 100.0% |
Occupancy by Household Size in Ronks
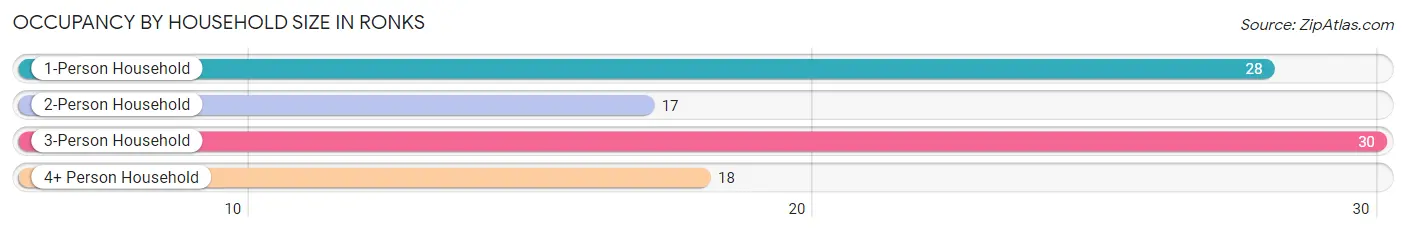
| Household Size | # Housing Units | % Housing Units |
| 1-Person Household | 28 | 30.1% |
| 2-Person Household | 17 | 18.3% |
| 3-Person Household | 30 | 32.3% |
| 4+ Person Household | 18 | 19.4% |
| Total Housing Units | 93 | 100.0% |
Occupancy by Ownership by Household Size in Ronks
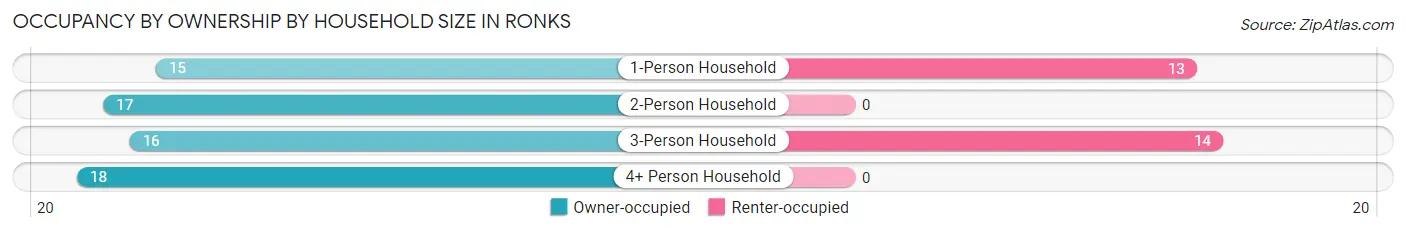
| Household Size | Owner-occupied | Renter-occupied |
| 1-Person Household | 15 (53.6%) | 13 (46.4%) |
| 2-Person Household | 17 (100.0%) | 0 (0.0%) |
| 3-Person Household | 16 (53.3%) | 14 (46.7%) |
| 4+ Person Household | 18 (100.0%) | 0 (0.0%) |
| Total Housing Units | 66 (71.0%) | 27 (29.0%) |
Occupancy by Educational Attainment in Ronks
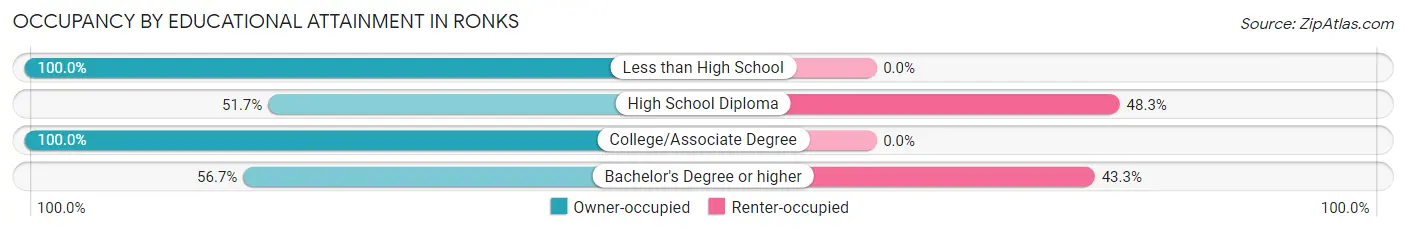
| Household Size | Owner-occupied | Renter-occupied |
| Less than High School | 18 (100.0%) | 0 (0.0%) |
| High School Diploma | 15 (51.7%) | 14 (48.3%) |
| College/Associate Degree | 16 (100.0%) | 0 (0.0%) |
| Bachelor's Degree or higher | 17 (56.7%) | 13 (43.3%) |
Occupancy by Age of Householder in Ronks
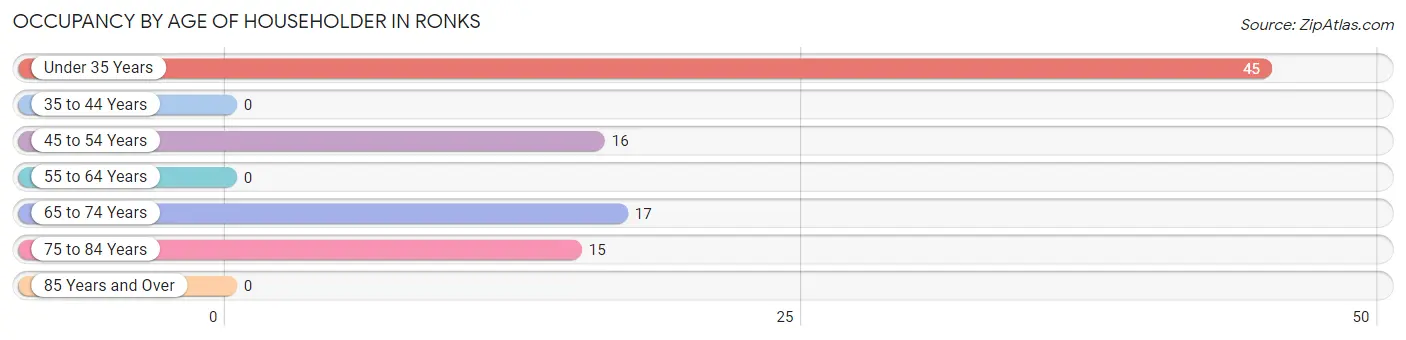
| Age Bracket | # Households | % Households |
| Under 35 Years | 45 | 48.4% |
| 35 to 44 Years | 0 | 0.0% |
| 45 to 54 Years | 16 | 17.2% |
| 55 to 64 Years | 0 | 0.0% |
| 65 to 74 Years | 17 | 18.3% |
| 75 to 84 Years | 15 | 16.1% |
| 85 Years and Over | 0 | 0.0% |
| Total | 93 | 100.0% |
Housing Finances in Ronks
Median Income by Occupancy in Ronks
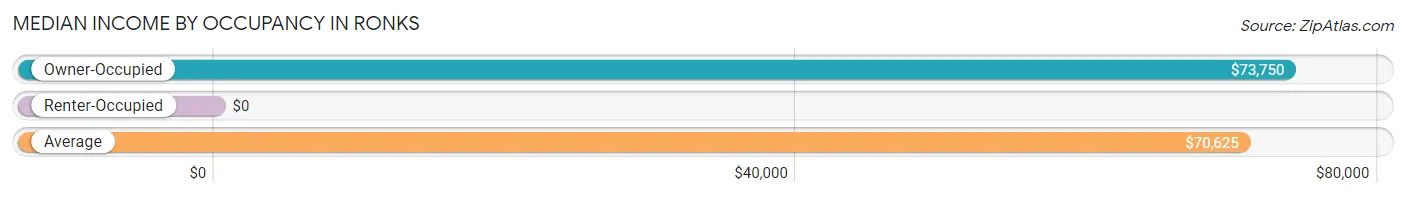
| Occupancy Type | # Households | Median Income |
| Owner-Occupied | 66 (71.0%) | $73,750 |
| Renter-Occupied | 27 (29.0%) | $0 |
| Average | 93 (100.0%) | $70,625 |
Occupancy by Householder Income Bracket in Ronks
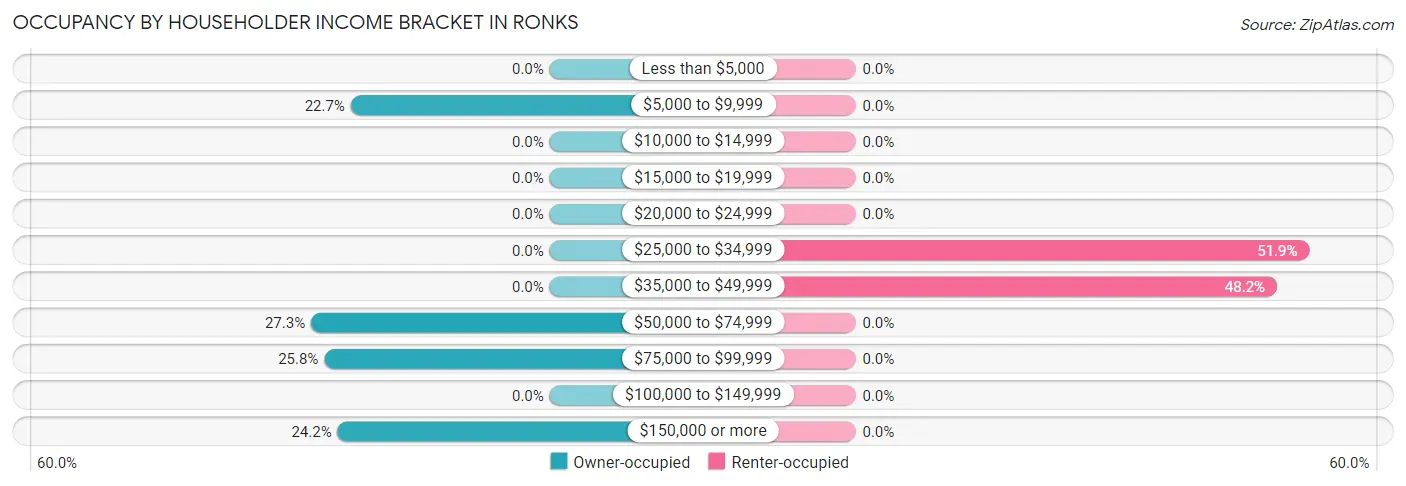
| Income Bracket | Owner-occupied | Renter-occupied |
| Less than $5,000 | 0 (0.0%) | 0 (0.0%) |
| $5,000 to $9,999 | 15 (22.7%) | 0 (0.0%) |
| $10,000 to $14,999 | 0 (0.0%) | 0 (0.0%) |
| $15,000 to $19,999 | 0 (0.0%) | 0 (0.0%) |
| $20,000 to $24,999 | 0 (0.0%) | 0 (0.0%) |
| $25,000 to $34,999 | 0 (0.0%) | 14 (51.8%) |
| $35,000 to $49,999 | 0 (0.0%) | 13 (48.1%) |
| $50,000 to $74,999 | 18 (27.3%) | 0 (0.0%) |
| $75,000 to $99,999 | 17 (25.8%) | 0 (0.0%) |
| $100,000 to $149,999 | 0 (0.0%) | 0 (0.0%) |
| $150,000 or more | 16 (24.2%) | 0 (0.0%) |
| Total | 66 (100.0%) | 27 (100.0%) |
Monthly Housing Cost Tiers in Ronks
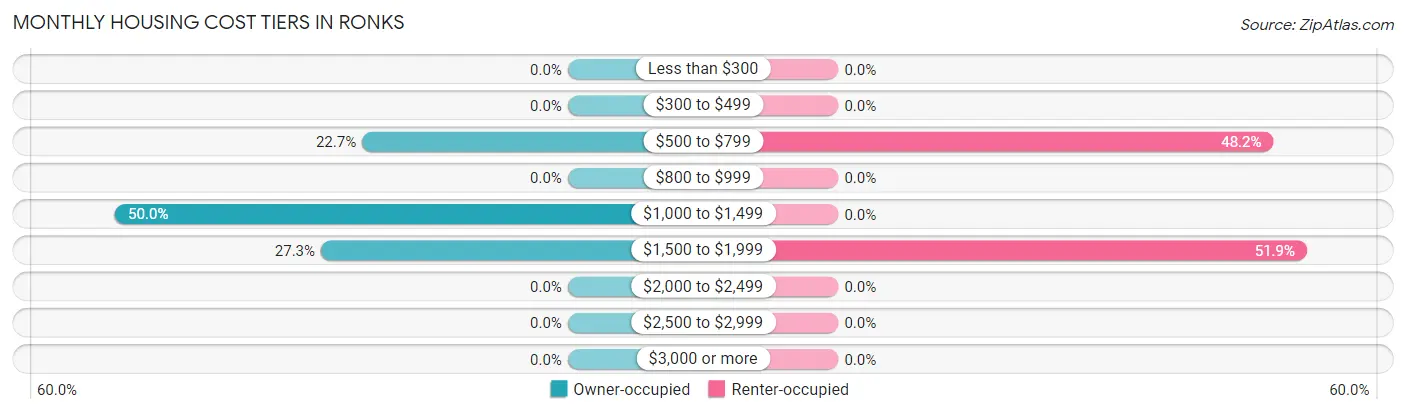
| Monthly Cost | Owner-occupied | Renter-occupied |
| Less than $300 | 0 (0.0%) | 0 (0.0%) |
| $300 to $499 | 0 (0.0%) | 0 (0.0%) |
| $500 to $799 | 15 (22.7%) | 13 (48.1%) |
| $800 to $999 | 0 (0.0%) | 0 (0.0%) |
| $1,000 to $1,499 | 33 (50.0%) | 0 (0.0%) |
| $1,500 to $1,999 | 18 (27.3%) | 14 (51.8%) |
| $2,000 to $2,499 | 0 (0.0%) | 0 (0.0%) |
| $2,500 to $2,999 | 0 (0.0%) | 0 (0.0%) |
| $3,000 or more | 0 (0.0%) | 0 (0.0%) |
| Total | 66 (100.0%) | 27 (100.0%) |
Physical Housing Characteristics in Ronks
Housing Structures in Ronks
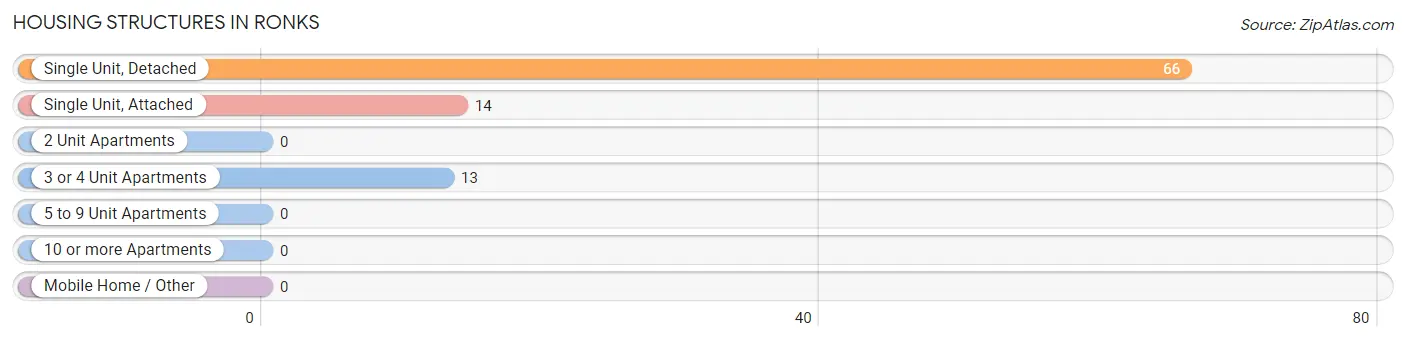
| Structure Type | # Housing Units | % Housing Units |
| Single Unit, Detached | 66 | 71.0% |
| Single Unit, Attached | 14 | 15.0% |
| 2 Unit Apartments | 0 | 0.0% |
| 3 or 4 Unit Apartments | 13 | 14.0% |
| 5 to 9 Unit Apartments | 0 | 0.0% |
| 10 or more Apartments | 0 | 0.0% |
| Mobile Home / Other | 0 | 0.0% |
| Total | 93 | 100.0% |
Housing Structures by Occupancy in Ronks
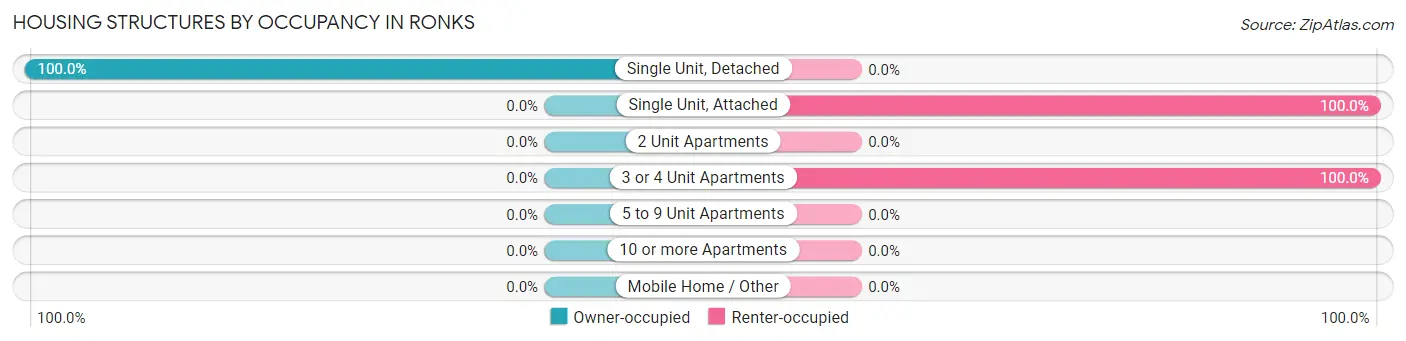
| Structure Type | Owner-occupied | Renter-occupied |
| Single Unit, Detached | 66 (100.0%) | 0 (0.0%) |
| Single Unit, Attached | 0 (0.0%) | 14 (100.0%) |
| 2 Unit Apartments | 0 (0.0%) | 0 (0.0%) |
| 3 or 4 Unit Apartments | 0 (0.0%) | 13 (100.0%) |
| 5 to 9 Unit Apartments | 0 (0.0%) | 0 (0.0%) |
| 10 or more Apartments | 0 (0.0%) | 0 (0.0%) |
| Mobile Home / Other | 0 (0.0%) | 0 (0.0%) |
| Total | 66 (71.0%) | 27 (29.0%) |
Housing Structures by Number of Rooms in Ronks
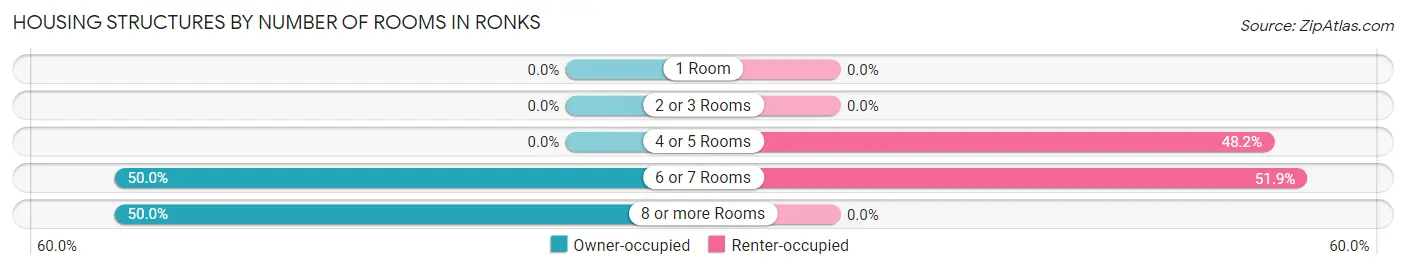
| Number of Rooms | Owner-occupied | Renter-occupied |
| 1 Room | 0 (0.0%) | 0 (0.0%) |
| 2 or 3 Rooms | 0 (0.0%) | 0 (0.0%) |
| 4 or 5 Rooms | 0 (0.0%) | 13 (48.1%) |
| 6 or 7 Rooms | 33 (50.0%) | 14 (51.8%) |
| 8 or more Rooms | 33 (50.0%) | 0 (0.0%) |
| Total | 66 (100.0%) | 27 (100.0%) |
Housing Structure by Heating Type in Ronks
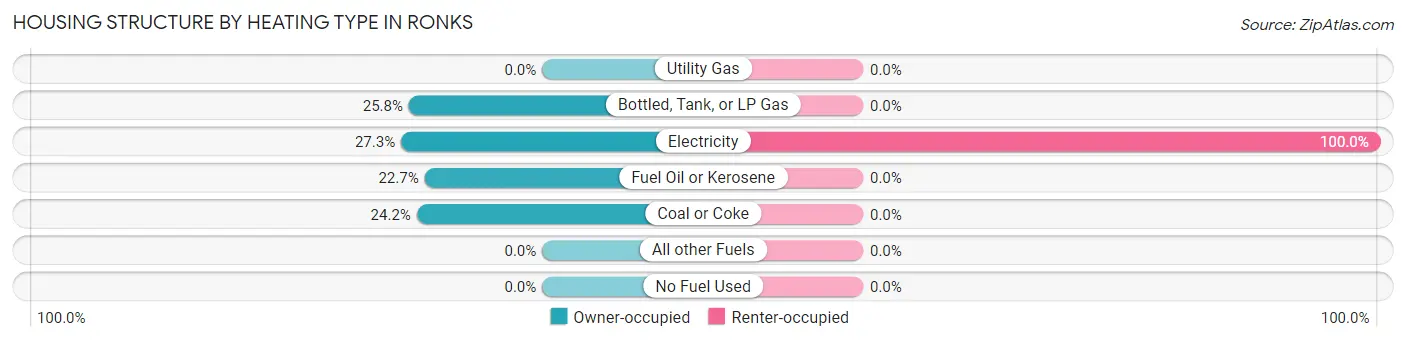
| Heating Type | Owner-occupied | Renter-occupied |
| Utility Gas | 0 (0.0%) | 0 (0.0%) |
| Bottled, Tank, or LP Gas | 17 (25.8%) | 0 (0.0%) |
| Electricity | 18 (27.3%) | 27 (100.0%) |
| Fuel Oil or Kerosene | 15 (22.7%) | 0 (0.0%) |
| Coal or Coke | 16 (24.2%) | 0 (0.0%) |
| All other Fuels | 0 (0.0%) | 0 (0.0%) |
| No Fuel Used | 0 (0.0%) | 0 (0.0%) |
| Total | 66 (100.0%) | 27 (100.0%) |
Household Vehicle Usage in Ronks
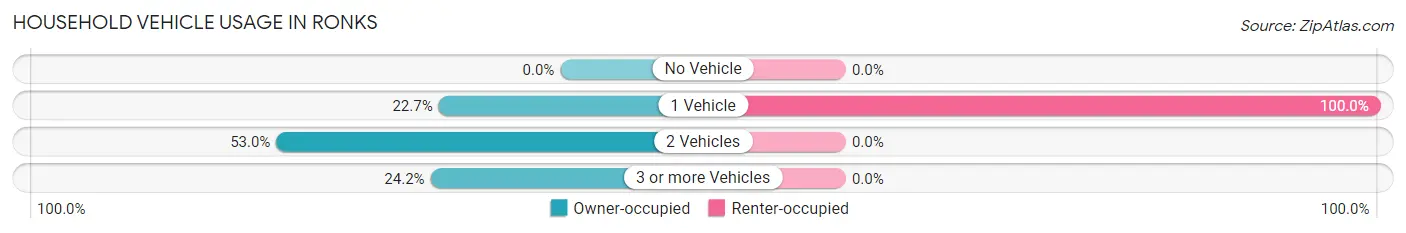
| Vehicles per Household | Owner-occupied | Renter-occupied |
| No Vehicle | 0 (0.0%) | 0 (0.0%) |
| 1 Vehicle | 15 (22.7%) | 27 (100.0%) |
| 2 Vehicles | 35 (53.0%) | 0 (0.0%) |
| 3 or more Vehicles | 16 (24.2%) | 0 (0.0%) |
| Total | 66 (100.0%) | 27 (100.0%) |
Real Estate & Mortgages in Ronks
Real Estate and Mortgage Overview in Ronks
| Characteristic | Without Mortgage | With Mortgage |
| Housing Units | 32 | 34 |
| Median Property Value | - | - |
| Median Household Income | - | - |
| Monthly Housing Costs | - | - |
| Real Estate Taxes | - | - |
Property Value by Mortgage Status in Ronks
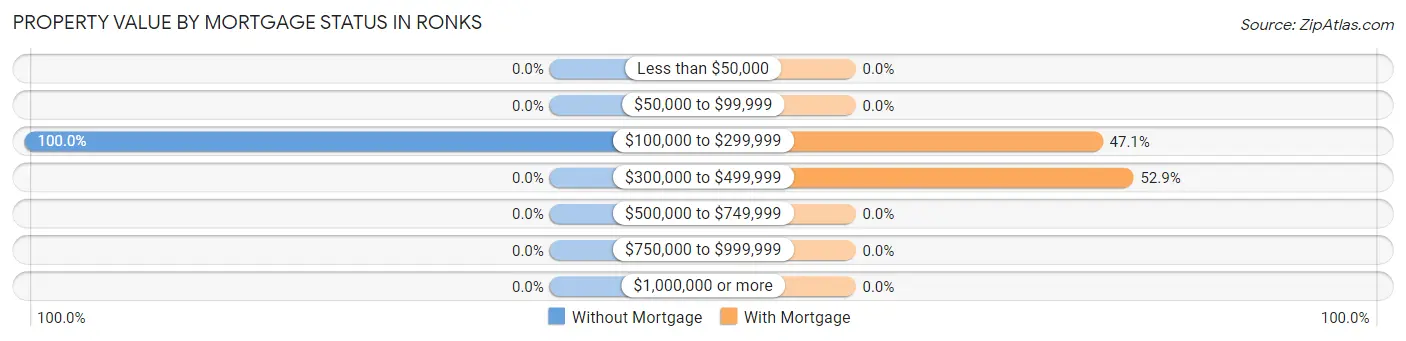
| Property Value | Without Mortgage | With Mortgage |
| Less than $50,000 | 0 (0.0%) | 0 (0.0%) |
| $50,000 to $99,999 | 0 (0.0%) | 0 (0.0%) |
| $100,000 to $299,999 | 32 (100.0%) | 16 (47.1%) |
| $300,000 to $499,999 | 0 (0.0%) | 18 (52.9%) |
| $500,000 to $749,999 | 0 (0.0%) | 0 (0.0%) |
| $750,000 to $999,999 | 0 (0.0%) | 0 (0.0%) |
| $1,000,000 or more | 0 (0.0%) | 0 (0.0%) |
| Total | 32 (100.0%) | 34 (100.0%) |
Household Income by Mortgage Status in Ronks
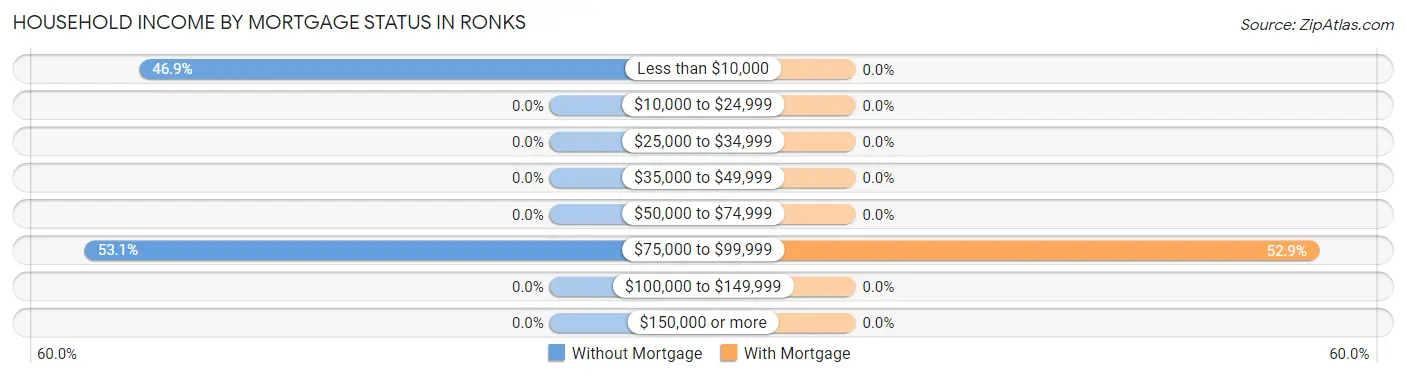
| Household Income | Without Mortgage | With Mortgage |
| Less than $10,000 | 15 (46.9%) | 0 (0.0%) |
| $10,000 to $24,999 | 0 (0.0%) | 0 (0.0%) |
| $25,000 to $34,999 | 0 (0.0%) | 0 (0.0%) |
| $35,000 to $49,999 | 0 (0.0%) | 0 (0.0%) |
| $50,000 to $74,999 | 0 (0.0%) | 0 (0.0%) |
| $75,000 to $99,999 | 17 (53.1%) | 18 (52.9%) |
| $100,000 to $149,999 | 0 (0.0%) | 0 (0.0%) |
| $150,000 or more | 0 (0.0%) | 0 (0.0%) |
| Total | 32 (100.0%) | 34 (100.0%) |
Property Value to Household Income Ratio in Ronks
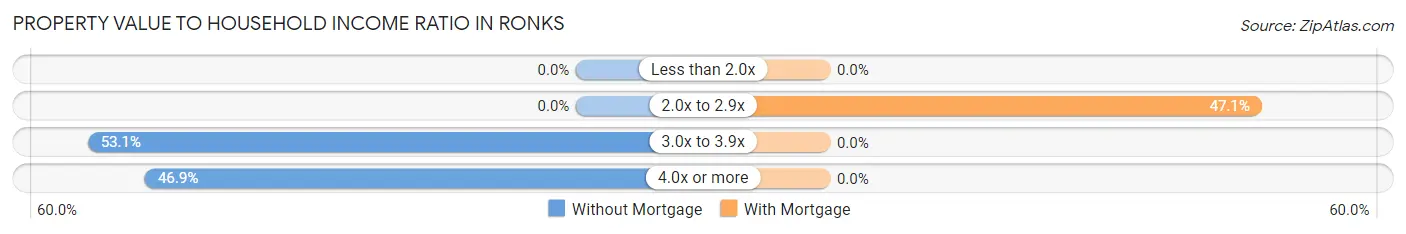
| Value-to-Income Ratio | Without Mortgage | With Mortgage |
| Less than 2.0x | 0 (0.0%) | 0 (0.0%) |
| 2.0x to 2.9x | 0 (0.0%) | 16 (47.1%) |
| 3.0x to 3.9x | 17 (53.1%) | 0 (0.0%) |
| 4.0x or more | 15 (46.9%) | 0 (0.0%) |
| Total | 32 (100.0%) | 34 (100.0%) |
Real Estate Taxes by Mortgage Status in Ronks
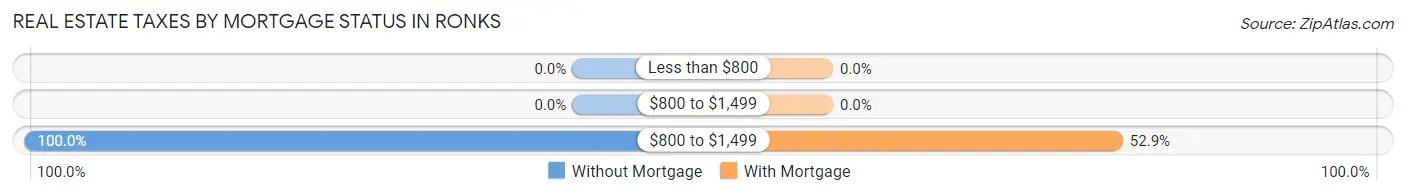
| Property Taxes | Without Mortgage | With Mortgage |
| Less than $800 | 0 (0.0%) | 0 (0.0%) |
| $800 to $1,499 | 0 (0.0%) | 0 (0.0%) |
| $800 to $1,499 | 32 (100.0%) | 18 (52.9%) |
| Total | 32 (100.0%) | 34 (100.0%) |
Health & Disability in Ronks
Health Insurance Coverage by Age in Ronks
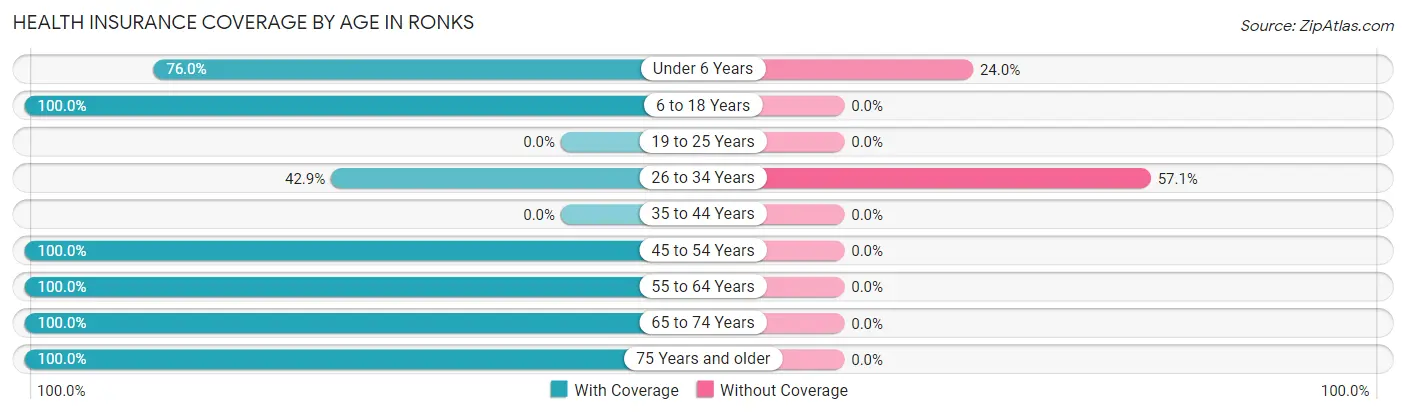
| Age Bracket | With Coverage | Without Coverage |
| Under 6 Years | 57 (76.0%) | 18 (24.0%) |
| 6 to 18 Years | 12 (100.0%) | 0 (0.0%) |
| 19 to 25 Years | 0 (0.0%) | 0 (0.0%) |
| 26 to 34 Years | 27 (42.9%) | 36 (57.1%) |
| 35 to 44 Years | 0 (0.0%) | 0 (0.0%) |
| 45 to 54 Years | 30 (100.0%) | 0 (0.0%) |
| 55 to 64 Years | 15 (100.0%) | 0 (0.0%) |
| 65 to 74 Years | 17 (100.0%) | 0 (0.0%) |
| 75 Years and older | 15 (100.0%) | 0 (0.0%) |
| Total | 173 (76.2%) | 54 (23.8%) |
Health Insurance Coverage by Citizenship Status in Ronks
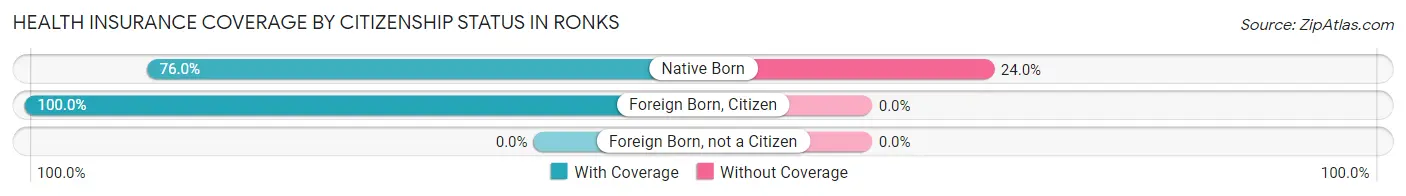
| Citizenship Status | With Coverage | Without Coverage |
| Native Born | 57 (76.0%) | 18 (24.0%) |
| Foreign Born, Citizen | 12 (100.0%) | 0 (0.0%) |
| Foreign Born, not a Citizen | 0 (0.0%) | 0 (0.0%) |
Health Insurance Coverage by Household Income in Ronks
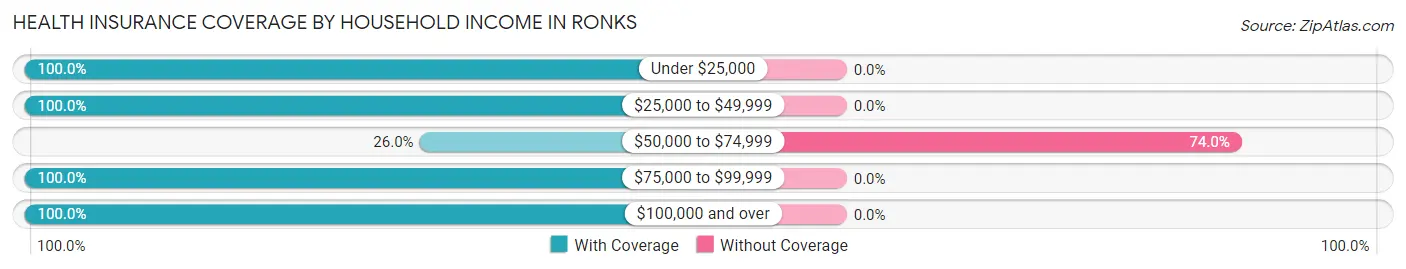
| Household Income | With Coverage | Without Coverage |
| Under $25,000 | 15 (100.0%) | 0 (0.0%) |
| $25,000 to $49,999 | 65 (100.0%) | 0 (0.0%) |
| $50,000 to $74,999 | 19 (26.0%) | 54 (74.0%) |
| $75,000 to $99,999 | 32 (100.0%) | 0 (0.0%) |
| $100,000 and over | 42 (100.0%) | 0 (0.0%) |
Public vs Private Health Insurance Coverage by Age in Ronks
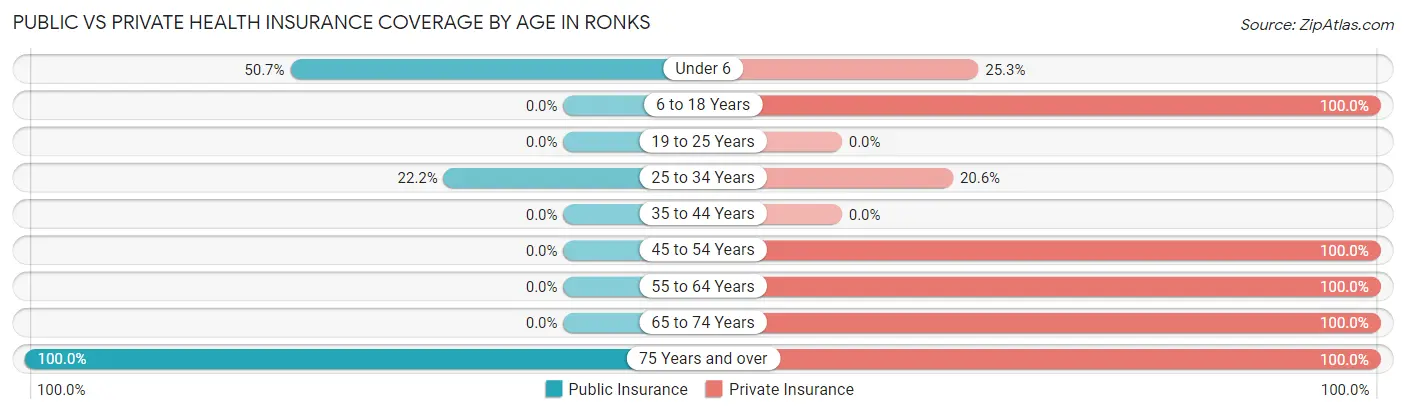
| Age Bracket | Public Insurance | Private Insurance |
| Under 6 | 38 (50.7%) | 19 (25.3%) |
| 6 to 18 Years | 0 (0.0%) | 12 (100.0%) |
| 19 to 25 Years | 0 (0.0%) | 0 (0.0%) |
| 25 to 34 Years | 14 (22.2%) | 13 (20.6%) |
| 35 to 44 Years | 0 (0.0%) | 0 (0.0%) |
| 45 to 54 Years | 0 (0.0%) | 30 (100.0%) |
| 55 to 64 Years | 0 (0.0%) | 15 (100.0%) |
| 65 to 74 Years | 0 (0.0%) | 17 (100.0%) |
| 75 Years and over | 15 (100.0%) | 15 (100.0%) |
| Total | 67 (29.5%) | 121 (53.3%) |
Disability Status by Sex by Age in Ronks
| Age Bracket | Male | Female |
| Under 5 Years | 0 (0.0%) | 0 (0.0%) |
| 5 to 17 Years | 0 (0.0%) | 0 (0.0%) |
| 18 to 34 Years | 0 (0.0%) | 0 (0.0%) |
| 35 to 64 Years | 0 (0.0%) | 0 (0.0%) |
| 65 to 74 Years | 0 (0.0%) | 0 (0.0%) |
| 75 Years and over | 0 (0.0%) | 0 (0.0%) |
Disability Class by Sex by Age in Ronks
Disability Class: Hearing Difficulty
| Age Bracket | Male | Female |
| Under 5 Years | 0 (0.0%) | 0 (0.0%) |
| 5 to 17 Years | 0 (0.0%) | 0 (0.0%) |
| 18 to 34 Years | 0 (0.0%) | 0 (0.0%) |
| 35 to 64 Years | 0 (0.0%) | 0 (0.0%) |
| 65 to 74 Years | 0 (0.0%) | 0 (0.0%) |
| 75 Years and over | 0 (0.0%) | 0 (0.0%) |
Disability Class: Vision Difficulty
| Age Bracket | Male | Female |
| Under 5 Years | 0 (0.0%) | 0 (0.0%) |
| 5 to 17 Years | 0 (0.0%) | 0 (0.0%) |
| 18 to 34 Years | 0 (0.0%) | 0 (0.0%) |
| 35 to 64 Years | 0 (0.0%) | 0 (0.0%) |
| 65 to 74 Years | 0 (0.0%) | 0 (0.0%) |
| 75 Years and over | 0 (0.0%) | 0 (0.0%) |
Disability Class: Cognitive Difficulty
| Age Bracket | Male | Female |
| 5 to 17 Years | 0 (0.0%) | 0 (0.0%) |
| 18 to 34 Years | 0 (0.0%) | 0 (0.0%) |
| 35 to 64 Years | 0 (0.0%) | 0 (0.0%) |
| 65 to 74 Years | 0 (0.0%) | 0 (0.0%) |
| 75 Years and over | 0 (0.0%) | 0 (0.0%) |
Disability Class: Ambulatory Difficulty
| Age Bracket | Male | Female |
| 5 to 17 Years | 0 (0.0%) | 0 (0.0%) |
| 18 to 34 Years | 0 (0.0%) | 0 (0.0%) |
| 35 to 64 Years | 0 (0.0%) | 0 (0.0%) |
| 65 to 74 Years | 0 (0.0%) | 0 (0.0%) |
| 75 Years and over | 0 (0.0%) | 0 (0.0%) |
Disability Class: Self-Care Difficulty
| Age Bracket | Male | Female |
| 5 to 17 Years | 0 (0.0%) | 0 (0.0%) |
| 18 to 34 Years | 0 (0.0%) | 0 (0.0%) |
| 35 to 64 Years | 0 (0.0%) | 0 (0.0%) |
| 65 to 74 Years | 0 (0.0%) | 0 (0.0%) |
| 75 Years and over | 0 (0.0%) | 0 (0.0%) |
Technology Access in Ronks
Computing Device Access in Ronks
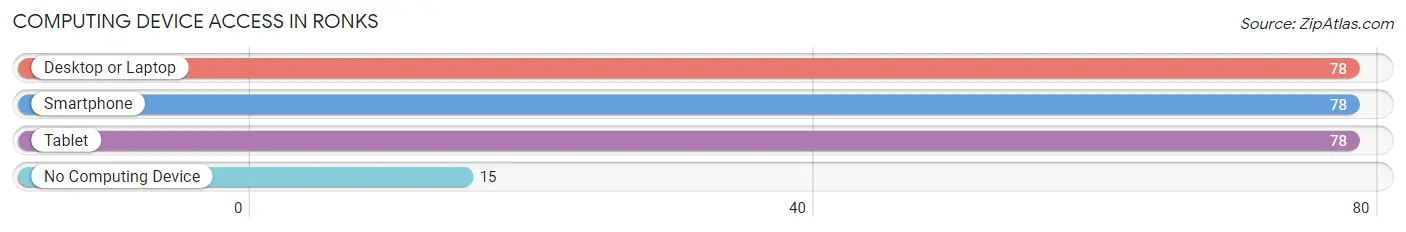
| Device Type | # Households | % Households |
| Desktop or Laptop | 78 | 83.9% |
| Smartphone | 78 | 83.9% |
| Tablet | 78 | 83.9% |
| No Computing Device | 15 | 16.1% |
| Total | 93 | 100.0% |
Internet Access in Ronks
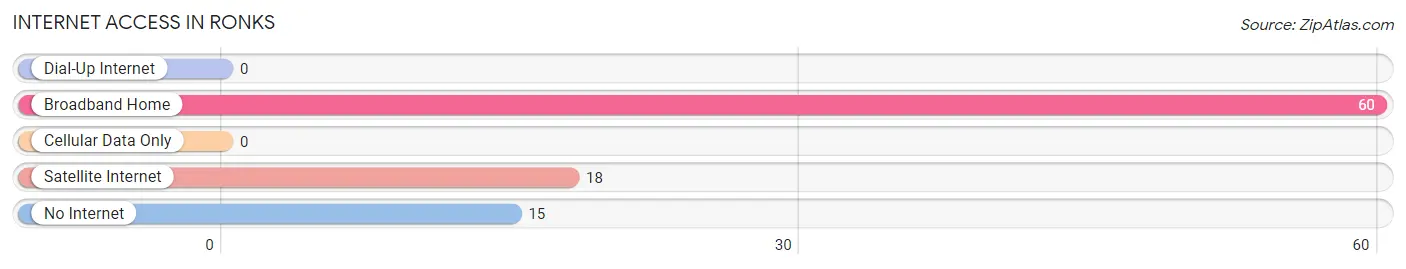
| Internet Type | # Households | % Households |
| Dial-Up Internet | 0 | 0.0% |
| Broadband Home | 60 | 64.5% |
| Cellular Data Only | 0 | 0.0% |
| Satellite Internet | 18 | 19.4% |
| No Internet | 15 | 16.1% |
| Total | 93 | 100.0% |
Ronks Summary
Ronks, Pennsylvania is a small unincorporated community located in Lancaster County. It is situated in the heart of Pennsylvania Dutch Country, and is home to a variety of Amish and Mennonite communities. The area is known for its rich history, beautiful geography, and unique economy and demographics.
History
Ronks has a long and storied history. The area was first settled by German immigrants in the late 1700s, and the town was officially established in 1814. The town was named after the Ronks family, who were among the first settlers in the area.
The town was an important stop on the Underground Railroad, and many escaped slaves found refuge in the area. The town was also home to a variety of industries, including a sawmill, a gristmill, and a tannery.
Geography
Ronks is located in the heart of Pennsylvania Dutch Country. The town is situated in the rolling hills of Lancaster County, and is surrounded by farmland and woodlands. The area is known for its picturesque views and rural charm.
The town is located near several major highways, including the Pennsylvania Turnpike and US Route 30. The town is also close to the cities of Lancaster and Reading, which are both about an hour away.
Economy
The economy of Ronks is largely based on agriculture. The area is home to a variety of Amish and Mennonite farms, which produce a variety of crops, including corn, wheat, and hay. The area is also home to a variety of small businesses, including restaurants, shops, and other services.
The town is also home to a variety of tourist attractions, including the Strasburg Rail Road, the National Toy Train Museum, and the Amish Village. These attractions draw visitors from all over the world, and help to support the local economy.
Demographics
As of the 2010 census, the population of Ronks was 1,845. The town is predominantly white, with a small minority population. The median household income is $50,000, and the median home value is $170,000.
The town is home to a variety of religious communities, including Amish, Mennonite, and Lutheran. The town is also home to a variety of cultural events, including the annual Ronks Fire Company Carnival and the Ronks Fall Festival.
Conclusion
Ronks, Pennsylvania is a small unincorporated community located in Lancaster County. The area is known for its rich history, beautiful geography, and unique economy and demographics. The town is home to a variety of Amish and Mennonite communities, and is a popular tourist destination. The town is also home to a variety of small businesses, and is a great place to live and work.
Common Questions
What is Per Capita Income in Ronks?
Per Capita income in Ronks is $25,679.
What is the Median Family Income in Ronks?
Median Family Income in Ronks is $75,074.
What is the Median Household income in Ronks?
Median Household Income in Ronks is $70,625.
What is Inequality or Gini Index in Ronks?
Inequality or Gini Index in Ronks is 0.38.
What is the Total Population of Ronks?
Total Population of Ronks is 227.
What is the Total Male Population of Ronks?
Total Male Population of Ronks is 101.
What is the Total Female Population of Ronks?
Total Female Population of Ronks is 126.
What is the Ratio of Males per 100 Females in Ronks?
There are 80.16 Males per 100 Females in Ronks.
What is the Ratio of Females per 100 Males in Ronks?
There are 124.75 Females per 100 Males in Ronks.
What is the Median Population Age in Ronks?
Median Population Age in Ronks is 29.3 Years.
What is the Average Family Size in Ronks
Average Family Size in Ronks is 3.1 People.
What is the Average Household Size in Ronks
Average Household Size in Ronks is 2.4 People.
How Large is the Labor Force in Ronks?
There are 107 People in the Labor Forcein in Ronks.
What is the Percentage of People in the Labor Force in Ronks?
76.4% of People are in the Labor Force in Ronks.