Edenborn, PA Map & Demographics
Edenborn Map
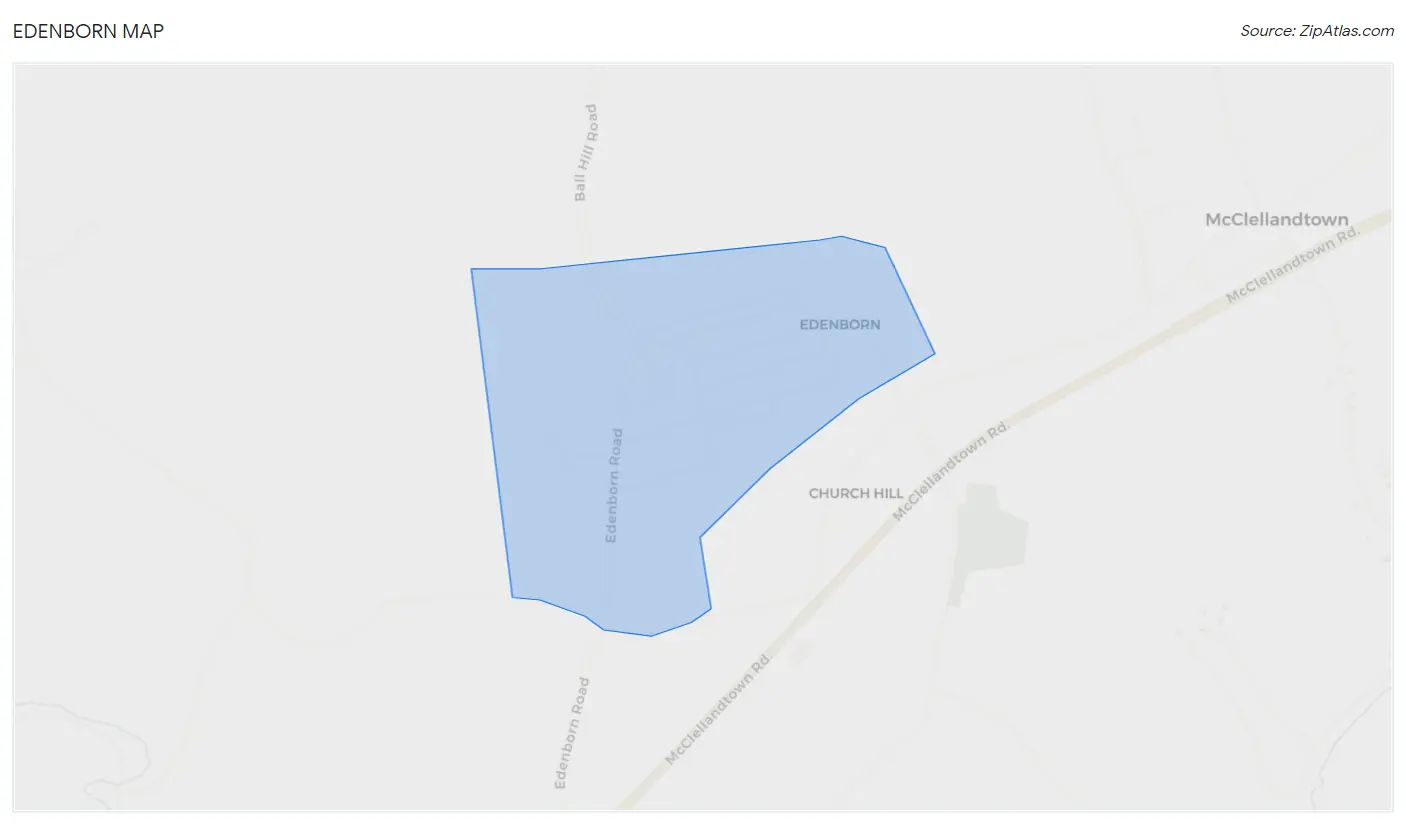
Edenborn Overview
$11,613
PER CAPITA INCOME
$55,938
AVG FAMILY INCOME
$55,313
AVG HOUSEHOLD INCOME
0.24
INEQUALITY / GINI INDEX
118
TOTAL POPULATION
39
MALE POPULATION
79
FEMALE POPULATION
49.37
MALES / 100 FEMALES
202.56
FEMALES / 100 MALES
21.6
MEDIAN AGE
4.6
AVG FAMILY SIZE
3.7
AVG HOUSEHOLD SIZE
42
LABOR FORCE [ PEOPLE ]
59.2%
PERCENT IN LABOR FORCE
Income in Edenborn
Income Overview in Edenborn
Per Capita Income in Edenborn is $11,613, while median incomes of families and households are $55,938 and $55,313 respectively.
| Characteristic | Number | Measure |
| Per Capita Income | 118 | $11,613 |
| Median Family Income | 24 | $55,938 |
| Mean Family Income | 24 | $54,846 |
| Median Household Income | 32 | $55,313 |
| Mean Household Income | 32 | $44,403 |
| Income Deficit | 24 | $0 |
| Wage / Income Gap (%) | 118 | 0.00% |
| Wage / Income Gap ($) | 118 | 100.00¢ per $1 |
| Gini / Inequality Index | 118 | 0.24 |
Earnings by Sex in Edenborn
| Sex | Number | Average Earnings |
| Male | 19 (45.2%) | $0 |
| Female | 23 (54.8%) | $0 |
| Total | 42 (100.0%) | $0 |
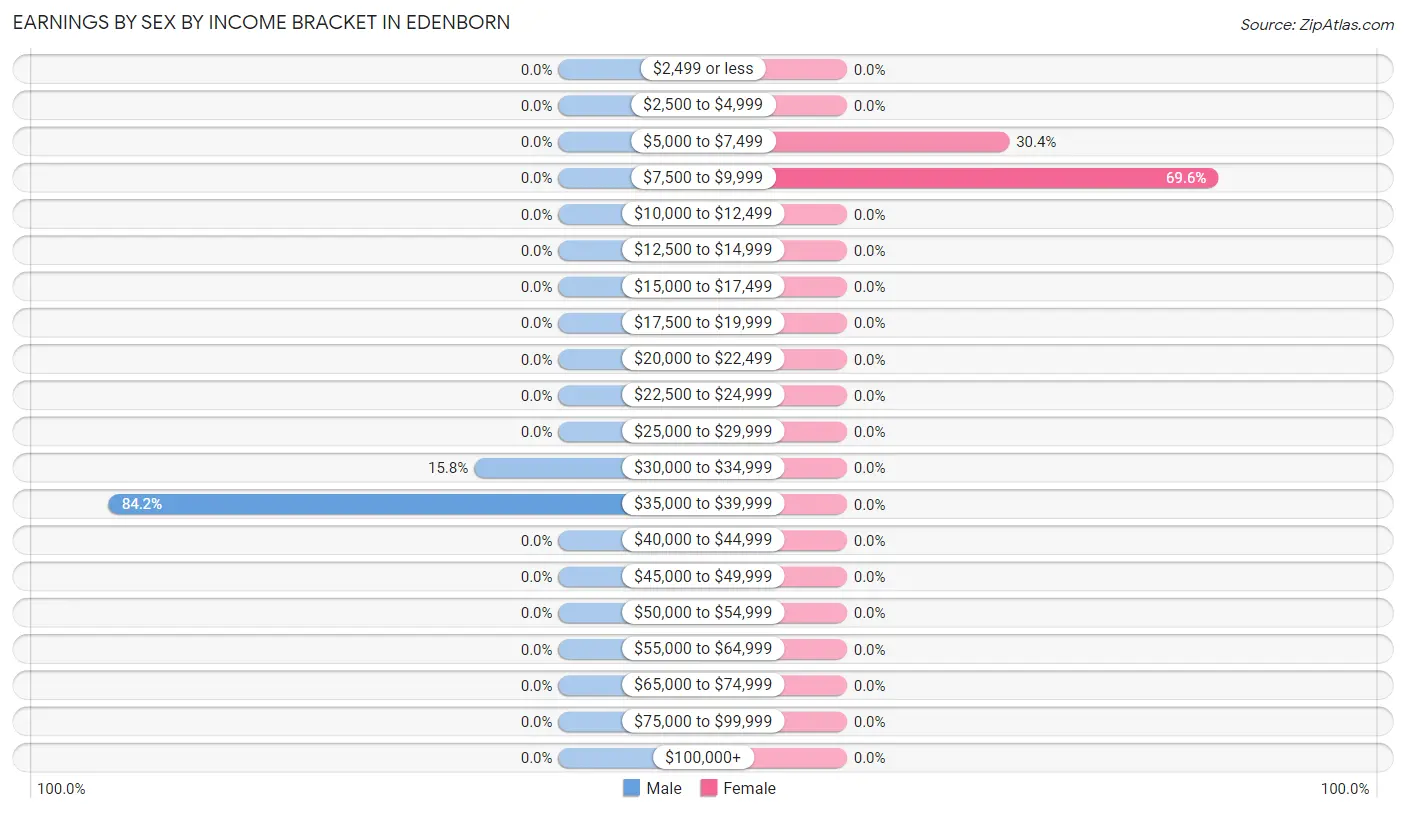
Earnings by Sex by Income Bracket in Edenborn
The most common earnings brackets in Edenborn are $35,000 to $39,999 for men (16 | 84.2%) and $7,500 to $9,999 for women (16 | 69.6%).
| Income | Male | Female |
| $2,499 or less | 0 (0.0%) | 0 (0.0%) |
| $2,500 to $4,999 | 0 (0.0%) | 0 (0.0%) |
| $5,000 to $7,499 | 0 (0.0%) | 7 (30.4%) |
| $7,500 to $9,999 | 0 (0.0%) | 16 (69.6%) |
| $10,000 to $12,499 | 0 (0.0%) | 0 (0.0%) |
| $12,500 to $14,999 | 0 (0.0%) | 0 (0.0%) |
| $15,000 to $17,499 | 0 (0.0%) | 0 (0.0%) |
| $17,500 to $19,999 | 0 (0.0%) | 0 (0.0%) |
| $20,000 to $22,499 | 0 (0.0%) | 0 (0.0%) |
| $22,500 to $24,999 | 0 (0.0%) | 0 (0.0%) |
| $25,000 to $29,999 | 0 (0.0%) | 0 (0.0%) |
| $30,000 to $34,999 | 3 (15.8%) | 0 (0.0%) |
| $35,000 to $39,999 | 16 (84.2%) | 0 (0.0%) |
| $40,000 to $44,999 | 0 (0.0%) | 0 (0.0%) |
| $45,000 to $49,999 | 0 (0.0%) | 0 (0.0%) |
| $50,000 to $54,999 | 0 (0.0%) | 0 (0.0%) |
| $55,000 to $64,999 | 0 (0.0%) | 0 (0.0%) |
| $65,000 to $74,999 | 0 (0.0%) | 0 (0.0%) |
| $75,000 to $99,999 | 0 (0.0%) | 0 (0.0%) |
| $100,000+ | 0 (0.0%) | 0 (0.0%) |
| Total | 19 (100.0%) | 23 (100.0%) |
Earnings by Sex by Educational Attainment in Edenborn
| Educational Attainment | Male Income | Female Income |
| Less than High School | - | - |
| High School Diploma | - | - |
| College or Associate's Degree | - | - |
| Bachelor's Degree | - | - |
| Graduate Degree | - | - |
| Total | - | - |
Family Income in Edenborn
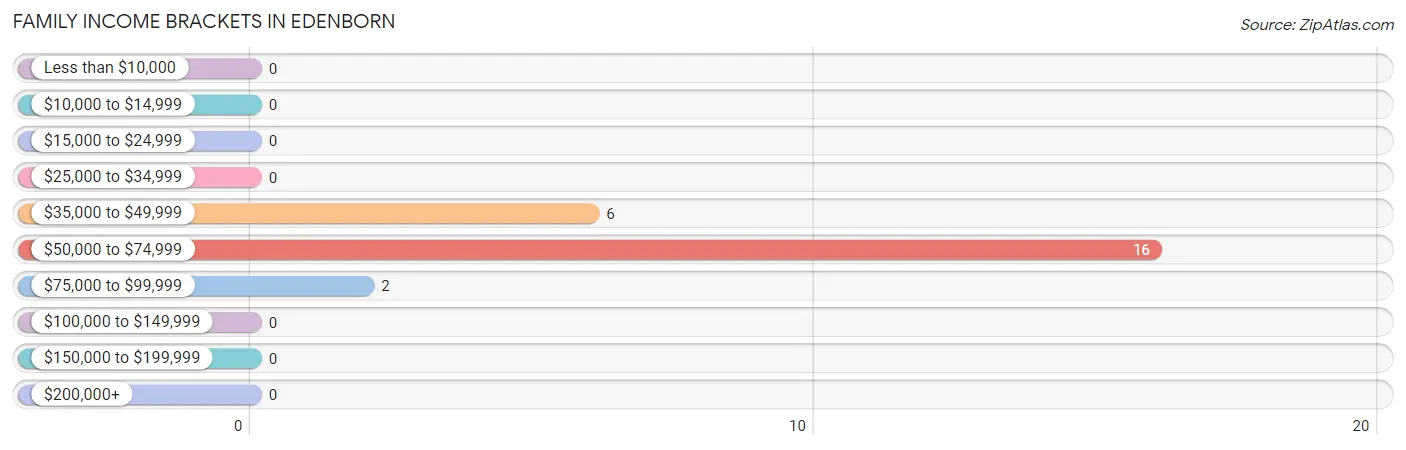
Family Income Brackets in Edenborn
According to the Edenborn family income data, there are 16 families falling into the $50,000 to $74,999 income range, which is the most common income bracket and makes up 66.7% of all families.
| Income Bracket | # Families | % Families |
| Less than $10,000 | 0 | 0.0% |
| $10,000 to $14,999 | 0 | 0.0% |
| $15,000 to $24,999 | 0 | 0.0% |
| $25,000 to $34,999 | 0 | 0.0% |
| $35,000 to $49,999 | 6 | 25.0% |
| $50,000 to $74,999 | 16 | 66.7% |
| $75,000 to $99,999 | 2 | 8.3% |
| $100,000 to $149,999 | 0 | 0.0% |
| $150,000 to $199,999 | 0 | 0.0% |
| $200,000+ | 0 | 0.0% |
Family Income by Famaliy Size in Edenborn
| Income Bracket | # Families | Median Income |
| 2-Person Families | 0 (0.0%) | $0 |
| 3-Person Families | 2 (8.3%) | $0 |
| 4-Person Families | 6 (25.0%) | $0 |
| 5-Person Families | 16 (66.7%) | $0 |
| 6-Person Families | 0 (0.0%) | $0 |
| 7+ Person Families | 0 (0.0%) | $0 |
| Total | 24 (100.0%) | $55,938 |
Family Income by Number of Earners in Edenborn
| Number of Earners | # Families | Median Income |
| No Earners | 2 (8.3%) | $0 |
| 1 Earner | 0 (0.0%) | $0 |
| 2 Earners | 22 (91.7%) | $0 |
| 3+ Earners | 0 (0.0%) | $0 |
| Total | 24 (100.0%) | $55,938 |
Household Income in Edenborn
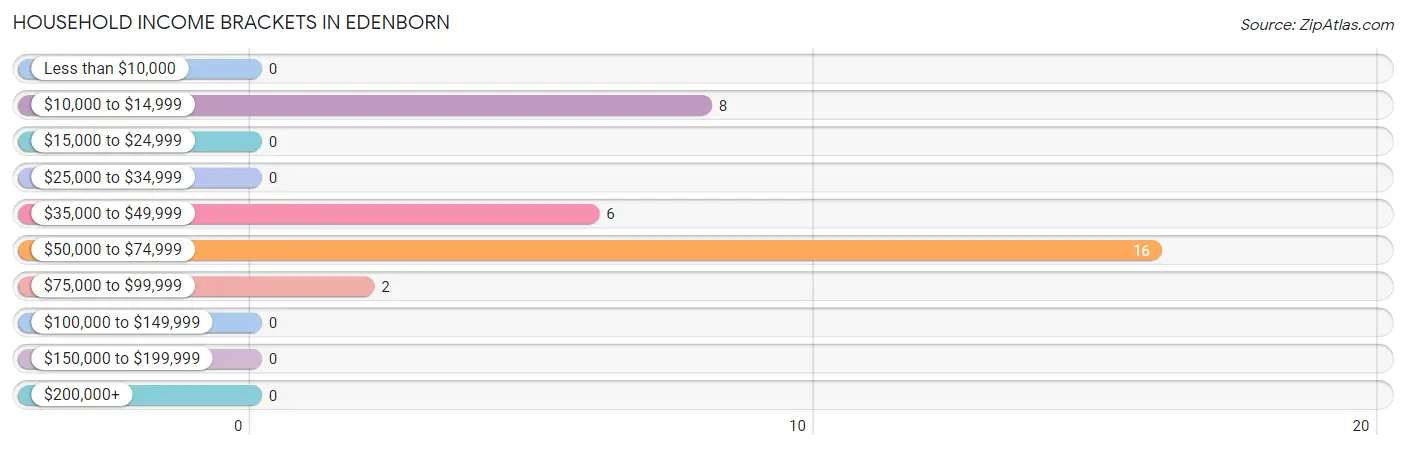
Household Income Brackets in Edenborn
With 16 households falling in the category, the $50,000 to $74,999 income range is the most frequent in Edenborn, accounting for 50.0% of all households.
| Income Bracket | # Households | % Households |
| Less than $10,000 | 0 | 0.0% |
| $10,000 to $14,999 | 8 | 25.0% |
| $15,000 to $24,999 | 0 | 0.0% |
| $25,000 to $34,999 | 0 | 0.0% |
| $35,000 to $49,999 | 6 | 18.8% |
| $50,000 to $74,999 | 16 | 50.0% |
| $75,000 to $99,999 | 2 | 6.3% |
| $100,000 to $149,999 | 0 | 0.0% |
| $150,000 to $199,999 | 0 | 0.0% |
| $200,000+ | 0 | 0.0% |
Household Income by Householder Age in Edenborn
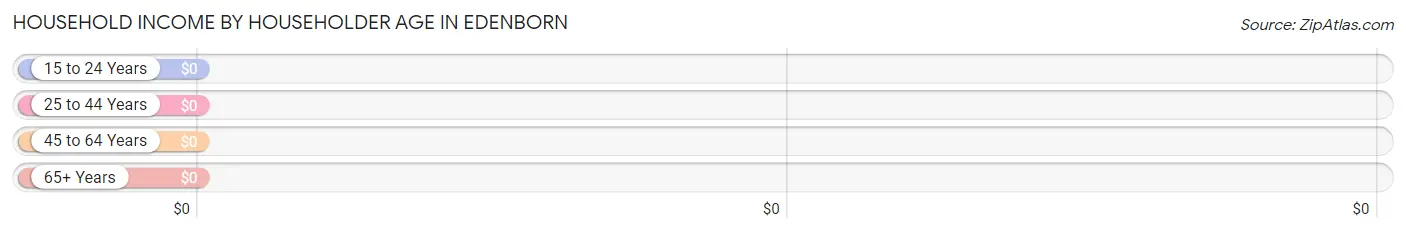
| Income Bracket | # Households | Median Income |
| 15 to 24 Years | 0 (0.0%) | $0 |
| 25 to 44 Years | 16 (50.0%) | $0 |
| 45 to 64 Years | 8 (25.0%) | $0 |
| 65+ Years | 8 (25.0%) | $0 |
| Total | 32 (100.0%) | $55,313 |
Poverty in Edenborn
Income Below Poverty by Sex and Age in Edenborn
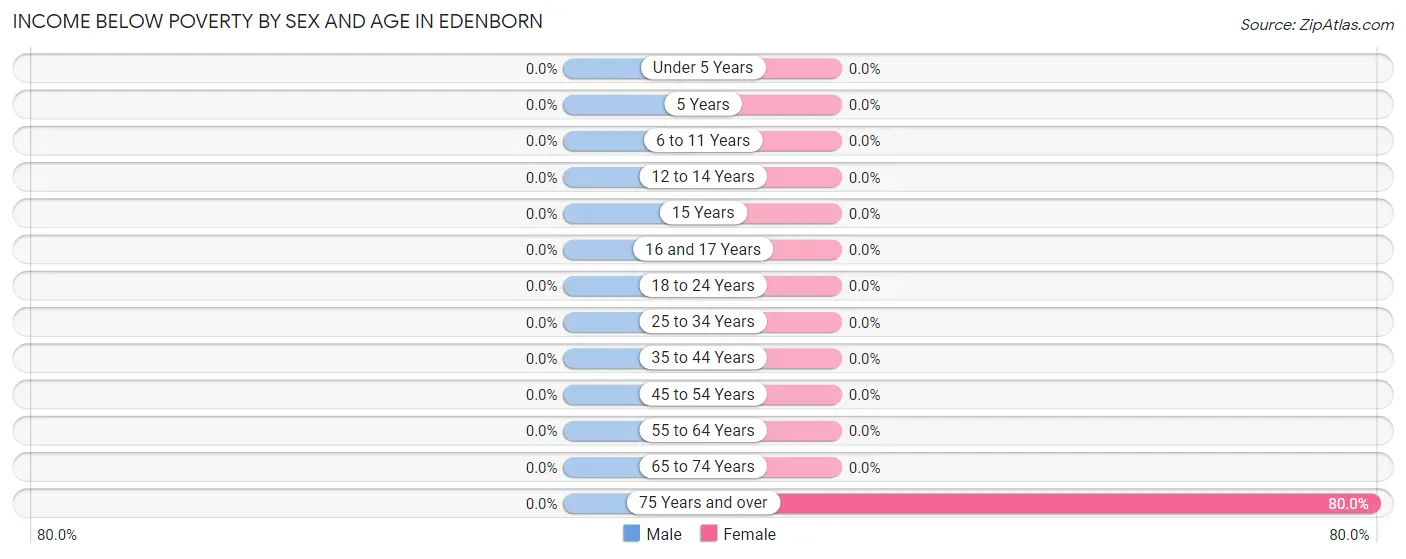
| Age Bracket | Male | Female |
| Under 5 Years | 0 (0.0%) | 0 (0.0%) |
| 5 Years | 0 (0.0%) | 0 (0.0%) |
| 6 to 11 Years | 0 (0.0%) | 0 (0.0%) |
| 12 to 14 Years | 0 (0.0%) | 0 (0.0%) |
| 15 Years | 0 (0.0%) | 0 (0.0%) |
| 16 and 17 Years | 0 (0.0%) | 0 (0.0%) |
| 18 to 24 Years | 0 (0.0%) | 0 (0.0%) |
| 25 to 34 Years | 0 (0.0%) | 0 (0.0%) |
| 35 to 44 Years | 0 (0.0%) | 0 (0.0%) |
| 45 to 54 Years | 0 (0.0%) | 0 (0.0%) |
| 55 to 64 Years | 0 (0.0%) | 0 (0.0%) |
| 65 to 74 Years | 0 (0.0%) | 0 (0.0%) |
| 75 Years and over | 0 (0.0%) | 8 (80.0%) |
| Total | 0 (0.0%) | 8 (10.1%) |
Income Above Poverty by Sex and Age in Edenborn
According to the poverty statistics in Edenborn, males aged 6 to 11 years and females aged 6 to 11 years are the age groups that are most secure financially, with 100.0% of males and 100.0% of females in these age groups living above the poverty line.
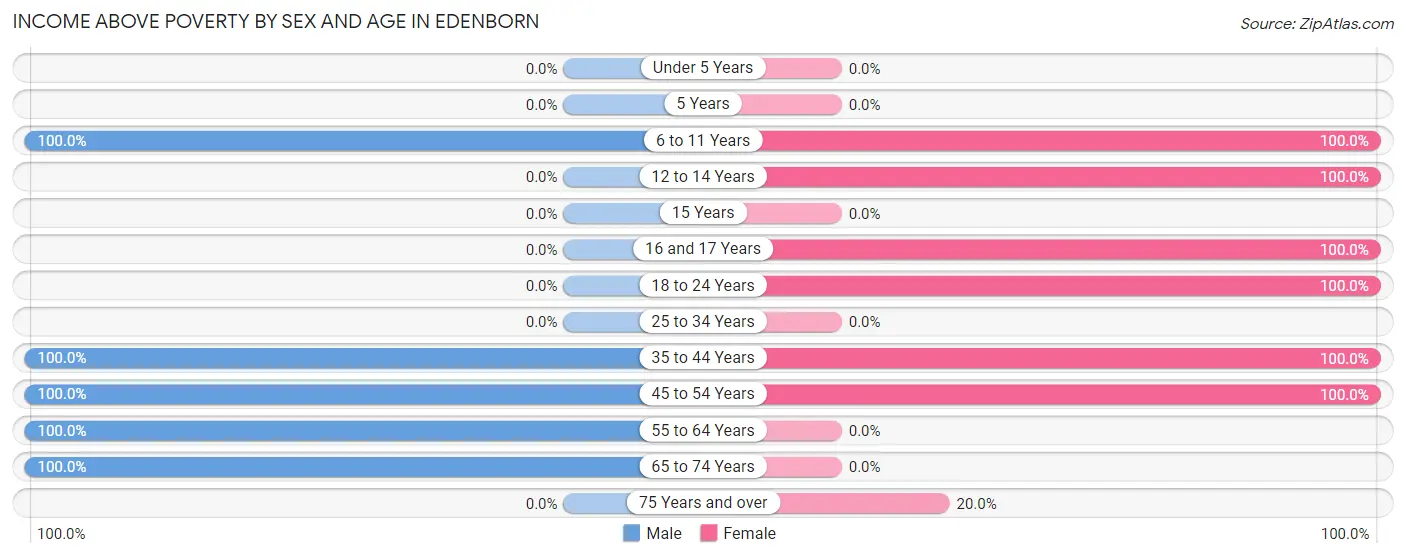
| Age Bracket | Male | Female |
| Under 5 Years | 0 (0.0%) | 0 (0.0%) |
| 5 Years | 0 (0.0%) | 0 (0.0%) |
| 6 to 11 Years | 15 (100.0%) | 16 (100.0%) |
| 12 to 14 Years | 0 (0.0%) | 16 (100.0%) |
| 15 Years | 0 (0.0%) | 0 (0.0%) |
| 16 and 17 Years | 0 (0.0%) | 8 (100.0%) |
| 18 to 24 Years | 0 (0.0%) | 7 (100.0%) |
| 25 to 34 Years | 0 (0.0%) | 0 (0.0%) |
| 35 to 44 Years | 16 (100.0%) | 16 (100.0%) |
| 45 to 54 Years | 3 (100.0%) | 6 (100.0%) |
| 55 to 64 Years | 2 (100.0%) | 0 (0.0%) |
| 65 to 74 Years | 3 (100.0%) | 0 (0.0%) |
| 75 Years and over | 0 (0.0%) | 2 (20.0%) |
| Total | 39 (100.0%) | 71 (89.9%) |
Income Below Poverty Among Married-Couple Families in Edenborn
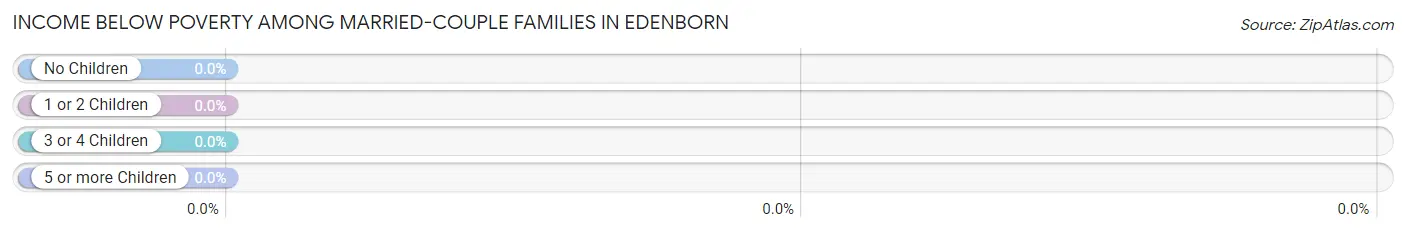
| Children | Above Poverty | Below Poverty |
| No Children | 2 (100.0%) | 0 (0.0%) |
| 1 or 2 Children | 6 (100.0%) | 0 (0.0%) |
| 3 or 4 Children | 16 (100.0%) | 0 (0.0%) |
| 5 or more Children | 0 (0.0%) | 0 (0.0%) |
| Total | 24 (100.0%) | 0 (0.0%) |
Income Below Poverty Among Single-Parent Households in Edenborn
| Children | Single Father | Single Mother |
| No Children | 0 (0.0%) | 0 (0.0%) |
| 1 or 2 Children | 0 (0.0%) | 0 (0.0%) |
| 3 or 4 Children | 0 (0.0%) | 0 (0.0%) |
| 5 or more Children | 0 (0.0%) | 0 (0.0%) |
| Total | 0 (0.0%) | 0 (0.0%) |
Income Below Poverty Among Married-Couple vs Single-Parent Households in Edenborn
| Children | Married-Couple Families | Single-Parent Households |
| No Children | 0 (0.0%) | 0 (0.0%) |
| 1 or 2 Children | 0 (0.0%) | 0 (0.0%) |
| 3 or 4 Children | 0 (0.0%) | 0 (0.0%) |
| 5 or more Children | 0 (0.0%) | 0 (0.0%) |
| Total | 0 (0.0%) | 0 (0.0%) |
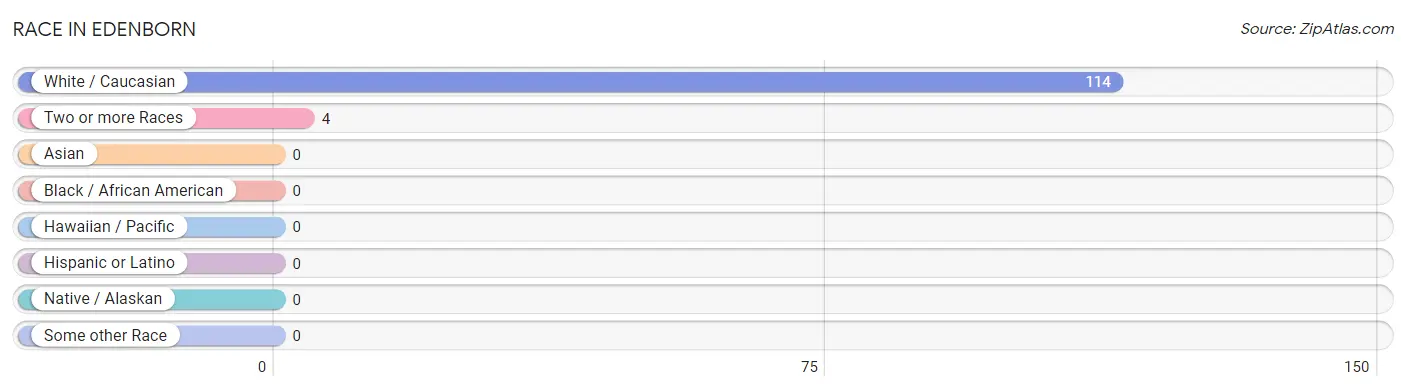
Race in Edenborn
The most populous races in Edenborn are White / Caucasian (114 | 96.6%), and Two or more Races (4 | 3.4%).
| Race | # Population | % Population |
| Asian | 0 | 0.0% |
| Black / African American | 0 | 0.0% |
| Hawaiian / Pacific | 0 | 0.0% |
| Hispanic or Latino | 0 | 0.0% |
| Native / Alaskan | 0 | 0.0% |
| White / Caucasian | 114 | 96.6% |
| Two or more Races | 4 | 3.4% |
| Some other Race | 0 | 0.0% |
| Total | 118 | 100.0% |
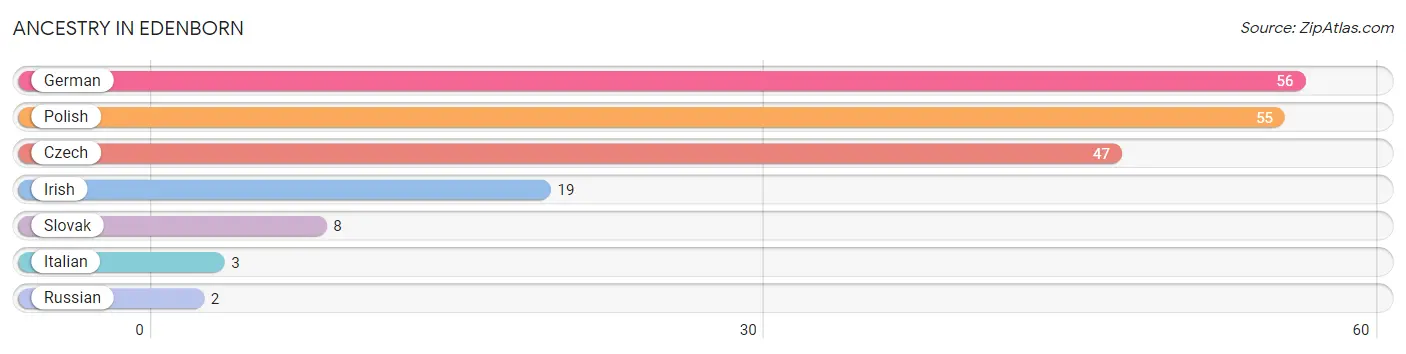
Ancestry in Edenborn
The most populous ancestries reported in Edenborn are German (56 | 47.5%), Polish (55 | 46.6%), Czech (47 | 39.8%), Irish (19 | 16.1%), and Slovak (8 | 6.8%), together accounting for 156.8% of all Edenborn residents.
| Ancestry | # Population | % Population |
| Czech | 47 | 39.8% |
| German | 56 | 47.5% |
| Irish | 19 | 16.1% |
| Italian | 3 | 2.5% |
| Polish | 55 | 46.6% |
| Russian | 2 | 1.7% |
| Slovak | 8 | 6.8% | View All 7 Rows |
Immigrants in Edenborn

| Immigration Origin | # Population | % Population | View All 0 Rows |
Sex and Age in Edenborn
Sex and Age in Edenborn
The most populous age groups in Edenborn are 35 to 39 Years (16 | 41.0%) for men and 10 to 14 Years (32 | 40.5%) for women.
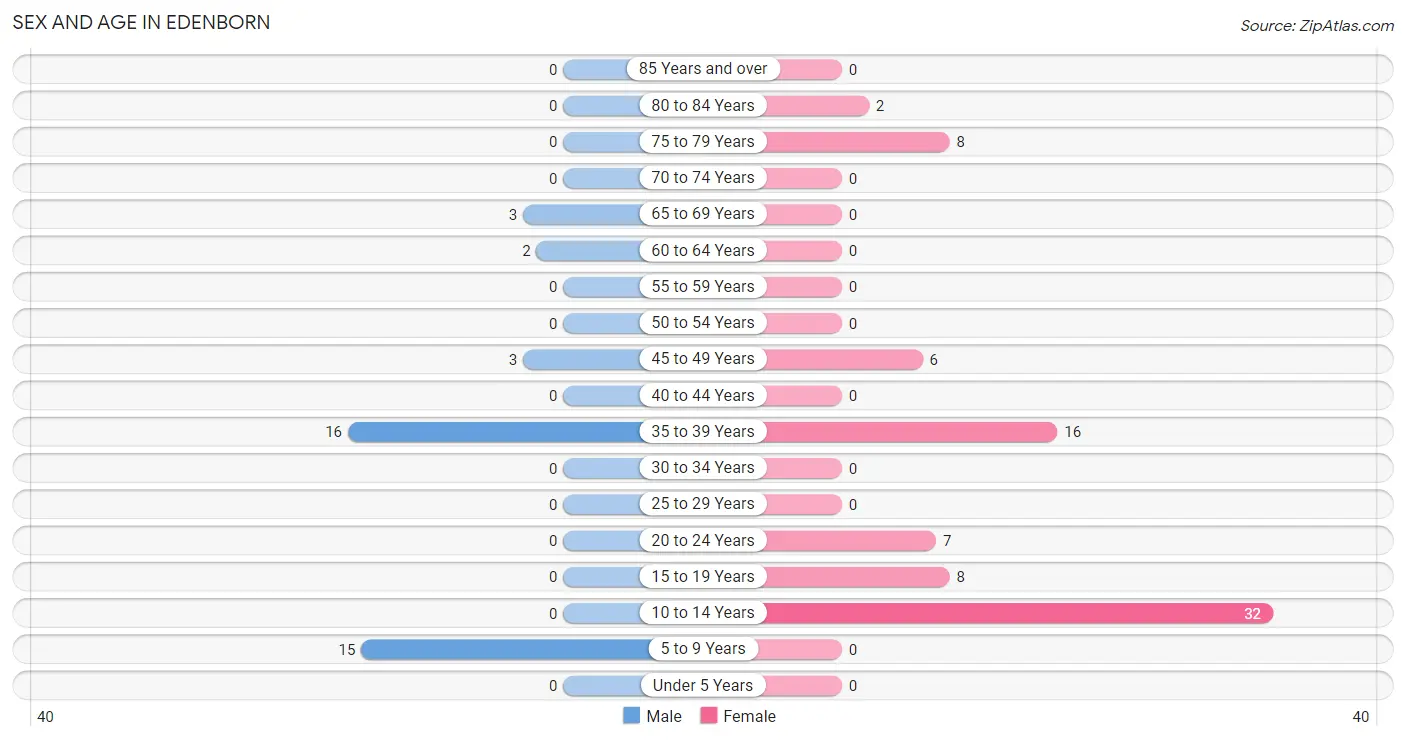
| Age Bracket | Male | Female |
| Under 5 Years | 0 (0.0%) | 0 (0.0%) |
| 5 to 9 Years | 15 (38.5%) | 0 (0.0%) |
| 10 to 14 Years | 0 (0.0%) | 32 (40.5%) |
| 15 to 19 Years | 0 (0.0%) | 8 (10.1%) |
| 20 to 24 Years | 0 (0.0%) | 7 (8.9%) |
| 25 to 29 Years | 0 (0.0%) | 0 (0.0%) |
| 30 to 34 Years | 0 (0.0%) | 0 (0.0%) |
| 35 to 39 Years | 16 (41.0%) | 16 (20.3%) |
| 40 to 44 Years | 0 (0.0%) | 0 (0.0%) |
| 45 to 49 Years | 3 (7.7%) | 6 (7.6%) |
| 50 to 54 Years | 0 (0.0%) | 0 (0.0%) |
| 55 to 59 Years | 0 (0.0%) | 0 (0.0%) |
| 60 to 64 Years | 2 (5.1%) | 0 (0.0%) |
| 65 to 69 Years | 3 (7.7%) | 0 (0.0%) |
| 70 to 74 Years | 0 (0.0%) | 0 (0.0%) |
| 75 to 79 Years | 0 (0.0%) | 8 (10.1%) |
| 80 to 84 Years | 0 (0.0%) | 2 (2.5%) |
| 85 Years and over | 0 (0.0%) | 0 (0.0%) |
| Total | 39 (100.0%) | 79 (100.0%) |
Families and Households in Edenborn
Median Family Size in Edenborn
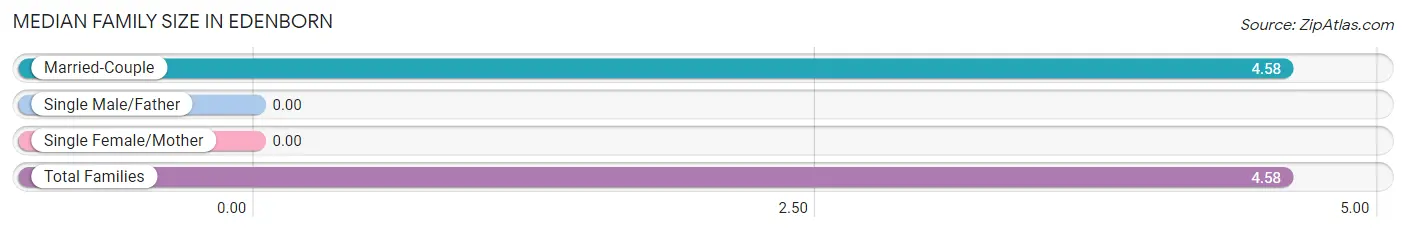
| Family Type | # Families | Family Size |
| Married-Couple | 24 (100.0%) | 4.58 |
| Single Male/Father | 0 (0.0%) | - |
| Single Female/Mother | 0 (0.0%) | - |
| Total Families | 24 (100.0%) | 4.58 |
Median Household Size in Edenborn
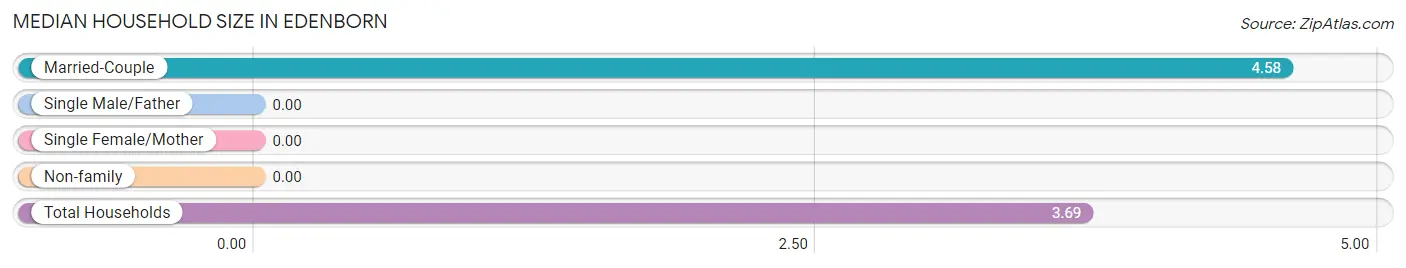
| Household Type | # Households | Household Size |
| Married-Couple | 24 (75.0%) | 4.58 |
| Single Male/Father | 0 (0.0%) | - |
| Single Female/Mother | 0 (0.0%) | - |
| Non-family | 8 (25.0%) | - |
| Total Households | 32 (100.0%) | 3.69 |
Household Size by Marriage Status in Edenborn
Out of a total of 32 households in Edenborn, 24 (75.0%) are family households, while 8 (25.0%) are nonfamily households. The most numerous type of family households are 5-person households, comprising 16, and the most common type of nonfamily households are 1-person households, comprising 8.
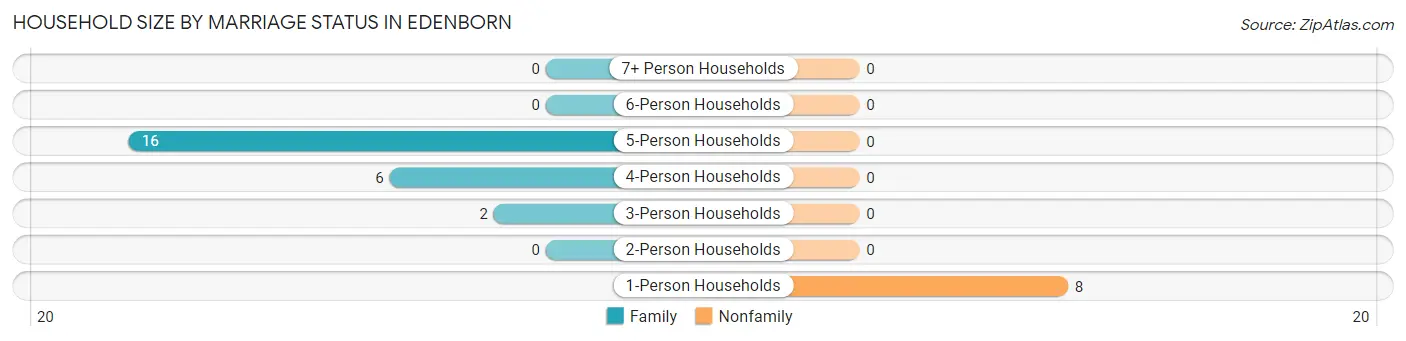
| Household Size | Family Households | Nonfamily Households |
| 1-Person Households | - | 8 (25.0%) |
| 2-Person Households | 0 (0.0%) | 0 (0.0%) |
| 3-Person Households | 2 (6.2%) | 0 (0.0%) |
| 4-Person Households | 6 (18.8%) | 0 (0.0%) |
| 5-Person Households | 16 (50.0%) | 0 (0.0%) |
| 6-Person Households | 0 (0.0%) | 0 (0.0%) |
| 7+ Person Households | 0 (0.0%) | 0 (0.0%) |
| Total | 24 (75.0%) | 8 (25.0%) |
Female Fertility in Edenborn
Fertility by Age in Edenborn
| Age Bracket | Women with Births | Births / 1,000 Women |
| 15 to 19 years | 0 (0.0%) | 0.0 |
| 20 to 34 years | 0 (0.0%) | 0.0 |
| 35 to 50 years | 0 (0.0%) | 0.0 |
| Total | 0 (0.0%) | 0.0 |
Fertility by Age by Marriage Status in Edenborn
| Age Bracket | Married | Unmarried |
| 15 to 19 years | 0 (0.0%) | 0 (0.0%) |
| 20 to 34 years | 0 (0.0%) | 0 (0.0%) |
| 35 to 50 years | 0 (0.0%) | 0 (0.0%) |
| Total | 0 (0.0%) | 0 (0.0%) |
Fertility by Education in Edenborn
| Educational Attainment | Women with Births | Births / 1,000 Women |
| Less than High School | 0 (0.0%) | 0.0 |
| High School Diploma | 0 (0.0%) | 0.0 |
| College or Associate's Degree | 0 (0.0%) | 0.0 |
| Bachelor's Degree | 0 (0.0%) | 0.0 |
| Graduate Degree | 0 (0.0%) | 0.0 |
| Total | 0 (0.0%) | 0.0 |
Fertility by Education by Marriage Status in Edenborn
| Educational Attainment | Married | Unmarried |
| Less than High School | 0 (0.0%) | 0 (0.0%) |
| High School Diploma | 0 (0.0%) | 0 (0.0%) |
| College or Associate's Degree | 0 (0.0%) | 0 (0.0%) |
| Bachelor's Degree | 0 (0.0%) | 0 (0.0%) |
| Graduate Degree | 0 (0.0%) | 0 (0.0%) |
| Total | 0 (0.0%) | 0 (0.0%) |
Employment Characteristics in Edenborn
Employment by Class of Employer in Edenborn
Among the 42 employed individuals in Edenborn, private company employees (26 | 61.9%), and local government employees (16 | 38.1%) make up the most common classes of employment.
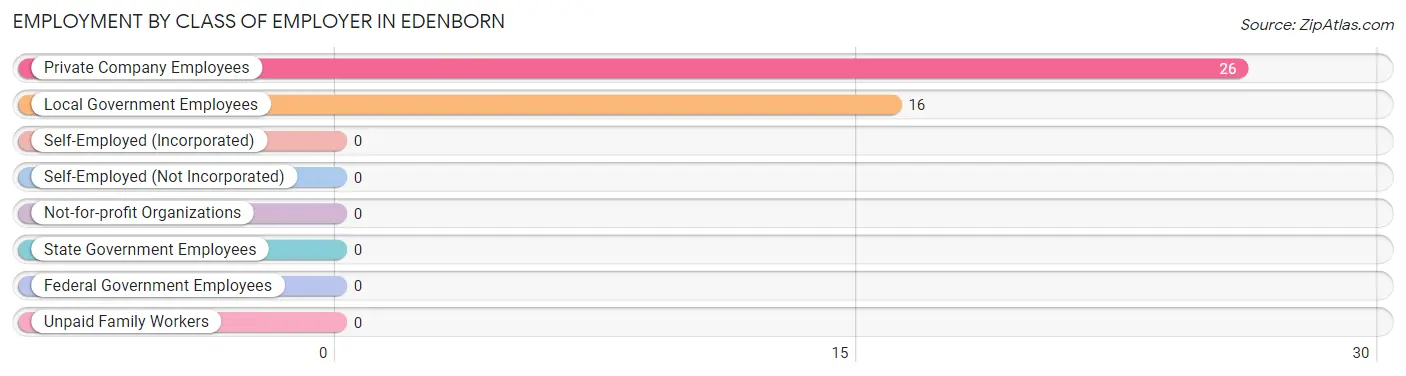
| Employer Class | # Employees | % Employees |
| Private Company Employees | 26 | 61.9% |
| Self-Employed (Incorporated) | 0 | 0.0% |
| Self-Employed (Not Incorporated) | 0 | 0.0% |
| Not-for-profit Organizations | 0 | 0.0% |
| Local Government Employees | 16 | 38.1% |
| State Government Employees | 0 | 0.0% |
| Federal Government Employees | 0 | 0.0% |
| Unpaid Family Workers | 0 | 0.0% |
| Total | 42 | 100.0% |
Employment Status by Age in Edenborn
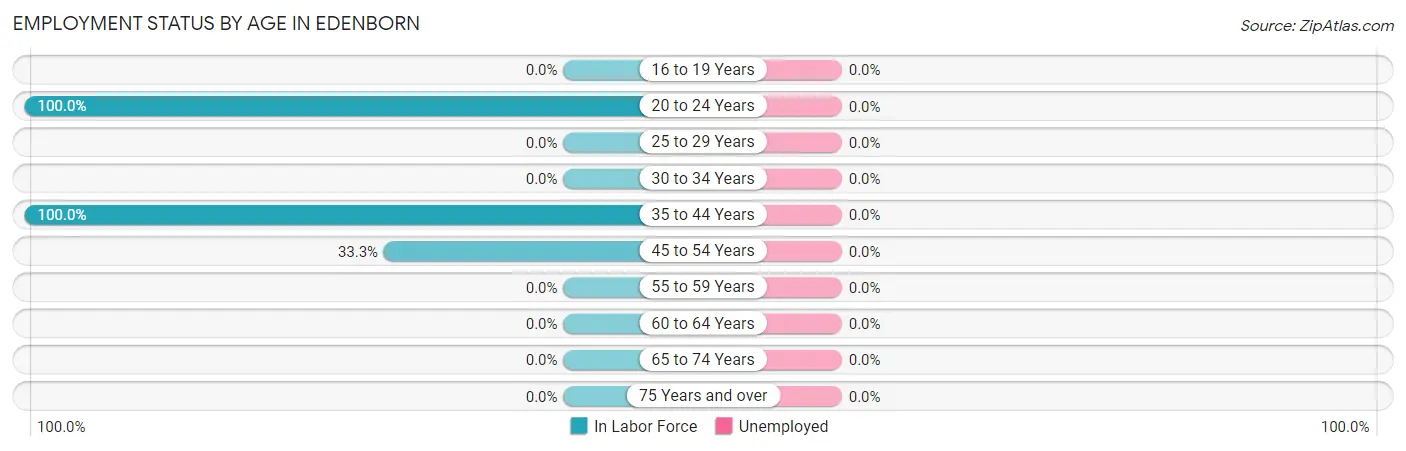
| Age Bracket | In Labor Force | Unemployed |
| 16 to 19 Years | 0 (0.0%) | 0 (0.0%) |
| 20 to 24 Years | 7 (100.0%) | 0 (0.0%) |
| 25 to 29 Years | 0 (0.0%) | 0 (0.0%) |
| 30 to 34 Years | 0 (0.0%) | 0 (0.0%) |
| 35 to 44 Years | 32 (100.0%) | 0 (0.0%) |
| 45 to 54 Years | 3 (33.3%) | 0 (0.0%) |
| 55 to 59 Years | 0 (0.0%) | 0 (0.0%) |
| 60 to 64 Years | 0 (0.0%) | 0 (0.0%) |
| 65 to 74 Years | 0 (0.0%) | 0 (0.0%) |
| 75 Years and over | 0 (0.0%) | 0 (0.0%) |
| Total | 42 (59.2%) | 0 (0.0%) |
Employment Status by Educational Attainment in Edenborn
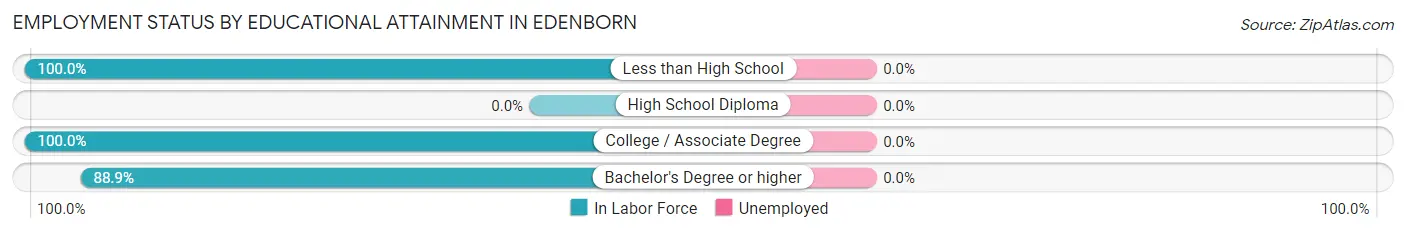
| Educational Attainment | In Labor Force | Unemployed |
| Less than High School | 16 (100.0%) | 0 (0.0%) |
| High School Diploma | 0 (0.0%) | 0 (0.0%) |
| College / Associate Degree | 3 (100.0%) | 0 (0.0%) |
| Bachelor's Degree or higher | 16 (88.9%) | 0 (0.0%) |
| Total | 35 (81.4%) | 0 (0.0%) |
Employment Occupations by Sex in Edenborn
Management, Business, Science and Arts Occupations
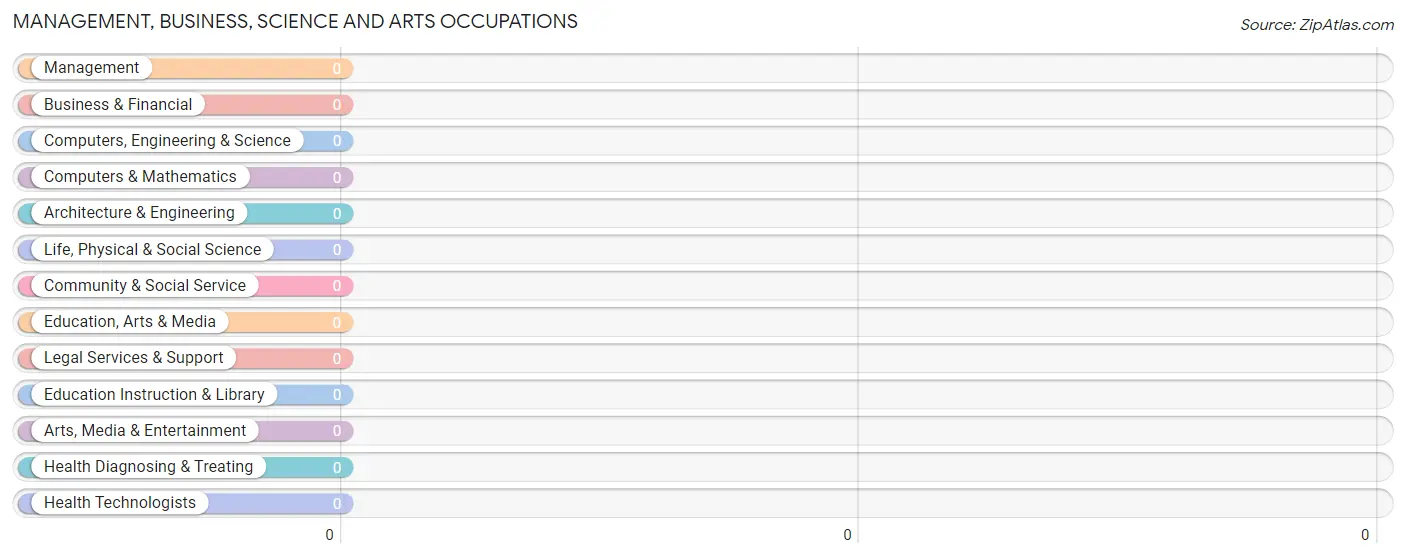
Management, Business, Science and Arts Occupations by Sex
| Occupation | Male | Female |
| Management | 0 (0.0%) | 0 (0.0%) |
| Business & Financial | 0 (0.0%) | 0 (0.0%) |
| Computers, Engineering & Science | 0 (0.0%) | 0 (0.0%) |
| Computers & Mathematics | 0 (0.0%) | 0 (0.0%) |
| Architecture & Engineering | 0 (0.0%) | 0 (0.0%) |
| Life, Physical & Social Science | 0 (0.0%) | 0 (0.0%) |
| Community & Social Service | 0 (0.0%) | 0 (0.0%) |
| Education, Arts & Media | 0 (0.0%) | 0 (0.0%) |
| Legal Services & Support | 0 (0.0%) | 0 (0.0%) |
| Education Instruction & Library | 0 (0.0%) | 0 (0.0%) |
| Arts, Media & Entertainment | 0 (0.0%) | 0 (0.0%) |
| Health Diagnosing & Treating | 0 (0.0%) | 0 (0.0%) |
| Health Technologists | 0 (0.0%) | 0 (0.0%) |
| Total (Category) | 0 (0.0%) | 0 (0.0%) |
| Total (Overall) | 19 (45.2%) | 23 (54.8%) |
Services Occupations
Services Occupations by Sex
| Occupation | Male | Female |
| Healthcare Support | 0 (0.0%) | 0 (0.0%) |
| Security & Protection | 0 (0.0%) | 0 (0.0%) |
| Firefighting & Prevention | 0 (0.0%) | 0 (0.0%) |
| Law Enforcement | 0 (0.0%) | 0 (0.0%) |
| Food Preparation & Serving | 0 (0.0%) | 0 (0.0%) |
| Cleaning & Maintenance | 0 (0.0%) | 0 (0.0%) |
| Personal Care & Service | 0 (0.0%) | 0 (0.0%) |
| Total (Category) | 0 (0.0%) | 0 (0.0%) |
| Total (Overall) | 19 (45.2%) | 23 (54.8%) |
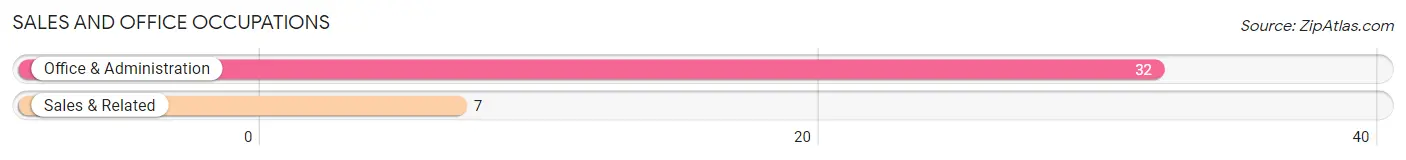
Sales and Office Occupations
The most common Sales and Office occupations in Edenborn are Office & Administration (32 | 76.2%), and Sales & Related (7 | 16.7%).
Sales and Office Occupations by Sex
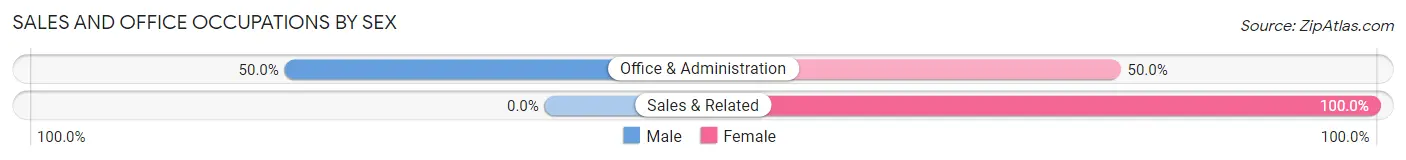
| Occupation | Male | Female |
| Sales & Related | 0 (0.0%) | 7 (100.0%) |
| Office & Administration | 16 (50.0%) | 16 (50.0%) |
| Total (Category) | 16 (41.0%) | 23 (59.0%) |
| Total (Overall) | 19 (45.2%) | 23 (54.8%) |
Natural Resources, Construction and Maintenance Occupations
The most common Natural Resources, Construction and Maintenance occupations in Edenborn are , and Construction & Extraction (3 | 7.1%).
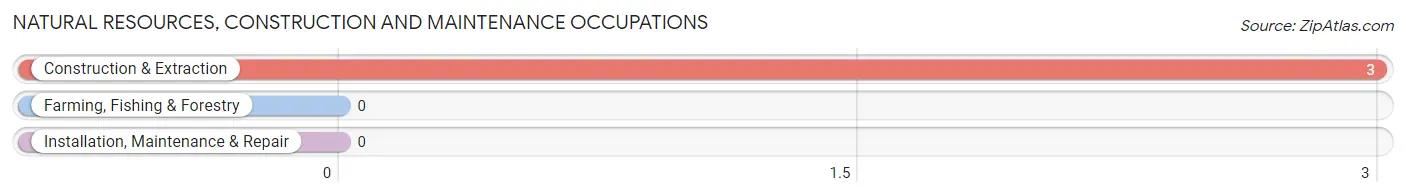
Natural Resources, Construction and Maintenance Occupations by Sex
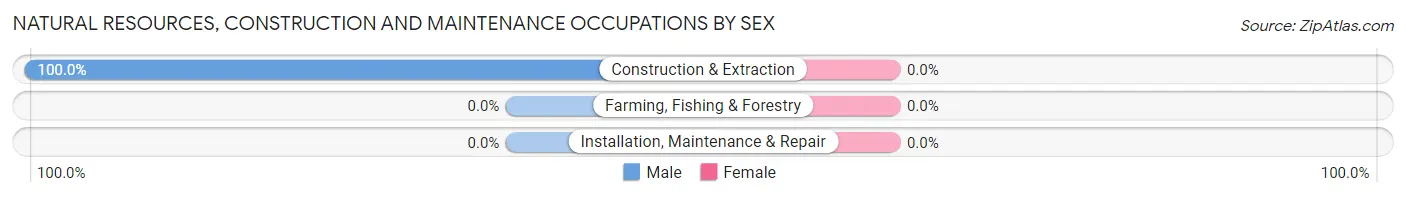
| Occupation | Male | Female |
| Farming, Fishing & Forestry | 0 (0.0%) | 0 (0.0%) |
| Construction & Extraction | 3 (100.0%) | 0 (0.0%) |
| Installation, Maintenance & Repair | 0 (0.0%) | 0 (0.0%) |
| Total (Category) | 3 (100.0%) | 0 (0.0%) |
| Total (Overall) | 19 (45.2%) | 23 (54.8%) |
Production, Transportation and Moving Occupations
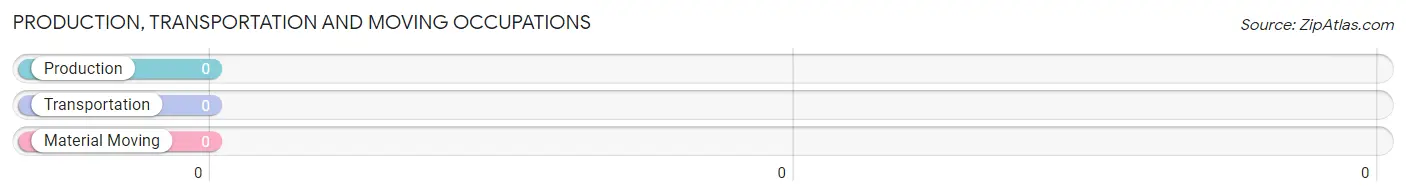
Production, Transportation and Moving Occupations by Sex
| Occupation | Male | Female |
| Production | 0 (0.0%) | 0 (0.0%) |
| Transportation | 0 (0.0%) | 0 (0.0%) |
| Material Moving | 0 (0.0%) | 0 (0.0%) |
| Total (Category) | 0 (0.0%) | 0 (0.0%) |
| Total (Overall) | 19 (45.2%) | 23 (54.8%) |
Employment Industries by Sex in Edenborn
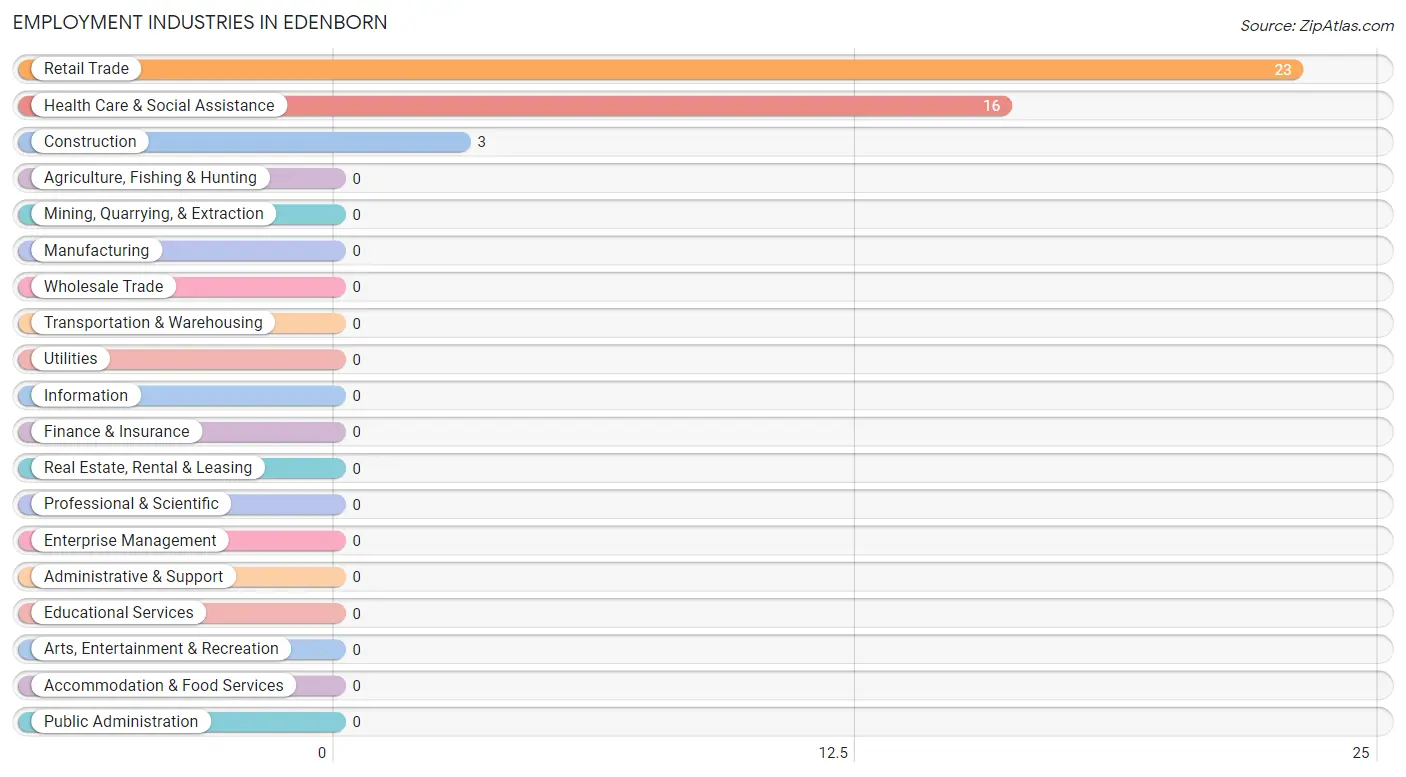
Employment Industries in Edenborn
The major employment industries in Edenborn include Retail Trade (23 | 54.8%), Health Care & Social Assistance (16 | 38.1%), and Construction (3 | 7.1%).
Employment Industries by Sex in Edenborn
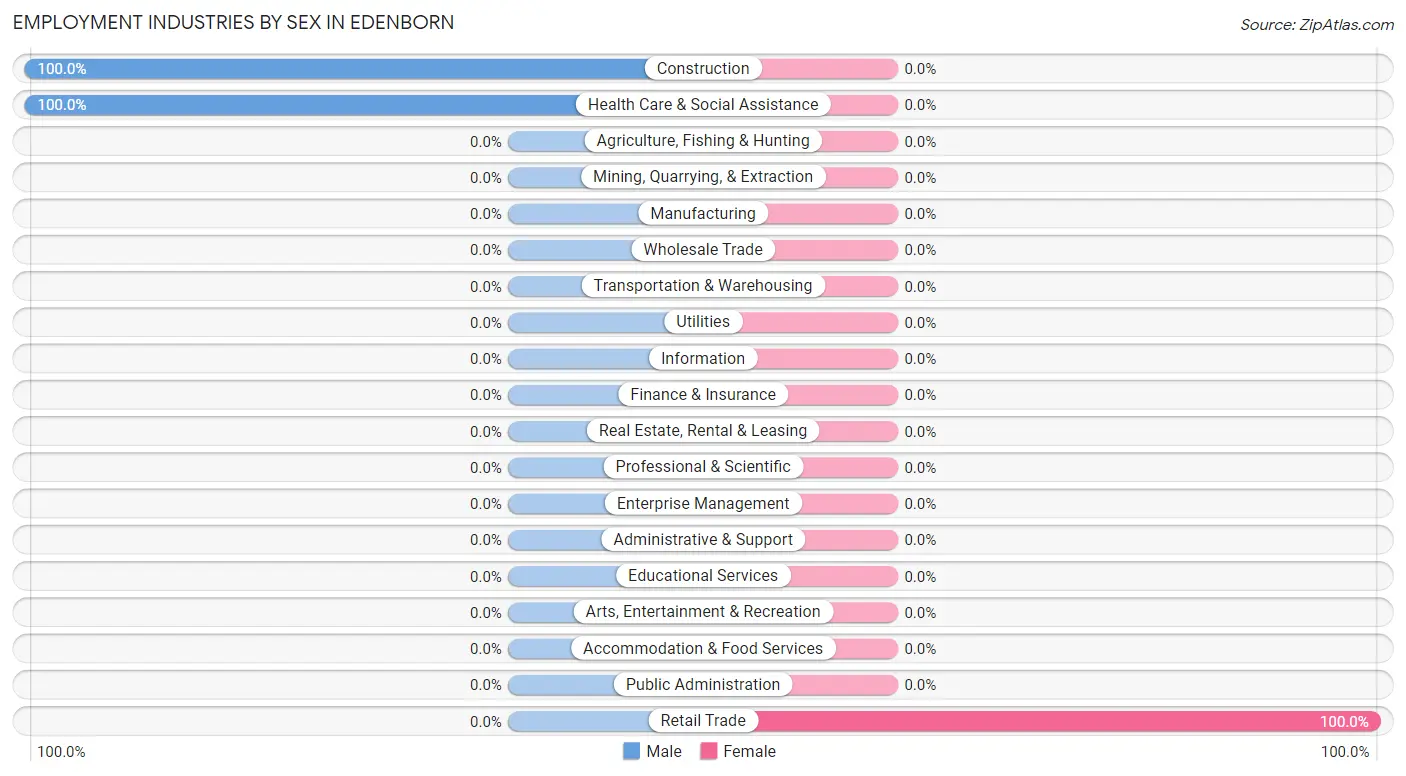
| Industry | Male | Female |
| Agriculture, Fishing & Hunting | 0 (0.0%) | 0 (0.0%) |
| Mining, Quarrying, & Extraction | 0 (0.0%) | 0 (0.0%) |
| Construction | 3 (100.0%) | 0 (0.0%) |
| Manufacturing | 0 (0.0%) | 0 (0.0%) |
| Wholesale Trade | 0 (0.0%) | 0 (0.0%) |
| Retail Trade | 0 (0.0%) | 23 (100.0%) |
| Transportation & Warehousing | 0 (0.0%) | 0 (0.0%) |
| Utilities | 0 (0.0%) | 0 (0.0%) |
| Information | 0 (0.0%) | 0 (0.0%) |
| Finance & Insurance | 0 (0.0%) | 0 (0.0%) |
| Real Estate, Rental & Leasing | 0 (0.0%) | 0 (0.0%) |
| Professional & Scientific | 0 (0.0%) | 0 (0.0%) |
| Enterprise Management | 0 (0.0%) | 0 (0.0%) |
| Administrative & Support | 0 (0.0%) | 0 (0.0%) |
| Educational Services | 0 (0.0%) | 0 (0.0%) |
| Health Care & Social Assistance | 16 (100.0%) | 0 (0.0%) |
| Arts, Entertainment & Recreation | 0 (0.0%) | 0 (0.0%) |
| Accommodation & Food Services | 0 (0.0%) | 0 (0.0%) |
| Public Administration | 0 (0.0%) | 0 (0.0%) |
| Total | 19 (45.2%) | 23 (54.8%) |
Education in Edenborn
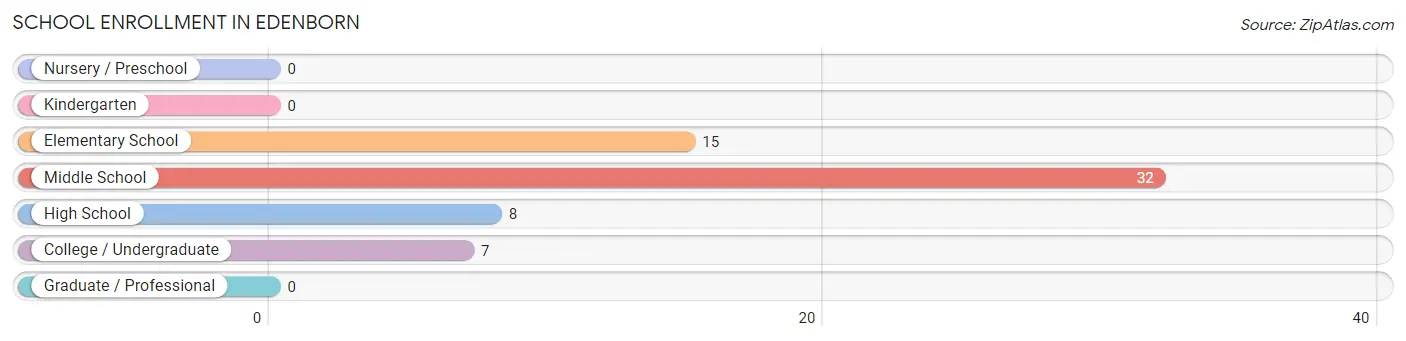
School Enrollment in Edenborn
The most common levels of schooling among the 62 students in Edenborn are middle school (32 | 51.6%), elementary school (15 | 24.2%), and high school (8 | 12.9%).
| School Level | # Students | % Students |
| Nursery / Preschool | 0 | 0.0% |
| Kindergarten | 0 | 0.0% |
| Elementary School | 15 | 24.2% |
| Middle School | 32 | 51.6% |
| High School | 8 | 12.9% |
| College / Undergraduate | 7 | 11.3% |
| Graduate / Professional | 0 | 0.0% |
| Total | 62 | 100.0% |
School Enrollment by Age by Funding Source in Edenborn
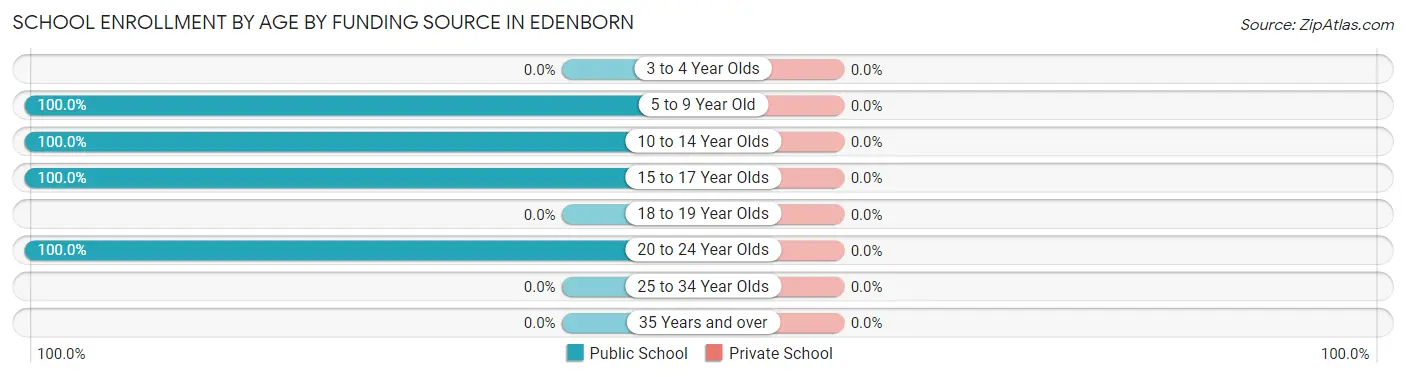
| Age Bracket | Public School | Private School |
| 3 to 4 Year Olds | 0 (0.0%) | 0 (0.0%) |
| 5 to 9 Year Old | 15 (100.0%) | 0 (0.0%) |
| 10 to 14 Year Olds | 32 (100.0%) | 0 (0.0%) |
| 15 to 17 Year Olds | 8 (100.0%) | 0 (0.0%) |
| 18 to 19 Year Olds | 0 (0.0%) | 0 (0.0%) |
| 20 to 24 Year Olds | 7 (100.0%) | 0 (0.0%) |
| 25 to 34 Year Olds | 0 (0.0%) | 0 (0.0%) |
| 35 Years and over | 0 (0.0%) | 0 (0.0%) |
| Total | 62 (100.0%) | 0 (0.0%) |
Educational Attainment by Field of Study in Edenborn
Arts & humanities (16 | 76.2%), education (3 | 14.3%), and visual & performing arts (2 | 9.5%) are the most common fields of study among 21 individuals in Edenborn who have obtained a bachelor's degree or higher.
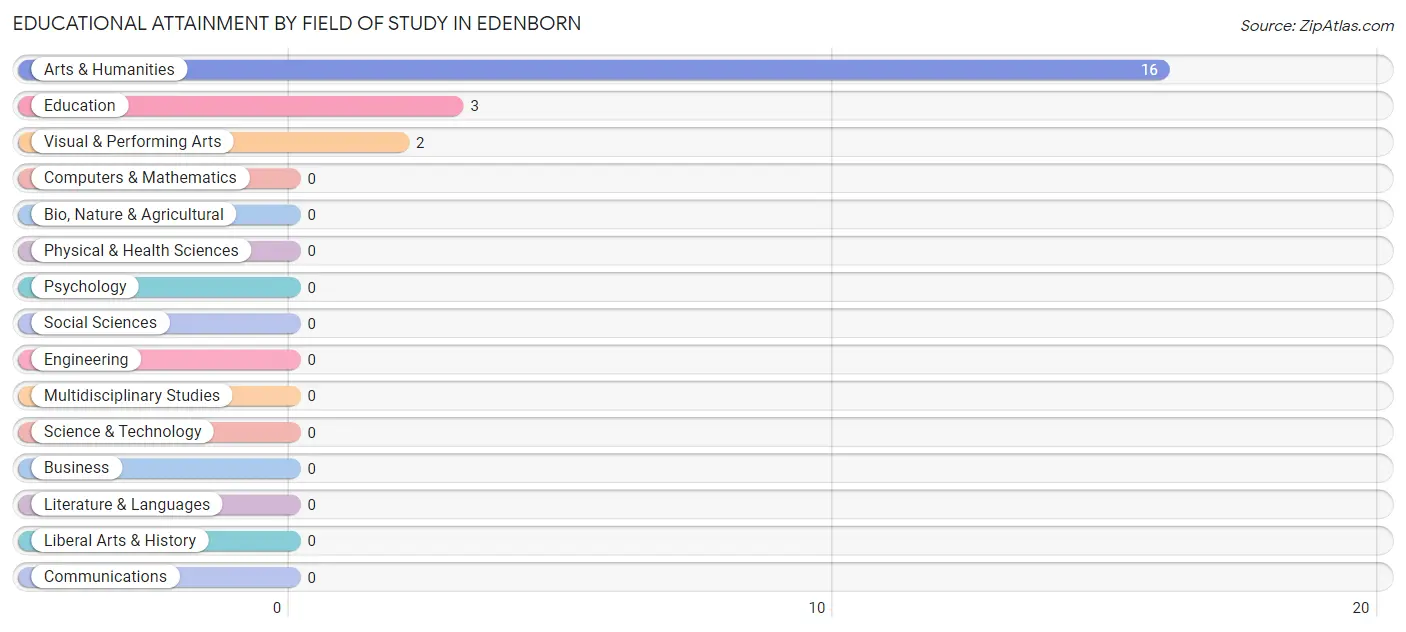
| Field of Study | # Graduates | % Graduates |
| Computers & Mathematics | 0 | 0.0% |
| Bio, Nature & Agricultural | 0 | 0.0% |
| Physical & Health Sciences | 0 | 0.0% |
| Psychology | 0 | 0.0% |
| Social Sciences | 0 | 0.0% |
| Engineering | 0 | 0.0% |
| Multidisciplinary Studies | 0 | 0.0% |
| Science & Technology | 0 | 0.0% |
| Business | 0 | 0.0% |
| Education | 3 | 14.3% |
| Literature & Languages | 0 | 0.0% |
| Liberal Arts & History | 0 | 0.0% |
| Visual & Performing Arts | 2 | 9.5% |
| Communications | 0 | 0.0% |
| Arts & Humanities | 16 | 76.2% |
| Total | 21 | 100.0% |
Transportation & Commute in Edenborn
Vehicle Availability by Sex in Edenborn
The most prevalent vehicle ownership categories in Edenborn are males with 2 vehicles (16, accounting for 84.2%) and females with 2 vehicles (16, making up 69.6%).
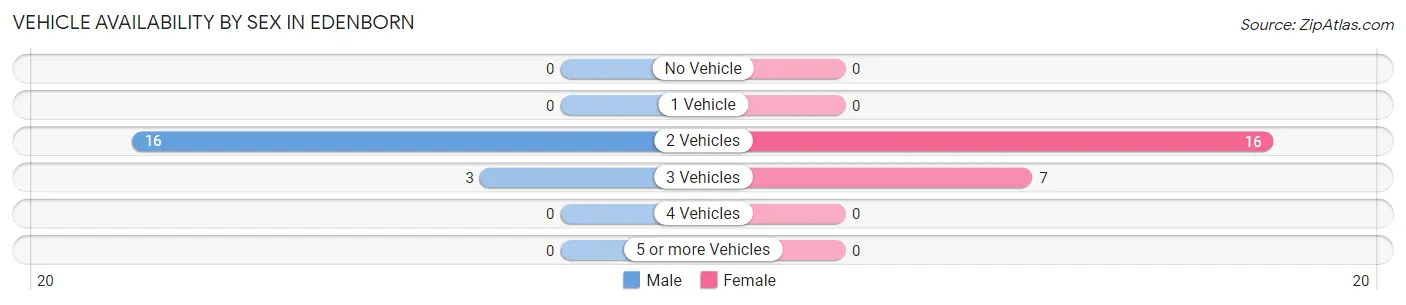
| Vehicles Available | Male | Female |
| No Vehicle | 0 (0.0%) | 0 (0.0%) |
| 1 Vehicle | 0 (0.0%) | 0 (0.0%) |
| 2 Vehicles | 16 (84.2%) | 16 (69.6%) |
| 3 Vehicles | 3 (15.8%) | 7 (30.4%) |
| 4 Vehicles | 0 (0.0%) | 0 (0.0%) |
| 5 or more Vehicles | 0 (0.0%) | 0 (0.0%) |
| Total | 19 (100.0%) | 23 (100.0%) |
Commute Time in Edenborn
The most frequently occuring commute durations in Edenborn are 10 to 14 minutes (16 commuters, 38.1%), 25 to 29 minutes (16 commuters, 38.1%), and 15 to 19 minutes (7 commuters, 16.7%).
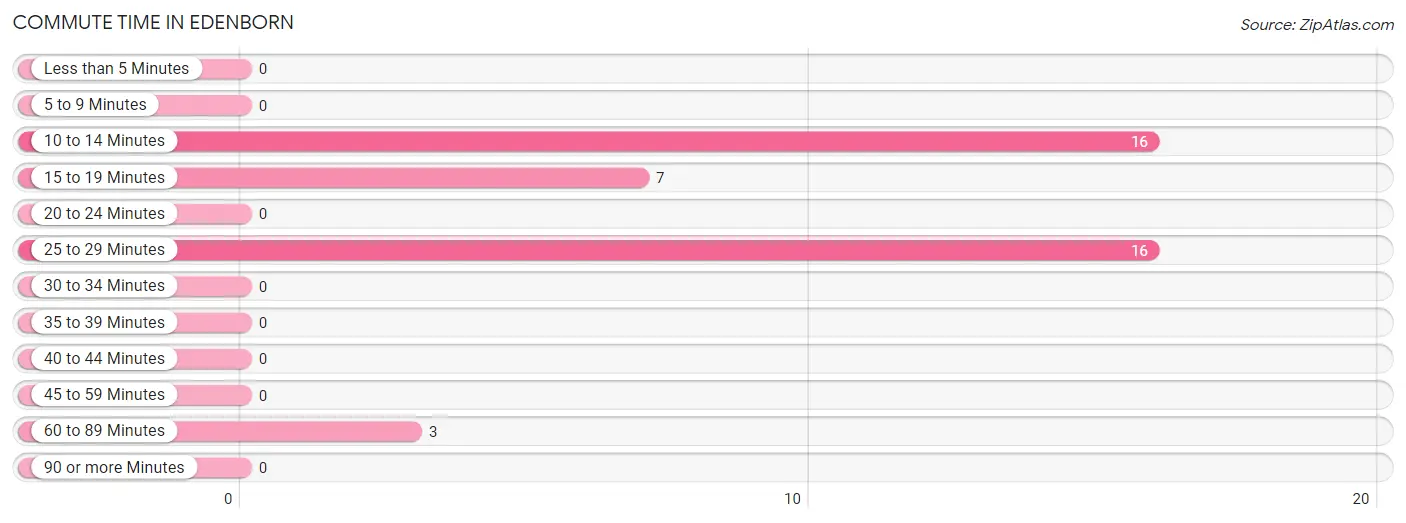
| Commute Time | # Commuters | % Commuters |
| Less than 5 Minutes | 0 | 0.0% |
| 5 to 9 Minutes | 0 | 0.0% |
| 10 to 14 Minutes | 16 | 38.1% |
| 15 to 19 Minutes | 7 | 16.7% |
| 20 to 24 Minutes | 0 | 0.0% |
| 25 to 29 Minutes | 16 | 38.1% |
| 30 to 34 Minutes | 0 | 0.0% |
| 35 to 39 Minutes | 0 | 0.0% |
| 40 to 44 Minutes | 0 | 0.0% |
| 45 to 59 Minutes | 0 | 0.0% |
| 60 to 89 Minutes | 3 | 7.1% |
| 90 or more Minutes | 0 | 0.0% |
Commute Time by Sex in Edenborn
The most common commute times in Edenborn are 25 to 29 minutes (16 commuters, 84.2%) for males and 10 to 14 minutes (16 commuters, 69.6%) for females.
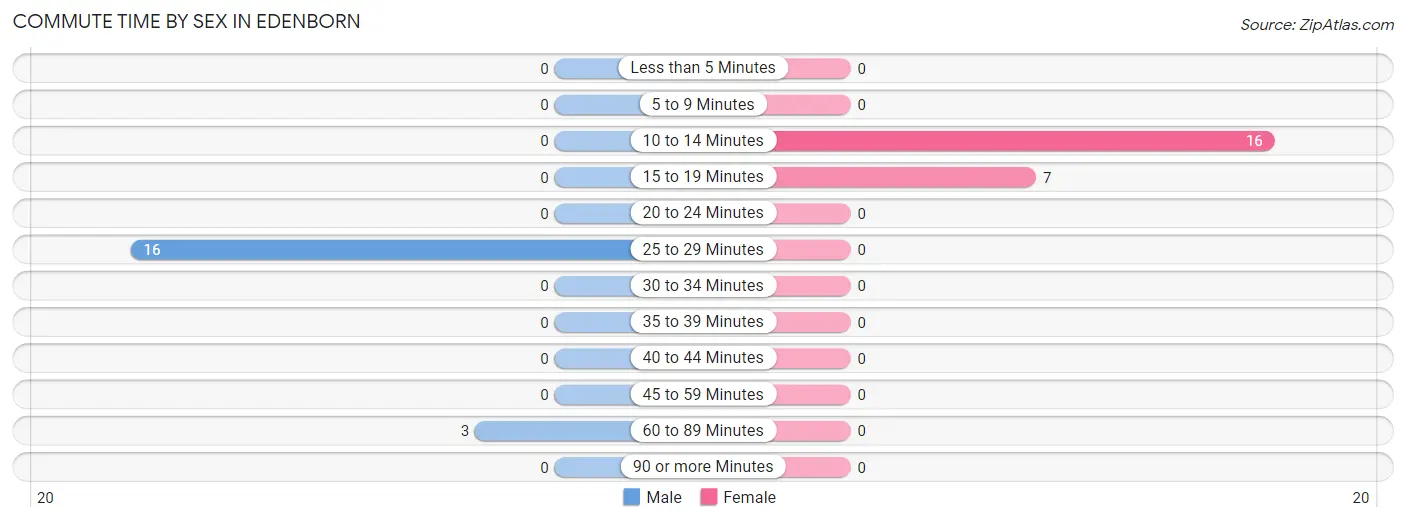
| Commute Time | Male | Female |
| Less than 5 Minutes | 0 (0.0%) | 0 (0.0%) |
| 5 to 9 Minutes | 0 (0.0%) | 0 (0.0%) |
| 10 to 14 Minutes | 0 (0.0%) | 16 (69.6%) |
| 15 to 19 Minutes | 0 (0.0%) | 7 (30.4%) |
| 20 to 24 Minutes | 0 (0.0%) | 0 (0.0%) |
| 25 to 29 Minutes | 16 (84.2%) | 0 (0.0%) |
| 30 to 34 Minutes | 0 (0.0%) | 0 (0.0%) |
| 35 to 39 Minutes | 0 (0.0%) | 0 (0.0%) |
| 40 to 44 Minutes | 0 (0.0%) | 0 (0.0%) |
| 45 to 59 Minutes | 0 (0.0%) | 0 (0.0%) |
| 60 to 89 Minutes | 3 (15.8%) | 0 (0.0%) |
| 90 or more Minutes | 0 (0.0%) | 0 (0.0%) |
Time of Departure to Work by Sex in Edenborn
The most frequent times of departure to work in Edenborn are 7:00 AM to 7:29 AM (16, 84.2%) for males and 4:00 PM to 11:59 PM (23, 100.0%) for females.
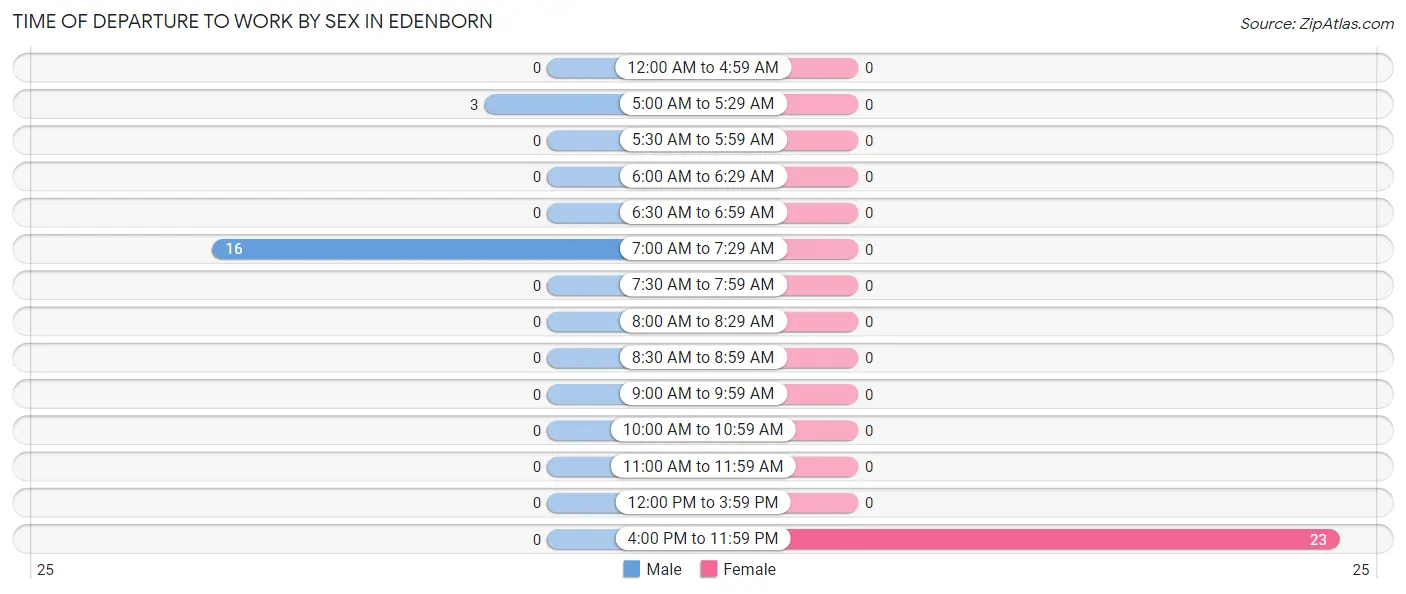
| Time of Departure | Male | Female |
| 12:00 AM to 4:59 AM | 0 (0.0%) | 0 (0.0%) |
| 5:00 AM to 5:29 AM | 3 (15.8%) | 0 (0.0%) |
| 5:30 AM to 5:59 AM | 0 (0.0%) | 0 (0.0%) |
| 6:00 AM to 6:29 AM | 0 (0.0%) | 0 (0.0%) |
| 6:30 AM to 6:59 AM | 0 (0.0%) | 0 (0.0%) |
| 7:00 AM to 7:29 AM | 16 (84.2%) | 0 (0.0%) |
| 7:30 AM to 7:59 AM | 0 (0.0%) | 0 (0.0%) |
| 8:00 AM to 8:29 AM | 0 (0.0%) | 0 (0.0%) |
| 8:30 AM to 8:59 AM | 0 (0.0%) | 0 (0.0%) |
| 9:00 AM to 9:59 AM | 0 (0.0%) | 0 (0.0%) |
| 10:00 AM to 10:59 AM | 0 (0.0%) | 0 (0.0%) |
| 11:00 AM to 11:59 AM | 0 (0.0%) | 0 (0.0%) |
| 12:00 PM to 3:59 PM | 0 (0.0%) | 0 (0.0%) |
| 4:00 PM to 11:59 PM | 0 (0.0%) | 23 (100.0%) |
| Total | 19 (100.0%) | 23 (100.0%) |
Housing Occupancy in Edenborn
Occupancy by Ownership in Edenborn
Of the total 32 dwellings in Edenborn, owner-occupied units account for 32 (100.0%), while renter-occupied units make up 0 (0.0%).
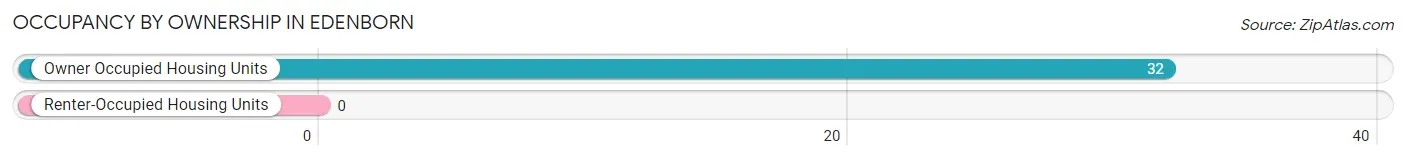
| Occupancy | # Housing Units | % Housing Units |
| Owner Occupied Housing Units | 32 | 100.0% |
| Renter-Occupied Housing Units | 0 | 0.0% |
| Total Occupied Housing Units | 32 | 100.0% |
Occupancy by Household Size in Edenborn
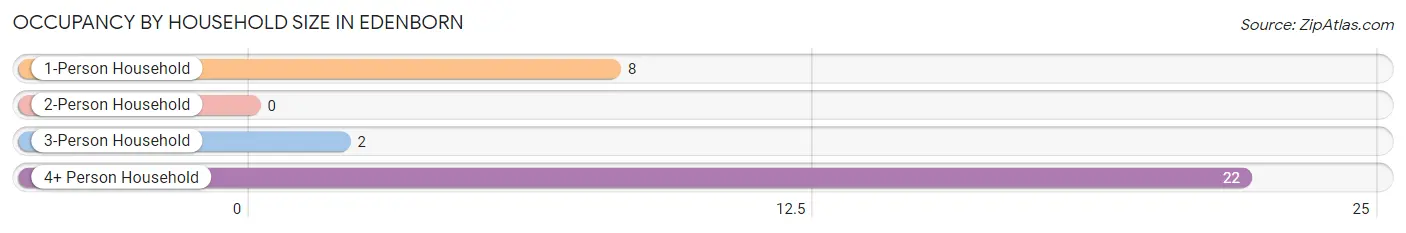
| Household Size | # Housing Units | % Housing Units |
| 1-Person Household | 8 | 25.0% |
| 2-Person Household | 0 | 0.0% |
| 3-Person Household | 2 | 6.2% |
| 4+ Person Household | 22 | 68.8% |
| Total Housing Units | 32 | 100.0% |
Occupancy by Ownership by Household Size in Edenborn
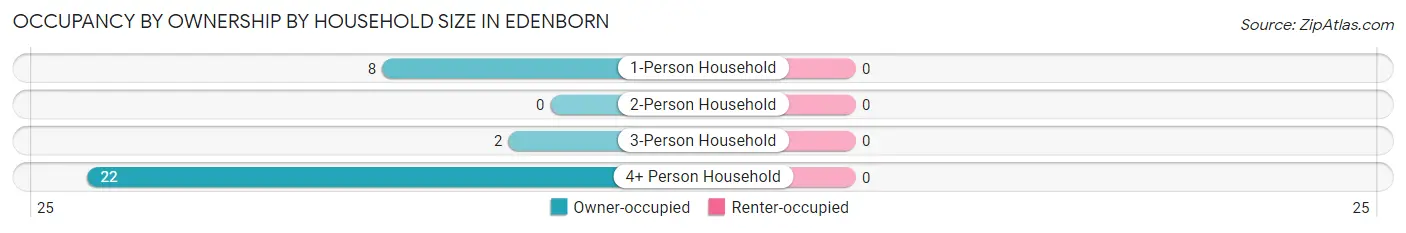
| Household Size | Owner-occupied | Renter-occupied |
| 1-Person Household | 8 (100.0%) | 0 (0.0%) |
| 2-Person Household | 0 (0.0%) | 0 (0.0%) |
| 3-Person Household | 2 (100.0%) | 0 (0.0%) |
| 4+ Person Household | 22 (100.0%) | 0 (0.0%) |
| Total Housing Units | 32 (100.0%) | 0 (0.0%) |
Occupancy by Educational Attainment in Edenborn
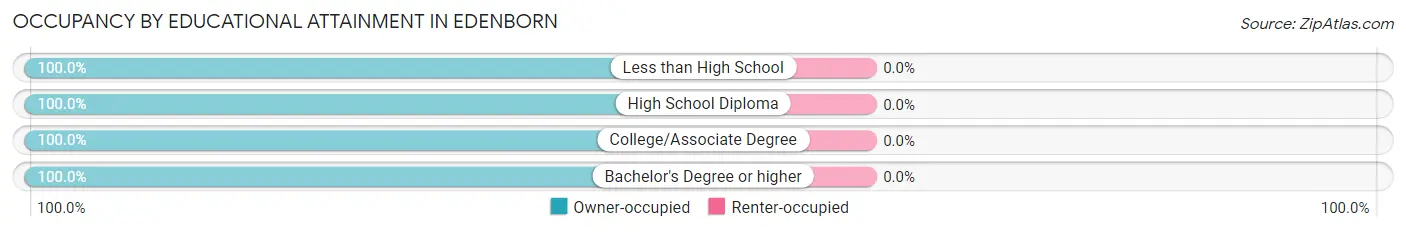
| Household Size | Owner-occupied | Renter-occupied |
| Less than High School | 16 (100.0%) | 0 (0.0%) |
| High School Diploma | 6 (100.0%) | 0 (0.0%) |
| College/Associate Degree | 8 (100.0%) | 0 (0.0%) |
| Bachelor's Degree or higher | 2 (100.0%) | 0 (0.0%) |
Occupancy by Age of Householder in Edenborn
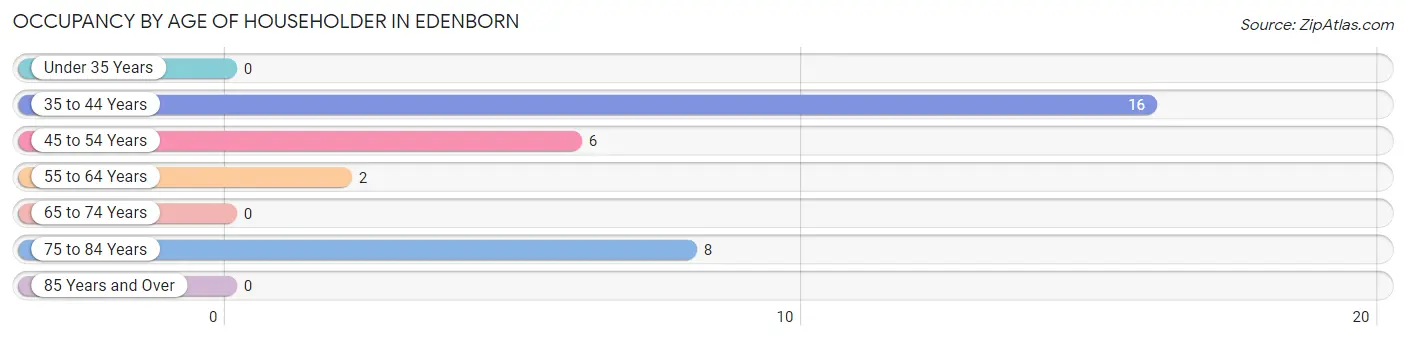
| Age Bracket | # Households | % Households |
| Under 35 Years | 0 | 0.0% |
| 35 to 44 Years | 16 | 50.0% |
| 45 to 54 Years | 6 | 18.8% |
| 55 to 64 Years | 2 | 6.2% |
| 65 to 74 Years | 0 | 0.0% |
| 75 to 84 Years | 8 | 25.0% |
| 85 Years and Over | 0 | 0.0% |
| Total | 32 | 100.0% |
Housing Finances in Edenborn
Median Income by Occupancy in Edenborn
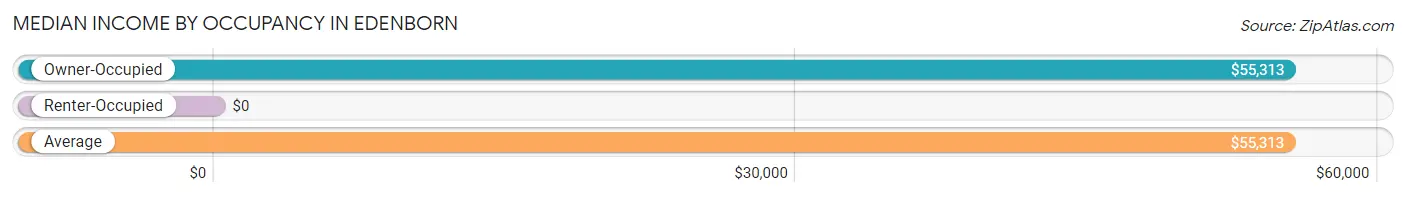
| Occupancy Type | # Households | Median Income |
| Owner-Occupied | 32 (100.0%) | $55,313 |
| Renter-Occupied | 0 (0.0%) | $0 |
| Average | 32 (100.0%) | $55,313 |
Occupancy by Householder Income Bracket in Edenborn
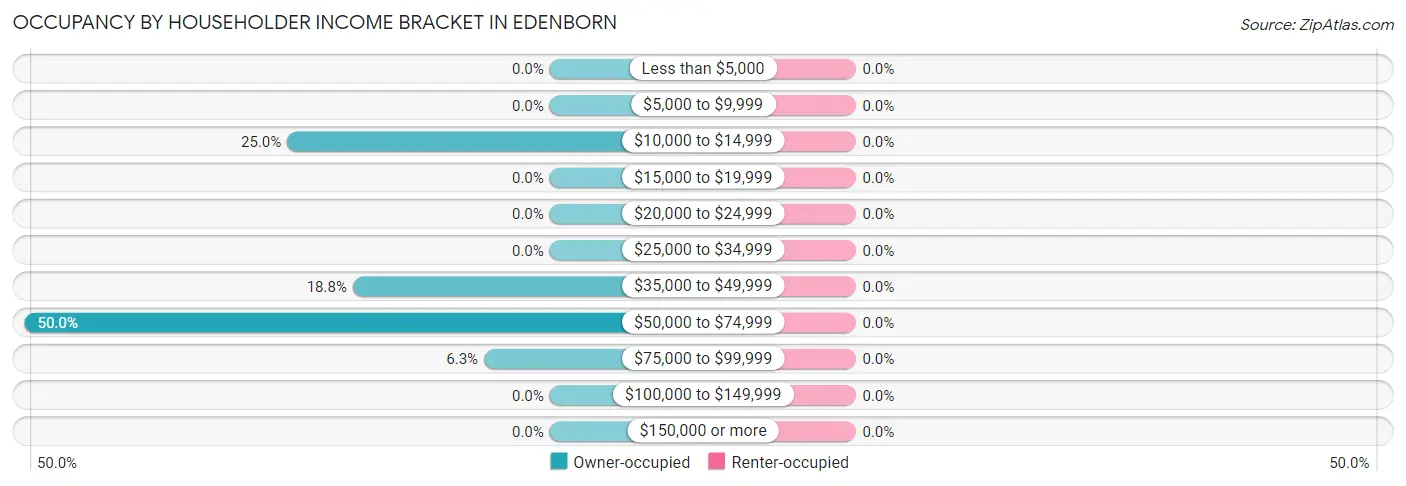
| Income Bracket | Owner-occupied | Renter-occupied |
| Less than $5,000 | 0 (0.0%) | 0 (0.0%) |
| $5,000 to $9,999 | 0 (0.0%) | 0 (0.0%) |
| $10,000 to $14,999 | 8 (25.0%) | 0 (0.0%) |
| $15,000 to $19,999 | 0 (0.0%) | 0 (0.0%) |
| $20,000 to $24,999 | 0 (0.0%) | 0 (0.0%) |
| $25,000 to $34,999 | 0 (0.0%) | 0 (0.0%) |
| $35,000 to $49,999 | 6 (18.8%) | 0 (0.0%) |
| $50,000 to $74,999 | 16 (50.0%) | 0 (0.0%) |
| $75,000 to $99,999 | 2 (6.2%) | 0 (0.0%) |
| $100,000 to $149,999 | 0 (0.0%) | 0 (0.0%) |
| $150,000 or more | 0 (0.0%) | 0 (0.0%) |
| Total | 32 (100.0%) | 0 (0.0%) |
Monthly Housing Cost Tiers in Edenborn
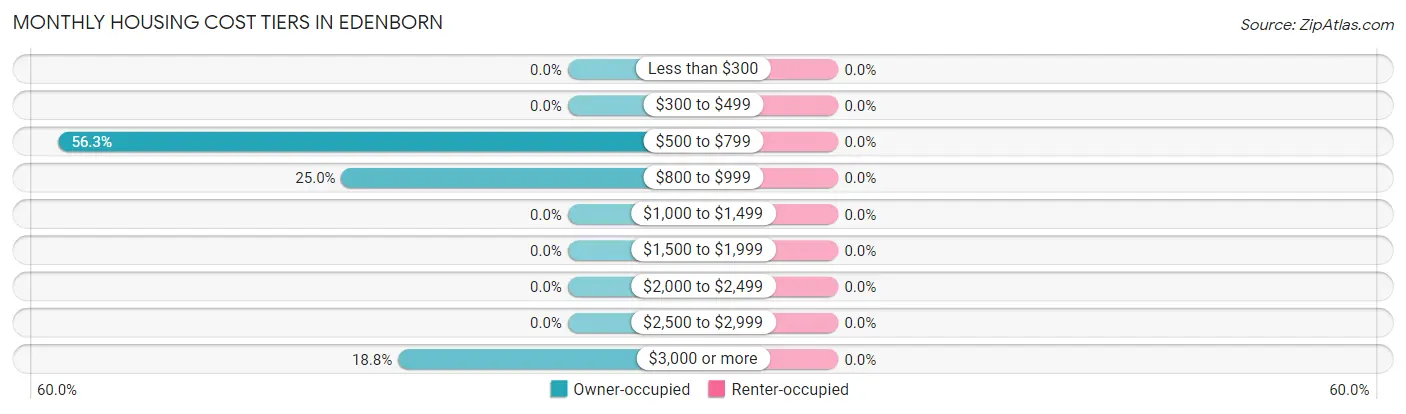
| Monthly Cost | Owner-occupied | Renter-occupied |
| Less than $300 | 0 (0.0%) | 0 (0.0%) |
| $300 to $499 | 0 (0.0%) | 0 (0.0%) |
| $500 to $799 | 18 (56.2%) | 0 (0.0%) |
| $800 to $999 | 8 (25.0%) | 0 (0.0%) |
| $1,000 to $1,499 | 0 (0.0%) | 0 (0.0%) |
| $1,500 to $1,999 | 0 (0.0%) | 0 (0.0%) |
| $2,000 to $2,499 | 0 (0.0%) | 0 (0.0%) |
| $2,500 to $2,999 | 0 (0.0%) | 0 (0.0%) |
| $3,000 or more | 6 (18.8%) | 0 (0.0%) |
| Total | 32 (100.0%) | 0 (0.0%) |
Physical Housing Characteristics in Edenborn
Housing Structures in Edenborn
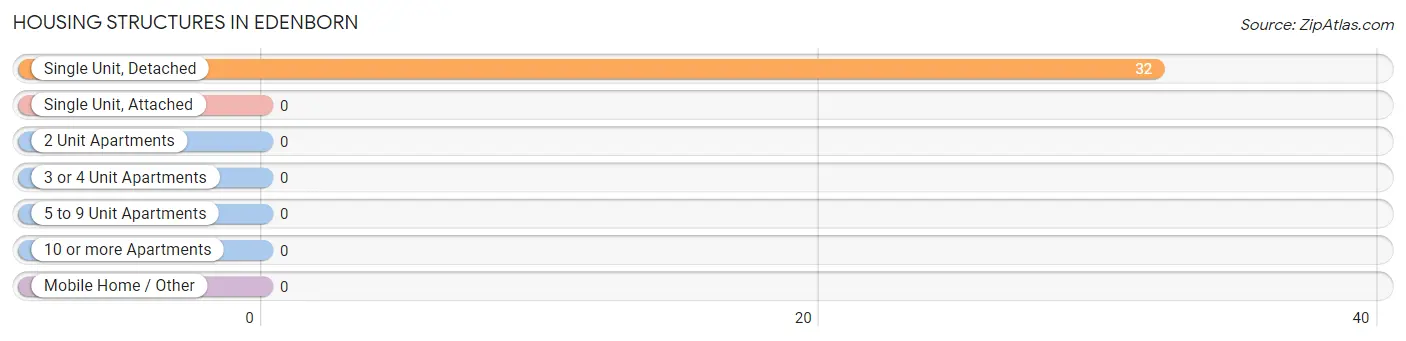
| Structure Type | # Housing Units | % Housing Units |
| Single Unit, Detached | 32 | 100.0% |
| Single Unit, Attached | 0 | 0.0% |
| 2 Unit Apartments | 0 | 0.0% |
| 3 or 4 Unit Apartments | 0 | 0.0% |
| 5 to 9 Unit Apartments | 0 | 0.0% |
| 10 or more Apartments | 0 | 0.0% |
| Mobile Home / Other | 0 | 0.0% |
| Total | 32 | 100.0% |
Housing Structures by Occupancy in Edenborn
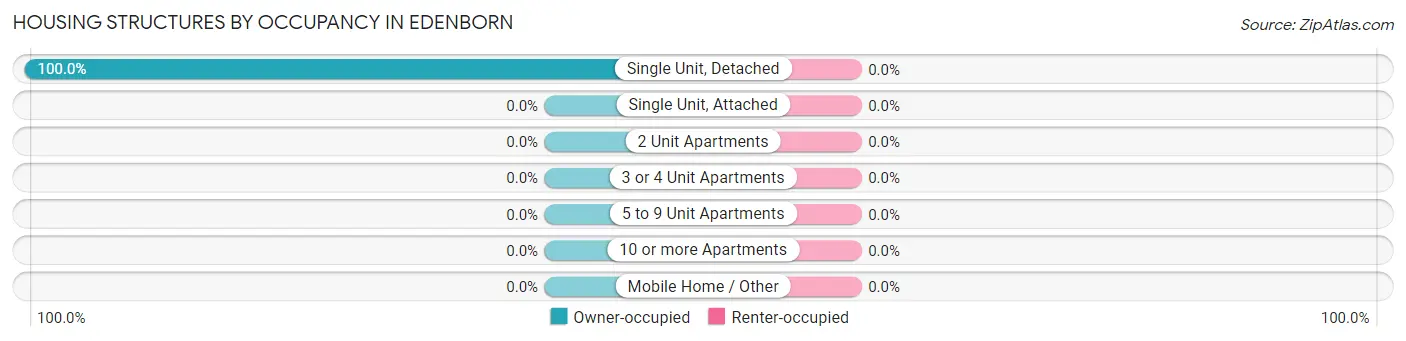
| Structure Type | Owner-occupied | Renter-occupied |
| Single Unit, Detached | 32 (100.0%) | 0 (0.0%) |
| Single Unit, Attached | 0 (0.0%) | 0 (0.0%) |
| 2 Unit Apartments | 0 (0.0%) | 0 (0.0%) |
| 3 or 4 Unit Apartments | 0 (0.0%) | 0 (0.0%) |
| 5 to 9 Unit Apartments | 0 (0.0%) | 0 (0.0%) |
| 10 or more Apartments | 0 (0.0%) | 0 (0.0%) |
| Mobile Home / Other | 0 (0.0%) | 0 (0.0%) |
| Total | 32 (100.0%) | 0 (0.0%) |
Housing Structures by Number of Rooms in Edenborn
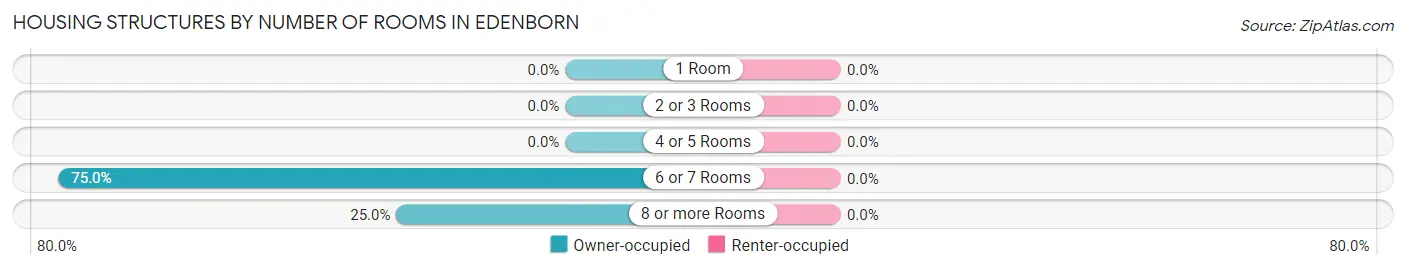
| Number of Rooms | Owner-occupied | Renter-occupied |
| 1 Room | 0 (0.0%) | 0 (0.0%) |
| 2 or 3 Rooms | 0 (0.0%) | 0 (0.0%) |
| 4 or 5 Rooms | 0 (0.0%) | 0 (0.0%) |
| 6 or 7 Rooms | 24 (75.0%) | 0 (0.0%) |
| 8 or more Rooms | 8 (25.0%) | 0 (0.0%) |
| Total | 32 (100.0%) | 0 (0.0%) |
Housing Structure by Heating Type in Edenborn
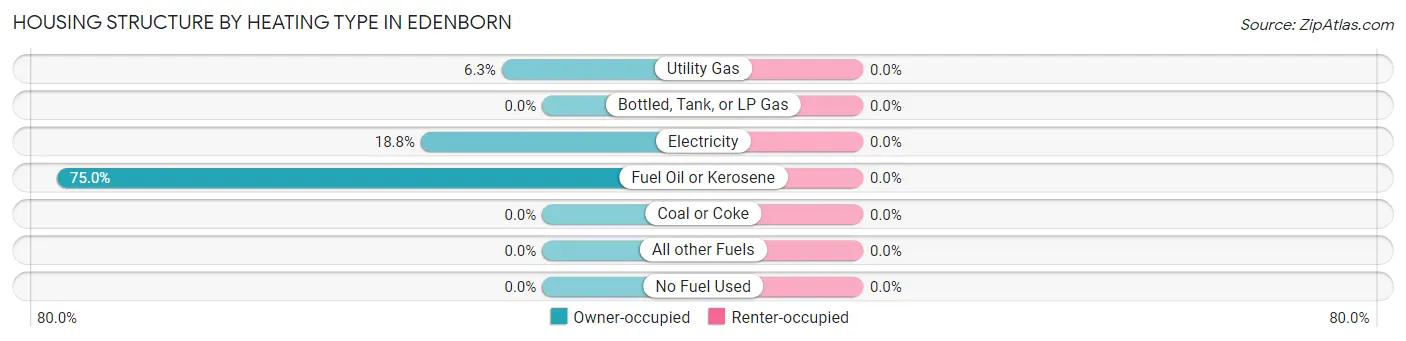
| Heating Type | Owner-occupied | Renter-occupied |
| Utility Gas | 2 (6.2%) | 0 (0.0%) |
| Bottled, Tank, or LP Gas | 0 (0.0%) | 0 (0.0%) |
| Electricity | 6 (18.8%) | 0 (0.0%) |
| Fuel Oil or Kerosene | 24 (75.0%) | 0 (0.0%) |
| Coal or Coke | 0 (0.0%) | 0 (0.0%) |
| All other Fuels | 0 (0.0%) | 0 (0.0%) |
| No Fuel Used | 0 (0.0%) | 0 (0.0%) |
| Total | 32 (100.0%) | 0 (0.0%) |
Household Vehicle Usage in Edenborn
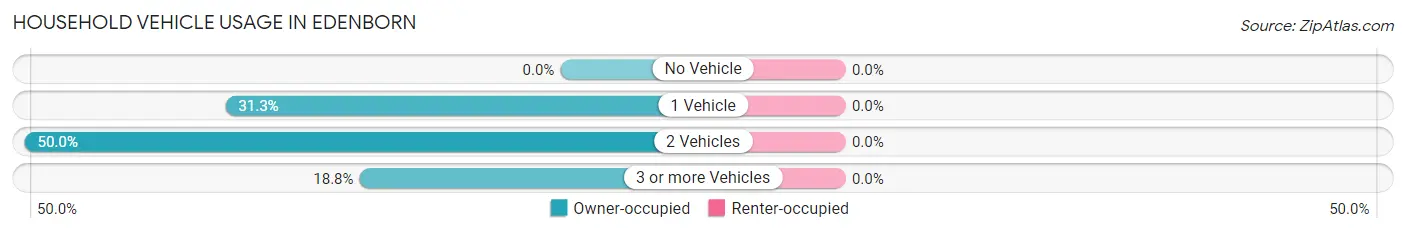
| Vehicles per Household | Owner-occupied | Renter-occupied |
| No Vehicle | 0 (0.0%) | 0 (0.0%) |
| 1 Vehicle | 10 (31.2%) | 0 (0.0%) |
| 2 Vehicles | 16 (50.0%) | 0 (0.0%) |
| 3 or more Vehicles | 6 (18.8%) | 0 (0.0%) |
| Total | 32 (100.0%) | 0 (0.0%) |
Real Estate & Mortgages in Edenborn
Real Estate and Mortgage Overview in Edenborn
| Characteristic | Without Mortgage | With Mortgage |
| Housing Units | 2 | 30 |
| Median Property Value | - | - |
| Median Household Income | - | - |
| Monthly Housing Costs | - | - |
| Real Estate Taxes | - | - |
Property Value by Mortgage Status in Edenborn
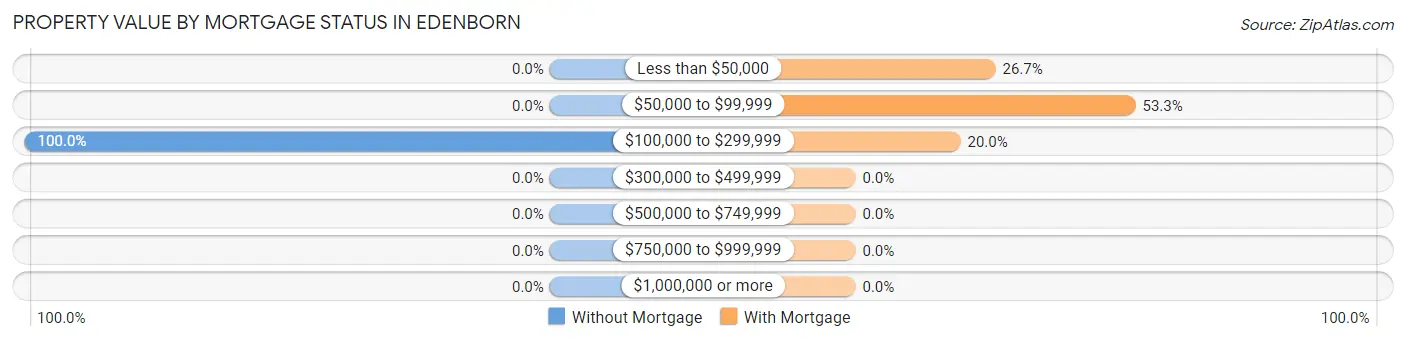
| Property Value | Without Mortgage | With Mortgage |
| Less than $50,000 | 0 (0.0%) | 8 (26.7%) |
| $50,000 to $99,999 | 0 (0.0%) | 16 (53.3%) |
| $100,000 to $299,999 | 2 (100.0%) | 6 (20.0%) |
| $300,000 to $499,999 | 0 (0.0%) | 0 (0.0%) |
| $500,000 to $749,999 | 0 (0.0%) | 0 (0.0%) |
| $750,000 to $999,999 | 0 (0.0%) | 0 (0.0%) |
| $1,000,000 or more | 0 (0.0%) | 0 (0.0%) |
| Total | 2 (100.0%) | 30 (100.0%) |
Household Income by Mortgage Status in Edenborn
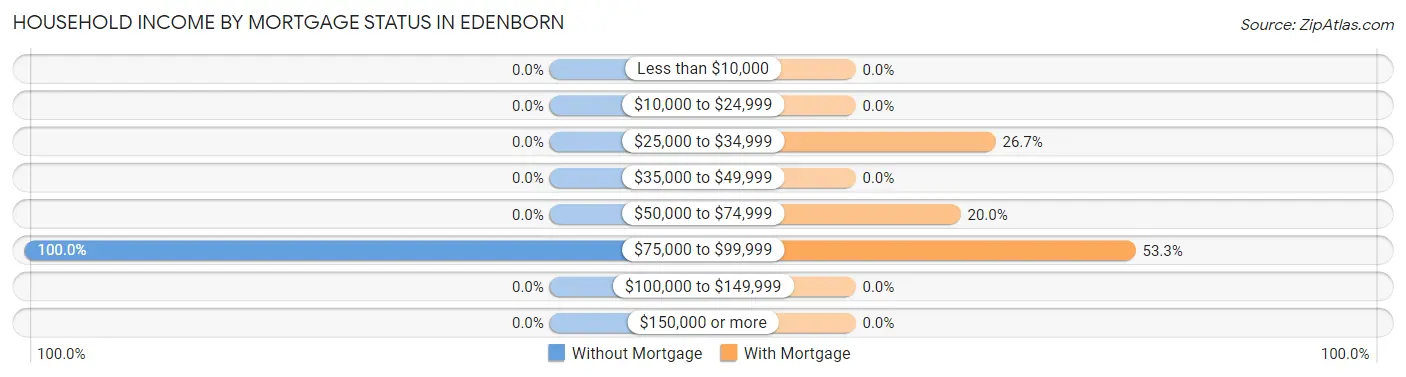
| Household Income | Without Mortgage | With Mortgage |
| Less than $10,000 | 0 (0.0%) | 0 (0.0%) |
| $10,000 to $24,999 | 0 (0.0%) | 0 (0.0%) |
| $25,000 to $34,999 | 0 (0.0%) | 8 (26.7%) |
| $35,000 to $49,999 | 0 (0.0%) | 0 (0.0%) |
| $50,000 to $74,999 | 0 (0.0%) | 6 (20.0%) |
| $75,000 to $99,999 | 2 (100.0%) | 16 (53.3%) |
| $100,000 to $149,999 | 0 (0.0%) | 0 (0.0%) |
| $150,000 or more | 0 (0.0%) | 0 (0.0%) |
| Total | 2 (100.0%) | 30 (100.0%) |
Property Value to Household Income Ratio in Edenborn
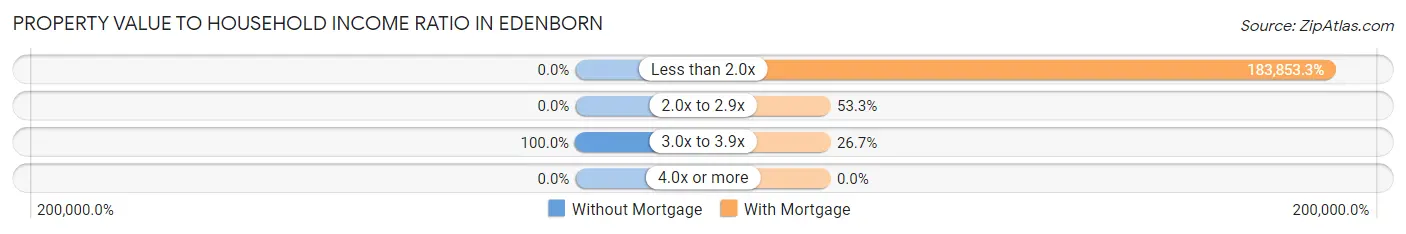
| Value-to-Income Ratio | Without Mortgage | With Mortgage |
| Less than 2.0x | 0 (0.0%) | 55,156 (183,853.3%) |
| 2.0x to 2.9x | 0 (0.0%) | 16 (53.3%) |
| 3.0x to 3.9x | 2 (100.0%) | 8 (26.7%) |
| 4.0x or more | 0 (0.0%) | 0 (0.0%) |
| Total | 2 (100.0%) | 30 (100.0%) |
Real Estate Taxes by Mortgage Status in Edenborn
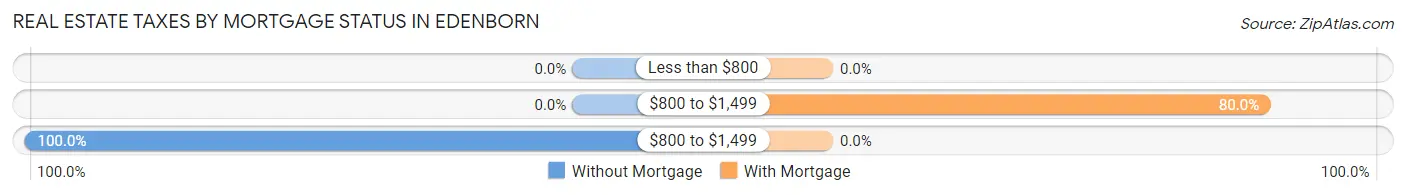
| Property Taxes | Without Mortgage | With Mortgage |
| Less than $800 | 0 (0.0%) | 0 (0.0%) |
| $800 to $1,499 | 0 (0.0%) | 24 (80.0%) |
| $800 to $1,499 | 2 (100.0%) | 0 (0.0%) |
| Total | 2 (100.0%) | 30 (100.0%) |
Health & Disability in Edenborn
Health Insurance Coverage by Age in Edenborn
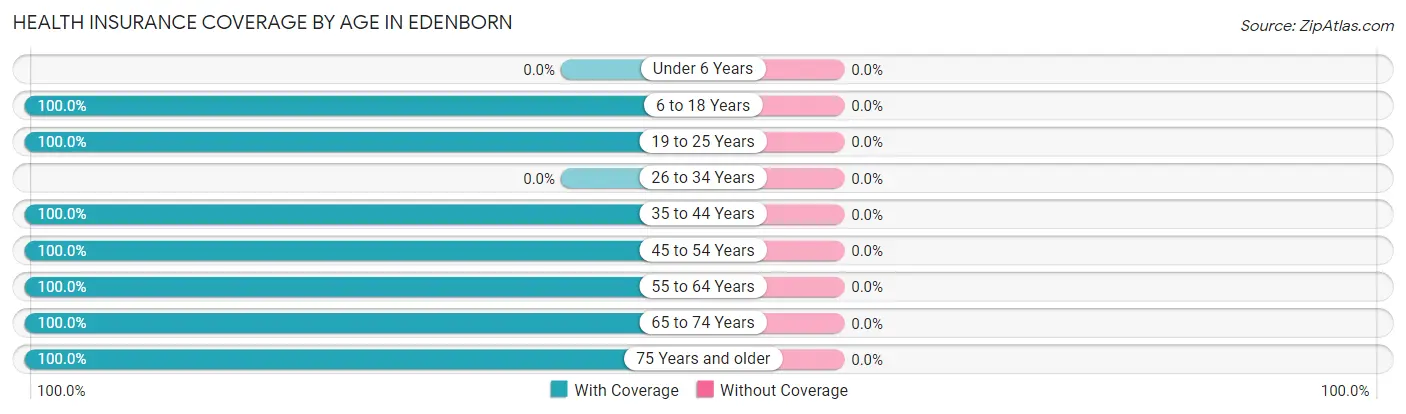
| Age Bracket | With Coverage | Without Coverage |
| Under 6 Years | 0 (0.0%) | 0 (0.0%) |
| 6 to 18 Years | 55 (100.0%) | 0 (0.0%) |
| 19 to 25 Years | 7 (100.0%) | 0 (0.0%) |
| 26 to 34 Years | 0 (0.0%) | 0 (0.0%) |
| 35 to 44 Years | 32 (100.0%) | 0 (0.0%) |
| 45 to 54 Years | 9 (100.0%) | 0 (0.0%) |
| 55 to 64 Years | 2 (100.0%) | 0 (0.0%) |
| 65 to 74 Years | 3 (100.0%) | 0 (0.0%) |
| 75 Years and older | 10 (100.0%) | 0 (0.0%) |
| Total | 118 (100.0%) | 0 (0.0%) |
Health Insurance Coverage by Citizenship Status in Edenborn
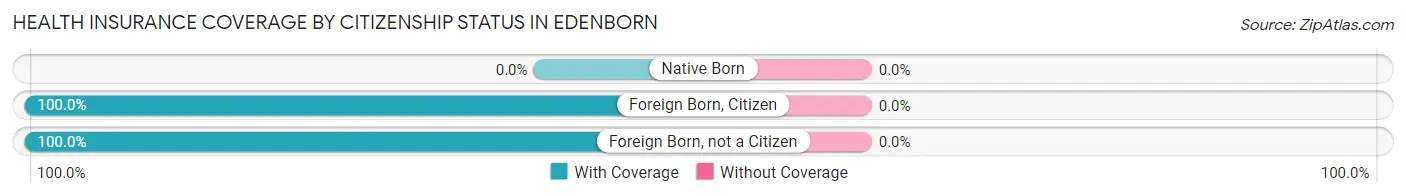
| Citizenship Status | With Coverage | Without Coverage |
| Native Born | 0 (0.0%) | 0 (0.0%) |
| Foreign Born, Citizen | 55 (100.0%) | 0 (0.0%) |
| Foreign Born, not a Citizen | 7 (100.0%) | 0 (0.0%) |
Health Insurance Coverage by Household Income in Edenborn
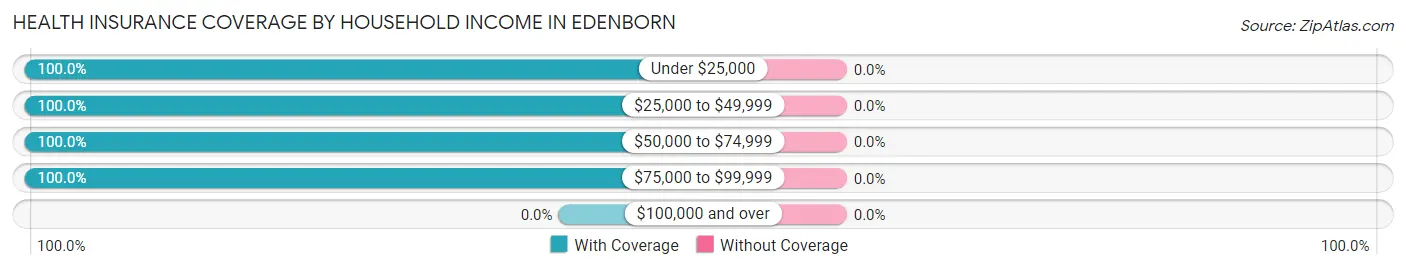
| Household Income | With Coverage | Without Coverage |
| Under $25,000 | 8 (100.0%) | 0 (0.0%) |
| $25,000 to $49,999 | 24 (100.0%) | 0 (0.0%) |
| $50,000 to $74,999 | 79 (100.0%) | 0 (0.0%) |
| $75,000 to $99,999 | 7 (100.0%) | 0 (0.0%) |
| $100,000 and over | 0 (0.0%) | 0 (0.0%) |
Public vs Private Health Insurance Coverage by Age in Edenborn
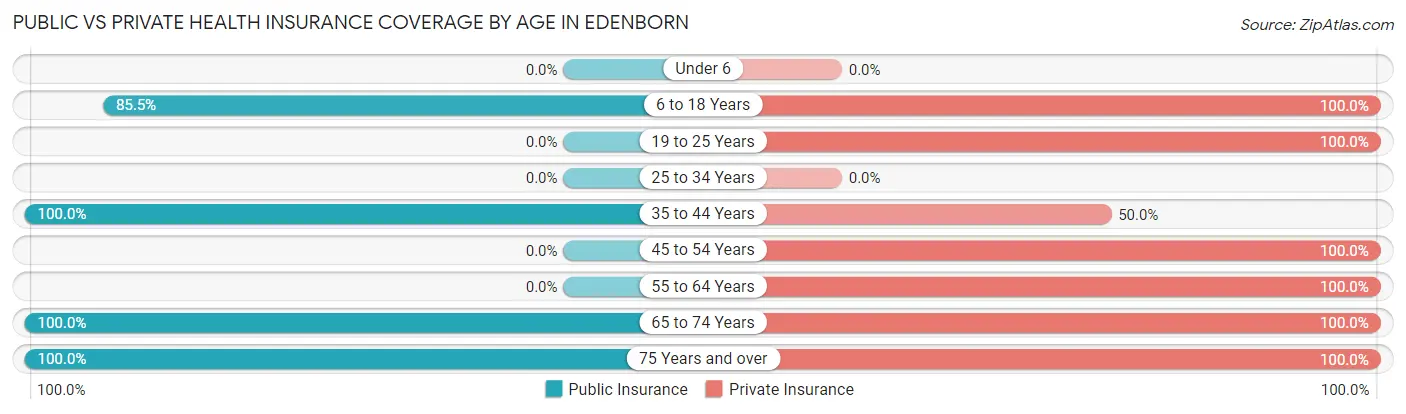
| Age Bracket | Public Insurance | Private Insurance |
| Under 6 | 0 (0.0%) | 0 (0.0%) |
| 6 to 18 Years | 47 (85.5%) | 55 (100.0%) |
| 19 to 25 Years | 0 (0.0%) | 7 (100.0%) |
| 25 to 34 Years | 0 (0.0%) | 0 (0.0%) |
| 35 to 44 Years | 32 (100.0%) | 16 (50.0%) |
| 45 to 54 Years | 0 (0.0%) | 9 (100.0%) |
| 55 to 64 Years | 0 (0.0%) | 2 (100.0%) |
| 65 to 74 Years | 3 (100.0%) | 3 (100.0%) |
| 75 Years and over | 10 (100.0%) | 10 (100.0%) |
| Total | 92 (78.0%) | 102 (86.4%) |
Disability Status by Sex by Age in Edenborn
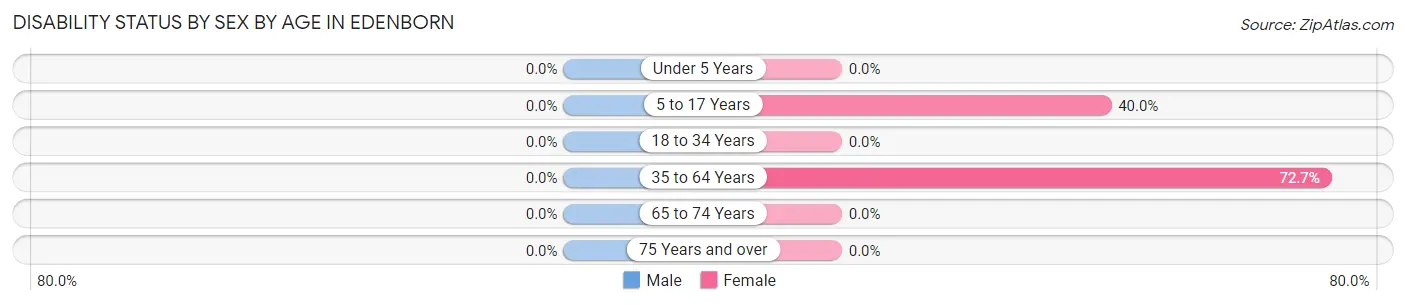
| Age Bracket | Male | Female |
| Under 5 Years | 0 (0.0%) | 0 (0.0%) |
| 5 to 17 Years | 0 (0.0%) | 16 (40.0%) |
| 18 to 34 Years | 0 (0.0%) | 0 (0.0%) |
| 35 to 64 Years | 0 (0.0%) | 16 (72.7%) |
| 65 to 74 Years | 0 (0.0%) | 0 (0.0%) |
| 75 Years and over | 0 (0.0%) | 0 (0.0%) |
Disability Class by Sex by Age in Edenborn
Disability Class: Hearing Difficulty
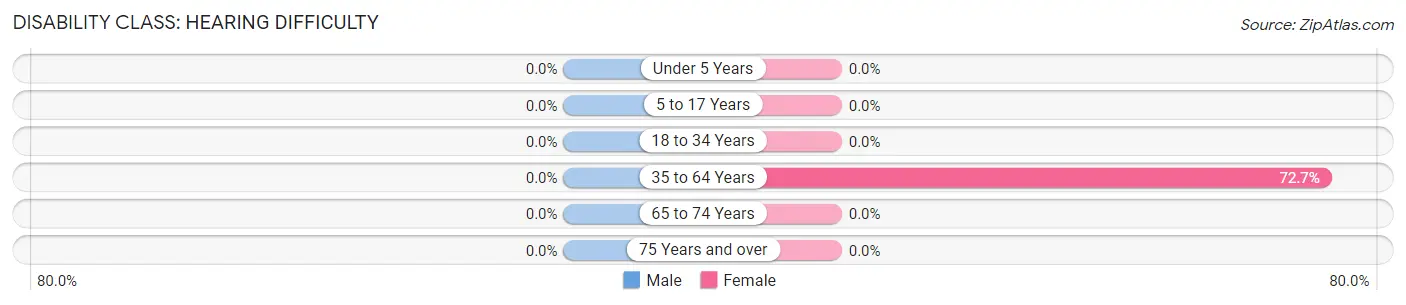
| Age Bracket | Male | Female |
| Under 5 Years | 0 (0.0%) | 0 (0.0%) |
| 5 to 17 Years | 0 (0.0%) | 0 (0.0%) |
| 18 to 34 Years | 0 (0.0%) | 0 (0.0%) |
| 35 to 64 Years | 0 (0.0%) | 16 (72.7%) |
| 65 to 74 Years | 0 (0.0%) | 0 (0.0%) |
| 75 Years and over | 0 (0.0%) | 0 (0.0%) |
Disability Class: Vision Difficulty
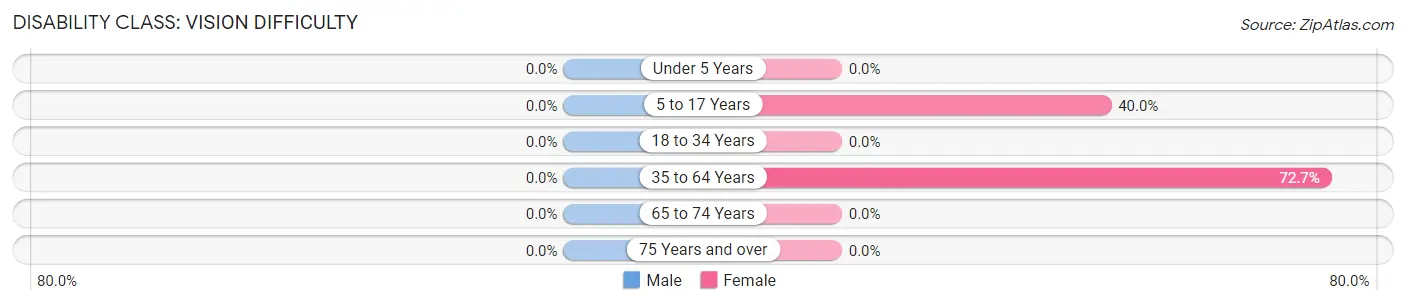
| Age Bracket | Male | Female |
| Under 5 Years | 0 (0.0%) | 0 (0.0%) |
| 5 to 17 Years | 0 (0.0%) | 16 (40.0%) |
| 18 to 34 Years | 0 (0.0%) | 0 (0.0%) |
| 35 to 64 Years | 0 (0.0%) | 16 (72.7%) |
| 65 to 74 Years | 0 (0.0%) | 0 (0.0%) |
| 75 Years and over | 0 (0.0%) | 0 (0.0%) |
Disability Class: Cognitive Difficulty
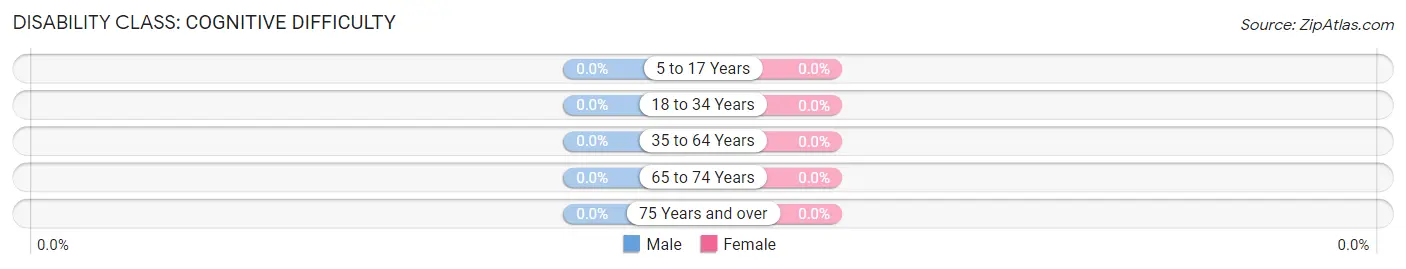
| Age Bracket | Male | Female |
| 5 to 17 Years | 0 (0.0%) | 0 (0.0%) |
| 18 to 34 Years | 0 (0.0%) | 0 (0.0%) |
| 35 to 64 Years | 0 (0.0%) | 0 (0.0%) |
| 65 to 74 Years | 0 (0.0%) | 0 (0.0%) |
| 75 Years and over | 0 (0.0%) | 0 (0.0%) |
Disability Class: Ambulatory Difficulty
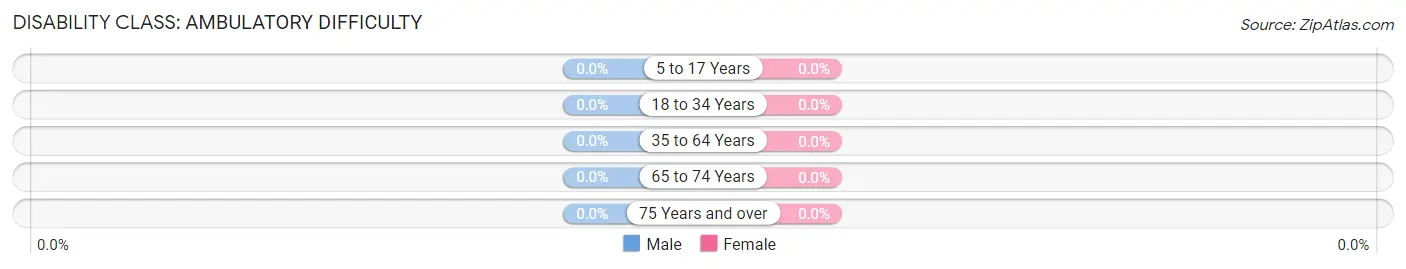
| Age Bracket | Male | Female |
| 5 to 17 Years | 0 (0.0%) | 0 (0.0%) |
| 18 to 34 Years | 0 (0.0%) | 0 (0.0%) |
| 35 to 64 Years | 0 (0.0%) | 0 (0.0%) |
| 65 to 74 Years | 0 (0.0%) | 0 (0.0%) |
| 75 Years and over | 0 (0.0%) | 0 (0.0%) |
Disability Class: Self-Care Difficulty
| Age Bracket | Male | Female |
| 5 to 17 Years | 0 (0.0%) | 0 (0.0%) |
| 18 to 34 Years | 0 (0.0%) | 0 (0.0%) |
| 35 to 64 Years | 0 (0.0%) | 0 (0.0%) |
| 65 to 74 Years | 0 (0.0%) | 0 (0.0%) |
| 75 Years and over | 0 (0.0%) | 0 (0.0%) |
Technology Access in Edenborn
Computing Device Access in Edenborn
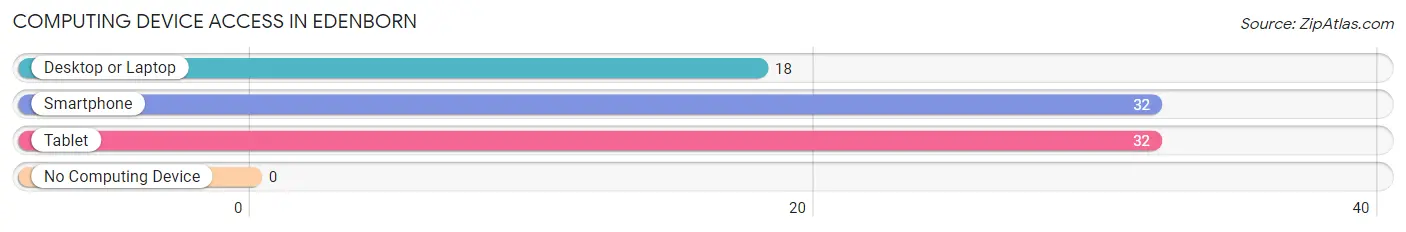
| Device Type | # Households | % Households |
| Desktop or Laptop | 18 | 56.2% |
| Smartphone | 32 | 100.0% |
| Tablet | 32 | 100.0% |
| No Computing Device | 0 | 0.0% |
| Total | 32 | 100.0% |
Internet Access in Edenborn
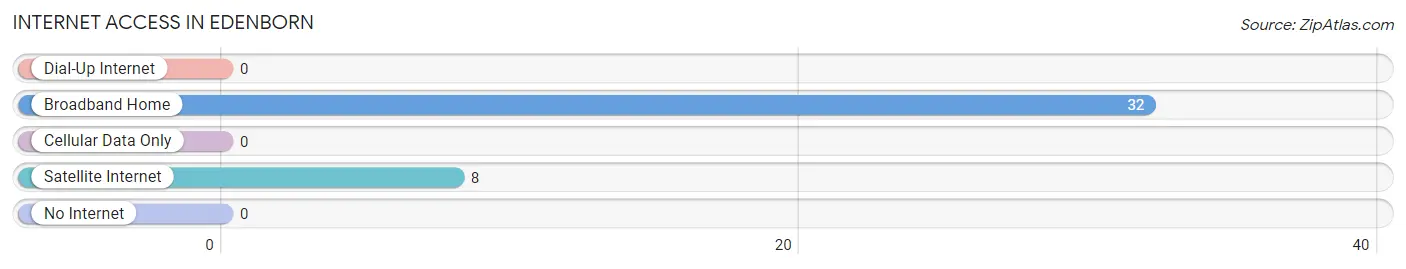
| Internet Type | # Households | % Households |
| Dial-Up Internet | 0 | 0.0% |
| Broadband Home | 32 | 100.0% |
| Cellular Data Only | 0 | 0.0% |
| Satellite Internet | 8 | 25.0% |
| No Internet | 0 | 0.0% |
| Total | 32 | 100.0% |
Edenborn Summary
Edenborn is a small borough located in the state of Pennsylvania, United States. It is situated in the Lehigh Valley region of the state, and is part of Northampton County. The borough has a population of approximately 1,400 people, and is located about 10 miles north of Allentown, the county seat.
History
Edenborn was founded in 1790 by a group of German settlers who had migrated from the Palatinate region of Germany. The settlers named the town after the biblical Garden of Eden, and the name has remained unchanged since then. The town was originally a farming community, and the settlers built a church and a school in the area.
In the early 19th century, the town began to grow and develop, and a number of businesses were established. The town was incorporated as a borough in 1845, and the first mayor was elected in 1846.
In the late 19th century, the town began to experience a period of industrialization, and a number of factories were built in the area. This period of growth and development continued into the 20th century, and the town experienced a population boom.
Geography
Edenborn is located in the Lehigh Valley region of Pennsylvania, and is situated in Northampton County. The borough is located about 10 miles north of Allentown, the county seat. The borough is situated on the banks of the Lehigh River, and is surrounded by rolling hills and farmland.
The borough has a total area of 0.7 square miles, all of which is land. The borough is located at an elevation of about 500 feet above sea level.
Economy
Edenborn has a small but diverse economy. The town is home to a number of small businesses, including restaurants, retail stores, and professional services. The town also has a number of manufacturing and industrial businesses, including a paper mill and a metal fabrication plant.
The town is also home to a number of agricultural businesses, including dairy farms and fruit orchards. The town is also home to a number of tourist attractions, including a historic museum and a number of outdoor recreation areas.
Demographics
As of the 2010 census, the population of Edenborn was 1,400. The racial makeup of the borough was 95.3% White, 1.4% African American, 0.4% Native American, 0.7% Asian, 0.1% Pacific Islander, and 1.1% from other races. Hispanic or Latino of any race were 2.3% of the population.
The median household income in the borough was $45,000, and the median family income was $50,000. The per capita income in the borough was $20,000. About 8.3% of the population was below the poverty line.
Common Questions
What is Per Capita Income in Edenborn?
Per Capita income in Edenborn is $11,613.
What is the Median Family Income in Edenborn?
Median Family Income in Edenborn is $55,938.
What is the Median Household income in Edenborn?
Median Household Income in Edenborn is $55,313.
What is Inequality or Gini Index in Edenborn?
Inequality or Gini Index in Edenborn is 0.24.
What is the Total Population of Edenborn?
Total Population of Edenborn is 118.
What is the Total Male Population of Edenborn?
Total Male Population of Edenborn is 39.
What is the Total Female Population of Edenborn?
Total Female Population of Edenborn is 79.
What is the Ratio of Males per 100 Females in Edenborn?
There are 49.37 Males per 100 Females in Edenborn.
What is the Ratio of Females per 100 Males in Edenborn?
There are 202.56 Females per 100 Males in Edenborn.
What is the Median Population Age in Edenborn?
Median Population Age in Edenborn is 21.6 Years.
What is the Average Family Size in Edenborn
Average Family Size in Edenborn is 4.6 People.
What is the Average Household Size in Edenborn
Average Household Size in Edenborn is 3.7 People.
How Large is the Labor Force in Edenborn?
There are 42 People in the Labor Forcein in Edenborn.
What is the Percentage of People in the Labor Force in Edenborn?
59.2% of People are in the Labor Force in Edenborn.