Sheppton, PA Map & Demographics
Sheppton Map
Sheppton Overview
$27,521
PER CAPITA INCOME
$68,333
AVG FAMILY INCOME
$63,864
AVG HOUSEHOLD INCOME
35.9%
WAGE / INCOME GAP [ % ]
64.1¢/ $1
WAGE / INCOME GAP [ $ ]
0.43
INEQUALITY / GINI INDEX
477
TOTAL POPULATION
210
MALE POPULATION
267
FEMALE POPULATION
78.65
MALES / 100 FEMALES
127.14
FEMALES / 100 MALES
40.2
MEDIAN AGE
3.7
AVG FAMILY SIZE
2.9
AVG HOUSEHOLD SIZE
126
LABOR FORCE [ PEOPLE ]
39.0%
PERCENT IN LABOR FORCE
7.1%
UNEMPLOYMENT RATE
Sheppton Zip Codes
Sheppton Area Codes
Income in Sheppton
Income Overview in Sheppton
Per Capita Income in Sheppton is $27,521, while median incomes of families and households are $68,333 and $63,864 respectively.
| Characteristic | Number | Measure |
| Per Capita Income | 477 | $27,521 |
| Median Family Income | 110 | $68,333 |
| Mean Family Income | 110 | $86,313 |
| Median Household Income | 162 | $63,864 |
| Mean Household Income | 162 | $77,076 |
| Income Deficit | 110 | $0 |
| Wage / Income Gap (%) | 477 | 35.90% |
| Wage / Income Gap ($) | 477 | 64.10¢ per $1 |
| Gini / Inequality Index | 477 | 0.43 |
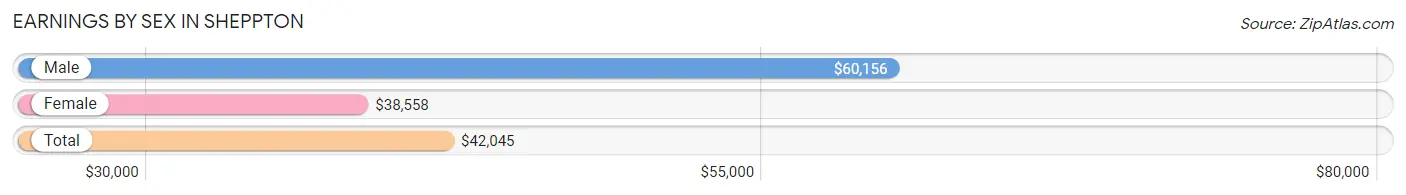
Earnings by Sex in Sheppton
Average Earnings in Sheppton are $42,045, $60,156 for men and $38,558 for women, a difference of 35.9%.
| Sex | Number | Average Earnings |
| Male | 59 (35.1%) | $60,156 |
| Female | 109 (64.9%) | $38,558 |
| Total | 168 (100.0%) | $42,045 |
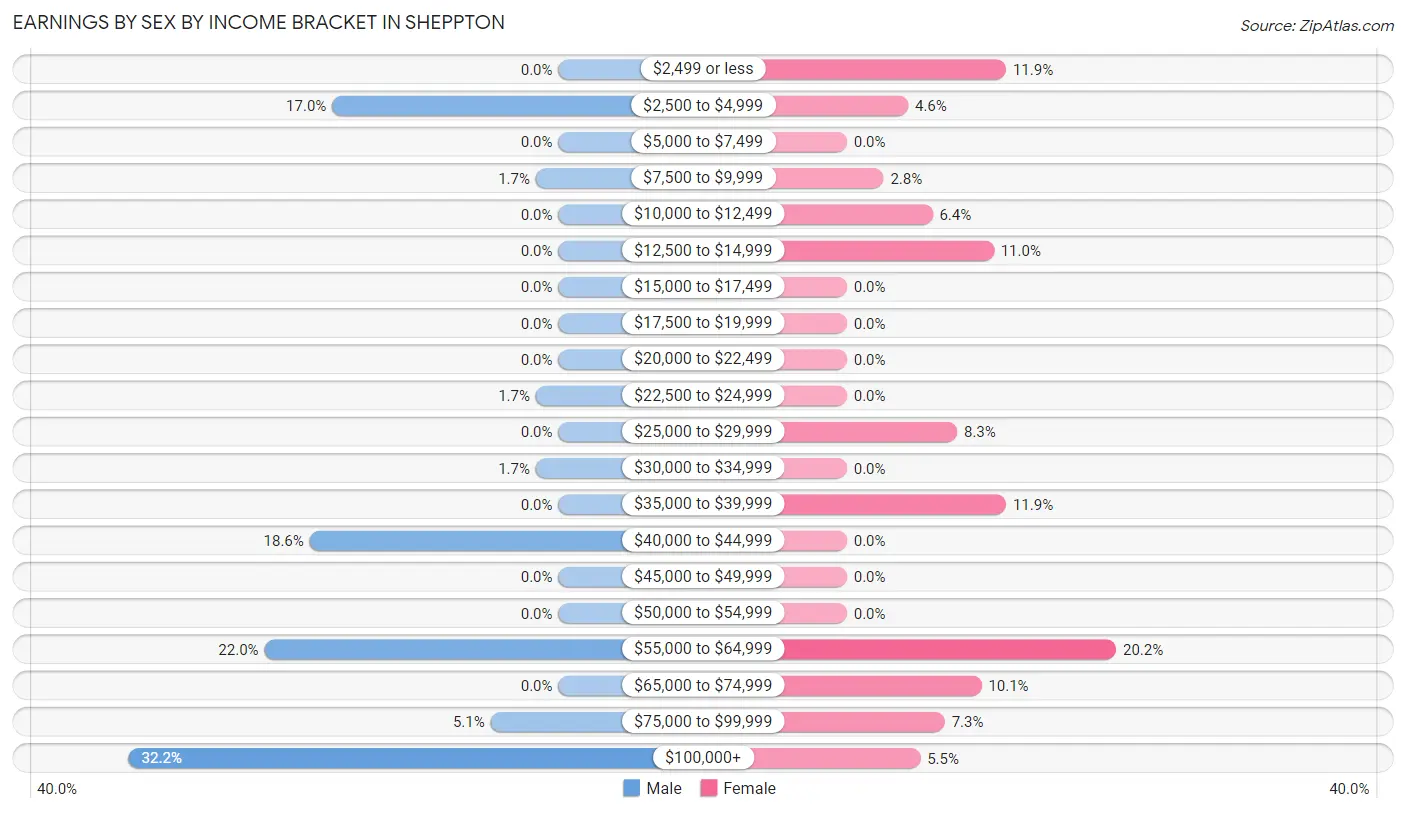
Earnings by Sex by Income Bracket in Sheppton
The most common earnings brackets in Sheppton are $100,000+ for men (19 | 32.2%) and $55,000 to $64,999 for women (22 | 20.2%).
| Income | Male | Female |
| $2,499 or less | 0 (0.0%) | 13 (11.9%) |
| $2,500 to $4,999 | 10 (17.0%) | 5 (4.6%) |
| $5,000 to $7,499 | 0 (0.0%) | 0 (0.0%) |
| $7,500 to $9,999 | 1 (1.7%) | 3 (2.8%) |
| $10,000 to $12,499 | 0 (0.0%) | 7 (6.4%) |
| $12,500 to $14,999 | 0 (0.0%) | 12 (11.0%) |
| $15,000 to $17,499 | 0 (0.0%) | 0 (0.0%) |
| $17,500 to $19,999 | 0 (0.0%) | 0 (0.0%) |
| $20,000 to $22,499 | 0 (0.0%) | 0 (0.0%) |
| $22,500 to $24,999 | 1 (1.7%) | 0 (0.0%) |
| $25,000 to $29,999 | 0 (0.0%) | 9 (8.3%) |
| $30,000 to $34,999 | 1 (1.7%) | 0 (0.0%) |
| $35,000 to $39,999 | 0 (0.0%) | 13 (11.9%) |
| $40,000 to $44,999 | 11 (18.6%) | 0 (0.0%) |
| $45,000 to $49,999 | 0 (0.0%) | 0 (0.0%) |
| $50,000 to $54,999 | 0 (0.0%) | 0 (0.0%) |
| $55,000 to $64,999 | 13 (22.0%) | 22 (20.2%) |
| $65,000 to $74,999 | 0 (0.0%) | 11 (10.1%) |
| $75,000 to $99,999 | 3 (5.1%) | 8 (7.3%) |
| $100,000+ | 19 (32.2%) | 6 (5.5%) |
| Total | 59 (100.0%) | 109 (100.0%) |
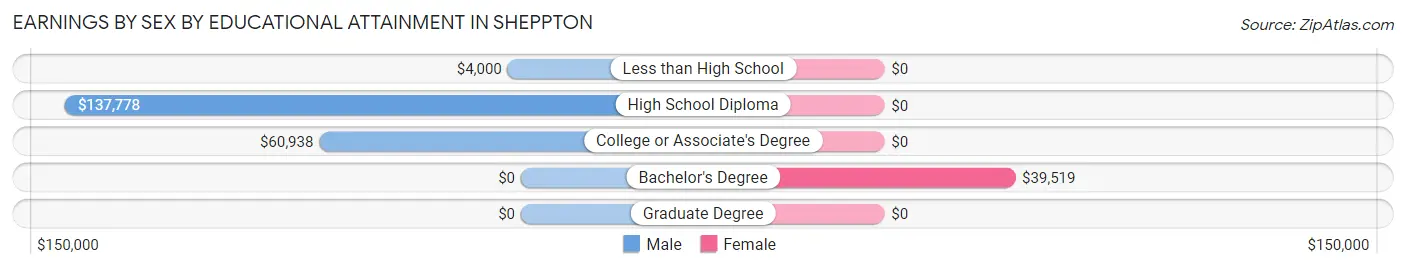
Earnings by Sex by Educational Attainment in Sheppton
| Educational Attainment | Male Income | Female Income |
| Less than High School | $4,000 | $0 |
| High School Diploma | $137,778 | $0 |
| College or Associate's Degree | $60,938 | $0 |
| Bachelor's Degree | - | - |
| Graduate Degree | - | - |
| Total | $60,313 | $0 |
Family Income in Sheppton
Family Income Brackets in Sheppton
According to the Sheppton family income data, there are 33 families falling into the $25,000 to $34,999 income range, which is the most common income bracket and makes up 30.0% of all families.
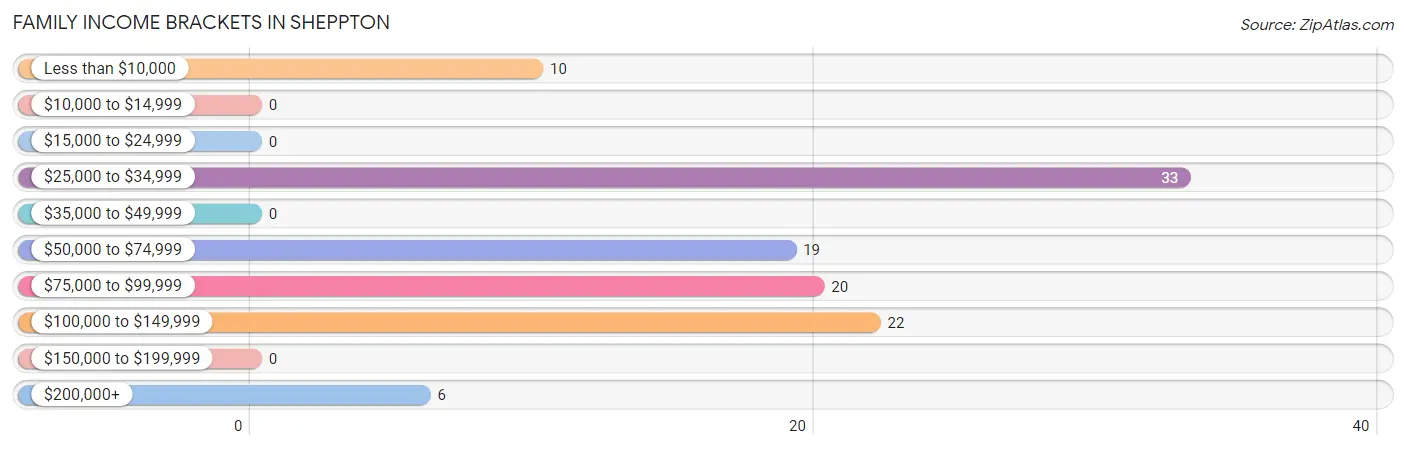
| Income Bracket | # Families | % Families |
| Less than $10,000 | 10 | 9.1% |
| $10,000 to $14,999 | 0 | 0.0% |
| $15,000 to $24,999 | 0 | 0.0% |
| $25,000 to $34,999 | 33 | 30.0% |
| $35,000 to $49,999 | 0 | 0.0% |
| $50,000 to $74,999 | 19 | 17.3% |
| $75,000 to $99,999 | 20 | 18.2% |
| $100,000 to $149,999 | 22 | 20.0% |
| $150,000 to $199,999 | 0 | 0.0% |
| $200,000+ | 6 | 5.5% |
Family Income by Famaliy Size in Sheppton
3-person families (26 | 23.6%) account for the highest median family income in Sheppton with $138,056 per family, while 3-person families (26 | 23.6%) have the highest median income of $46,019 per family member.
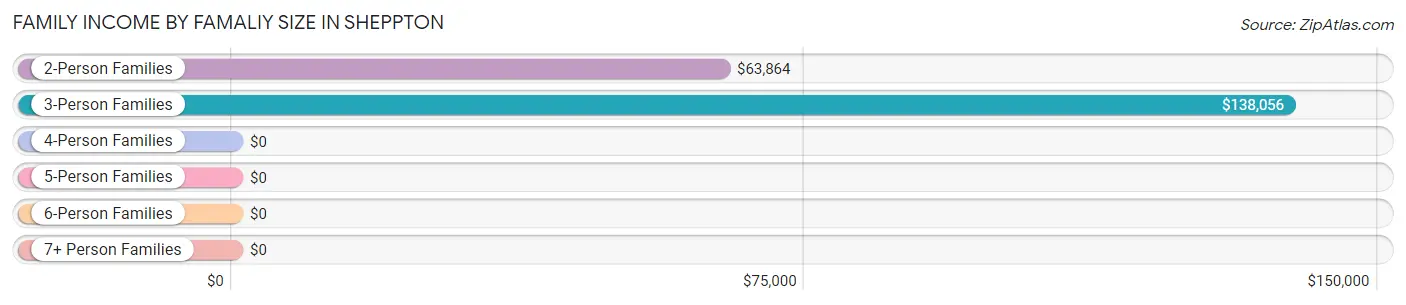
| Income Bracket | # Families | Median Income |
| 2-Person Families | 52 (47.3%) | $63,864 |
| 3-Person Families | 26 (23.6%) | $138,056 |
| 4-Person Families | 9 (8.2%) | $0 |
| 5-Person Families | 23 (20.9%) | $0 |
| 6-Person Families | 0 (0.0%) | $0 |
| 7+ Person Families | 0 (0.0%) | $0 |
| Total | 110 (100.0%) | $68,333 |
Family Income by Number of Earners in Sheppton
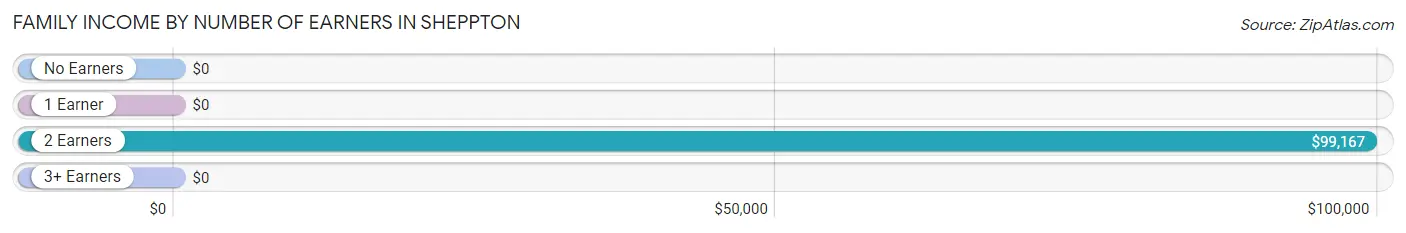
| Number of Earners | # Families | Median Income |
| No Earners | 33 (30.0%) | $0 |
| 1 Earner | 22 (20.0%) | $0 |
| 2 Earners | 44 (40.0%) | $99,167 |
| 3+ Earners | 11 (10.0%) | $0 |
| Total | 110 (100.0%) | $68,333 |
Household Income in Sheppton
Household Income Brackets in Sheppton
With 40 households falling in the category, the $25,000 to $34,999 income range is the most frequent in Sheppton, accounting for 24.7% of all households.
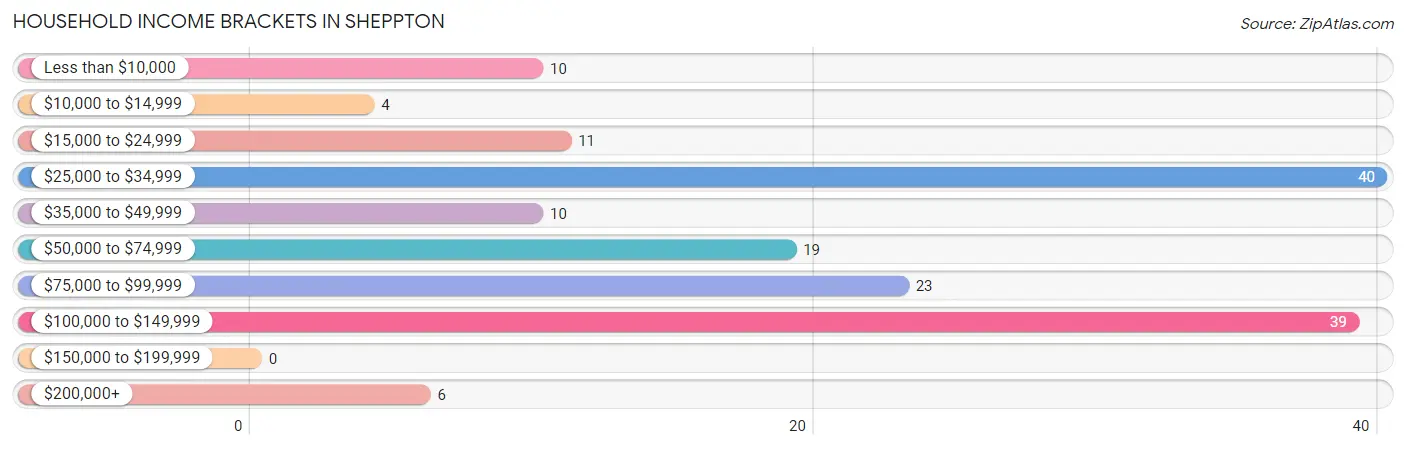
| Income Bracket | # Households | % Households |
| Less than $10,000 | 10 | 6.2% |
| $10,000 to $14,999 | 4 | 2.5% |
| $15,000 to $24,999 | 11 | 6.8% |
| $25,000 to $34,999 | 40 | 24.7% |
| $35,000 to $49,999 | 10 | 6.2% |
| $50,000 to $74,999 | 19 | 11.7% |
| $75,000 to $99,999 | 23 | 14.2% |
| $100,000 to $149,999 | 39 | 24.1% |
| $150,000 to $199,999 | 0 | 0.0% |
| $200,000+ | 6 | 3.7% |
Household Income by Householder Age in Sheppton
The median household income in Sheppton is $63,864, with the highest median household income of $87,841 found in the 45 to 64 years age bracket for the primary householder. A total of 55 households (34.0%) fall into this category.
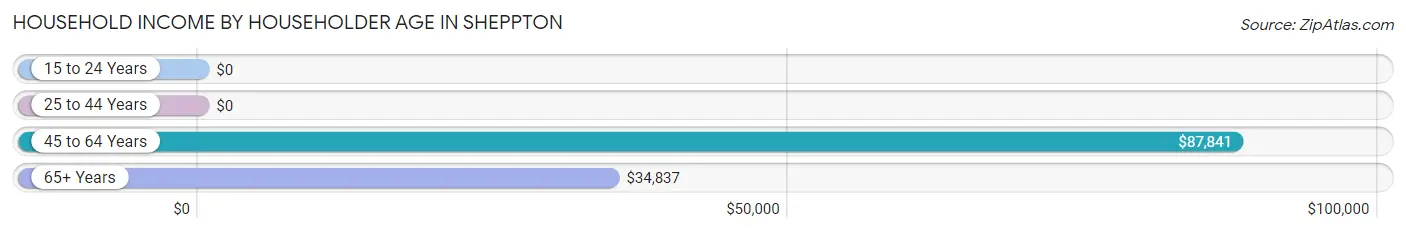
| Income Bracket | # Households | Median Income |
| 15 to 24 Years | 0 (0.0%) | $0 |
| 25 to 44 Years | 22 (13.6%) | $0 |
| 45 to 64 Years | 55 (34.0%) | $87,841 |
| 65+ Years | 85 (52.5%) | $34,837 |
| Total | 162 (100.0%) | $63,864 |
Poverty in Sheppton
Income Below Poverty by Sex and Age in Sheppton
With 62.4% poverty level for males and 34.7% for females among the residents of Sheppton, 6 to 11 year old males and 75 year old and over females are the most vulnerable to poverty, with 40 males (100.0%) and 23 females (57.5%) in their respective age groups living below the poverty level.
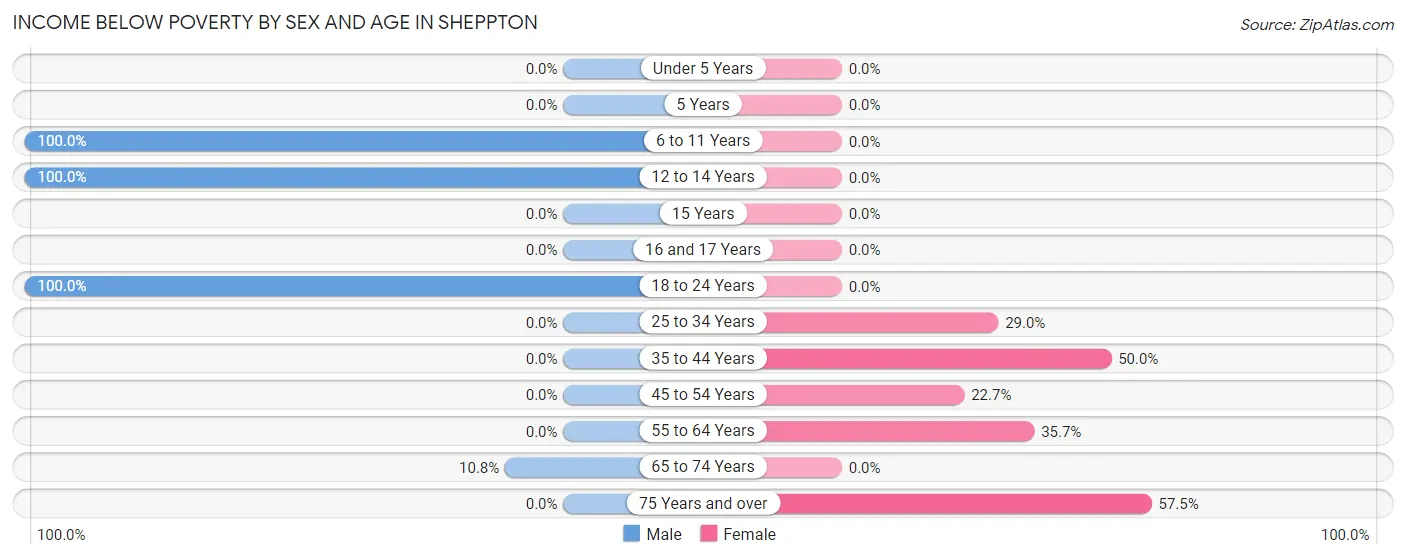
| Age Bracket | Male | Female |
| Under 5 Years | 0 (0.0%) | 0 (0.0%) |
| 5 Years | 0 (0.0%) | 0 (0.0%) |
| 6 to 11 Years | 40 (100.0%) | 0 (0.0%) |
| 12 to 14 Years | 85 (100.0%) | 0 (0.0%) |
| 15 Years | 0 (0.0%) | 0 (0.0%) |
| 16 and 17 Years | 0 (0.0%) | 0 (0.0%) |
| 18 to 24 Years | 2 (100.0%) | 0 (0.0%) |
| 25 to 34 Years | 0 (0.0%) | 9 (29.0%) |
| 35 to 44 Years | 0 (0.0%) | 44 (50.0%) |
| 45 to 54 Years | 0 (0.0%) | 5 (22.7%) |
| 55 to 64 Years | 0 (0.0%) | 10 (35.7%) |
| 65 to 74 Years | 4 (10.8%) | 0 (0.0%) |
| 75 Years and over | 0 (0.0%) | 23 (57.5%) |
| Total | 131 (62.4%) | 91 (34.7%) |
Income Above Poverty by Sex and Age in Sheppton
According to the poverty statistics in Sheppton, males aged 16 and 17 years and females aged 6 to 11 years are the age groups that are most secure financially, with 100.0% of males and 100.0% of females in these age groups living above the poverty line.
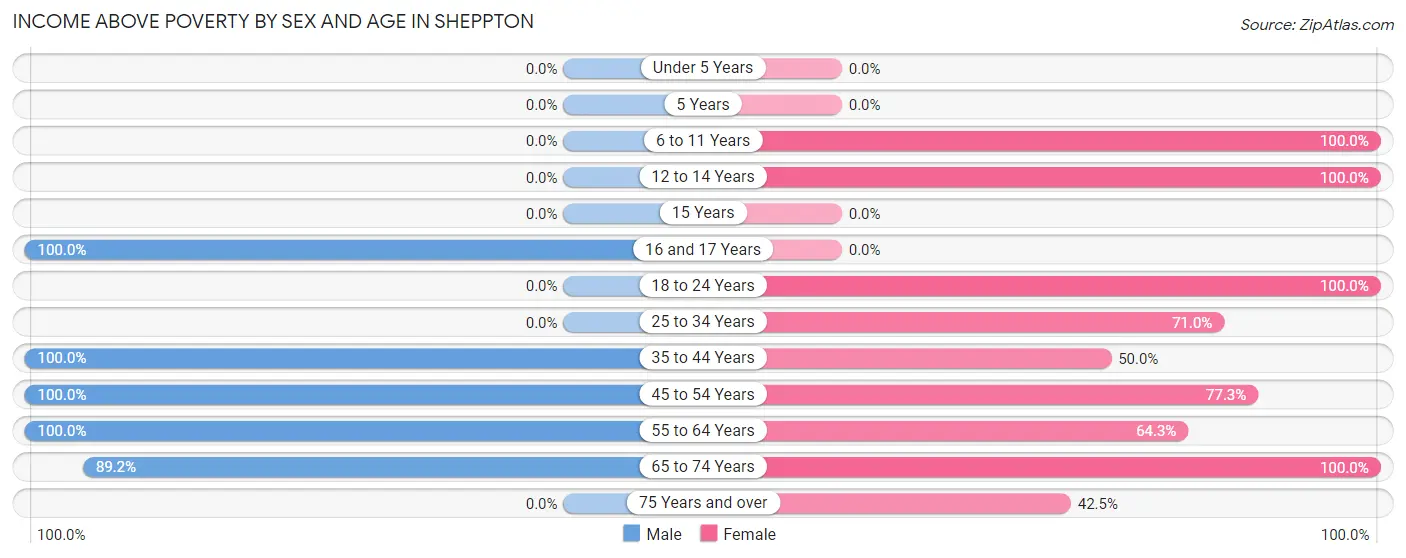
| Age Bracket | Male | Female |
| Under 5 Years | 0 (0.0%) | 0 (0.0%) |
| 5 Years | 0 (0.0%) | 0 (0.0%) |
| 6 to 11 Years | 0 (0.0%) | 10 (100.0%) |
| 12 to 14 Years | 0 (0.0%) | 19 (100.0%) |
| 15 Years | 0 (0.0%) | 0 (0.0%) |
| 16 and 17 Years | 7 (100.0%) | 0 (0.0%) |
| 18 to 24 Years | 0 (0.0%) | 13 (100.0%) |
| 25 to 34 Years | 0 (0.0%) | 22 (71.0%) |
| 35 to 44 Years | 1 (100.0%) | 44 (50.0%) |
| 45 to 54 Years | 20 (100.0%) | 17 (77.3%) |
| 55 to 64 Years | 18 (100.0%) | 18 (64.3%) |
| 65 to 74 Years | 33 (89.2%) | 11 (100.0%) |
| 75 Years and over | 0 (0.0%) | 17 (42.5%) |
| Total | 79 (37.6%) | 171 (65.3%) |
Income Below Poverty Among Married-Couple Families in Sheppton
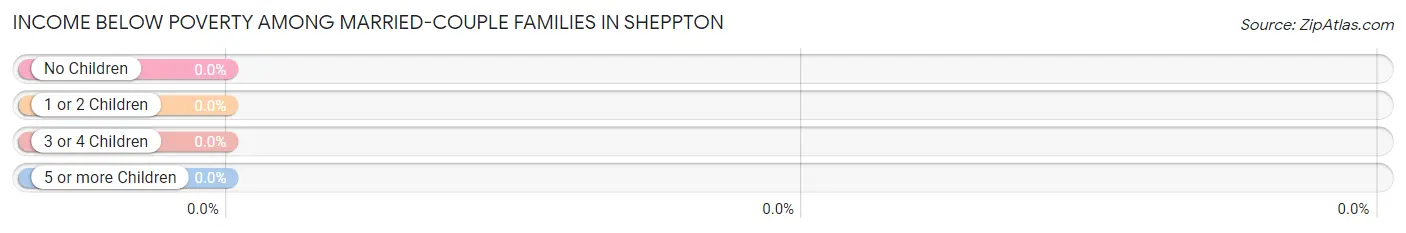
| Children | Above Poverty | Below Poverty |
| No Children | 32 (100.0%) | 0 (0.0%) |
| 1 or 2 Children | 15 (100.0%) | 0 (0.0%) |
| 3 or 4 Children | 0 (0.0%) | 0 (0.0%) |
| 5 or more Children | 0 (0.0%) | 0 (0.0%) |
| Total | 47 (100.0%) | 0 (0.0%) |
Income Below Poverty Among Single-Parent Households in Sheppton
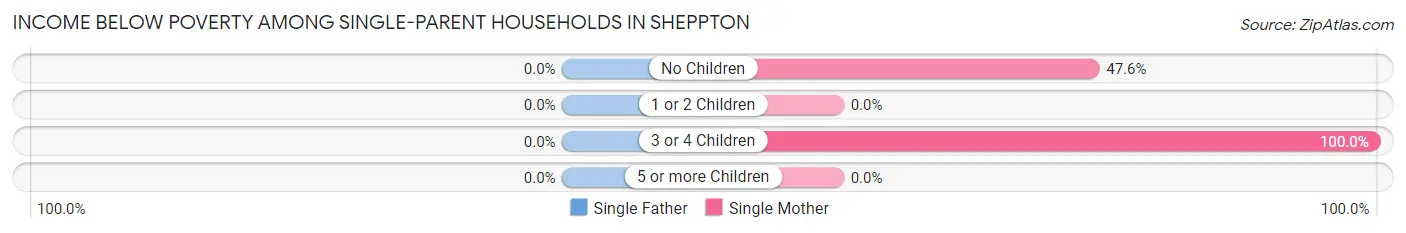
| Children | Single Father | Single Mother |
| No Children | 0 (0.0%) | 10 (47.6%) |
| 1 or 2 Children | 0 (0.0%) | 0 (0.0%) |
| 3 or 4 Children | 0 (0.0%) | 23 (100.0%) |
| 5 or more Children | 0 (0.0%) | 0 (0.0%) |
| Total | 0 (0.0%) | 33 (75.0%) |
Income Below Poverty Among Married-Couple vs Single-Parent Households in Sheppton
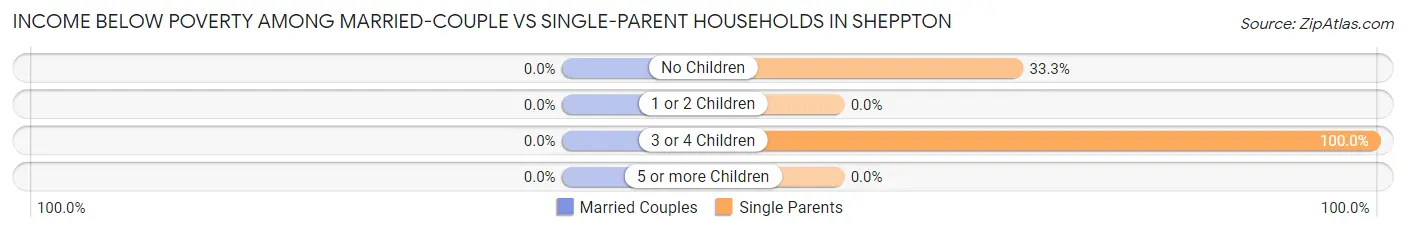
| Children | Married-Couple Families | Single-Parent Households |
| No Children | 0 (0.0%) | 10 (33.3%) |
| 1 or 2 Children | 0 (0.0%) | 0 (0.0%) |
| 3 or 4 Children | 0 (0.0%) | 23 (100.0%) |
| 5 or more Children | 0 (0.0%) | 0 (0.0%) |
| Total | 0 (0.0%) | 33 (52.4%) |
Race in Sheppton
The most populous races in Sheppton are White / Caucasian (447 | 93.7%), Hispanic or Latino (68 | 14.3%), and Black / African American (24 | 5.0%).
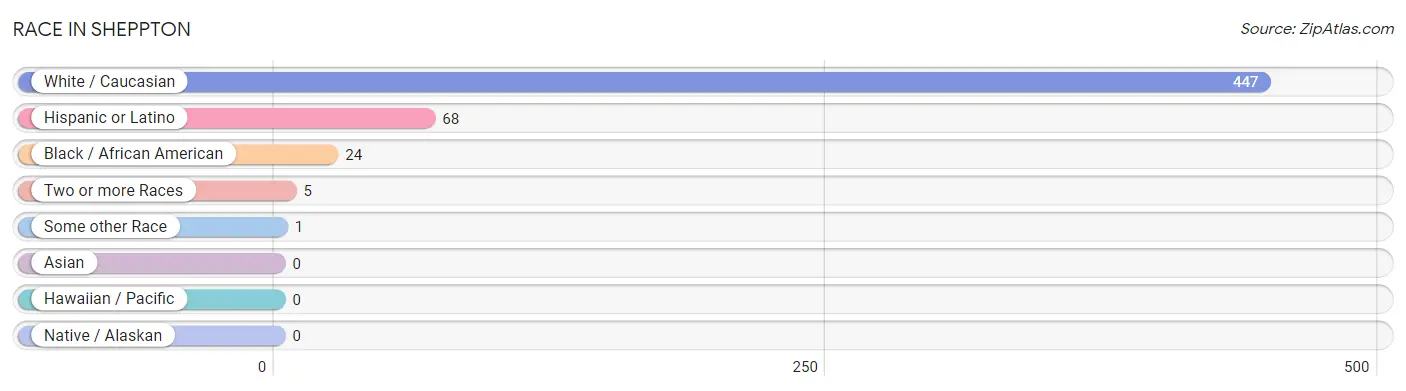
| Race | # Population | % Population |
| Asian | 0 | 0.0% |
| Black / African American | 24 | 5.0% |
| Hawaiian / Pacific | 0 | 0.0% |
| Hispanic or Latino | 68 | 14.3% |
| Native / Alaskan | 0 | 0.0% |
| White / Caucasian | 447 | 93.7% |
| Two or more Races | 5 | 1.1% |
| Some other Race | 1 | 0.2% |
| Total | 477 | 100.0% |
Ancestry in Sheppton
The most populous ancestries reported in Sheppton are German (263 | 55.1%), Italian (222 | 46.5%), Irish (70 | 14.7%), Polish (40 | 8.4%), and Dominican (32 | 6.7%), together accounting for 131.5% of all Sheppton residents.
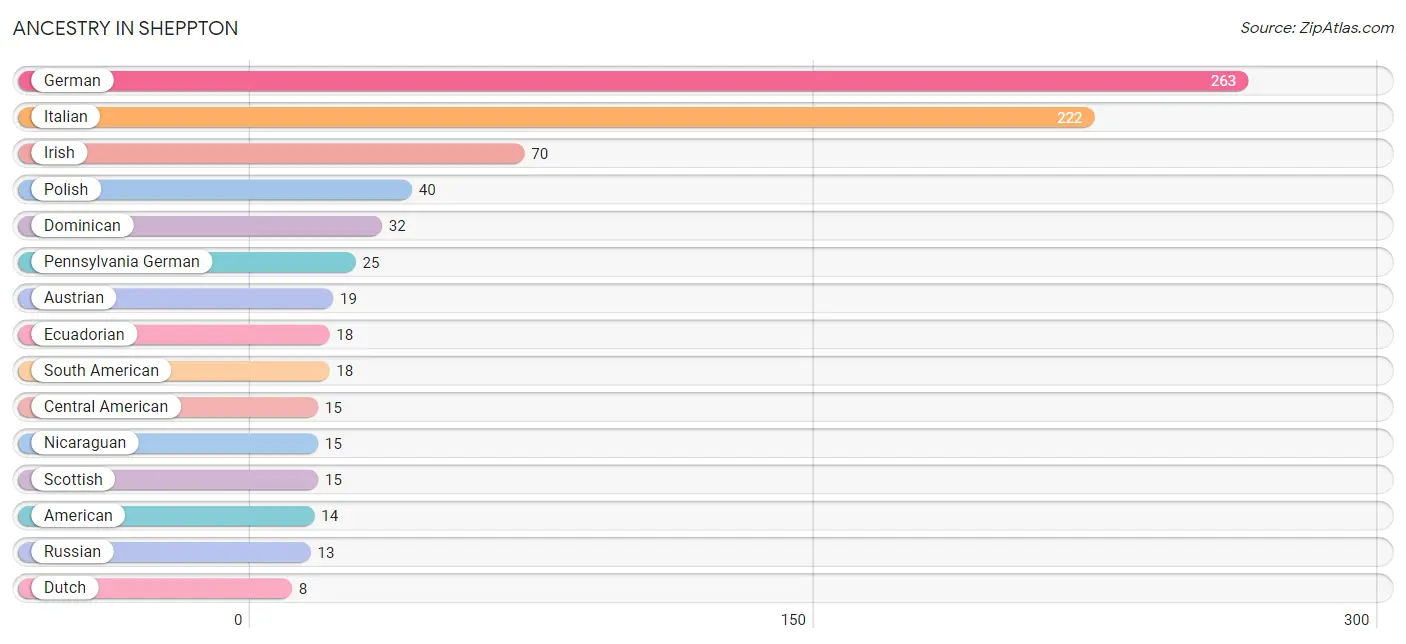
| Ancestry | # Population | % Population |
| American | 14 | 2.9% |
| Austrian | 19 | 4.0% |
| Central American | 15 | 3.1% |
| Dominican | 32 | 6.7% |
| Dutch | 8 | 1.7% |
| Ecuadorian | 18 | 3.8% |
| German | 263 | 55.1% |
| Greek | 3 | 0.6% |
| Irish | 70 | 14.7% |
| Italian | 222 | 46.5% |
| Lithuanian | 5 | 1.1% |
| Mexican | 2 | 0.4% |
| Nicaraguan | 15 | 3.1% |
| Pennsylvania German | 25 | 5.2% |
| Polish | 40 | 8.4% |
| Puerto Rican | 1 | 0.2% |
| Russian | 13 | 2.7% |
| Scottish | 15 | 3.1% |
| Slovak | 3 | 0.6% |
| South American | 18 | 3.8% | View All 20 Rows |
Immigrants in Sheppton
The most numerous immigrant groups reported in Sheppton came from Latin America (50 | 10.5%), Ecuador (18 | 3.8%), South America (18 | 3.8%), Central America (17 | 3.6%), and Caribbean (15 | 3.1%), together accounting for 24.7% of all Sheppton residents.
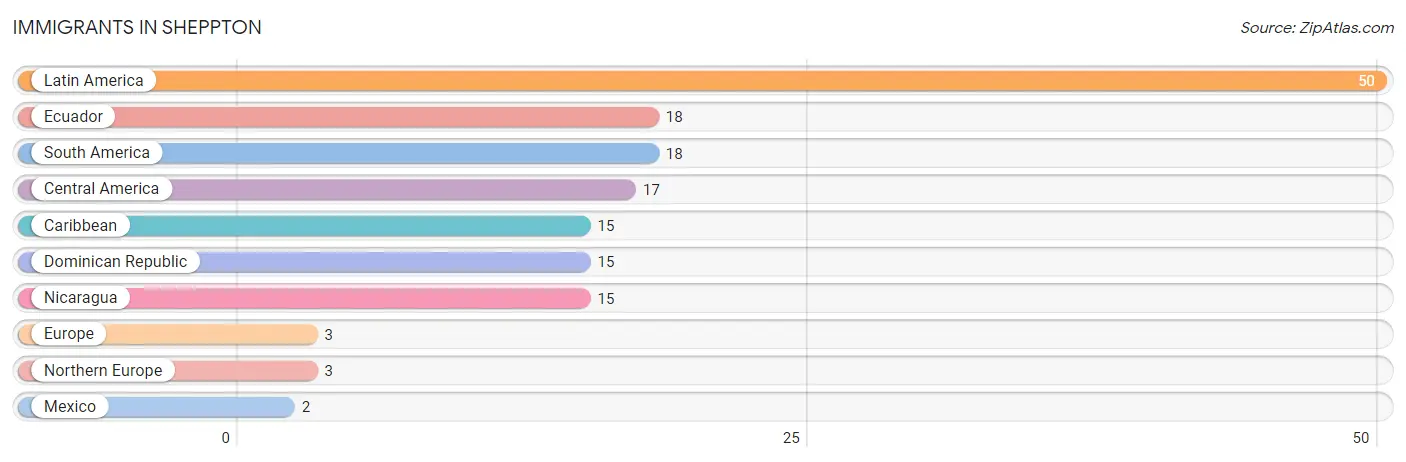
| Immigration Origin | # Population | % Population |
| Caribbean | 15 | 3.1% |
| Central America | 17 | 3.6% |
| Dominican Republic | 15 | 3.1% |
| Ecuador | 18 | 3.8% |
| Europe | 3 | 0.6% |
| Latin America | 50 | 10.5% |
| Mexico | 2 | 0.4% |
| Nicaragua | 15 | 3.1% |
| Northern Europe | 3 | 0.6% |
| South America | 18 | 3.8% | View All 10 Rows |
Sex and Age in Sheppton
Sex and Age in Sheppton
The most populous age groups in Sheppton are 10 to 14 Years (85 | 40.5%) for men and 40 to 44 Years (66 | 24.7%) for women.
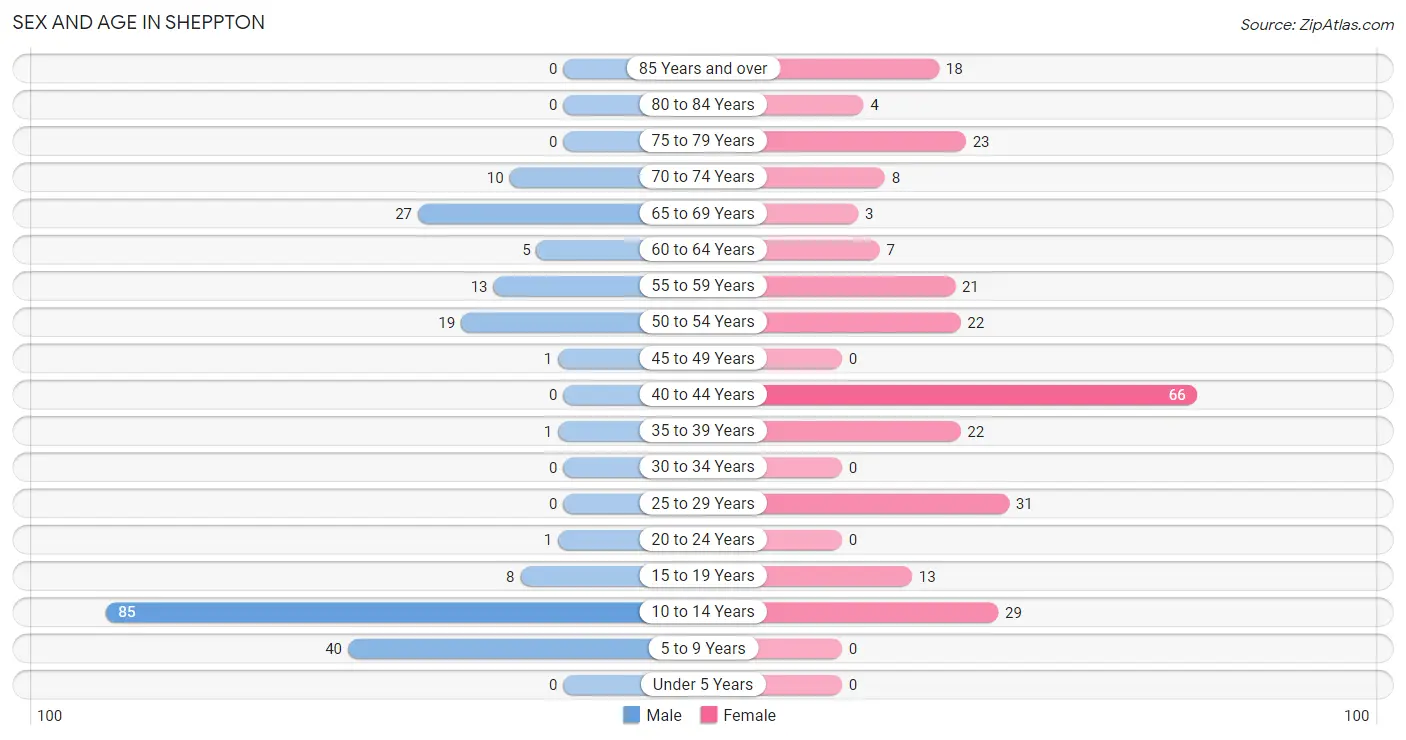
| Age Bracket | Male | Female |
| Under 5 Years | 0 (0.0%) | 0 (0.0%) |
| 5 to 9 Years | 40 (19.1%) | 0 (0.0%) |
| 10 to 14 Years | 85 (40.5%) | 29 (10.9%) |
| 15 to 19 Years | 8 (3.8%) | 13 (4.9%) |
| 20 to 24 Years | 1 (0.5%) | 0 (0.0%) |
| 25 to 29 Years | 0 (0.0%) | 31 (11.6%) |
| 30 to 34 Years | 0 (0.0%) | 0 (0.0%) |
| 35 to 39 Years | 1 (0.5%) | 22 (8.2%) |
| 40 to 44 Years | 0 (0.0%) | 66 (24.7%) |
| 45 to 49 Years | 1 (0.5%) | 0 (0.0%) |
| 50 to 54 Years | 19 (9.0%) | 22 (8.2%) |
| 55 to 59 Years | 13 (6.2%) | 21 (7.9%) |
| 60 to 64 Years | 5 (2.4%) | 7 (2.6%) |
| 65 to 69 Years | 27 (12.9%) | 3 (1.1%) |
| 70 to 74 Years | 10 (4.8%) | 8 (3.0%) |
| 75 to 79 Years | 0 (0.0%) | 23 (8.6%) |
| 80 to 84 Years | 0 (0.0%) | 4 (1.5%) |
| 85 Years and over | 0 (0.0%) | 18 (6.7%) |
| Total | 210 (100.0%) | 267 (100.0%) |
Families and Households in Sheppton
Median Family Size in Sheppton
The median family size in Sheppton is 3.73 persons per family, with single female/mother families (44 | 40.0%) accounting for the largest median family size of 5.61 persons per family. On the other hand, single male/father families (19 | 17.3%) represent the smallest median family size with 2.21 persons per family.
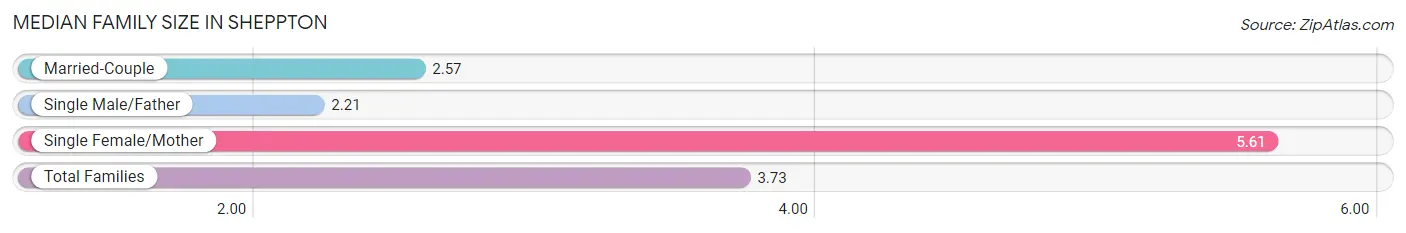
| Family Type | # Families | Family Size |
| Married-Couple | 47 (42.7%) | 2.57 |
| Single Male/Father | 19 (17.3%) | 2.21 |
| Single Female/Mother | 44 (40.0%) | 5.61 |
| Total Families | 110 (100.0%) | 3.73 |
Median Household Size in Sheppton
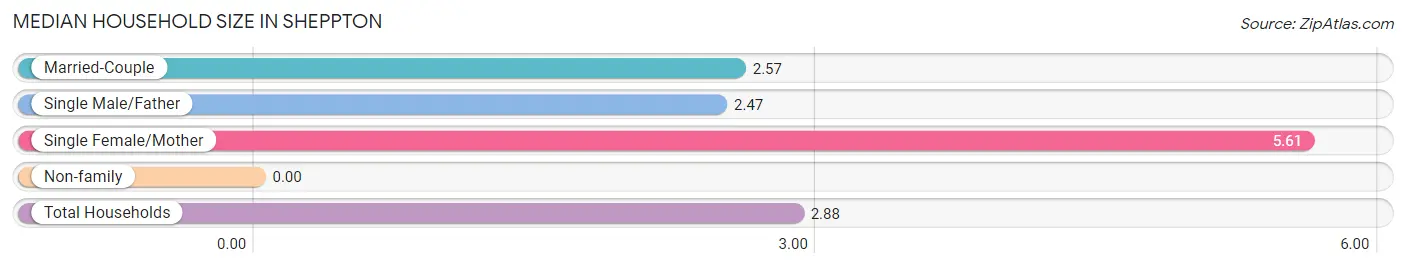
| Household Type | # Households | Household Size |
| Married-Couple | 47 (29.0%) | 2.57 |
| Single Male/Father | 19 (11.7%) | 2.47 |
| Single Female/Mother | 44 (27.2%) | 5.61 |
| Non-family | 52 (32.1%) | - |
| Total Households | 162 (100.0%) | 2.88 |
Household Size by Marriage Status in Sheppton
Out of a total of 162 households in Sheppton, 110 (67.9%) are family households, while 52 (32.1%) are nonfamily households. The most numerous type of family households are 2-person households, comprising 42, and the most common type of nonfamily households are 1-person households, comprising 52.
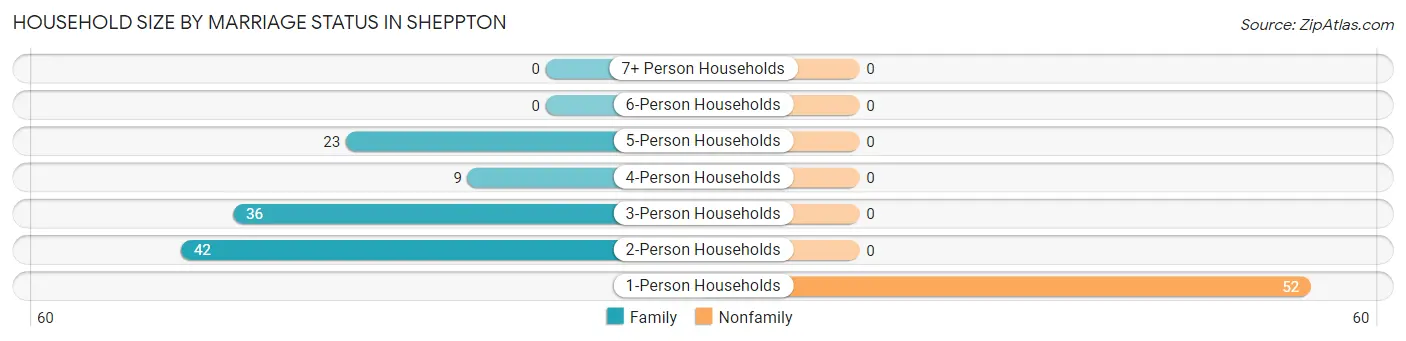
| Household Size | Family Households | Nonfamily Households |
| 1-Person Households | - | 52 (32.1%) |
| 2-Person Households | 42 (25.9%) | 0 (0.0%) |
| 3-Person Households | 36 (22.2%) | 0 (0.0%) |
| 4-Person Households | 9 (5.6%) | 0 (0.0%) |
| 5-Person Households | 23 (14.2%) | 0 (0.0%) |
| 6-Person Households | 0 (0.0%) | 0 (0.0%) |
| 7+ Person Households | 0 (0.0%) | 0 (0.0%) |
| Total | 110 (67.9%) | 52 (32.1%) |
Female Fertility in Sheppton
Fertility by Age in Sheppton
| Age Bracket | Women with Births | Births / 1,000 Women |
| 15 to 19 years | 0 (0.0%) | 0.0 |
| 20 to 34 years | 0 (0.0%) | 0.0 |
| 35 to 50 years | 0 (0.0%) | 0.0 |
| Total | 0 (0.0%) | 0.0 |
Fertility by Age by Marriage Status in Sheppton
| Age Bracket | Married | Unmarried |
| 15 to 19 years | 0 (0.0%) | 0 (0.0%) |
| 20 to 34 years | 0 (0.0%) | 0 (0.0%) |
| 35 to 50 years | 0 (0.0%) | 0 (0.0%) |
| Total | 0 (0.0%) | 0 (0.0%) |
Fertility by Education in Sheppton
| Educational Attainment | Women with Births | Births / 1,000 Women |
| Less than High School | 0 (0.0%) | 0.0 |
| High School Diploma | 0 (0.0%) | 0.0 |
| College or Associate's Degree | 0 (0.0%) | 0.0 |
| Bachelor's Degree | 0 (0.0%) | 0.0 |
| Graduate Degree | 0 (0.0%) | 0.0 |
| Total | 0 (0.0%) | 0.0 |
Fertility by Education by Marriage Status in Sheppton
| Educational Attainment | Married | Unmarried |
| Less than High School | 0 (0.0%) | 0 (0.0%) |
| High School Diploma | 0 (0.0%) | 0 (0.0%) |
| College or Associate's Degree | 0 (0.0%) | 0 (0.0%) |
| Bachelor's Degree | 0 (0.0%) | 0 (0.0%) |
| Graduate Degree | 0 (0.0%) | 0 (0.0%) |
| Total | 0 (0.0%) | 0 (0.0%) |
Employment Characteristics in Sheppton
Employment by Class of Employer in Sheppton
Among the 106 employed individuals in Sheppton, private company employees (64 | 60.4%), self-employed (not incorporated) (16 | 15.1%), and federal government employees (9 | 8.5%) make up the most common classes of employment.
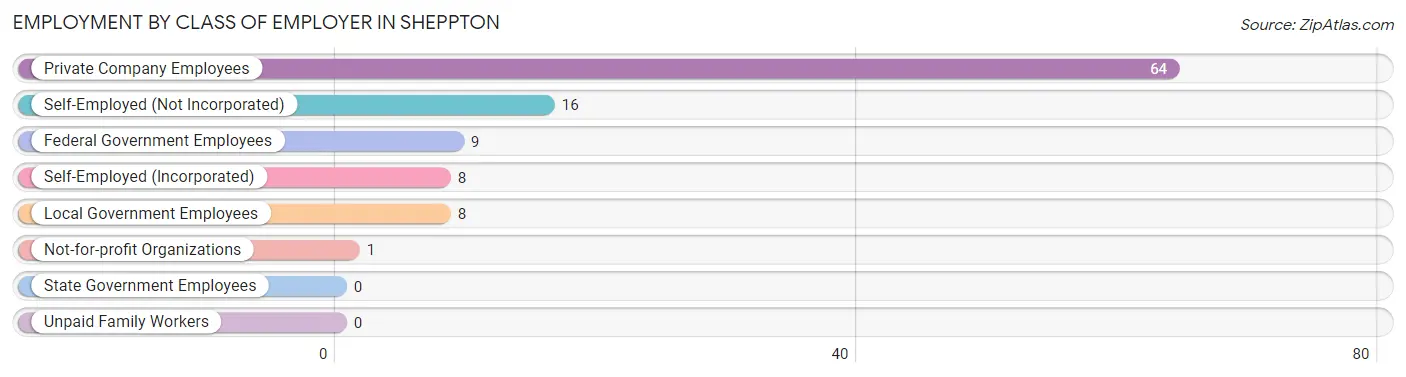
| Employer Class | # Employees | % Employees |
| Private Company Employees | 64 | 60.4% |
| Self-Employed (Incorporated) | 8 | 7.5% |
| Self-Employed (Not Incorporated) | 16 | 15.1% |
| Not-for-profit Organizations | 1 | 0.9% |
| Local Government Employees | 8 | 7.5% |
| State Government Employees | 0 | 0.0% |
| Federal Government Employees | 9 | 8.5% |
| Unpaid Family Workers | 0 | 0.0% |
| Total | 106 | 100.0% |
Employment Status by Age in Sheppton
According to the labor force statistics for Sheppton, out of the total population over 16 years of age (323), 39.0% or 126 individuals are in the labor force, with 7.1% or 9 of them unemployed. The age group with the highest labor force participation rate is 20 to 24 years, with 100.0% or 1 individuals in the labor force. Within the labor force, the 55 to 59 years age range has the highest percentage of unemployed individuals, with 50.0% or 9 of them being unemployed.
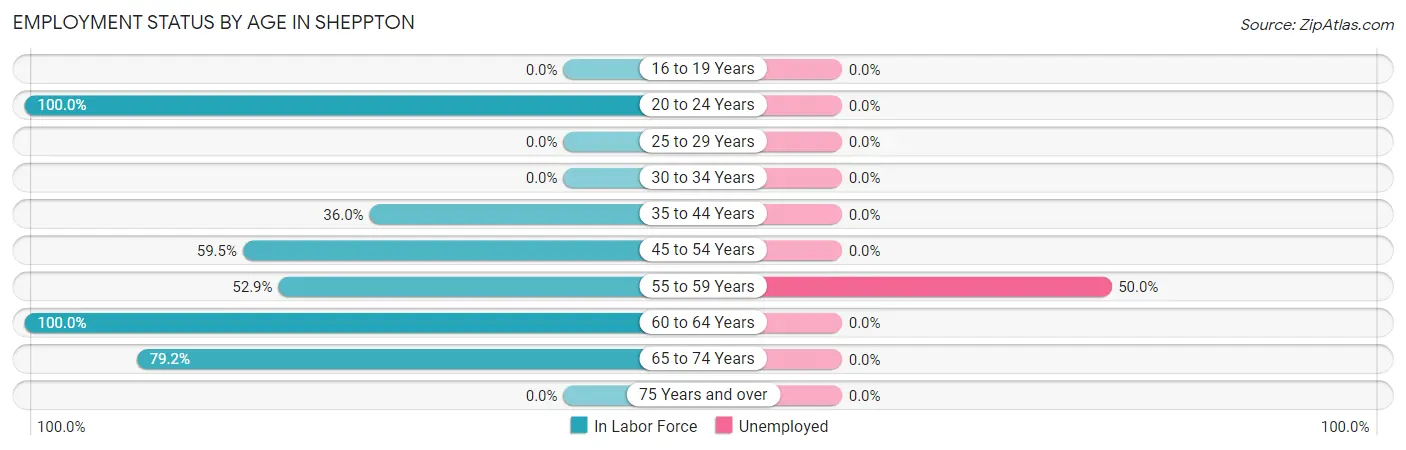
| Age Bracket | In Labor Force | Unemployed |
| 16 to 19 Years | 0 (0.0%) | 0 (0.0%) |
| 20 to 24 Years | 1 (100.0%) | 0 (0.0%) |
| 25 to 29 Years | 0 (0.0%) | 0 (0.0%) |
| 30 to 34 Years | 0 (0.0%) | 0 (0.0%) |
| 35 to 44 Years | 32 (36.0%) | 0 (0.0%) |
| 45 to 54 Years | 25 (59.5%) | 0 (0.0%) |
| 55 to 59 Years | 18 (52.9%) | 9 (50.0%) |
| 60 to 64 Years | 12 (100.0%) | 0 (0.0%) |
| 65 to 74 Years | 38 (79.2%) | 0 (0.0%) |
| 75 Years and over | 0 (0.0%) | 0 (0.0%) |
| Total | 126 (39.0%) | 9 (7.1%) |
Employment Status by Educational Attainment in Sheppton
According to labor force statistics for Sheppton, 41.8% of individuals (87) out of the total population between 25 and 64 years of age (208) are in the labor force, with 10.3% or 9 of them being unemployed. The group with the highest labor force participation rate are those with the educational attainment of less than high school, with 100.0% or 2 individuals in the labor force. Within the labor force, individuals with high school diploma education have the highest percentage of unemployment, with 37.5% or 9 of them being unemployed.
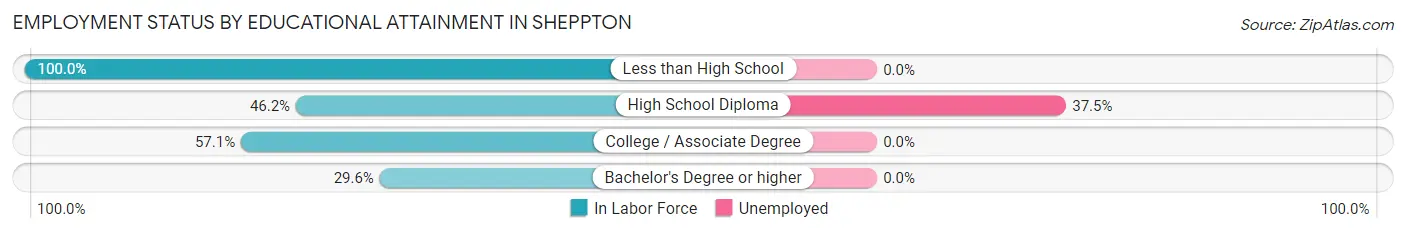
| Educational Attainment | In Labor Force | Unemployed |
| Less than High School | 2 (100.0%) | 0 (0.0%) |
| High School Diploma | 24 (46.2%) | 20 (37.5%) |
| College / Associate Degree | 32 (57.1%) | 0 (0.0%) |
| Bachelor's Degree or higher | 29 (29.6%) | 0 (0.0%) |
| Total | 87 (41.8%) | 21 (10.3%) |
Employment Occupations by Sex in Sheppton
Management, Business, Science and Arts Occupations
The most common Management, Business, Science and Arts occupations in Sheppton are Management (30 | 25.6%), Community & Social Service (11 | 9.4%), Education Instruction & Library (11 | 9.4%), and Business & Financial (9 | 7.7%).
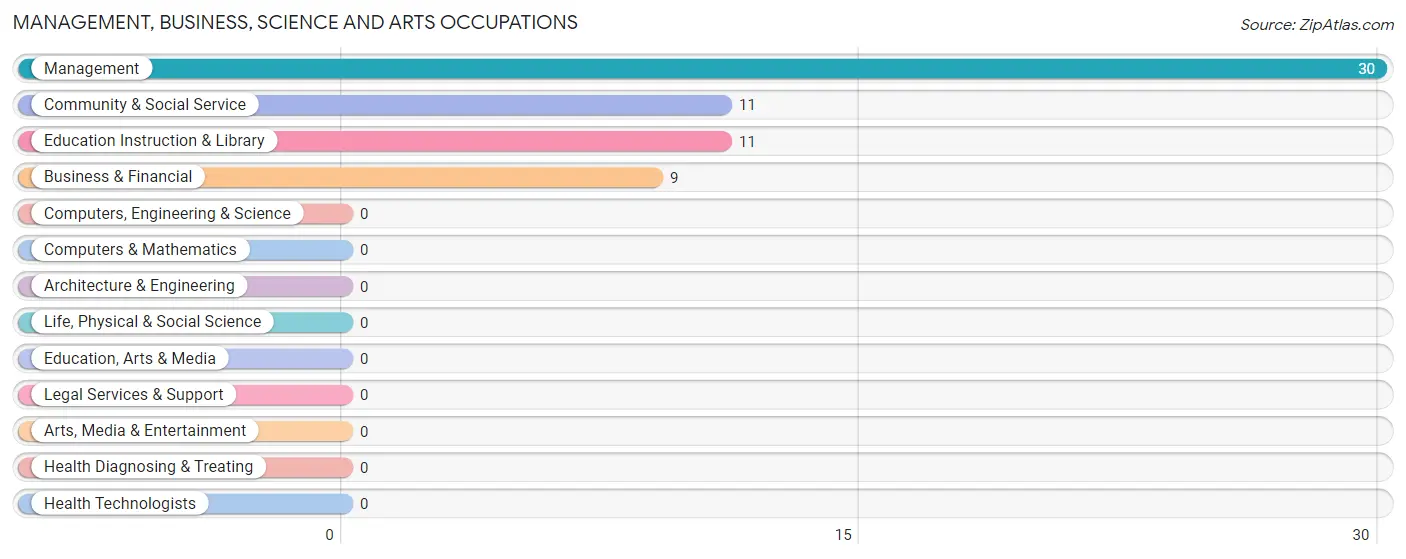
Management, Business, Science and Arts Occupations by Sex
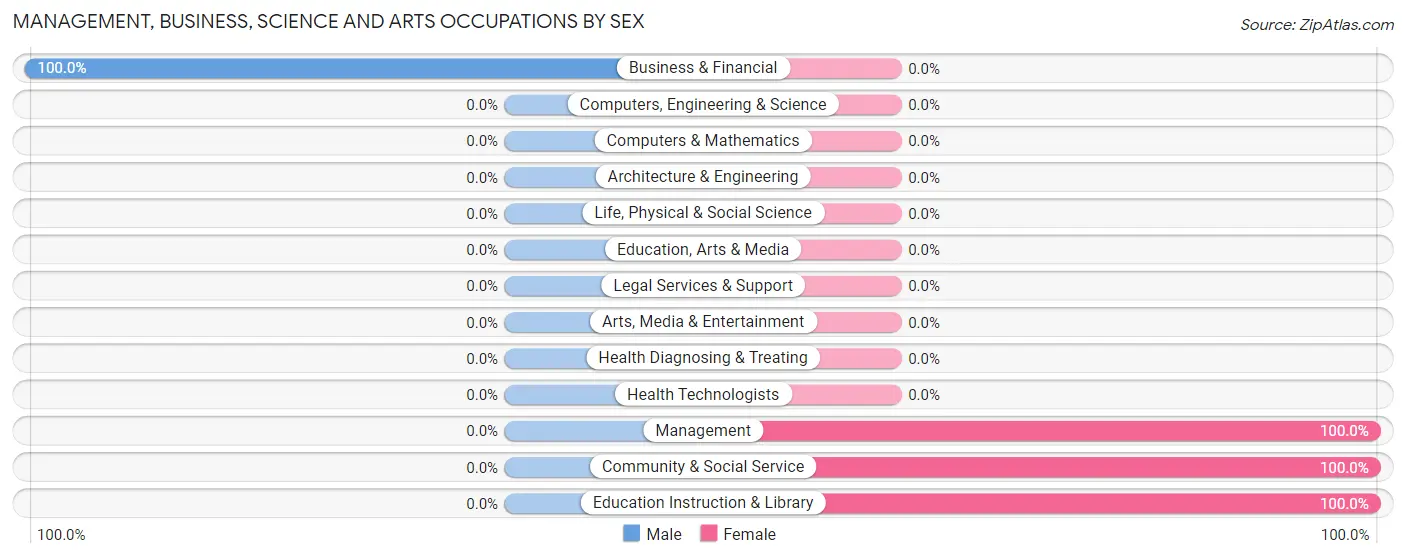
| Occupation | Male | Female |
| Management | 0 (0.0%) | 30 (100.0%) |
| Business & Financial | 9 (100.0%) | 0 (0.0%) |
| Computers, Engineering & Science | 0 (0.0%) | 0 (0.0%) |
| Computers & Mathematics | 0 (0.0%) | 0 (0.0%) |
| Architecture & Engineering | 0 (0.0%) | 0 (0.0%) |
| Life, Physical & Social Science | 0 (0.0%) | 0 (0.0%) |
| Community & Social Service | 0 (0.0%) | 11 (100.0%) |
| Education, Arts & Media | 0 (0.0%) | 0 (0.0%) |
| Legal Services & Support | 0 (0.0%) | 0 (0.0%) |
| Education Instruction & Library | 0 (0.0%) | 11 (100.0%) |
| Arts, Media & Entertainment | 0 (0.0%) | 0 (0.0%) |
| Health Diagnosing & Treating | 0 (0.0%) | 0 (0.0%) |
| Health Technologists | 0 (0.0%) | 0 (0.0%) |
| Total (Category) | 9 (18.0%) | 41 (82.0%) |
| Total (Overall) | 49 (41.9%) | 68 (58.1%) |
Services Occupations
The most common Services occupations in Sheppton are Food Preparation & Serving (9 | 7.7%), and Personal Care & Service (7 | 6.0%).
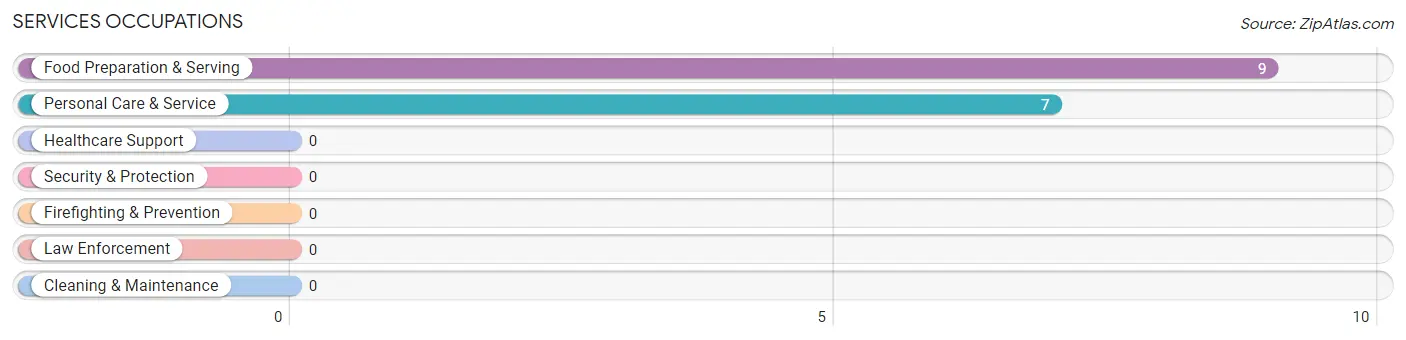
Services Occupations by Sex
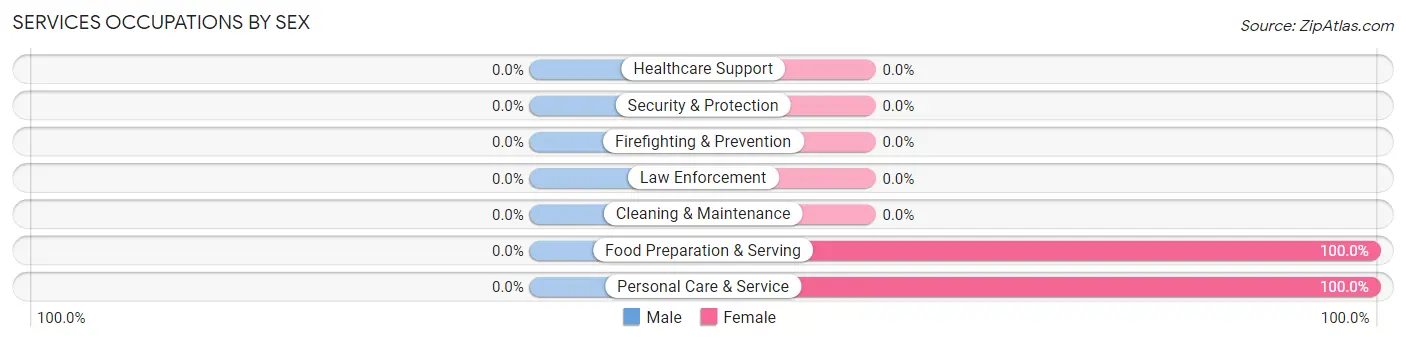
| Occupation | Male | Female |
| Healthcare Support | 0 (0.0%) | 0 (0.0%) |
| Security & Protection | 0 (0.0%) | 0 (0.0%) |
| Firefighting & Prevention | 0 (0.0%) | 0 (0.0%) |
| Law Enforcement | 0 (0.0%) | 0 (0.0%) |
| Food Preparation & Serving | 0 (0.0%) | 9 (100.0%) |
| Cleaning & Maintenance | 0 (0.0%) | 0 (0.0%) |
| Personal Care & Service | 0 (0.0%) | 7 (100.0%) |
| Total (Category) | 0 (0.0%) | 16 (100.0%) |
| Total (Overall) | 49 (41.9%) | 68 (58.1%) |
Sales and Office Occupations
The most common Sales and Office occupations in Sheppton are , and Office & Administration (22 | 18.8%).
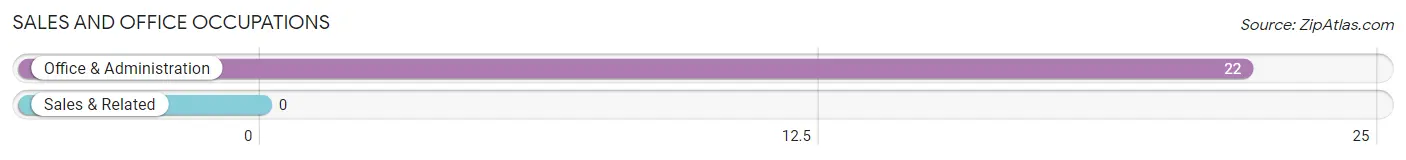
Sales and Office Occupations by Sex
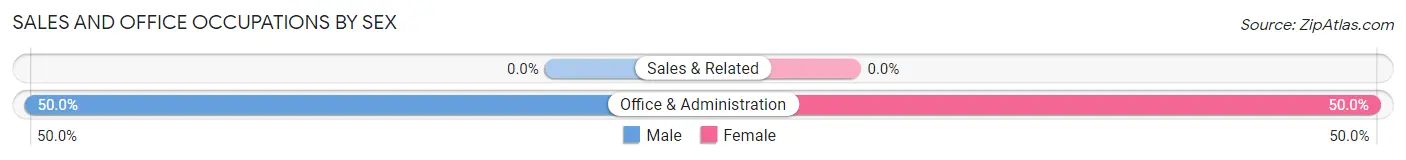
| Occupation | Male | Female |
| Sales & Related | 0 (0.0%) | 0 (0.0%) |
| Office & Administration | 11 (50.0%) | 11 (50.0%) |
| Total (Category) | 11 (50.0%) | 11 (50.0%) |
| Total (Overall) | 49 (41.9%) | 68 (58.1%) |
Natural Resources, Construction and Maintenance Occupations
The most common Natural Resources, Construction and Maintenance occupations in Sheppton are Installation, Maintenance & Repair (5 | 4.3%), and Farming, Fishing & Forestry (3 | 2.6%).
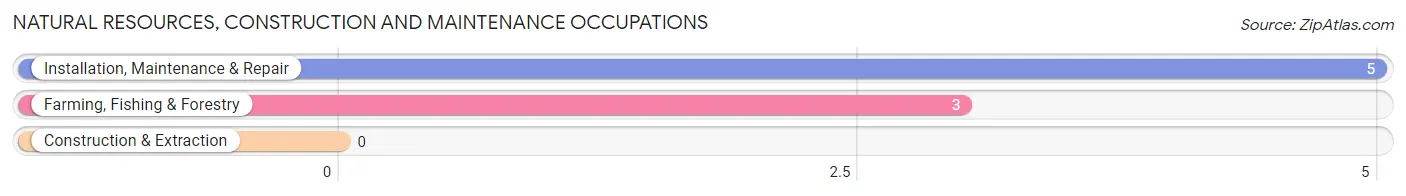
Natural Resources, Construction and Maintenance Occupations by Sex
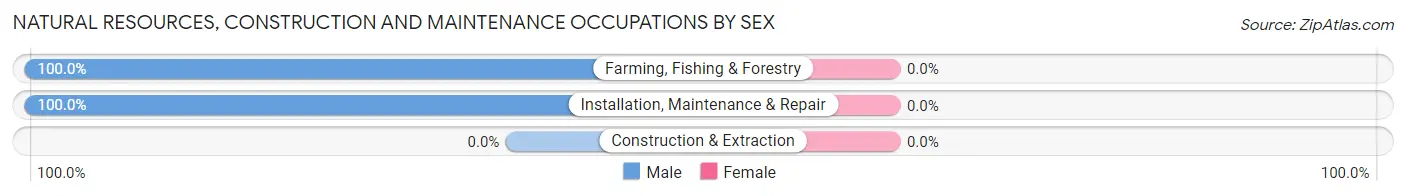
| Occupation | Male | Female |
| Farming, Fishing & Forestry | 3 (100.0%) | 0 (0.0%) |
| Construction & Extraction | 0 (0.0%) | 0 (0.0%) |
| Installation, Maintenance & Repair | 5 (100.0%) | 0 (0.0%) |
| Total (Category) | 8 (100.0%) | 0 (0.0%) |
| Total (Overall) | 49 (41.9%) | 68 (58.1%) |
Production, Transportation and Moving Occupations
The most common Production, Transportation and Moving occupations in Sheppton are Material Moving (11 | 9.4%), and Production (10 | 8.6%).
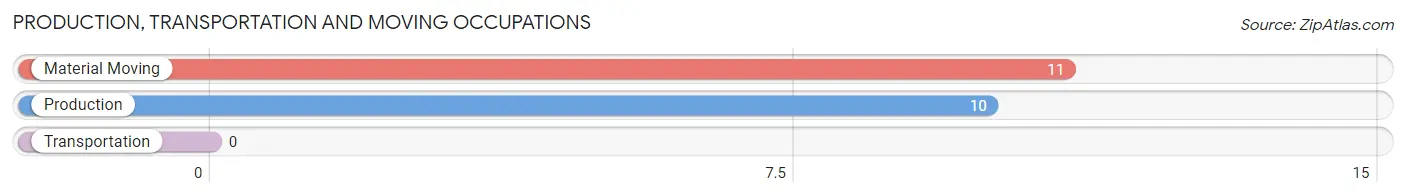
Production, Transportation and Moving Occupations by Sex
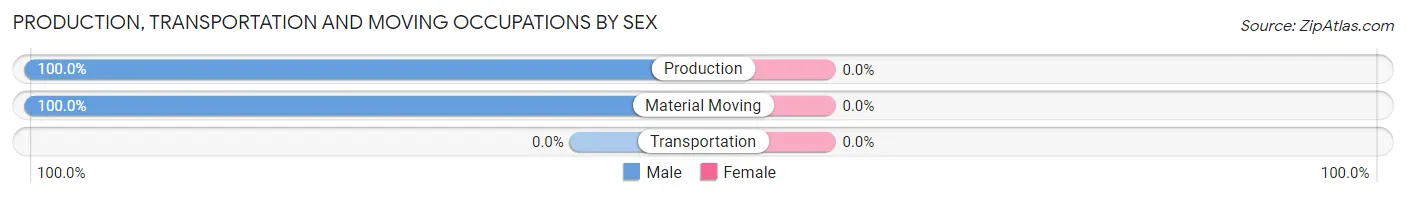
| Occupation | Male | Female |
| Production | 10 (100.0%) | 0 (0.0%) |
| Transportation | 0 (0.0%) | 0 (0.0%) |
| Material Moving | 11 (100.0%) | 0 (0.0%) |
| Total (Category) | 21 (100.0%) | 0 (0.0%) |
| Total (Overall) | 49 (41.9%) | 68 (58.1%) |
Employment Industries by Sex in Sheppton
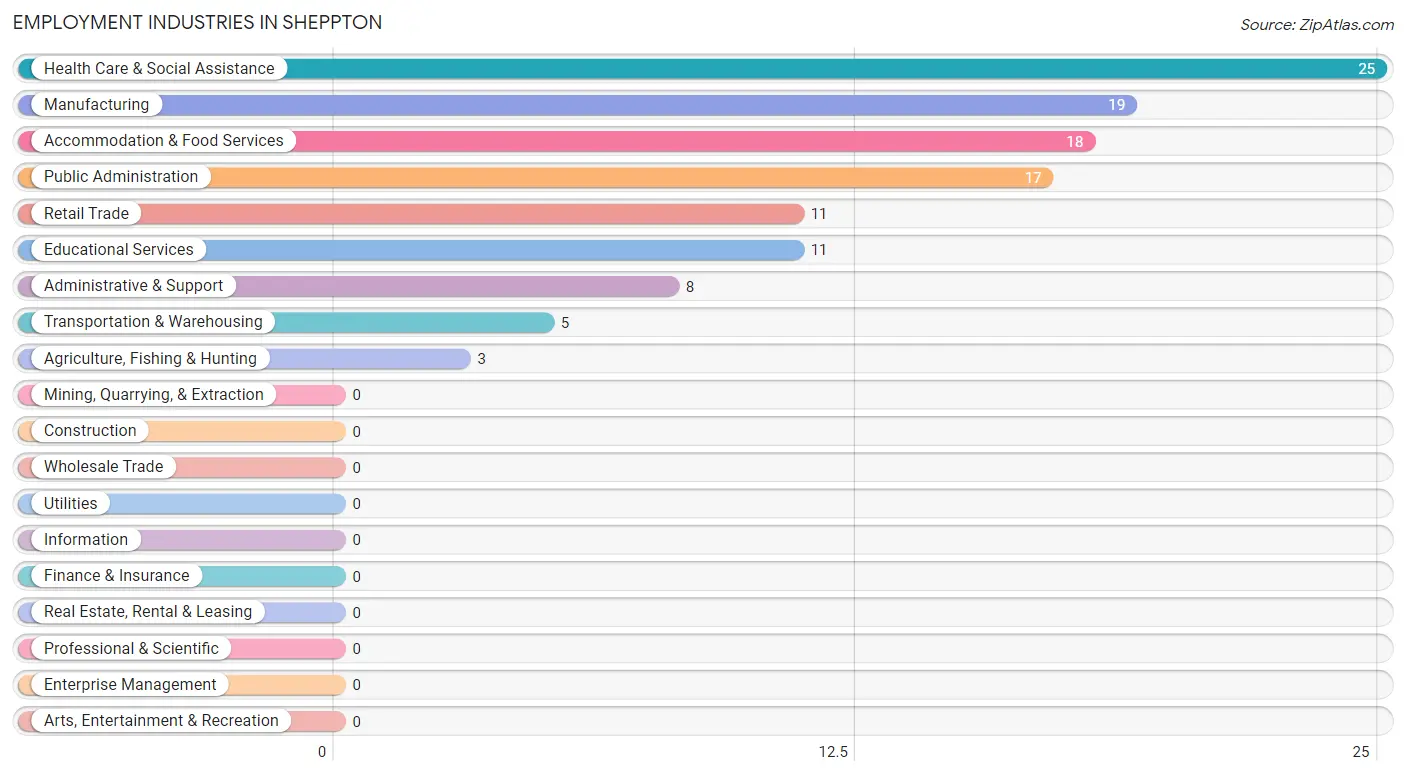
Employment Industries in Sheppton
The major employment industries in Sheppton include Health Care & Social Assistance (25 | 21.4%), Manufacturing (19 | 16.2%), Accommodation & Food Services (18 | 15.4%), Public Administration (17 | 14.5%), and Retail Trade (11 | 9.4%).
Employment Industries by Sex in Sheppton
The Sheppton industries that see more men than women are Agriculture, Fishing & Hunting (100.0%), Retail Trade (100.0%), and Transportation & Warehousing (100.0%), whereas the industries that tend to have a higher number of women are Administrative & Support (100.0%), Educational Services (100.0%), and Health Care & Social Assistance (100.0%).
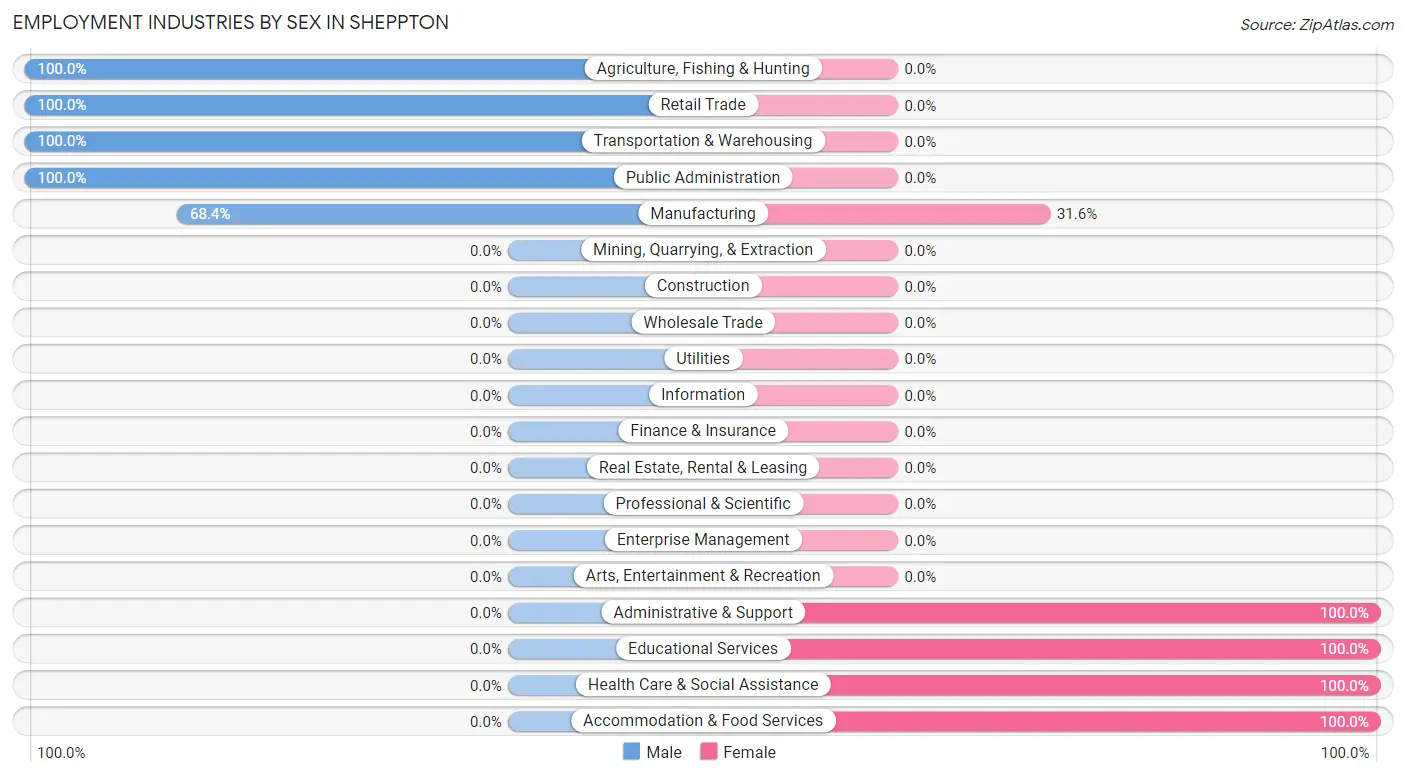
| Industry | Male | Female |
| Agriculture, Fishing & Hunting | 3 (100.0%) | 0 (0.0%) |
| Mining, Quarrying, & Extraction | 0 (0.0%) | 0 (0.0%) |
| Construction | 0 (0.0%) | 0 (0.0%) |
| Manufacturing | 13 (68.4%) | 6 (31.6%) |
| Wholesale Trade | 0 (0.0%) | 0 (0.0%) |
| Retail Trade | 11 (100.0%) | 0 (0.0%) |
| Transportation & Warehousing | 5 (100.0%) | 0 (0.0%) |
| Utilities | 0 (0.0%) | 0 (0.0%) |
| Information | 0 (0.0%) | 0 (0.0%) |
| Finance & Insurance | 0 (0.0%) | 0 (0.0%) |
| Real Estate, Rental & Leasing | 0 (0.0%) | 0 (0.0%) |
| Professional & Scientific | 0 (0.0%) | 0 (0.0%) |
| Enterprise Management | 0 (0.0%) | 0 (0.0%) |
| Administrative & Support | 0 (0.0%) | 8 (100.0%) |
| Educational Services | 0 (0.0%) | 11 (100.0%) |
| Health Care & Social Assistance | 0 (0.0%) | 25 (100.0%) |
| Arts, Entertainment & Recreation | 0 (0.0%) | 0 (0.0%) |
| Accommodation & Food Services | 0 (0.0%) | 18 (100.0%) |
| Public Administration | 17 (100.0%) | 0 (0.0%) |
| Total | 49 (41.9%) | 68 (58.1%) |
Education in Sheppton
School Enrollment in Sheppton
The most common levels of schooling among the 188 students in Sheppton are middle school (106 | 56.4%), kindergarten (40 | 21.3%), and high school (15 | 8.0%).
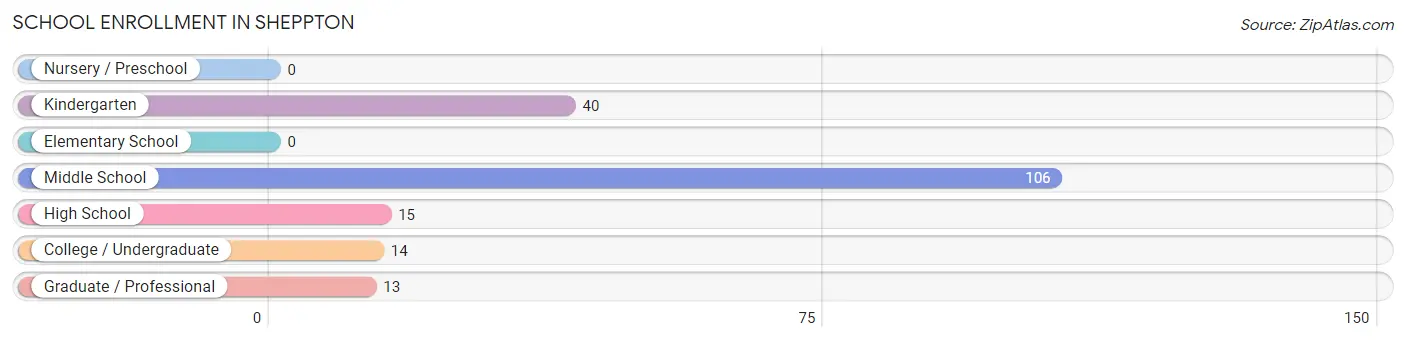
| School Level | # Students | % Students |
| Nursery / Preschool | 0 | 0.0% |
| Kindergarten | 40 | 21.3% |
| Elementary School | 0 | 0.0% |
| Middle School | 106 | 56.4% |
| High School | 15 | 8.0% |
| College / Undergraduate | 14 | 7.4% |
| Graduate / Professional | 13 | 6.9% |
| Total | 188 | 100.0% |
School Enrollment by Age by Funding Source in Sheppton
Out of a total of 188 students who are enrolled in schools in Sheppton, 14 (7.4%) attend a private institution, while the remaining 174 (92.6%) are enrolled in public schools. The age group of 20 to 24 year olds has the highest likelihood of being enrolled in private schools, with 1 (100.0% in the age bracket) enrolled. Conversely, the age group of 5 to 9 year old has the lowest likelihood of being enrolled in a private school, with 40 (100.0% in the age bracket) attending a public institution.
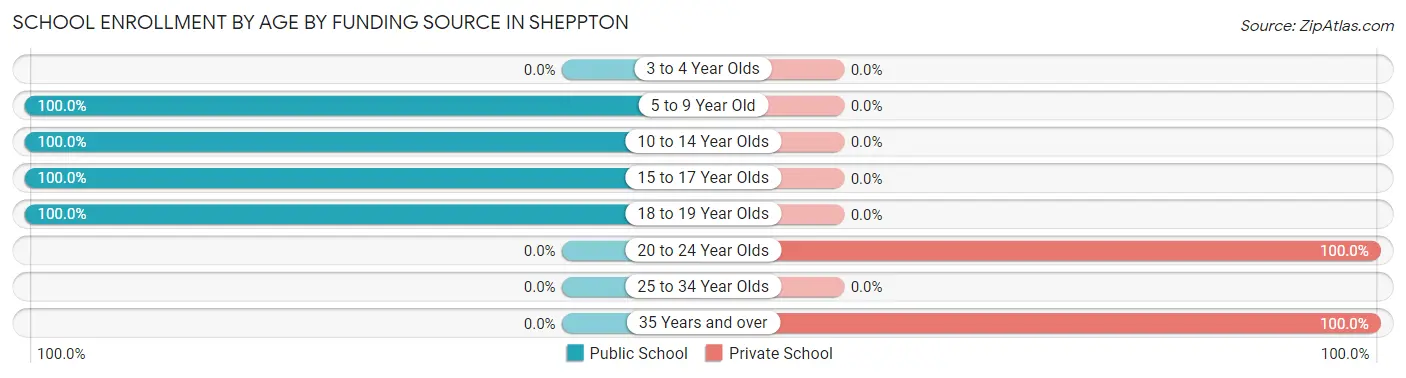
| Age Bracket | Public School | Private School |
| 3 to 4 Year Olds | 0 (0.0%) | 0 (0.0%) |
| 5 to 9 Year Old | 40 (100.0%) | 0 (0.0%) |
| 10 to 14 Year Olds | 114 (100.0%) | 0 (0.0%) |
| 15 to 17 Year Olds | 7 (100.0%) | 0 (0.0%) |
| 18 to 19 Year Olds | 13 (100.0%) | 0 (0.0%) |
| 20 to 24 Year Olds | 0 (0.0%) | 1 (100.0%) |
| 25 to 34 Year Olds | 0 (0.0%) | 0 (0.0%) |
| 35 Years and over | 0 (0.0%) | 13 (100.0%) |
| Total | 174 (92.6%) | 14 (7.4%) |
Educational Attainment by Field of Study in Sheppton
Business (57 | 58.2%), communications (13 | 13.3%), science & technology (12 | 12.2%), education (11 | 11.2%), and visual & performing arts (5 | 5.1%) are the most common fields of study among 98 individuals in Sheppton who have obtained a bachelor's degree or higher.
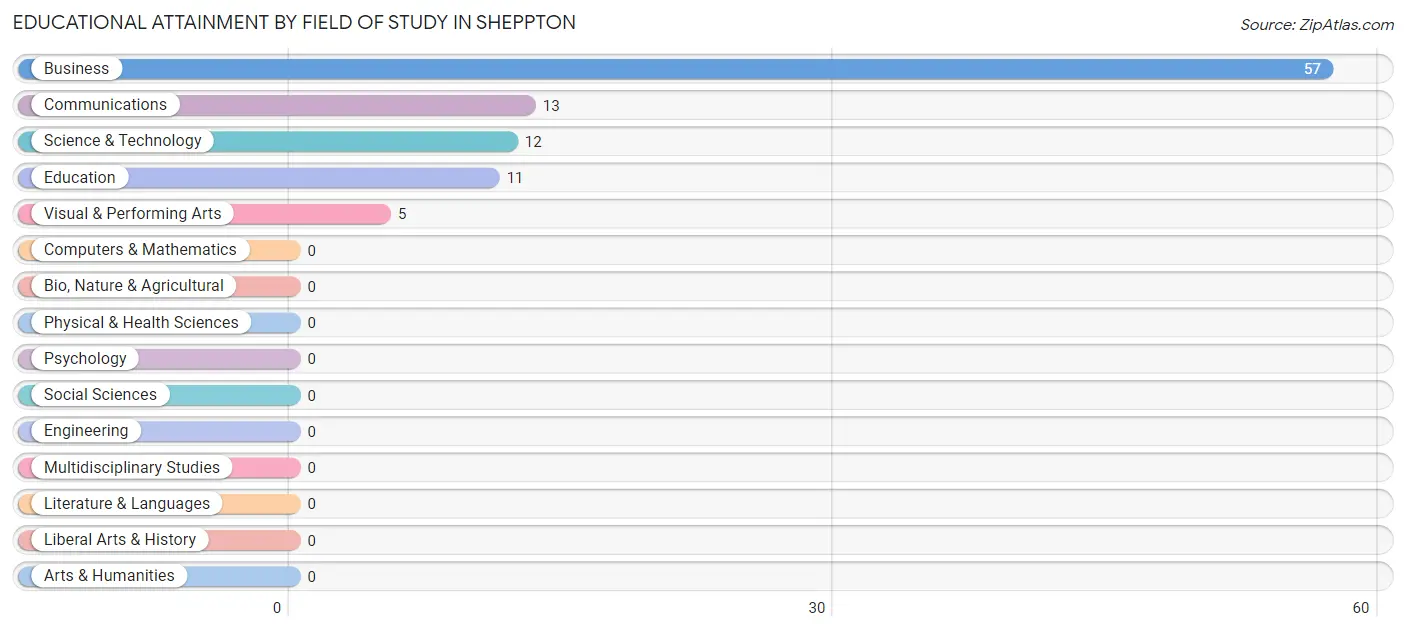
| Field of Study | # Graduates | % Graduates |
| Computers & Mathematics | 0 | 0.0% |
| Bio, Nature & Agricultural | 0 | 0.0% |
| Physical & Health Sciences | 0 | 0.0% |
| Psychology | 0 | 0.0% |
| Social Sciences | 0 | 0.0% |
| Engineering | 0 | 0.0% |
| Multidisciplinary Studies | 0 | 0.0% |
| Science & Technology | 12 | 12.2% |
| Business | 57 | 58.2% |
| Education | 11 | 11.2% |
| Literature & Languages | 0 | 0.0% |
| Liberal Arts & History | 0 | 0.0% |
| Visual & Performing Arts | 5 | 5.1% |
| Communications | 13 | 13.3% |
| Arts & Humanities | 0 | 0.0% |
| Total | 98 | 100.0% |
Transportation & Commute in Sheppton
Vehicle Availability by Sex in Sheppton
The most prevalent vehicle ownership categories in Sheppton are males with 2 vehicles (24, accounting for 52.2%) and females with 2 vehicles (26, making up 42.1%).
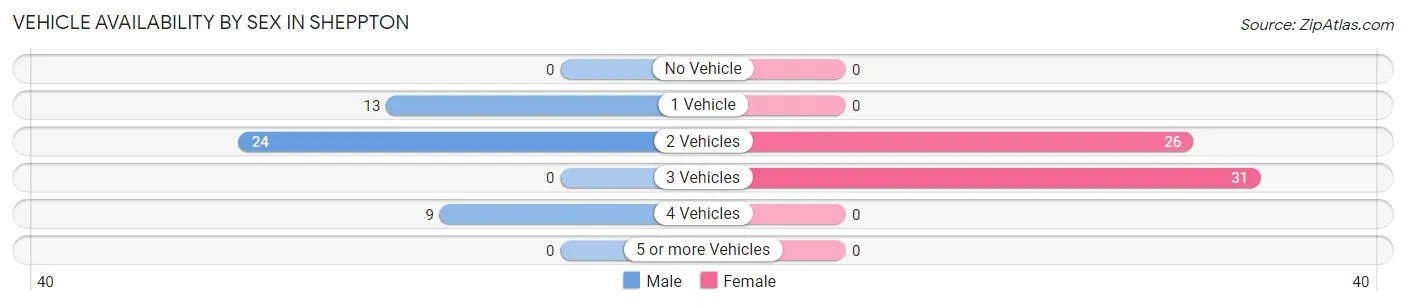
| Vehicles Available | Male | Female |
| No Vehicle | 0 (0.0%) | 0 (0.0%) |
| 1 Vehicle | 13 (28.3%) | 0 (0.0%) |
| 2 Vehicles | 24 (52.2%) | 26 (45.6%) |
| 3 Vehicles | 0 (0.0%) | 31 (54.4%) |
| 4 Vehicles | 9 (19.6%) | 0 (0.0%) |
| 5 or more Vehicles | 0 (0.0%) | 0 (0.0%) |
| Total | 46 (100.0%) | 57 (100.0%) |
Commute Time in Sheppton
The most frequently occuring commute durations in Sheppton are 10 to 14 minutes (19 commuters, 20.6%), 45 to 59 minutes (19 commuters, 20.6%), and 5 to 9 minutes (18 commuters, 19.6%).
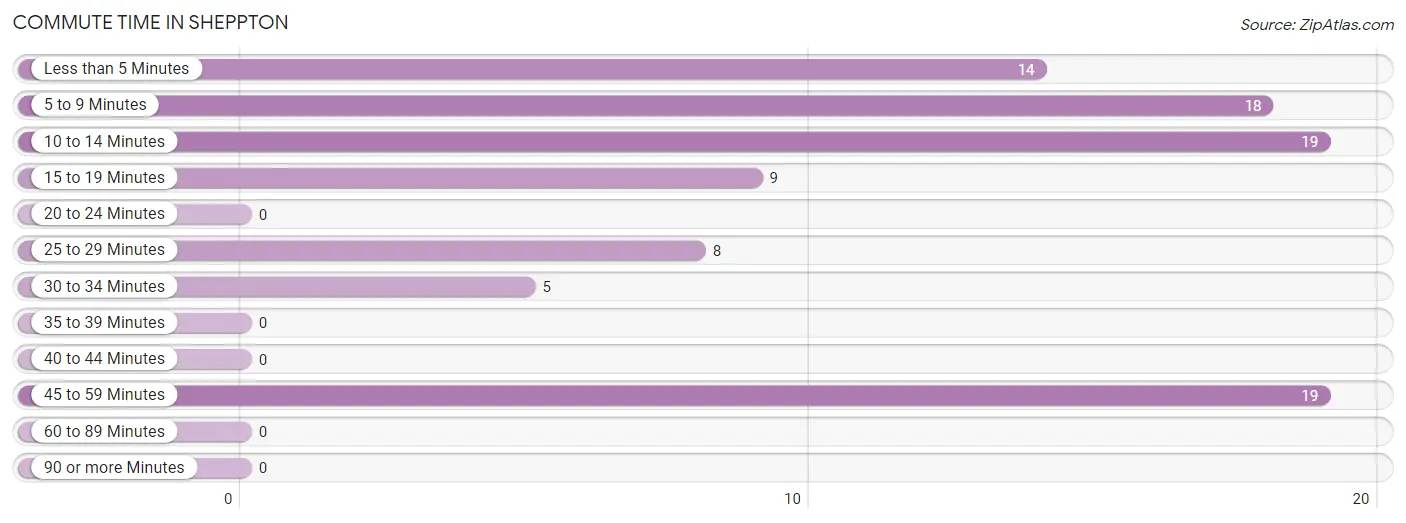
| Commute Time | # Commuters | % Commuters |
| Less than 5 Minutes | 14 | 15.2% |
| 5 to 9 Minutes | 18 | 19.6% |
| 10 to 14 Minutes | 19 | 20.6% |
| 15 to 19 Minutes | 9 | 9.8% |
| 20 to 24 Minutes | 0 | 0.0% |
| 25 to 29 Minutes | 8 | 8.7% |
| 30 to 34 Minutes | 5 | 5.4% |
| 35 to 39 Minutes | 0 | 0.0% |
| 40 to 44 Minutes | 0 | 0.0% |
| 45 to 59 Minutes | 19 | 20.6% |
| 60 to 89 Minutes | 0 | 0.0% |
| 90 or more Minutes | 0 | 0.0% |
Commute Time by Sex in Sheppton
The most common commute times in Sheppton are 5 to 9 minutes (18 commuters, 37.5%) for males and less than 5 minutes (13 commuters, 29.5%) for females.
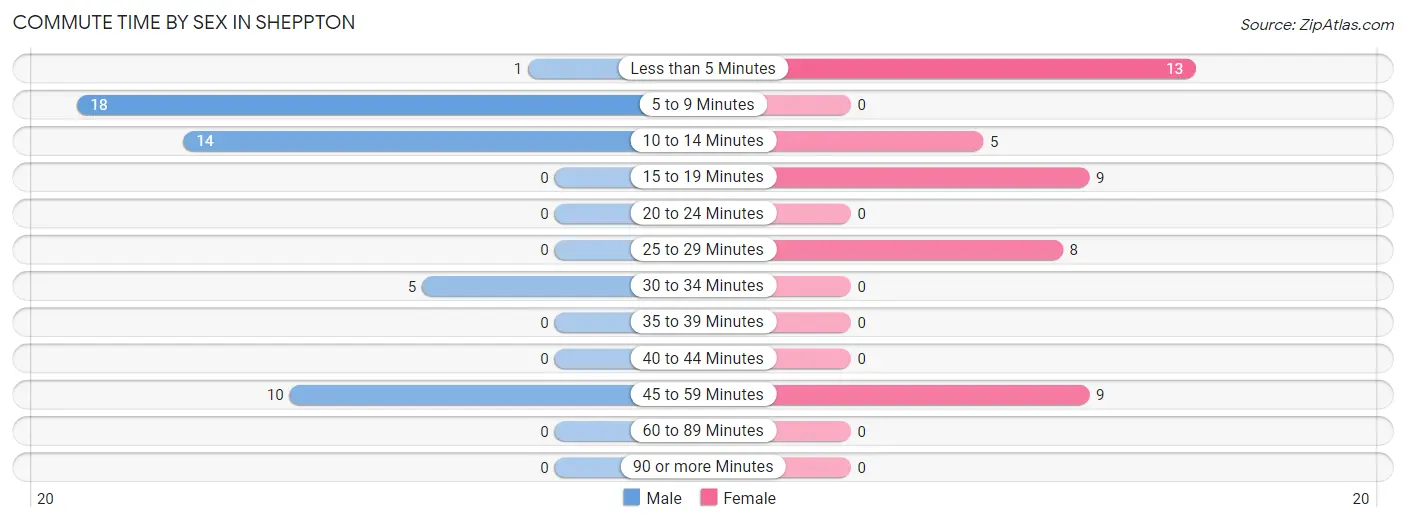
| Commute Time | Male | Female |
| Less than 5 Minutes | 1 (2.1%) | 13 (29.5%) |
| 5 to 9 Minutes | 18 (37.5%) | 0 (0.0%) |
| 10 to 14 Minutes | 14 (29.2%) | 5 (11.4%) |
| 15 to 19 Minutes | 0 (0.0%) | 9 (20.4%) |
| 20 to 24 Minutes | 0 (0.0%) | 0 (0.0%) |
| 25 to 29 Minutes | 0 (0.0%) | 8 (18.2%) |
| 30 to 34 Minutes | 5 (10.4%) | 0 (0.0%) |
| 35 to 39 Minutes | 0 (0.0%) | 0 (0.0%) |
| 40 to 44 Minutes | 0 (0.0%) | 0 (0.0%) |
| 45 to 59 Minutes | 10 (20.8%) | 9 (20.4%) |
| 60 to 89 Minutes | 0 (0.0%) | 0 (0.0%) |
| 90 or more Minutes | 0 (0.0%) | 0 (0.0%) |
Time of Departure to Work by Sex in Sheppton
The most frequent times of departure to work in Sheppton are 6:00 AM to 6:29 AM (12, 25.0%) for males and 5:00 AM to 5:29 AM (9, 20.4%) for females.
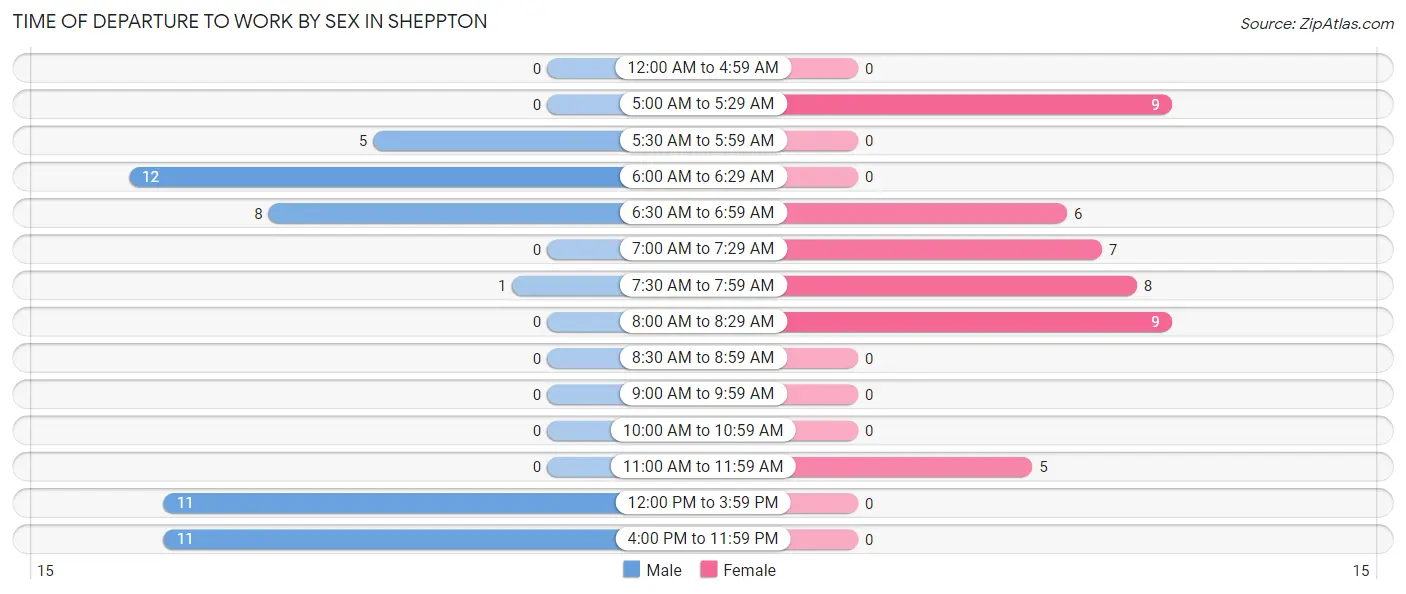
| Time of Departure | Male | Female |
| 12:00 AM to 4:59 AM | 0 (0.0%) | 0 (0.0%) |
| 5:00 AM to 5:29 AM | 0 (0.0%) | 9 (20.4%) |
| 5:30 AM to 5:59 AM | 5 (10.4%) | 0 (0.0%) |
| 6:00 AM to 6:29 AM | 12 (25.0%) | 0 (0.0%) |
| 6:30 AM to 6:59 AM | 8 (16.7%) | 6 (13.6%) |
| 7:00 AM to 7:29 AM | 0 (0.0%) | 7 (15.9%) |
| 7:30 AM to 7:59 AM | 1 (2.1%) | 8 (18.2%) |
| 8:00 AM to 8:29 AM | 0 (0.0%) | 9 (20.4%) |
| 8:30 AM to 8:59 AM | 0 (0.0%) | 0 (0.0%) |
| 9:00 AM to 9:59 AM | 0 (0.0%) | 0 (0.0%) |
| 10:00 AM to 10:59 AM | 0 (0.0%) | 0 (0.0%) |
| 11:00 AM to 11:59 AM | 0 (0.0%) | 5 (11.4%) |
| 12:00 PM to 3:59 PM | 11 (22.9%) | 0 (0.0%) |
| 4:00 PM to 11:59 PM | 11 (22.9%) | 0 (0.0%) |
| Total | 48 (100.0%) | 44 (100.0%) |
Housing Occupancy in Sheppton
Occupancy by Ownership in Sheppton
Of the total 162 dwellings in Sheppton, owner-occupied units account for 142 (87.6%), while renter-occupied units make up 20 (12.3%).
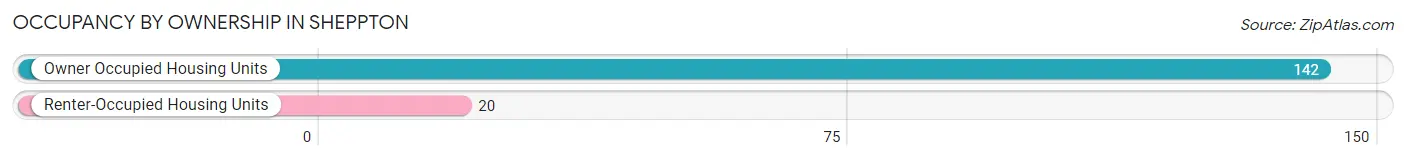
| Occupancy | # Housing Units | % Housing Units |
| Owner Occupied Housing Units | 142 | 87.6% |
| Renter-Occupied Housing Units | 20 | 12.3% |
| Total Occupied Housing Units | 162 | 100.0% |
Occupancy by Household Size in Sheppton
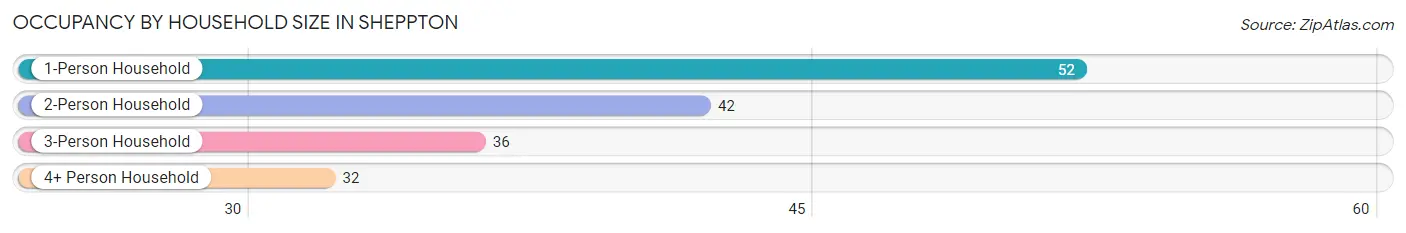
| Household Size | # Housing Units | % Housing Units |
| 1-Person Household | 52 | 32.1% |
| 2-Person Household | 42 | 25.9% |
| 3-Person Household | 36 | 22.2% |
| 4+ Person Household | 32 | 19.8% |
| Total Housing Units | 162 | 100.0% |
Occupancy by Ownership by Household Size in Sheppton
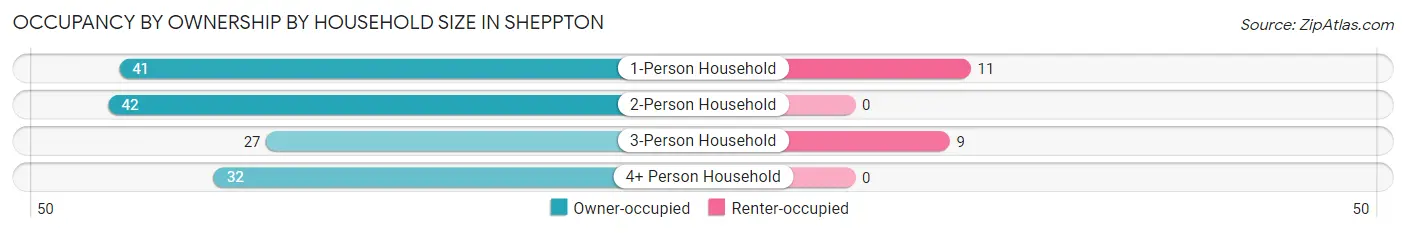
| Household Size | Owner-occupied | Renter-occupied |
| 1-Person Household | 41 (78.8%) | 11 (21.1%) |
| 2-Person Household | 42 (100.0%) | 0 (0.0%) |
| 3-Person Household | 27 (75.0%) | 9 (25.0%) |
| 4+ Person Household | 32 (100.0%) | 0 (0.0%) |
| Total Housing Units | 142 (87.6%) | 20 (12.3%) |
Occupancy by Educational Attainment in Sheppton
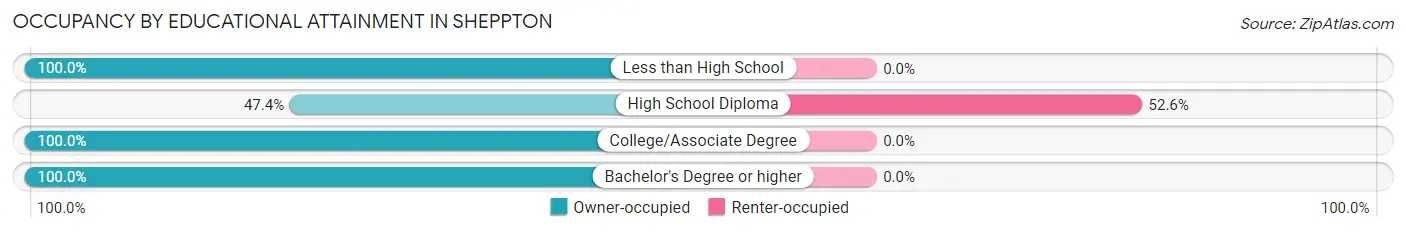
| Household Size | Owner-occupied | Renter-occupied |
| Less than High School | 27 (100.0%) | 0 (0.0%) |
| High School Diploma | 18 (47.4%) | 20 (52.6%) |
| College/Associate Degree | 68 (100.0%) | 0 (0.0%) |
| Bachelor's Degree or higher | 29 (100.0%) | 0 (0.0%) |
Occupancy by Age of Householder in Sheppton
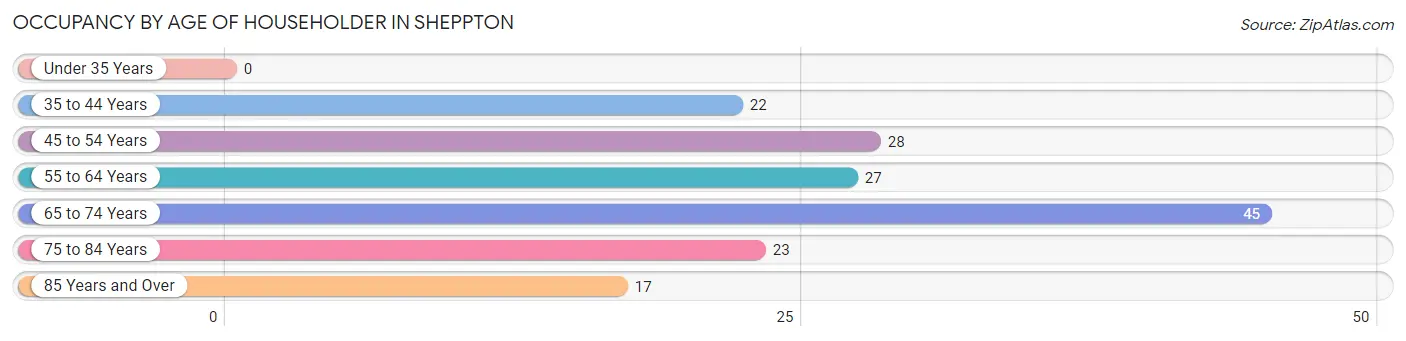
| Age Bracket | # Households | % Households |
| Under 35 Years | 0 | 0.0% |
| 35 to 44 Years | 22 | 13.6% |
| 45 to 54 Years | 28 | 17.3% |
| 55 to 64 Years | 27 | 16.7% |
| 65 to 74 Years | 45 | 27.8% |
| 75 to 84 Years | 23 | 14.2% |
| 85 Years and Over | 17 | 10.5% |
| Total | 162 | 100.0% |
Housing Finances in Sheppton
Median Income by Occupancy in Sheppton
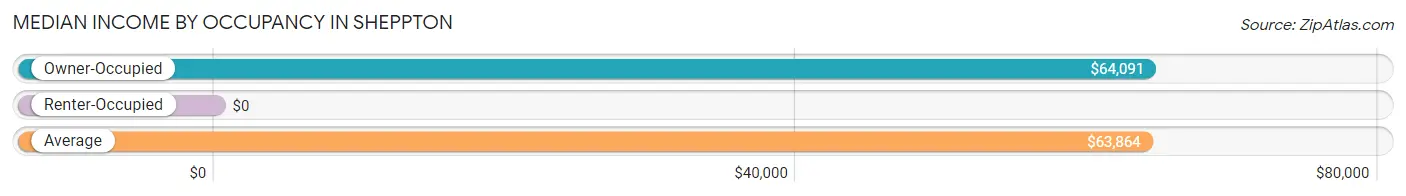
| Occupancy Type | # Households | Median Income |
| Owner-Occupied | 142 (87.6%) | $64,091 |
| Renter-Occupied | 20 (12.3%) | $0 |
| Average | 162 (100.0%) | $63,864 |
Occupancy by Householder Income Bracket in Sheppton
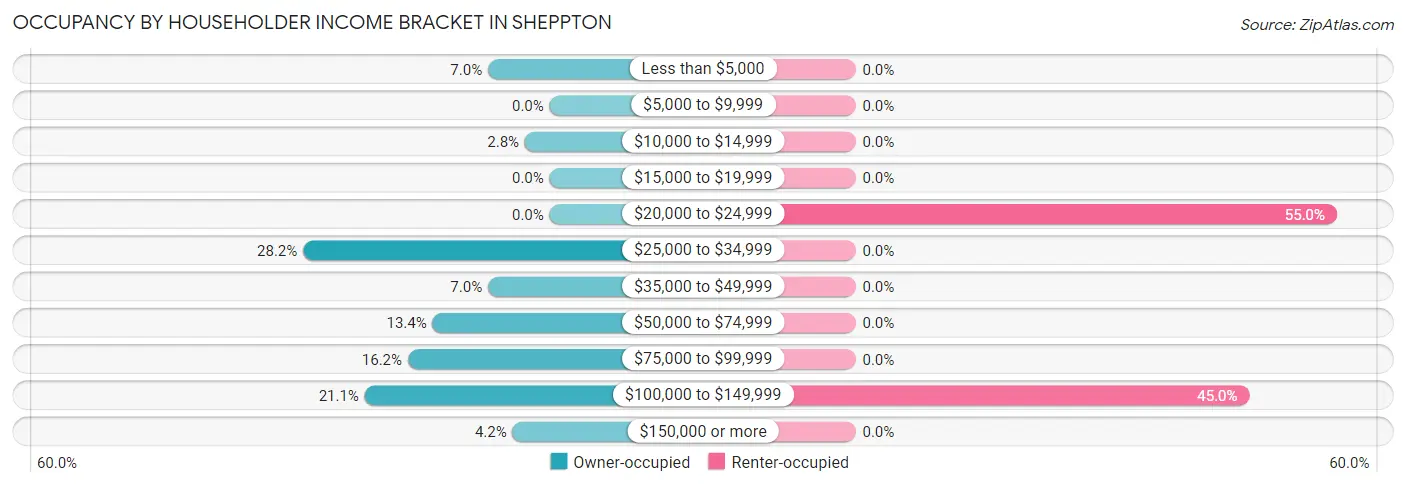
| Income Bracket | Owner-occupied | Renter-occupied |
| Less than $5,000 | 10 (7.0%) | 0 (0.0%) |
| $5,000 to $9,999 | 0 (0.0%) | 0 (0.0%) |
| $10,000 to $14,999 | 4 (2.8%) | 0 (0.0%) |
| $15,000 to $19,999 | 0 (0.0%) | 0 (0.0%) |
| $20,000 to $24,999 | 0 (0.0%) | 11 (55.0%) |
| $25,000 to $34,999 | 40 (28.2%) | 0 (0.0%) |
| $35,000 to $49,999 | 10 (7.0%) | 0 (0.0%) |
| $50,000 to $74,999 | 19 (13.4%) | 0 (0.0%) |
| $75,000 to $99,999 | 23 (16.2%) | 0 (0.0%) |
| $100,000 to $149,999 | 30 (21.1%) | 9 (45.0%) |
| $150,000 or more | 6 (4.2%) | 0 (0.0%) |
| Total | 142 (100.0%) | 20 (100.0%) |
Monthly Housing Cost Tiers in Sheppton
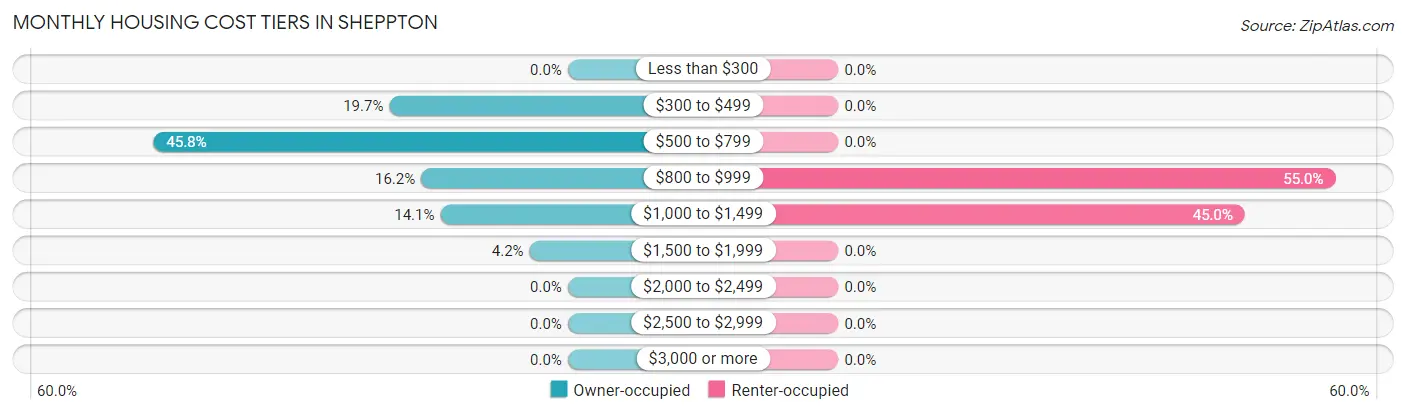
| Monthly Cost | Owner-occupied | Renter-occupied |
| Less than $300 | 0 (0.0%) | 0 (0.0%) |
| $300 to $499 | 28 (19.7%) | 0 (0.0%) |
| $500 to $799 | 65 (45.8%) | 0 (0.0%) |
| $800 to $999 | 23 (16.2%) | 11 (55.0%) |
| $1,000 to $1,499 | 20 (14.1%) | 9 (45.0%) |
| $1,500 to $1,999 | 6 (4.2%) | 0 (0.0%) |
| $2,000 to $2,499 | 0 (0.0%) | 0 (0.0%) |
| $2,500 to $2,999 | 0 (0.0%) | 0 (0.0%) |
| $3,000 or more | 0 (0.0%) | 0 (0.0%) |
| Total | 142 (100.0%) | 20 (100.0%) |
Physical Housing Characteristics in Sheppton
Housing Structures in Sheppton
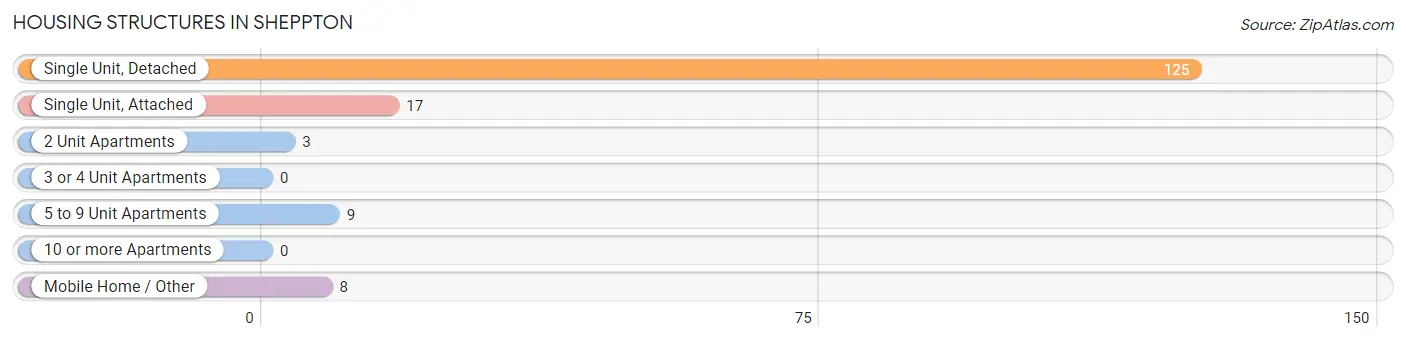
| Structure Type | # Housing Units | % Housing Units |
| Single Unit, Detached | 125 | 77.2% |
| Single Unit, Attached | 17 | 10.5% |
| 2 Unit Apartments | 3 | 1.8% |
| 3 or 4 Unit Apartments | 0 | 0.0% |
| 5 to 9 Unit Apartments | 9 | 5.6% |
| 10 or more Apartments | 0 | 0.0% |
| Mobile Home / Other | 8 | 4.9% |
| Total | 162 | 100.0% |
Housing Structures by Occupancy in Sheppton
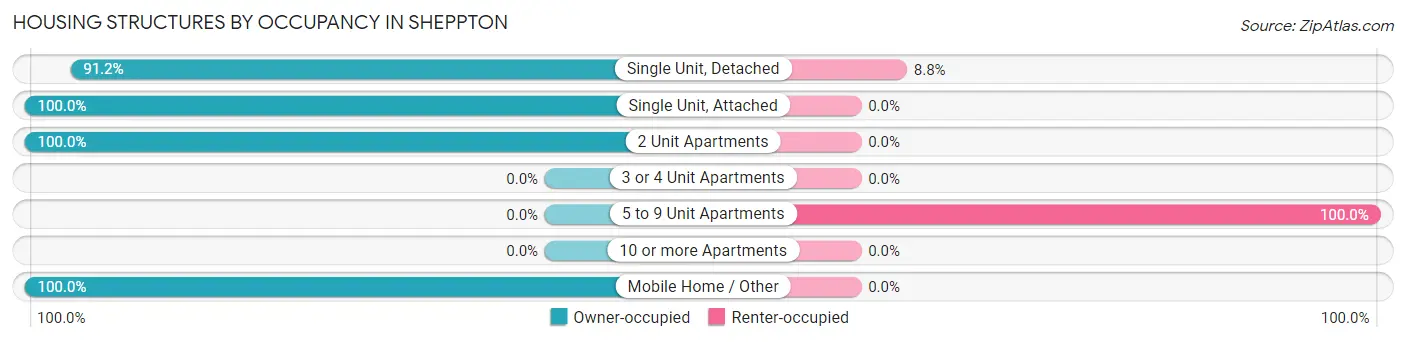
| Structure Type | Owner-occupied | Renter-occupied |
| Single Unit, Detached | 114 (91.2%) | 11 (8.8%) |
| Single Unit, Attached | 17 (100.0%) | 0 (0.0%) |
| 2 Unit Apartments | 3 (100.0%) | 0 (0.0%) |
| 3 or 4 Unit Apartments | 0 (0.0%) | 0 (0.0%) |
| 5 to 9 Unit Apartments | 0 (0.0%) | 9 (100.0%) |
| 10 or more Apartments | 0 (0.0%) | 0 (0.0%) |
| Mobile Home / Other | 8 (100.0%) | 0 (0.0%) |
| Total | 142 (87.6%) | 20 (12.3%) |
Housing Structures by Number of Rooms in Sheppton
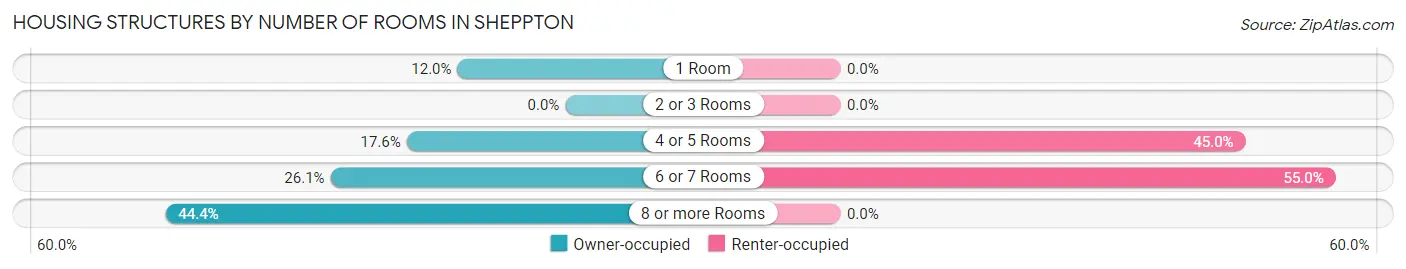
| Number of Rooms | Owner-occupied | Renter-occupied |
| 1 Room | 17 (12.0%) | 0 (0.0%) |
| 2 or 3 Rooms | 0 (0.0%) | 0 (0.0%) |
| 4 or 5 Rooms | 25 (17.6%) | 9 (45.0%) |
| 6 or 7 Rooms | 37 (26.1%) | 11 (55.0%) |
| 8 or more Rooms | 63 (44.4%) | 0 (0.0%) |
| Total | 142 (100.0%) | 20 (100.0%) |
Housing Structure by Heating Type in Sheppton
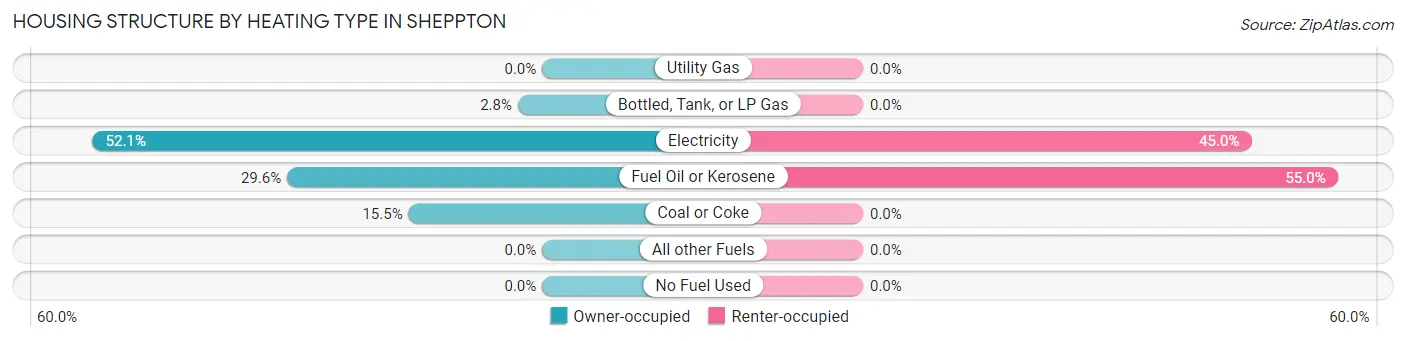
| Heating Type | Owner-occupied | Renter-occupied |
| Utility Gas | 0 (0.0%) | 0 (0.0%) |
| Bottled, Tank, or LP Gas | 4 (2.8%) | 0 (0.0%) |
| Electricity | 74 (52.1%) | 9 (45.0%) |
| Fuel Oil or Kerosene | 42 (29.6%) | 11 (55.0%) |
| Coal or Coke | 22 (15.5%) | 0 (0.0%) |
| All other Fuels | 0 (0.0%) | 0 (0.0%) |
| No Fuel Used | 0 (0.0%) | 0 (0.0%) |
| Total | 142 (100.0%) | 20 (100.0%) |
Household Vehicle Usage in Sheppton
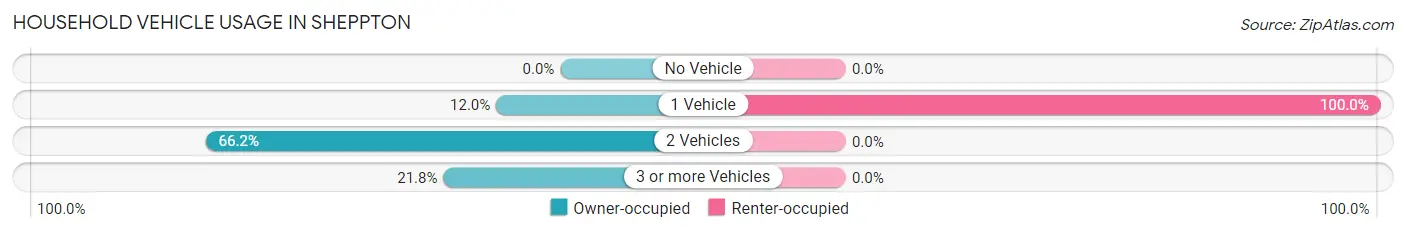
| Vehicles per Household | Owner-occupied | Renter-occupied |
| No Vehicle | 0 (0.0%) | 0 (0.0%) |
| 1 Vehicle | 17 (12.0%) | 20 (100.0%) |
| 2 Vehicles | 94 (66.2%) | 0 (0.0%) |
| 3 or more Vehicles | 31 (21.8%) | 0 (0.0%) |
| Total | 142 (100.0%) | 20 (100.0%) |
Real Estate & Mortgages in Sheppton
Real Estate and Mortgage Overview in Sheppton
| Characteristic | Without Mortgage | With Mortgage |
| Housing Units | 93 | 49 |
| Median Property Value | $104,400 | $126,300 |
| Median Household Income | - | - |
| Monthly Housing Costs | $536 | $0 |
| Real Estate Taxes | - | - |
Property Value by Mortgage Status in Sheppton
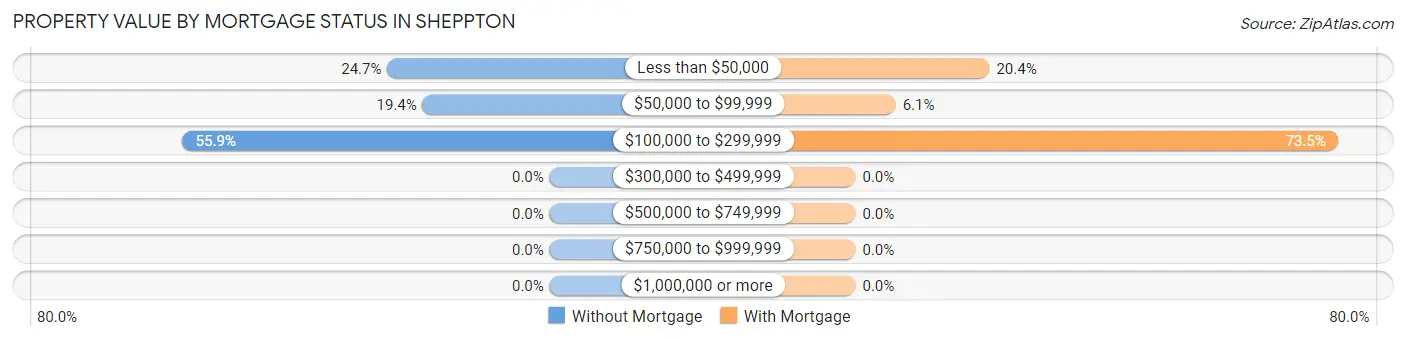
| Property Value | Without Mortgage | With Mortgage |
| Less than $50,000 | 23 (24.7%) | 10 (20.4%) |
| $50,000 to $99,999 | 18 (19.4%) | 3 (6.1%) |
| $100,000 to $299,999 | 52 (55.9%) | 36 (73.5%) |
| $300,000 to $499,999 | 0 (0.0%) | 0 (0.0%) |
| $500,000 to $749,999 | 0 (0.0%) | 0 (0.0%) |
| $750,000 to $999,999 | 0 (0.0%) | 0 (0.0%) |
| $1,000,000 or more | 0 (0.0%) | 0 (0.0%) |
| Total | 93 (100.0%) | 49 (100.0%) |
Household Income by Mortgage Status in Sheppton
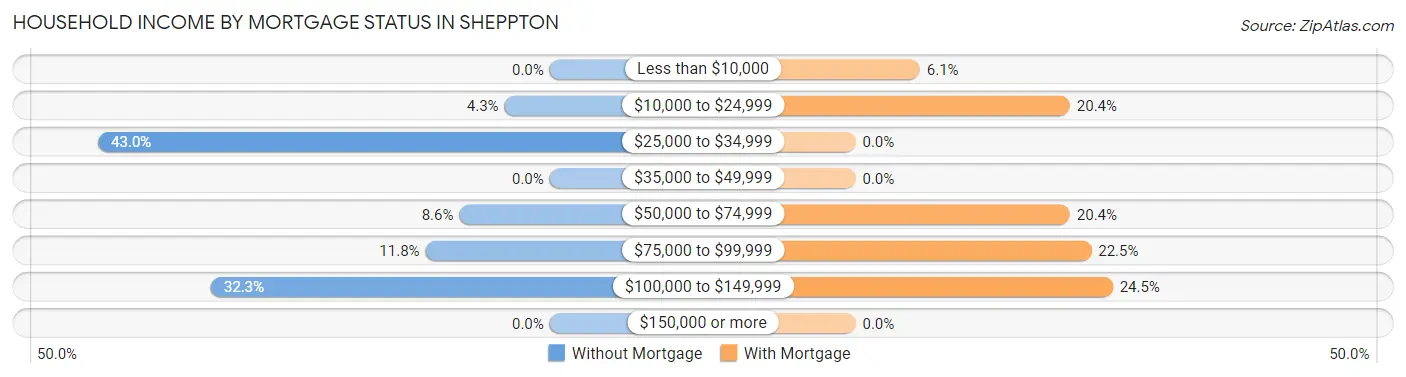
| Household Income | Without Mortgage | With Mortgage |
| Less than $10,000 | 0 (0.0%) | 3 (6.1%) |
| $10,000 to $24,999 | 4 (4.3%) | 10 (20.4%) |
| $25,000 to $34,999 | 40 (43.0%) | 0 (0.0%) |
| $35,000 to $49,999 | 0 (0.0%) | 0 (0.0%) |
| $50,000 to $74,999 | 8 (8.6%) | 10 (20.4%) |
| $75,000 to $99,999 | 11 (11.8%) | 11 (22.5%) |
| $100,000 to $149,999 | 30 (32.3%) | 12 (24.5%) |
| $150,000 or more | 0 (0.0%) | 0 (0.0%) |
| Total | 93 (100.0%) | 49 (100.0%) |
Property Value to Household Income Ratio in Sheppton
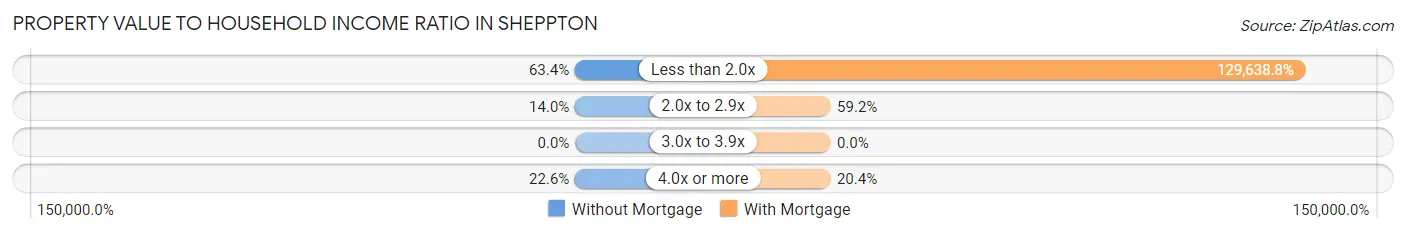
| Value-to-Income Ratio | Without Mortgage | With Mortgage |
| Less than 2.0x | 59 (63.4%) | 63,523 (129,638.8%) |
| 2.0x to 2.9x | 13 (14.0%) | 29 (59.2%) |
| 3.0x to 3.9x | 0 (0.0%) | 0 (0.0%) |
| 4.0x or more | 21 (22.6%) | 10 (20.4%) |
| Total | 93 (100.0%) | 49 (100.0%) |
Real Estate Taxes by Mortgage Status in Sheppton
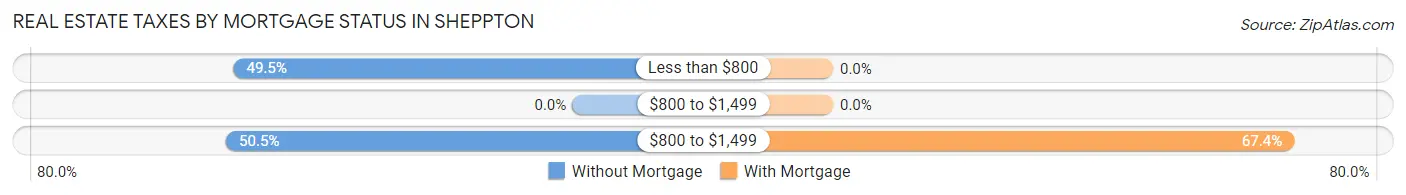
| Property Taxes | Without Mortgage | With Mortgage |
| Less than $800 | 46 (49.5%) | 0 (0.0%) |
| $800 to $1,499 | 0 (0.0%) | 0 (0.0%) |
| $800 to $1,499 | 47 (50.5%) | 33 (67.3%) |
| Total | 93 (100.0%) | 49 (100.0%) |
Health & Disability in Sheppton
Health Insurance Coverage by Age in Sheppton
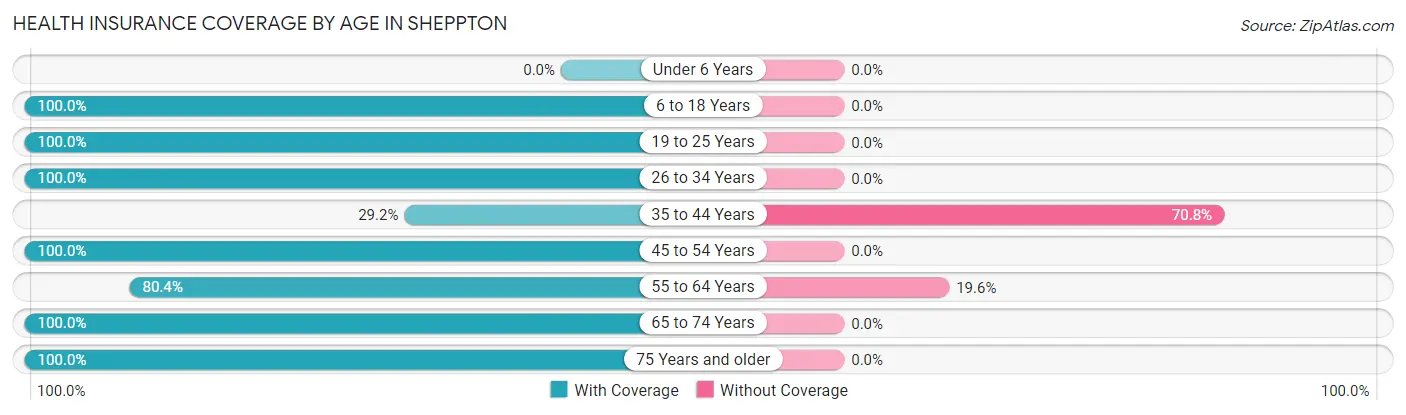
| Age Bracket | With Coverage | Without Coverage |
| Under 6 Years | 0 (0.0%) | 0 (0.0%) |
| 6 to 18 Years | 162 (100.0%) | 0 (0.0%) |
| 19 to 25 Years | 26 (100.0%) | 0 (0.0%) |
| 26 to 34 Years | 19 (100.0%) | 0 (0.0%) |
| 35 to 44 Years | 26 (29.2%) | 63 (70.8%) |
| 45 to 54 Years | 42 (100.0%) | 0 (0.0%) |
| 55 to 64 Years | 37 (80.4%) | 9 (19.6%) |
| 65 to 74 Years | 48 (100.0%) | 0 (0.0%) |
| 75 Years and older | 40 (100.0%) | 0 (0.0%) |
| Total | 400 (84.8%) | 72 (15.2%) |
Health Insurance Coverage by Citizenship Status in Sheppton
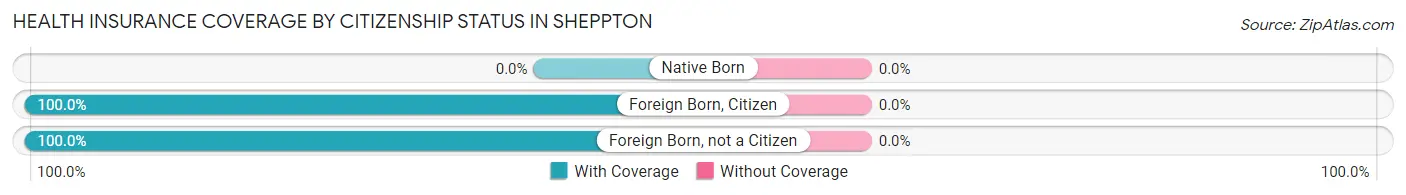
| Citizenship Status | With Coverage | Without Coverage |
| Native Born | 0 (0.0%) | 0 (0.0%) |
| Foreign Born, Citizen | 162 (100.0%) | 0 (0.0%) |
| Foreign Born, not a Citizen | 26 (100.0%) | 0 (0.0%) |
Health Insurance Coverage by Household Income in Sheppton
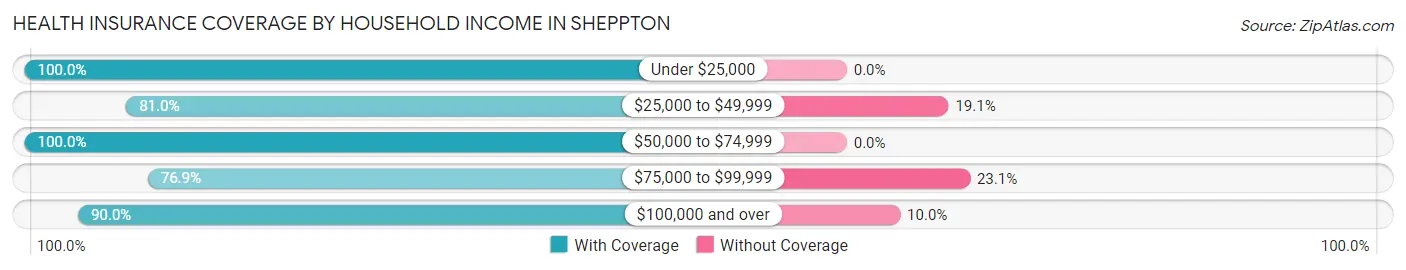
| Household Income | With Coverage | Without Coverage |
| Under $25,000 | 34 (100.0%) | 0 (0.0%) |
| $25,000 to $49,999 | 187 (80.9%) | 44 (19.1%) |
| $50,000 to $74,999 | 34 (100.0%) | 0 (0.0%) |
| $75,000 to $99,999 | 60 (76.9%) | 18 (23.1%) |
| $100,000 and over | 81 (90.0%) | 9 (10.0%) |
Public vs Private Health Insurance Coverage by Age in Sheppton
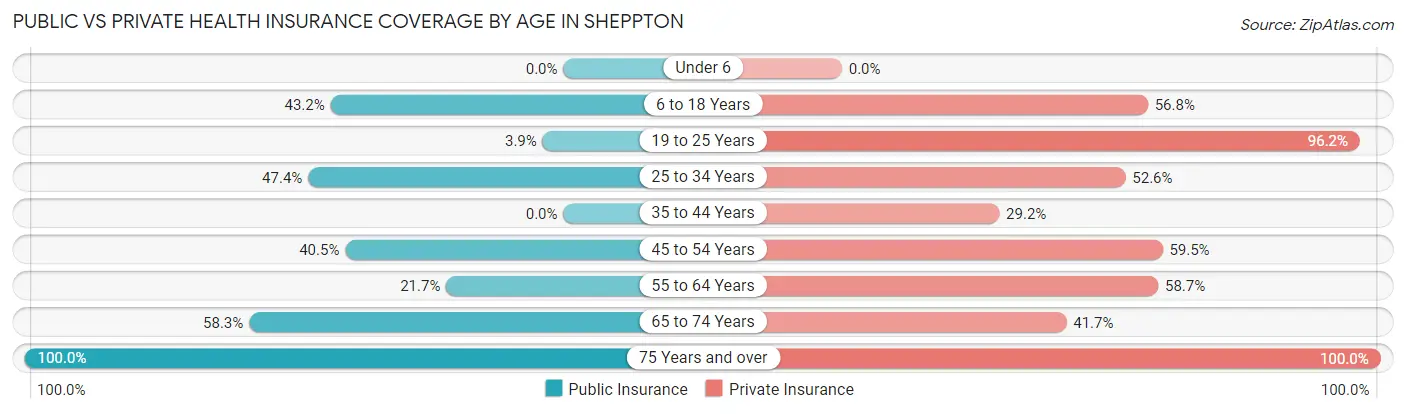
| Age Bracket | Public Insurance | Private Insurance |
| Under 6 | 0 (0.0%) | 0 (0.0%) |
| 6 to 18 Years | 70 (43.2%) | 92 (56.8%) |
| 19 to 25 Years | 1 (3.8%) | 25 (96.2%) |
| 25 to 34 Years | 9 (47.4%) | 10 (52.6%) |
| 35 to 44 Years | 0 (0.0%) | 26 (29.2%) |
| 45 to 54 Years | 17 (40.5%) | 25 (59.5%) |
| 55 to 64 Years | 10 (21.7%) | 27 (58.7%) |
| 65 to 74 Years | 28 (58.3%) | 20 (41.7%) |
| 75 Years and over | 40 (100.0%) | 40 (100.0%) |
| Total | 175 (37.1%) | 265 (56.1%) |
Disability Status by Sex by Age in Sheppton

| Age Bracket | Male | Female |
| Under 5 Years | 0 (0.0%) | 0 (0.0%) |
| 5 to 17 Years | 0 (0.0%) | 21 (72.4%) |
| 18 to 34 Years | 0 (0.0%) | 0 (0.0%) |
| 35 to 64 Years | 12 (30.8%) | 30 (21.7%) |
| 65 to 74 Years | 9 (24.3%) | 0 (0.0%) |
| 75 Years and over | 0 (0.0%) | 17 (42.5%) |
Disability Class by Sex by Age in Sheppton
Disability Class: Hearing Difficulty
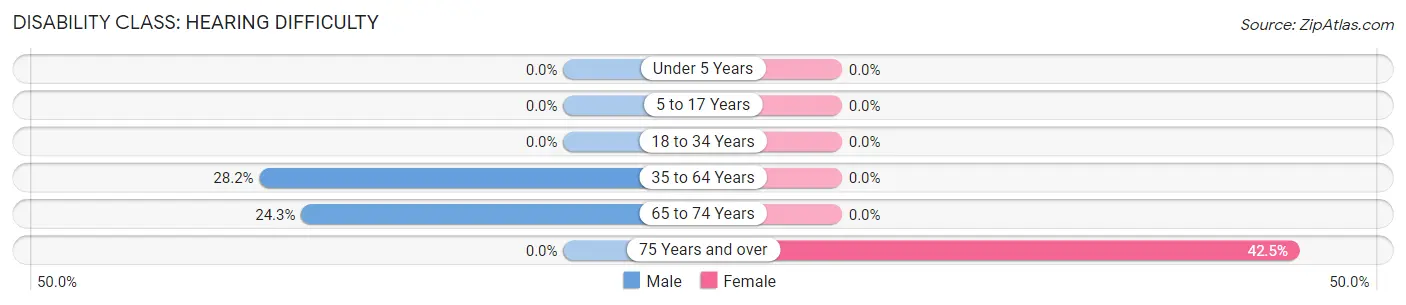
| Age Bracket | Male | Female |
| Under 5 Years | 0 (0.0%) | 0 (0.0%) |
| 5 to 17 Years | 0 (0.0%) | 0 (0.0%) |
| 18 to 34 Years | 0 (0.0%) | 0 (0.0%) |
| 35 to 64 Years | 11 (28.2%) | 0 (0.0%) |
| 65 to 74 Years | 9 (24.3%) | 0 (0.0%) |
| 75 Years and over | 0 (0.0%) | 17 (42.5%) |
Disability Class: Vision Difficulty
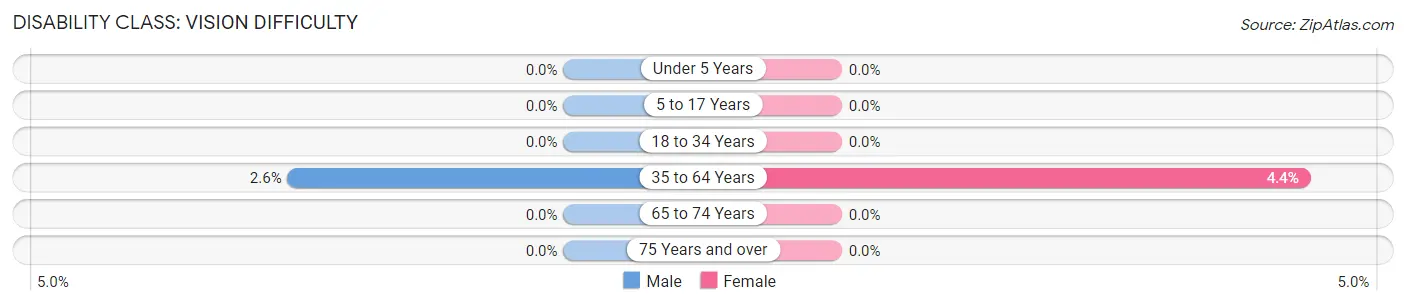
| Age Bracket | Male | Female |
| Under 5 Years | 0 (0.0%) | 0 (0.0%) |
| 5 to 17 Years | 0 (0.0%) | 0 (0.0%) |
| 18 to 34 Years | 0 (0.0%) | 0 (0.0%) |
| 35 to 64 Years | 1 (2.6%) | 6 (4.3%) |
| 65 to 74 Years | 0 (0.0%) | 0 (0.0%) |
| 75 Years and over | 0 (0.0%) | 0 (0.0%) |
Disability Class: Cognitive Difficulty
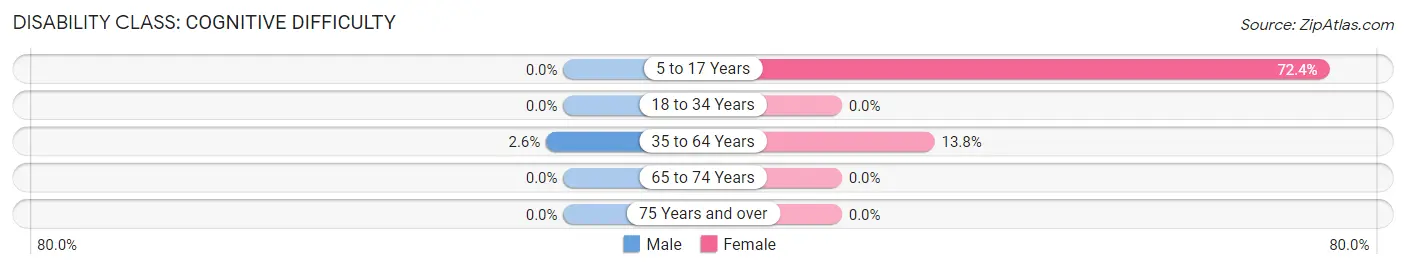
| Age Bracket | Male | Female |
| 5 to 17 Years | 0 (0.0%) | 21 (72.4%) |
| 18 to 34 Years | 0 (0.0%) | 0 (0.0%) |
| 35 to 64 Years | 1 (2.6%) | 19 (13.8%) |
| 65 to 74 Years | 0 (0.0%) | 0 (0.0%) |
| 75 Years and over | 0 (0.0%) | 0 (0.0%) |
Disability Class: Ambulatory Difficulty
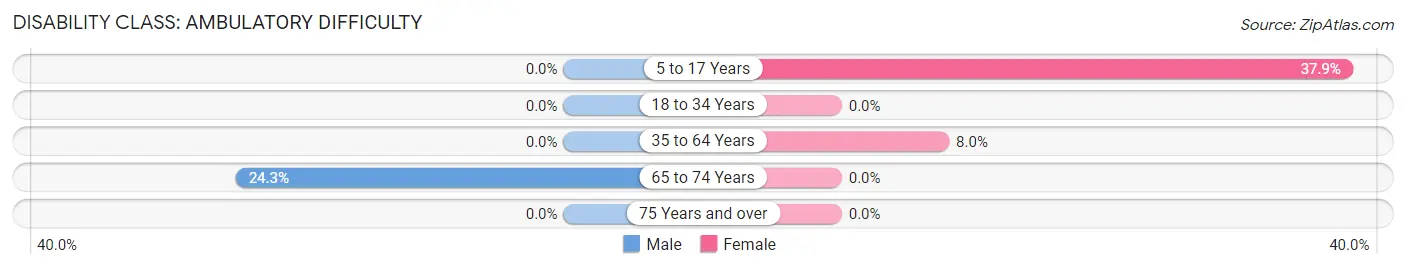
| Age Bracket | Male | Female |
| 5 to 17 Years | 0 (0.0%) | 11 (37.9%) |
| 18 to 34 Years | 0 (0.0%) | 0 (0.0%) |
| 35 to 64 Years | 0 (0.0%) | 11 (8.0%) |
| 65 to 74 Years | 9 (24.3%) | 0 (0.0%) |
| 75 Years and over | 0 (0.0%) | 0 (0.0%) |
Disability Class: Self-Care Difficulty
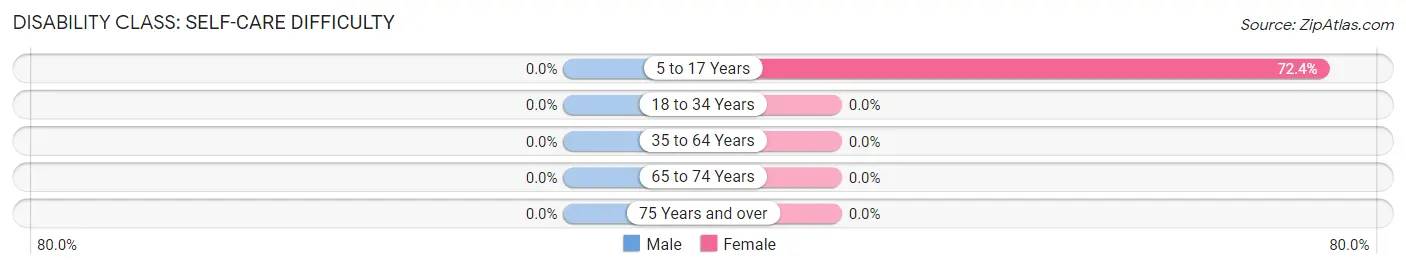
| Age Bracket | Male | Female |
| 5 to 17 Years | 0 (0.0%) | 21 (72.4%) |
| 18 to 34 Years | 0 (0.0%) | 0 (0.0%) |
| 35 to 64 Years | 0 (0.0%) | 0 (0.0%) |
| 65 to 74 Years | 0 (0.0%) | 0 (0.0%) |
| 75 Years and over | 0 (0.0%) | 0 (0.0%) |
Technology Access in Sheppton
Computing Device Access in Sheppton
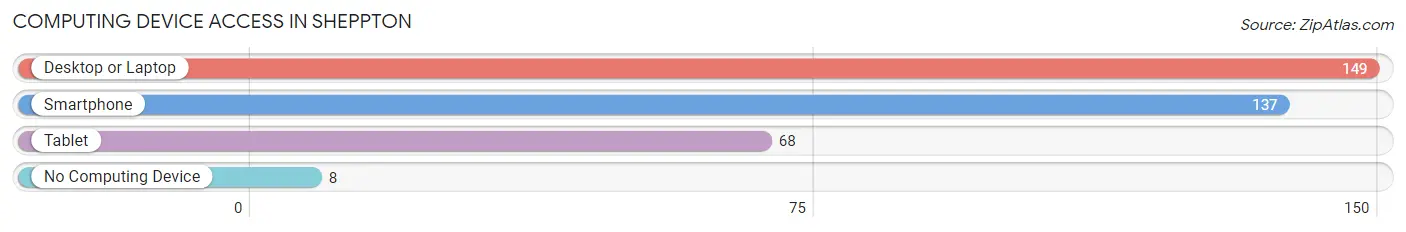
| Device Type | # Households | % Households |
| Desktop or Laptop | 149 | 92.0% |
| Smartphone | 137 | 84.6% |
| Tablet | 68 | 42.0% |
| No Computing Device | 8 | 4.9% |
| Total | 162 | 100.0% |
Internet Access in Sheppton
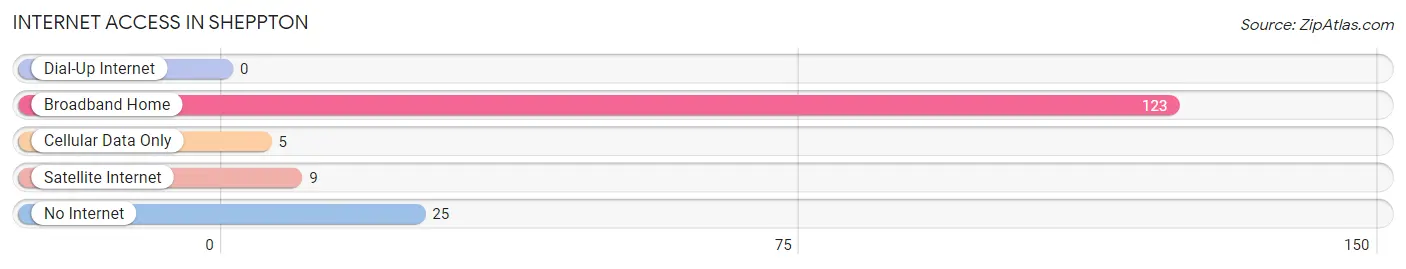
| Internet Type | # Households | % Households |
| Dial-Up Internet | 0 | 0.0% |
| Broadband Home | 123 | 75.9% |
| Cellular Data Only | 5 | 3.1% |
| Satellite Internet | 9 | 5.6% |
| No Internet | 25 | 15.4% |
| Total | 162 | 100.0% |
Sheppton Summary
Sheppton, Pennsylvania is a small borough located in Schuylkill County, Pennsylvania. It is situated in the southern part of the county, approximately 10 miles south of Pottsville. The borough is bordered by the townships of East Union, West Mahanoy, and Delano. As of the 2010 census, the population of Sheppton was 1,092.
History
The area that is now Sheppton was first settled in the late 1700s by German immigrants. The town was originally known as “Shepp’s Town” after the first settler, John Shepp. The town was officially incorporated in 1876.
In the late 1800s, Sheppton was a thriving coal mining town. The town was home to several coal mines, including the Sheppton Mine, which was the largest in the area. The coal industry was the main source of employment for the town’s residents.
Geography
Sheppton is located in the southern part of Schuylkill County, approximately 10 miles south of Pottsville. The borough is bordered by the townships of East Union, West Mahanoy, and Delano. The town is situated in the Appalachian Mountains and is surrounded by rolling hills and forests.
The climate in Sheppton is classified as humid continental, with cold winters and hot, humid summers. The average annual temperature is 48°F (9°C). The average annual precipitation is 41 inches (104 cm).
Economy
The economy of Sheppton is largely based on the coal mining industry. The town is home to several coal mines, including the Sheppton Mine, which is the largest in the area. The coal industry is the main source of employment for the town’s residents.
In addition to the coal industry, Sheppton is also home to several small businesses, including restaurants, retail stores, and service providers. The town also has a small manufacturing sector, which produces a variety of products, including furniture and clothing.
Demographics
As of the 2010 census, the population of Sheppton was 1,092. The racial makeup of the town was 97.3% White, 0.9% African American, 0.2% Native American, 0.2% Asian, and 1.4% from other races. The median household income was $37,917, and the median family income was $45,625. The per capita income was $18,945.
The population of Sheppton is largely Catholic, with the majority of the town’s residents belonging to the Roman Catholic Church. The town also has a small Protestant population. The town is served by two churches, St. Mary’s Catholic Church and Sheppton United Methodist Church.
Common Questions
What is Per Capita Income in Sheppton?
Per Capita income in Sheppton is $27,521.
What is the Median Family Income in Sheppton?
Median Family Income in Sheppton is $68,333.
What is the Median Household income in Sheppton?
Median Household Income in Sheppton is $63,864.
What is Income or Wage Gap in Sheppton?
Income or Wage Gap in Sheppton is 35.9%.
Women in Sheppton earn 64.1 cents for every dollar earned by a man.
What is Inequality or Gini Index in Sheppton?
Inequality or Gini Index in Sheppton is 0.43.
What is the Total Population of Sheppton?
Total Population of Sheppton is 477.
What is the Total Male Population of Sheppton?
Total Male Population of Sheppton is 210.
What is the Total Female Population of Sheppton?
Total Female Population of Sheppton is 267.
What is the Ratio of Males per 100 Females in Sheppton?
There are 78.65 Males per 100 Females in Sheppton.
What is the Ratio of Females per 100 Males in Sheppton?
There are 127.14 Females per 100 Males in Sheppton.
What is the Median Population Age in Sheppton?
Median Population Age in Sheppton is 40.2 Years.
What is the Average Family Size in Sheppton
Average Family Size in Sheppton is 3.7 People.
What is the Average Household Size in Sheppton
Average Household Size in Sheppton is 2.9 People.
How Large is the Labor Force in Sheppton?
There are 126 People in the Labor Forcein in Sheppton.
What is the Percentage of People in the Labor Force in Sheppton?
39.0% of People are in the Labor Force in Sheppton.
What is the Unemployment Rate in Sheppton?
Unemployment Rate in Sheppton is 7.1%.