Lynnwood Pricedale, PA Map & Demographics
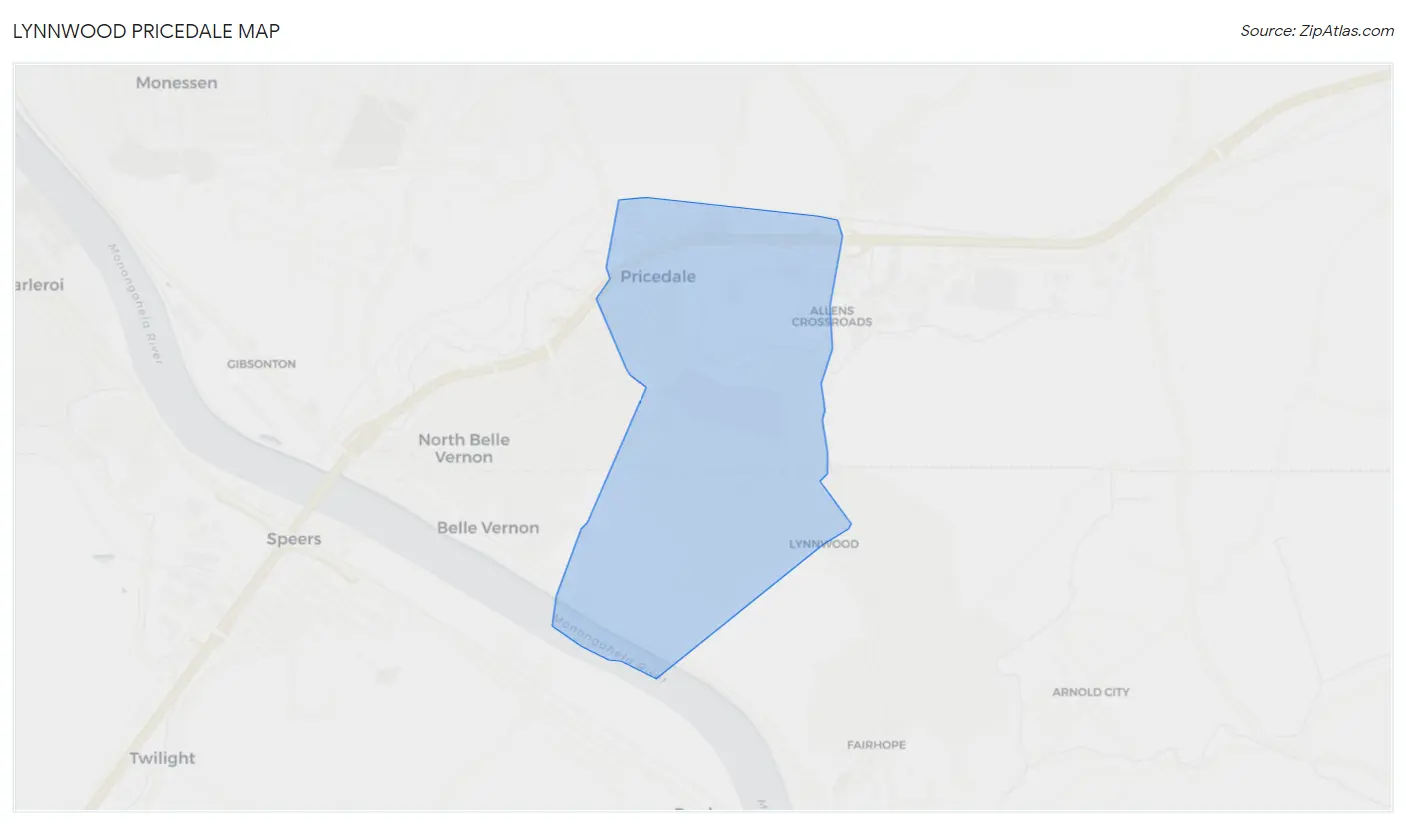
Lynnwood Pricedale Map
Lynnwood Pricedale Overview
$34,986
PER CAPITA INCOME
$95,500
AVG FAMILY INCOME
$46,522
AVG HOUSEHOLD INCOME
28.4%
WAGE / INCOME GAP [ % ]
71.6¢/ $1
WAGE / INCOME GAP [ $ ]
0.44
INEQUALITY / GINI INDEX
1,918
TOTAL POPULATION
860
MALE POPULATION
1,058
FEMALE POPULATION
81.29
MALES / 100 FEMALES
123.02
FEMALES / 100 MALES
47.3
MEDIAN AGE
2.7
AVG FAMILY SIZE
1.8
AVG HOUSEHOLD SIZE
883
LABOR FORCE [ PEOPLE ]
52.7%
PERCENT IN LABOR FORCE
1.5%
UNEMPLOYMENT RATE
Income in Lynnwood Pricedale
Income Overview in Lynnwood Pricedale
Per Capita Income in Lynnwood Pricedale is $34,986, while median incomes of families and households are $95,500 and $46,522 respectively.
| Characteristic | Number | Measure |
| Per Capita Income | 1,918 | $34,986 |
| Median Family Income | 470 | $95,500 |
| Mean Family Income | 470 | $88,723 |
| Median Household Income | 1,044 | $46,522 |
| Mean Household Income | 1,044 | $64,544 |
| Income Deficit | 470 | $0 |
| Wage / Income Gap (%) | 1,918 | 28.35% |
| Wage / Income Gap ($) | 1,918 | 71.65¢ per $1 |
| Gini / Inequality Index | 1,918 | 0.44 |
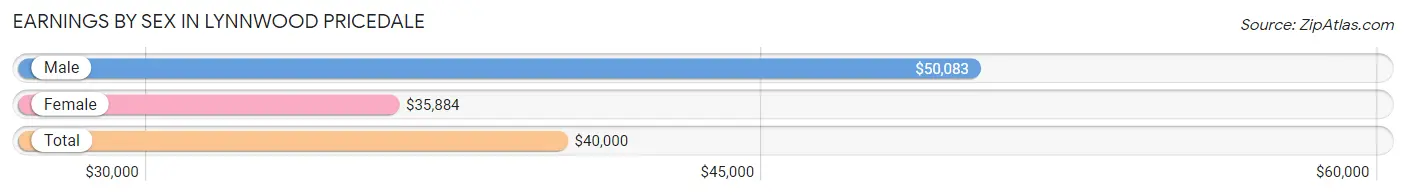
Earnings by Sex in Lynnwood Pricedale
Average Earnings in Lynnwood Pricedale are $40,000, $50,083 for men and $35,884 for women, a difference of 28.3%.
| Sex | Number | Average Earnings |
| Male | 435 (47.1%) | $50,083 |
| Female | 489 (52.9%) | $35,884 |
| Total | 924 (100.0%) | $40,000 |
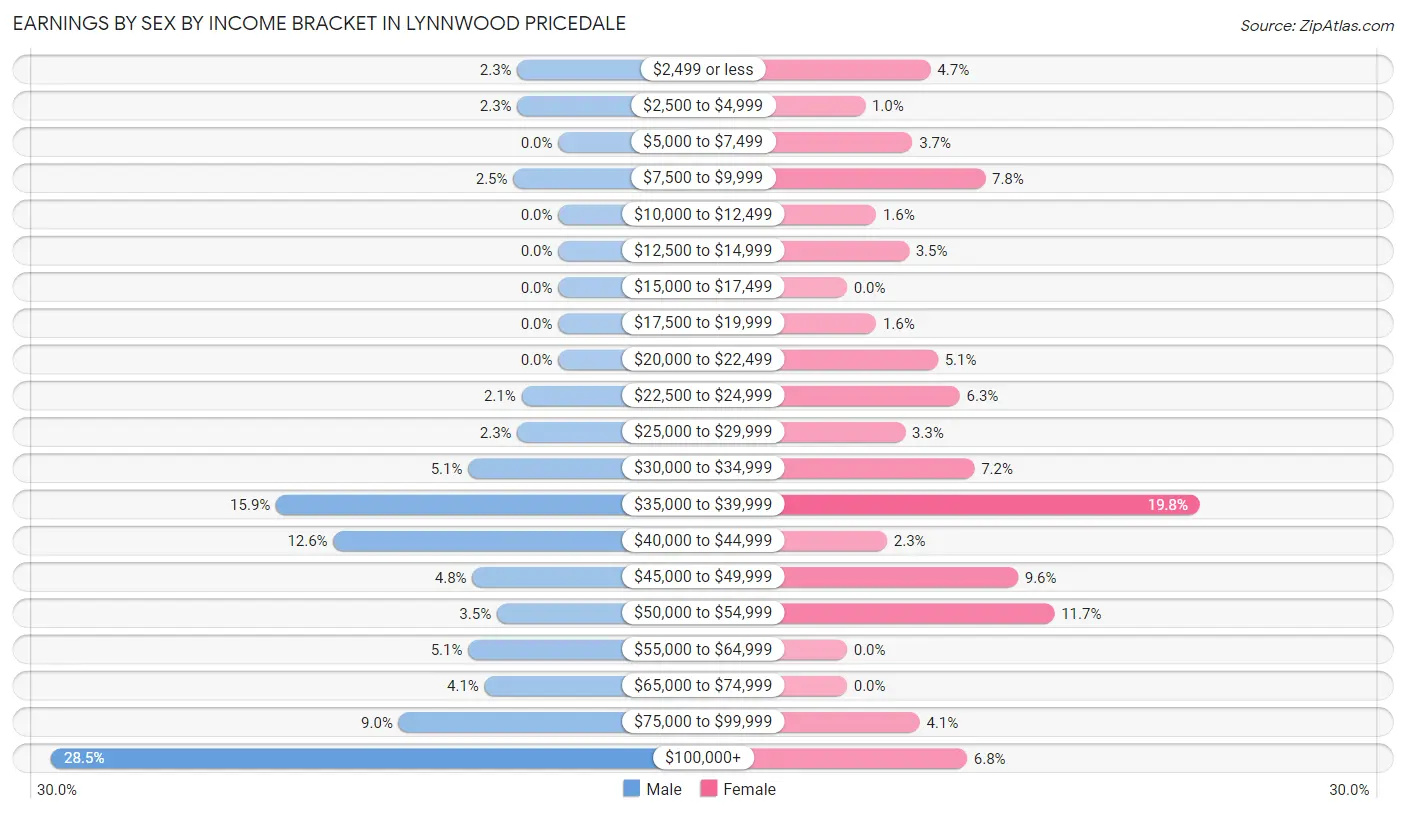
Earnings by Sex by Income Bracket in Lynnwood Pricedale
The most common earnings brackets in Lynnwood Pricedale are $100,000+ for men (124 | 28.5%) and $35,000 to $39,999 for women (97 | 19.8%).
| Income | Male | Female |
| $2,499 or less | 10 (2.3%) | 23 (4.7%) |
| $2,500 to $4,999 | 10 (2.3%) | 5 (1.0%) |
| $5,000 to $7,499 | 0 (0.0%) | 18 (3.7%) |
| $7,500 to $9,999 | 11 (2.5%) | 38 (7.8%) |
| $10,000 to $12,499 | 0 (0.0%) | 8 (1.6%) |
| $12,500 to $14,999 | 0 (0.0%) | 17 (3.5%) |
| $15,000 to $17,499 | 0 (0.0%) | 0 (0.0%) |
| $17,500 to $19,999 | 0 (0.0%) | 8 (1.6%) |
| $20,000 to $22,499 | 0 (0.0%) | 25 (5.1%) |
| $22,500 to $24,999 | 9 (2.1%) | 31 (6.3%) |
| $25,000 to $29,999 | 10 (2.3%) | 16 (3.3%) |
| $30,000 to $34,999 | 22 (5.1%) | 35 (7.2%) |
| $35,000 to $39,999 | 69 (15.9%) | 97 (19.8%) |
| $40,000 to $44,999 | 55 (12.6%) | 11 (2.2%) |
| $45,000 to $49,999 | 21 (4.8%) | 47 (9.6%) |
| $50,000 to $54,999 | 15 (3.5%) | 57 (11.7%) |
| $55,000 to $64,999 | 22 (5.1%) | 0 (0.0%) |
| $65,000 to $74,999 | 18 (4.1%) | 0 (0.0%) |
| $75,000 to $99,999 | 39 (9.0%) | 20 (4.1%) |
| $100,000+ | 124 (28.5%) | 33 (6.8%) |
| Total | 435 (100.0%) | 489 (100.0%) |
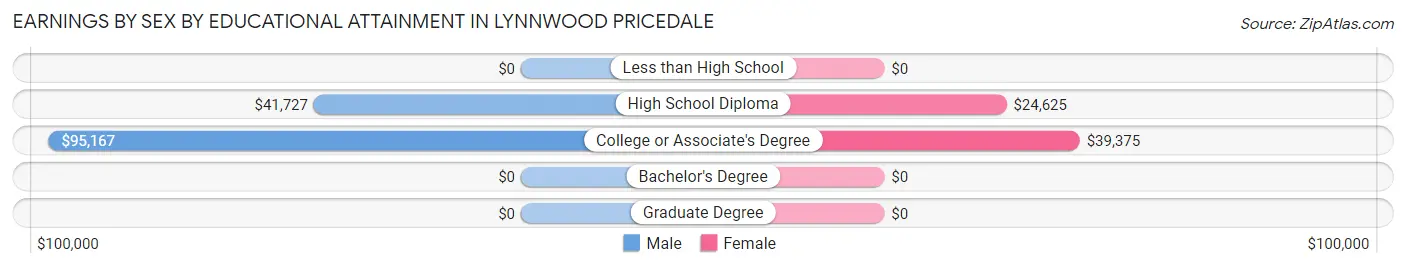
Earnings by Sex by Educational Attainment in Lynnwood Pricedale
Average earnings in Lynnwood Pricedale are $63,611 for men and $36,170 for women, a difference of 43.1%. Men with an educational attainment of college or associate's degree enjoy the highest average annual earnings of $95,167, while those with high school diploma education earn the least with $41,727. Women with an educational attainment of college or associate's degree earn the most with the average annual earnings of $39,375, while those with high school diploma education have the smallest earnings of $24,625.
| Educational Attainment | Male Income | Female Income |
| Less than High School | - | - |
| High School Diploma | $41,727 | $24,625 |
| College or Associate's Degree | $95,167 | $39,375 |
| Bachelor's Degree | - | - |
| Graduate Degree | - | - |
| Total | $63,611 | $36,170 |
Family Income in Lynnwood Pricedale
Family Income Brackets in Lynnwood Pricedale
According to the Lynnwood Pricedale family income data, there are 139 families falling into the $100,000 to $149,999 income range, which is the most common income bracket and makes up 29.6% of all families. Conversely, the $200,000+ income bracket is the least frequent group with only 10 families (2.1%) belonging to this category.
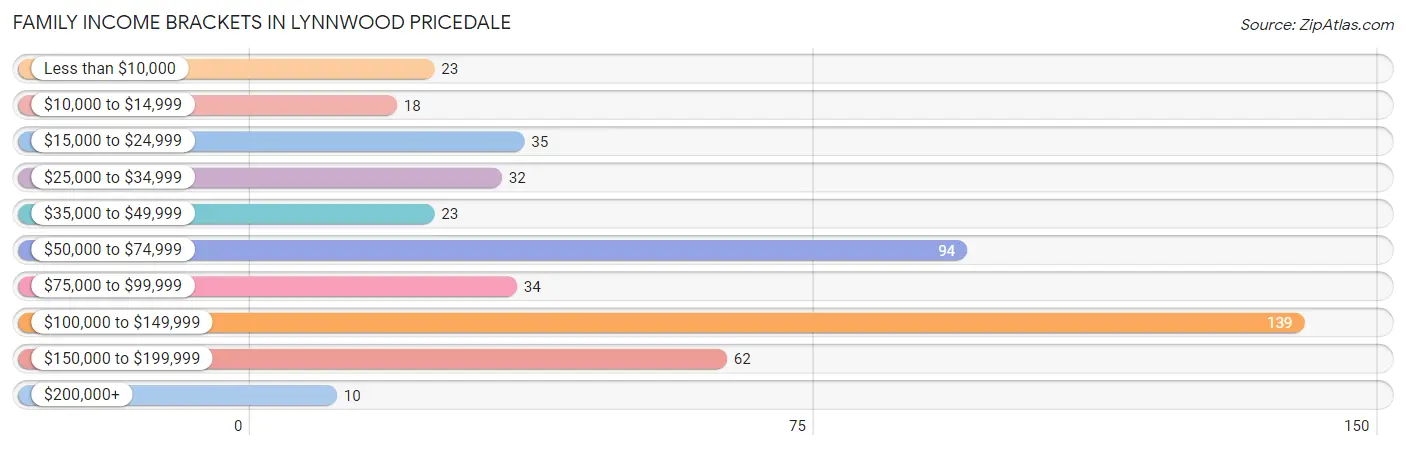
| Income Bracket | # Families | % Families |
| Less than $10,000 | 23 | 4.9% |
| $10,000 to $14,999 | 18 | 3.8% |
| $15,000 to $24,999 | 35 | 7.4% |
| $25,000 to $34,999 | 32 | 6.8% |
| $35,000 to $49,999 | 23 | 4.9% |
| $50,000 to $74,999 | 94 | 20.0% |
| $75,000 to $99,999 | 34 | 7.2% |
| $100,000 to $149,999 | 139 | 29.6% |
| $150,000 to $199,999 | 62 | 13.2% |
| $200,000+ | 10 | 2.1% |
Family Income by Famaliy Size in Lynnwood Pricedale
4-person families (51 | 10.8%) account for the highest median family income in Lynnwood Pricedale with $114,327 per family, while 3-person families (177 | 37.7%) have the highest median income of $32,181 per family member.
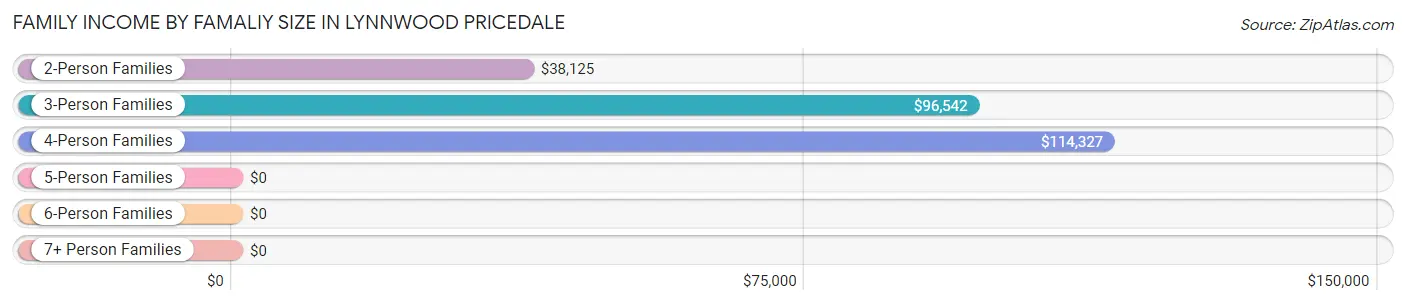
| Income Bracket | # Families | Median Income |
| 2-Person Families | 222 (47.2%) | $38,125 |
| 3-Person Families | 177 (37.7%) | $96,542 |
| 4-Person Families | 51 (10.8%) | $114,327 |
| 5-Person Families | 0 (0.0%) | $0 |
| 6-Person Families | 0 (0.0%) | $0 |
| 7+ Person Families | 20 (4.3%) | $0 |
| Total | 470 (100.0%) | $95,500 |
Family Income by Number of Earners in Lynnwood Pricedale
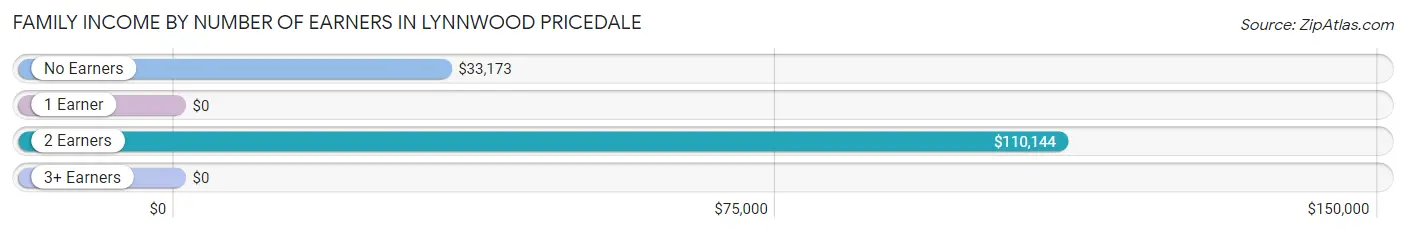
| Number of Earners | # Families | Median Income |
| No Earners | 105 (22.3%) | $33,173 |
| 1 Earner | 142 (30.2%) | $0 |
| 2 Earners | 199 (42.3%) | $110,144 |
| 3+ Earners | 24 (5.1%) | $0 |
| Total | 470 (100.0%) | $95,500 |
Household Income in Lynnwood Pricedale
Household Income Brackets in Lynnwood Pricedale
With 187 households falling in the category, the $35,000 to $49,999 income range is the most frequent in Lynnwood Pricedale, accounting for 17.9% of all households. In contrast, only 10 households (1.0%) fall into the $200,000+ income bracket, making it the least populous group.
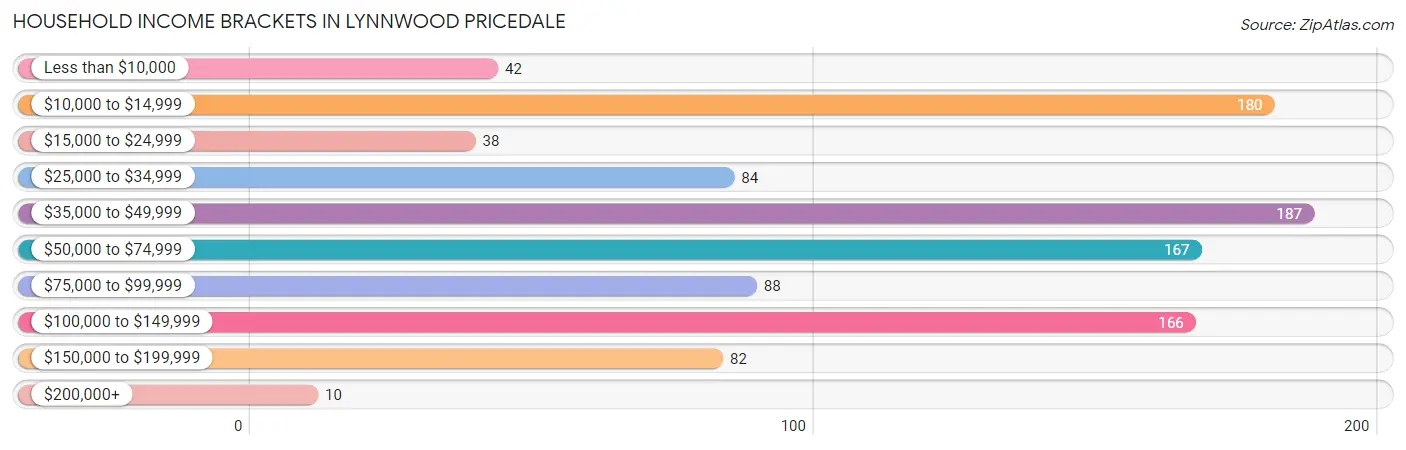
| Income Bracket | # Households | % Households |
| Less than $10,000 | 42 | 4.0% |
| $10,000 to $14,999 | 180 | 17.2% |
| $15,000 to $24,999 | 38 | 3.6% |
| $25,000 to $34,999 | 84 | 8.0% |
| $35,000 to $49,999 | 187 | 17.9% |
| $50,000 to $74,999 | 167 | 16.0% |
| $75,000 to $99,999 | 88 | 8.4% |
| $100,000 to $149,999 | 166 | 15.9% |
| $150,000 to $199,999 | 82 | 7.9% |
| $200,000+ | 10 | 1.0% |
Household Income by Householder Age in Lynnwood Pricedale
The median household income in Lynnwood Pricedale is $46,522, with the highest median household income of $83,403 found in the 25 to 44 years age bracket for the primary householder. A total of 307 households (29.4%) fall into this category. Meanwhile, the 15 to 24 years age bracket for the primary householder has the lowest median household income of $0, with 54 households (5.2%) in this group.
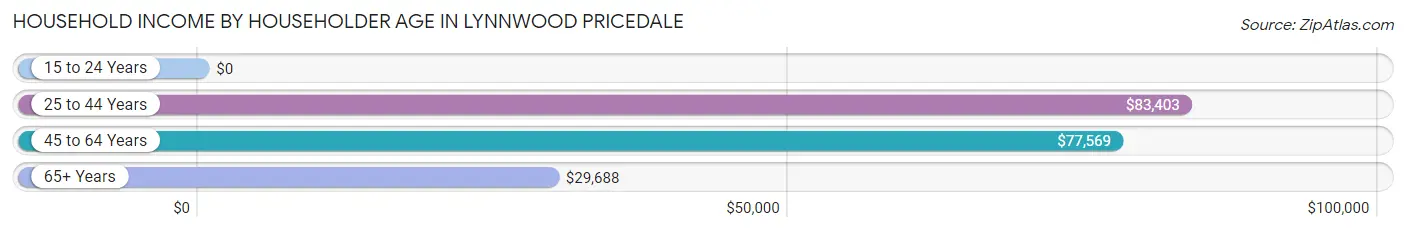
| Income Bracket | # Households | Median Income |
| 15 to 24 Years | 54 (5.2%) | $0 |
| 25 to 44 Years | 307 (29.4%) | $83,403 |
| 45 to 64 Years | 247 (23.7%) | $77,569 |
| 65+ Years | 436 (41.8%) | $29,688 |
| Total | 1,044 (100.0%) | $46,522 |
Poverty in Lynnwood Pricedale
Income Below Poverty by Sex and Age in Lynnwood Pricedale
With 4.6% poverty level for males and 26.0% for females among the residents of Lynnwood Pricedale, 55 to 64 year old males and 75 year old and over females are the most vulnerable to poverty, with 28 males (16.5%) and 147 females (61.3%) in their respective age groups living below the poverty level.
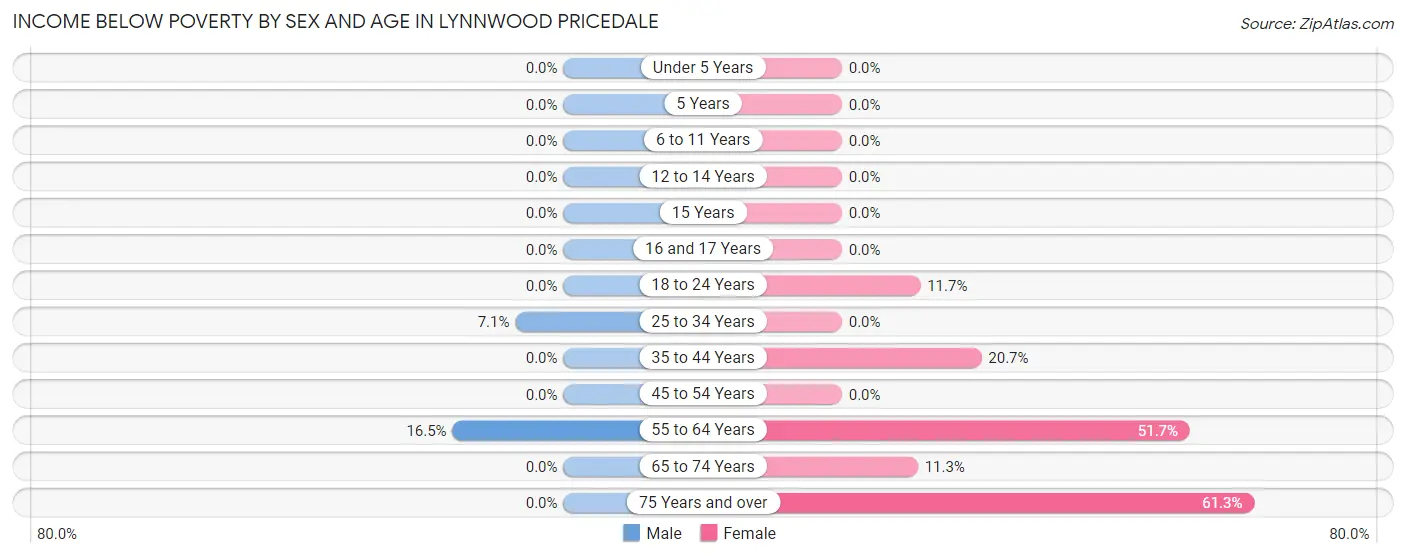
| Age Bracket | Male | Female |
| Under 5 Years | 0 (0.0%) | 0 (0.0%) |
| 5 Years | 0 (0.0%) | 0 (0.0%) |
| 6 to 11 Years | 0 (0.0%) | 0 (0.0%) |
| 12 to 14 Years | 0 (0.0%) | 0 (0.0%) |
| 15 Years | 0 (0.0%) | 0 (0.0%) |
| 16 and 17 Years | 0 (0.0%) | 0 (0.0%) |
| 18 to 24 Years | 0 (0.0%) | 12 (11.7%) |
| 25 to 34 Years | 12 (7.1%) | 0 (0.0%) |
| 35 to 44 Years | 0 (0.0%) | 23 (20.7%) |
| 45 to 54 Years | 0 (0.0%) | 0 (0.0%) |
| 55 to 64 Years | 28 (16.5%) | 77 (51.7%) |
| 65 to 74 Years | 0 (0.0%) | 16 (11.3%) |
| 75 Years and over | 0 (0.0%) | 147 (61.3%) |
| Total | 40 (4.6%) | 275 (26.0%) |
Income Above Poverty by Sex and Age in Lynnwood Pricedale
According to the poverty statistics in Lynnwood Pricedale, males aged under 5 years and females aged under 5 years are the age groups that are most secure financially, with 100.0% of males and 100.0% of females in these age groups living above the poverty line.
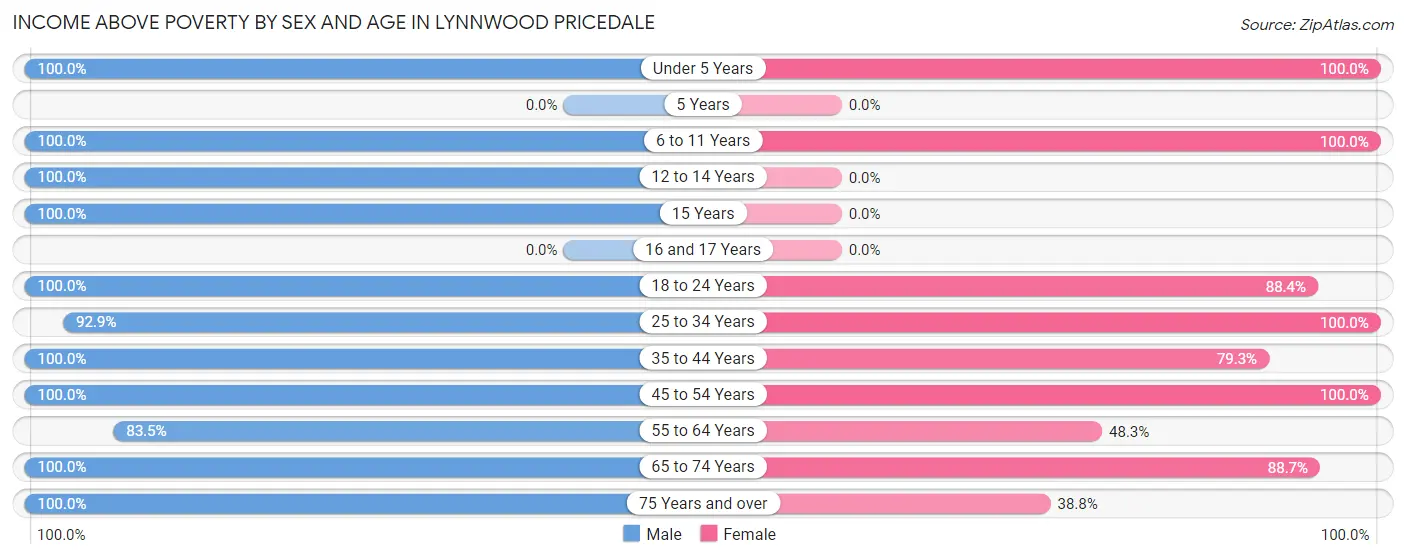
| Age Bracket | Male | Female |
| Under 5 Years | 36 (100.0%) | 30 (100.0%) |
| 5 Years | 0 (0.0%) | 0 (0.0%) |
| 6 to 11 Years | 49 (100.0%) | 50 (100.0%) |
| 12 to 14 Years | 65 (100.0%) | 0 (0.0%) |
| 15 Years | 13 (100.0%) | 0 (0.0%) |
| 16 and 17 Years | 0 (0.0%) | 0 (0.0%) |
| 18 to 24 Years | 63 (100.0%) | 91 (88.3%) |
| 25 to 34 Years | 156 (92.9%) | 167 (100.0%) |
| 35 to 44 Years | 83 (100.0%) | 88 (79.3%) |
| 45 to 54 Years | 54 (100.0%) | 66 (100.0%) |
| 55 to 64 Years | 142 (83.5%) | 72 (48.3%) |
| 65 to 74 Years | 86 (100.0%) | 126 (88.7%) |
| 75 Years and over | 73 (100.0%) | 93 (38.8%) |
| Total | 820 (95.4%) | 783 (74.0%) |
Income Below Poverty Among Married-Couple Families in Lynnwood Pricedale
The poverty statistics for married-couple families in Lynnwood Pricedale show that 5.9% or 18 of the total 307 families live below the poverty line. Families with no children have the highest poverty rate of 9.8%, comprising of 18 families. On the other hand, families with 1 or 2 children have the lowest poverty rate of 0.0%, which includes 0 families.
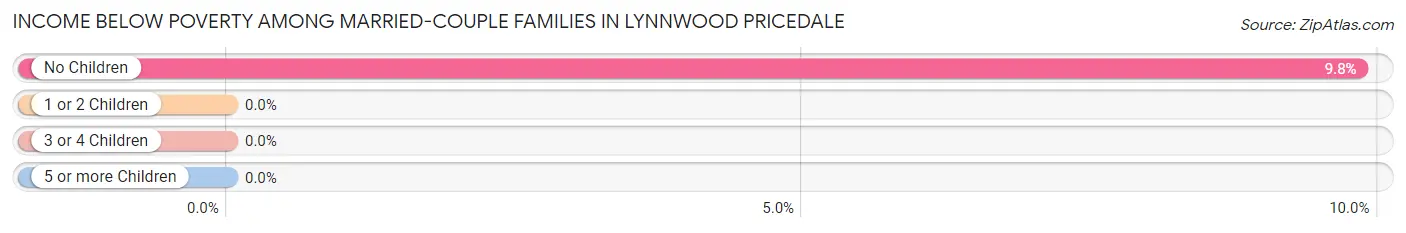
| Children | Above Poverty | Below Poverty |
| No Children | 165 (90.2%) | 18 (9.8%) |
| 1 or 2 Children | 124 (100.0%) | 0 (0.0%) |
| 3 or 4 Children | 0 (0.0%) | 0 (0.0%) |
| 5 or more Children | 0 (0.0%) | 0 (0.0%) |
| Total | 289 (94.1%) | 18 (5.9%) |
Income Below Poverty Among Single-Parent Households in Lynnwood Pricedale
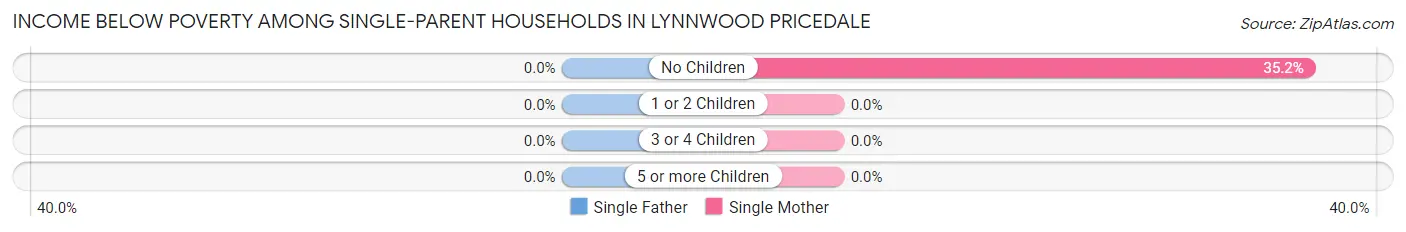
| Children | Single Father | Single Mother |
| No Children | 0 (0.0%) | 32 (35.2%) |
| 1 or 2 Children | 0 (0.0%) | 0 (0.0%) |
| 3 or 4 Children | 0 (0.0%) | 0 (0.0%) |
| 5 or more Children | 0 (0.0%) | 0 (0.0%) |
| Total | 0 (0.0%) | 32 (19.6%) |
Income Below Poverty Among Married-Couple vs Single-Parent Households in Lynnwood Pricedale
The poverty data for Lynnwood Pricedale shows that 18 of the married-couple family households (5.9%) and 32 of the single-parent households (19.6%) are living below the poverty level. Within the married-couple family households, those with no children have the highest poverty rate, with 18 households (9.8%) falling below the poverty line. Among the single-parent households, those with no children have the highest poverty rate, with 32 household (35.2%) living below poverty.
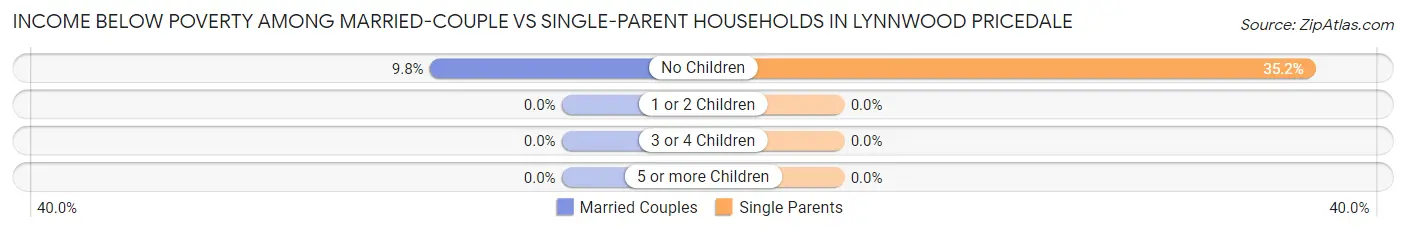
| Children | Married-Couple Families | Single-Parent Households |
| No Children | 18 (9.8%) | 32 (35.2%) |
| 1 or 2 Children | 0 (0.0%) | 0 (0.0%) |
| 3 or 4 Children | 0 (0.0%) | 0 (0.0%) |
| 5 or more Children | 0 (0.0%) | 0 (0.0%) |
| Total | 18 (5.9%) | 32 (19.6%) |
Race in Lynnwood Pricedale
The most populous races in Lynnwood Pricedale are White / Caucasian (1,780 | 92.8%), Black / African American (119 | 6.2%), and Two or more Races (19 | 1.0%).
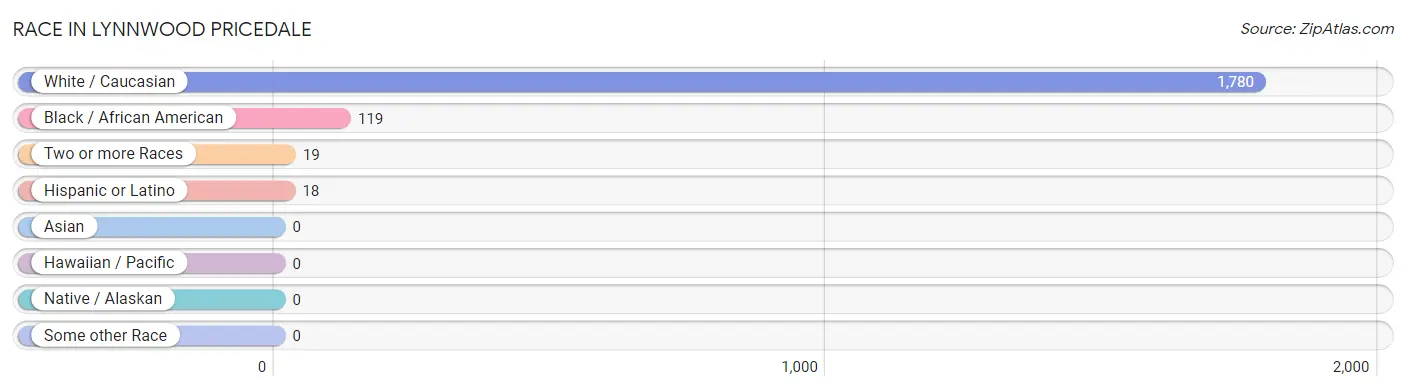
| Race | # Population | % Population |
| Asian | 0 | 0.0% |
| Black / African American | 119 | 6.2% |
| Hawaiian / Pacific | 0 | 0.0% |
| Hispanic or Latino | 18 | 0.9% |
| Native / Alaskan | 0 | 0.0% |
| White / Caucasian | 1,780 | 92.8% |
| Two or more Races | 19 | 1.0% |
| Some other Race | 0 | 0.0% |
| Total | 1,918 | 100.0% |
Ancestry in Lynnwood Pricedale
The most populous ancestries reported in Lynnwood Pricedale are Irish (328 | 17.1%), German (307 | 16.0%), Italian (298 | 15.5%), Polish (238 | 12.4%), and English (182 | 9.5%), together accounting for 70.6% of all Lynnwood Pricedale residents.
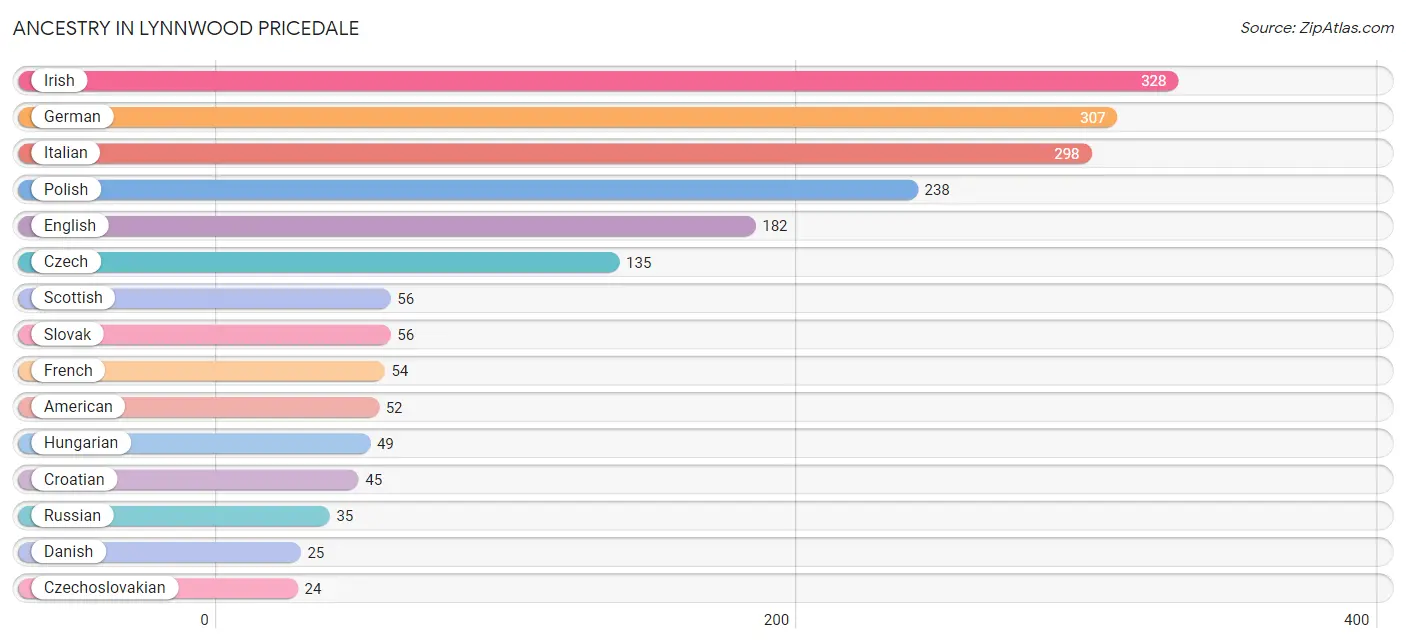
| Ancestry | # Population | % Population |
| American | 52 | 2.7% |
| Arab | 13 | 0.7% |
| Belgian | 18 | 0.9% |
| Croatian | 45 | 2.4% |
| Czech | 135 | 7.0% |
| Czechoslovakian | 24 | 1.3% |
| Danish | 25 | 1.3% |
| Eastern European | 20 | 1.0% |
| English | 182 | 9.5% |
| French | 54 | 2.8% |
| German | 307 | 16.0% |
| Hungarian | 49 | 2.5% |
| Irish | 328 | 17.1% |
| Italian | 298 | 15.5% |
| Lebanese | 13 | 0.7% |
| Mexican | 18 | 0.9% |
| Polish | 238 | 12.4% |
| Romanian | 12 | 0.6% |
| Russian | 35 | 1.8% |
| Scottish | 56 | 2.9% |
| Serbian | 6 | 0.3% |
| Slovak | 56 | 2.9% |
| Slovene | 13 | 0.7% |
| Trinidadian and Tobagonian | 1 | 0.1% |
| Welsh | 7 | 0.4% | View All 25 Rows |
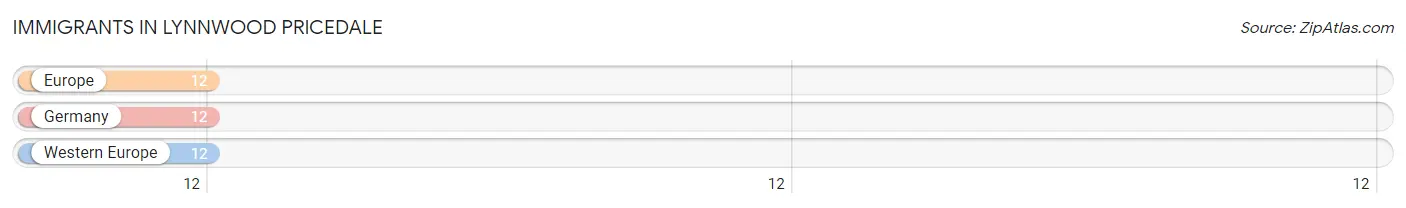
Immigrants in Lynnwood Pricedale
The most numerous immigrant groups reported in Lynnwood Pricedale came from Europe (12 | 0.6%), Germany (12 | 0.6%), and Western Europe (12 | 0.6%), together accounting for 1.9% of all Lynnwood Pricedale residents.
| Immigration Origin | # Population | % Population |
| Europe | 12 | 0.6% |
| Germany | 12 | 0.6% |
| Western Europe | 12 | 0.6% | View All 3 Rows |
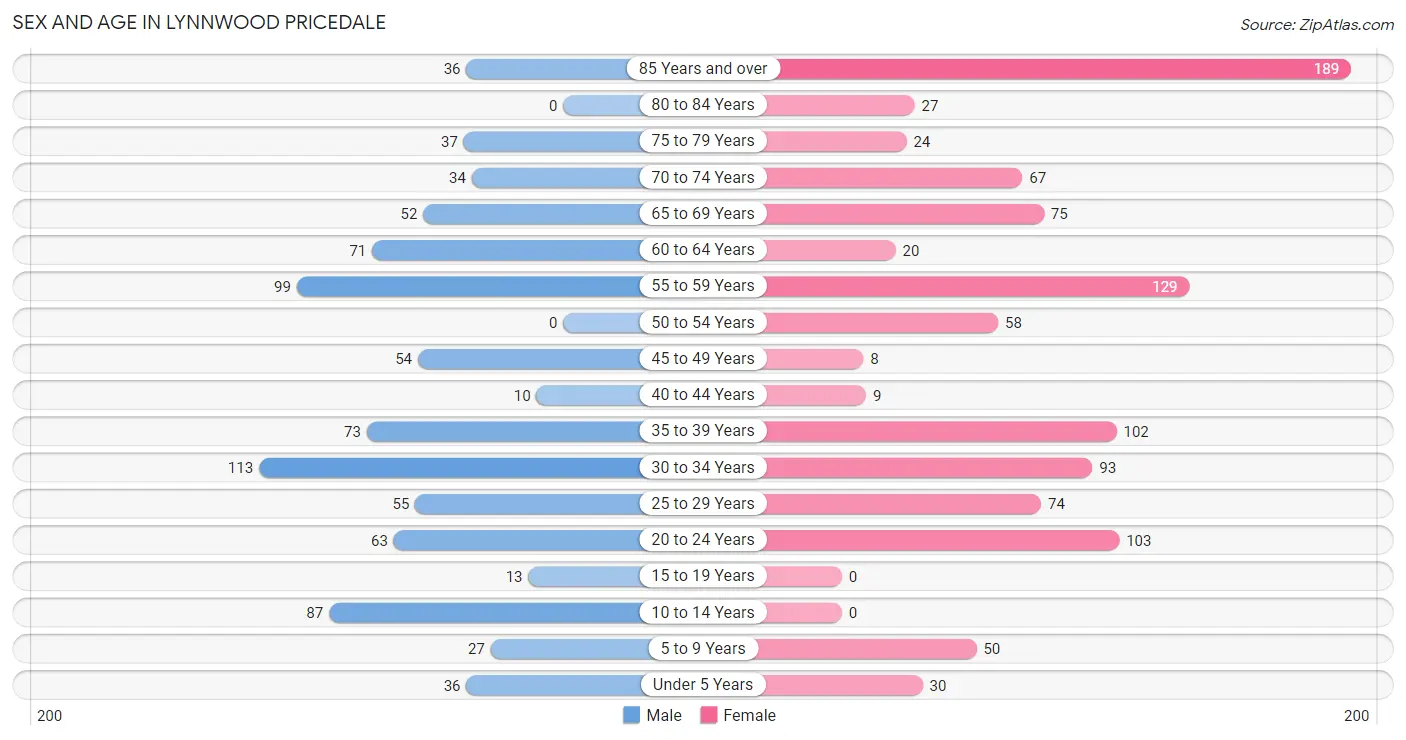
Sex and Age in Lynnwood Pricedale
Sex and Age in Lynnwood Pricedale
The most populous age groups in Lynnwood Pricedale are 30 to 34 Years (113 | 13.1%) for men and 85 Years and over (189 | 17.9%) for women.
| Age Bracket | Male | Female |
| Under 5 Years | 36 (4.2%) | 30 (2.8%) |
| 5 to 9 Years | 27 (3.1%) | 50 (4.7%) |
| 10 to 14 Years | 87 (10.1%) | 0 (0.0%) |
| 15 to 19 Years | 13 (1.5%) | 0 (0.0%) |
| 20 to 24 Years | 63 (7.3%) | 103 (9.7%) |
| 25 to 29 Years | 55 (6.4%) | 74 (7.0%) |
| 30 to 34 Years | 113 (13.1%) | 93 (8.8%) |
| 35 to 39 Years | 73 (8.5%) | 102 (9.6%) |
| 40 to 44 Years | 10 (1.2%) | 9 (0.9%) |
| 45 to 49 Years | 54 (6.3%) | 8 (0.8%) |
| 50 to 54 Years | 0 (0.0%) | 58 (5.5%) |
| 55 to 59 Years | 99 (11.5%) | 129 (12.2%) |
| 60 to 64 Years | 71 (8.3%) | 20 (1.9%) |
| 65 to 69 Years | 52 (6.0%) | 75 (7.1%) |
| 70 to 74 Years | 34 (4.0%) | 67 (6.3%) |
| 75 to 79 Years | 37 (4.3%) | 24 (2.3%) |
| 80 to 84 Years | 0 (0.0%) | 27 (2.5%) |
| 85 Years and over | 36 (4.2%) | 189 (17.9%) |
| Total | 860 (100.0%) | 1,058 (100.0%) |
Families and Households in Lynnwood Pricedale
Median Family Size in Lynnwood Pricedale
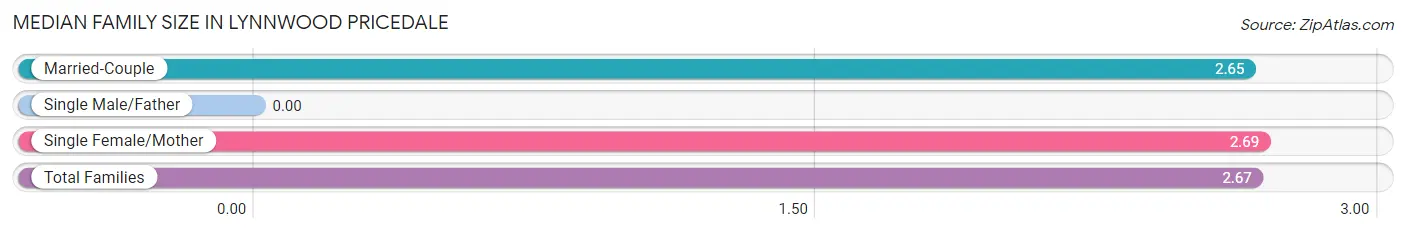
| Family Type | # Families | Family Size |
| Married-Couple | 307 (65.3%) | 2.65 |
| Single Male/Father | 0 (0.0%) | - |
| Single Female/Mother | 163 (34.7%) | 2.69 |
| Total Families | 470 (100.0%) | 2.67 |
Median Household Size in Lynnwood Pricedale
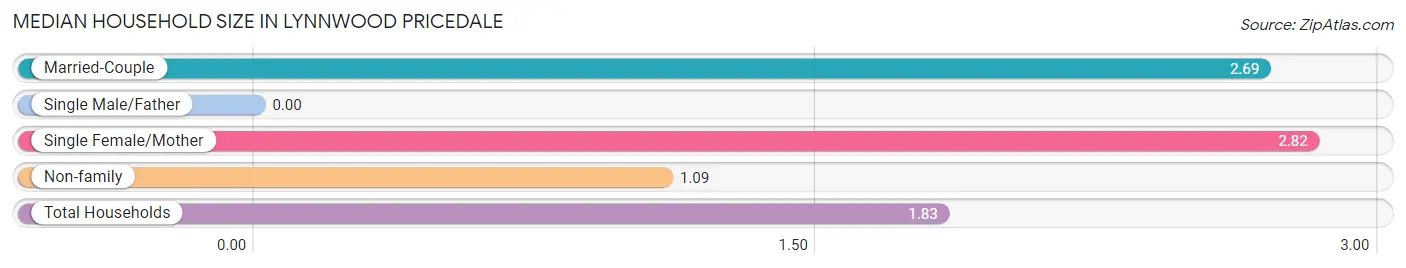
| Household Type | # Households | Household Size |
| Married-Couple | 307 (29.4%) | 2.69 |
| Single Male/Father | 0 (0.0%) | - |
| Single Female/Mother | 163 (15.6%) | 2.82 |
| Non-family | 574 (55.0%) | 1.09 |
| Total Households | 1,044 (100.0%) | 1.83 |
Household Size by Marriage Status in Lynnwood Pricedale
Out of a total of 1,044 households in Lynnwood Pricedale, 470 (45.0%) are family households, while 574 (55.0%) are nonfamily households. The most numerous type of family households are 2-person households, comprising 213, and the most common type of nonfamily households are 1-person households, comprising 523.
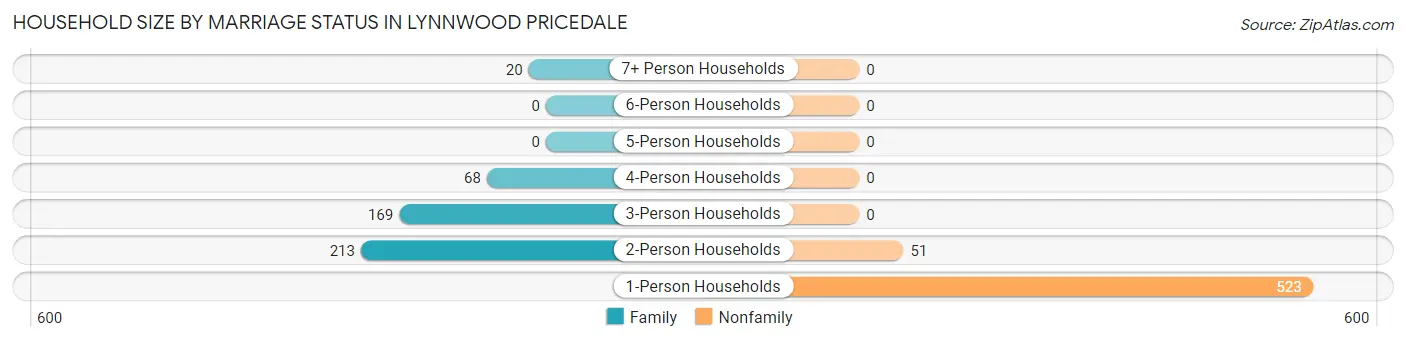
| Household Size | Family Households | Nonfamily Households |
| 1-Person Households | - | 523 (50.1%) |
| 2-Person Households | 213 (20.4%) | 51 (4.9%) |
| 3-Person Households | 169 (16.2%) | 0 (0.0%) |
| 4-Person Households | 68 (6.5%) | 0 (0.0%) |
| 5-Person Households | 0 (0.0%) | 0 (0.0%) |
| 6-Person Households | 0 (0.0%) | 0 (0.0%) |
| 7+ Person Households | 20 (1.9%) | 0 (0.0%) |
| Total | 470 (45.0%) | 574 (55.0%) |
Female Fertility in Lynnwood Pricedale
Fertility by Age in Lynnwood Pricedale
| Age Bracket | Women with Births | Births / 1,000 Women |
| 15 to 19 years | 0 (0.0%) | 0.0 |
| 20 to 34 years | 0 (0.0%) | 0.0 |
| 35 to 50 years | 0 (0.0%) | 0.0 |
| Total | 0 (0.0%) | 0.0 |
Fertility by Age by Marriage Status in Lynnwood Pricedale
| Age Bracket | Married | Unmarried |
| 15 to 19 years | 0 (0.0%) | 0 (0.0%) |
| 20 to 34 years | 0 (0.0%) | 0 (0.0%) |
| 35 to 50 years | 0 (0.0%) | 0 (0.0%) |
| Total | 0 (0.0%) | 0 (0.0%) |
Fertility by Education in Lynnwood Pricedale
| Educational Attainment | Women with Births | Births / 1,000 Women |
| Less than High School | 0 (0.0%) | 0.0 |
| High School Diploma | 0 (0.0%) | 0.0 |
| College or Associate's Degree | 0 (0.0%) | 0.0 |
| Bachelor's Degree | 0 (0.0%) | 0.0 |
| Graduate Degree | 0 (0.0%) | 0.0 |
| Total | 0 (0.0%) | 0.0 |
Fertility by Education by Marriage Status in Lynnwood Pricedale
| Educational Attainment | Married | Unmarried |
| Less than High School | 0 (0.0%) | 0 (0.0%) |
| High School Diploma | 0 (0.0%) | 0 (0.0%) |
| College or Associate's Degree | 0 (0.0%) | 0 (0.0%) |
| Bachelor's Degree | 0 (0.0%) | 0 (0.0%) |
| Graduate Degree | 0 (0.0%) | 0 (0.0%) |
| Total | 0 (0.0%) | 0 (0.0%) |
Employment Characteristics in Lynnwood Pricedale
Employment by Class of Employer in Lynnwood Pricedale
Among the 862 employed individuals in Lynnwood Pricedale, private company employees (662 | 76.8%), local government employees (121 | 14.0%), and not-for-profit organizations (56 | 6.5%) make up the most common classes of employment.
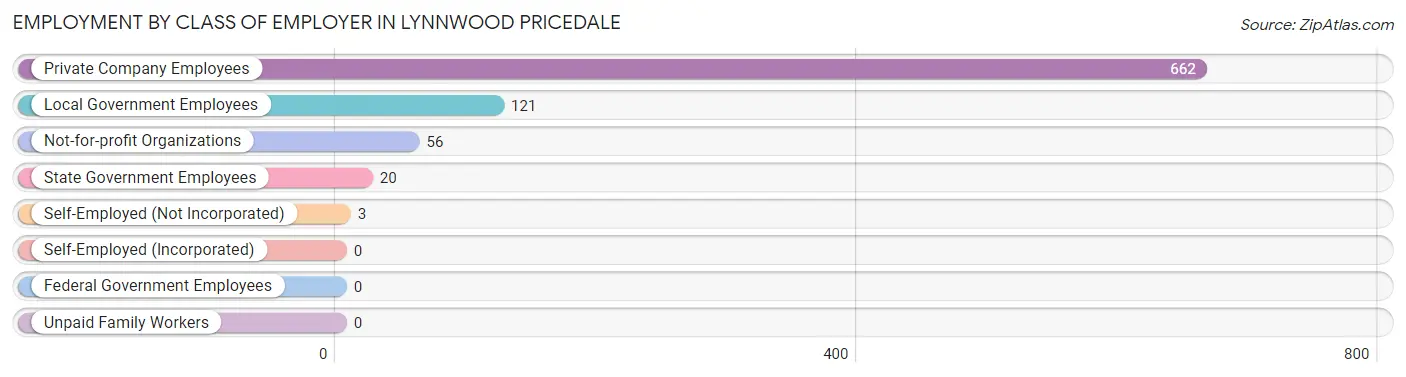
| Employer Class | # Employees | % Employees |
| Private Company Employees | 662 | 76.8% |
| Self-Employed (Incorporated) | 0 | 0.0% |
| Self-Employed (Not Incorporated) | 3 | 0.4% |
| Not-for-profit Organizations | 56 | 6.5% |
| Local Government Employees | 121 | 14.0% |
| State Government Employees | 20 | 2.3% |
| Federal Government Employees | 0 | 0.0% |
| Unpaid Family Workers | 0 | 0.0% |
| Total | 862 | 100.0% |
Employment Status by Age in Lynnwood Pricedale
According to the labor force statistics for Lynnwood Pricedale, out of the total population over 16 years of age (1,675), 52.7% or 883 individuals are in the labor force, with 1.5% or 13 of them unemployed. The age group with the highest labor force participation rate is 20 to 24 years, with 86.1% or 143 individuals in the labor force. Within the labor force, the 55 to 59 years age range has the highest percentage of unemployed individuals, with 9.8% or 13 of them being unemployed.
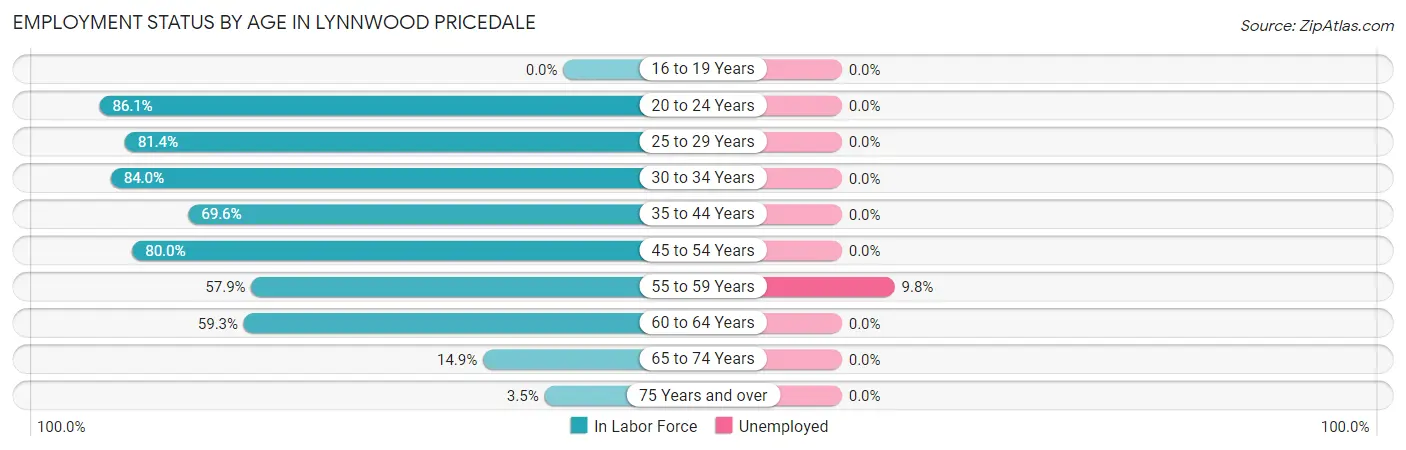
| Age Bracket | In Labor Force | Unemployed |
| 16 to 19 Years | 0 (0.0%) | 0 (0.0%) |
| 20 to 24 Years | 143 (86.1%) | 0 (0.0%) |
| 25 to 29 Years | 105 (81.4%) | 0 (0.0%) |
| 30 to 34 Years | 173 (84.0%) | 0 (0.0%) |
| 35 to 44 Years | 135 (69.6%) | 0 (0.0%) |
| 45 to 54 Years | 96 (80.0%) | 0 (0.0%) |
| 55 to 59 Years | 132 (57.9%) | 13 (9.8%) |
| 60 to 64 Years | 54 (59.3%) | 0 (0.0%) |
| 65 to 74 Years | 34 (14.9%) | 0 (0.0%) |
| 75 Years and over | 11 (3.5%) | 0 (0.0%) |
| Total | 883 (52.7%) | 13 (1.5%) |
Employment Status by Educational Attainment in Lynnwood Pricedale
According to labor force statistics for Lynnwood Pricedale, 71.8% of individuals (695) out of the total population between 25 and 64 years of age (968) are in the labor force, with 1.9% or 13 of them being unemployed. The group with the highest labor force participation rate are those with the educational attainment of bachelor's degree or higher, with 77.9% or 232 individuals in the labor force. Within the labor force, individuals with high school diploma education have the highest percentage of unemployment, with 4.9% or 13 of them being unemployed.
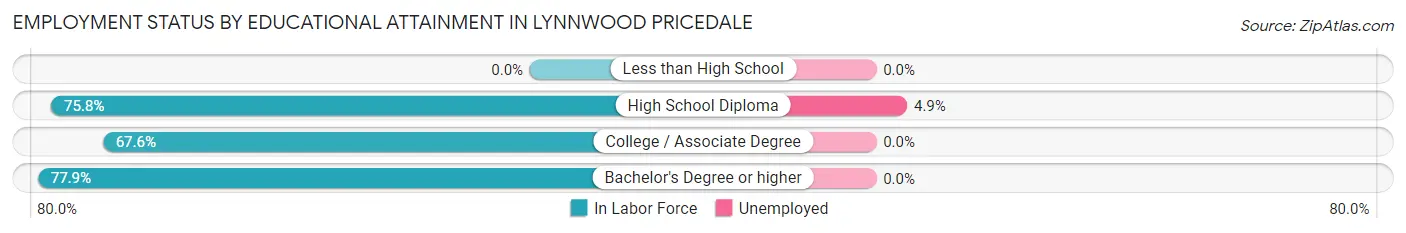
| Educational Attainment | In Labor Force | Unemployed |
| Less than High School | 0 (0.0%) | 0 (0.0%) |
| High School Diploma | 263 (75.8%) | 17 (4.9%) |
| College / Associate Degree | 200 (67.6%) | 0 (0.0%) |
| Bachelor's Degree or higher | 232 (77.9%) | 0 (0.0%) |
| Total | 695 (71.8%) | 18 (1.9%) |
Employment Occupations by Sex in Lynnwood Pricedale
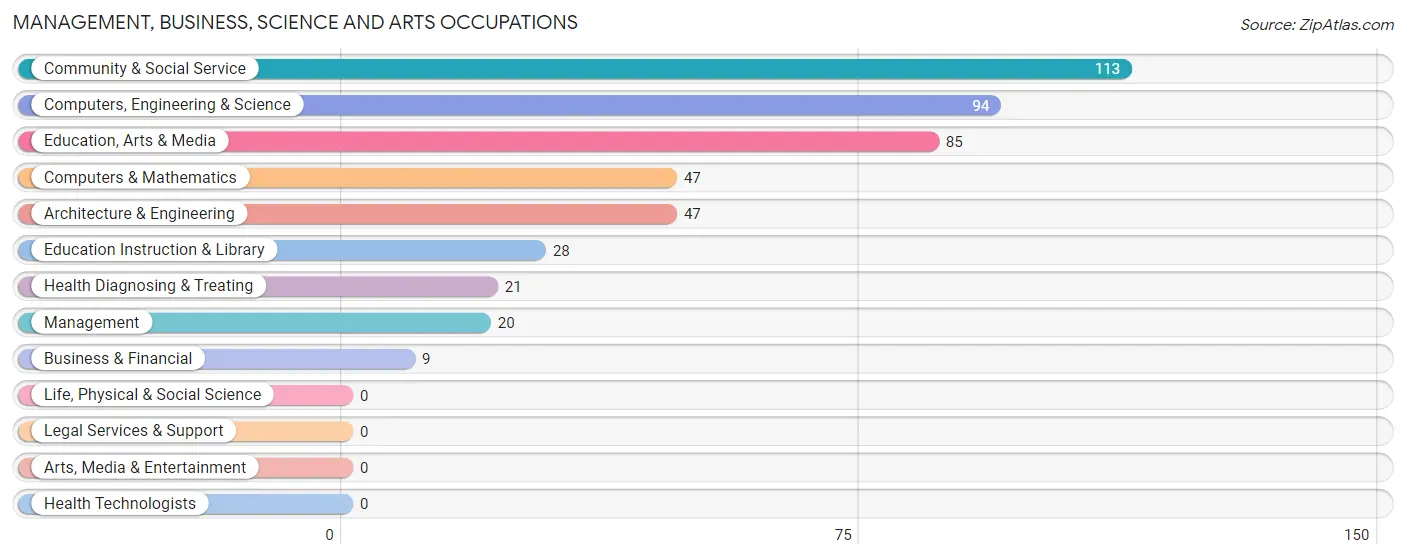
Management, Business, Science and Arts Occupations
The most common Management, Business, Science and Arts occupations in Lynnwood Pricedale are Community & Social Service (113 | 13.0%), Computers, Engineering & Science (94 | 10.8%), Education, Arts & Media (85 | 9.8%), Computers & Mathematics (47 | 5.4%), and Architecture & Engineering (47 | 5.4%).
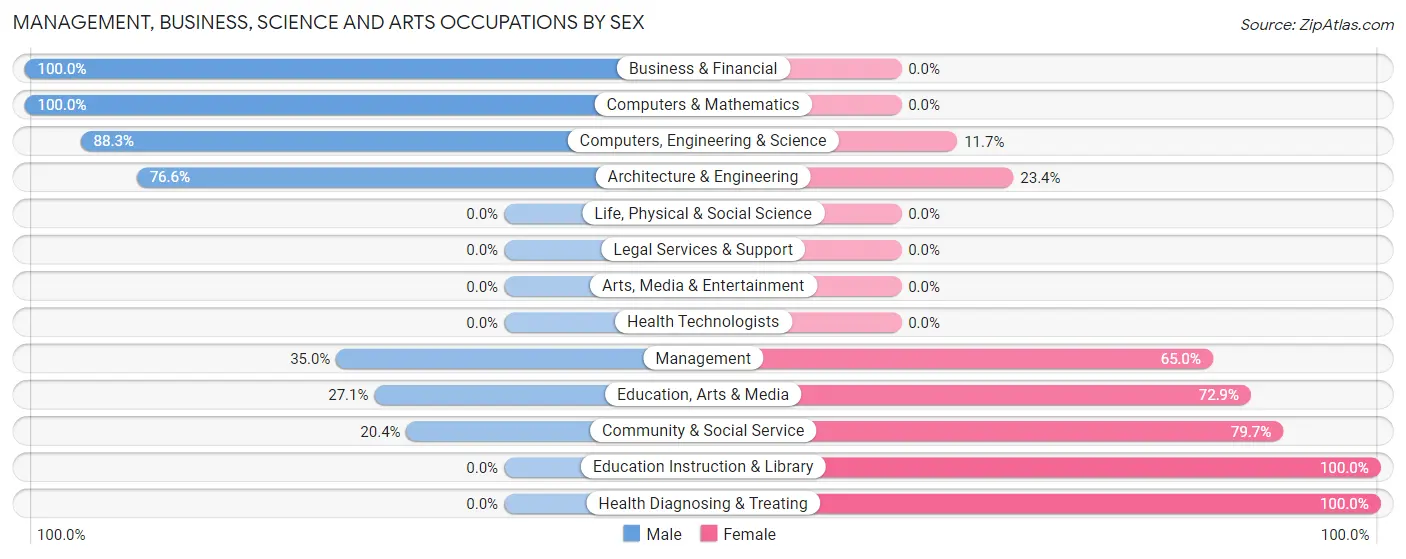
Management, Business, Science and Arts Occupations by Sex
Within the Management, Business, Science and Arts occupations in Lynnwood Pricedale, the most male-oriented occupations are Business & Financial (100.0%), Computers & Mathematics (100.0%), and Computers, Engineering & Science (88.3%), while the most female-oriented occupations are Education Instruction & Library (100.0%), Health Diagnosing & Treating (100.0%), and Community & Social Service (79.6%).
| Occupation | Male | Female |
| Management | 7 (35.0%) | 13 (65.0%) |
| Business & Financial | 9 (100.0%) | 0 (0.0%) |
| Computers, Engineering & Science | 83 (88.3%) | 11 (11.7%) |
| Computers & Mathematics | 47 (100.0%) | 0 (0.0%) |
| Architecture & Engineering | 36 (76.6%) | 11 (23.4%) |
| Life, Physical & Social Science | 0 (0.0%) | 0 (0.0%) |
| Community & Social Service | 23 (20.3%) | 90 (79.6%) |
| Education, Arts & Media | 23 (27.1%) | 62 (72.9%) |
| Legal Services & Support | 0 (0.0%) | 0 (0.0%) |
| Education Instruction & Library | 0 (0.0%) | 28 (100.0%) |
| Arts, Media & Entertainment | 0 (0.0%) | 0 (0.0%) |
| Health Diagnosing & Treating | 0 (0.0%) | 21 (100.0%) |
| Health Technologists | 0 (0.0%) | 0 (0.0%) |
| Total (Category) | 122 (47.5%) | 135 (52.5%) |
| Total (Overall) | 425 (48.8%) | 445 (51.1%) |
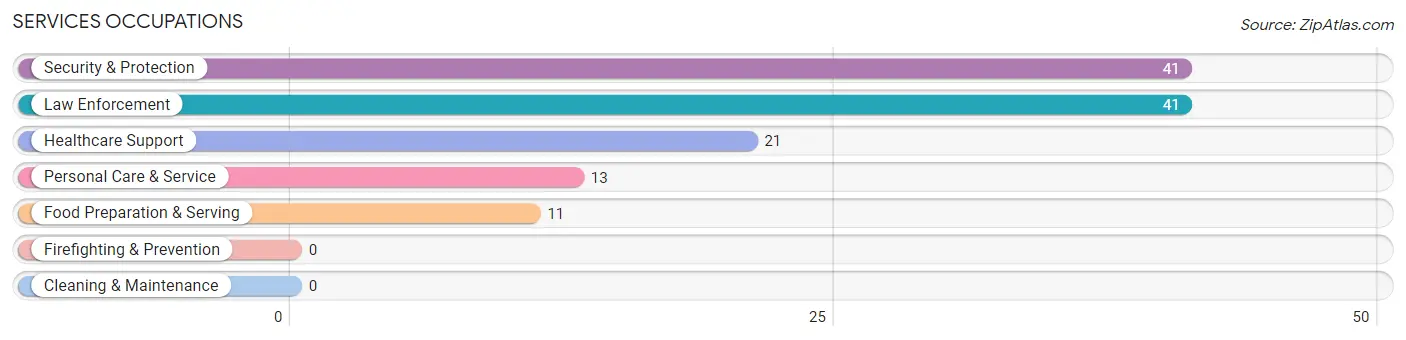
Services Occupations
The most common Services occupations in Lynnwood Pricedale are Security & Protection (41 | 4.7%), Law Enforcement (41 | 4.7%), Healthcare Support (21 | 2.4%), Personal Care & Service (13 | 1.5%), and Food Preparation & Serving (11 | 1.3%).
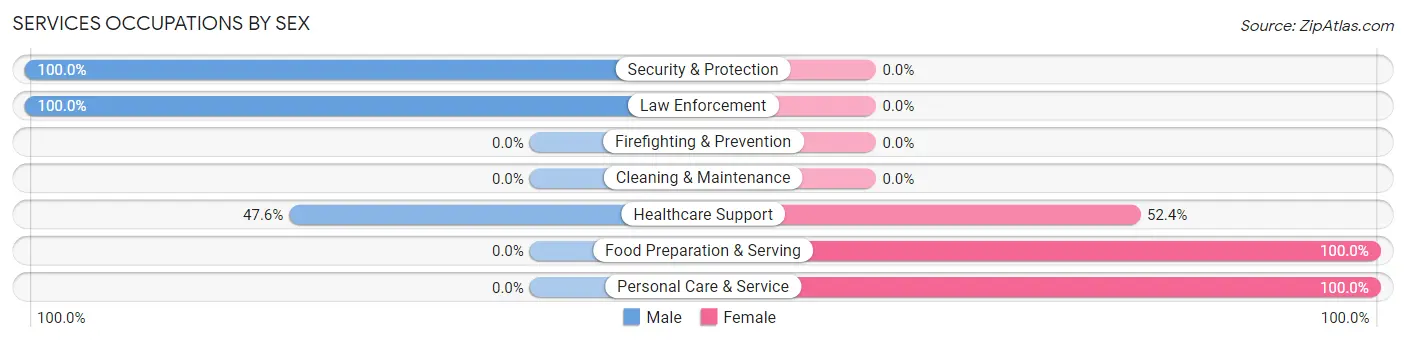
Services Occupations by Sex
Within the Services occupations in Lynnwood Pricedale, the most male-oriented occupations are Security & Protection (100.0%), Law Enforcement (100.0%), and Healthcare Support (47.6%), while the most female-oriented occupations are Food Preparation & Serving (100.0%), Personal Care & Service (100.0%), and Healthcare Support (52.4%).
| Occupation | Male | Female |
| Healthcare Support | 10 (47.6%) | 11 (52.4%) |
| Security & Protection | 41 (100.0%) | 0 (0.0%) |
| Firefighting & Prevention | 0 (0.0%) | 0 (0.0%) |
| Law Enforcement | 41 (100.0%) | 0 (0.0%) |
| Food Preparation & Serving | 0 (0.0%) | 11 (100.0%) |
| Cleaning & Maintenance | 0 (0.0%) | 0 (0.0%) |
| Personal Care & Service | 0 (0.0%) | 13 (100.0%) |
| Total (Category) | 51 (59.3%) | 35 (40.7%) |
| Total (Overall) | 425 (48.8%) | 445 (51.1%) |
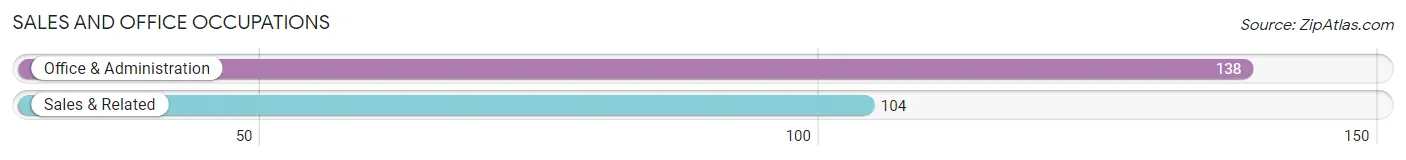
Sales and Office Occupations
The most common Sales and Office occupations in Lynnwood Pricedale are Office & Administration (138 | 15.9%), and Sales & Related (104 | 11.9%).
Sales and Office Occupations by Sex
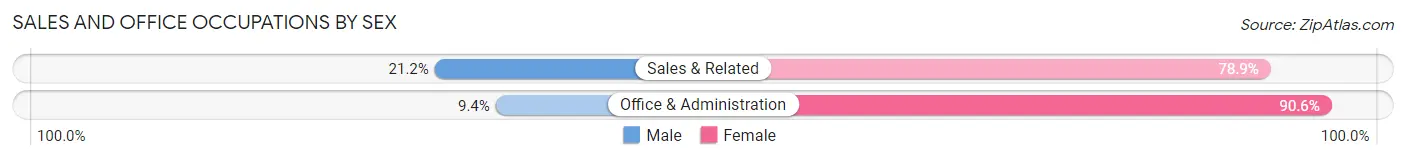
| Occupation | Male | Female |
| Sales & Related | 22 (21.1%) | 82 (78.8%) |
| Office & Administration | 13 (9.4%) | 125 (90.6%) |
| Total (Category) | 35 (14.5%) | 207 (85.5%) |
| Total (Overall) | 425 (48.8%) | 445 (51.1%) |
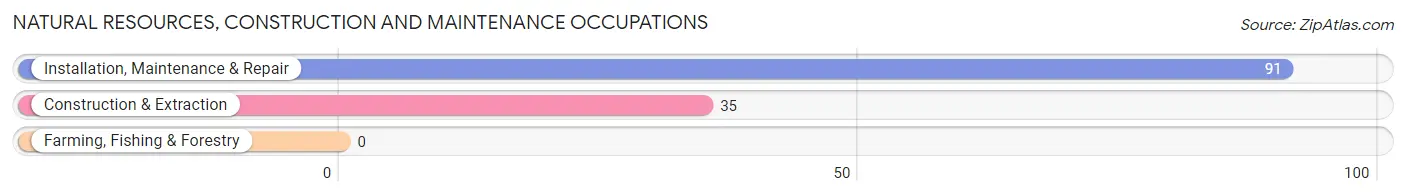
Natural Resources, Construction and Maintenance Occupations
The most common Natural Resources, Construction and Maintenance occupations in Lynnwood Pricedale are Installation, Maintenance & Repair (91 | 10.5%), and Construction & Extraction (35 | 4.0%).
Natural Resources, Construction and Maintenance Occupations by Sex
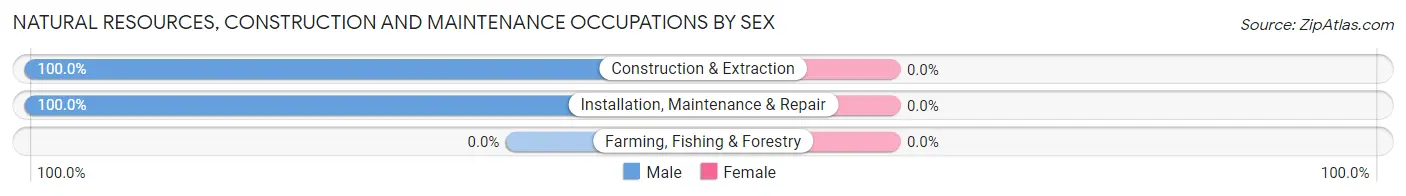
| Occupation | Male | Female |
| Farming, Fishing & Forestry | 0 (0.0%) | 0 (0.0%) |
| Construction & Extraction | 35 (100.0%) | 0 (0.0%) |
| Installation, Maintenance & Repair | 91 (100.0%) | 0 (0.0%) |
| Total (Category) | 126 (100.0%) | 0 (0.0%) |
| Total (Overall) | 425 (48.8%) | 445 (51.1%) |
Production, Transportation and Moving Occupations
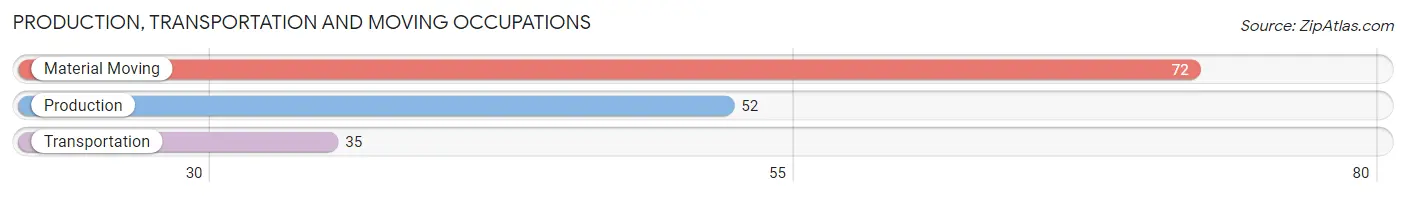
The most common Production, Transportation and Moving occupations in Lynnwood Pricedale are Material Moving (72 | 8.3%), Production (52 | 6.0%), and Transportation (35 | 4.0%).
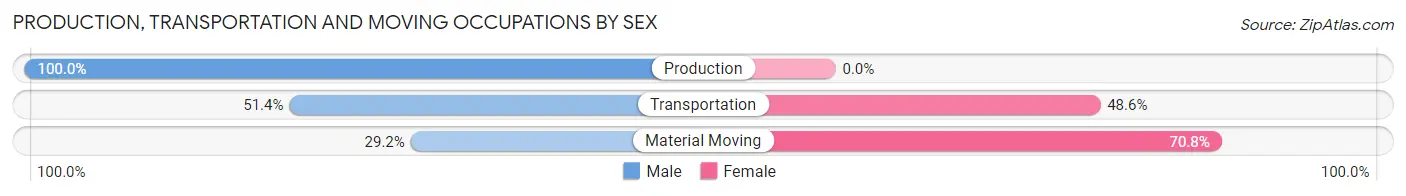
Production, Transportation and Moving Occupations by Sex
| Occupation | Male | Female |
| Production | 52 (100.0%) | 0 (0.0%) |
| Transportation | 18 (51.4%) | 17 (48.6%) |
| Material Moving | 21 (29.2%) | 51 (70.8%) |
| Total (Category) | 91 (57.2%) | 68 (42.8%) |
| Total (Overall) | 425 (48.8%) | 445 (51.1%) |
Employment Industries by Sex in Lynnwood Pricedale
Employment Industries in Lynnwood Pricedale
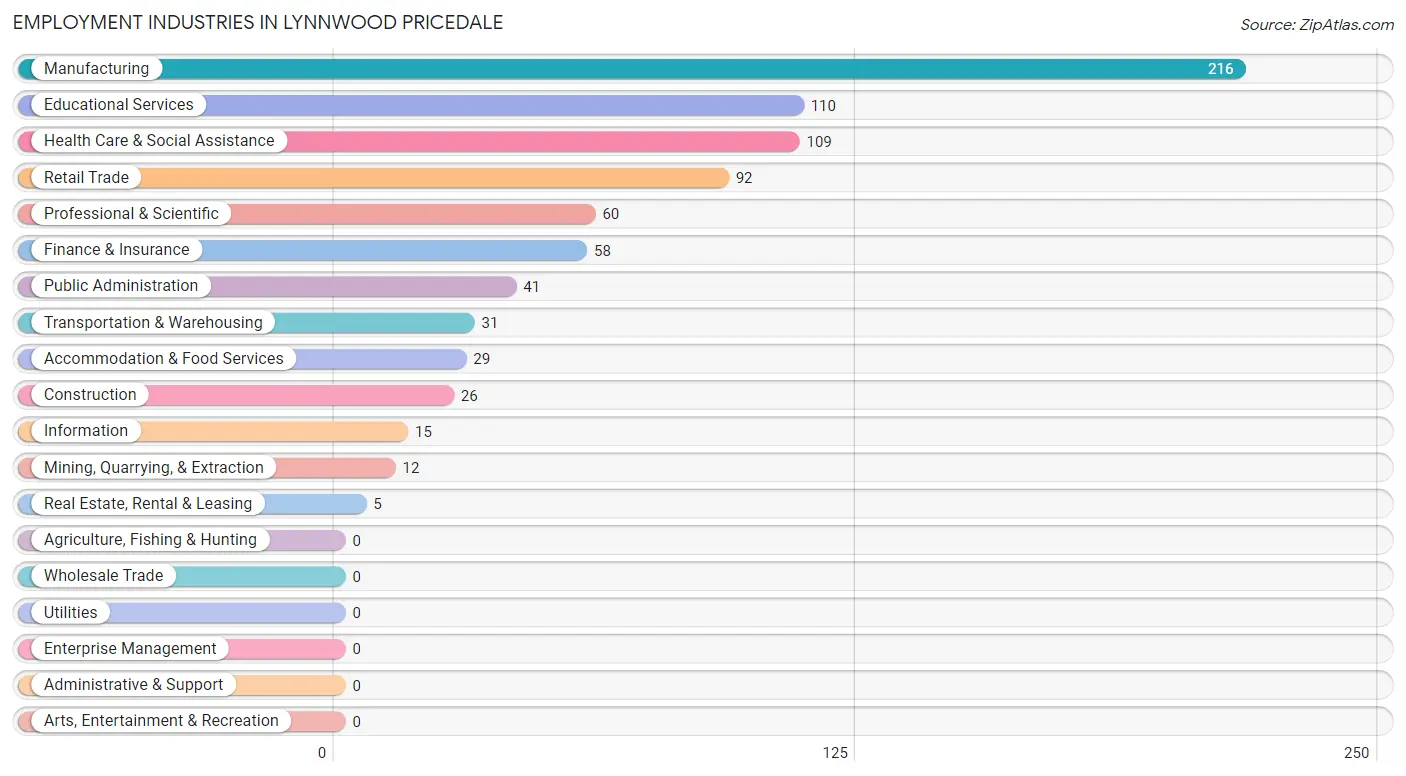
The major employment industries in Lynnwood Pricedale include Manufacturing (216 | 24.8%), Educational Services (110 | 12.6%), Health Care & Social Assistance (109 | 12.5%), Retail Trade (92 | 10.6%), and Professional & Scientific (60 | 6.9%).
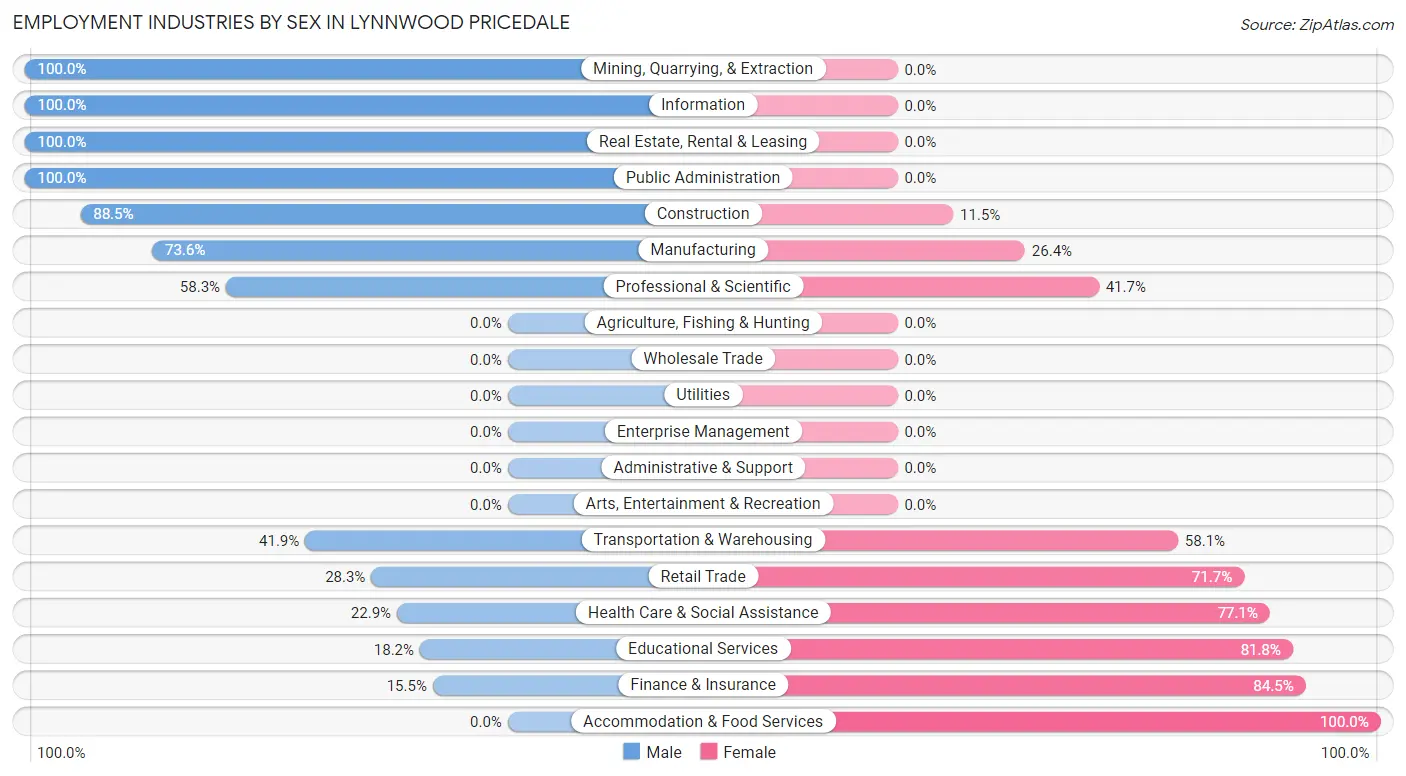
Employment Industries by Sex in Lynnwood Pricedale
The Lynnwood Pricedale industries that see more men than women are Mining, Quarrying, & Extraction (100.0%), Information (100.0%), and Real Estate, Rental & Leasing (100.0%), whereas the industries that tend to have a higher number of women are Accommodation & Food Services (100.0%), Finance & Insurance (84.5%), and Educational Services (81.8%).
| Industry | Male | Female |
| Agriculture, Fishing & Hunting | 0 (0.0%) | 0 (0.0%) |
| Mining, Quarrying, & Extraction | 12 (100.0%) | 0 (0.0%) |
| Construction | 23 (88.5%) | 3 (11.5%) |
| Manufacturing | 159 (73.6%) | 57 (26.4%) |
| Wholesale Trade | 0 (0.0%) | 0 (0.0%) |
| Retail Trade | 26 (28.3%) | 66 (71.7%) |
| Transportation & Warehousing | 13 (41.9%) | 18 (58.1%) |
| Utilities | 0 (0.0%) | 0 (0.0%) |
| Information | 15 (100.0%) | 0 (0.0%) |
| Finance & Insurance | 9 (15.5%) | 49 (84.5%) |
| Real Estate, Rental & Leasing | 5 (100.0%) | 0 (0.0%) |
| Professional & Scientific | 35 (58.3%) | 25 (41.7%) |
| Enterprise Management | 0 (0.0%) | 0 (0.0%) |
| Administrative & Support | 0 (0.0%) | 0 (0.0%) |
| Educational Services | 20 (18.2%) | 90 (81.8%) |
| Health Care & Social Assistance | 25 (22.9%) | 84 (77.1%) |
| Arts, Entertainment & Recreation | 0 (0.0%) | 0 (0.0%) |
| Accommodation & Food Services | 0 (0.0%) | 29 (100.0%) |
| Public Administration | 41 (100.0%) | 0 (0.0%) |
| Total | 425 (48.8%) | 445 (51.1%) |
Education in Lynnwood Pricedale
School Enrollment in Lynnwood Pricedale
The most common levels of schooling among the 213 students in Lynnwood Pricedale are middle school (78 | 36.6%), elementary school (65 | 30.5%), and college / undergraduate (23 | 10.8%).
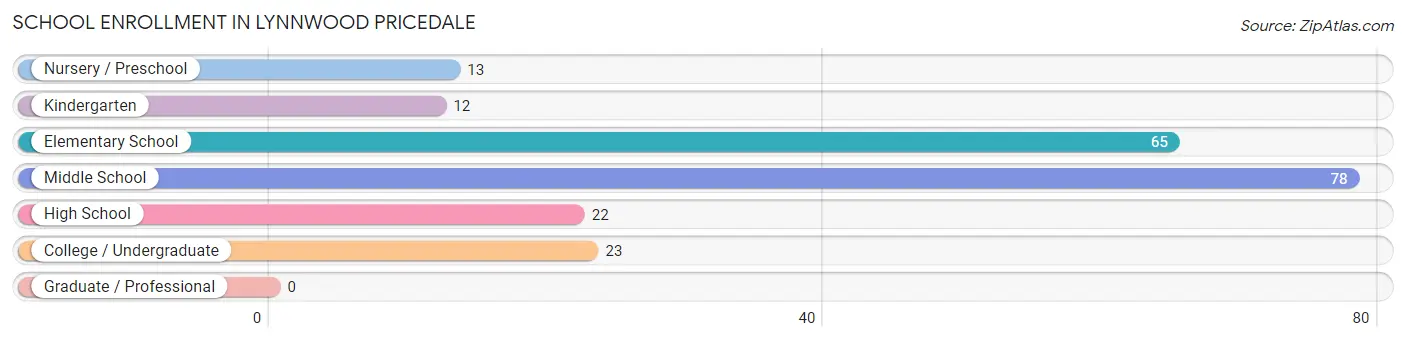
| School Level | # Students | % Students |
| Nursery / Preschool | 13 | 6.1% |
| Kindergarten | 12 | 5.6% |
| Elementary School | 65 | 30.5% |
| Middle School | 78 | 36.6% |
| High School | 22 | 10.3% |
| College / Undergraduate | 23 | 10.8% |
| Graduate / Professional | 0 | 0.0% |
| Total | 213 | 100.0% |
School Enrollment by Age by Funding Source in Lynnwood Pricedale
Out of a total of 213 students who are enrolled in schools in Lynnwood Pricedale, 47 (22.1%) attend a private institution, while the remaining 166 (77.9%) are enrolled in public schools. The age group of 20 to 24 year olds has the highest likelihood of being enrolled in private schools, with 23 (100.0% in the age bracket) enrolled. Conversely, the age group of 3 to 4 year olds has the lowest likelihood of being enrolled in a private school, with 13 (100.0% in the age bracket) attending a public institution.
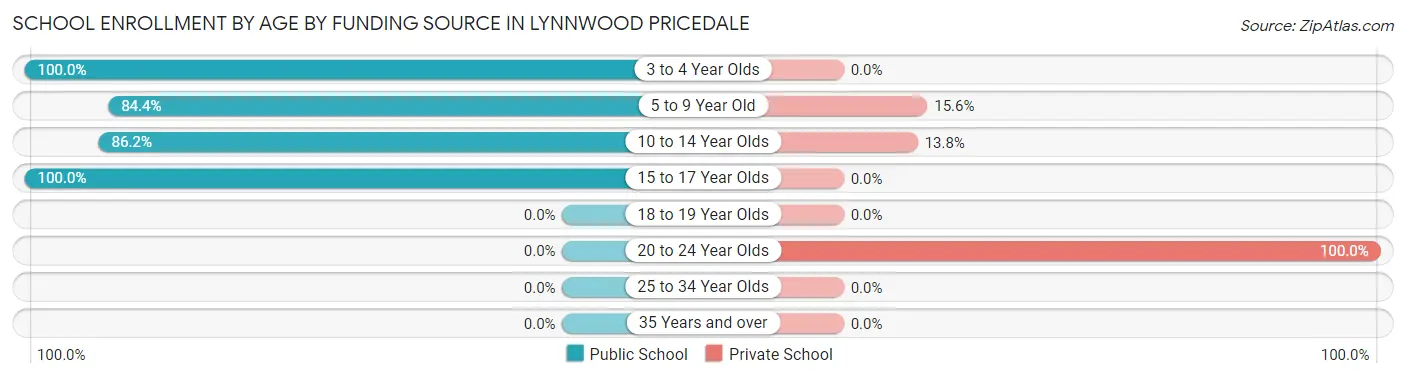
| Age Bracket | Public School | Private School |
| 3 to 4 Year Olds | 13 (100.0%) | 0 (0.0%) |
| 5 to 9 Year Old | 65 (84.4%) | 12 (15.6%) |
| 10 to 14 Year Olds | 75 (86.2%) | 12 (13.8%) |
| 15 to 17 Year Olds | 13 (100.0%) | 0 (0.0%) |
| 18 to 19 Year Olds | 0 (0.0%) | 0 (0.0%) |
| 20 to 24 Year Olds | 0 (0.0%) | 23 (100.0%) |
| 25 to 34 Year Olds | 0 (0.0%) | 0 (0.0%) |
| 35 Years and over | 0 (0.0%) | 0 (0.0%) |
| Total | 166 (77.9%) | 47 (22.1%) |
Educational Attainment by Field of Study in Lynnwood Pricedale
Science & technology (95 | 24.0%), arts & humanities (74 | 18.7%), liberal arts & history (48 | 12.1%), education (43 | 10.9%), and computers & mathematics (25 | 6.3%) are the most common fields of study among 396 individuals in Lynnwood Pricedale who have obtained a bachelor's degree or higher.
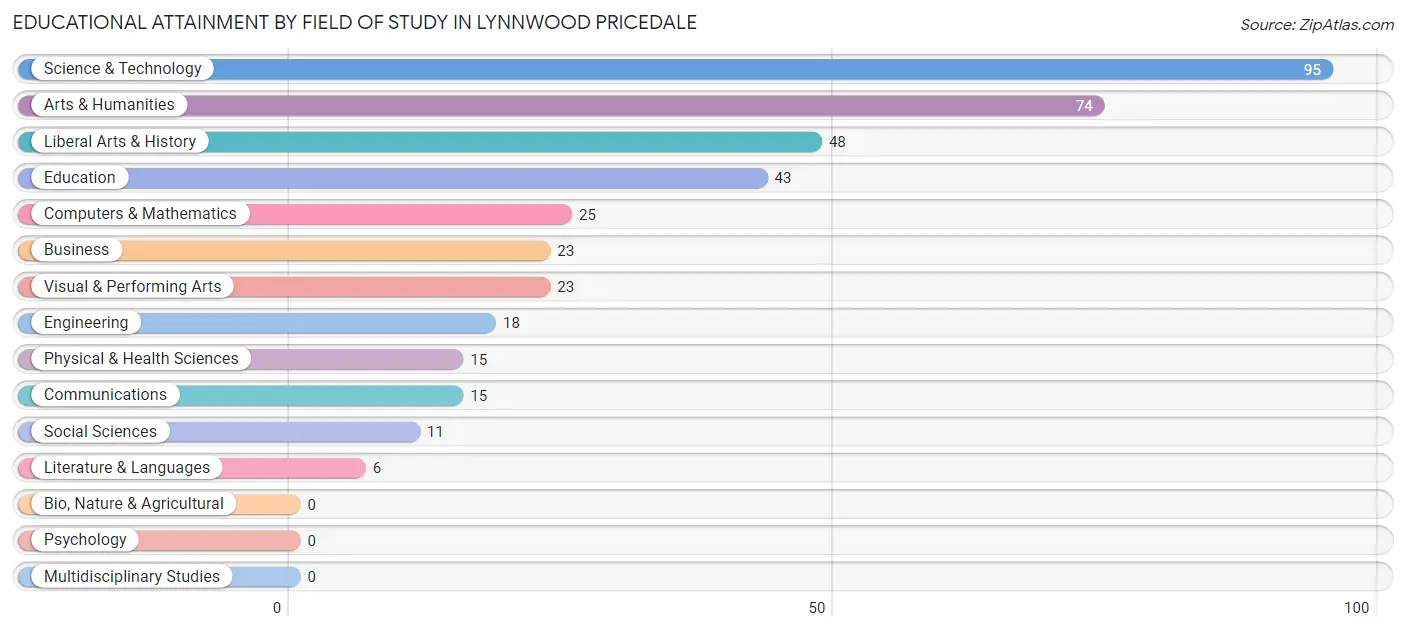
| Field of Study | # Graduates | % Graduates |
| Computers & Mathematics | 25 | 6.3% |
| Bio, Nature & Agricultural | 0 | 0.0% |
| Physical & Health Sciences | 15 | 3.8% |
| Psychology | 0 | 0.0% |
| Social Sciences | 11 | 2.8% |
| Engineering | 18 | 4.5% |
| Multidisciplinary Studies | 0 | 0.0% |
| Science & Technology | 95 | 24.0% |
| Business | 23 | 5.8% |
| Education | 43 | 10.9% |
| Literature & Languages | 6 | 1.5% |
| Liberal Arts & History | 48 | 12.1% |
| Visual & Performing Arts | 23 | 5.8% |
| Communications | 15 | 3.8% |
| Arts & Humanities | 74 | 18.7% |
| Total | 396 | 100.0% |
Transportation & Commute in Lynnwood Pricedale
Vehicle Availability by Sex in Lynnwood Pricedale
The most prevalent vehicle ownership categories in Lynnwood Pricedale are males with 2 vehicles (191, accounting for 45.4%) and females with 2 vehicles (259, making up 43.4%).
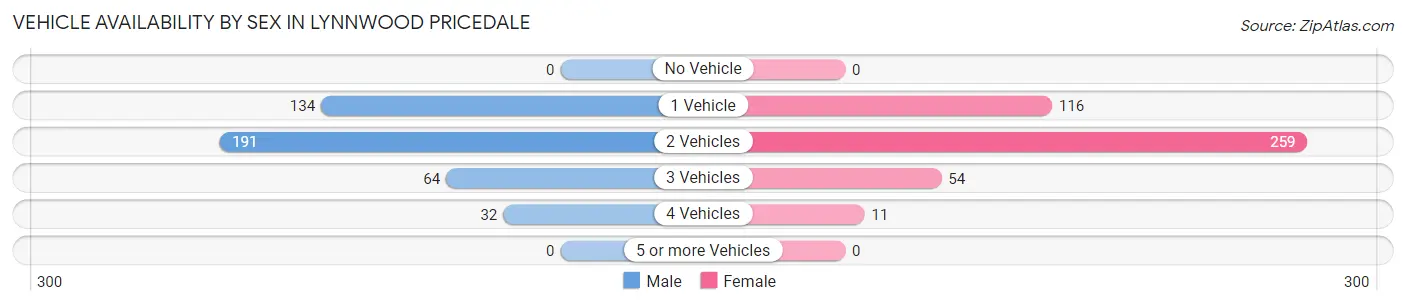
| Vehicles Available | Male | Female |
| No Vehicle | 0 (0.0%) | 0 (0.0%) |
| 1 Vehicle | 134 (31.8%) | 116 (26.4%) |
| 2 Vehicles | 191 (45.4%) | 259 (58.9%) |
| 3 Vehicles | 64 (15.2%) | 54 (12.3%) |
| 4 Vehicles | 32 (7.6%) | 11 (2.5%) |
| 5 or more Vehicles | 0 (0.0%) | 0 (0.0%) |
| Total | 421 (100.0%) | 440 (100.0%) |
Commute Time in Lynnwood Pricedale
The most frequently occuring commute durations in Lynnwood Pricedale are 10 to 14 minutes (154 commuters, 20.0%), 25 to 29 minutes (123 commuters, 16.0%), and 60 to 89 minutes (109 commuters, 14.2%).
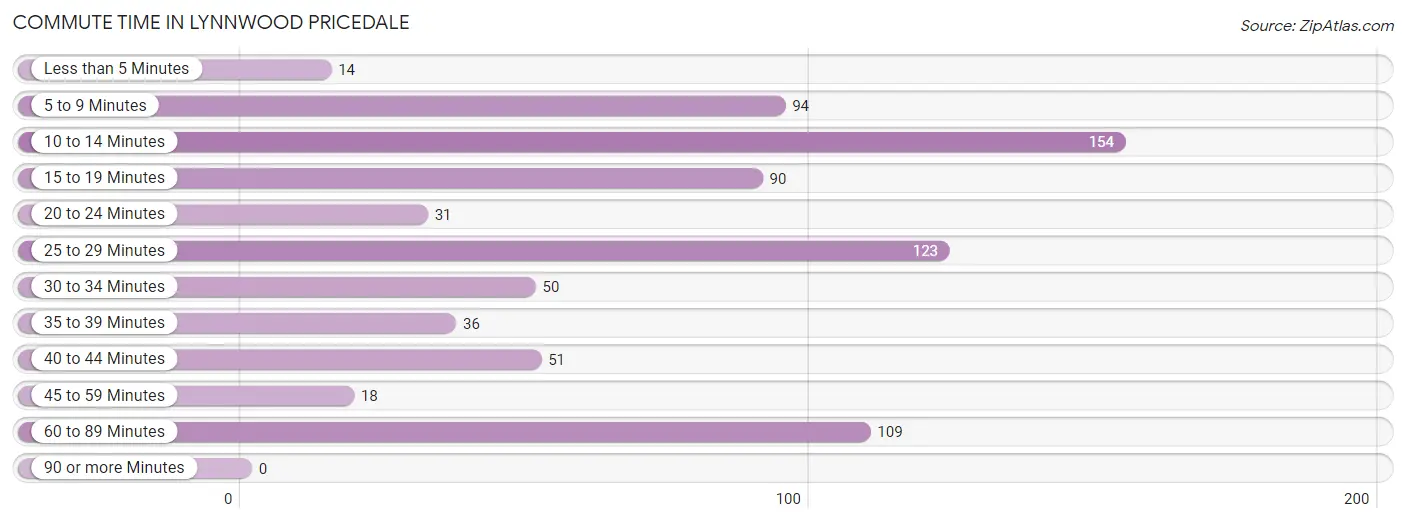
| Commute Time | # Commuters | % Commuters |
| Less than 5 Minutes | 14 | 1.8% |
| 5 to 9 Minutes | 94 | 12.2% |
| 10 to 14 Minutes | 154 | 20.0% |
| 15 to 19 Minutes | 90 | 11.7% |
| 20 to 24 Minutes | 31 | 4.0% |
| 25 to 29 Minutes | 123 | 16.0% |
| 30 to 34 Minutes | 50 | 6.5% |
| 35 to 39 Minutes | 36 | 4.7% |
| 40 to 44 Minutes | 51 | 6.6% |
| 45 to 59 Minutes | 18 | 2.3% |
| 60 to 89 Minutes | 109 | 14.2% |
| 90 or more Minutes | 0 | 0.0% |
Commute Time by Sex in Lynnwood Pricedale
The most common commute times in Lynnwood Pricedale are 25 to 29 minutes (110 commuters, 30.0%) for males and 5 to 9 minutes (76 commuters, 18.8%) for females.
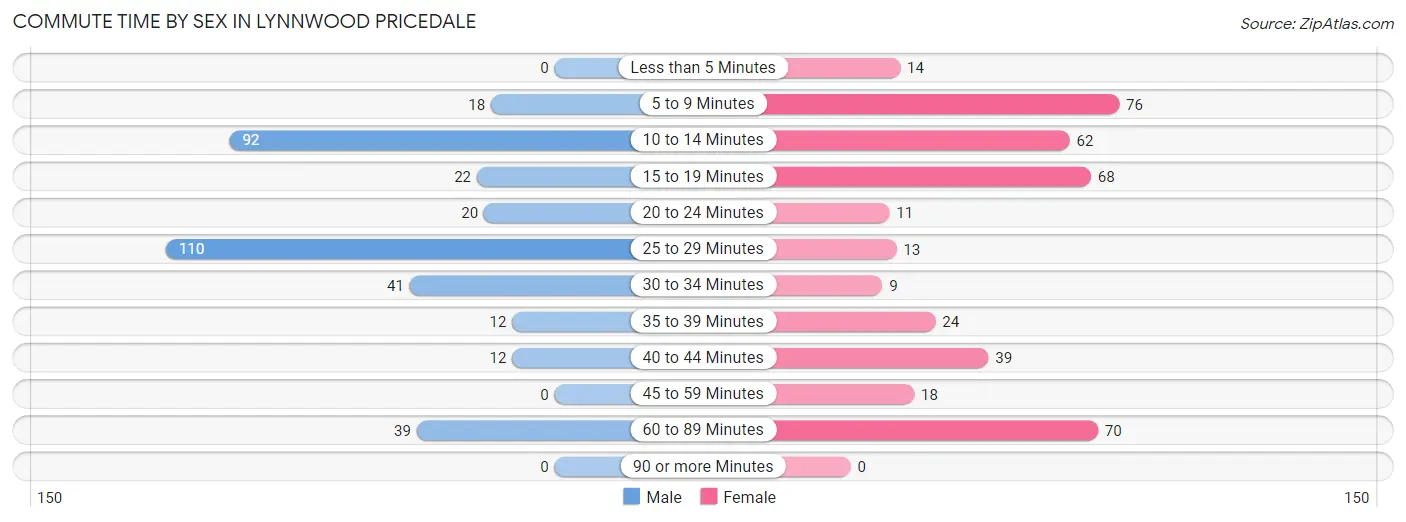
| Commute Time | Male | Female |
| Less than 5 Minutes | 0 (0.0%) | 14 (3.5%) |
| 5 to 9 Minutes | 18 (4.9%) | 76 (18.8%) |
| 10 to 14 Minutes | 92 (25.1%) | 62 (15.3%) |
| 15 to 19 Minutes | 22 (6.0%) | 68 (16.8%) |
| 20 to 24 Minutes | 20 (5.5%) | 11 (2.7%) |
| 25 to 29 Minutes | 110 (30.0%) | 13 (3.2%) |
| 30 to 34 Minutes | 41 (11.2%) | 9 (2.2%) |
| 35 to 39 Minutes | 12 (3.3%) | 24 (5.9%) |
| 40 to 44 Minutes | 12 (3.3%) | 39 (9.7%) |
| 45 to 59 Minutes | 0 (0.0%) | 18 (4.5%) |
| 60 to 89 Minutes | 39 (10.7%) | 70 (17.3%) |
| 90 or more Minutes | 0 (0.0%) | 0 (0.0%) |
Time of Departure to Work by Sex in Lynnwood Pricedale
The most frequent times of departure to work in Lynnwood Pricedale are 5:30 AM to 5:59 AM (75, 20.5%) for males and 6:30 AM to 6:59 AM (90, 22.3%) for females.
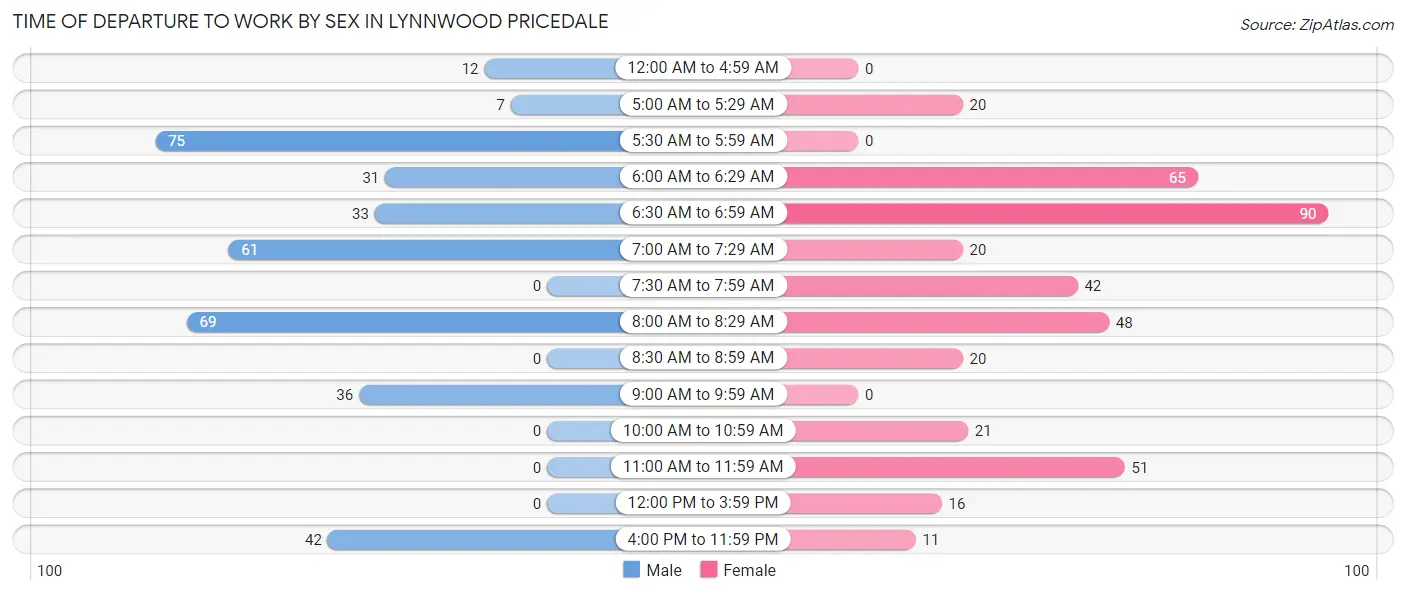
| Time of Departure | Male | Female |
| 12:00 AM to 4:59 AM | 12 (3.3%) | 0 (0.0%) |
| 5:00 AM to 5:29 AM | 7 (1.9%) | 20 (5.0%) |
| 5:30 AM to 5:59 AM | 75 (20.5%) | 0 (0.0%) |
| 6:00 AM to 6:29 AM | 31 (8.5%) | 65 (16.1%) |
| 6:30 AM to 6:59 AM | 33 (9.0%) | 90 (22.3%) |
| 7:00 AM to 7:29 AM | 61 (16.7%) | 20 (5.0%) |
| 7:30 AM to 7:59 AM | 0 (0.0%) | 42 (10.4%) |
| 8:00 AM to 8:29 AM | 69 (18.9%) | 48 (11.9%) |
| 8:30 AM to 8:59 AM | 0 (0.0%) | 20 (5.0%) |
| 9:00 AM to 9:59 AM | 36 (9.8%) | 0 (0.0%) |
| 10:00 AM to 10:59 AM | 0 (0.0%) | 21 (5.2%) |
| 11:00 AM to 11:59 AM | 0 (0.0%) | 51 (12.6%) |
| 12:00 PM to 3:59 PM | 0 (0.0%) | 16 (4.0%) |
| 4:00 PM to 11:59 PM | 42 (11.5%) | 11 (2.7%) |
| Total | 366 (100.0%) | 404 (100.0%) |
Housing Occupancy in Lynnwood Pricedale
Occupancy by Ownership in Lynnwood Pricedale
Of the total 1,044 dwellings in Lynnwood Pricedale, owner-occupied units account for 761 (72.9%), while renter-occupied units make up 283 (27.1%).
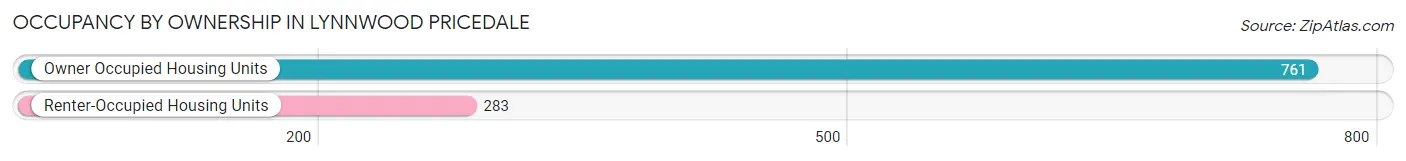
| Occupancy | # Housing Units | % Housing Units |
| Owner Occupied Housing Units | 761 | 72.9% |
| Renter-Occupied Housing Units | 283 | 27.1% |
| Total Occupied Housing Units | 1,044 | 100.0% |
Occupancy by Household Size in Lynnwood Pricedale
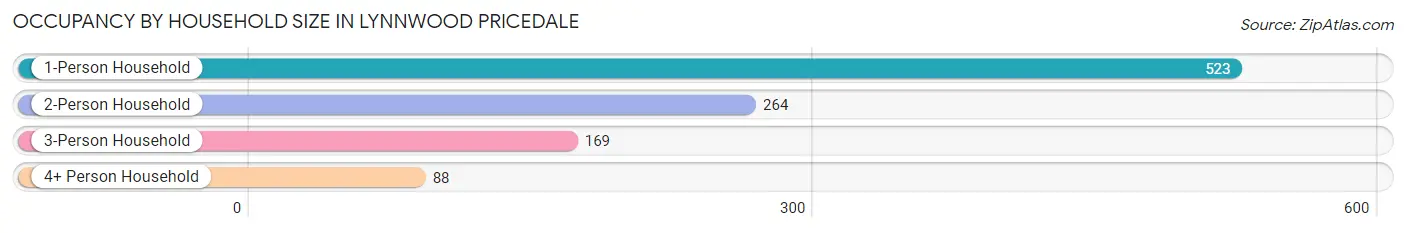
| Household Size | # Housing Units | % Housing Units |
| 1-Person Household | 523 | 50.1% |
| 2-Person Household | 264 | 25.3% |
| 3-Person Household | 169 | 16.2% |
| 4+ Person Household | 88 | 8.4% |
| Total Housing Units | 1,044 | 100.0% |
Occupancy by Ownership by Household Size in Lynnwood Pricedale
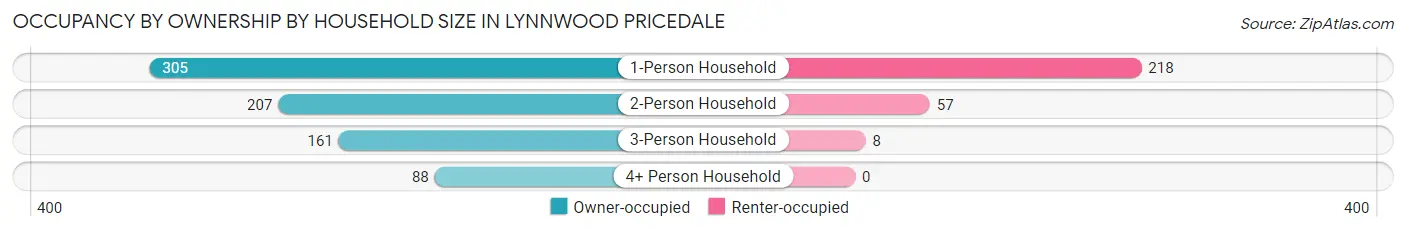
| Household Size | Owner-occupied | Renter-occupied |
| 1-Person Household | 305 (58.3%) | 218 (41.7%) |
| 2-Person Household | 207 (78.4%) | 57 (21.6%) |
| 3-Person Household | 161 (95.3%) | 8 (4.7%) |
| 4+ Person Household | 88 (100.0%) | 0 (0.0%) |
| Total Housing Units | 761 (72.9%) | 283 (27.1%) |
Occupancy by Educational Attainment in Lynnwood Pricedale
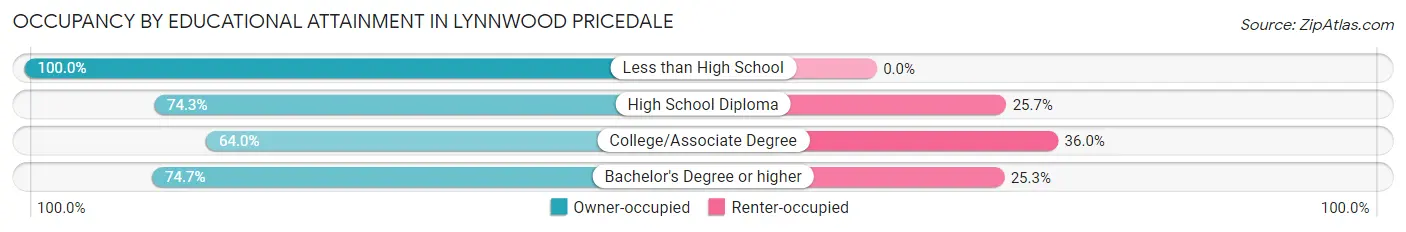
| Household Size | Owner-occupied | Renter-occupied |
| Less than High School | 44 (100.0%) | 0 (0.0%) |
| High School Diploma | 353 (74.3%) | 122 (25.7%) |
| College/Associate Degree | 169 (64.0%) | 95 (36.0%) |
| Bachelor's Degree or higher | 195 (74.7%) | 66 (25.3%) |
Occupancy by Age of Householder in Lynnwood Pricedale
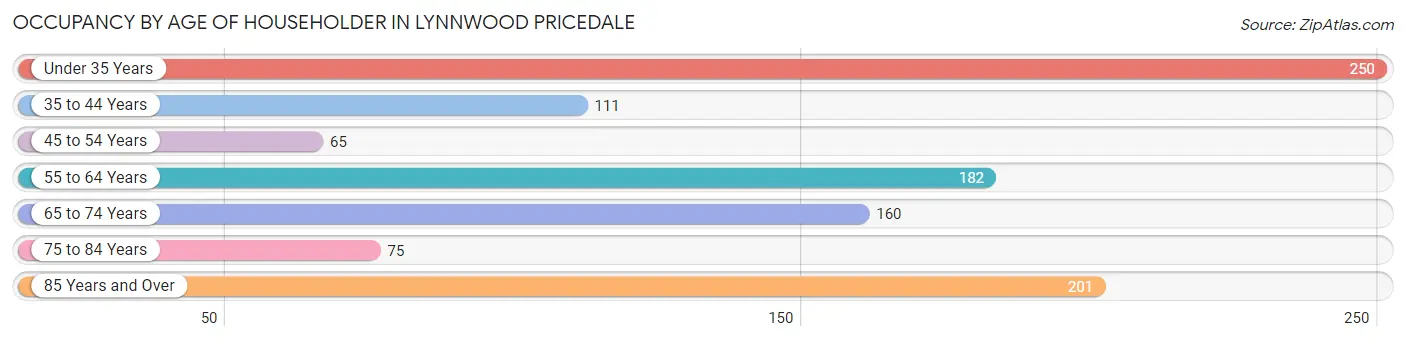
| Age Bracket | # Households | % Households |
| Under 35 Years | 250 | 23.9% |
| 35 to 44 Years | 111 | 10.6% |
| 45 to 54 Years | 65 | 6.2% |
| 55 to 64 Years | 182 | 17.4% |
| 65 to 74 Years | 160 | 15.3% |
| 75 to 84 Years | 75 | 7.2% |
| 85 Years and Over | 201 | 19.3% |
| Total | 1,044 | 100.0% |
Housing Finances in Lynnwood Pricedale
Median Income by Occupancy in Lynnwood Pricedale
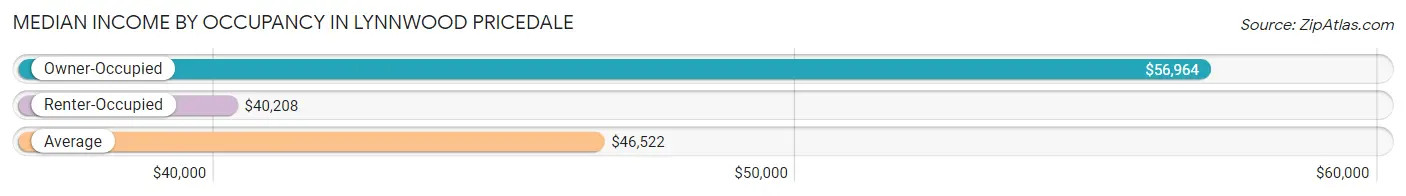
| Occupancy Type | # Households | Median Income |
| Owner-Occupied | 761 (72.9%) | $56,964 |
| Renter-Occupied | 283 (27.1%) | $40,208 |
| Average | 1,044 (100.0%) | $46,522 |
Occupancy by Householder Income Bracket in Lynnwood Pricedale
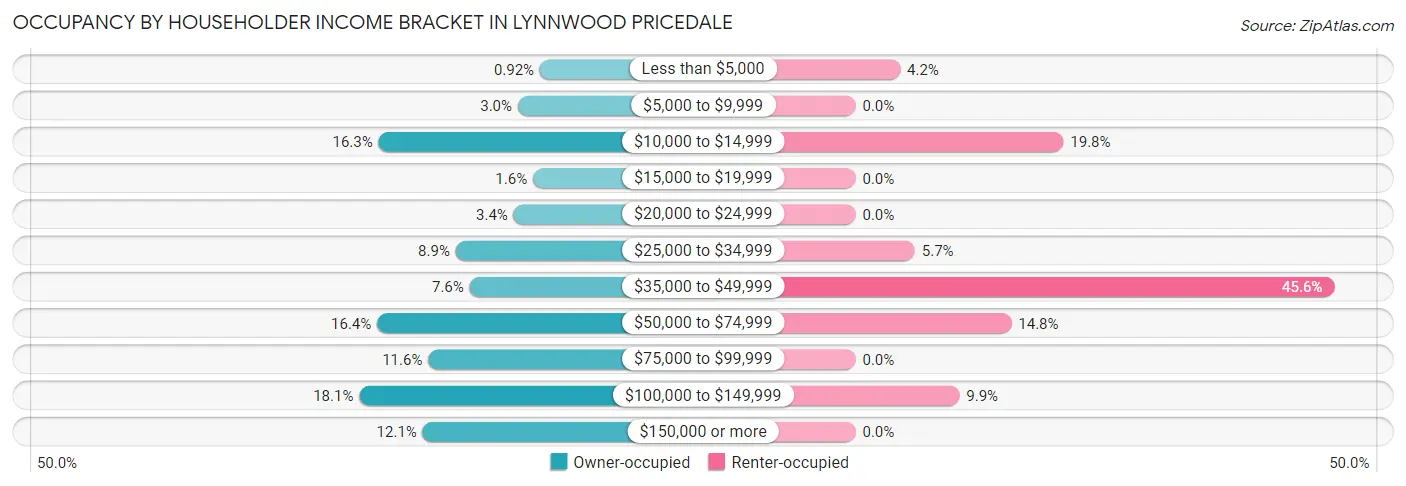
| Income Bracket | Owner-occupied | Renter-occupied |
| Less than $5,000 | 7 (0.9%) | 12 (4.2%) |
| $5,000 to $9,999 | 23 (3.0%) | 0 (0.0%) |
| $10,000 to $14,999 | 124 (16.3%) | 56 (19.8%) |
| $15,000 to $19,999 | 12 (1.6%) | 0 (0.0%) |
| $20,000 to $24,999 | 26 (3.4%) | 0 (0.0%) |
| $25,000 to $34,999 | 68 (8.9%) | 16 (5.7%) |
| $35,000 to $49,999 | 58 (7.6%) | 129 (45.6%) |
| $50,000 to $74,999 | 125 (16.4%) | 42 (14.8%) |
| $75,000 to $99,999 | 88 (11.6%) | 0 (0.0%) |
| $100,000 to $149,999 | 138 (18.1%) | 28 (9.9%) |
| $150,000 or more | 92 (12.1%) | 0 (0.0%) |
| Total | 761 (100.0%) | 283 (100.0%) |
Monthly Housing Cost Tiers in Lynnwood Pricedale
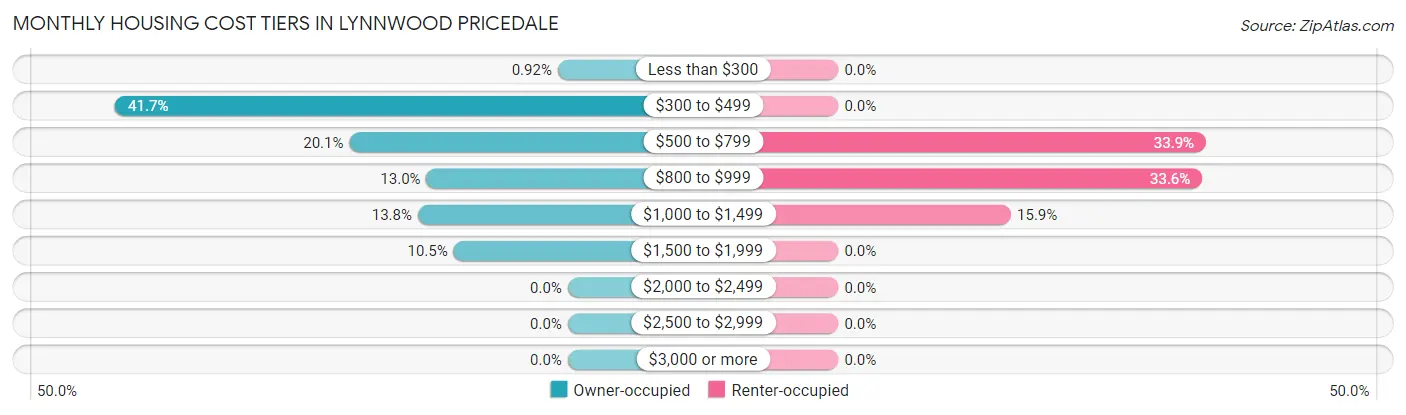
| Monthly Cost | Owner-occupied | Renter-occupied |
| Less than $300 | 7 (0.9%) | 0 (0.0%) |
| $300 to $499 | 317 (41.7%) | 0 (0.0%) |
| $500 to $799 | 153 (20.1%) | 96 (33.9%) |
| $800 to $999 | 99 (13.0%) | 95 (33.6%) |
| $1,000 to $1,499 | 105 (13.8%) | 45 (15.9%) |
| $1,500 to $1,999 | 80 (10.5%) | 0 (0.0%) |
| $2,000 to $2,499 | 0 (0.0%) | 0 (0.0%) |
| $2,500 to $2,999 | 0 (0.0%) | 0 (0.0%) |
| $3,000 or more | 0 (0.0%) | 0 (0.0%) |
| Total | 761 (100.0%) | 283 (100.0%) |
Physical Housing Characteristics in Lynnwood Pricedale
Housing Structures in Lynnwood Pricedale
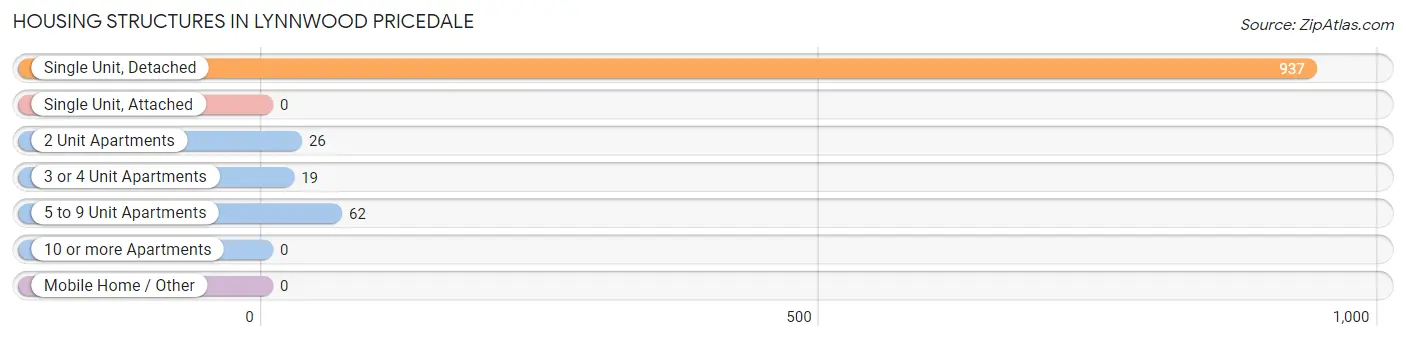
| Structure Type | # Housing Units | % Housing Units |
| Single Unit, Detached | 937 | 89.7% |
| Single Unit, Attached | 0 | 0.0% |
| 2 Unit Apartments | 26 | 2.5% |
| 3 or 4 Unit Apartments | 19 | 1.8% |
| 5 to 9 Unit Apartments | 62 | 5.9% |
| 10 or more Apartments | 0 | 0.0% |
| Mobile Home / Other | 0 | 0.0% |
| Total | 1,044 | 100.0% |
Housing Structures by Occupancy in Lynnwood Pricedale
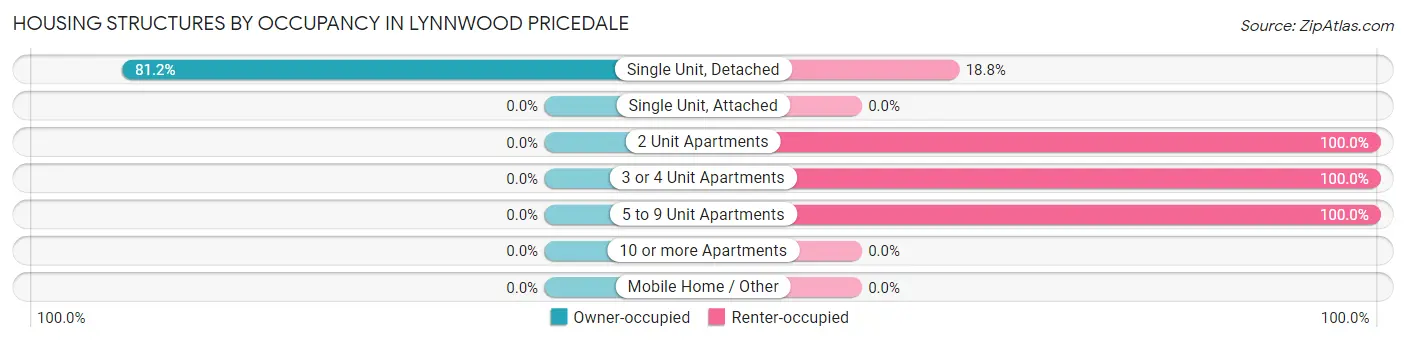
| Structure Type | Owner-occupied | Renter-occupied |
| Single Unit, Detached | 761 (81.2%) | 176 (18.8%) |
| Single Unit, Attached | 0 (0.0%) | 0 (0.0%) |
| 2 Unit Apartments | 0 (0.0%) | 26 (100.0%) |
| 3 or 4 Unit Apartments | 0 (0.0%) | 19 (100.0%) |
| 5 to 9 Unit Apartments | 0 (0.0%) | 62 (100.0%) |
| 10 or more Apartments | 0 (0.0%) | 0 (0.0%) |
| Mobile Home / Other | 0 (0.0%) | 0 (0.0%) |
| Total | 761 (72.9%) | 283 (27.1%) |
Housing Structures by Number of Rooms in Lynnwood Pricedale
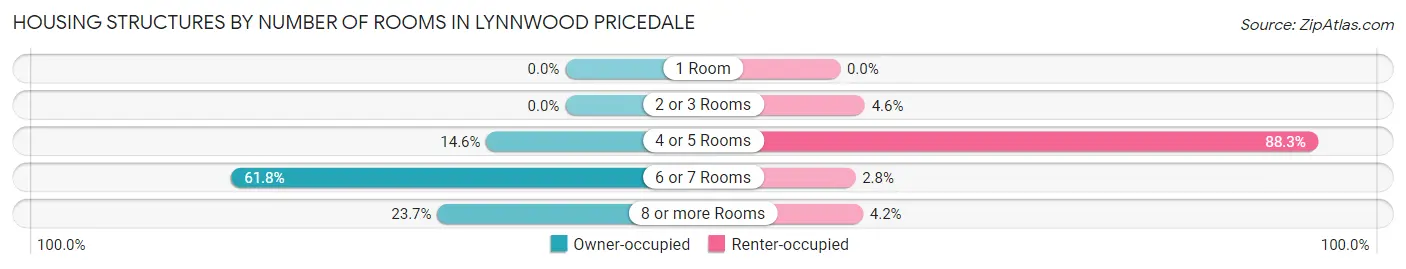
| Number of Rooms | Owner-occupied | Renter-occupied |
| 1 Room | 0 (0.0%) | 0 (0.0%) |
| 2 or 3 Rooms | 0 (0.0%) | 13 (4.6%) |
| 4 or 5 Rooms | 111 (14.6%) | 250 (88.3%) |
| 6 or 7 Rooms | 470 (61.8%) | 8 (2.8%) |
| 8 or more Rooms | 180 (23.6%) | 12 (4.2%) |
| Total | 761 (100.0%) | 283 (100.0%) |
Housing Structure by Heating Type in Lynnwood Pricedale
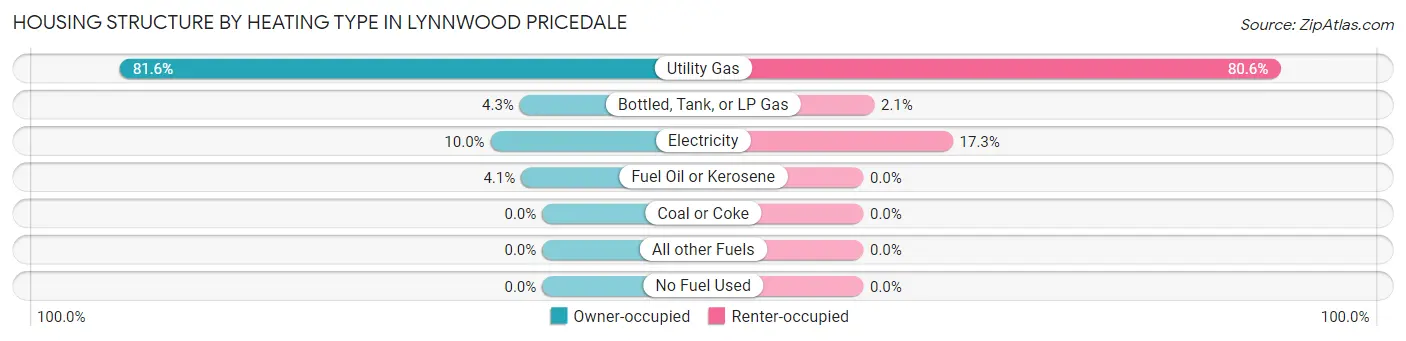
| Heating Type | Owner-occupied | Renter-occupied |
| Utility Gas | 621 (81.6%) | 228 (80.6%) |
| Bottled, Tank, or LP Gas | 33 (4.3%) | 6 (2.1%) |
| Electricity | 76 (10.0%) | 49 (17.3%) |
| Fuel Oil or Kerosene | 31 (4.1%) | 0 (0.0%) |
| Coal or Coke | 0 (0.0%) | 0 (0.0%) |
| All other Fuels | 0 (0.0%) | 0 (0.0%) |
| No Fuel Used | 0 (0.0%) | 0 (0.0%) |
| Total | 761 (100.0%) | 283 (100.0%) |
Household Vehicle Usage in Lynnwood Pricedale
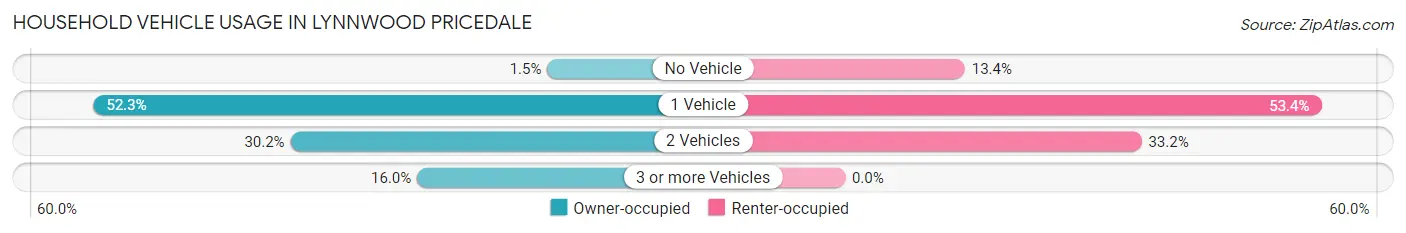
| Vehicles per Household | Owner-occupied | Renter-occupied |
| No Vehicle | 11 (1.5%) | 38 (13.4%) |
| 1 Vehicle | 398 (52.3%) | 151 (53.4%) |
| 2 Vehicles | 230 (30.2%) | 94 (33.2%) |
| 3 or more Vehicles | 122 (16.0%) | 0 (0.0%) |
| Total | 761 (100.0%) | 283 (100.0%) |
Real Estate & Mortgages in Lynnwood Pricedale
Real Estate and Mortgage Overview in Lynnwood Pricedale
| Characteristic | Without Mortgage | With Mortgage |
| Housing Units | 436 | 325 |
| Median Property Value | $189,000 | $141,500 |
| Median Household Income | $39,868 | $85 |
| Monthly Housing Costs | $397 | $0 |
| Real Estate Taxes | $1,816 | $0 |
Property Value by Mortgage Status in Lynnwood Pricedale
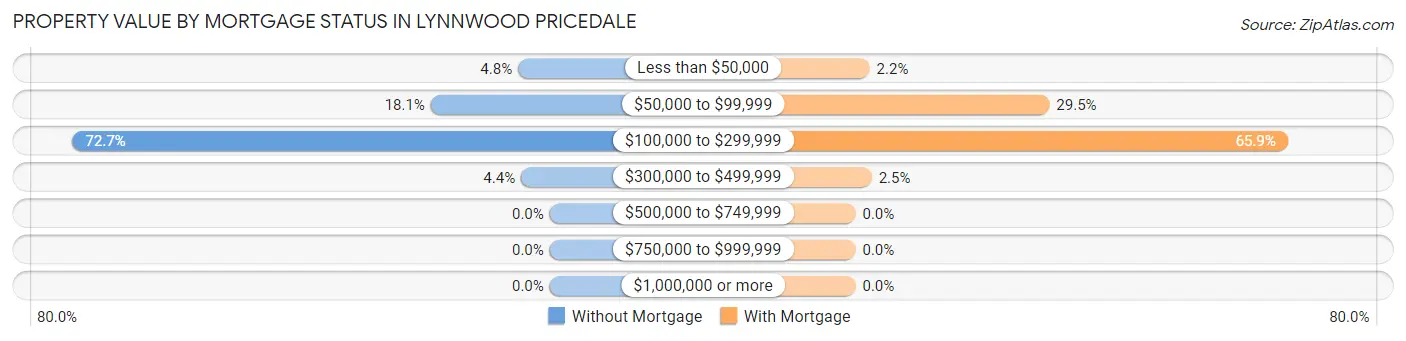
| Property Value | Without Mortgage | With Mortgage |
| Less than $50,000 | 21 (4.8%) | 7 (2.1%) |
| $50,000 to $99,999 | 79 (18.1%) | 96 (29.5%) |
| $100,000 to $299,999 | 317 (72.7%) | 214 (65.8%) |
| $300,000 to $499,999 | 19 (4.4%) | 8 (2.5%) |
| $500,000 to $749,999 | 0 (0.0%) | 0 (0.0%) |
| $750,000 to $999,999 | 0 (0.0%) | 0 (0.0%) |
| $1,000,000 or more | 0 (0.0%) | 0 (0.0%) |
| Total | 436 (100.0%) | 325 (100.0%) |
Household Income by Mortgage Status in Lynnwood Pricedale
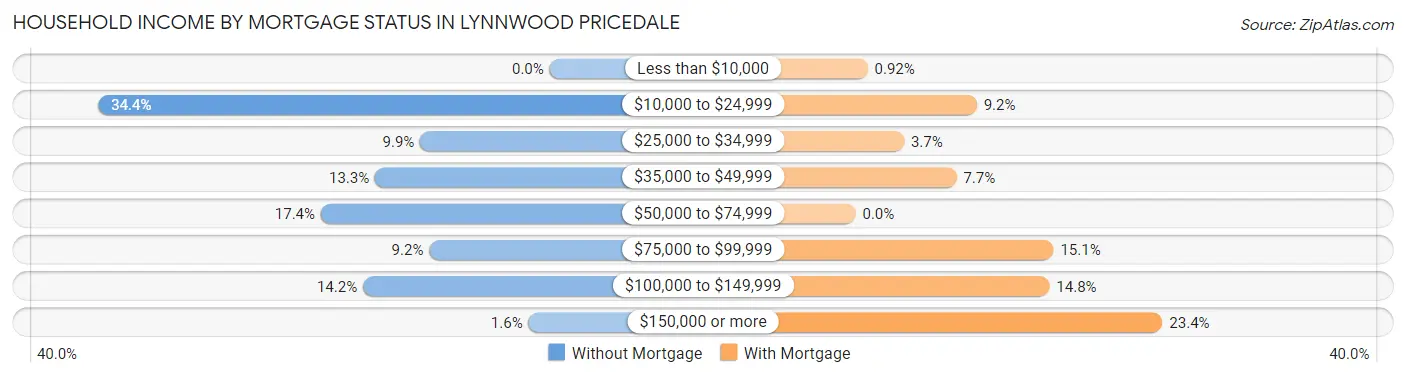
| Household Income | Without Mortgage | With Mortgage |
| Less than $10,000 | 0 (0.0%) | 3 (0.9%) |
| $10,000 to $24,999 | 150 (34.4%) | 30 (9.2%) |
| $25,000 to $34,999 | 43 (9.9%) | 12 (3.7%) |
| $35,000 to $49,999 | 58 (13.3%) | 25 (7.7%) |
| $50,000 to $74,999 | 76 (17.4%) | 0 (0.0%) |
| $75,000 to $99,999 | 40 (9.2%) | 49 (15.1%) |
| $100,000 to $149,999 | 62 (14.2%) | 48 (14.8%) |
| $150,000 or more | 7 (1.6%) | 76 (23.4%) |
| Total | 436 (100.0%) | 325 (100.0%) |
Property Value to Household Income Ratio in Lynnwood Pricedale
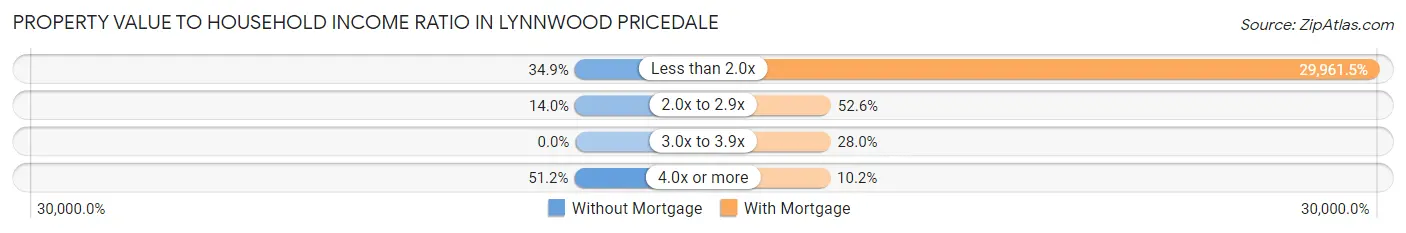
| Value-to-Income Ratio | Without Mortgage | With Mortgage |
| Less than 2.0x | 152 (34.9%) | 97,375 (29,961.5%) |
| 2.0x to 2.9x | 61 (14.0%) | 171 (52.6%) |
| 3.0x to 3.9x | 0 (0.0%) | 91 (28.0%) |
| 4.0x or more | 223 (51.1%) | 33 (10.2%) |
| Total | 436 (100.0%) | 325 (100.0%) |
Real Estate Taxes by Mortgage Status in Lynnwood Pricedale
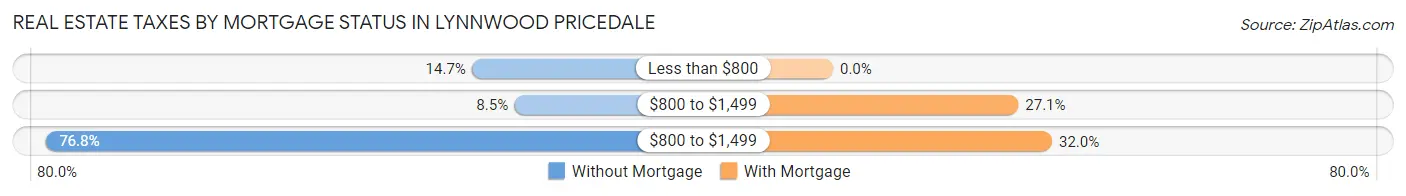
| Property Taxes | Without Mortgage | With Mortgage |
| Less than $800 | 64 (14.7%) | 0 (0.0%) |
| $800 to $1,499 | 37 (8.5%) | 88 (27.1%) |
| $800 to $1,499 | 335 (76.8%) | 104 (32.0%) |
| Total | 436 (100.0%) | 325 (100.0%) |
Health & Disability in Lynnwood Pricedale
Health Insurance Coverage by Age in Lynnwood Pricedale
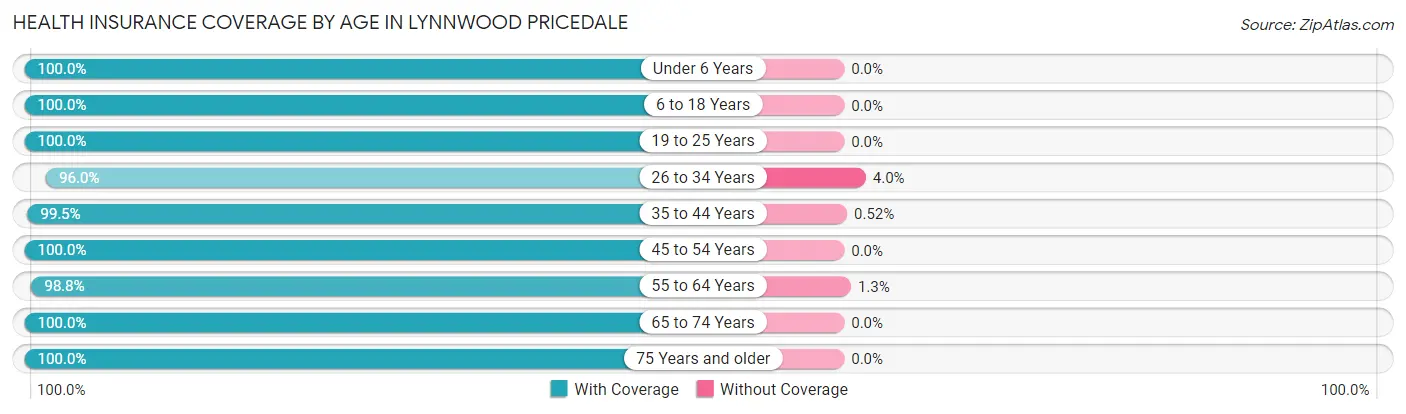
| Age Bracket | With Coverage | Without Coverage |
| Under 6 Years | 66 (100.0%) | 0 (0.0%) |
| 6 to 18 Years | 177 (100.0%) | 0 (0.0%) |
| 19 to 25 Years | 178 (100.0%) | 0 (0.0%) |
| 26 to 34 Years | 310 (96.0%) | 13 (4.0%) |
| 35 to 44 Years | 193 (99.5%) | 1 (0.5%) |
| 45 to 54 Years | 120 (100.0%) | 0 (0.0%) |
| 55 to 64 Years | 315 (98.8%) | 4 (1.3%) |
| 65 to 74 Years | 228 (100.0%) | 0 (0.0%) |
| 75 Years and older | 313 (100.0%) | 0 (0.0%) |
| Total | 1,900 (99.1%) | 18 (0.9%) |
Health Insurance Coverage by Citizenship Status in Lynnwood Pricedale
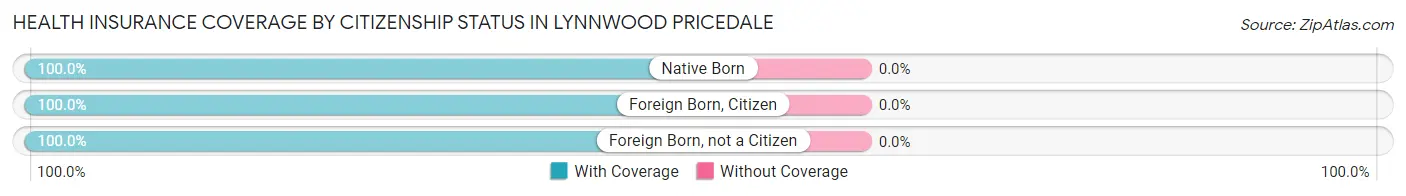
| Citizenship Status | With Coverage | Without Coverage |
| Native Born | 66 (100.0%) | 0 (0.0%) |
| Foreign Born, Citizen | 177 (100.0%) | 0 (0.0%) |
| Foreign Born, not a Citizen | 178 (100.0%) | 0 (0.0%) |
Health Insurance Coverage by Household Income in Lynnwood Pricedale
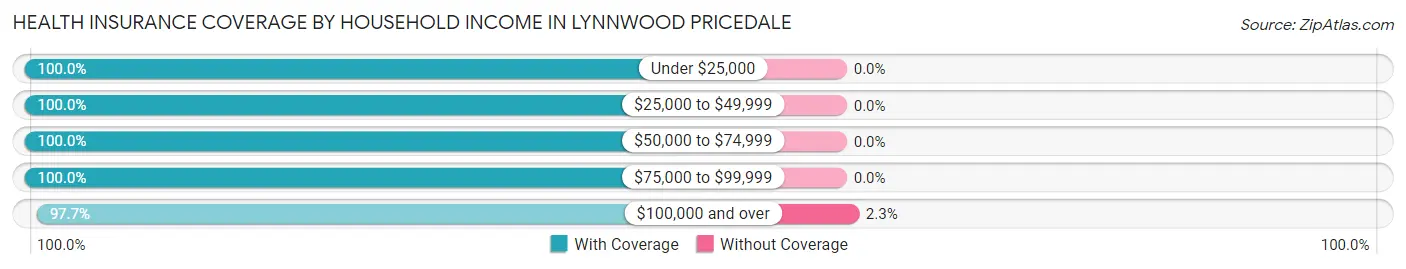
| Household Income | With Coverage | Without Coverage |
| Under $25,000 | 311 (100.0%) | 0 (0.0%) |
| $25,000 to $49,999 | 386 (100.0%) | 0 (0.0%) |
| $50,000 to $74,999 | 312 (100.0%) | 0 (0.0%) |
| $75,000 to $99,999 | 156 (100.0%) | 0 (0.0%) |
| $100,000 and over | 731 (97.7%) | 17 (2.3%) |
Public vs Private Health Insurance Coverage by Age in Lynnwood Pricedale
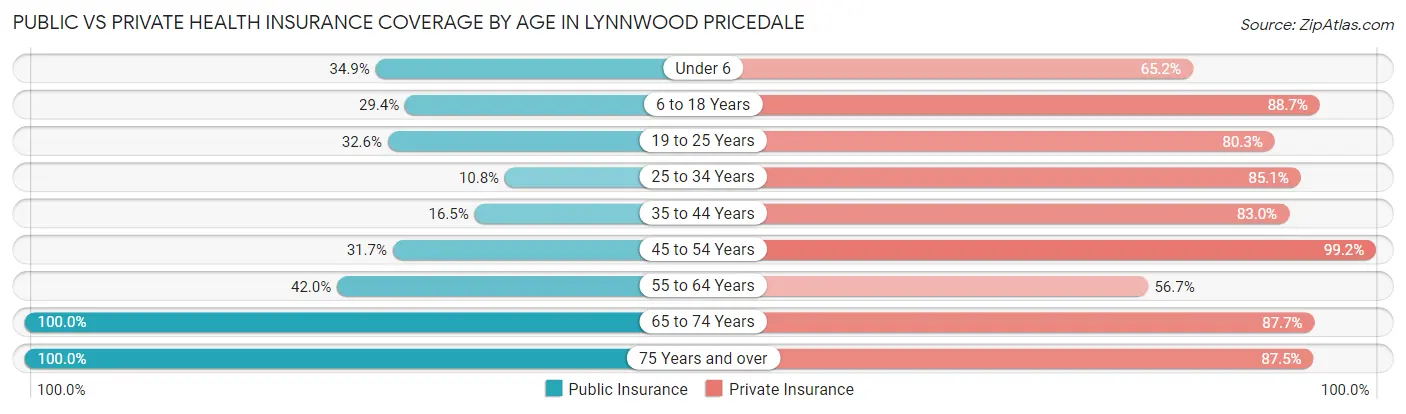
| Age Bracket | Public Insurance | Private Insurance |
| Under 6 | 23 (34.8%) | 43 (65.1%) |
| 6 to 18 Years | 52 (29.4%) | 157 (88.7%) |
| 19 to 25 Years | 58 (32.6%) | 143 (80.3%) |
| 25 to 34 Years | 35 (10.8%) | 275 (85.1%) |
| 35 to 44 Years | 32 (16.5%) | 161 (83.0%) |
| 45 to 54 Years | 38 (31.7%) | 119 (99.2%) |
| 55 to 64 Years | 134 (42.0%) | 181 (56.7%) |
| 65 to 74 Years | 228 (100.0%) | 200 (87.7%) |
| 75 Years and over | 313 (100.0%) | 274 (87.5%) |
| Total | 913 (47.6%) | 1,553 (81.0%) |
Disability Status by Sex by Age in Lynnwood Pricedale
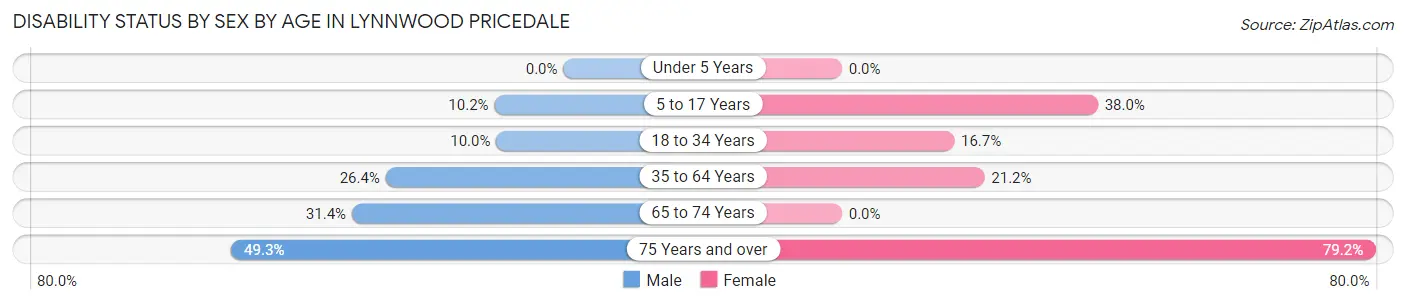
| Age Bracket | Male | Female |
| Under 5 Years | 0 (0.0%) | 0 (0.0%) |
| 5 to 17 Years | 13 (10.2%) | 19 (38.0%) |
| 18 to 34 Years | 23 (10.0%) | 45 (16.7%) |
| 35 to 64 Years | 81 (26.4%) | 69 (21.2%) |
| 65 to 74 Years | 27 (31.4%) | 0 (0.0%) |
| 75 Years and over | 36 (49.3%) | 190 (79.2%) |
Disability Class by Sex by Age in Lynnwood Pricedale
Disability Class: Hearing Difficulty
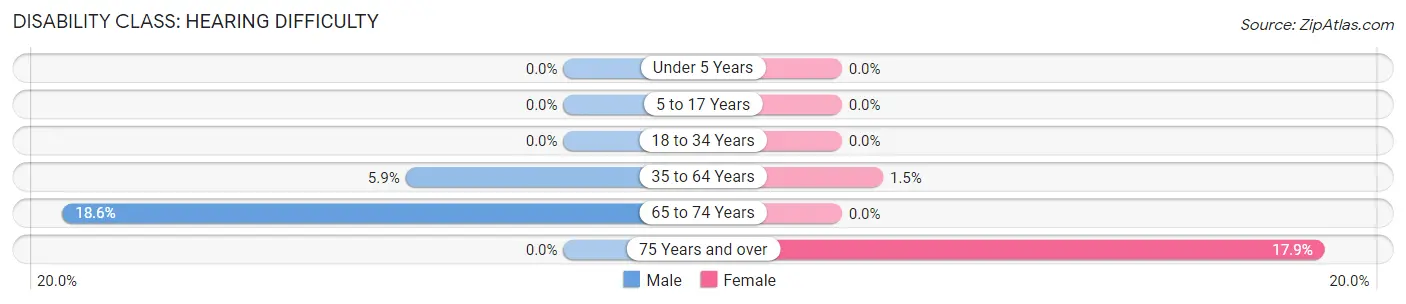
| Age Bracket | Male | Female |
| Under 5 Years | 0 (0.0%) | 0 (0.0%) |
| 5 to 17 Years | 0 (0.0%) | 0 (0.0%) |
| 18 to 34 Years | 0 (0.0%) | 0 (0.0%) |
| 35 to 64 Years | 18 (5.9%) | 5 (1.5%) |
| 65 to 74 Years | 16 (18.6%) | 0 (0.0%) |
| 75 Years and over | 0 (0.0%) | 43 (17.9%) |
Disability Class: Vision Difficulty
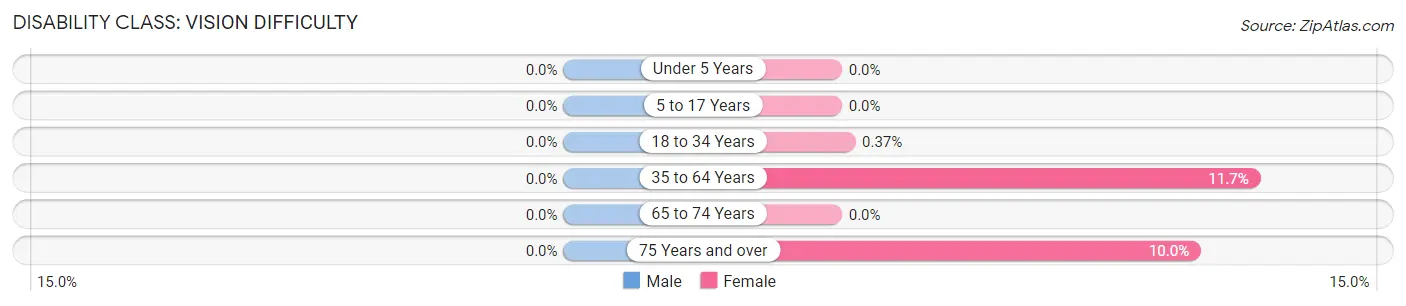
| Age Bracket | Male | Female |
| Under 5 Years | 0 (0.0%) | 0 (0.0%) |
| 5 to 17 Years | 0 (0.0%) | 0 (0.0%) |
| 18 to 34 Years | 0 (0.0%) | 1 (0.4%) |
| 35 to 64 Years | 0 (0.0%) | 38 (11.7%) |
| 65 to 74 Years | 0 (0.0%) | 0 (0.0%) |
| 75 Years and over | 0 (0.0%) | 24 (10.0%) |
Disability Class: Cognitive Difficulty
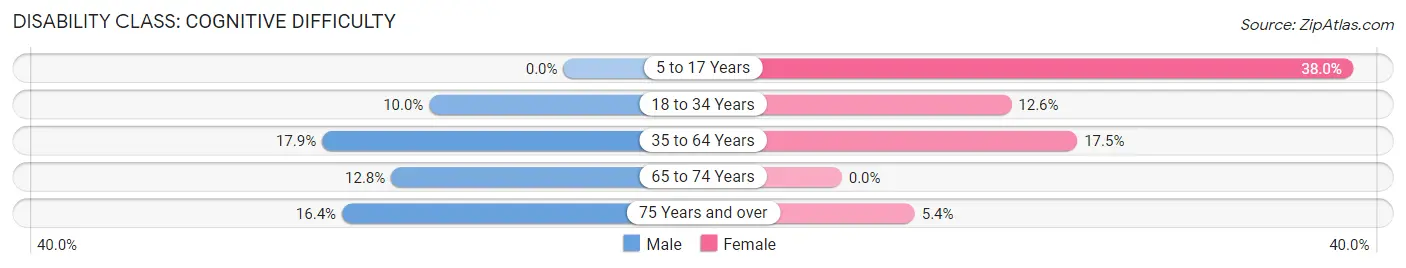
| Age Bracket | Male | Female |
| 5 to 17 Years | 0 (0.0%) | 19 (38.0%) |
| 18 to 34 Years | 23 (10.0%) | 34 (12.6%) |
| 35 to 64 Years | 55 (17.9%) | 57 (17.5%) |
| 65 to 74 Years | 11 (12.8%) | 0 (0.0%) |
| 75 Years and over | 12 (16.4%) | 13 (5.4%) |
Disability Class: Ambulatory Difficulty
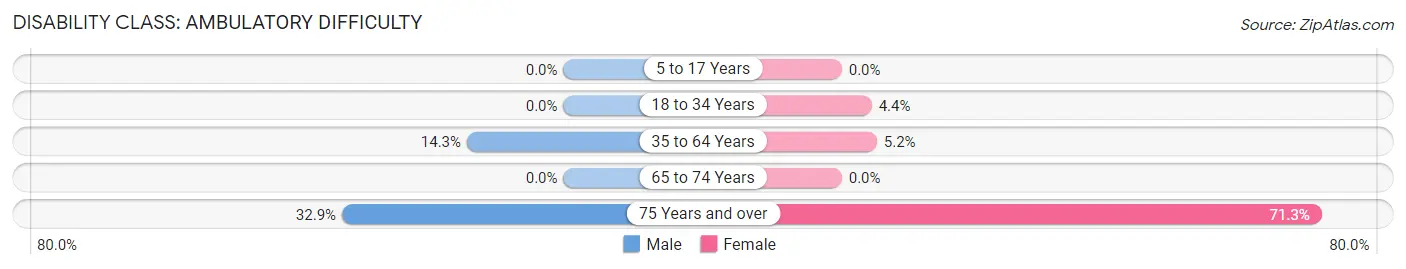
| Age Bracket | Male | Female |
| 5 to 17 Years | 0 (0.0%) | 0 (0.0%) |
| 18 to 34 Years | 0 (0.0%) | 12 (4.4%) |
| 35 to 64 Years | 44 (14.3%) | 17 (5.2%) |
| 65 to 74 Years | 0 (0.0%) | 0 (0.0%) |
| 75 Years and over | 24 (32.9%) | 171 (71.3%) |
Disability Class: Self-Care Difficulty
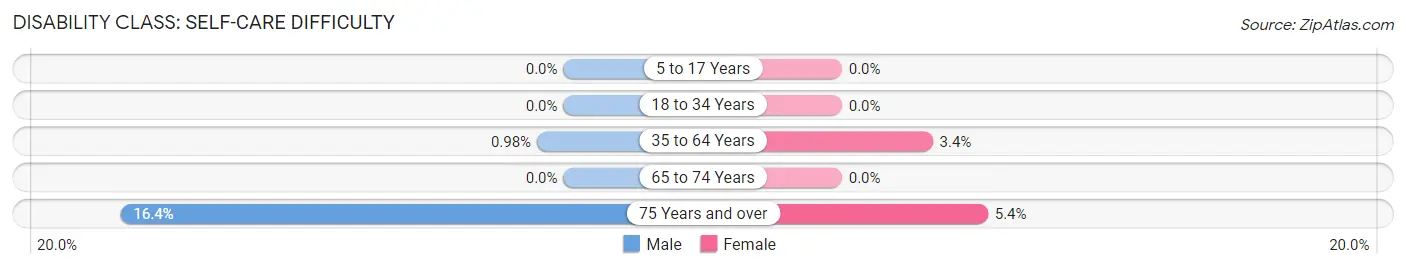
| Age Bracket | Male | Female |
| 5 to 17 Years | 0 (0.0%) | 0 (0.0%) |
| 18 to 34 Years | 0 (0.0%) | 0 (0.0%) |
| 35 to 64 Years | 3 (1.0%) | 11 (3.4%) |
| 65 to 74 Years | 0 (0.0%) | 0 (0.0%) |
| 75 Years and over | 12 (16.4%) | 13 (5.4%) |
Technology Access in Lynnwood Pricedale
Computing Device Access in Lynnwood Pricedale
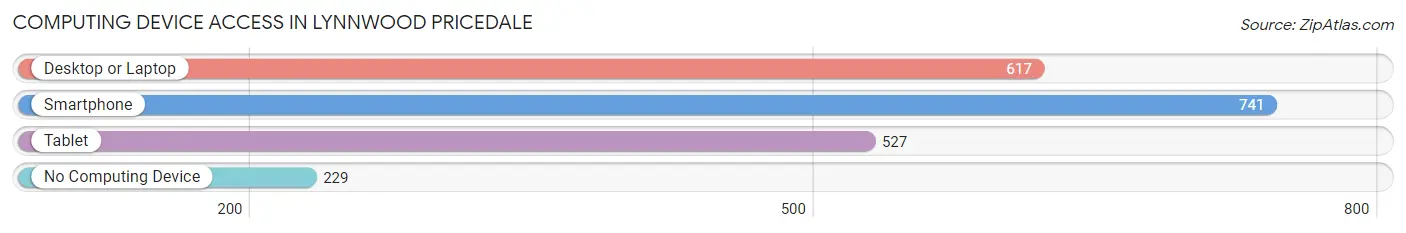
| Device Type | # Households | % Households |
| Desktop or Laptop | 617 | 59.1% |
| Smartphone | 741 | 71.0% |
| Tablet | 527 | 50.5% |
| No Computing Device | 229 | 21.9% |
| Total | 1,044 | 100.0% |
Internet Access in Lynnwood Pricedale
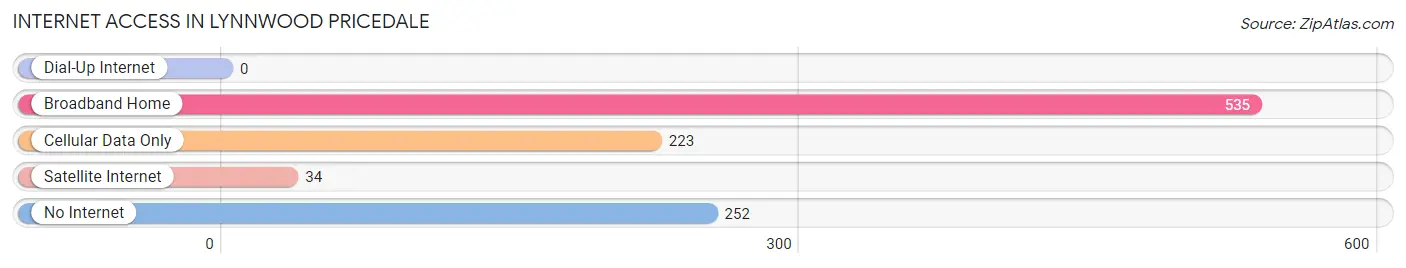
| Internet Type | # Households | % Households |
| Dial-Up Internet | 0 | 0.0% |
| Broadband Home | 535 | 51.2% |
| Cellular Data Only | 223 | 21.4% |
| Satellite Internet | 34 | 3.3% |
| No Internet | 252 | 24.1% |
| Total | 1,044 | 100.0% |
Lynnwood Pricedale Summary
Lynnwood Pricedale is a small borough located in Washington County, Pennsylvania. It is situated in the southwestern corner of the state, approximately 25 miles south of Pittsburgh. The borough is bordered by the townships of North Strabane, South Strabane, and Donegal. As of the 2010 census, the population of Lynnwood Pricedale was 1,845.
History
The area that is now Lynnwood Pricedale was first settled in the late 1700s by German immigrants. The town was originally known as Price’s Dale, named after the Price family who owned much of the land in the area. In 1891, the town was incorporated as the Borough of Lynnwood Pricedale.
The town was a rural farming community for much of its history. In the early 1900s, the town began to grow as coal mining and steel production increased in the area. The town was home to several coal mines, including the Lynnwood Mine, which operated from the early 1900s until the late 1950s.
Geography
Lynnwood Pricedale is located in southwestern Pennsylvania, approximately 25 miles south of Pittsburgh. The borough is situated in the foothills of the Allegheny Mountains. The town is bordered by the townships of North Strabane, South Strabane, and Donegal.
The borough has a total area of 1.2 square miles, all of which is land. The town is located along the Monongahela River, which flows through the borough.
Economy
The economy of Lynnwood Pricedale is largely based on agriculture and manufacturing. The town is home to several small businesses, including a grocery store, a hardware store, and a few restaurants.
The town is also home to several manufacturing companies, including a steel mill and a paper mill. The steel mill is the largest employer in the town, employing over 500 people.
Demographics
As of the 2010 census, the population of Lynnwood Pricedale was 1,845. The racial makeup of the town was 97.3% White, 0.9% African American, 0.2% Native American, 0.3% Asian, and 1.3% from other races.
The median household income in Lynnwood Pricedale was $41,250, and the median family income was $50,000. The per capita income was $20,845. About 8.3% of the population was below the poverty line.
The town is served by the Washington County School District. The town has one elementary school, one middle school, and one high school.
Common Questions
What is Per Capita Income in Lynnwood Pricedale?
Per Capita income in Lynnwood Pricedale is $34,986.
What is the Median Family Income in Lynnwood Pricedale?
Median Family Income in Lynnwood Pricedale is $95,500.
What is the Median Household income in Lynnwood Pricedale?
Median Household Income in Lynnwood Pricedale is $46,522.
What is Income or Wage Gap in Lynnwood Pricedale?
Income or Wage Gap in Lynnwood Pricedale is 28.4%.
Women in Lynnwood Pricedale earn 71.6 cents for every dollar earned by a man.
What is Inequality or Gini Index in Lynnwood Pricedale?
Inequality or Gini Index in Lynnwood Pricedale is 0.44.
What is the Total Population of Lynnwood Pricedale?
Total Population of Lynnwood Pricedale is 1,918.
What is the Total Male Population of Lynnwood Pricedale?
Total Male Population of Lynnwood Pricedale is 860.
What is the Total Female Population of Lynnwood Pricedale?
Total Female Population of Lynnwood Pricedale is 1,058.
What is the Ratio of Males per 100 Females in Lynnwood Pricedale?
There are 81.29 Males per 100 Females in Lynnwood Pricedale.
What is the Ratio of Females per 100 Males in Lynnwood Pricedale?
There are 123.02 Females per 100 Males in Lynnwood Pricedale.
What is the Median Population Age in Lynnwood Pricedale?
Median Population Age in Lynnwood Pricedale is 47.3 Years.
What is the Average Family Size in Lynnwood Pricedale
Average Family Size in Lynnwood Pricedale is 2.7 People.
What is the Average Household Size in Lynnwood Pricedale
Average Household Size in Lynnwood Pricedale is 1.8 People.
How Large is the Labor Force in Lynnwood Pricedale?
There are 883 People in the Labor Forcein in Lynnwood Pricedale.
What is the Percentage of People in the Labor Force in Lynnwood Pricedale?
52.7% of People are in the Labor Force in Lynnwood Pricedale.
What is the Unemployment Rate in Lynnwood Pricedale?
Unemployment Rate in Lynnwood Pricedale is 1.5%.