Park Crest, PA Map & Demographics
Park Crest Map
Park Crest Overview
$29,245
PER CAPITA INCOME
$73,750
AVG FAMILY INCOME
$58,824
AVG HOUSEHOLD INCOME
49.9%
WAGE / INCOME GAP [ % ]
50.1¢/ $1
WAGE / INCOME GAP [ $ ]
0.45
INEQUALITY / GINI INDEX
583
TOTAL POPULATION
231
MALE POPULATION
352
FEMALE POPULATION
65.62
MALES / 100 FEMALES
152.38
FEMALES / 100 MALES
51.8
MEDIAN AGE
2.9
AVG FAMILY SIZE
2.2
AVG HOUSEHOLD SIZE
240
LABOR FORCE [ PEOPLE ]
49.9%
PERCENT IN LABOR FORCE
7.1%
UNEMPLOYMENT RATE
Income in Park Crest
Income Overview in Park Crest
Per Capita Income in Park Crest is $29,245, while median incomes of families and households are $73,750 and $58,824 respectively.
| Characteristic | Number | Measure |
| Per Capita Income | 583 | $29,245 |
| Median Family Income | 158 | $73,750 |
| Mean Family Income | 158 | $88,725 |
| Median Household Income | 264 | $58,824 |
| Mean Household Income | 264 | $65,123 |
| Income Deficit | 158 | $0 |
| Wage / Income Gap (%) | 583 | 49.87% |
| Wage / Income Gap ($) | 583 | 50.13¢ per $1 |
| Gini / Inequality Index | 583 | 0.45 |
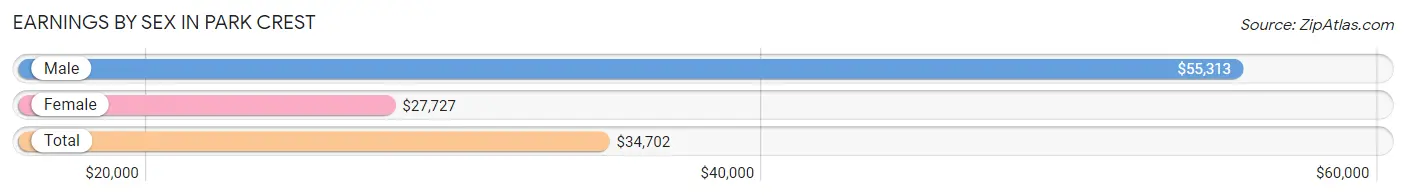
Earnings by Sex in Park Crest
Average Earnings in Park Crest are $34,702, $55,313 for men and $27,727 for women, a difference of 49.9%.
| Sex | Number | Average Earnings |
| Male | 117 (46.3%) | $55,313 |
| Female | 136 (53.7%) | $27,727 |
| Total | 253 (100.0%) | $34,702 |
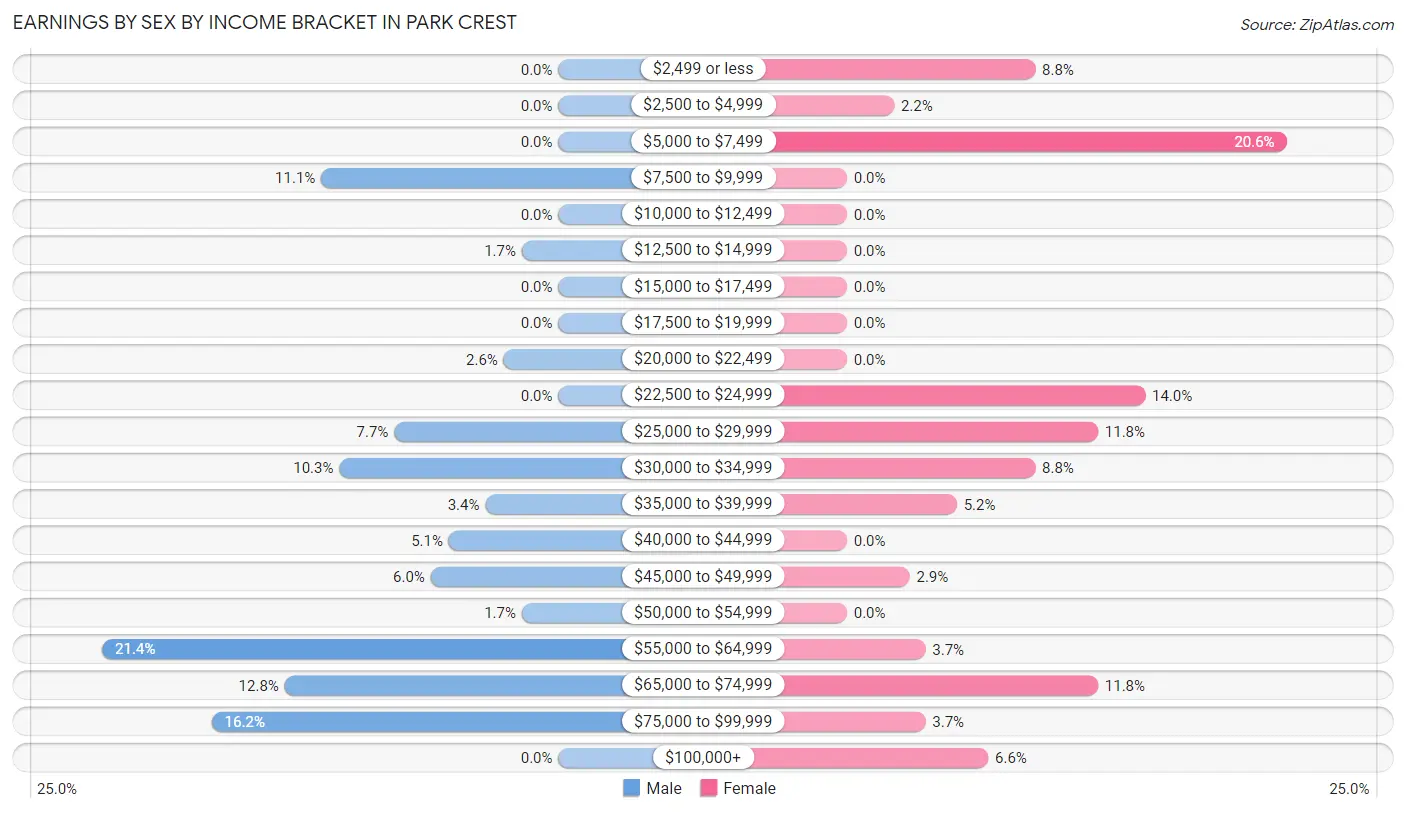
Earnings by Sex by Income Bracket in Park Crest
The most common earnings brackets in Park Crest are $55,000 to $64,999 for men (25 | 21.4%) and $5,000 to $7,499 for women (28 | 20.6%).
| Income | Male | Female |
| $2,499 or less | 0 (0.0%) | 12 (8.8%) |
| $2,500 to $4,999 | 0 (0.0%) | 3 (2.2%) |
| $5,000 to $7,499 | 0 (0.0%) | 28 (20.6%) |
| $7,500 to $9,999 | 13 (11.1%) | 0 (0.0%) |
| $10,000 to $12,499 | 0 (0.0%) | 0 (0.0%) |
| $12,500 to $14,999 | 2 (1.7%) | 0 (0.0%) |
| $15,000 to $17,499 | 0 (0.0%) | 0 (0.0%) |
| $17,500 to $19,999 | 0 (0.0%) | 0 (0.0%) |
| $20,000 to $22,499 | 3 (2.6%) | 0 (0.0%) |
| $22,500 to $24,999 | 0 (0.0%) | 19 (14.0%) |
| $25,000 to $29,999 | 9 (7.7%) | 16 (11.8%) |
| $30,000 to $34,999 | 12 (10.3%) | 12 (8.8%) |
| $35,000 to $39,999 | 4 (3.4%) | 7 (5.1%) |
| $40,000 to $44,999 | 6 (5.1%) | 0 (0.0%) |
| $45,000 to $49,999 | 7 (6.0%) | 4 (2.9%) |
| $50,000 to $54,999 | 2 (1.7%) | 0 (0.0%) |
| $55,000 to $64,999 | 25 (21.4%) | 5 (3.7%) |
| $65,000 to $74,999 | 15 (12.8%) | 16 (11.8%) |
| $75,000 to $99,999 | 19 (16.2%) | 5 (3.7%) |
| $100,000+ | 0 (0.0%) | 9 (6.6%) |
| Total | 117 (100.0%) | 136 (100.0%) |
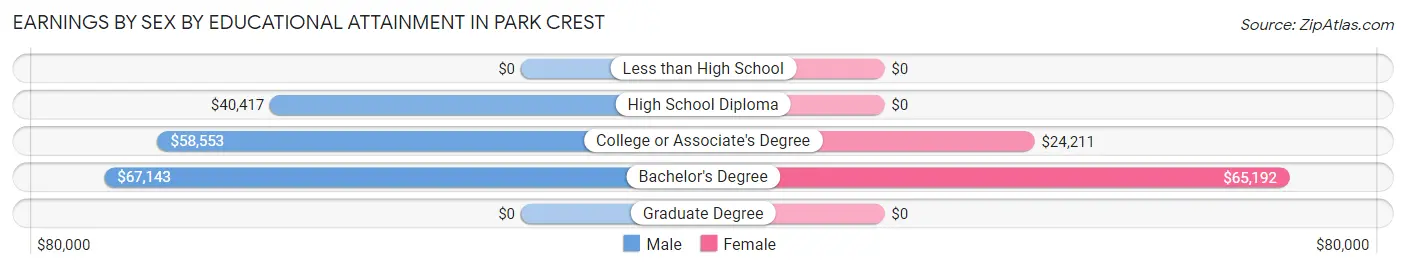
Earnings by Sex by Educational Attainment in Park Crest
Average earnings in Park Crest are $58,155 for men and $28,295 for women, a difference of 51.3%. Men with an educational attainment of bachelor's degree enjoy the highest average annual earnings of $67,143, while those with high school diploma education earn the least with $40,417. Women with an educational attainment of bachelor's degree earn the most with the average annual earnings of $65,192, while those with college or associate's degree education have the smallest earnings of $24,211.
| Educational Attainment | Male Income | Female Income |
| Less than High School | - | - |
| High School Diploma | $40,417 | $0 |
| College or Associate's Degree | $58,553 | $24,211 |
| Bachelor's Degree | $67,143 | $65,192 |
| Graduate Degree | - | - |
| Total | $58,155 | $28,295 |
Family Income in Park Crest
Family Income Brackets in Park Crest
According to the Park Crest family income data, there are 58 families falling into the $50,000 to $74,999 income range, which is the most common income bracket and makes up 36.7% of all families.
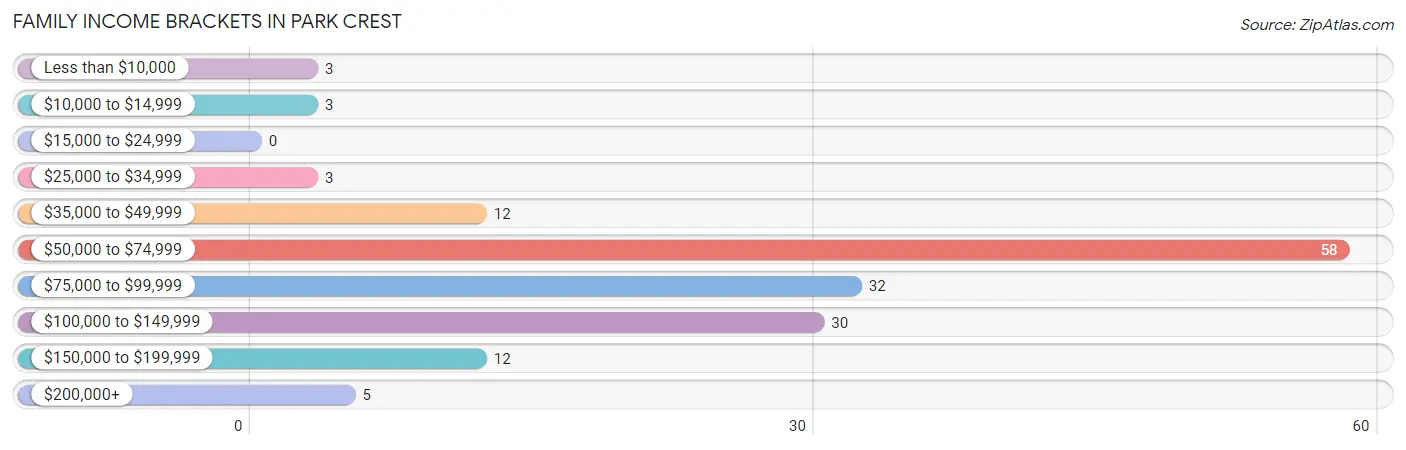
| Income Bracket | # Families | % Families |
| Less than $10,000 | 3 | 1.9% |
| $10,000 to $14,999 | 3 | 1.9% |
| $15,000 to $24,999 | 0 | 0.0% |
| $25,000 to $34,999 | 3 | 1.9% |
| $35,000 to $49,999 | 12 | 7.6% |
| $50,000 to $74,999 | 58 | 36.7% |
| $75,000 to $99,999 | 32 | 20.3% |
| $100,000 to $149,999 | 30 | 19.0% |
| $150,000 to $199,999 | 12 | 7.6% |
| $200,000+ | 5 | 3.2% |
Family Income by Famaliy Size in Park Crest
2-person families (89 | 56.3%) account for the highest median family income in Park Crest with $82,875 per family, while 2-person families (89 | 56.3%) have the highest median income of $41,438 per family member.
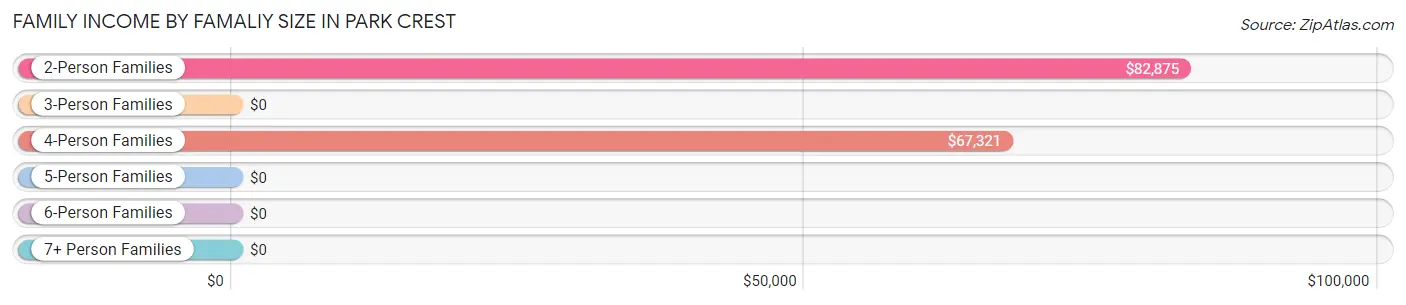
| Income Bracket | # Families | Median Income |
| 2-Person Families | 89 (56.3%) | $82,875 |
| 3-Person Families | 23 (14.6%) | $0 |
| 4-Person Families | 34 (21.5%) | $67,321 |
| 5-Person Families | 9 (5.7%) | $0 |
| 6-Person Families | 3 (1.9%) | $0 |
| 7+ Person Families | 0 (0.0%) | $0 |
| Total | 158 (100.0%) | $73,750 |
Family Income by Number of Earners in Park Crest
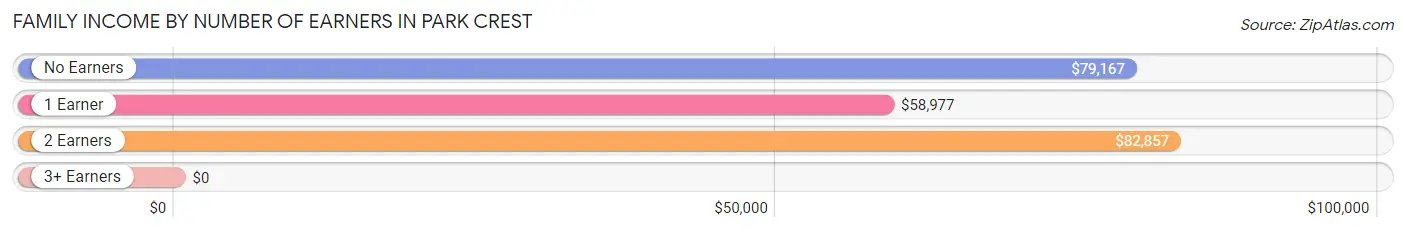
| Number of Earners | # Families | Median Income |
| No Earners | 32 (20.3%) | $79,167 |
| 1 Earner | 25 (15.8%) | $58,977 |
| 2 Earners | 96 (60.8%) | $82,857 |
| 3+ Earners | 5 (3.2%) | $0 |
| Total | 158 (100.0%) | $73,750 |
Household Income in Park Crest
Household Income Brackets in Park Crest
With 82 households falling in the category, the $10,000 to $14,999 income range is the most frequent in Park Crest, accounting for 31.1% of all households. In contrast, only 3 households (1.1%) fall into the less than $10,000 income bracket, making it the least populous group.
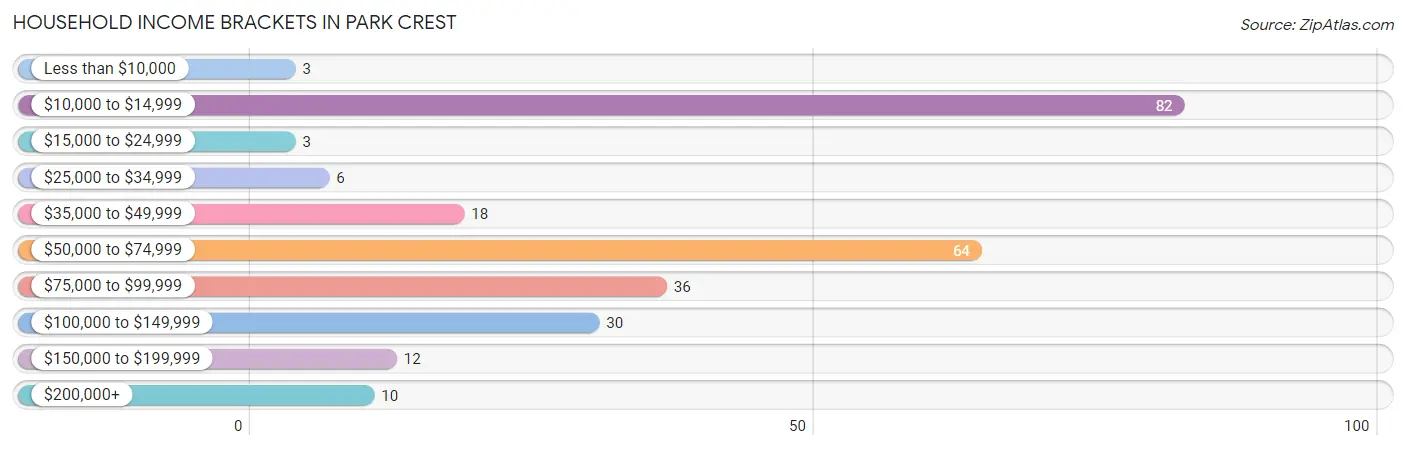
| Income Bracket | # Households | % Households |
| Less than $10,000 | 3 | 1.1% |
| $10,000 to $14,999 | 82 | 31.1% |
| $15,000 to $24,999 | 3 | 1.1% |
| $25,000 to $34,999 | 6 | 2.3% |
| $35,000 to $49,999 | 18 | 6.8% |
| $50,000 to $74,999 | 64 | 24.2% |
| $75,000 to $99,999 | 36 | 13.6% |
| $100,000 to $149,999 | 30 | 11.4% |
| $150,000 to $199,999 | 12 | 4.5% |
| $200,000+ | 10 | 3.8% |
Household Income by Householder Age in Park Crest
The median household income in Park Crest is $58,824, with the highest median household income of $76,875 found in the 25 to 44 years age bracket for the primary householder. A total of 60 households (22.7%) fall into this category.
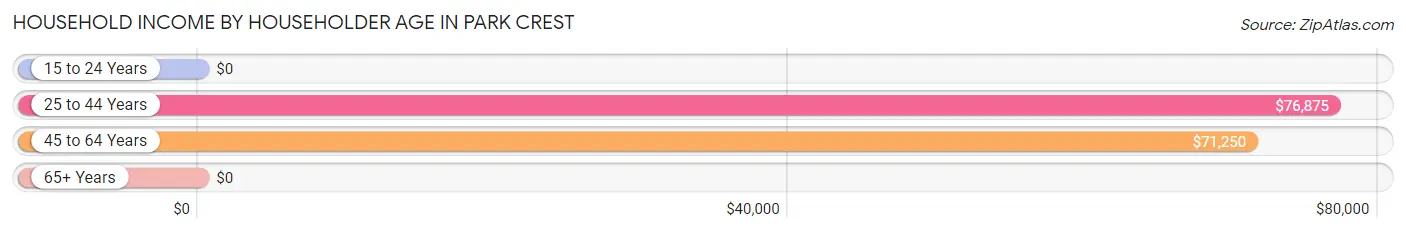
| Income Bracket | # Households | Median Income |
| 15 to 24 Years | 0 (0.0%) | $0 |
| 25 to 44 Years | 60 (22.7%) | $76,875 |
| 45 to 64 Years | 58 (22.0%) | $71,250 |
| 65+ Years | 146 (55.3%) | $0 |
| Total | 264 (100.0%) | $58,824 |
Poverty in Park Crest
Income Below Poverty by Sex and Age in Park Crest
With 8.2% poverty level for males and 29.0% for females among the residents of Park Crest, 25 to 34 year old males and 25 to 34 year old females are the most vulnerable to poverty, with 5 males (31.2%) and 10 females (52.6%) in their respective age groups living below the poverty level.
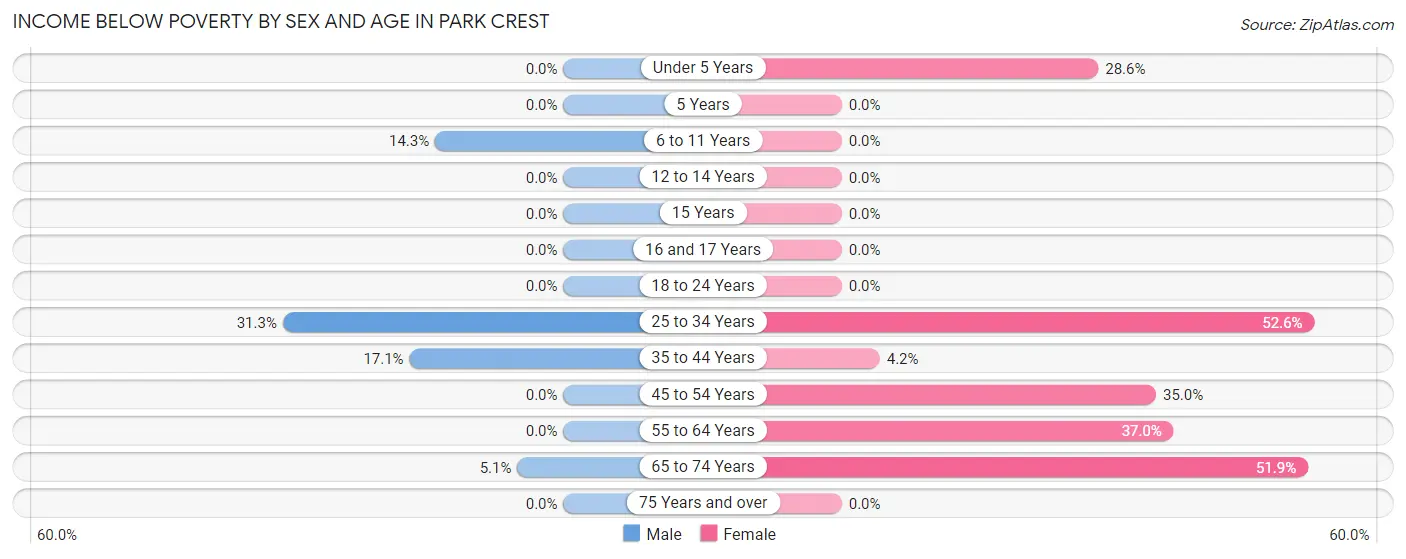
| Age Bracket | Male | Female |
| Under 5 Years | 0 (0.0%) | 4 (28.6%) |
| 5 Years | 0 (0.0%) | 0 (0.0%) |
| 6 to 11 Years | 6 (14.3%) | 0 (0.0%) |
| 12 to 14 Years | 0 (0.0%) | 0 (0.0%) |
| 15 Years | 0 (0.0%) | 0 (0.0%) |
| 16 and 17 Years | 0 (0.0%) | 0 (0.0%) |
| 18 to 24 Years | 0 (0.0%) | 0 (0.0%) |
| 25 to 34 Years | 5 (31.2%) | 10 (52.6%) |
| 35 to 44 Years | 6 (17.1%) | 3 (4.2%) |
| 45 to 54 Years | 0 (0.0%) | 14 (35.0%) |
| 55 to 64 Years | 0 (0.0%) | 17 (37.0%) |
| 65 to 74 Years | 2 (5.1%) | 54 (51.9%) |
| 75 Years and over | 0 (0.0%) | 0 (0.0%) |
| Total | 19 (8.2%) | 102 (29.0%) |
Income Above Poverty by Sex and Age in Park Crest
According to the poverty statistics in Park Crest, males aged under 5 years and females aged 6 to 11 years are the age groups that are most secure financially, with 100.0% of males and 100.0% of females in these age groups living above the poverty line.
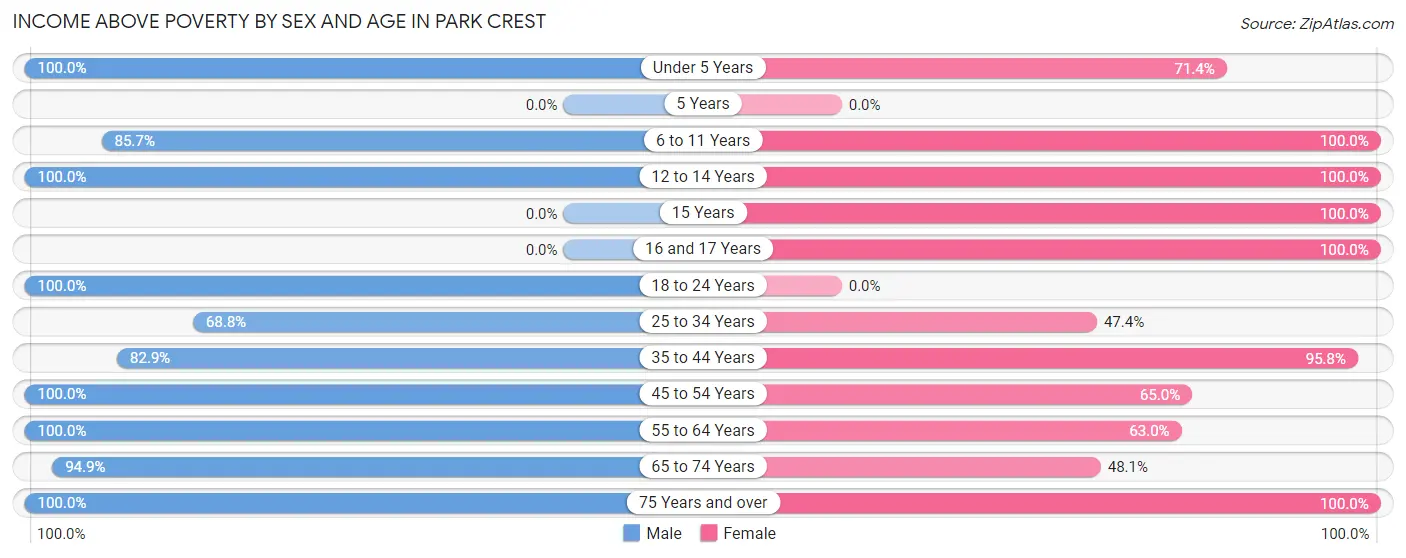
| Age Bracket | Male | Female |
| Under 5 Years | 8 (100.0%) | 10 (71.4%) |
| 5 Years | 0 (0.0%) | 0 (0.0%) |
| 6 to 11 Years | 36 (85.7%) | 3 (100.0%) |
| 12 to 14 Years | 4 (100.0%) | 14 (100.0%) |
| 15 Years | 0 (0.0%) | 17 (100.0%) |
| 16 and 17 Years | 0 (0.0%) | 5 (100.0%) |
| 18 to 24 Years | 18 (100.0%) | 0 (0.0%) |
| 25 to 34 Years | 11 (68.8%) | 9 (47.4%) |
| 35 to 44 Years | 29 (82.9%) | 68 (95.8%) |
| 45 to 54 Years | 13 (100.0%) | 26 (65.0%) |
| 55 to 64 Years | 27 (100.0%) | 29 (63.0%) |
| 65 to 74 Years | 37 (94.9%) | 50 (48.1%) |
| 75 Years and over | 29 (100.0%) | 19 (100.0%) |
| Total | 212 (91.8%) | 250 (71.0%) |
Income Below Poverty Among Married-Couple Families in Park Crest
The poverty statistics for married-couple families in Park Crest show that 2.4% or 3 of the total 125 families live below the poverty line. Families with 3 or 4 children have the highest poverty rate of 100.0%, comprising of 3 families. On the other hand, families with no children have the lowest poverty rate of 0.0%, which includes 0 families.
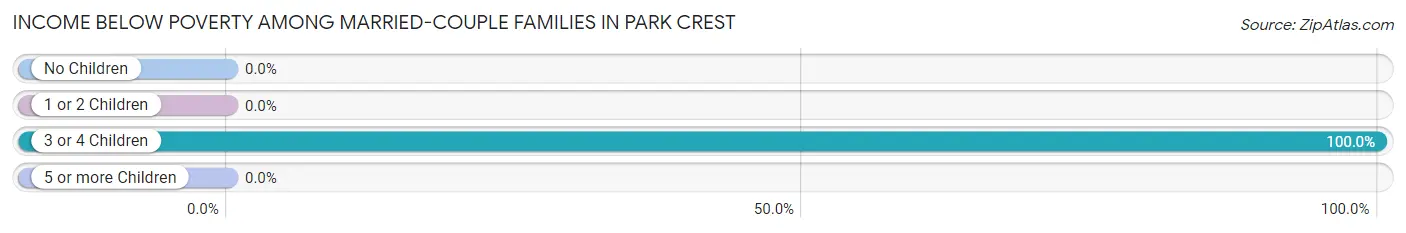
| Children | Above Poverty | Below Poverty |
| No Children | 77 (100.0%) | 0 (0.0%) |
| 1 or 2 Children | 45 (100.0%) | 0 (0.0%) |
| 3 or 4 Children | 0 (0.0%) | 3 (100.0%) |
| 5 or more Children | 0 (0.0%) | 0 (0.0%) |
| Total | 122 (97.6%) | 3 (2.4%) |
Income Below Poverty Among Single-Parent Households in Park Crest
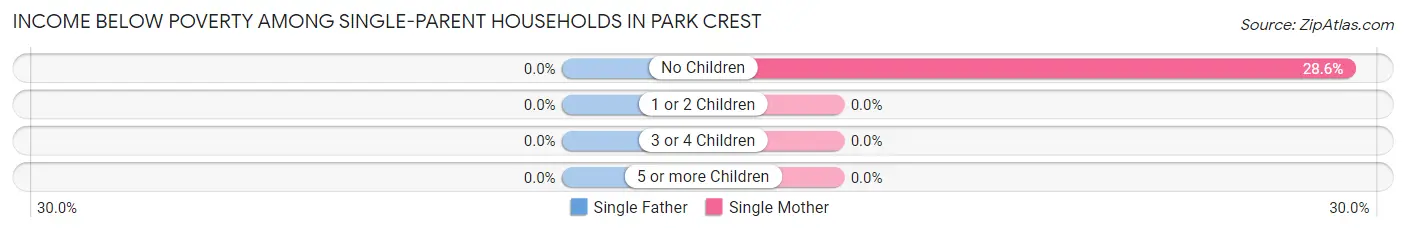
| Children | Single Father | Single Mother |
| No Children | 0 (0.0%) | 6 (28.6%) |
| 1 or 2 Children | 0 (0.0%) | 0 (0.0%) |
| 3 or 4 Children | 0 (0.0%) | 0 (0.0%) |
| 5 or more Children | 0 (0.0%) | 0 (0.0%) |
| Total | 0 (0.0%) | 6 (28.6%) |
Income Below Poverty Among Married-Couple vs Single-Parent Households in Park Crest
The poverty data for Park Crest shows that 3 of the married-couple family households (2.4%) and 6 of the single-parent households (18.2%) are living below the poverty level. Within the married-couple family households, those with 3 or 4 children have the highest poverty rate, with 3 households (100.0%) falling below the poverty line. Among the single-parent households, those with no children have the highest poverty rate, with 6 household (28.6%) living below poverty.
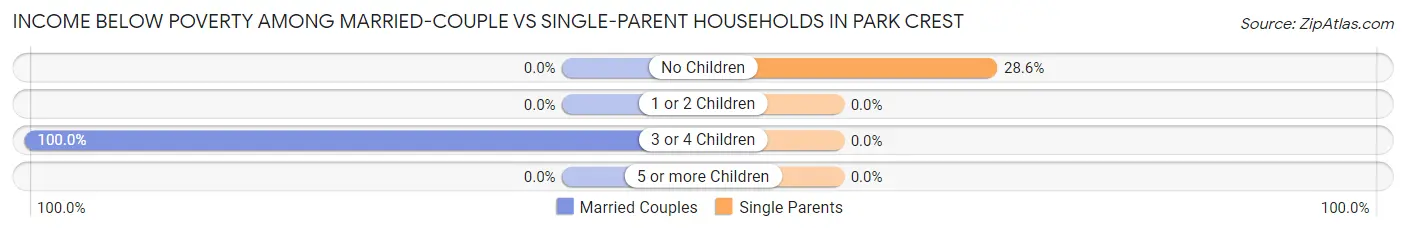
| Children | Married-Couple Families | Single-Parent Households |
| No Children | 0 (0.0%) | 6 (28.6%) |
| 1 or 2 Children | 0 (0.0%) | 0 (0.0%) |
| 3 or 4 Children | 3 (100.0%) | 0 (0.0%) |
| 5 or more Children | 0 (0.0%) | 0 (0.0%) |
| Total | 3 (2.4%) | 6 (18.2%) |
Race in Park Crest
The most populous races in Park Crest are White / Caucasian (574 | 98.5%), and Two or more Races (9 | 1.5%).
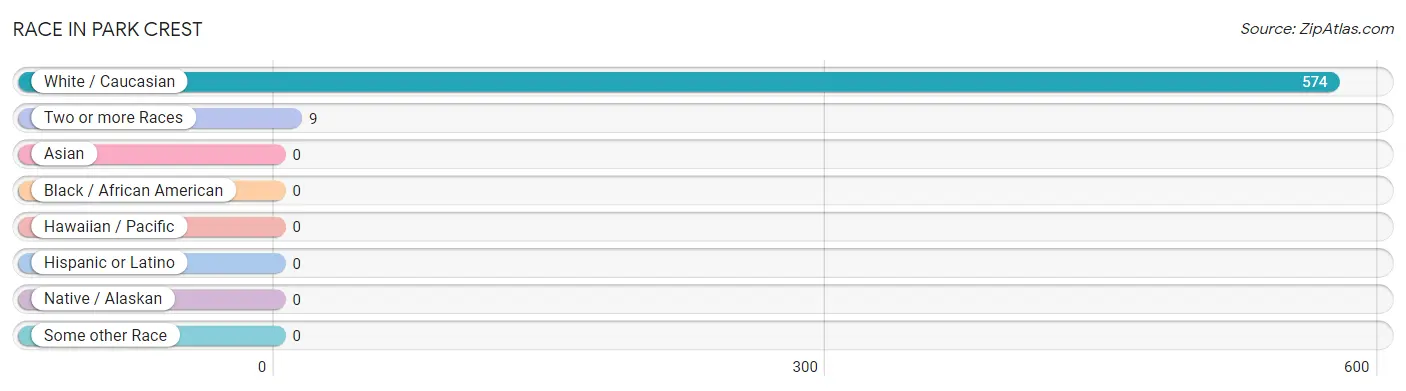
| Race | # Population | % Population |
| Asian | 0 | 0.0% |
| Black / African American | 0 | 0.0% |
| Hawaiian / Pacific | 0 | 0.0% |
| Hispanic or Latino | 0 | 0.0% |
| Native / Alaskan | 0 | 0.0% |
| White / Caucasian | 574 | 98.5% |
| Two or more Races | 9 | 1.5% |
| Some other Race | 0 | 0.0% |
| Total | 583 | 100.0% |
Ancestry in Park Crest
The most populous ancestries reported in Park Crest are German (213 | 36.5%), Irish (133 | 22.8%), Greek (100 | 17.2%), Polish (73 | 12.5%), and Lithuanian (71 | 12.2%), together accounting for 101.2% of all Park Crest residents.
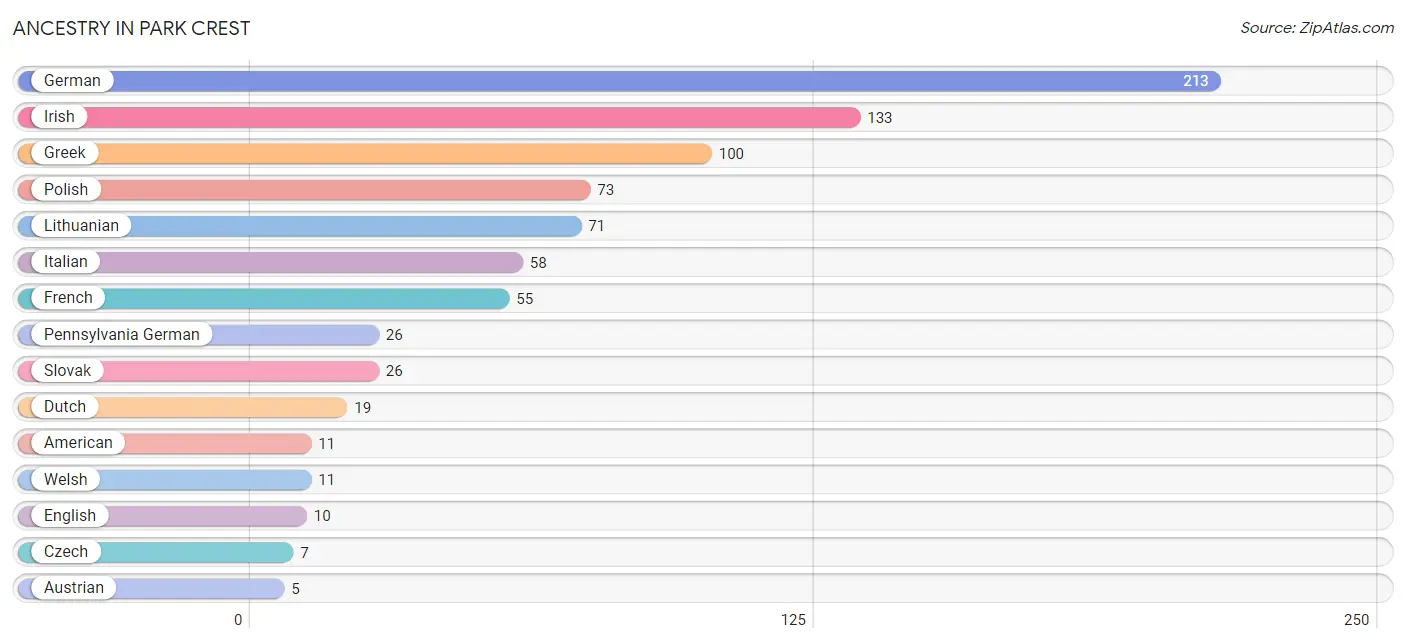
| Ancestry | # Population | % Population |
| American | 11 | 1.9% |
| Austrian | 5 | 0.9% |
| Czech | 7 | 1.2% |
| Dutch | 19 | 3.3% |
| English | 10 | 1.7% |
| French | 55 | 9.4% |
| German | 213 | 36.5% |
| Greek | 100 | 17.2% |
| Irish | 133 | 22.8% |
| Italian | 58 | 10.0% |
| Lithuanian | 71 | 12.2% |
| Norwegian | 3 | 0.5% |
| Pennsylvania German | 26 | 4.5% |
| Polish | 73 | 12.5% |
| Russian | 3 | 0.5% |
| Slovak | 26 | 4.5% |
| Ukrainian | 2 | 0.3% |
| Welsh | 11 | 1.9% | View All 18 Rows |
Immigrants in Park Crest

| Immigration Origin | # Population | % Population | View All 0 Rows |
Sex and Age in Park Crest
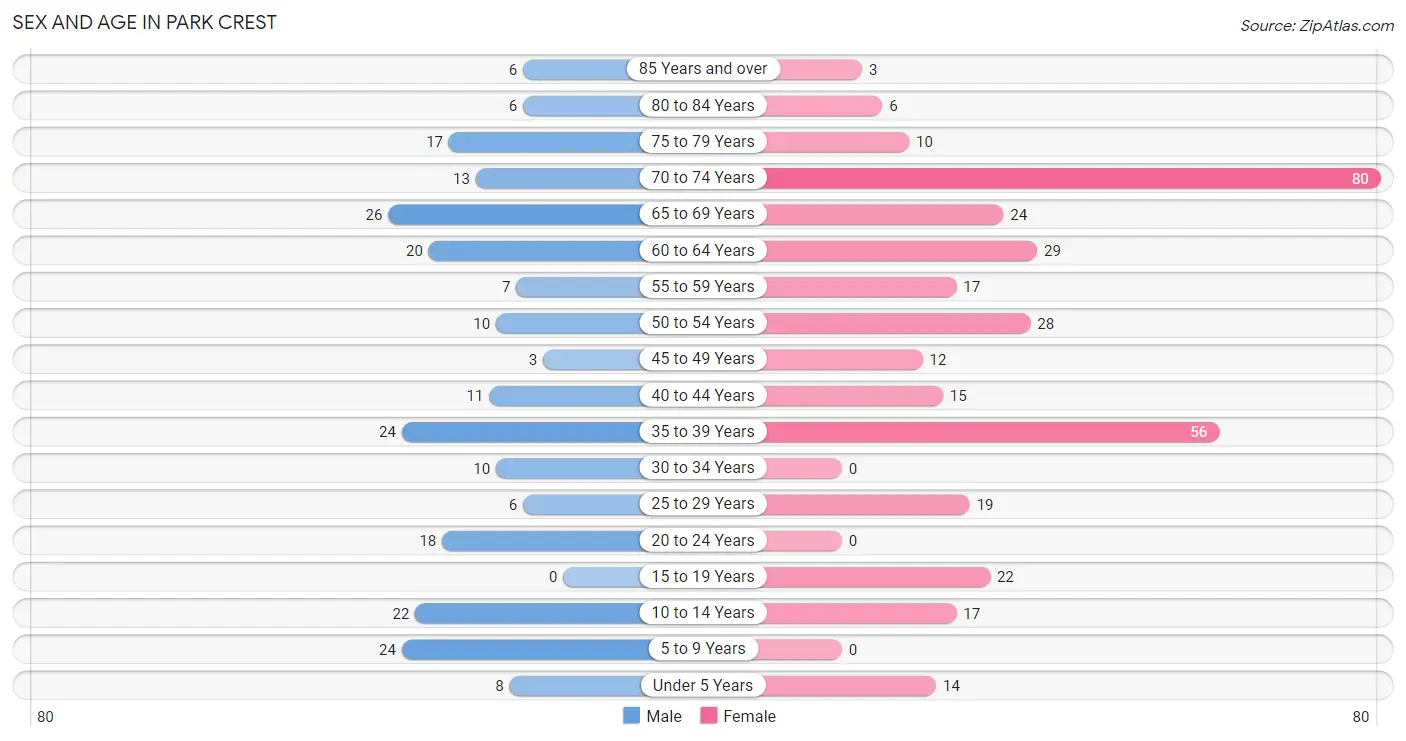
Sex and Age in Park Crest
The most populous age groups in Park Crest are 65 to 69 Years (26 | 11.3%) for men and 70 to 74 Years (80 | 22.7%) for women.
| Age Bracket | Male | Female |
| Under 5 Years | 8 (3.5%) | 14 (4.0%) |
| 5 to 9 Years | 24 (10.4%) | 0 (0.0%) |
| 10 to 14 Years | 22 (9.5%) | 17 (4.8%) |
| 15 to 19 Years | 0 (0.0%) | 22 (6.2%) |
| 20 to 24 Years | 18 (7.8%) | 0 (0.0%) |
| 25 to 29 Years | 6 (2.6%) | 19 (5.4%) |
| 30 to 34 Years | 10 (4.3%) | 0 (0.0%) |
| 35 to 39 Years | 24 (10.4%) | 56 (15.9%) |
| 40 to 44 Years | 11 (4.8%) | 15 (4.3%) |
| 45 to 49 Years | 3 (1.3%) | 12 (3.4%) |
| 50 to 54 Years | 10 (4.3%) | 28 (8.0%) |
| 55 to 59 Years | 7 (3.0%) | 17 (4.8%) |
| 60 to 64 Years | 20 (8.7%) | 29 (8.2%) |
| 65 to 69 Years | 26 (11.3%) | 24 (6.8%) |
| 70 to 74 Years | 13 (5.6%) | 80 (22.7%) |
| 75 to 79 Years | 17 (7.4%) | 10 (2.8%) |
| 80 to 84 Years | 6 (2.6%) | 6 (1.7%) |
| 85 Years and over | 6 (2.6%) | 3 (0.9%) |
| Total | 231 (100.0%) | 352 (100.0%) |
Families and Households in Park Crest
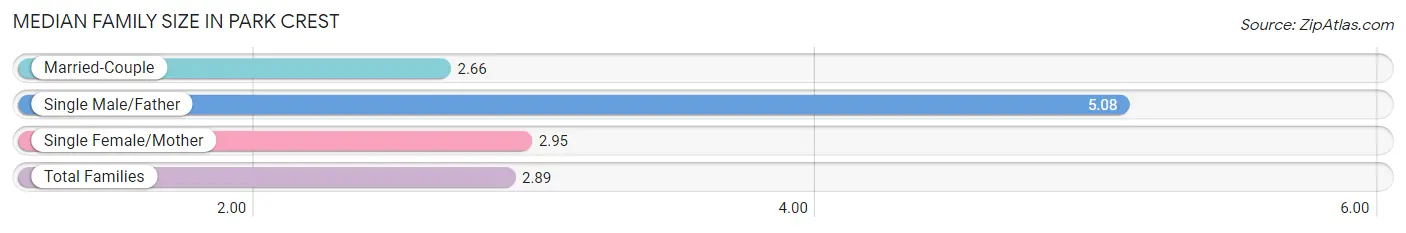
Median Family Size in Park Crest
The median family size in Park Crest is 2.89 persons per family, with single male/father families (12 | 7.6%) accounting for the largest median family size of 5.08 persons per family. On the other hand, married-couple families (125 | 79.1%) represent the smallest median family size with 2.66 persons per family.
| Family Type | # Families | Family Size |
| Married-Couple | 125 (79.1%) | 2.66 |
| Single Male/Father | 12 (7.6%) | 5.08 |
| Single Female/Mother | 21 (13.3%) | 2.95 |
| Total Families | 158 (100.0%) | 2.89 |
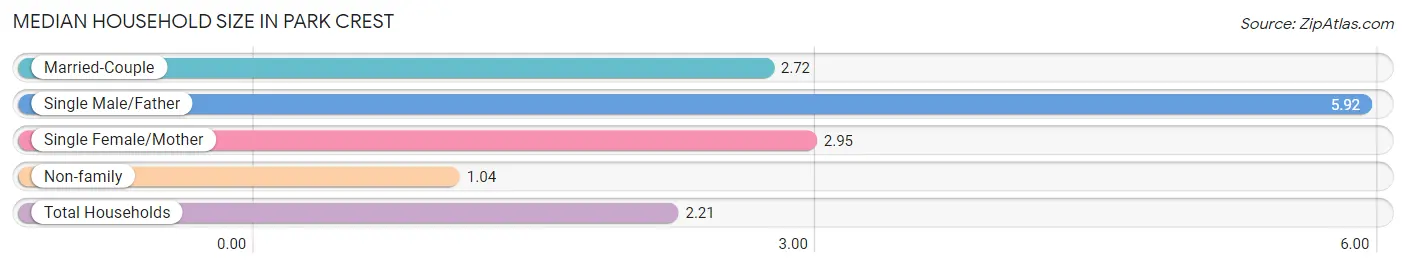
Median Household Size in Park Crest
The median household size in Park Crest is 2.21 persons per household, with single male/father households (12 | 4.5%) accounting for the largest median household size of 5.92 persons per household. non-family households (106 | 40.2%) represent the smallest median household size with 1.04 persons per household.
| Household Type | # Households | Household Size |
| Married-Couple | 125 (47.3%) | 2.72 |
| Single Male/Father | 12 (4.5%) | 5.92 |
| Single Female/Mother | 21 (8.0%) | 2.95 |
| Non-family | 106 (40.2%) | 1.04 |
| Total Households | 264 (100.0%) | 2.21 |
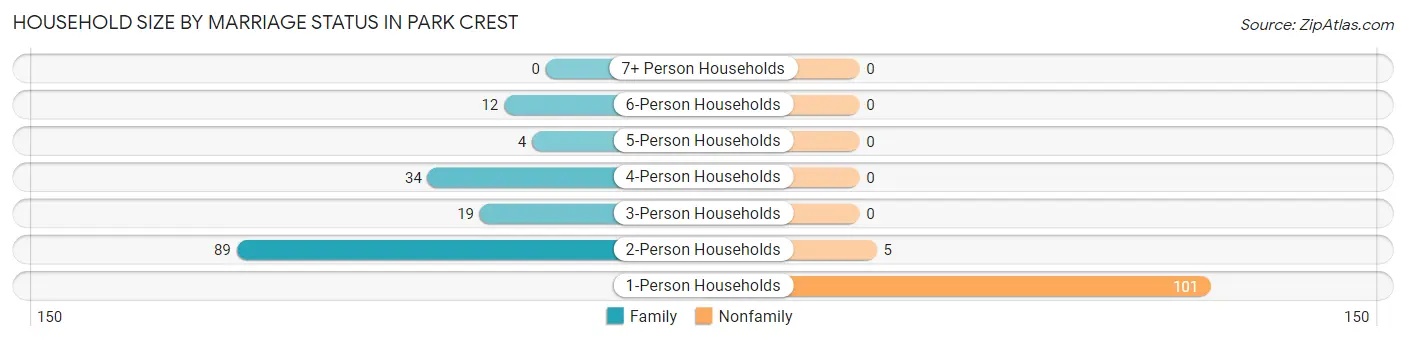
Household Size by Marriage Status in Park Crest
Out of a total of 264 households in Park Crest, 158 (59.9%) are family households, while 106 (40.2%) are nonfamily households. The most numerous type of family households are 2-person households, comprising 89, and the most common type of nonfamily households are 1-person households, comprising 101.
| Household Size | Family Households | Nonfamily Households |
| 1-Person Households | - | 101 (38.3%) |
| 2-Person Households | 89 (33.7%) | 5 (1.9%) |
| 3-Person Households | 19 (7.2%) | 0 (0.0%) |
| 4-Person Households | 34 (12.9%) | 0 (0.0%) |
| 5-Person Households | 4 (1.5%) | 0 (0.0%) |
| 6-Person Households | 12 (4.5%) | 0 (0.0%) |
| 7+ Person Households | 0 (0.0%) | 0 (0.0%) |
| Total | 158 (59.9%) | 106 (40.2%) |
Female Fertility in Park Crest
Fertility by Age in Park Crest
Average fertility rate in Park Crest is 148.0 births per 1,000 women. Women in the age bracket of 35 to 50 years have the highest fertility rate with 218.0 births per 1,000 women. Women in the age bracket of 35 to 50 years acount for 100.0% of all women with births.
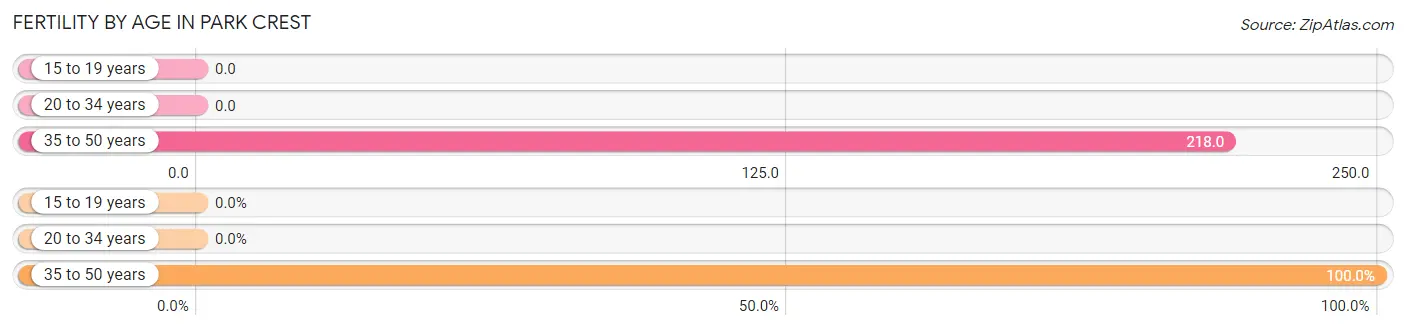
| Age Bracket | Women with Births | Births / 1,000 Women |
| 15 to 19 years | 0 (0.0%) | 0.0 |
| 20 to 34 years | 0 (0.0%) | 0.0 |
| 35 to 50 years | 19 (100.0%) | 218.0 |
| Total | 19 (100.0%) | 148.0 |
Fertility by Age by Marriage Status in Park Crest
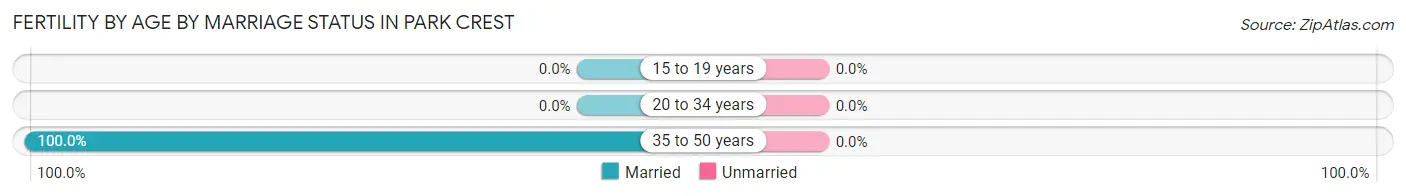
| Age Bracket | Married | Unmarried |
| 15 to 19 years | 0 (0.0%) | 0 (0.0%) |
| 20 to 34 years | 0 (0.0%) | 0 (0.0%) |
| 35 to 50 years | 19 (100.0%) | 0 (0.0%) |
| Total | 19 (100.0%) | 0 (0.0%) |
Fertility by Education in Park Crest
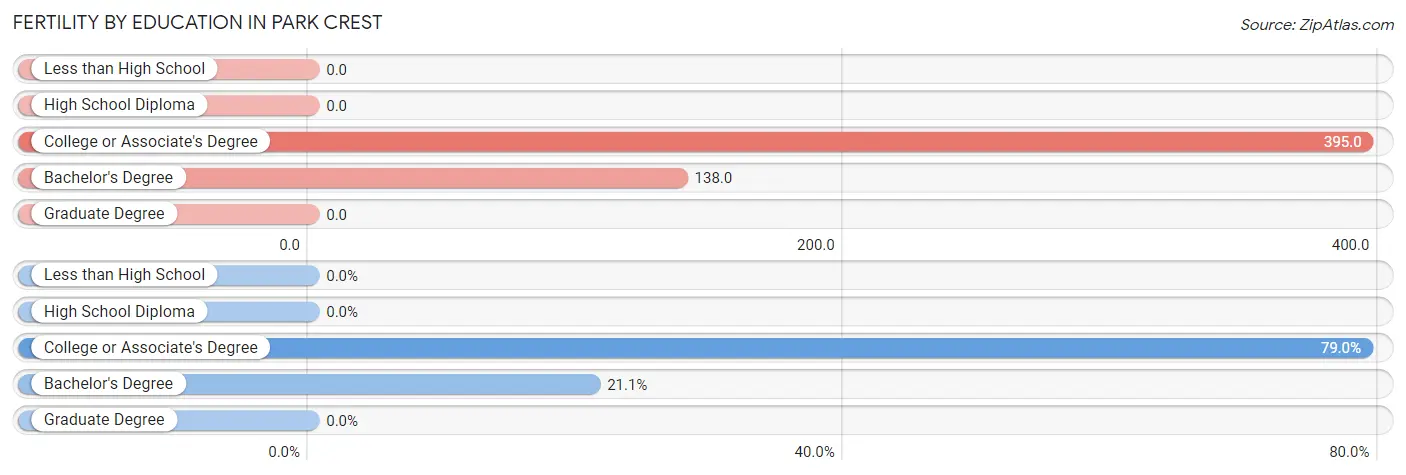
| Educational Attainment | Women with Births | Births / 1,000 Women |
| Less than High School | 0 (0.0%) | 0.0 |
| High School Diploma | 0 (0.0%) | 0.0 |
| College or Associate's Degree | 15 (78.9%) | 395.0 |
| Bachelor's Degree | 4 (21.0%) | 138.0 |
| Graduate Degree | 0 (0.0%) | 0.0 |
| Total | 19 (100.0%) | 148.0 |
Fertility by Education by Marriage Status in Park Crest
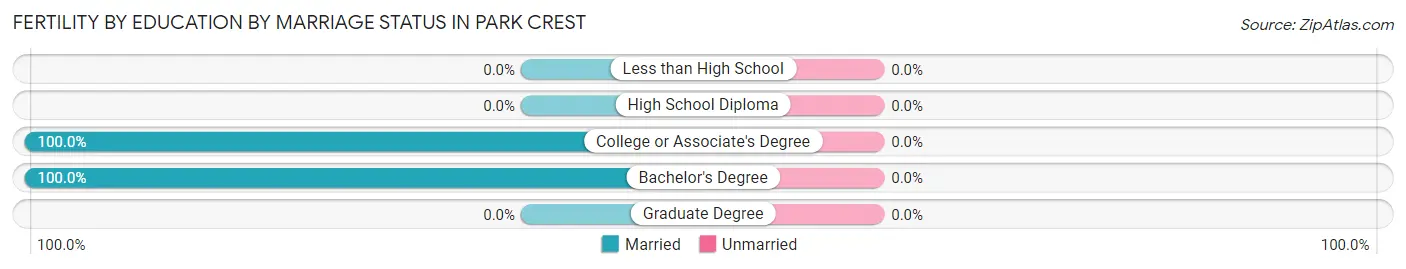
| Educational Attainment | Married | Unmarried |
| Less than High School | 0 (0.0%) | 0 (0.0%) |
| High School Diploma | 0 (0.0%) | 0 (0.0%) |
| College or Associate's Degree | 15 (100.0%) | 0 (0.0%) |
| Bachelor's Degree | 4 (100.0%) | 0 (0.0%) |
| Graduate Degree | 0 (0.0%) | 0 (0.0%) |
| Total | 19 (100.0%) | 0 (0.0%) |
Employment Characteristics in Park Crest
Employment by Class of Employer in Park Crest
Among the 213 employed individuals in Park Crest, private company employees (142 | 66.7%), self-employed (incorporated) (22 | 10.3%), and self-employed (not incorporated) (15 | 7.0%) make up the most common classes of employment.
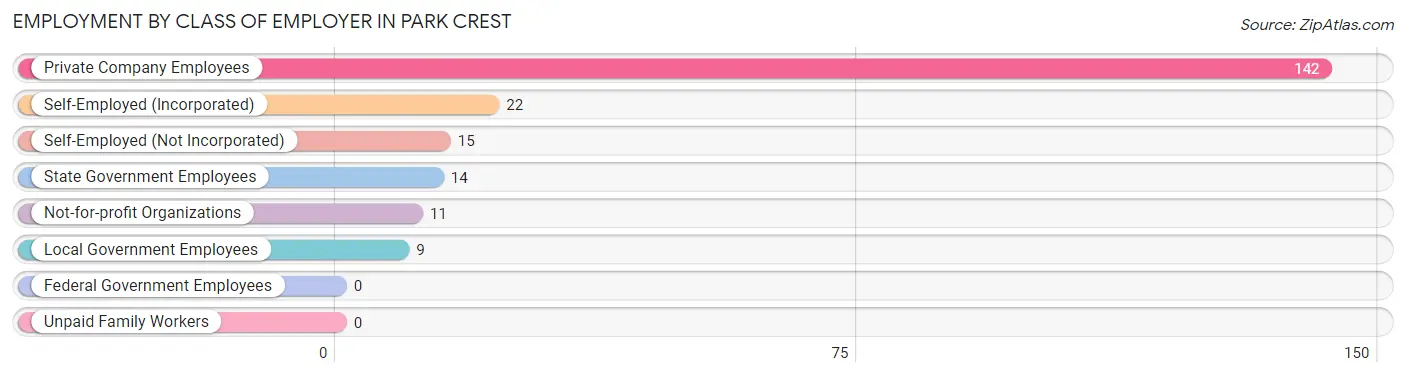
| Employer Class | # Employees | % Employees |
| Private Company Employees | 142 | 66.7% |
| Self-Employed (Incorporated) | 22 | 10.3% |
| Self-Employed (Not Incorporated) | 15 | 7.0% |
| Not-for-profit Organizations | 11 | 5.2% |
| Local Government Employees | 9 | 4.2% |
| State Government Employees | 14 | 6.6% |
| Federal Government Employees | 0 | 0.0% |
| Unpaid Family Workers | 0 | 0.0% |
| Total | 213 | 100.0% |
Employment Status by Age in Park Crest
According to the labor force statistics for Park Crest, out of the total population over 16 years of age (481), 49.9% or 240 individuals are in the labor force, with 7.1% or 17 of them unemployed. The age group with the highest labor force participation rate is 20 to 24 years, with 100.0% or 18 individuals in the labor force. Within the labor force, the 60 to 64 years age range has the highest percentage of unemployed individuals, with 27.8% or 10 of them being unemployed.
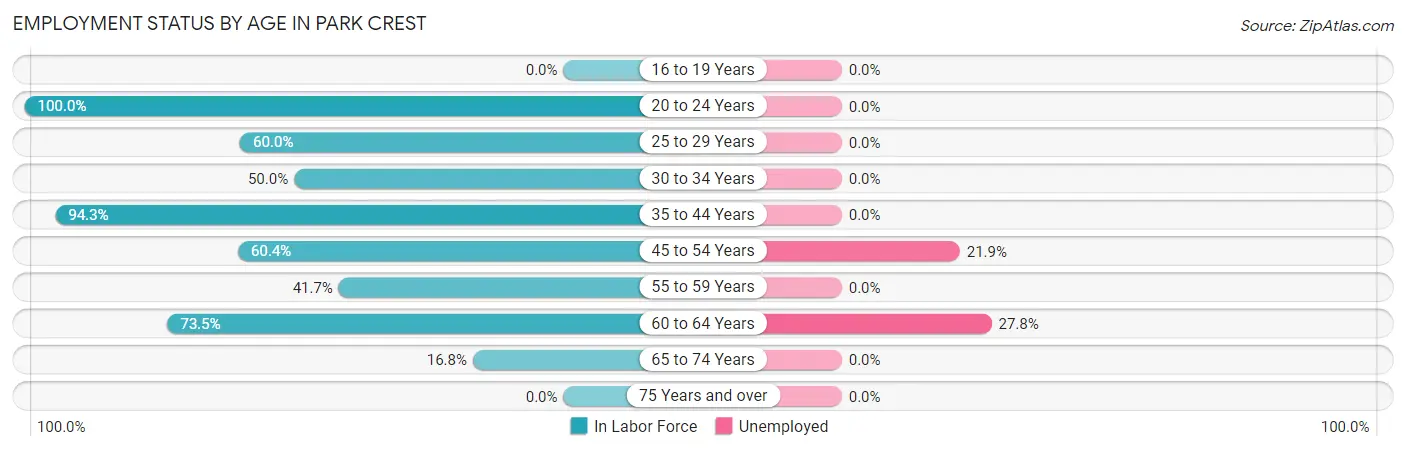
| Age Bracket | In Labor Force | Unemployed |
| 16 to 19 Years | 0 (0.0%) | 0 (0.0%) |
| 20 to 24 Years | 18 (100.0%) | 0 (0.0%) |
| 25 to 29 Years | 15 (60.0%) | 0 (0.0%) |
| 30 to 34 Years | 5 (50.0%) | 0 (0.0%) |
| 35 to 44 Years | 100 (94.3%) | 0 (0.0%) |
| 45 to 54 Years | 32 (60.4%) | 7 (21.9%) |
| 55 to 59 Years | 10 (41.7%) | 0 (0.0%) |
| 60 to 64 Years | 36 (73.5%) | 10 (27.8%) |
| 65 to 74 Years | 24 (16.8%) | 0 (0.0%) |
| 75 Years and over | 0 (0.0%) | 0 (0.0%) |
| Total | 240 (49.9%) | 17 (7.1%) |
Employment Status by Educational Attainment in Park Crest
According to labor force statistics for Park Crest, 74.2% of individuals (198) out of the total population between 25 and 64 years of age (267) are in the labor force, with 8.6% or 17 of them being unemployed. The group with the highest labor force participation rate are those with the educational attainment of bachelor's degree or higher, with 89.1% or 57 individuals in the labor force. Within the labor force, individuals with bachelor's degree or higher education have the highest percentage of unemployment, with 12.3% or 7 of them being unemployed.
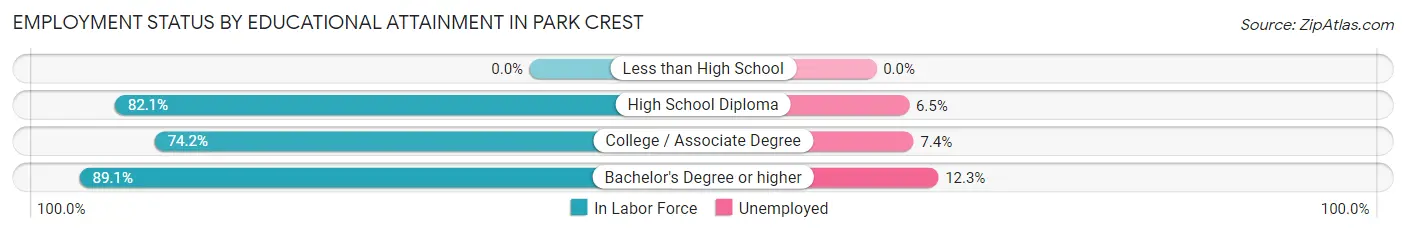
| Educational Attainment | In Labor Force | Unemployed |
| Less than High School | 0 (0.0%) | 0 (0.0%) |
| High School Diploma | 46 (82.1%) | 4 (6.5%) |
| College / Associate Degree | 95 (74.2%) | 9 (7.4%) |
| Bachelor's Degree or higher | 57 (89.1%) | 8 (12.3%) |
| Total | 198 (74.2%) | 23 (8.6%) |
Employment Occupations by Sex in Park Crest
Management, Business, Science and Arts Occupations
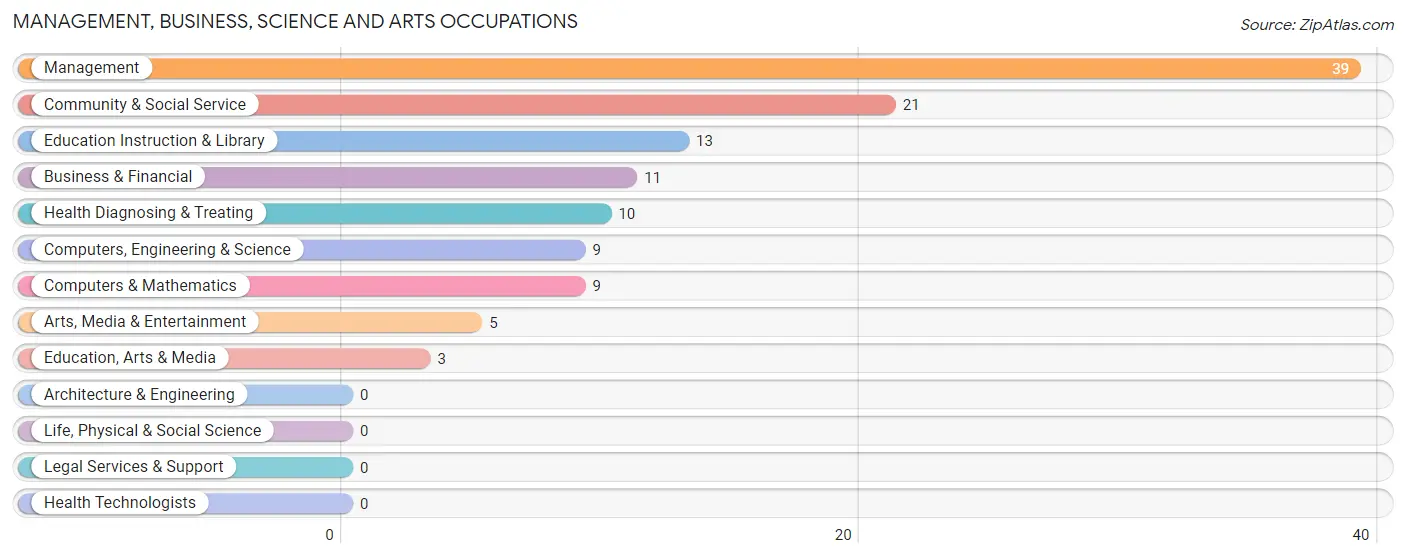
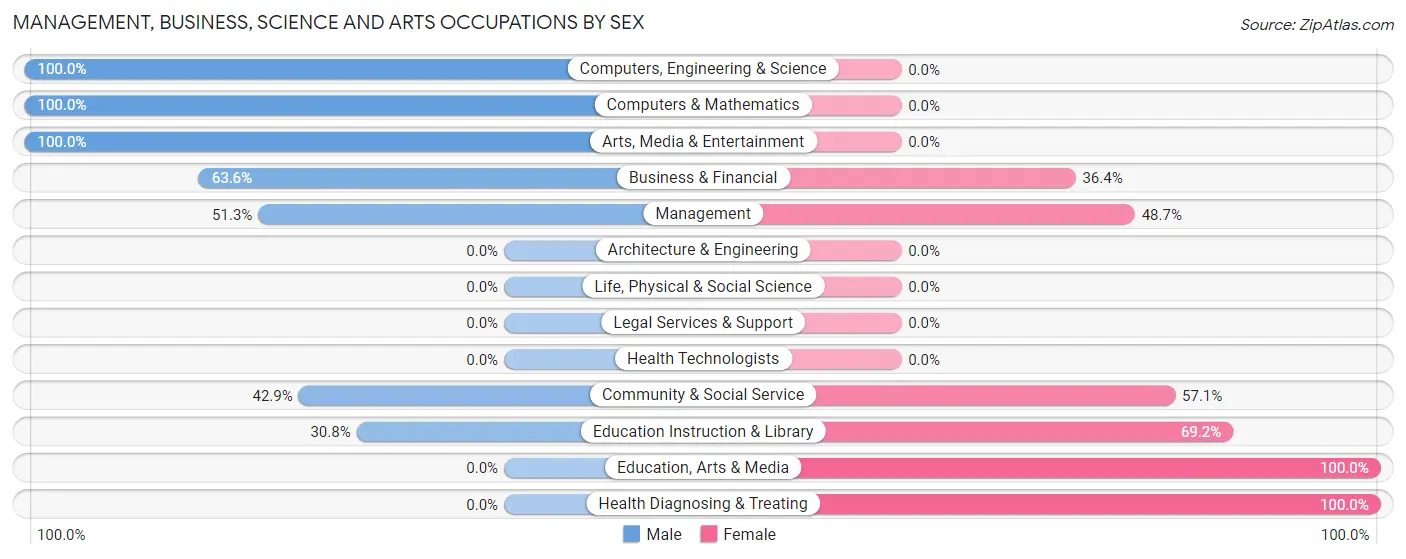
The most common Management, Business, Science and Arts occupations in Park Crest are Management (39 | 17.5%), Community & Social Service (21 | 9.4%), Education Instruction & Library (13 | 5.8%), Business & Financial (11 | 4.9%), and Health Diagnosing & Treating (10 | 4.5%).
Management, Business, Science and Arts Occupations by Sex
Within the Management, Business, Science and Arts occupations in Park Crest, the most male-oriented occupations are Computers, Engineering & Science (100.0%), Computers & Mathematics (100.0%), and Arts, Media & Entertainment (100.0%), while the most female-oriented occupations are Education, Arts & Media (100.0%), Health Diagnosing & Treating (100.0%), and Education Instruction & Library (69.2%).
| Occupation | Male | Female |
| Management | 20 (51.3%) | 19 (48.7%) |
| Business & Financial | 7 (63.6%) | 4 (36.4%) |
| Computers, Engineering & Science | 9 (100.0%) | 0 (0.0%) |
| Computers & Mathematics | 9 (100.0%) | 0 (0.0%) |
| Architecture & Engineering | 0 (0.0%) | 0 (0.0%) |
| Life, Physical & Social Science | 0 (0.0%) | 0 (0.0%) |
| Community & Social Service | 9 (42.9%) | 12 (57.1%) |
| Education, Arts & Media | 0 (0.0%) | 3 (100.0%) |
| Legal Services & Support | 0 (0.0%) | 0 (0.0%) |
| Education Instruction & Library | 4 (30.8%) | 9 (69.2%) |
| Arts, Media & Entertainment | 5 (100.0%) | 0 (0.0%) |
| Health Diagnosing & Treating | 0 (0.0%) | 10 (100.0%) |
| Health Technologists | 0 (0.0%) | 0 (0.0%) |
| Total (Category) | 45 (50.0%) | 45 (50.0%) |
| Total (Overall) | 110 (49.3%) | 113 (50.7%) |
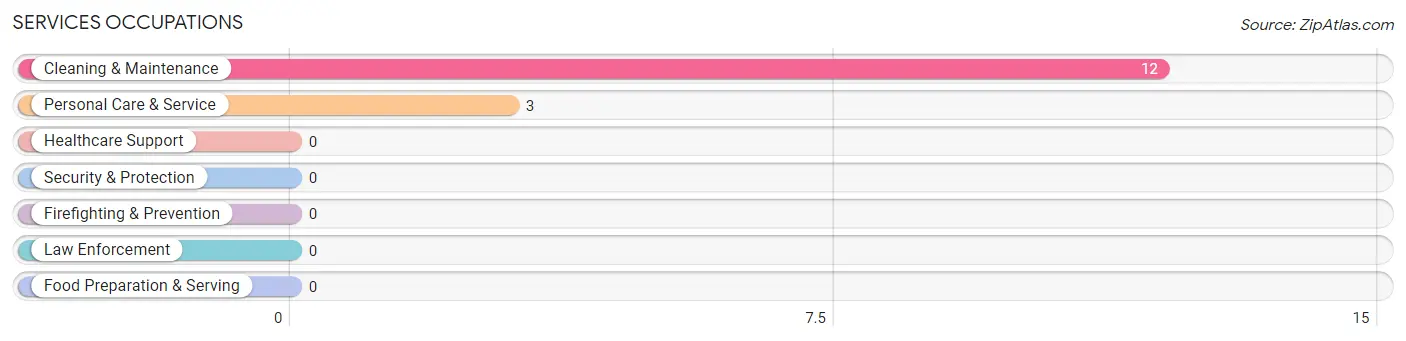
Services Occupations
The most common Services occupations in Park Crest are Cleaning & Maintenance (12 | 5.4%), and Personal Care & Service (3 | 1.3%).
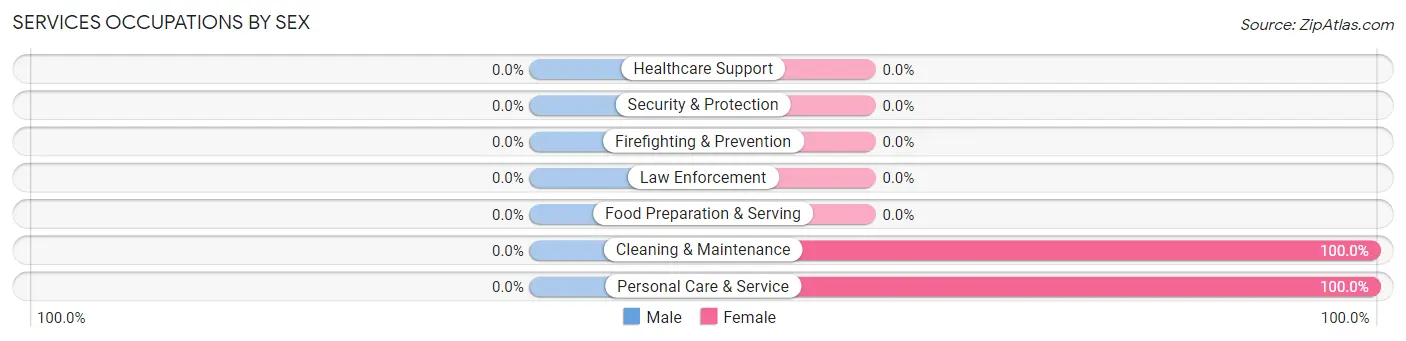
Services Occupations by Sex
| Occupation | Male | Female |
| Healthcare Support | 0 (0.0%) | 0 (0.0%) |
| Security & Protection | 0 (0.0%) | 0 (0.0%) |
| Firefighting & Prevention | 0 (0.0%) | 0 (0.0%) |
| Law Enforcement | 0 (0.0%) | 0 (0.0%) |
| Food Preparation & Serving | 0 (0.0%) | 0 (0.0%) |
| Cleaning & Maintenance | 0 (0.0%) | 12 (100.0%) |
| Personal Care & Service | 0 (0.0%) | 3 (100.0%) |
| Total (Category) | 0 (0.0%) | 15 (100.0%) |
| Total (Overall) | 110 (49.3%) | 113 (50.7%) |
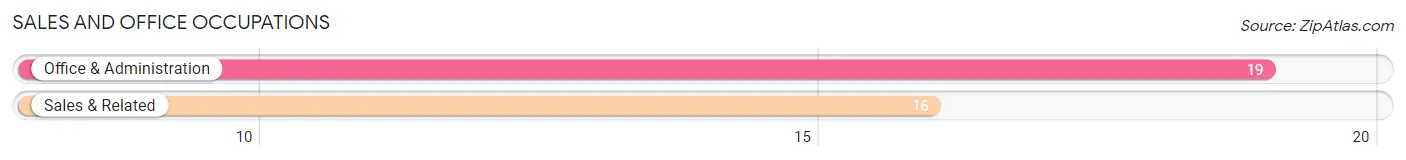
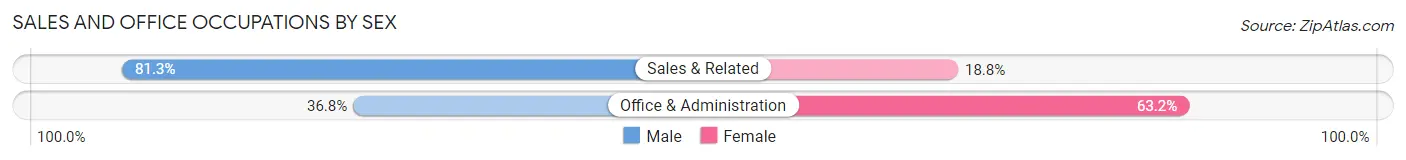
Sales and Office Occupations
The most common Sales and Office occupations in Park Crest are Office & Administration (19 | 8.5%), and Sales & Related (16 | 7.2%).
Sales and Office Occupations by Sex
| Occupation | Male | Female |
| Sales & Related | 13 (81.2%) | 3 (18.8%) |
| Office & Administration | 7 (36.8%) | 12 (63.2%) |
| Total (Category) | 20 (57.1%) | 15 (42.9%) |
| Total (Overall) | 110 (49.3%) | 113 (50.7%) |
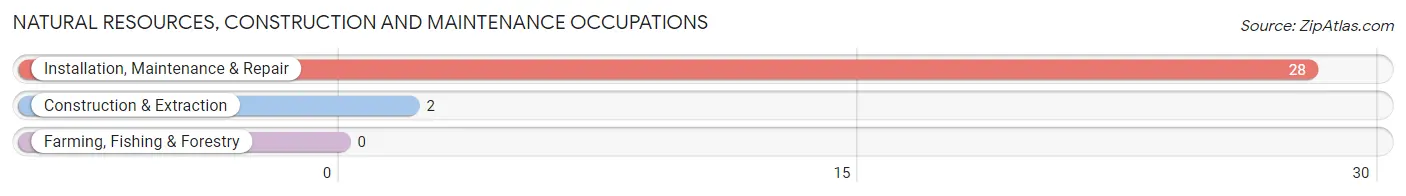
Natural Resources, Construction and Maintenance Occupations
The most common Natural Resources, Construction and Maintenance occupations in Park Crest are Installation, Maintenance & Repair (28 | 12.6%), and Construction & Extraction (2 | 0.9%).
Natural Resources, Construction and Maintenance Occupations by Sex
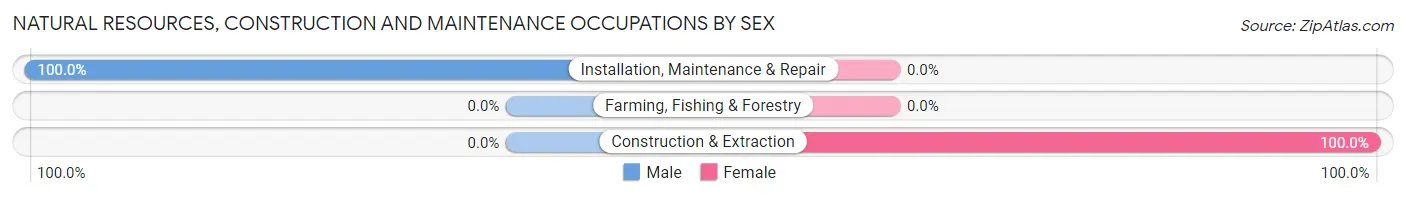
| Occupation | Male | Female |
| Farming, Fishing & Forestry | 0 (0.0%) | 0 (0.0%) |
| Construction & Extraction | 0 (0.0%) | 2 (100.0%) |
| Installation, Maintenance & Repair | 28 (100.0%) | 0 (0.0%) |
| Total (Category) | 28 (93.3%) | 2 (6.7%) |
| Total (Overall) | 110 (49.3%) | 113 (50.7%) |
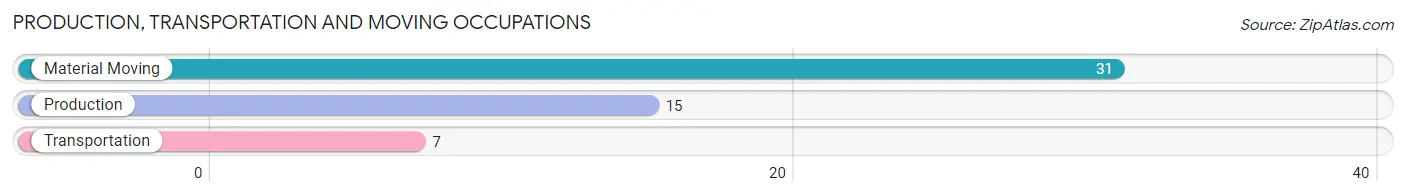
Production, Transportation and Moving Occupations
The most common Production, Transportation and Moving occupations in Park Crest are Material Moving (31 | 13.9%), Production (15 | 6.7%), and Transportation (7 | 3.1%).
Production, Transportation and Moving Occupations by Sex
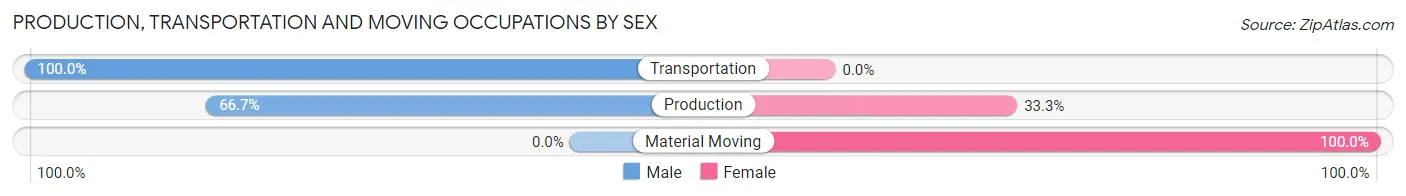
| Occupation | Male | Female |
| Production | 10 (66.7%) | 5 (33.3%) |
| Transportation | 7 (100.0%) | 0 (0.0%) |
| Material Moving | 0 (0.0%) | 31 (100.0%) |
| Total (Category) | 17 (32.1%) | 36 (67.9%) |
| Total (Overall) | 110 (49.3%) | 113 (50.7%) |
Employment Industries by Sex in Park Crest
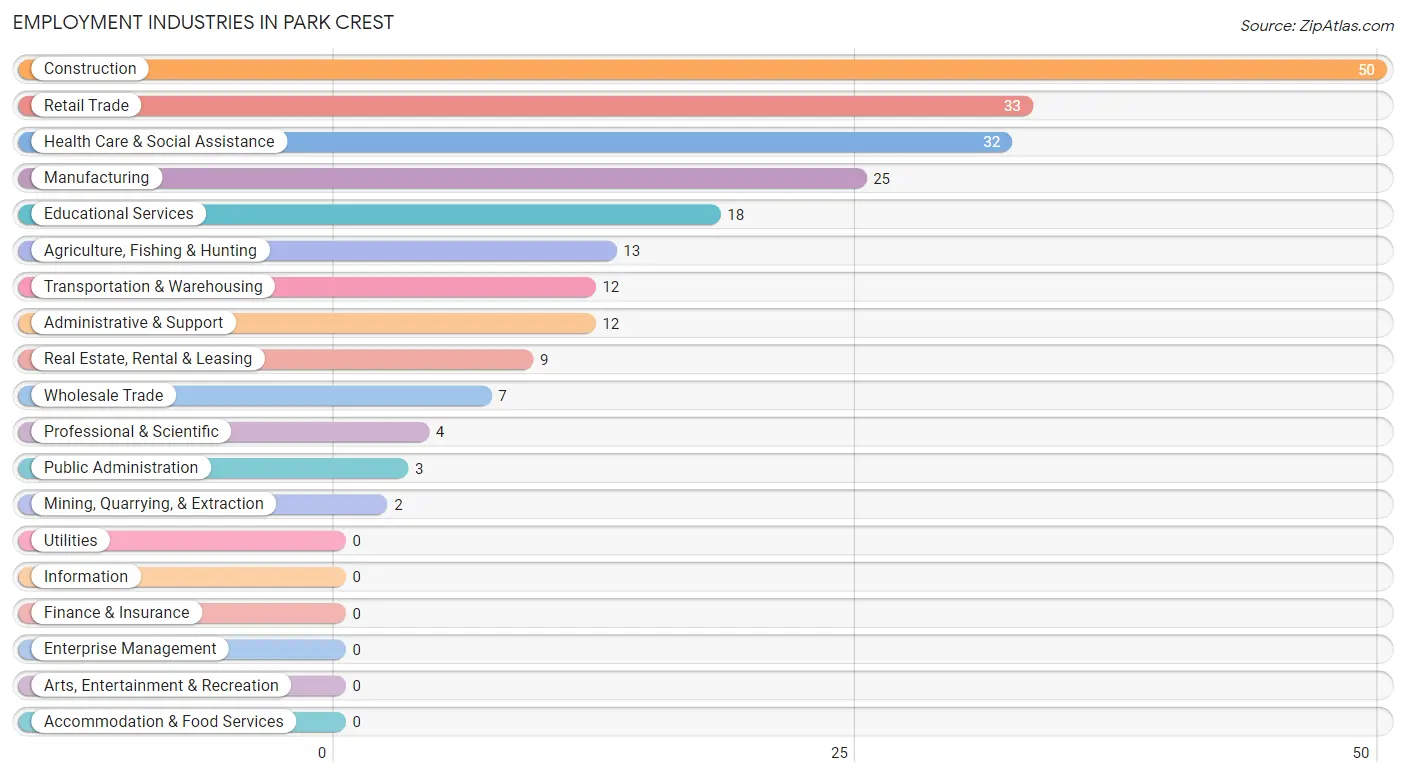
Employment Industries in Park Crest
The major employment industries in Park Crest include Construction (50 | 22.4%), Retail Trade (33 | 14.8%), Health Care & Social Assistance (32 | 14.3%), Manufacturing (25 | 11.2%), and Educational Services (18 | 8.1%).
Employment Industries by Sex in Park Crest
The Park Crest industries that see more men than women are Agriculture, Fishing & Hunting (100.0%), Wholesale Trade (100.0%), and Real Estate, Rental & Leasing (100.0%), whereas the industries that tend to have a higher number of women are Mining, Quarrying, & Extraction (100.0%), Transportation & Warehousing (100.0%), and Professional & Scientific (100.0%).
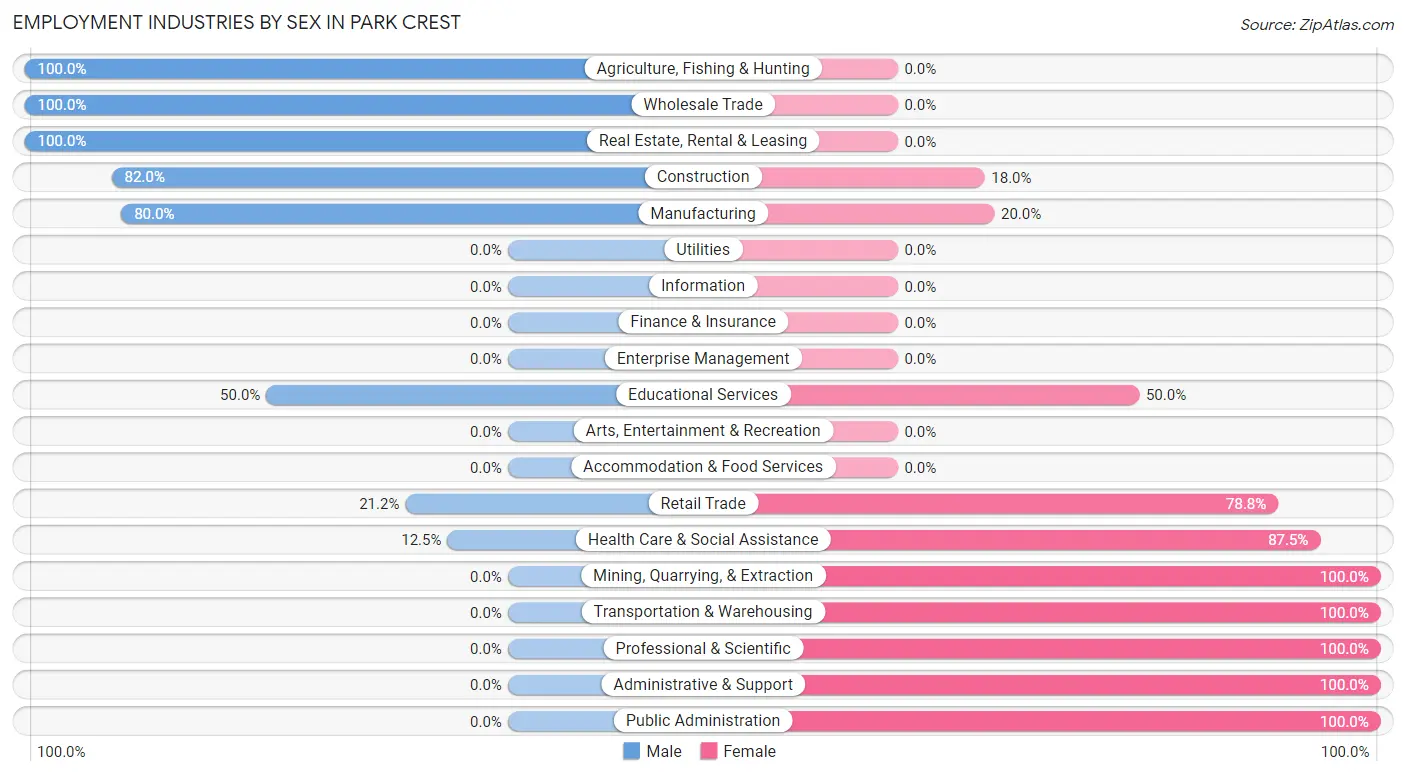
| Industry | Male | Female |
| Agriculture, Fishing & Hunting | 13 (100.0%) | 0 (0.0%) |
| Mining, Quarrying, & Extraction | 0 (0.0%) | 2 (100.0%) |
| Construction | 41 (82.0%) | 9 (18.0%) |
| Manufacturing | 20 (80.0%) | 5 (20.0%) |
| Wholesale Trade | 7 (100.0%) | 0 (0.0%) |
| Retail Trade | 7 (21.2%) | 26 (78.8%) |
| Transportation & Warehousing | 0 (0.0%) | 12 (100.0%) |
| Utilities | 0 (0.0%) | 0 (0.0%) |
| Information | 0 (0.0%) | 0 (0.0%) |
| Finance & Insurance | 0 (0.0%) | 0 (0.0%) |
| Real Estate, Rental & Leasing | 9 (100.0%) | 0 (0.0%) |
| Professional & Scientific | 0 (0.0%) | 4 (100.0%) |
| Enterprise Management | 0 (0.0%) | 0 (0.0%) |
| Administrative & Support | 0 (0.0%) | 12 (100.0%) |
| Educational Services | 9 (50.0%) | 9 (50.0%) |
| Health Care & Social Assistance | 4 (12.5%) | 28 (87.5%) |
| Arts, Entertainment & Recreation | 0 (0.0%) | 0 (0.0%) |
| Accommodation & Food Services | 0 (0.0%) | 0 (0.0%) |
| Public Administration | 0 (0.0%) | 3 (100.0%) |
| Total | 110 (49.3%) | 113 (50.7%) |
Education in Park Crest
School Enrollment in Park Crest
The most common levels of schooling among the 97 students in Park Crest are elementary school (36 | 37.1%), middle school (27 | 27.8%), and high school (22 | 22.7%).
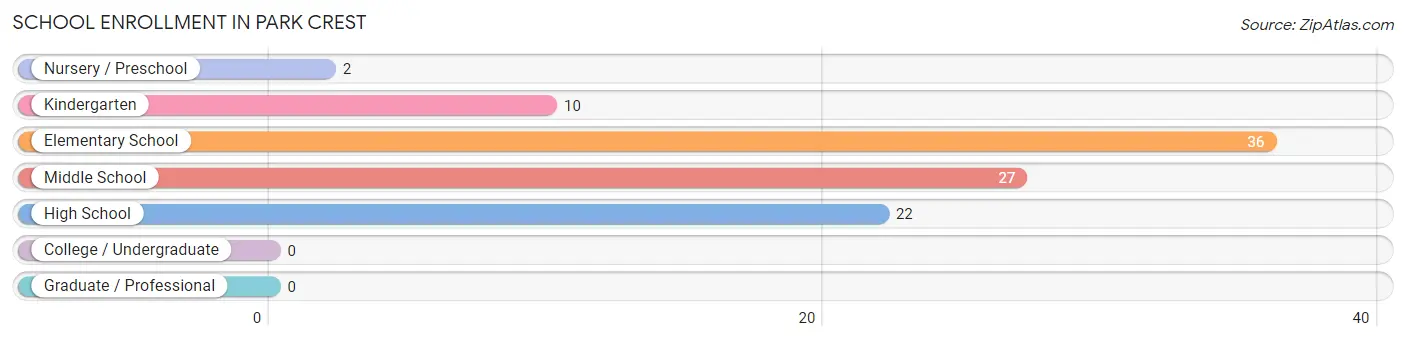
| School Level | # Students | % Students |
| Nursery / Preschool | 2 | 2.1% |
| Kindergarten | 10 | 10.3% |
| Elementary School | 36 | 37.1% |
| Middle School | 27 | 27.8% |
| High School | 22 | 22.7% |
| College / Undergraduate | 0 | 0.0% |
| Graduate / Professional | 0 | 0.0% |
| Total | 97 | 100.0% |
School Enrollment by Age by Funding Source in Park Crest
Out of a total of 97 students who are enrolled in schools in Park Crest, 30 (30.9%) attend a private institution, while the remaining 67 (69.1%) are enrolled in public schools. The age group of 5 to 9 year old has the highest likelihood of being enrolled in private schools, with 13 (54.2% in the age bracket) enrolled. Conversely, the age group of 3 to 4 year olds has the lowest likelihood of being enrolled in a private school, with 12 (100.0% in the age bracket) attending a public institution.
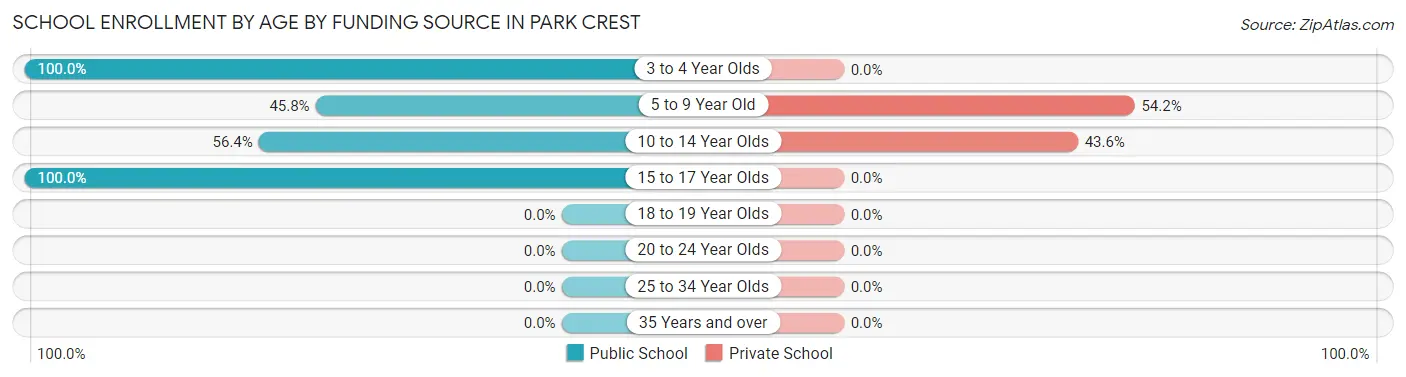
| Age Bracket | Public School | Private School |
| 3 to 4 Year Olds | 12 (100.0%) | 0 (0.0%) |
| 5 to 9 Year Old | 11 (45.8%) | 13 (54.2%) |
| 10 to 14 Year Olds | 22 (56.4%) | 17 (43.6%) |
| 15 to 17 Year Olds | 22 (100.0%) | 0 (0.0%) |
| 18 to 19 Year Olds | 0 (0.0%) | 0 (0.0%) |
| 20 to 24 Year Olds | 0 (0.0%) | 0 (0.0%) |
| 25 to 34 Year Olds | 0 (0.0%) | 0 (0.0%) |
| 35 Years and over | 0 (0.0%) | 0 (0.0%) |
| Total | 67 (69.1%) | 30 (30.9%) |
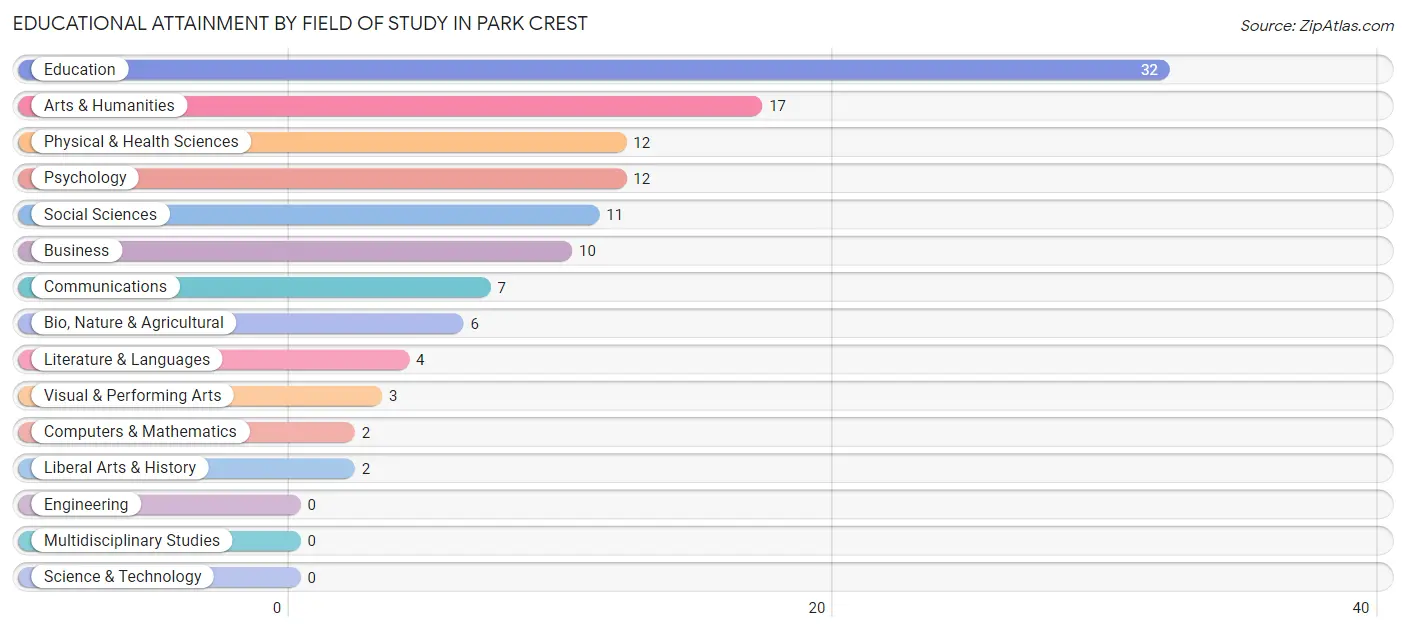
Educational Attainment by Field of Study in Park Crest
Education (32 | 27.1%), arts & humanities (17 | 14.4%), physical & health sciences (12 | 10.2%), psychology (12 | 10.2%), and social sciences (11 | 9.3%) are the most common fields of study among 118 individuals in Park Crest who have obtained a bachelor's degree or higher.
| Field of Study | # Graduates | % Graduates |
| Computers & Mathematics | 2 | 1.7% |
| Bio, Nature & Agricultural | 6 | 5.1% |
| Physical & Health Sciences | 12 | 10.2% |
| Psychology | 12 | 10.2% |
| Social Sciences | 11 | 9.3% |
| Engineering | 0 | 0.0% |
| Multidisciplinary Studies | 0 | 0.0% |
| Science & Technology | 0 | 0.0% |
| Business | 10 | 8.5% |
| Education | 32 | 27.1% |
| Literature & Languages | 4 | 3.4% |
| Liberal Arts & History | 2 | 1.7% |
| Visual & Performing Arts | 3 | 2.5% |
| Communications | 7 | 5.9% |
| Arts & Humanities | 17 | 14.4% |
| Total | 118 | 100.0% |
Transportation & Commute in Park Crest
Vehicle Availability by Sex in Park Crest
The most prevalent vehicle ownership categories in Park Crest are males with 2 vehicles (71, accounting for 64.5%) and females with 2 vehicles (66, making up 68.9%).
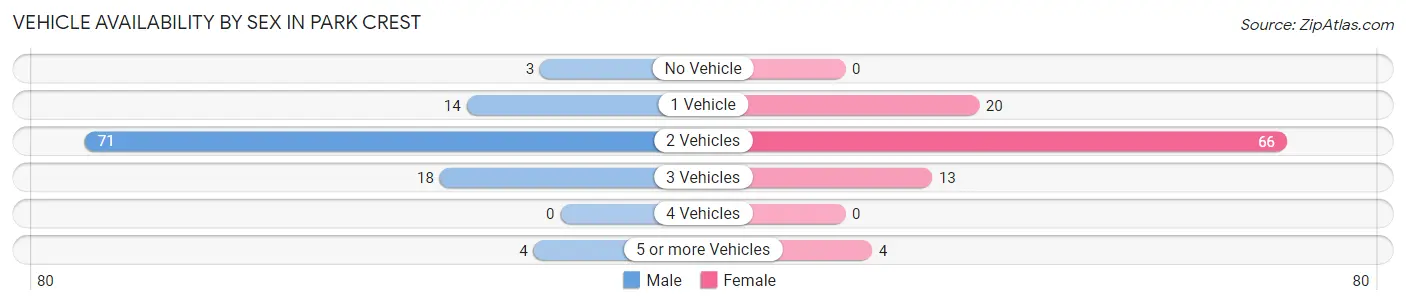
| Vehicles Available | Male | Female |
| No Vehicle | 3 (2.7%) | 0 (0.0%) |
| 1 Vehicle | 14 (12.7%) | 20 (19.4%) |
| 2 Vehicles | 71 (64.5%) | 66 (64.1%) |
| 3 Vehicles | 18 (16.4%) | 13 (12.6%) |
| 4 Vehicles | 0 (0.0%) | 0 (0.0%) |
| 5 or more Vehicles | 4 (3.6%) | 4 (3.9%) |
| Total | 110 (100.0%) | 103 (100.0%) |
Commute Time in Park Crest
The most frequently occuring commute durations in Park Crest are 20 to 24 minutes (74 commuters, 36.8%), 15 to 19 minutes (25 commuters, 12.4%), and 30 to 34 minutes (22 commuters, 11.0%).
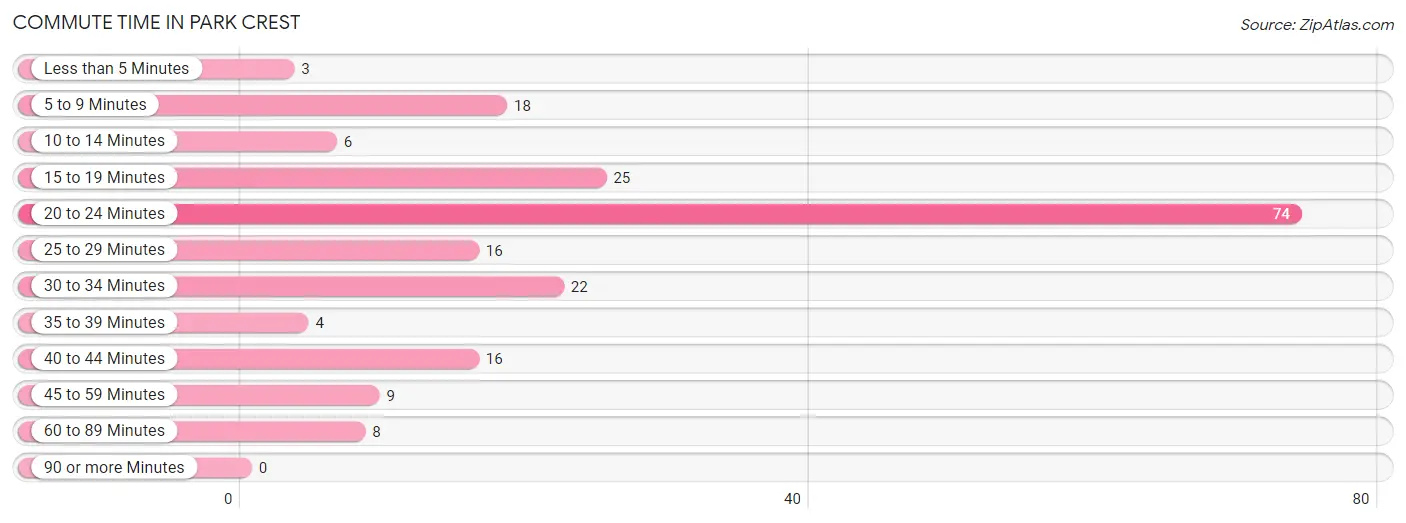
| Commute Time | # Commuters | % Commuters |
| Less than 5 Minutes | 3 | 1.5% |
| 5 to 9 Minutes | 18 | 9.0% |
| 10 to 14 Minutes | 6 | 3.0% |
| 15 to 19 Minutes | 25 | 12.4% |
| 20 to 24 Minutes | 74 | 36.8% |
| 25 to 29 Minutes | 16 | 8.0% |
| 30 to 34 Minutes | 22 | 11.0% |
| 35 to 39 Minutes | 4 | 2.0% |
| 40 to 44 Minutes | 16 | 8.0% |
| 45 to 59 Minutes | 9 | 4.5% |
| 60 to 89 Minutes | 8 | 4.0% |
| 90 or more Minutes | 0 | 0.0% |
Commute Time by Sex in Park Crest
The most common commute times in Park Crest are 20 to 24 minutes (35 commuters, 34.6%) for males and 20 to 24 minutes (39 commuters, 39.0%) for females.
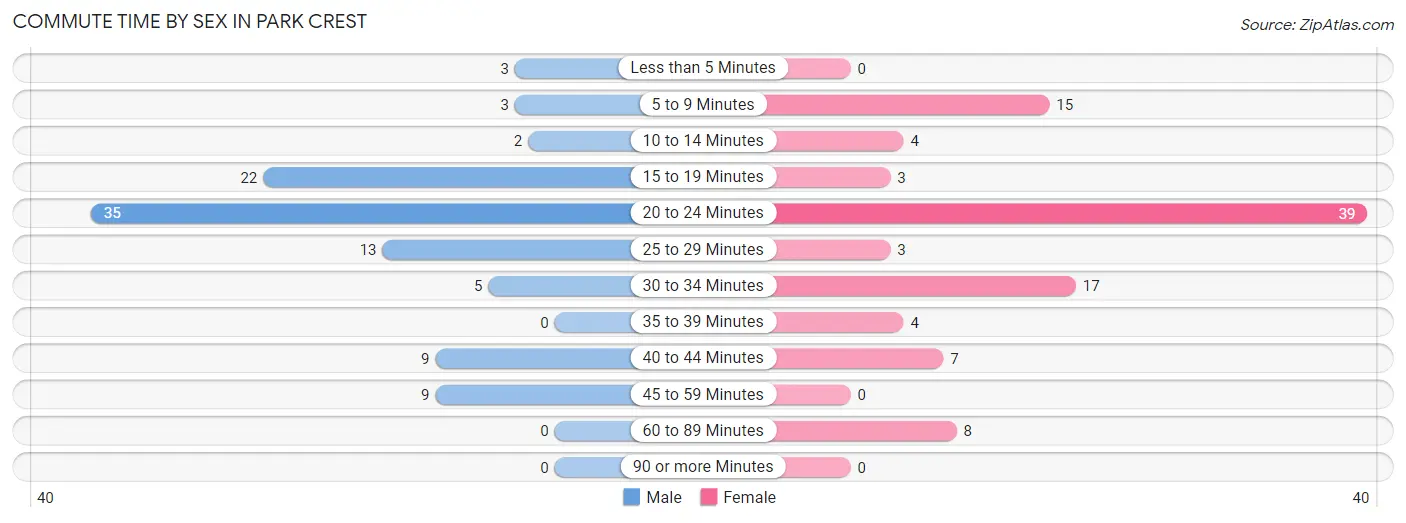
| Commute Time | Male | Female |
| Less than 5 Minutes | 3 (3.0%) | 0 (0.0%) |
| 5 to 9 Minutes | 3 (3.0%) | 15 (15.0%) |
| 10 to 14 Minutes | 2 (2.0%) | 4 (4.0%) |
| 15 to 19 Minutes | 22 (21.8%) | 3 (3.0%) |
| 20 to 24 Minutes | 35 (34.6%) | 39 (39.0%) |
| 25 to 29 Minutes | 13 (12.9%) | 3 (3.0%) |
| 30 to 34 Minutes | 5 (5.0%) | 17 (17.0%) |
| 35 to 39 Minutes | 0 (0.0%) | 4 (4.0%) |
| 40 to 44 Minutes | 9 (8.9%) | 7 (7.0%) |
| 45 to 59 Minutes | 9 (8.9%) | 0 (0.0%) |
| 60 to 89 Minutes | 0 (0.0%) | 8 (8.0%) |
| 90 or more Minutes | 0 (0.0%) | 0 (0.0%) |
Time of Departure to Work by Sex in Park Crest
The most frequent times of departure to work in Park Crest are 6:00 AM to 6:29 AM (35, 34.6%) for males and 5:30 AM to 5:59 AM (24, 24.0%) for females.
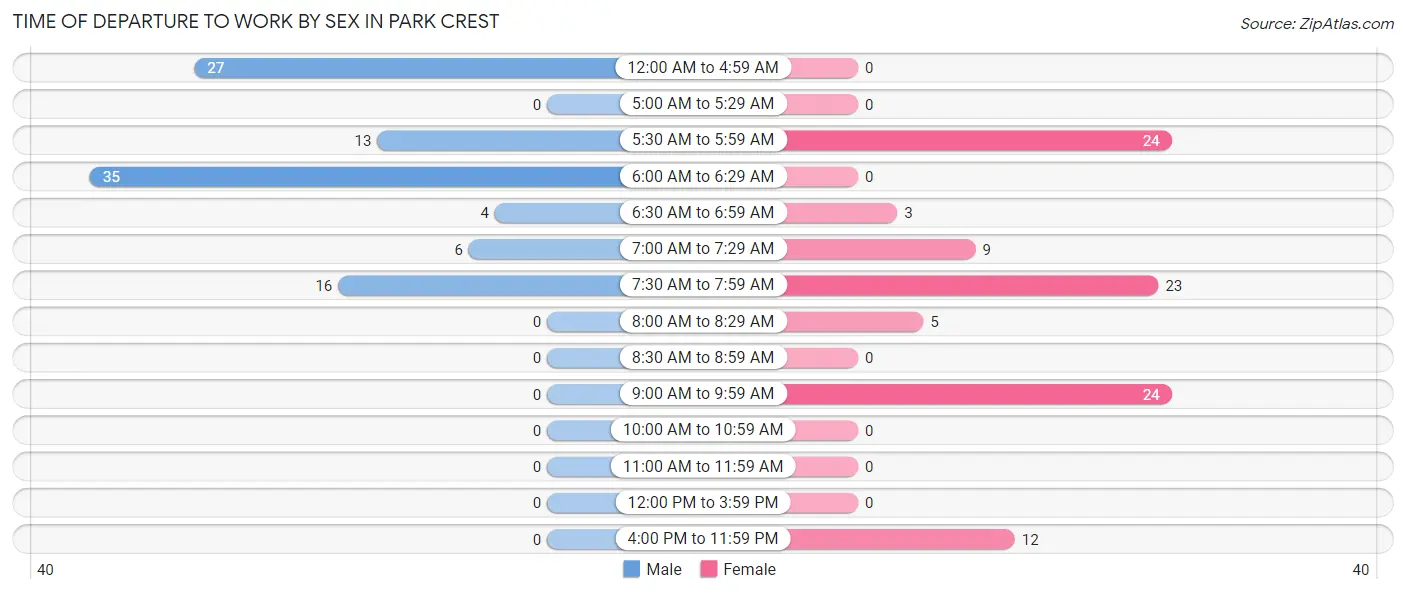
| Time of Departure | Male | Female |
| 12:00 AM to 4:59 AM | 27 (26.7%) | 0 (0.0%) |
| 5:00 AM to 5:29 AM | 0 (0.0%) | 0 (0.0%) |
| 5:30 AM to 5:59 AM | 13 (12.9%) | 24 (24.0%) |
| 6:00 AM to 6:29 AM | 35 (34.6%) | 0 (0.0%) |
| 6:30 AM to 6:59 AM | 4 (4.0%) | 3 (3.0%) |
| 7:00 AM to 7:29 AM | 6 (5.9%) | 9 (9.0%) |
| 7:30 AM to 7:59 AM | 16 (15.8%) | 23 (23.0%) |
| 8:00 AM to 8:29 AM | 0 (0.0%) | 5 (5.0%) |
| 8:30 AM to 8:59 AM | 0 (0.0%) | 0 (0.0%) |
| 9:00 AM to 9:59 AM | 0 (0.0%) | 24 (24.0%) |
| 10:00 AM to 10:59 AM | 0 (0.0%) | 0 (0.0%) |
| 11:00 AM to 11:59 AM | 0 (0.0%) | 0 (0.0%) |
| 12:00 PM to 3:59 PM | 0 (0.0%) | 0 (0.0%) |
| 4:00 PM to 11:59 PM | 0 (0.0%) | 12 (12.0%) |
| Total | 101 (100.0%) | 100 (100.0%) |
Housing Occupancy in Park Crest
Occupancy by Ownership in Park Crest
Of the total 264 dwellings in Park Crest, owner-occupied units account for 249 (94.3%), while renter-occupied units make up 15 (5.7%).
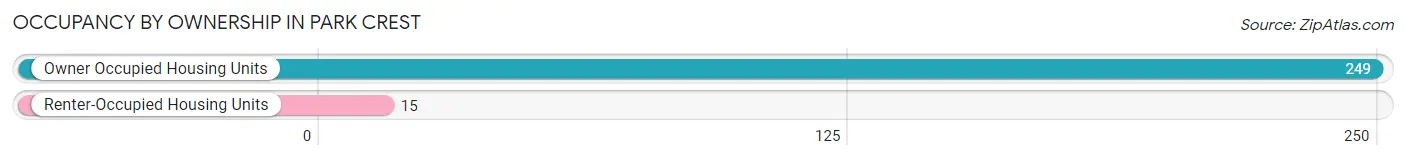
| Occupancy | # Housing Units | % Housing Units |
| Owner Occupied Housing Units | 249 | 94.3% |
| Renter-Occupied Housing Units | 15 | 5.7% |
| Total Occupied Housing Units | 264 | 100.0% |
Occupancy by Household Size in Park Crest
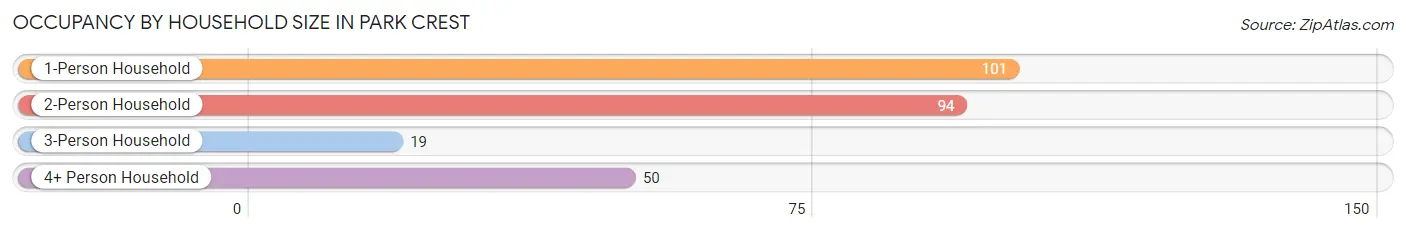
| Household Size | # Housing Units | % Housing Units |
| 1-Person Household | 101 | 38.3% |
| 2-Person Household | 94 | 35.6% |
| 3-Person Household | 19 | 7.2% |
| 4+ Person Household | 50 | 18.9% |
| Total Housing Units | 264 | 100.0% |
Occupancy by Ownership by Household Size in Park Crest
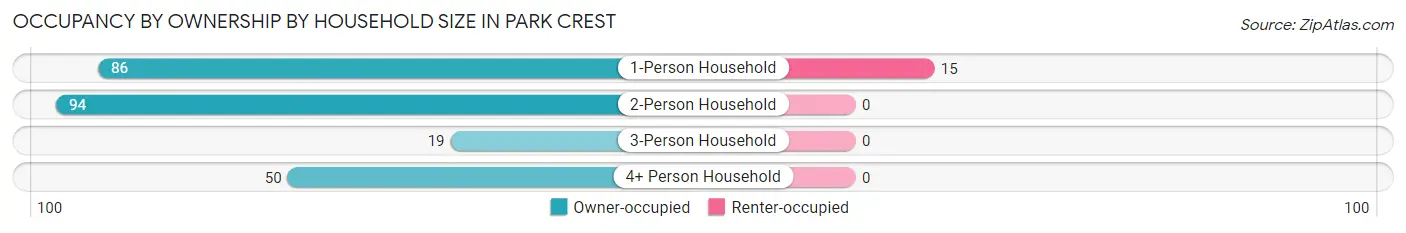
| Household Size | Owner-occupied | Renter-occupied |
| 1-Person Household | 86 (85.2%) | 15 (14.8%) |
| 2-Person Household | 94 (100.0%) | 0 (0.0%) |
| 3-Person Household | 19 (100.0%) | 0 (0.0%) |
| 4+ Person Household | 50 (100.0%) | 0 (0.0%) |
| Total Housing Units | 249 (94.3%) | 15 (5.7%) |
Occupancy by Educational Attainment in Park Crest
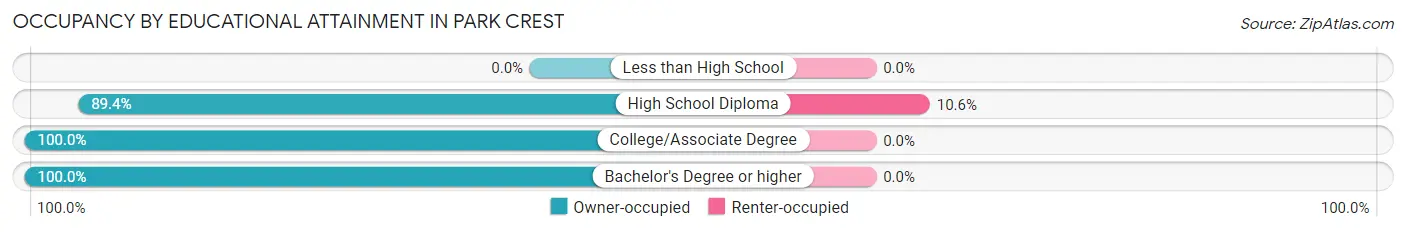
| Household Size | Owner-occupied | Renter-occupied |
| Less than High School | 0 (0.0%) | 0 (0.0%) |
| High School Diploma | 126 (89.4%) | 15 (10.6%) |
| College/Associate Degree | 71 (100.0%) | 0 (0.0%) |
| Bachelor's Degree or higher | 52 (100.0%) | 0 (0.0%) |
Occupancy by Age of Householder in Park Crest
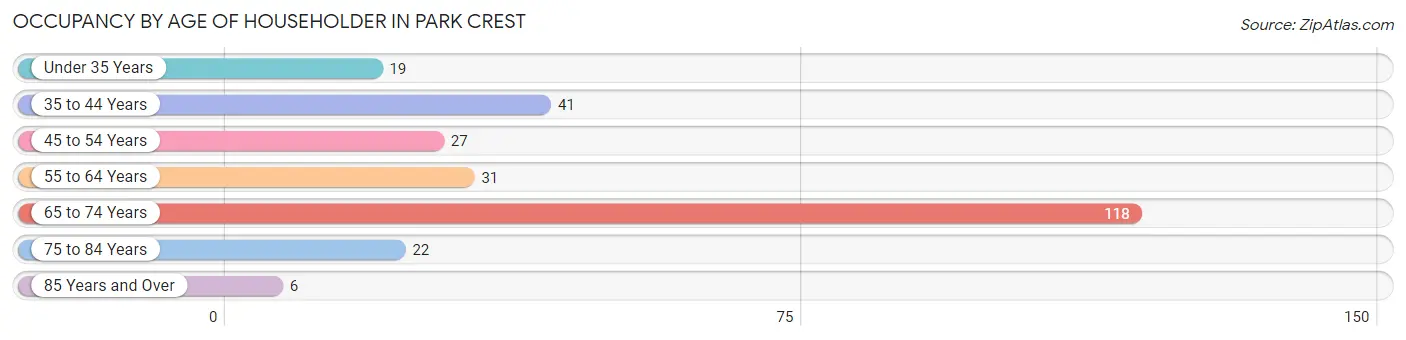
| Age Bracket | # Households | % Households |
| Under 35 Years | 19 | 7.2% |
| 35 to 44 Years | 41 | 15.5% |
| 45 to 54 Years | 27 | 10.2% |
| 55 to 64 Years | 31 | 11.7% |
| 65 to 74 Years | 118 | 44.7% |
| 75 to 84 Years | 22 | 8.3% |
| 85 Years and Over | 6 | 2.3% |
| Total | 264 | 100.0% |
Housing Finances in Park Crest
Median Income by Occupancy in Park Crest
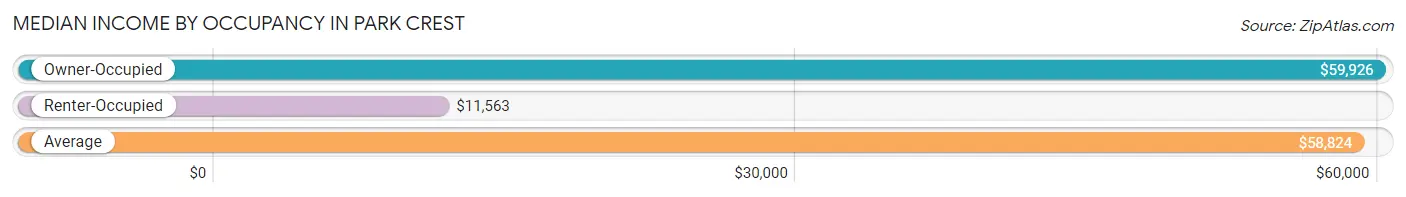
| Occupancy Type | # Households | Median Income |
| Owner-Occupied | 249 (94.3%) | $59,926 |
| Renter-Occupied | 15 (5.7%) | $11,563 |
| Average | 264 (100.0%) | $58,824 |
Occupancy by Householder Income Bracket in Park Crest
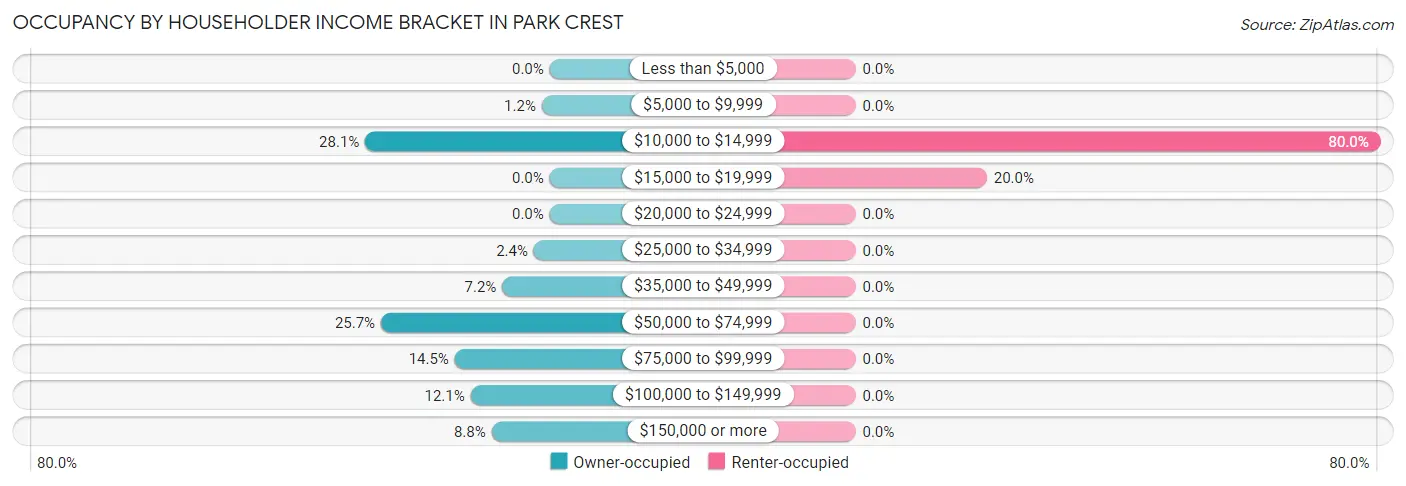
| Income Bracket | Owner-occupied | Renter-occupied |
| Less than $5,000 | 0 (0.0%) | 0 (0.0%) |
| $5,000 to $9,999 | 3 (1.2%) | 0 (0.0%) |
| $10,000 to $14,999 | 70 (28.1%) | 12 (80.0%) |
| $15,000 to $19,999 | 0 (0.0%) | 3 (20.0%) |
| $20,000 to $24,999 | 0 (0.0%) | 0 (0.0%) |
| $25,000 to $34,999 | 6 (2.4%) | 0 (0.0%) |
| $35,000 to $49,999 | 18 (7.2%) | 0 (0.0%) |
| $50,000 to $74,999 | 64 (25.7%) | 0 (0.0%) |
| $75,000 to $99,999 | 36 (14.5%) | 0 (0.0%) |
| $100,000 to $149,999 | 30 (12.0%) | 0 (0.0%) |
| $150,000 or more | 22 (8.8%) | 0 (0.0%) |
| Total | 249 (100.0%) | 15 (100.0%) |
Monthly Housing Cost Tiers in Park Crest
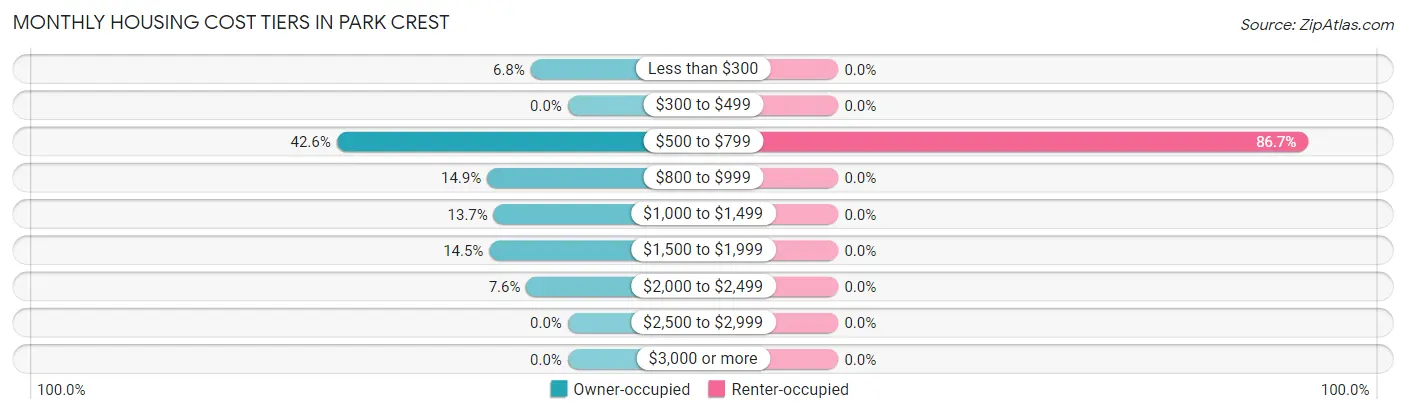
| Monthly Cost | Owner-occupied | Renter-occupied |
| Less than $300 | 17 (6.8%) | 0 (0.0%) |
| $300 to $499 | 0 (0.0%) | 0 (0.0%) |
| $500 to $799 | 106 (42.6%) | 13 (86.7%) |
| $800 to $999 | 37 (14.9%) | 0 (0.0%) |
| $1,000 to $1,499 | 34 (13.7%) | 0 (0.0%) |
| $1,500 to $1,999 | 36 (14.5%) | 0 (0.0%) |
| $2,000 to $2,499 | 19 (7.6%) | 0 (0.0%) |
| $2,500 to $2,999 | 0 (0.0%) | 0 (0.0%) |
| $3,000 or more | 0 (0.0%) | 0 (0.0%) |
| Total | 249 (100.0%) | 15 (100.0%) |
Physical Housing Characteristics in Park Crest
Housing Structures in Park Crest
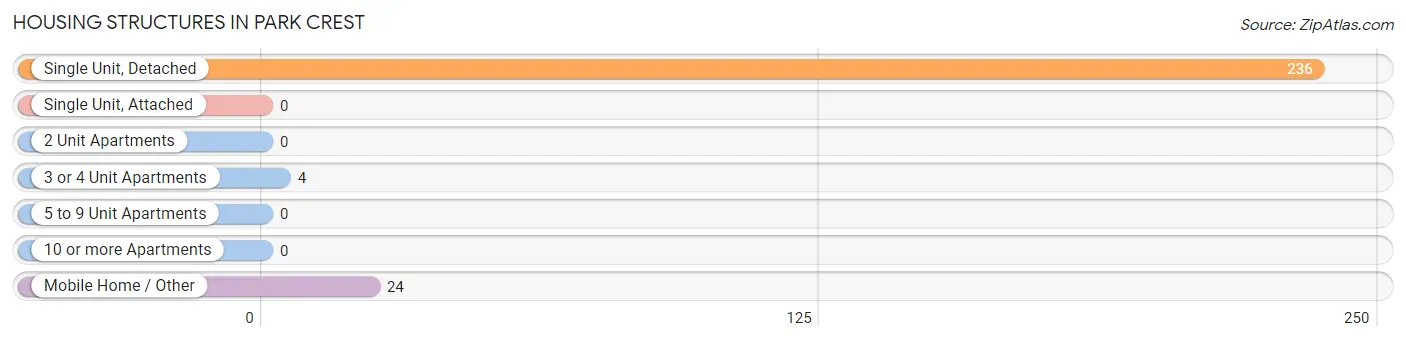
| Structure Type | # Housing Units | % Housing Units |
| Single Unit, Detached | 236 | 89.4% |
| Single Unit, Attached | 0 | 0.0% |
| 2 Unit Apartments | 0 | 0.0% |
| 3 or 4 Unit Apartments | 4 | 1.5% |
| 5 to 9 Unit Apartments | 0 | 0.0% |
| 10 or more Apartments | 0 | 0.0% |
| Mobile Home / Other | 24 | 9.1% |
| Total | 264 | 100.0% |
Housing Structures by Occupancy in Park Crest
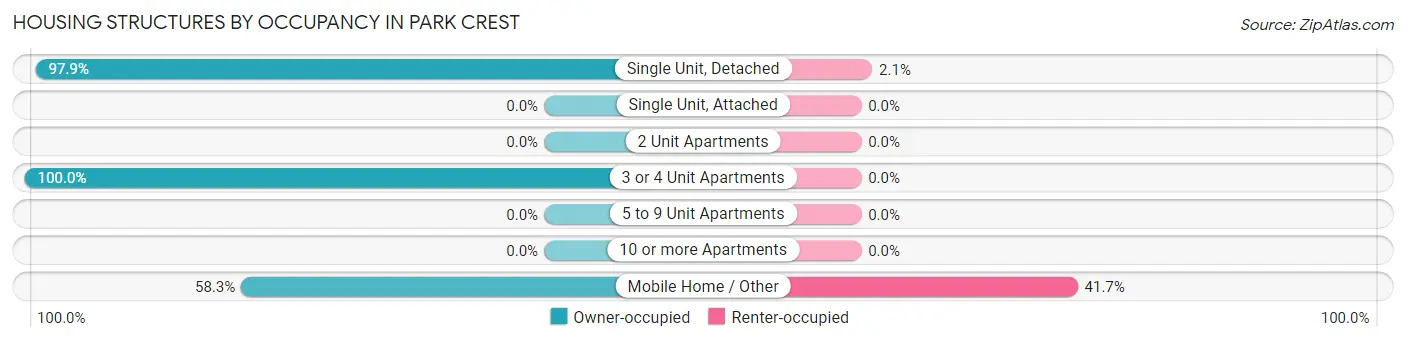
| Structure Type | Owner-occupied | Renter-occupied |
| Single Unit, Detached | 231 (97.9%) | 5 (2.1%) |
| Single Unit, Attached | 0 (0.0%) | 0 (0.0%) |
| 2 Unit Apartments | 0 (0.0%) | 0 (0.0%) |
| 3 or 4 Unit Apartments | 4 (100.0%) | 0 (0.0%) |
| 5 to 9 Unit Apartments | 0 (0.0%) | 0 (0.0%) |
| 10 or more Apartments | 0 (0.0%) | 0 (0.0%) |
| Mobile Home / Other | 14 (58.3%) | 10 (41.7%) |
| Total | 249 (94.3%) | 15 (5.7%) |
Housing Structures by Number of Rooms in Park Crest
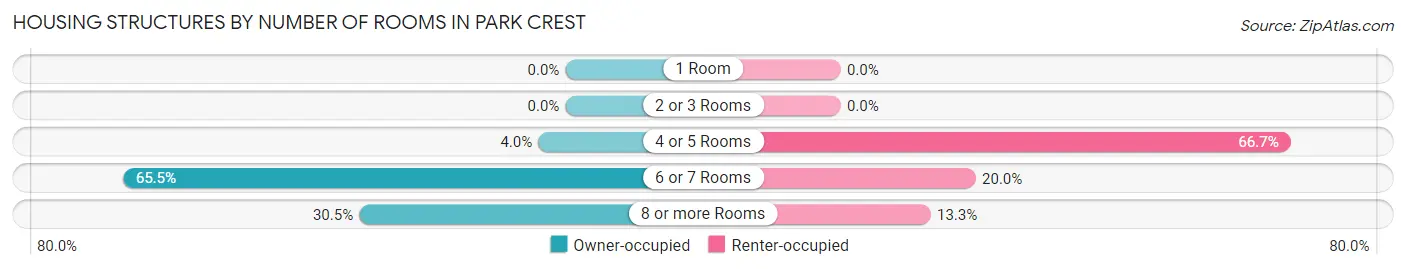
| Number of Rooms | Owner-occupied | Renter-occupied |
| 1 Room | 0 (0.0%) | 0 (0.0%) |
| 2 or 3 Rooms | 0 (0.0%) | 0 (0.0%) |
| 4 or 5 Rooms | 10 (4.0%) | 10 (66.7%) |
| 6 or 7 Rooms | 163 (65.5%) | 3 (20.0%) |
| 8 or more Rooms | 76 (30.5%) | 2 (13.3%) |
| Total | 249 (100.0%) | 15 (100.0%) |
Housing Structure by Heating Type in Park Crest
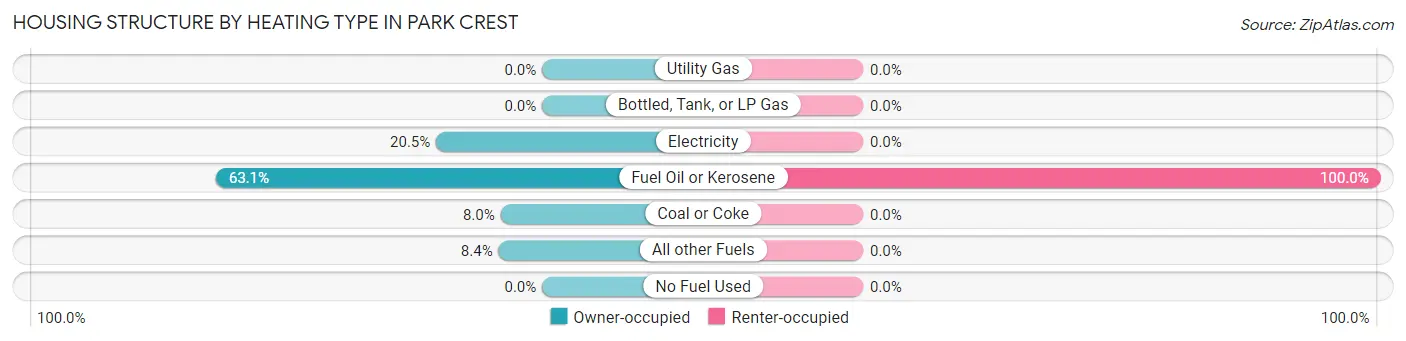
| Heating Type | Owner-occupied | Renter-occupied |
| Utility Gas | 0 (0.0%) | 0 (0.0%) |
| Bottled, Tank, or LP Gas | 0 (0.0%) | 0 (0.0%) |
| Electricity | 51 (20.5%) | 0 (0.0%) |
| Fuel Oil or Kerosene | 157 (63.0%) | 15 (100.0%) |
| Coal or Coke | 20 (8.0%) | 0 (0.0%) |
| All other Fuels | 21 (8.4%) | 0 (0.0%) |
| No Fuel Used | 0 (0.0%) | 0 (0.0%) |
| Total | 249 (100.0%) | 15 (100.0%) |
Household Vehicle Usage in Park Crest
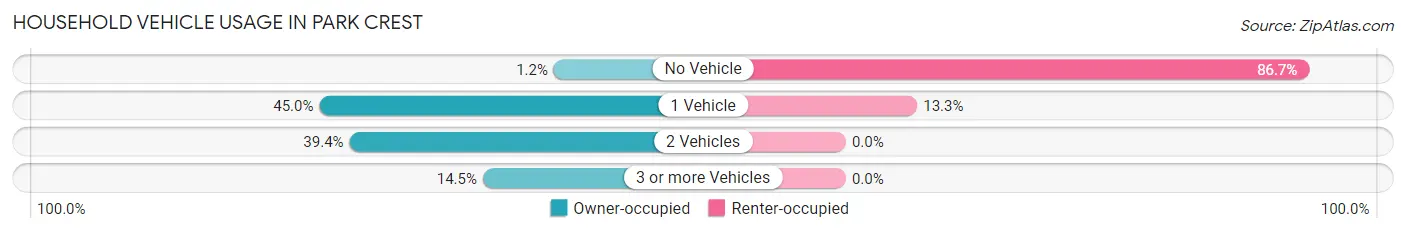
| Vehicles per Household | Owner-occupied | Renter-occupied |
| No Vehicle | 3 (1.2%) | 13 (86.7%) |
| 1 Vehicle | 112 (45.0%) | 2 (13.3%) |
| 2 Vehicles | 98 (39.4%) | 0 (0.0%) |
| 3 or more Vehicles | 36 (14.5%) | 0 (0.0%) |
| Total | 249 (100.0%) | 15 (100.0%) |
Real Estate & Mortgages in Park Crest
Real Estate and Mortgage Overview in Park Crest
| Characteristic | Without Mortgage | With Mortgage |
| Housing Units | 121 | 128 |
| Median Property Value | $170,400 | $187,500 |
| Median Household Income | $59,250 | $9 |
| Monthly Housing Costs | $715 | $0 |
| Real Estate Taxes | $3,321 | $3 |
Property Value by Mortgage Status in Park Crest
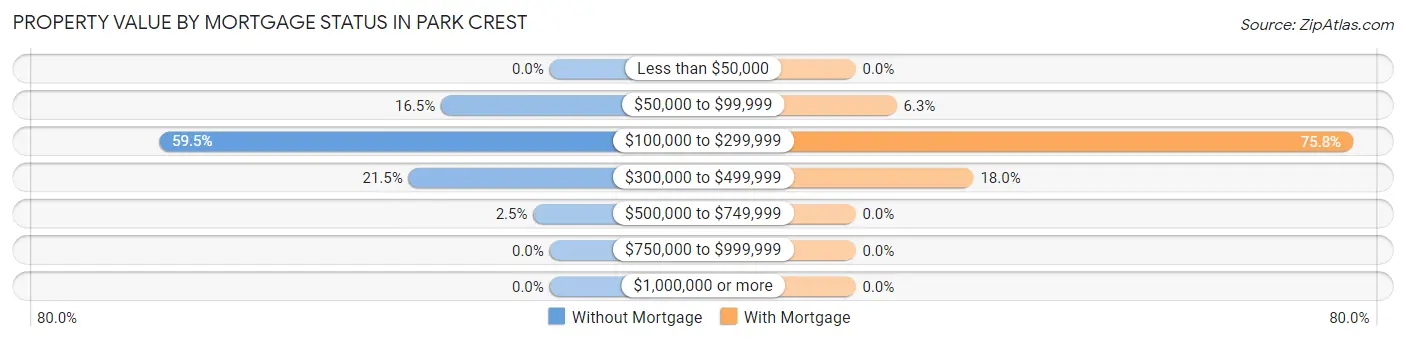
| Property Value | Without Mortgage | With Mortgage |
| Less than $50,000 | 0 (0.0%) | 0 (0.0%) |
| $50,000 to $99,999 | 20 (16.5%) | 8 (6.2%) |
| $100,000 to $299,999 | 72 (59.5%) | 97 (75.8%) |
| $300,000 to $499,999 | 26 (21.5%) | 23 (18.0%) |
| $500,000 to $749,999 | 3 (2.5%) | 0 (0.0%) |
| $750,000 to $999,999 | 0 (0.0%) | 0 (0.0%) |
| $1,000,000 or more | 0 (0.0%) | 0 (0.0%) |
| Total | 121 (100.0%) | 128 (100.0%) |
Household Income by Mortgage Status in Park Crest
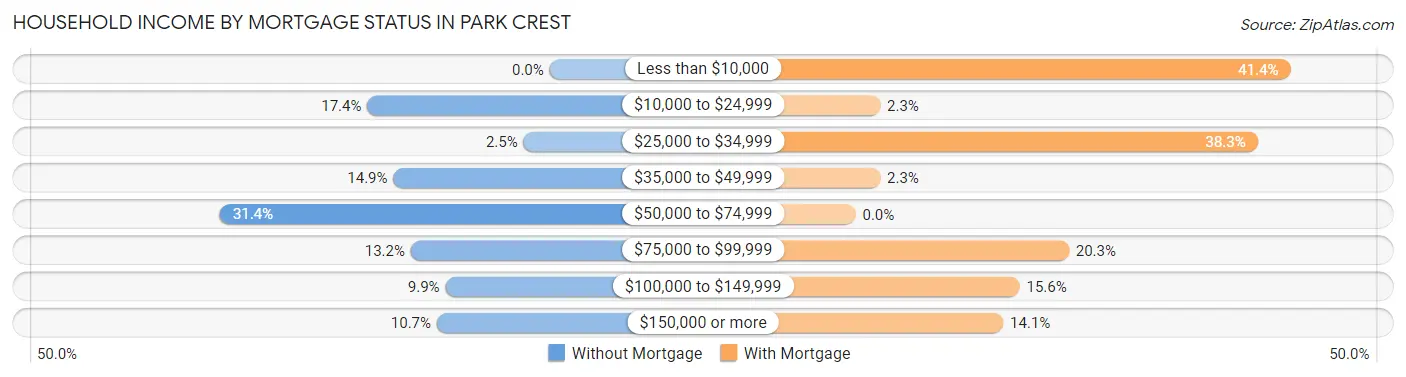
| Household Income | Without Mortgage | With Mortgage |
| Less than $10,000 | 0 (0.0%) | 53 (41.4%) |
| $10,000 to $24,999 | 21 (17.4%) | 3 (2.3%) |
| $25,000 to $34,999 | 3 (2.5%) | 49 (38.3%) |
| $35,000 to $49,999 | 18 (14.9%) | 3 (2.3%) |
| $50,000 to $74,999 | 38 (31.4%) | 0 (0.0%) |
| $75,000 to $99,999 | 16 (13.2%) | 26 (20.3%) |
| $100,000 to $149,999 | 12 (9.9%) | 20 (15.6%) |
| $150,000 or more | 13 (10.7%) | 18 (14.1%) |
| Total | 121 (100.0%) | 128 (100.0%) |
Property Value to Household Income Ratio in Park Crest
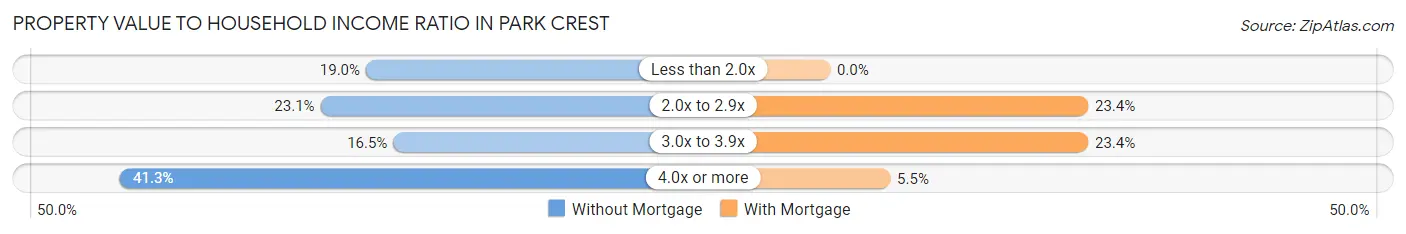
| Value-to-Income Ratio | Without Mortgage | With Mortgage |
| Less than 2.0x | 23 (19.0%) | 0 (0.0%) |
| 2.0x to 2.9x | 28 (23.1%) | 30 (23.4%) |
| 3.0x to 3.9x | 20 (16.5%) | 30 (23.4%) |
| 4.0x or more | 50 (41.3%) | 7 (5.5%) |
| Total | 121 (100.0%) | 128 (100.0%) |
Real Estate Taxes by Mortgage Status in Park Crest
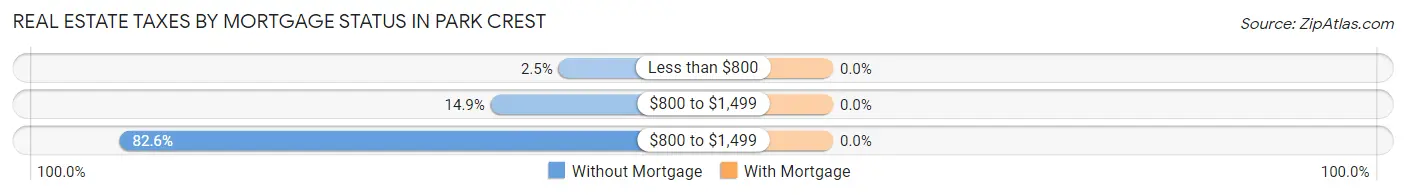
| Property Taxes | Without Mortgage | With Mortgage |
| Less than $800 | 3 (2.5%) | 0 (0.0%) |
| $800 to $1,499 | 18 (14.9%) | 0 (0.0%) |
| $800 to $1,499 | 100 (82.6%) | 0 (0.0%) |
| Total | 121 (100.0%) | 128 (100.0%) |
Health & Disability in Park Crest
Health Insurance Coverage by Age in Park Crest
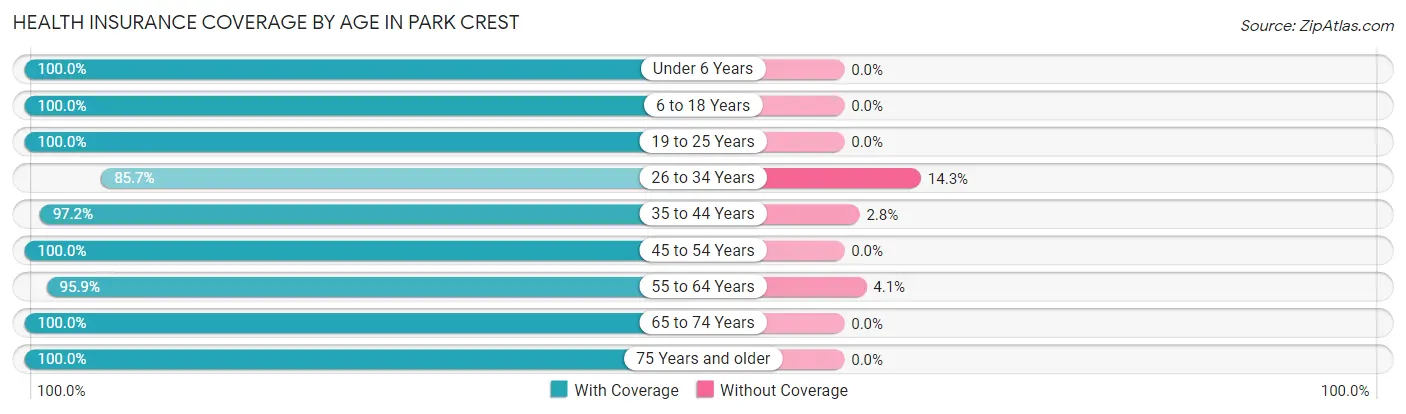
| Age Bracket | With Coverage | Without Coverage |
| Under 6 Years | 22 (100.0%) | 0 (0.0%) |
| 6 to 18 Years | 85 (100.0%) | 0 (0.0%) |
| 19 to 25 Years | 18 (100.0%) | 0 (0.0%) |
| 26 to 34 Years | 30 (85.7%) | 5 (14.3%) |
| 35 to 44 Years | 103 (97.2%) | 3 (2.8%) |
| 45 to 54 Years | 53 (100.0%) | 0 (0.0%) |
| 55 to 64 Years | 70 (95.9%) | 3 (4.1%) |
| 65 to 74 Years | 143 (100.0%) | 0 (0.0%) |
| 75 Years and older | 48 (100.0%) | 0 (0.0%) |
| Total | 572 (98.1%) | 11 (1.9%) |
Health Insurance Coverage by Citizenship Status in Park Crest
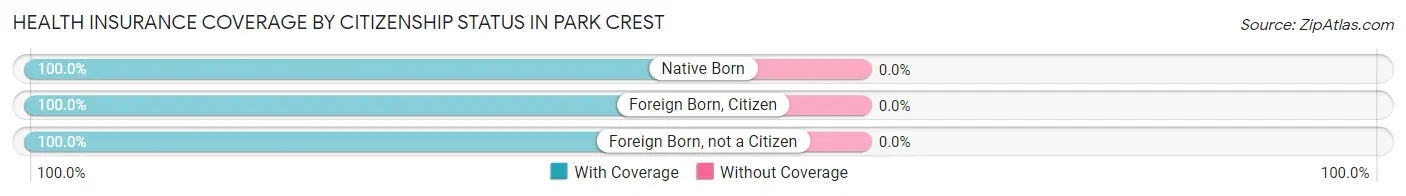
| Citizenship Status | With Coverage | Without Coverage |
| Native Born | 22 (100.0%) | 0 (0.0%) |
| Foreign Born, Citizen | 85 (100.0%) | 0 (0.0%) |
| Foreign Born, not a Citizen | 18 (100.0%) | 0 (0.0%) |
Health Insurance Coverage by Household Income in Park Crest
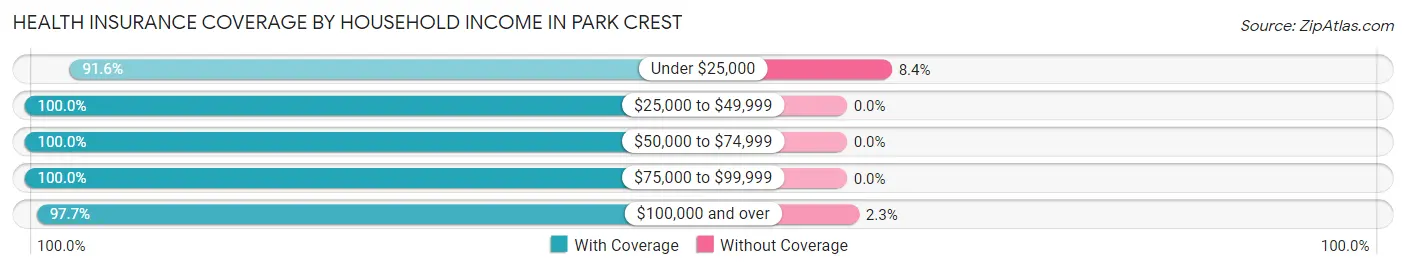
| Household Income | With Coverage | Without Coverage |
| Under $25,000 | 87 (91.6%) | 8 (8.4%) |
| $25,000 to $49,999 | 96 (100.0%) | 0 (0.0%) |
| $50,000 to $74,999 | 178 (100.0%) | 0 (0.0%) |
| $75,000 to $99,999 | 82 (100.0%) | 0 (0.0%) |
| $100,000 and over | 129 (97.7%) | 3 (2.3%) |
Public vs Private Health Insurance Coverage by Age in Park Crest
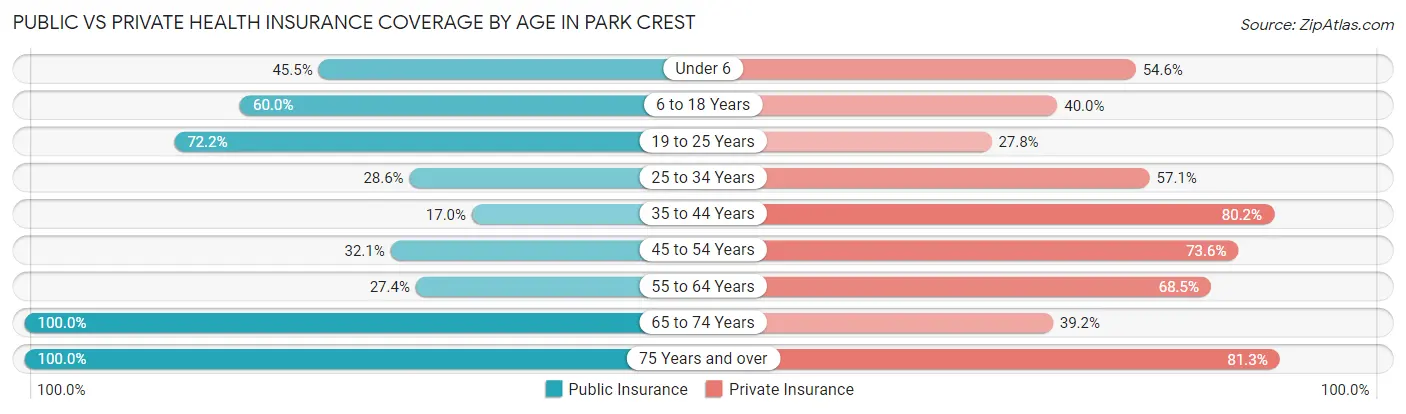
| Age Bracket | Public Insurance | Private Insurance |
| Under 6 | 10 (45.5%) | 12 (54.5%) |
| 6 to 18 Years | 51 (60.0%) | 34 (40.0%) |
| 19 to 25 Years | 13 (72.2%) | 5 (27.8%) |
| 25 to 34 Years | 10 (28.6%) | 20 (57.1%) |
| 35 to 44 Years | 18 (17.0%) | 85 (80.2%) |
| 45 to 54 Years | 17 (32.1%) | 39 (73.6%) |
| 55 to 64 Years | 20 (27.4%) | 50 (68.5%) |
| 65 to 74 Years | 143 (100.0%) | 56 (39.2%) |
| 75 Years and over | 48 (100.0%) | 39 (81.2%) |
| Total | 330 (56.6%) | 340 (58.3%) |
Disability Status by Sex by Age in Park Crest
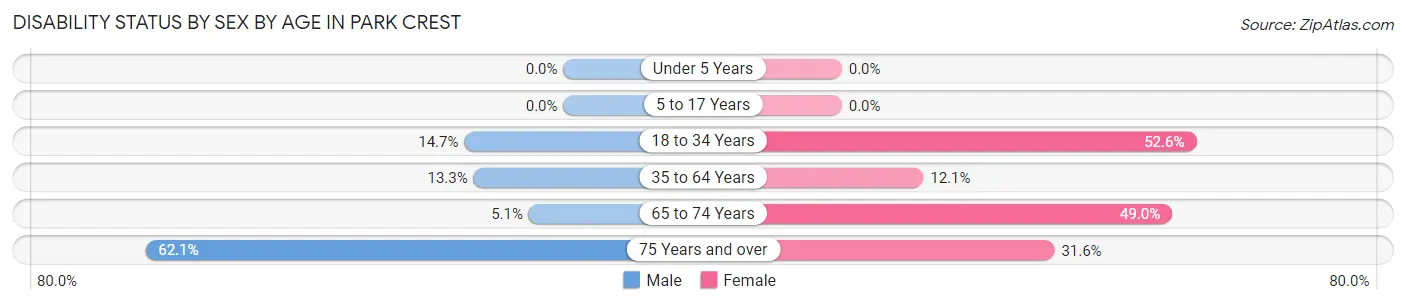
| Age Bracket | Male | Female |
| Under 5 Years | 0 (0.0%) | 0 (0.0%) |
| 5 to 17 Years | 0 (0.0%) | 0 (0.0%) |
| 18 to 34 Years | 5 (14.7%) | 10 (52.6%) |
| 35 to 64 Years | 10 (13.3%) | 19 (12.1%) |
| 65 to 74 Years | 2 (5.1%) | 51 (49.0%) |
| 75 Years and over | 18 (62.1%) | 6 (31.6%) |
Disability Class by Sex by Age in Park Crest
Disability Class: Hearing Difficulty
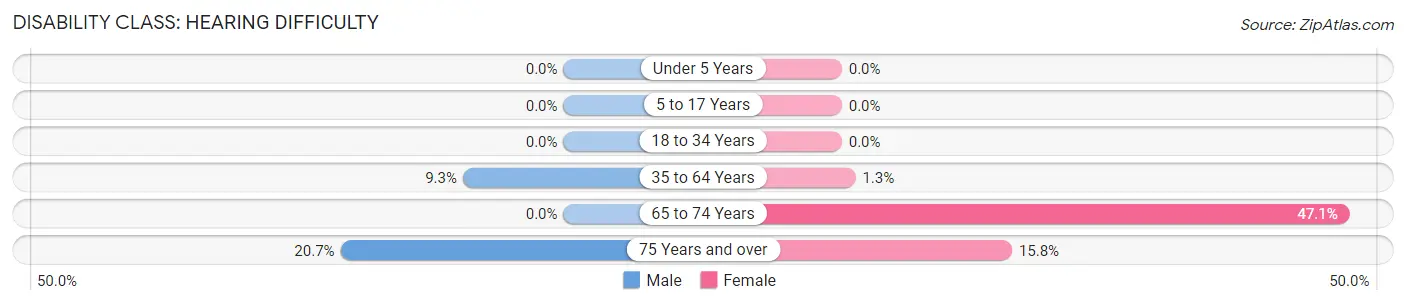
| Age Bracket | Male | Female |
| Under 5 Years | 0 (0.0%) | 0 (0.0%) |
| 5 to 17 Years | 0 (0.0%) | 0 (0.0%) |
| 18 to 34 Years | 0 (0.0%) | 0 (0.0%) |
| 35 to 64 Years | 7 (9.3%) | 2 (1.3%) |
| 65 to 74 Years | 0 (0.0%) | 49 (47.1%) |
| 75 Years and over | 6 (20.7%) | 3 (15.8%) |
Disability Class: Vision Difficulty
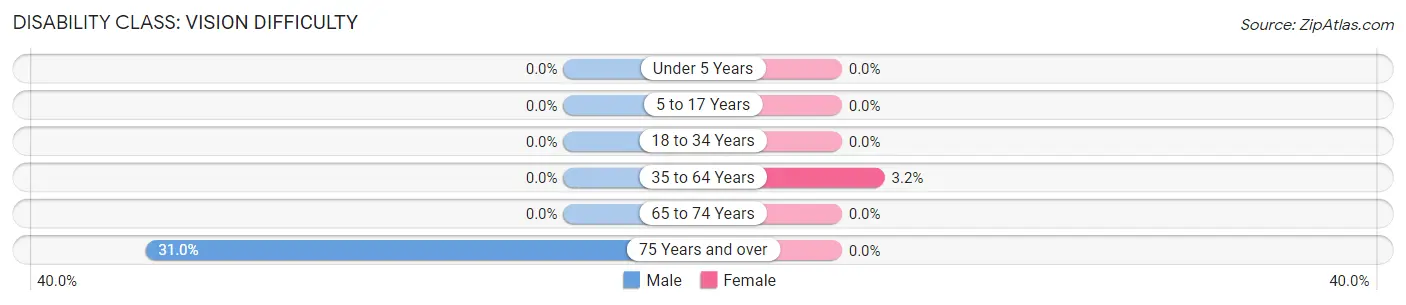
| Age Bracket | Male | Female |
| Under 5 Years | 0 (0.0%) | 0 (0.0%) |
| 5 to 17 Years | 0 (0.0%) | 0 (0.0%) |
| 18 to 34 Years | 0 (0.0%) | 0 (0.0%) |
| 35 to 64 Years | 0 (0.0%) | 5 (3.2%) |
| 65 to 74 Years | 0 (0.0%) | 0 (0.0%) |
| 75 Years and over | 9 (31.0%) | 0 (0.0%) |
Disability Class: Cognitive Difficulty
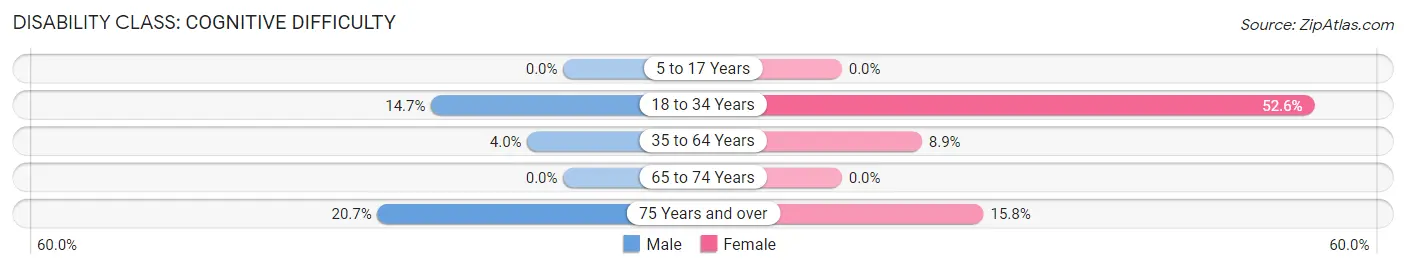
| Age Bracket | Male | Female |
| 5 to 17 Years | 0 (0.0%) | 0 (0.0%) |
| 18 to 34 Years | 5 (14.7%) | 10 (52.6%) |
| 35 to 64 Years | 3 (4.0%) | 14 (8.9%) |
| 65 to 74 Years | 0 (0.0%) | 0 (0.0%) |
| 75 Years and over | 6 (20.7%) | 3 (15.8%) |
Disability Class: Ambulatory Difficulty
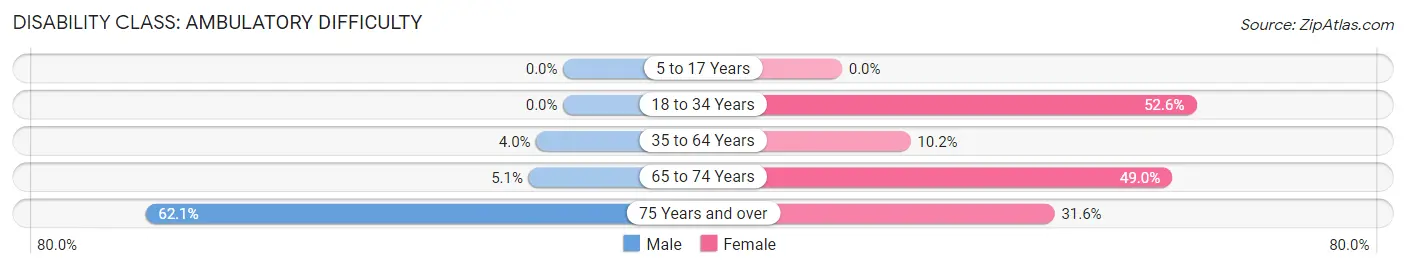
| Age Bracket | Male | Female |
| 5 to 17 Years | 0 (0.0%) | 0 (0.0%) |
| 18 to 34 Years | 0 (0.0%) | 10 (52.6%) |
| 35 to 64 Years | 3 (4.0%) | 16 (10.2%) |
| 65 to 74 Years | 2 (5.1%) | 51 (49.0%) |
| 75 Years and over | 18 (62.1%) | 6 (31.6%) |
Disability Class: Self-Care Difficulty
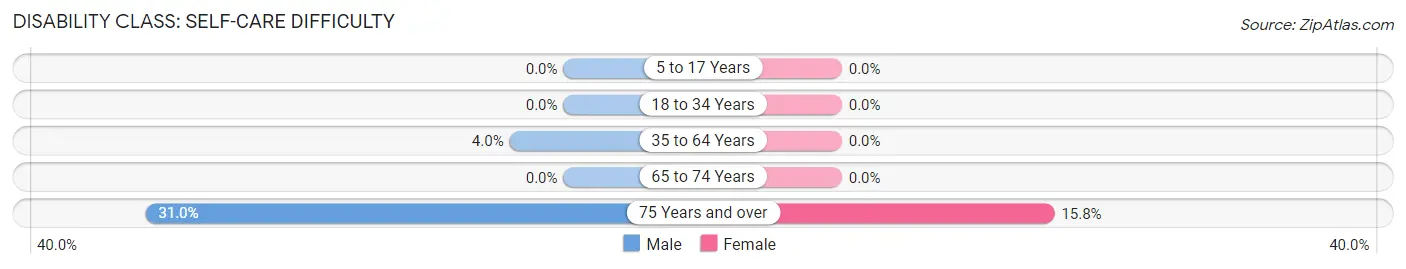
| Age Bracket | Male | Female |
| 5 to 17 Years | 0 (0.0%) | 0 (0.0%) |
| 18 to 34 Years | 0 (0.0%) | 0 (0.0%) |
| 35 to 64 Years | 3 (4.0%) | 0 (0.0%) |
| 65 to 74 Years | 0 (0.0%) | 0 (0.0%) |
| 75 Years and over | 9 (31.0%) | 3 (15.8%) |
Technology Access in Park Crest
Computing Device Access in Park Crest
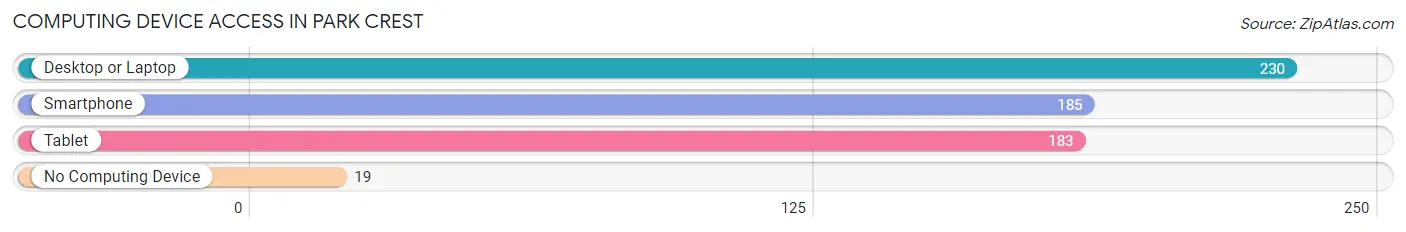
| Device Type | # Households | % Households |
| Desktop or Laptop | 230 | 87.1% |
| Smartphone | 185 | 70.1% |
| Tablet | 183 | 69.3% |
| No Computing Device | 19 | 7.2% |
| Total | 264 | 100.0% |
Internet Access in Park Crest
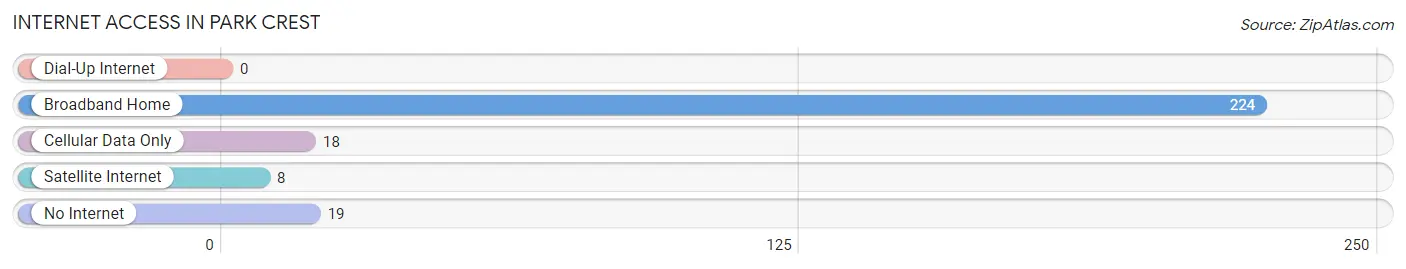
| Internet Type | # Households | % Households |
| Dial-Up Internet | 0 | 0.0% |
| Broadband Home | 224 | 84.9% |
| Cellular Data Only | 18 | 6.8% |
| Satellite Internet | 8 | 3.0% |
| No Internet | 19 | 7.2% |
| Total | 264 | 100.0% |
Park Crest Summary
History
Park Crest is a small borough located in Montgomery County, Pennsylvania. It is situated in the southeastern part of the county, approximately 20 miles northwest of Philadelphia. The borough was incorporated in 1891 and is home to a population of approximately 2,000 people.
The area that is now Park Crest was originally inhabited by the Lenni Lenape Native Americans. The first European settlers arrived in the area in the late 1700s and early 1800s. The area was known as “Parkersburg” and was part of the larger township of Upper Dublin. In 1891, the area was incorporated as the Borough of Park Crest.
The borough was named after the Park Crest Hotel, which was built in 1887. The hotel was a popular destination for wealthy Philadelphians who wanted to escape the city and enjoy the rural atmosphere of the area. The hotel was destroyed by fire in 1895, but the name Park Crest remained.
The borough grew slowly over the next few decades, with the population reaching 1,000 by the 1950s. The population has remained relatively stable since then, with the 2000 census showing a population of 2,000.
Geography
Park Crest is located in southeastern Montgomery County, approximately 20 miles northwest of Philadelphia. The borough is situated on a plateau, with an elevation of approximately 500 feet above sea level. The borough is bordered by Upper Dublin Township to the north, Horsham Township to the east, Warminster Township to the south, and Upper Moreland Township to the west.
The borough is primarily residential, with a few small businesses located in the downtown area. The main thoroughfare is Park Crest Avenue, which runs through the center of the borough. The borough is also home to several parks, including Park Crest Park, which is located in the center of the borough.
Economy
The economy of Park Crest is primarily based on small businesses and services. The borough is home to a variety of small businesses, including restaurants, retail stores, and professional services. The borough also has a few larger employers, including a manufacturing plant and a medical center.
The median household income in Park Crest is approximately $60,000, which is slightly higher than the national average. The unemployment rate in the borough is also slightly lower than the national average.
Demographics
The population of Park Crest is approximately 2,000 people, according to the 2000 census. The population is primarily white (90%), with a small percentage of African Americans (5%) and Asians (3%). The median age in the borough is 43 years, and the median household income is approximately $60,000.
The majority of the population is married (60%), and the majority of households are owner-occupied (80%). The borough is also home to a large number of seniors (20%), and the majority of the population is college-educated (60%).
Conclusion
Park Crest is a small borough located in southeastern Montgomery County, Pennsylvania. The borough was incorporated in 1891 and is home to a population of approximately 2,000 people. The economy of Park Crest is primarily based on small businesses and services, and the median household income is approximately $60,000. The population is primarily white, with a small percentage of African Americans and Asians. The majority of the population is married, and the majority of households are owner-occupied. Park Crest is a peaceful and pleasant place to live, and it is a great place to raise a family.
Common Questions
What is Per Capita Income in Park Crest?
Per Capita income in Park Crest is $29,245.
What is the Median Family Income in Park Crest?
Median Family Income in Park Crest is $73,750.
What is the Median Household income in Park Crest?
Median Household Income in Park Crest is $58,824.
What is Income or Wage Gap in Park Crest?
Income or Wage Gap in Park Crest is 49.9%.
Women in Park Crest earn 50.1 cents for every dollar earned by a man.
What is Inequality or Gini Index in Park Crest?
Inequality or Gini Index in Park Crest is 0.45.
What is the Total Population of Park Crest?
Total Population of Park Crest is 583.
What is the Total Male Population of Park Crest?
Total Male Population of Park Crest is 231.
What is the Total Female Population of Park Crest?
Total Female Population of Park Crest is 352.
What is the Ratio of Males per 100 Females in Park Crest?
There are 65.62 Males per 100 Females in Park Crest.
What is the Ratio of Females per 100 Males in Park Crest?
There are 152.38 Females per 100 Males in Park Crest.
What is the Median Population Age in Park Crest?
Median Population Age in Park Crest is 51.8 Years.
What is the Average Family Size in Park Crest
Average Family Size in Park Crest is 2.9 People.
What is the Average Household Size in Park Crest
Average Household Size in Park Crest is 2.2 People.
How Large is the Labor Force in Park Crest?
There are 240 People in the Labor Forcein in Park Crest.
What is the Percentage of People in the Labor Force in Park Crest?
49.9% of People are in the Labor Force in Park Crest.
What is the Unemployment Rate in Park Crest?
Unemployment Rate in Park Crest is 7.1%.