New Morgan borough, PA Map & Demographics
New Morgan borough Overview
$16,943
PER CAPITA INCOME
$138,750
AVG FAMILY INCOME
$126,250
AVG HOUSEHOLD INCOME
46.0%
WAGE / INCOME GAP [ % ]
54.0¢/ $1
WAGE / INCOME GAP [ $ ]
0.35
INEQUALITY / GINI INDEX
70
TOTAL POPULATION
48
MALE POPULATION
22
FEMALE POPULATION
218.18
MALES / 100 FEMALES
45.83
FEMALES / 100 MALES
18.2
MEDIAN AGE
5.8
AVG FAMILY SIZE
4.0
AVG HOUSEHOLD SIZE
22
LABOR FORCE [ PEOPLE ]
40.0%
PERCENT IN LABOR FORCE
Income in New Morgan borough
Income Overview in New Morgan borough
Per Capita Income in New Morgan borough is $16,943, while median incomes of families and households are $138,750 and $126,250 respectively.
| Characteristic | Number | Measure |
| Per Capita Income | 70 | $16,943 |
| Median Family Income | 6 | $138,750 |
| Mean Family Income | 6 | $139,017 |
| Median Household Income | 10 | $126,250 |
| Mean Household Income | 10 | $106,870 |
| Income Deficit | 6 | $0 |
| Wage / Income Gap (%) | 70 | 46.00% |
| Wage / Income Gap ($) | 70 | 54.00¢ per $1 |
| Gini / Inequality Index | 70 | 0.35 |
Earnings by Sex in New Morgan borough
Average Earnings in New Morgan borough are $41,000, $75,000 for men and $40,500 for women, a difference of 46.0%.
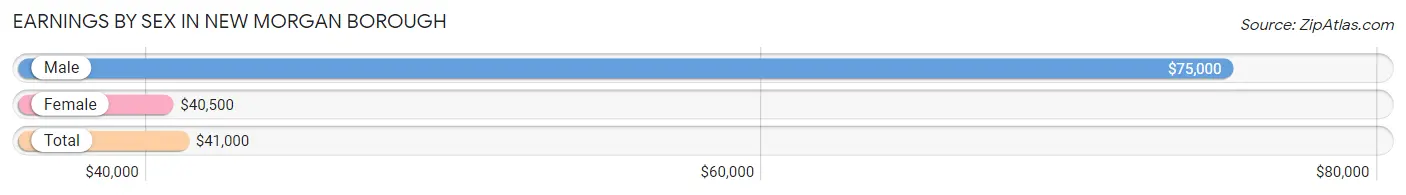
| Sex | Number | Average Earnings |
| Male | 12 (54.5%) | $75,000 |
| Female | 10 (45.5%) | $40,500 |
| Total | 22 (100.0%) | $41,000 |
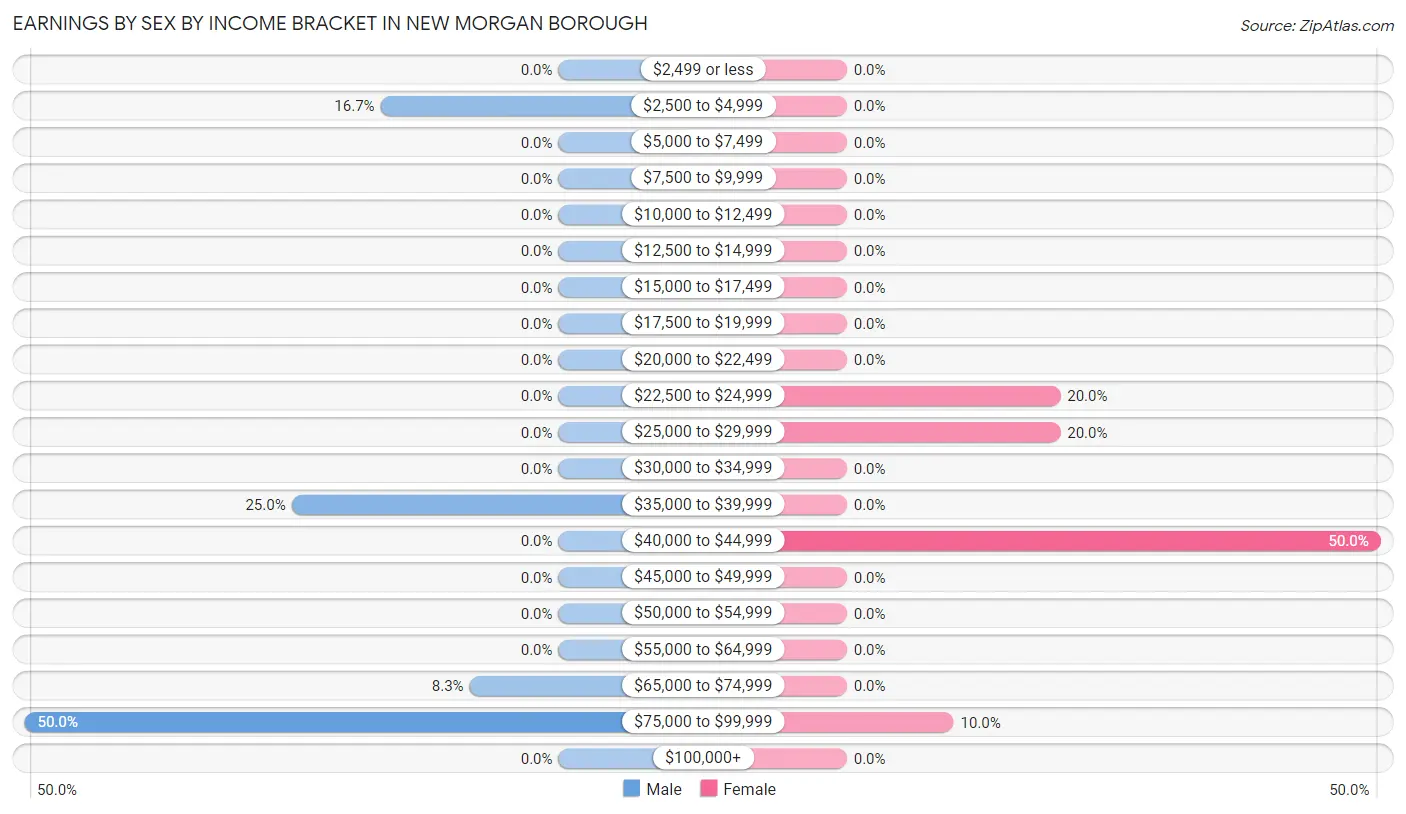
Earnings by Sex by Income Bracket in New Morgan borough
The most common earnings brackets in New Morgan borough are $75,000 to $99,999 for men (6 | 50.0%) and $40,000 to $44,999 for women (5 | 50.0%).
| Income | Male | Female |
| $2,499 or less | 0 (0.0%) | 0 (0.0%) |
| $2,500 to $4,999 | 2 (16.7%) | 0 (0.0%) |
| $5,000 to $7,499 | 0 (0.0%) | 0 (0.0%) |
| $7,500 to $9,999 | 0 (0.0%) | 0 (0.0%) |
| $10,000 to $12,499 | 0 (0.0%) | 0 (0.0%) |
| $12,500 to $14,999 | 0 (0.0%) | 0 (0.0%) |
| $15,000 to $17,499 | 0 (0.0%) | 0 (0.0%) |
| $17,500 to $19,999 | 0 (0.0%) | 0 (0.0%) |
| $20,000 to $22,499 | 0 (0.0%) | 0 (0.0%) |
| $22,500 to $24,999 | 0 (0.0%) | 2 (20.0%) |
| $25,000 to $29,999 | 0 (0.0%) | 2 (20.0%) |
| $30,000 to $34,999 | 0 (0.0%) | 0 (0.0%) |
| $35,000 to $39,999 | 3 (25.0%) | 0 (0.0%) |
| $40,000 to $44,999 | 0 (0.0%) | 5 (50.0%) |
| $45,000 to $49,999 | 0 (0.0%) | 0 (0.0%) |
| $50,000 to $54,999 | 0 (0.0%) | 0 (0.0%) |
| $55,000 to $64,999 | 0 (0.0%) | 0 (0.0%) |
| $65,000 to $74,999 | 1 (8.3%) | 0 (0.0%) |
| $75,000 to $99,999 | 6 (50.0%) | 1 (10.0%) |
| $100,000+ | 0 (0.0%) | 0 (0.0%) |
| Total | 12 (100.0%) | 10 (100.0%) |
Earnings by Sex by Educational Attainment in New Morgan borough
| Educational Attainment | Male Income | Female Income |
| Less than High School | - | - |
| High School Diploma | - | - |
| College or Associate's Degree | - | - |
| Bachelor's Degree | - | - |
| Graduate Degree | - | - |
| Total | $76,875 | $40,625 |
Family Income in New Morgan borough
Family Income Brackets in New Morgan borough
According to the New Morgan borough family income data, there are 4 families falling into the $100,000 to $149,999 income range, which is the most common income bracket and makes up 66.7% of all families.
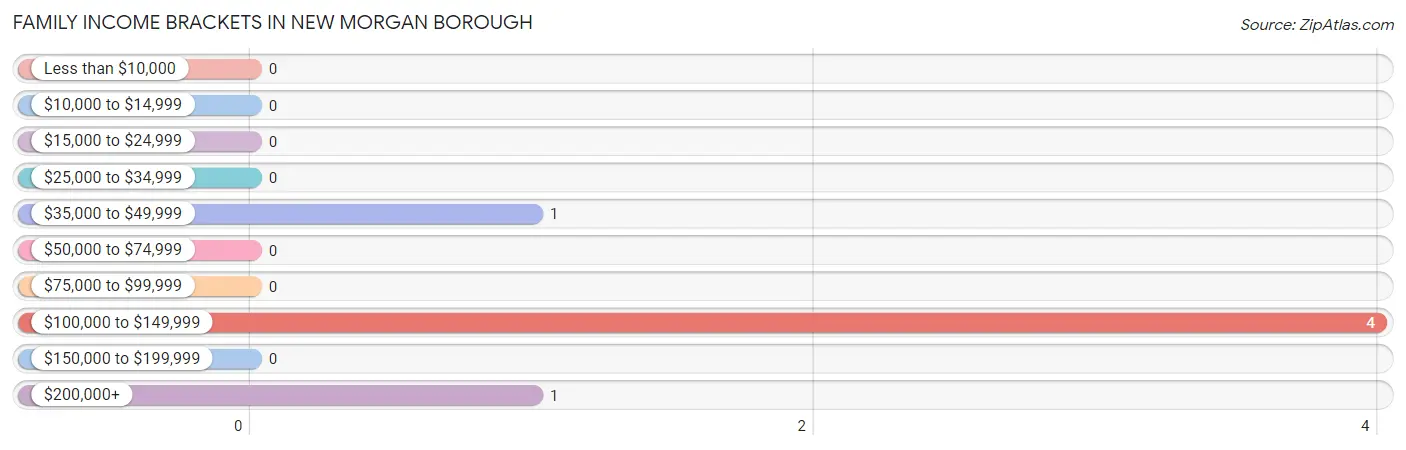
| Income Bracket | # Families | % Families |
| Less than $10,000 | 0 | 0.0% |
| $10,000 to $14,999 | 0 | 0.0% |
| $15,000 to $24,999 | 0 | 0.0% |
| $25,000 to $34,999 | 0 | 0.0% |
| $35,000 to $49,999 | 1 | 16.7% |
| $50,000 to $74,999 | 0 | 0.0% |
| $75,000 to $99,999 | 0 | 0.0% |
| $100,000 to $149,999 | 4 | 66.7% |
| $150,000 to $199,999 | 0 | 0.0% |
| $200,000+ | 1 | 16.7% |
Family Income by Famaliy Size in New Morgan borough
| Income Bracket | # Families | Median Income |
| 2-Person Families | 1 (16.7%) | $0 |
| 3-Person Families | 0 (0.0%) | $0 |
| 4-Person Families | 4 (66.7%) | $0 |
| 5-Person Families | 0 (0.0%) | $0 |
| 6-Person Families | 0 (0.0%) | $0 |
| 7+ Person Families | 1 (16.7%) | $0 |
| Total | 6 (100.0%) | $138,750 |
Family Income by Number of Earners in New Morgan borough
| Number of Earners | # Families | Median Income |
| No Earners | 0 (0.0%) | $0 |
| 1 Earner | 1 (16.7%) | $0 |
| 2 Earners | 4 (66.7%) | $0 |
| 3+ Earners | 1 (16.7%) | $0 |
| Total | 6 (100.0%) | $138,750 |
Household Income in New Morgan borough
Household Income Brackets in New Morgan borough
With 6 households falling in the category, the $100,000 to $149,999 income range is the most frequent in New Morgan borough, accounting for 60.0% of all households.
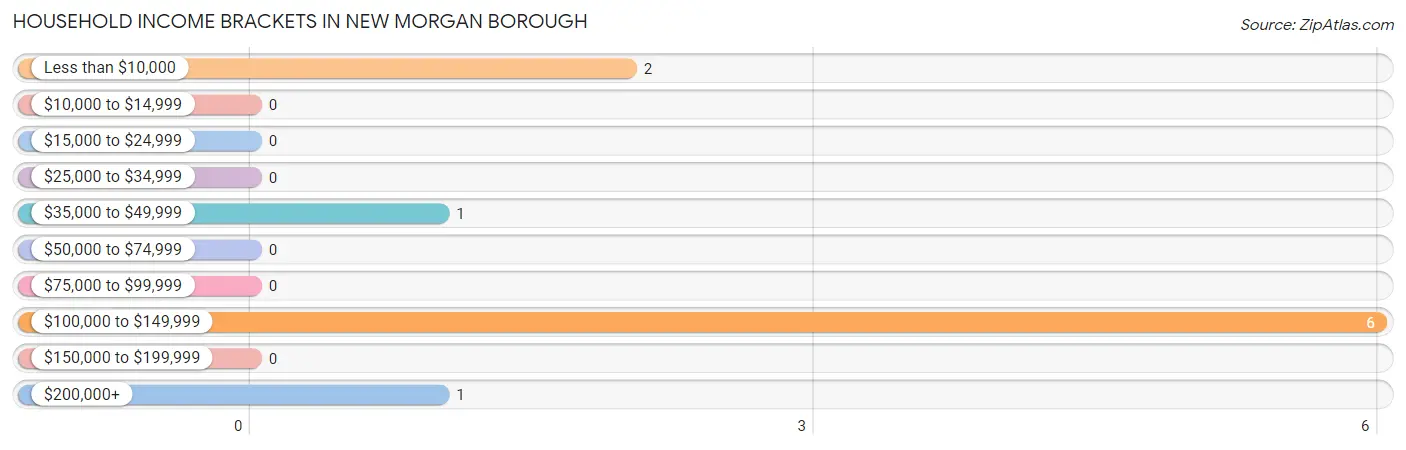
| Income Bracket | # Households | % Households |
| Less than $10,000 | 2 | 20.0% |
| $10,000 to $14,999 | 0 | 0.0% |
| $15,000 to $24,999 | 0 | 0.0% |
| $25,000 to $34,999 | 0 | 0.0% |
| $35,000 to $49,999 | 1 | 10.0% |
| $50,000 to $74,999 | 0 | 0.0% |
| $75,000 to $99,999 | 0 | 0.0% |
| $100,000 to $149,999 | 6 | 60.0% |
| $150,000 to $199,999 | 0 | 0.0% |
| $200,000+ | 1 | 10.0% |
Household Income by Householder Age in New Morgan borough
| Income Bracket | # Households | Median Income |
| 15 to 24 Years | 0 (0.0%) | $0 |
| 25 to 44 Years | 6 (60.0%) | $0 |
| 45 to 64 Years | 2 (20.0%) | $0 |
| 65+ Years | 2 (20.0%) | $0 |
| Total | 10 (100.0%) | $126,250 |
Poverty in New Morgan borough
Income Below Poverty by Sex and Age in New Morgan borough
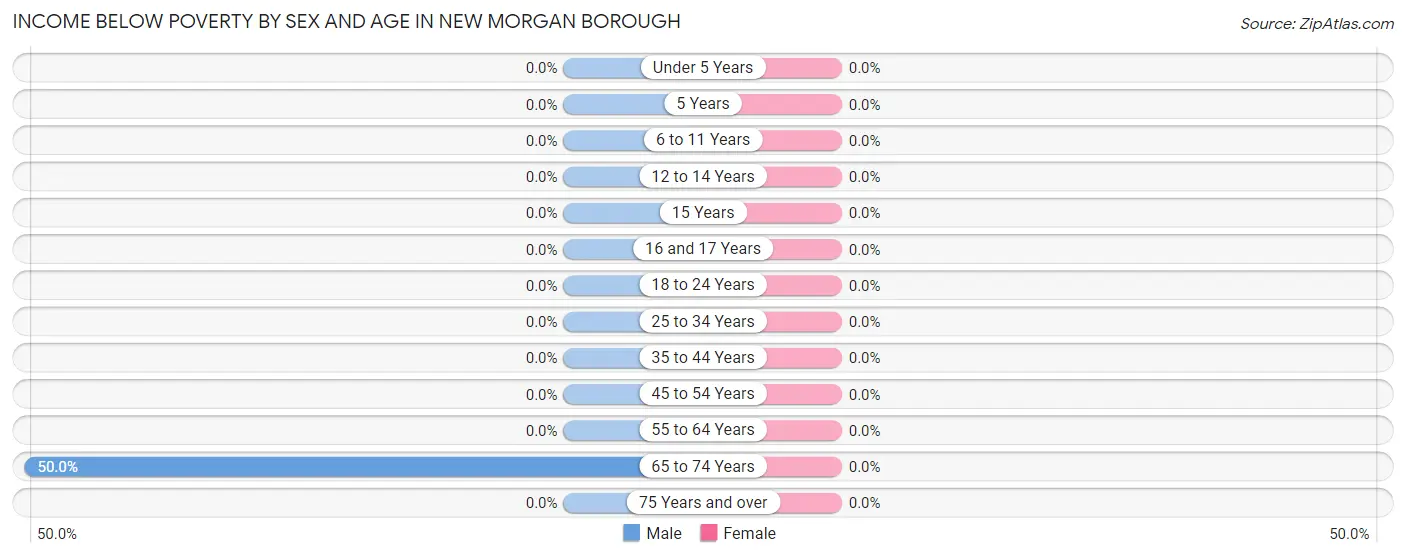
| Age Bracket | Male | Female |
| Under 5 Years | 0 (0.0%) | 0 (0.0%) |
| 5 Years | 0 (0.0%) | 0 (0.0%) |
| 6 to 11 Years | 0 (0.0%) | 0 (0.0%) |
| 12 to 14 Years | 0 (0.0%) | 0 (0.0%) |
| 15 Years | 0 (0.0%) | 0 (0.0%) |
| 16 and 17 Years | 0 (0.0%) | 0 (0.0%) |
| 18 to 24 Years | 0 (0.0%) | 0 (0.0%) |
| 25 to 34 Years | 0 (0.0%) | 0 (0.0%) |
| 35 to 44 Years | 0 (0.0%) | 0 (0.0%) |
| 45 to 54 Years | 0 (0.0%) | 0 (0.0%) |
| 55 to 64 Years | 0 (0.0%) | 0 (0.0%) |
| 65 to 74 Years | 2 (50.0%) | 0 (0.0%) |
| 75 Years and over | 0 (0.0%) | 0 (0.0%) |
| Total | 2 (8.7%) | 0 (0.0%) |
Income Above Poverty by Sex and Age in New Morgan borough
According to the poverty statistics in New Morgan borough, males aged under 5 years and females aged under 5 years are the age groups that are most secure financially, with 100.0% of males and 100.0% of females in these age groups living above the poverty line.
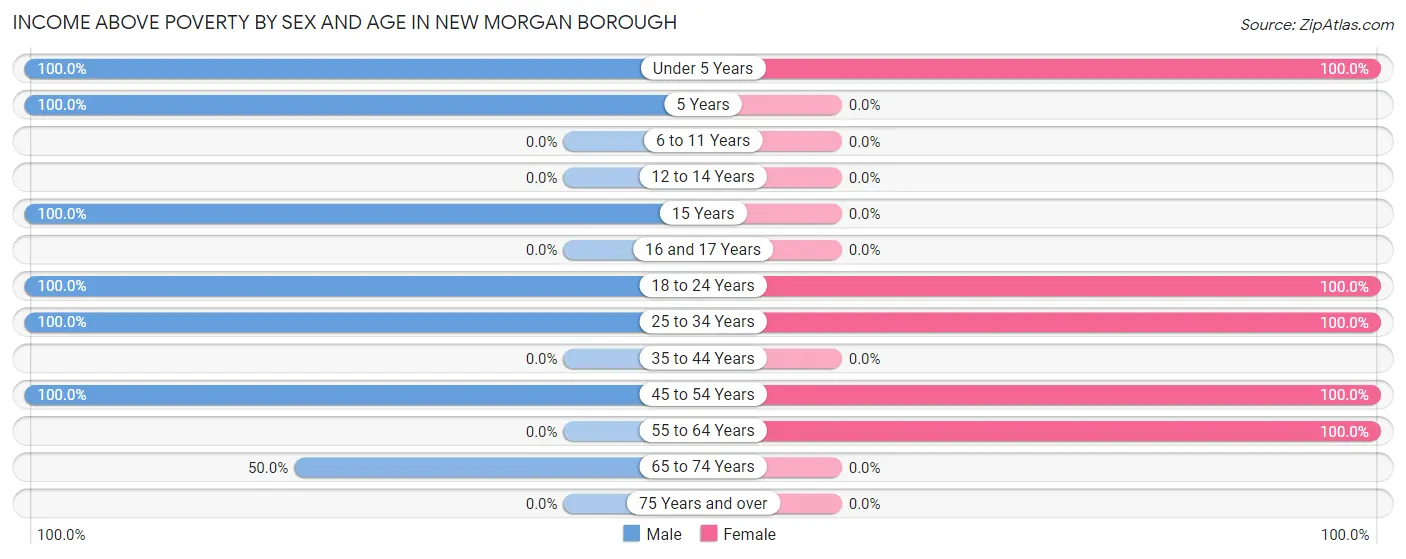
| Age Bracket | Male | Female |
| Under 5 Years | 1 (100.0%) | 6 (100.0%) |
| 5 Years | 4 (100.0%) | 0 (0.0%) |
| 6 to 11 Years | 0 (0.0%) | 0 (0.0%) |
| 12 to 14 Years | 0 (0.0%) | 0 (0.0%) |
| 15 Years | 1 (100.0%) | 0 (0.0%) |
| 16 and 17 Years | 0 (0.0%) | 0 (0.0%) |
| 18 to 24 Years | 6 (100.0%) | 5 (100.0%) |
| 25 to 34 Years | 5 (100.0%) | 4 (100.0%) |
| 35 to 44 Years | 0 (0.0%) | 0 (0.0%) |
| 45 to 54 Years | 2 (100.0%) | 1 (100.0%) |
| 55 to 64 Years | 0 (0.0%) | 1 (100.0%) |
| 65 to 74 Years | 2 (50.0%) | 0 (0.0%) |
| 75 Years and over | 0 (0.0%) | 0 (0.0%) |
| Total | 21 (91.3%) | 17 (100.0%) |
Income Below Poverty Among Married-Couple Families in New Morgan borough
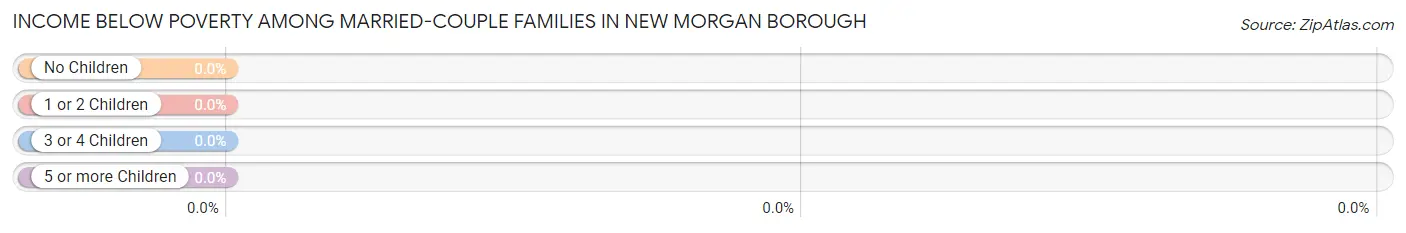
| Children | Above Poverty | Below Poverty |
| No Children | 0 (0.0%) | 0 (0.0%) |
| 1 or 2 Children | 4 (100.0%) | 0 (0.0%) |
| 3 or 4 Children | 1 (100.0%) | 0 (0.0%) |
| 5 or more Children | 0 (0.0%) | 0 (0.0%) |
| Total | 5 (100.0%) | 0 (0.0%) |
Income Below Poverty Among Single-Parent Households in New Morgan borough
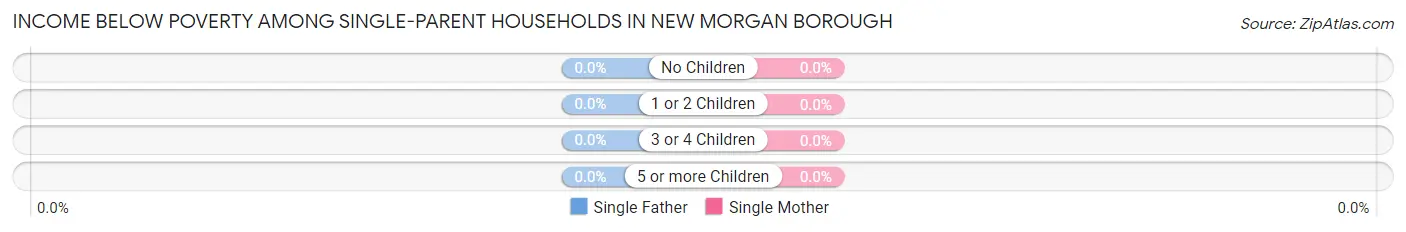
| Children | Single Father | Single Mother |
| No Children | 0 (0.0%) | 0 (0.0%) |
| 1 or 2 Children | 0 (0.0%) | 0 (0.0%) |
| 3 or 4 Children | 0 (0.0%) | 0 (0.0%) |
| 5 or more Children | 0 (0.0%) | 0 (0.0%) |
| Total | 0 (0.0%) | 0 (0.0%) |
Income Below Poverty Among Married-Couple vs Single-Parent Households in New Morgan borough
| Children | Married-Couple Families | Single-Parent Households |
| No Children | 0 (0.0%) | 0 (0.0%) |
| 1 or 2 Children | 0 (0.0%) | 0 (0.0%) |
| 3 or 4 Children | 0 (0.0%) | 0 (0.0%) |
| 5 or more Children | 0 (0.0%) | 0 (0.0%) |
| Total | 0 (0.0%) | 0 (0.0%) |
Race in New Morgan borough
The most populous races in New Morgan borough are White / Caucasian (55 | 78.6%), Black / African American (15 | 21.4%), and Hispanic or Latino (9 | 12.9%).
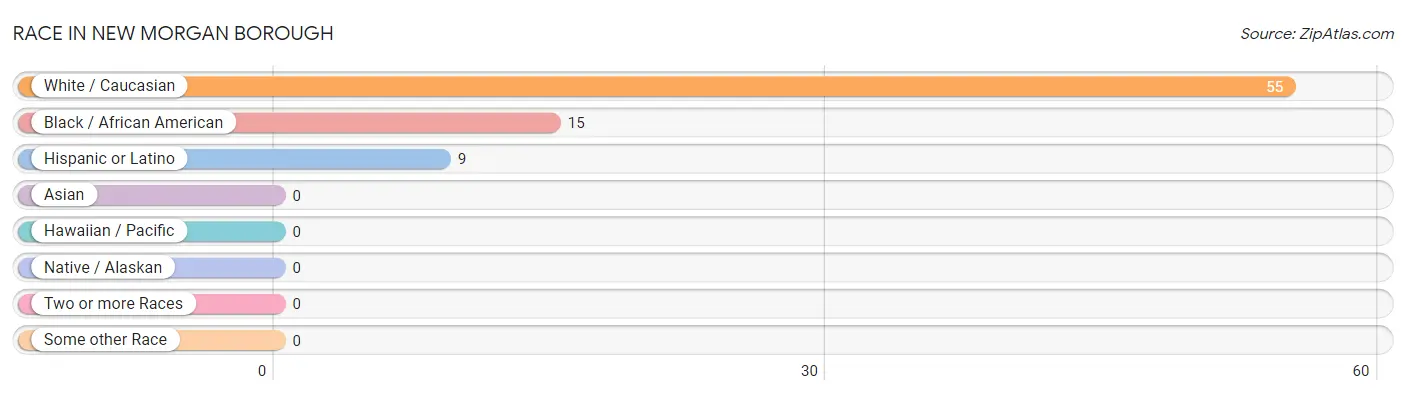
| Race | # Population | % Population |
| Asian | 0 | 0.0% |
| Black / African American | 15 | 21.4% |
| Hawaiian / Pacific | 0 | 0.0% |
| Hispanic or Latino | 9 | 12.9% |
| Native / Alaskan | 0 | 0.0% |
| White / Caucasian | 55 | 78.6% |
| Two or more Races | 0 | 0.0% |
| Some other Race | 0 | 0.0% |
| Total | 70 | 100.0% |
Ancestry in New Morgan borough
The most populous ancestries reported in New Morgan borough are American (3 | 4.3%), Italian (2 | 2.9%), and German (1 | 1.4%), together accounting for 8.6% of all New Morgan borough residents.
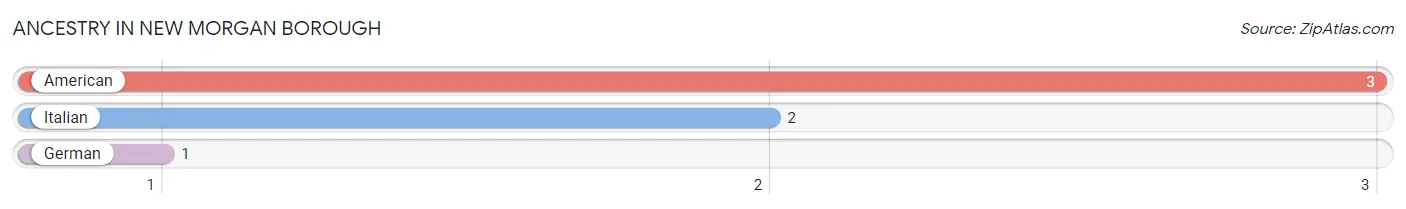
| Ancestry | # Population | % Population |
| American | 3 | 4.3% |
| German | 1 | 1.4% |
| Italian | 2 | 2.9% | View All 3 Rows |
Immigrants in New Morgan borough

| Immigration Origin | # Population | % Population | View All 0 Rows |
Sex and Age in New Morgan borough
Sex and Age in New Morgan borough
The most populous age groups in New Morgan borough are 15 to 19 Years (26 | 54.2%) for men and Under 5 Years (6 | 27.3%) for women.
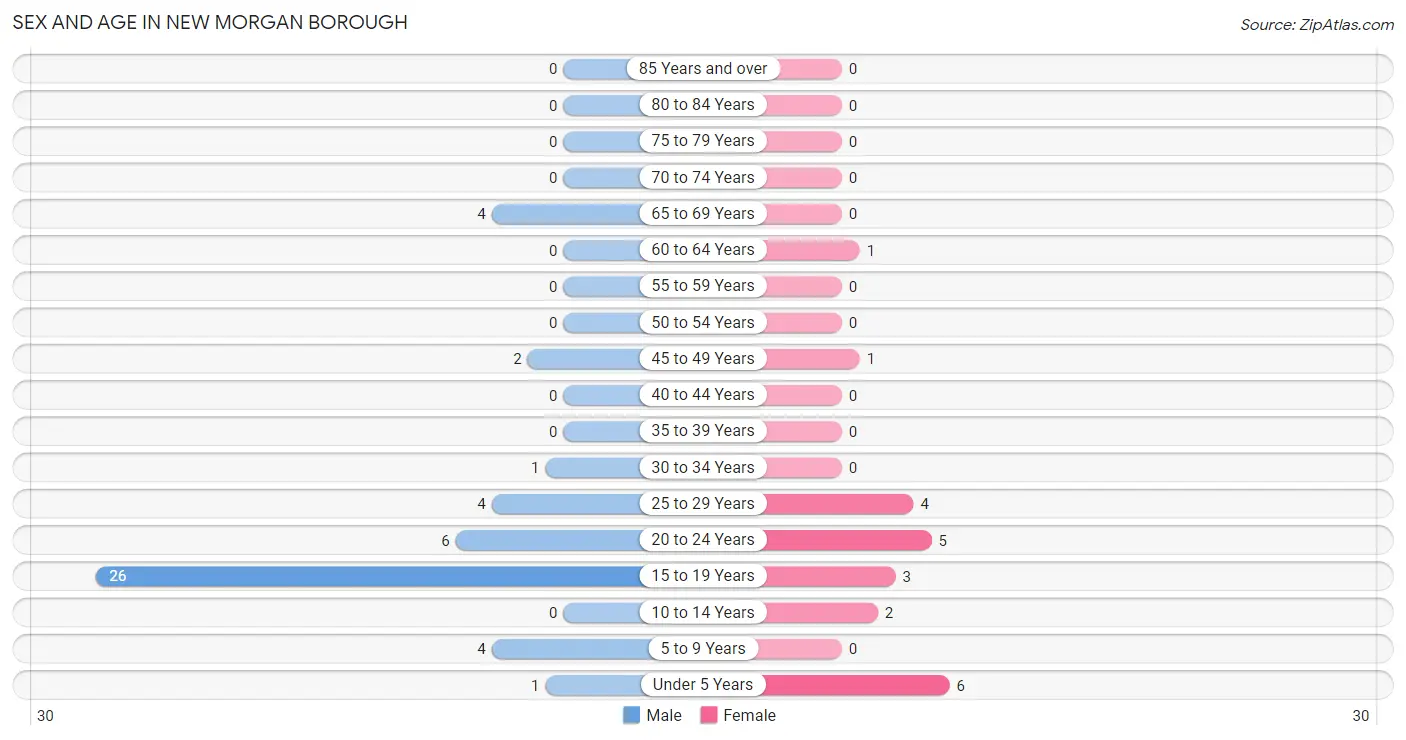
| Age Bracket | Male | Female |
| Under 5 Years | 1 (2.1%) | 6 (27.3%) |
| 5 to 9 Years | 4 (8.3%) | 0 (0.0%) |
| 10 to 14 Years | 0 (0.0%) | 2 (9.1%) |
| 15 to 19 Years | 26 (54.2%) | 3 (13.6%) |
| 20 to 24 Years | 6 (12.5%) | 5 (22.7%) |
| 25 to 29 Years | 4 (8.3%) | 4 (18.2%) |
| 30 to 34 Years | 1 (2.1%) | 0 (0.0%) |
| 35 to 39 Years | 0 (0.0%) | 0 (0.0%) |
| 40 to 44 Years | 0 (0.0%) | 0 (0.0%) |
| 45 to 49 Years | 2 (4.2%) | 1 (4.5%) |
| 50 to 54 Years | 0 (0.0%) | 0 (0.0%) |
| 55 to 59 Years | 0 (0.0%) | 0 (0.0%) |
| 60 to 64 Years | 0 (0.0%) | 1 (4.5%) |
| 65 to 69 Years | 4 (8.3%) | 0 (0.0%) |
| 70 to 74 Years | 0 (0.0%) | 0 (0.0%) |
| 75 to 79 Years | 0 (0.0%) | 0 (0.0%) |
| 80 to 84 Years | 0 (0.0%) | 0 (0.0%) |
| 85 Years and over | 0 (0.0%) | 0 (0.0%) |
| Total | 48 (100.0%) | 22 (100.0%) |
Families and Households in New Morgan borough
Median Family Size in New Morgan borough
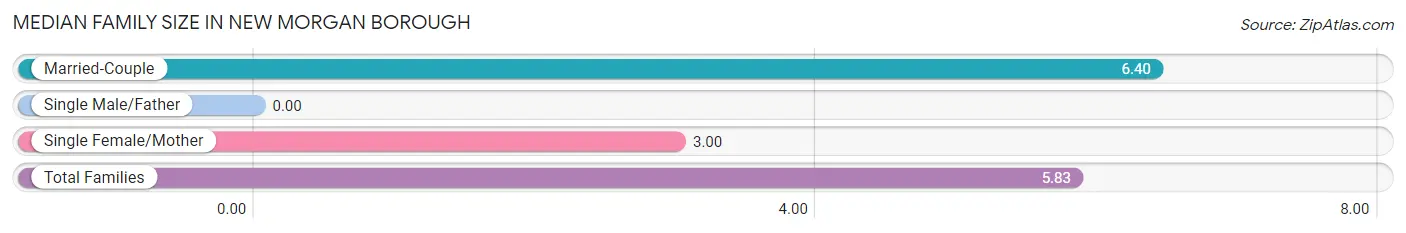
| Family Type | # Families | Family Size |
| Married-Couple | 5 (83.3%) | 6.40 |
| Single Male/Father | 0 (0.0%) | - |
| Single Female/Mother | 1 (16.7%) | 3.00 |
| Total Families | 6 (100.0%) | 5.83 |
Median Household Size in New Morgan borough
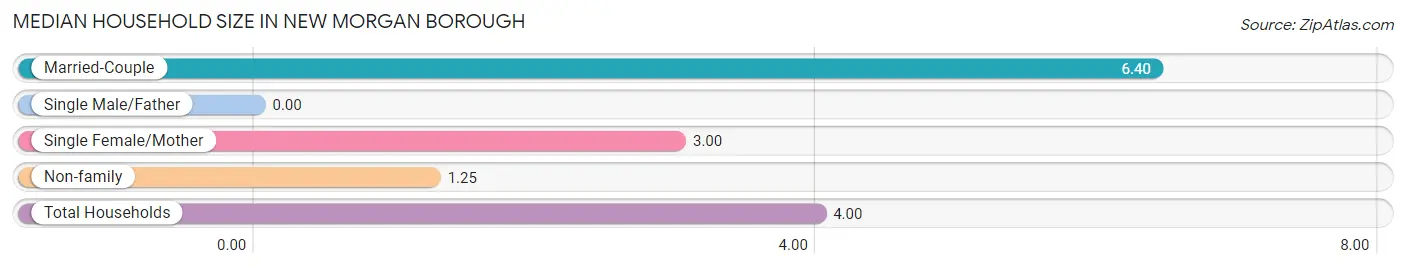
| Household Type | # Households | Household Size |
| Married-Couple | 5 (50.0%) | 6.40 |
| Single Male/Father | 0 (0.0%) | - |
| Single Female/Mother | 1 (10.0%) | 3.00 |
| Non-family | 4 (40.0%) | 1.25 |
| Total Households | 10 (100.0%) | 4.00 |
Household Size by Marriage Status in New Morgan borough
Out of a total of 10 households in New Morgan borough, 6 (60.0%) are family households, while 4 (40.0%) are nonfamily households. The most numerous type of family households are 4-person households, comprising 4, and the most common type of nonfamily households are 1-person households, comprising 2.
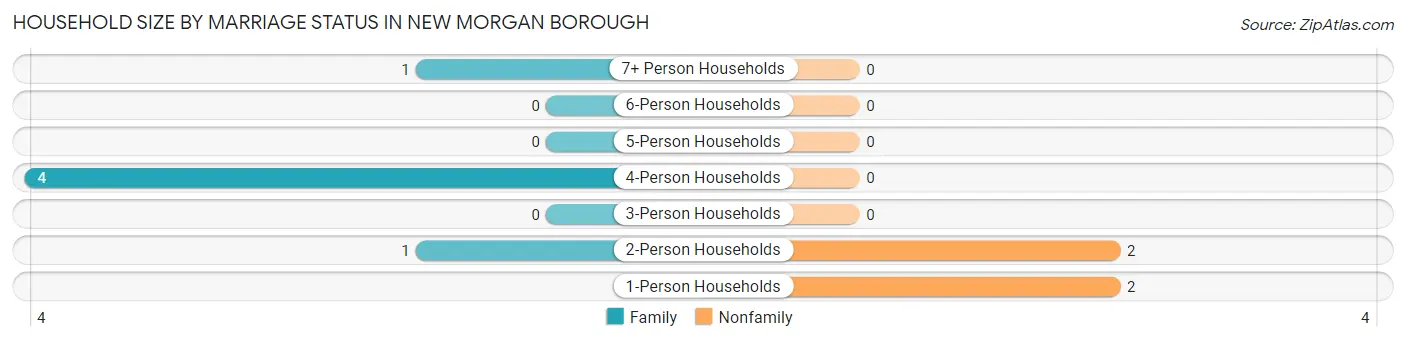
| Household Size | Family Households | Nonfamily Households |
| 1-Person Households | - | 2 (20.0%) |
| 2-Person Households | 1 (10.0%) | 2 (20.0%) |
| 3-Person Households | 0 (0.0%) | 0 (0.0%) |
| 4-Person Households | 4 (40.0%) | 0 (0.0%) |
| 5-Person Households | 0 (0.0%) | 0 (0.0%) |
| 6-Person Households | 0 (0.0%) | 0 (0.0%) |
| 7+ Person Households | 1 (10.0%) | 0 (0.0%) |
| Total | 6 (60.0%) | 4 (40.0%) |
Female Fertility in New Morgan borough
Fertility by Age in New Morgan borough
Average fertility rate in New Morgan borough is 231.0 births per 1,000 women. Women in the age bracket of 20 to 34 years have the highest fertility rate with 333.0 births per 1,000 women. Women in the age bracket of 20 to 34 years acount for 100.0% of all women with births.
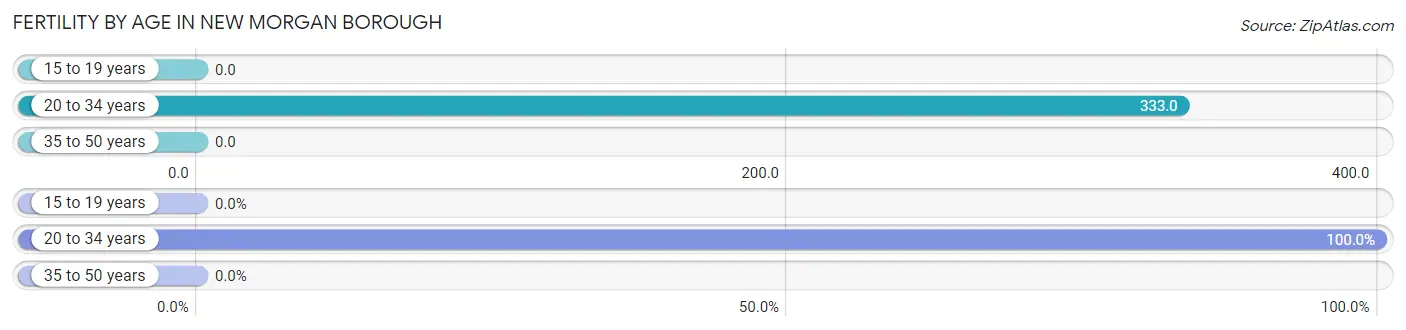
| Age Bracket | Women with Births | Births / 1,000 Women |
| 15 to 19 years | 0 (0.0%) | 0.0 |
| 20 to 34 years | 3 (100.0%) | 333.0 |
| 35 to 50 years | 0 (0.0%) | 0.0 |
| Total | 3 (100.0%) | 231.0 |
Fertility by Age by Marriage Status in New Morgan borough
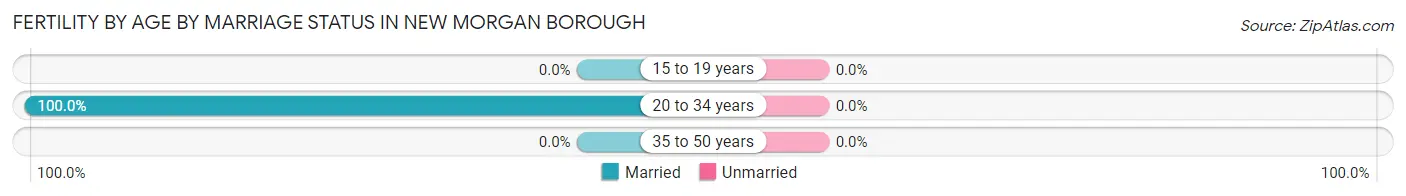
| Age Bracket | Married | Unmarried |
| 15 to 19 years | 0 (0.0%) | 0 (0.0%) |
| 20 to 34 years | 3 (100.0%) | 0 (0.0%) |
| 35 to 50 years | 0 (0.0%) | 0 (0.0%) |
| Total | 3 (100.0%) | 0 (0.0%) |
Fertility by Education in New Morgan borough
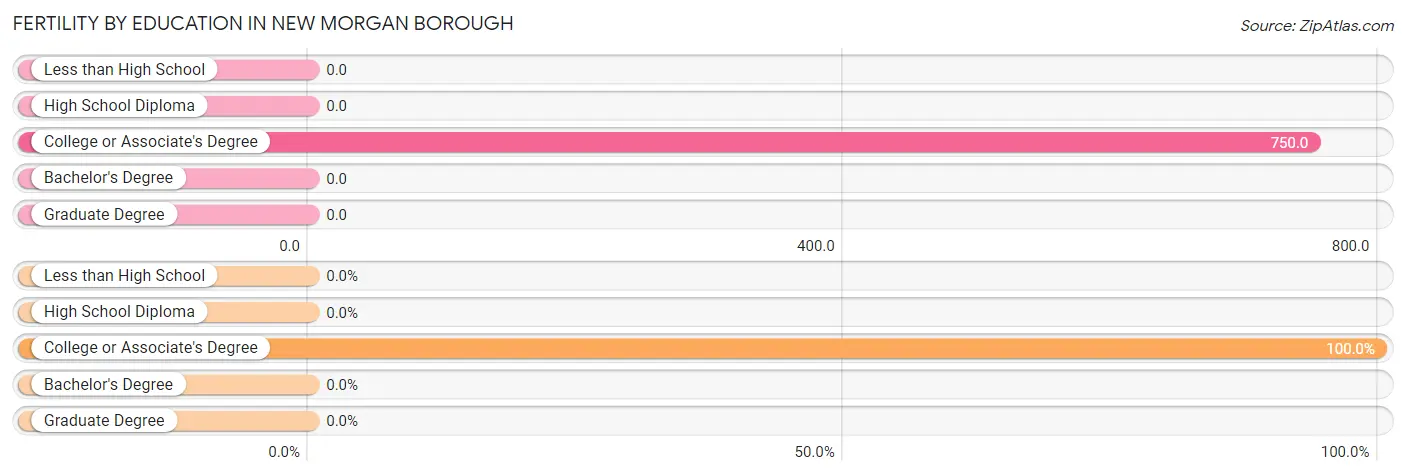
| Educational Attainment | Women with Births | Births / 1,000 Women |
| Less than High School | 0 (0.0%) | 0.0 |
| High School Diploma | 0 (0.0%) | 0.0 |
| College or Associate's Degree | 3 (100.0%) | 750.0 |
| Bachelor's Degree | 0 (0.0%) | 0.0 |
| Graduate Degree | 0 (0.0%) | 0.0 |
| Total | 3 (100.0%) | 231.0 |
Fertility by Education by Marriage Status in New Morgan borough
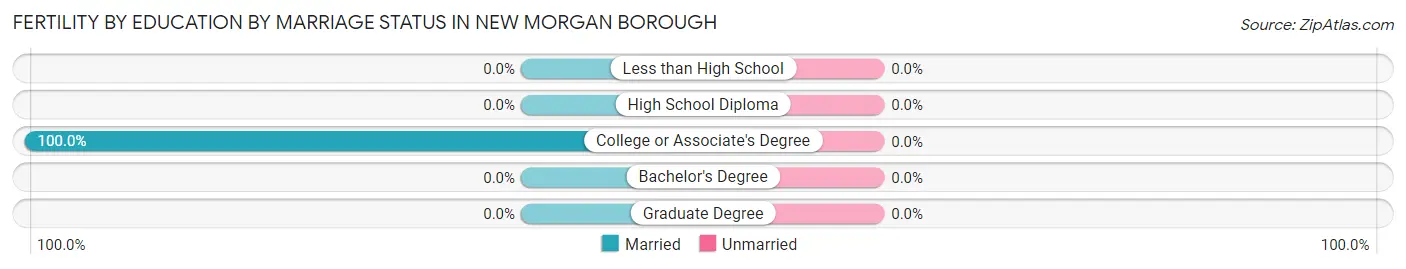
| Educational Attainment | Married | Unmarried |
| Less than High School | 0 (0.0%) | 0 (0.0%) |
| High School Diploma | 0 (0.0%) | 0 (0.0%) |
| College or Associate's Degree | 3 (100.0%) | 0 (0.0%) |
| Bachelor's Degree | 0 (0.0%) | 0 (0.0%) |
| Graduate Degree | 0 (0.0%) | 0 (0.0%) |
| Total | 3 (100.0%) | 0 (0.0%) |
Employment Characteristics in New Morgan borough
Employment by Class of Employer in New Morgan borough
Among the 22 employed individuals in New Morgan borough, private company employees (20 | 90.9%), and federal government employees (2 | 9.1%) make up the most common classes of employment.
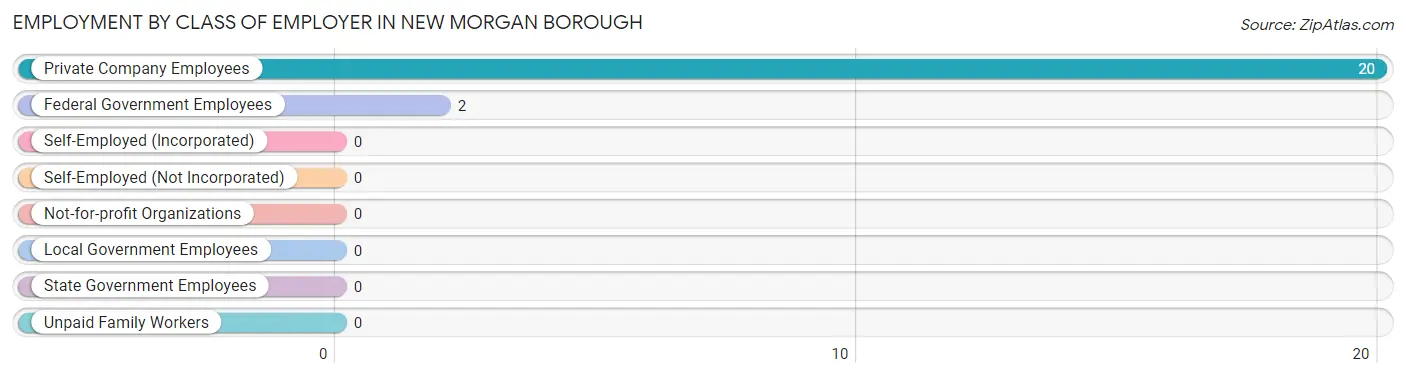
| Employer Class | # Employees | % Employees |
| Private Company Employees | 20 | 90.9% |
| Self-Employed (Incorporated) | 0 | 0.0% |
| Self-Employed (Not Incorporated) | 0 | 0.0% |
| Not-for-profit Organizations | 0 | 0.0% |
| Local Government Employees | 0 | 0.0% |
| State Government Employees | 0 | 0.0% |
| Federal Government Employees | 2 | 9.1% |
| Unpaid Family Workers | 0 | 0.0% |
| Total | 22 | 100.0% |
Employment Status by Age in New Morgan borough
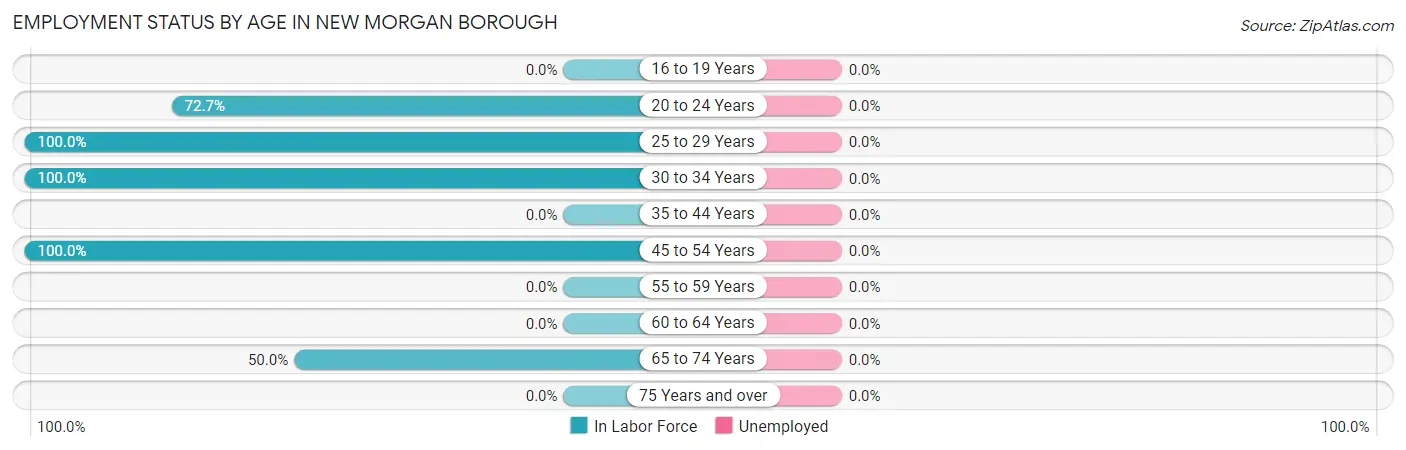
| Age Bracket | In Labor Force | Unemployed |
| 16 to 19 Years | 0 (0.0%) | 0 (0.0%) |
| 20 to 24 Years | 8 (72.7%) | 0 (0.0%) |
| 25 to 29 Years | 8 (100.0%) | 0 (0.0%) |
| 30 to 34 Years | 1 (100.0%) | 0 (0.0%) |
| 35 to 44 Years | 0 (0.0%) | 0 (0.0%) |
| 45 to 54 Years | 3 (100.0%) | 0 (0.0%) |
| 55 to 59 Years | 0 (0.0%) | 0 (0.0%) |
| 60 to 64 Years | 0 (0.0%) | 0 (0.0%) |
| 65 to 74 Years | 2 (50.0%) | 0 (0.0%) |
| 75 Years and over | 0 (0.0%) | 0 (0.0%) |
| Total | 22 (40.0%) | 0 (0.0%) |
Employment Status by Educational Attainment in New Morgan borough
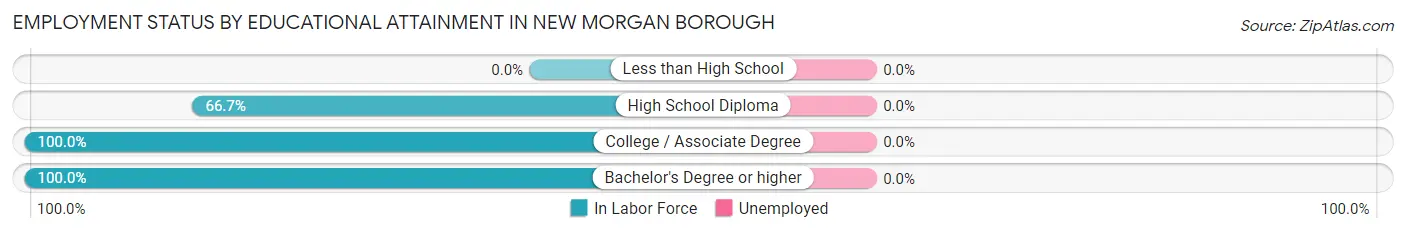
| Educational Attainment | In Labor Force | Unemployed |
| Less than High School | 0 (0.0%) | 0 (0.0%) |
| High School Diploma | 2 (66.7%) | 0 (0.0%) |
| College / Associate Degree | 2 (100.0%) | 0 (0.0%) |
| Bachelor's Degree or higher | 8 (100.0%) | 0 (0.0%) |
| Total | 12 (92.3%) | 0 (0.0%) |
Employment Occupations by Sex in New Morgan borough
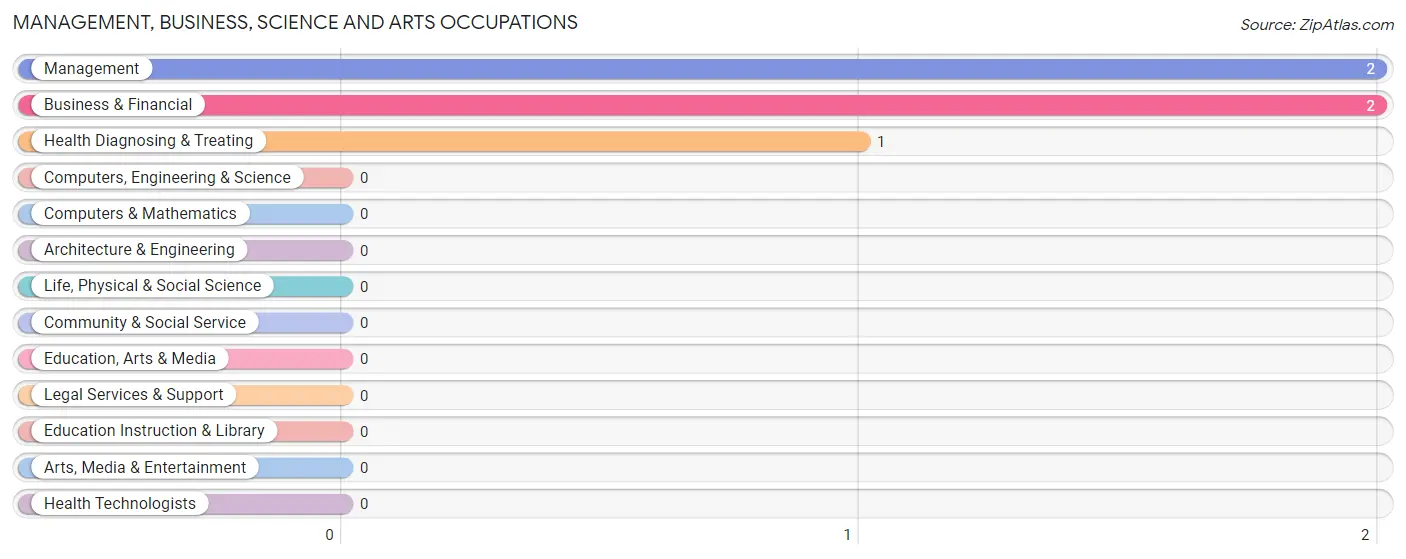
Management, Business, Science and Arts Occupations
The most common Management, Business, Science and Arts occupations in New Morgan borough are Management (2 | 9.1%), Business & Financial (2 | 9.1%), and Health Diagnosing & Treating (1 | 4.5%).
Management, Business, Science and Arts Occupations by Sex
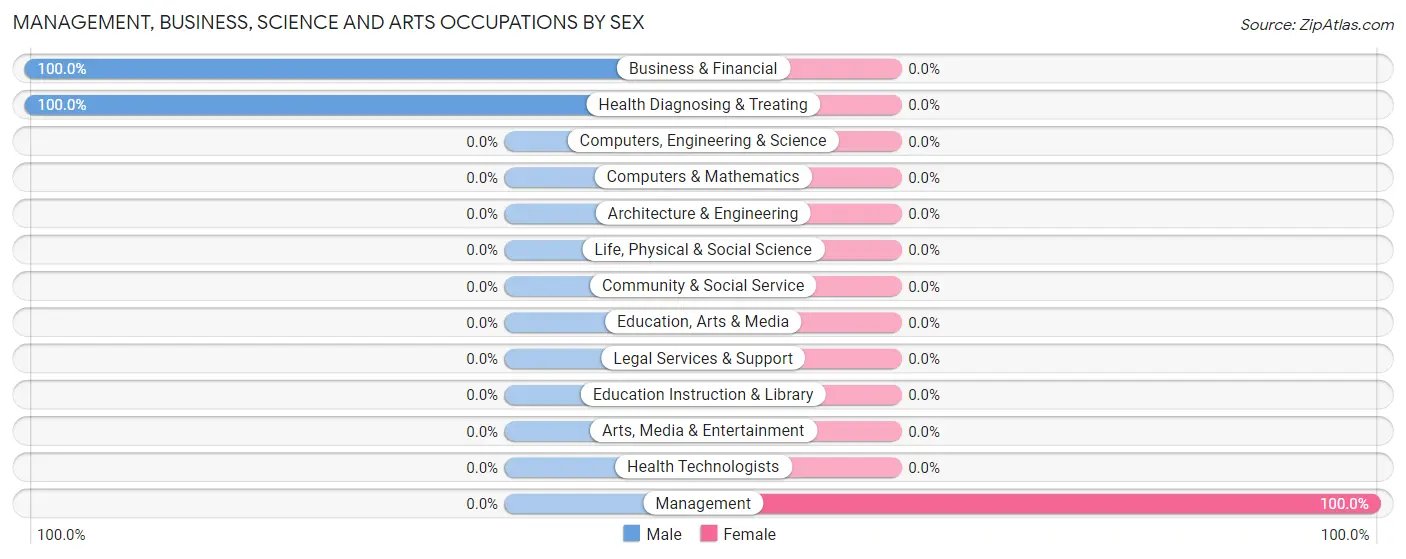
| Occupation | Male | Female |
| Management | 0 (0.0%) | 2 (100.0%) |
| Business & Financial | 2 (100.0%) | 0 (0.0%) |
| Computers, Engineering & Science | 0 (0.0%) | 0 (0.0%) |
| Computers & Mathematics | 0 (0.0%) | 0 (0.0%) |
| Architecture & Engineering | 0 (0.0%) | 0 (0.0%) |
| Life, Physical & Social Science | 0 (0.0%) | 0 (0.0%) |
| Community & Social Service | 0 (0.0%) | 0 (0.0%) |
| Education, Arts & Media | 0 (0.0%) | 0 (0.0%) |
| Legal Services & Support | 0 (0.0%) | 0 (0.0%) |
| Education Instruction & Library | 0 (0.0%) | 0 (0.0%) |
| Arts, Media & Entertainment | 0 (0.0%) | 0 (0.0%) |
| Health Diagnosing & Treating | 1 (100.0%) | 0 (0.0%) |
| Health Technologists | 0 (0.0%) | 0 (0.0%) |
| Total (Category) | 3 (60.0%) | 2 (40.0%) |
| Total (Overall) | 12 (54.5%) | 10 (45.5%) |
Services Occupations
The most common Services occupations in New Morgan borough are Healthcare Support (3 | 13.6%), and Food Preparation & Serving (2 | 9.1%).
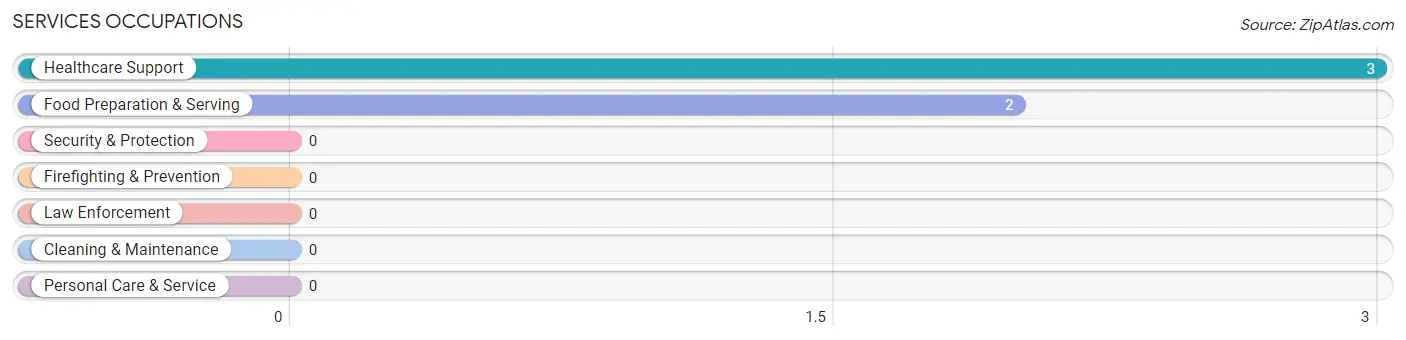
Services Occupations by Sex
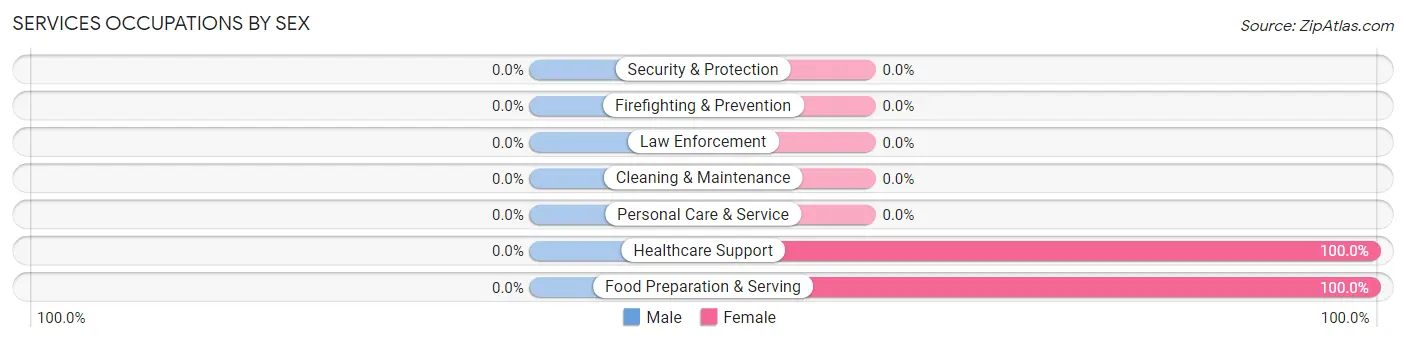
| Occupation | Male | Female |
| Healthcare Support | 0 (0.0%) | 3 (100.0%) |
| Security & Protection | 0 (0.0%) | 0 (0.0%) |
| Firefighting & Prevention | 0 (0.0%) | 0 (0.0%) |
| Law Enforcement | 0 (0.0%) | 0 (0.0%) |
| Food Preparation & Serving | 0 (0.0%) | 2 (100.0%) |
| Cleaning & Maintenance | 0 (0.0%) | 0 (0.0%) |
| Personal Care & Service | 0 (0.0%) | 0 (0.0%) |
| Total (Category) | 0 (0.0%) | 5 (100.0%) |
| Total (Overall) | 12 (54.5%) | 10 (45.5%) |
Sales and Office Occupations
The most common Sales and Office occupations in New Morgan borough are , and Sales & Related (7 | 31.8%).
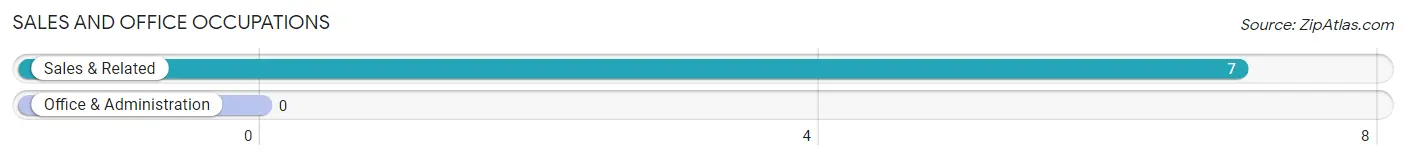
Sales and Office Occupations by Sex
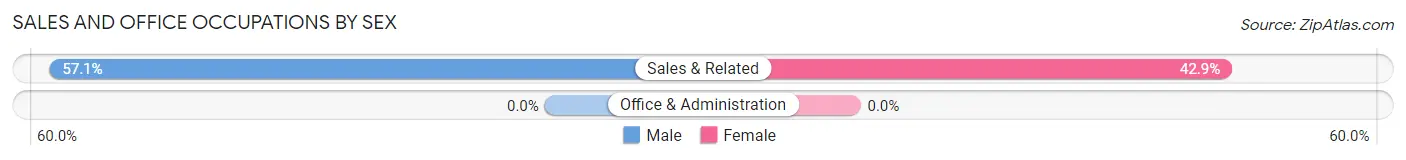
| Occupation | Male | Female |
| Sales & Related | 4 (57.1%) | 3 (42.9%) |
| Office & Administration | 0 (0.0%) | 0 (0.0%) |
| Total (Category) | 4 (57.1%) | 3 (42.9%) |
| Total (Overall) | 12 (54.5%) | 10 (45.5%) |
Natural Resources, Construction and Maintenance Occupations
Natural Resources, Construction and Maintenance Occupations by Sex
| Occupation | Male | Female |
| Farming, Fishing & Forestry | 0 (0.0%) | 0 (0.0%) |
| Construction & Extraction | 0 (0.0%) | 0 (0.0%) |
| Installation, Maintenance & Repair | 0 (0.0%) | 0 (0.0%) |
| Total (Category) | 0 (0.0%) | 0 (0.0%) |
| Total (Overall) | 12 (54.5%) | 10 (45.5%) |
Production, Transportation and Moving Occupations
The most common Production, Transportation and Moving occupations in New Morgan borough are Material Moving (3 | 13.6%), and Production (2 | 9.1%).
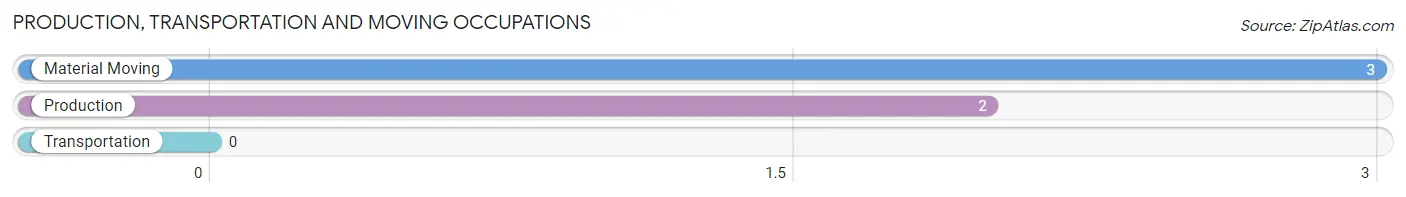
Production, Transportation and Moving Occupations by Sex
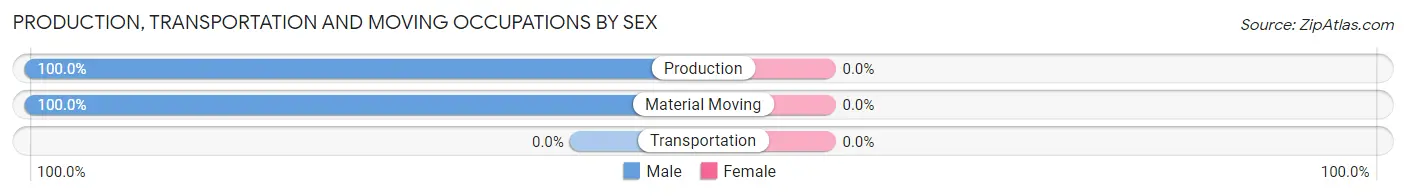
| Occupation | Male | Female |
| Production | 2 (100.0%) | 0 (0.0%) |
| Transportation | 0 (0.0%) | 0 (0.0%) |
| Material Moving | 3 (100.0%) | 0 (0.0%) |
| Total (Category) | 5 (100.0%) | 0 (0.0%) |
| Total (Overall) | 12 (54.5%) | 10 (45.5%) |
Employment Industries by Sex in New Morgan borough
Employment Industries in New Morgan borough
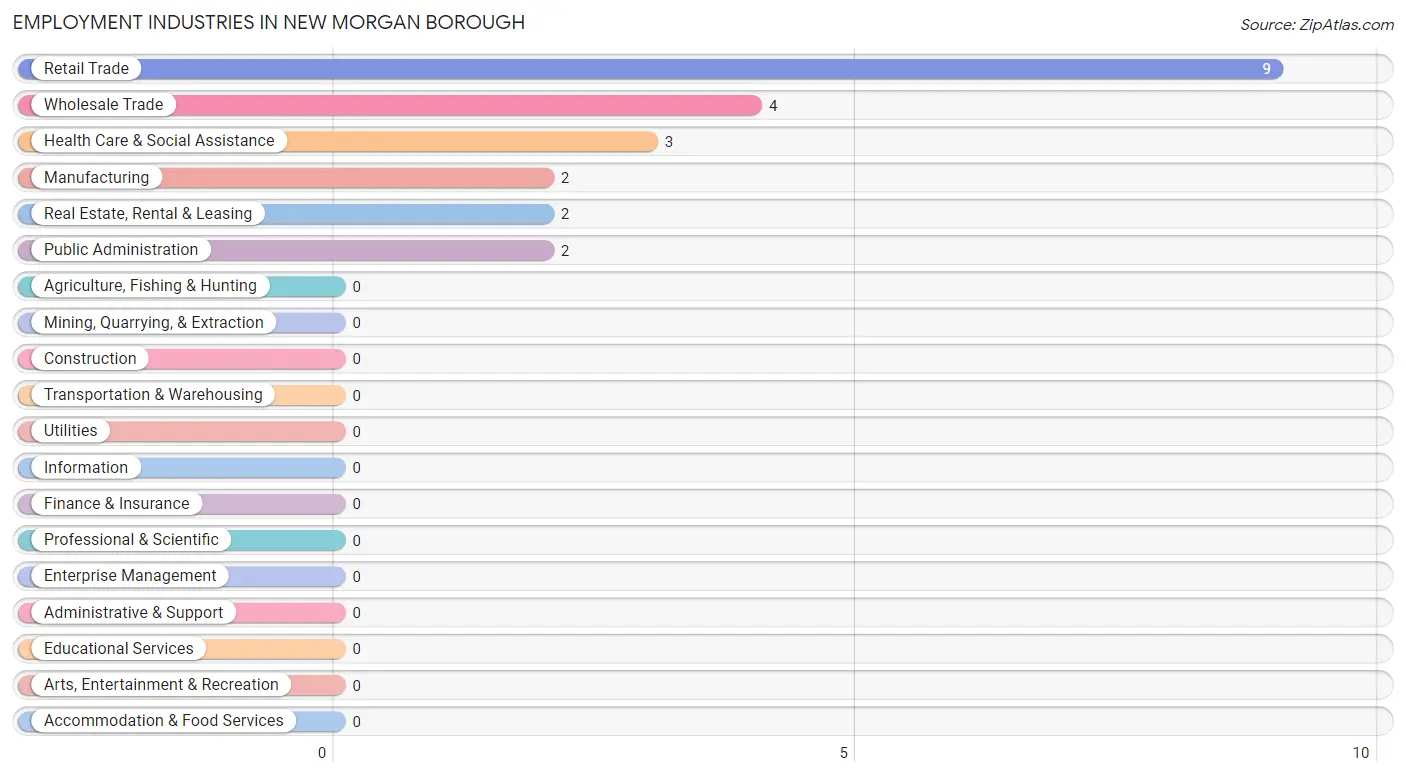
The major employment industries in New Morgan borough include Retail Trade (9 | 40.9%), Wholesale Trade (4 | 18.2%), Health Care & Social Assistance (3 | 13.6%), Manufacturing (2 | 9.1%), and Real Estate, Rental & Leasing (2 | 9.1%).
Employment Industries by Sex in New Morgan borough
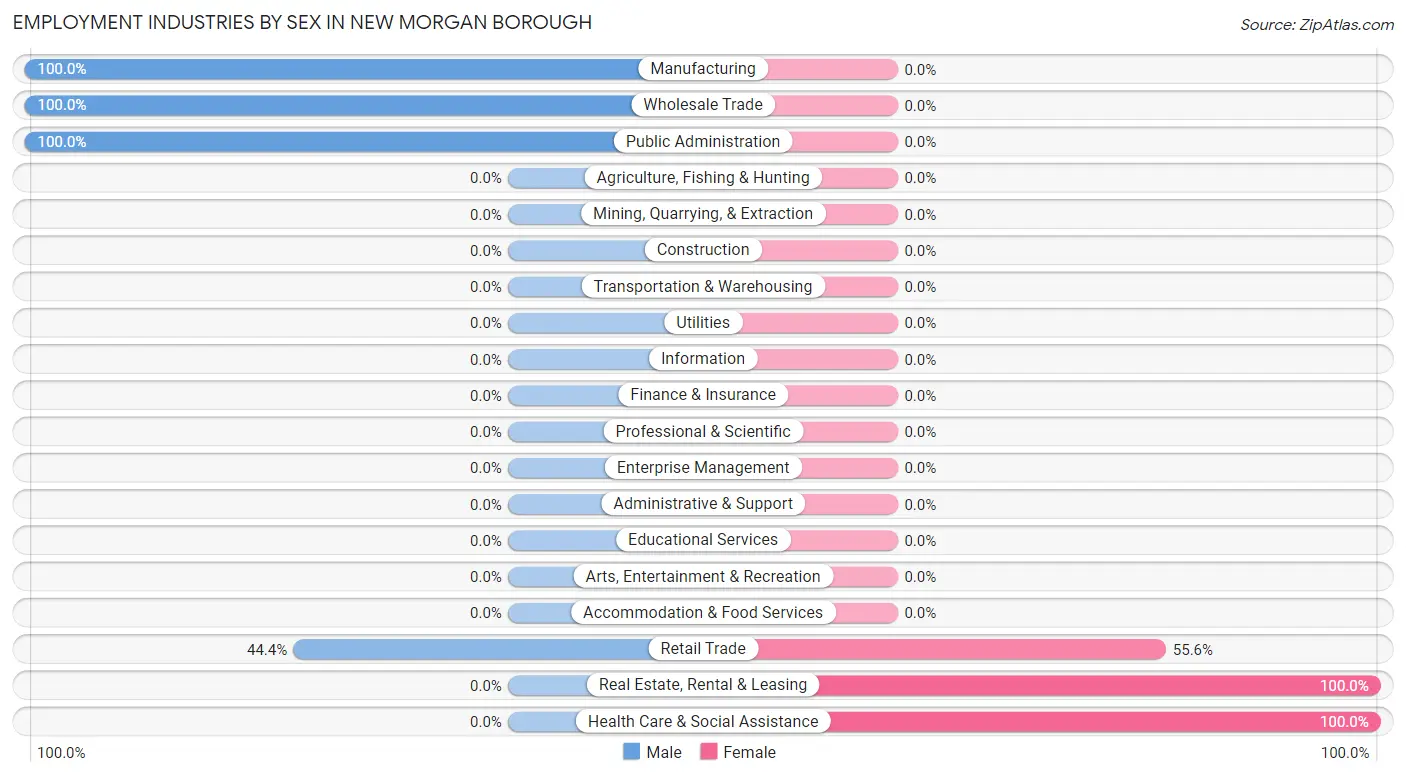
The New Morgan borough industries that see more men than women are Manufacturing (100.0%), Wholesale Trade (100.0%), and Public Administration (100.0%), whereas the industries that tend to have a higher number of women are Real Estate, Rental & Leasing (100.0%), Health Care & Social Assistance (100.0%), and Retail Trade (55.6%).
| Industry | Male | Female |
| Agriculture, Fishing & Hunting | 0 (0.0%) | 0 (0.0%) |
| Mining, Quarrying, & Extraction | 0 (0.0%) | 0 (0.0%) |
| Construction | 0 (0.0%) | 0 (0.0%) |
| Manufacturing | 2 (100.0%) | 0 (0.0%) |
| Wholesale Trade | 4 (100.0%) | 0 (0.0%) |
| Retail Trade | 4 (44.4%) | 5 (55.6%) |
| Transportation & Warehousing | 0 (0.0%) | 0 (0.0%) |
| Utilities | 0 (0.0%) | 0 (0.0%) |
| Information | 0 (0.0%) | 0 (0.0%) |
| Finance & Insurance | 0 (0.0%) | 0 (0.0%) |
| Real Estate, Rental & Leasing | 0 (0.0%) | 2 (100.0%) |
| Professional & Scientific | 0 (0.0%) | 0 (0.0%) |
| Enterprise Management | 0 (0.0%) | 0 (0.0%) |
| Administrative & Support | 0 (0.0%) | 0 (0.0%) |
| Educational Services | 0 (0.0%) | 0 (0.0%) |
| Health Care & Social Assistance | 0 (0.0%) | 3 (100.0%) |
| Arts, Entertainment & Recreation | 0 (0.0%) | 0 (0.0%) |
| Accommodation & Food Services | 0 (0.0%) | 0 (0.0%) |
| Public Administration | 2 (100.0%) | 0 (0.0%) |
| Total | 12 (54.5%) | 10 (45.5%) |
Education in New Morgan borough
School Enrollment in New Morgan borough
The most common levels of schooling among the 31 students in New Morgan borough are high school (16 | 51.6%), college / undergraduate (9 | 29.0%), and kindergarten (4 | 12.9%).
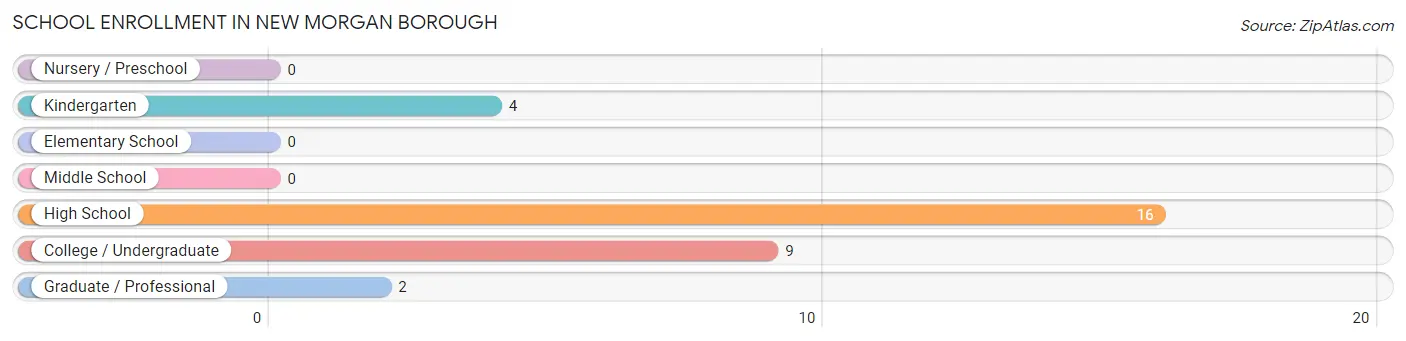
| School Level | # Students | % Students |
| Nursery / Preschool | 0 | 0.0% |
| Kindergarten | 4 | 12.9% |
| Elementary School | 0 | 0.0% |
| Middle School | 0 | 0.0% |
| High School | 16 | 51.6% |
| College / Undergraduate | 9 | 29.0% |
| Graduate / Professional | 2 | 6.5% |
| Total | 31 | 100.0% |
School Enrollment by Age by Funding Source in New Morgan borough
Out of a total of 31 students who are enrolled in schools in New Morgan borough, 11 (35.5%) attend a private institution, while the remaining 20 (64.5%) are enrolled in public schools. The age group of 18 to 19 year olds has the highest likelihood of being enrolled in private schools, with 2 (100.0% in the age bracket) enrolled. Conversely, the age group of 5 to 9 year old has the lowest likelihood of being enrolled in a private school, with 4 (100.0% in the age bracket) attending a public institution.
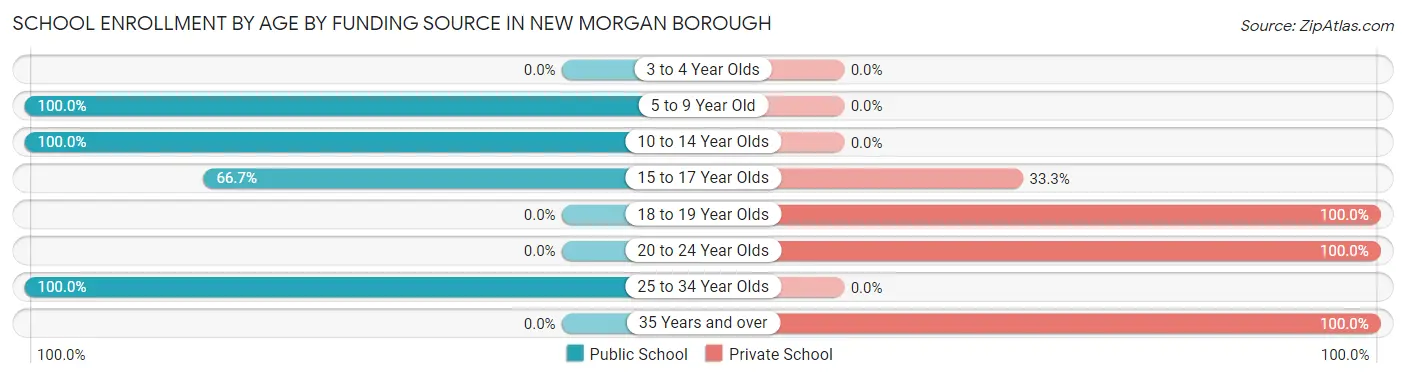
| Age Bracket | Public School | Private School |
| 3 to 4 Year Olds | 0 (0.0%) | 0 (0.0%) |
| 5 to 9 Year Old | 4 (100.0%) | 0 (0.0%) |
| 10 to 14 Year Olds | 2 (100.0%) | 0 (0.0%) |
| 15 to 17 Year Olds | 8 (66.7%) | 4 (33.3%) |
| 18 to 19 Year Olds | 0 (0.0%) | 2 (100.0%) |
| 20 to 24 Year Olds | 0 (0.0%) | 3 (100.0%) |
| 25 to 34 Year Olds | 6 (100.0%) | 0 (0.0%) |
| 35 Years and over | 0 (0.0%) | 2 (100.0%) |
| Total | 20 (64.5%) | 11 (35.5%) |
Educational Attainment by Field of Study in New Morgan borough
Business (4 | 50.0%), psychology (2 | 25.0%), and arts & humanities (2 | 25.0%) are the most common fields of study among 8 individuals in New Morgan borough who have obtained a bachelor's degree or higher.
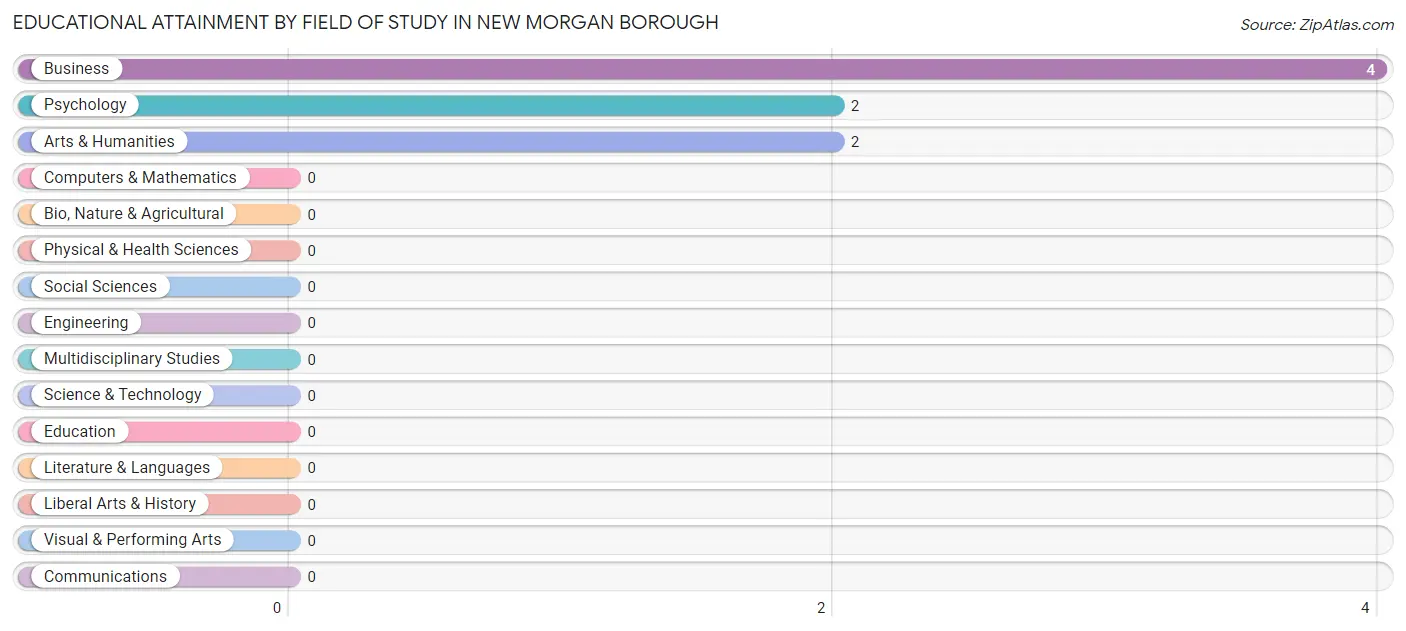
| Field of Study | # Graduates | % Graduates |
| Computers & Mathematics | 0 | 0.0% |
| Bio, Nature & Agricultural | 0 | 0.0% |
| Physical & Health Sciences | 0 | 0.0% |
| Psychology | 2 | 25.0% |
| Social Sciences | 0 | 0.0% |
| Engineering | 0 | 0.0% |
| Multidisciplinary Studies | 0 | 0.0% |
| Science & Technology | 0 | 0.0% |
| Business | 4 | 50.0% |
| Education | 0 | 0.0% |
| Literature & Languages | 0 | 0.0% |
| Liberal Arts & History | 0 | 0.0% |
| Visual & Performing Arts | 0 | 0.0% |
| Communications | 0 | 0.0% |
| Arts & Humanities | 2 | 25.0% |
| Total | 8 | 100.0% |
Transportation & Commute in New Morgan borough
Vehicle Availability by Sex in New Morgan borough
The most prevalent vehicle ownership categories in New Morgan borough are males with 5 or more vehicles (5, accounting for 41.7%) and females with 5 or more vehicles (5, making up 50.0%).
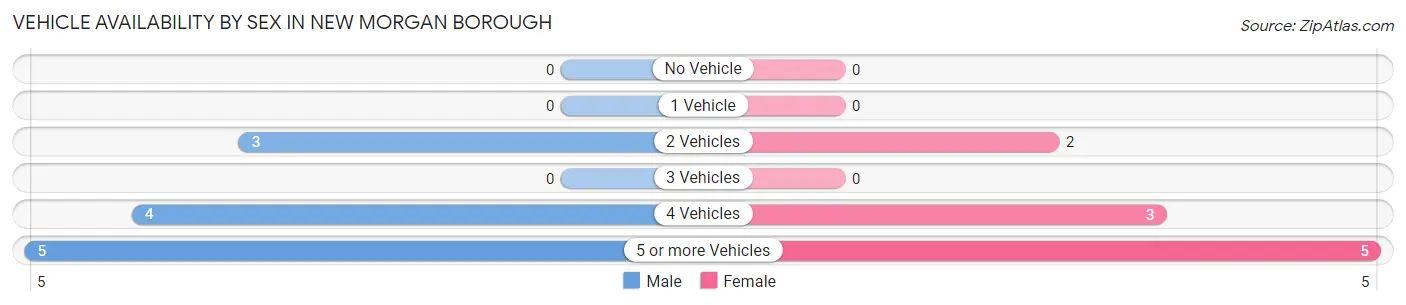
| Vehicles Available | Male | Female |
| No Vehicle | 0 (0.0%) | 0 (0.0%) |
| 1 Vehicle | 0 (0.0%) | 0 (0.0%) |
| 2 Vehicles | 3 (25.0%) | 2 (20.0%) |
| 3 Vehicles | 0 (0.0%) | 0 (0.0%) |
| 4 Vehicles | 4 (33.3%) | 3 (30.0%) |
| 5 or more Vehicles | 5 (41.7%) | 5 (50.0%) |
| Total | 12 (100.0%) | 10 (100.0%) |
Commute Time in New Morgan borough
The most frequently occuring commute durations in New Morgan borough are 35 to 39 minutes (4 commuters, 20.0%), 20 to 24 minutes (3 commuters, 15.0%), and 40 to 44 minutes (3 commuters, 15.0%).
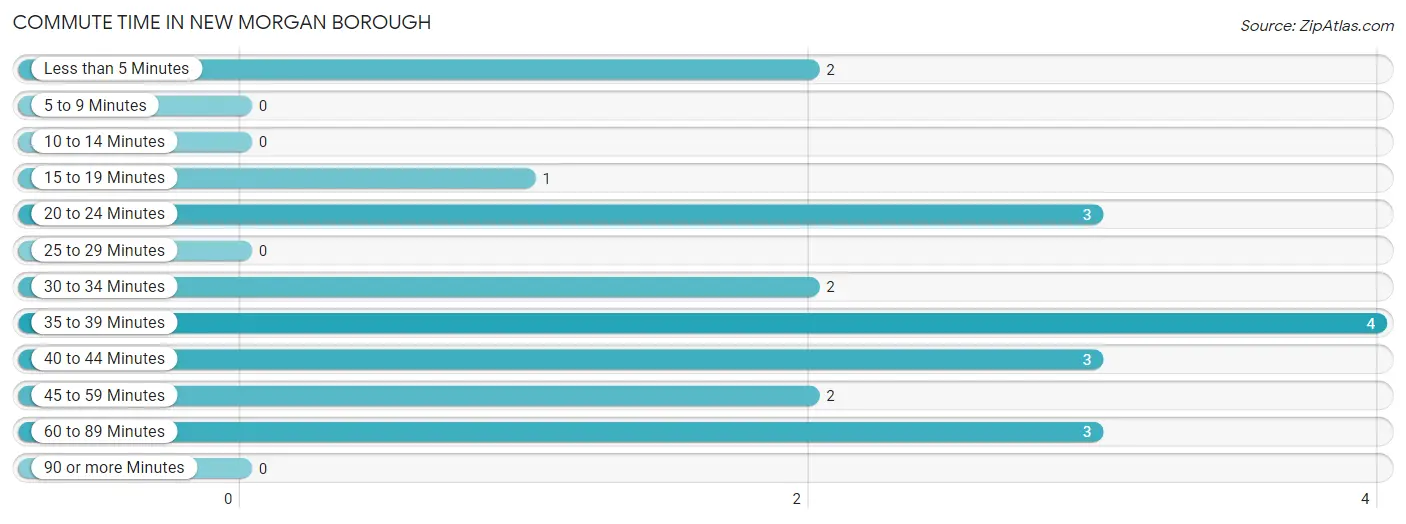
| Commute Time | # Commuters | % Commuters |
| Less than 5 Minutes | 2 | 10.0% |
| 5 to 9 Minutes | 0 | 0.0% |
| 10 to 14 Minutes | 0 | 0.0% |
| 15 to 19 Minutes | 1 | 5.0% |
| 20 to 24 Minutes | 3 | 15.0% |
| 25 to 29 Minutes | 0 | 0.0% |
| 30 to 34 Minutes | 2 | 10.0% |
| 35 to 39 Minutes | 4 | 20.0% |
| 40 to 44 Minutes | 3 | 15.0% |
| 45 to 59 Minutes | 2 | 10.0% |
| 60 to 89 Minutes | 3 | 15.0% |
| 90 or more Minutes | 0 | 0.0% |
Commute Time by Sex in New Morgan borough
The most common commute times in New Morgan borough are 35 to 39 minutes (4 commuters, 33.3%) for males and 20 to 24 minutes (3 commuters, 37.5%) for females.
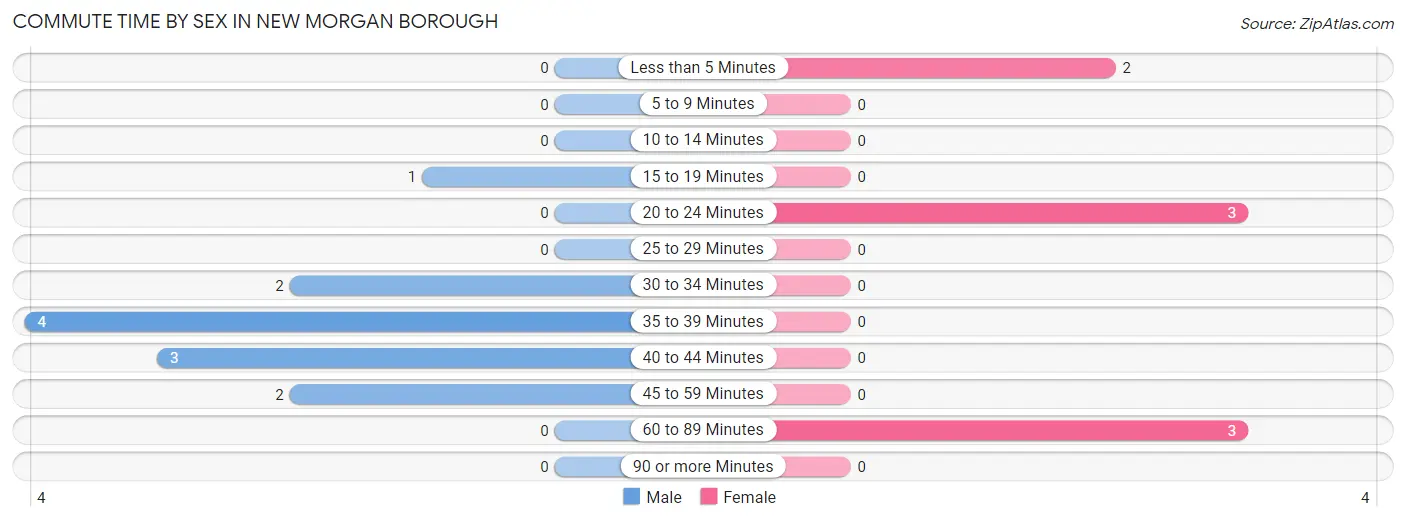
| Commute Time | Male | Female |
| Less than 5 Minutes | 0 (0.0%) | 2 (25.0%) |
| 5 to 9 Minutes | 0 (0.0%) | 0 (0.0%) |
| 10 to 14 Minutes | 0 (0.0%) | 0 (0.0%) |
| 15 to 19 Minutes | 1 (8.3%) | 0 (0.0%) |
| 20 to 24 Minutes | 0 (0.0%) | 3 (37.5%) |
| 25 to 29 Minutes | 0 (0.0%) | 0 (0.0%) |
| 30 to 34 Minutes | 2 (16.7%) | 0 (0.0%) |
| 35 to 39 Minutes | 4 (33.3%) | 0 (0.0%) |
| 40 to 44 Minutes | 3 (25.0%) | 0 (0.0%) |
| 45 to 59 Minutes | 2 (16.7%) | 0 (0.0%) |
| 60 to 89 Minutes | 0 (0.0%) | 3 (37.5%) |
| 90 or more Minutes | 0 (0.0%) | 0 (0.0%) |
Time of Departure to Work by Sex in New Morgan borough
The most frequent times of departure to work in New Morgan borough are 12:00 AM to 4:59 AM (4, 33.3%) for males and 6:00 AM to 6:29 AM (3, 37.5%) for females.
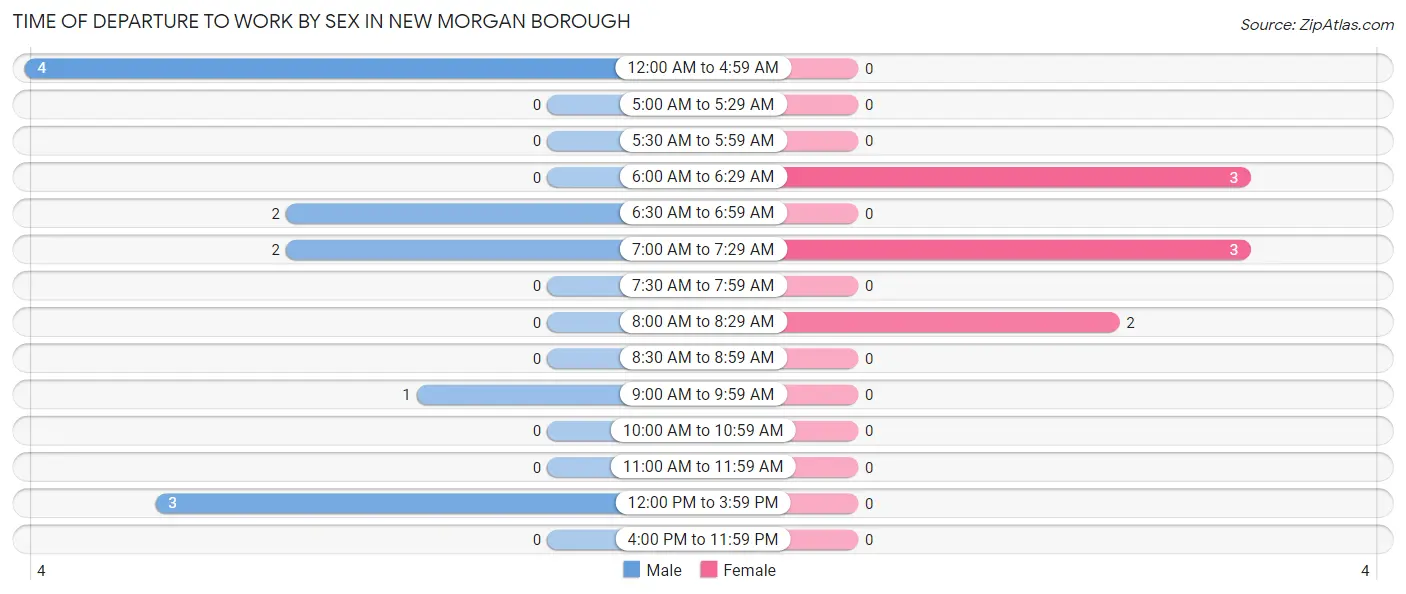
| Time of Departure | Male | Female |
| 12:00 AM to 4:59 AM | 4 (33.3%) | 0 (0.0%) |
| 5:00 AM to 5:29 AM | 0 (0.0%) | 0 (0.0%) |
| 5:30 AM to 5:59 AM | 0 (0.0%) | 0 (0.0%) |
| 6:00 AM to 6:29 AM | 0 (0.0%) | 3 (37.5%) |
| 6:30 AM to 6:59 AM | 2 (16.7%) | 0 (0.0%) |
| 7:00 AM to 7:29 AM | 2 (16.7%) | 3 (37.5%) |
| 7:30 AM to 7:59 AM | 0 (0.0%) | 0 (0.0%) |
| 8:00 AM to 8:29 AM | 0 (0.0%) | 2 (25.0%) |
| 8:30 AM to 8:59 AM | 0 (0.0%) | 0 (0.0%) |
| 9:00 AM to 9:59 AM | 1 (8.3%) | 0 (0.0%) |
| 10:00 AM to 10:59 AM | 0 (0.0%) | 0 (0.0%) |
| 11:00 AM to 11:59 AM | 0 (0.0%) | 0 (0.0%) |
| 12:00 PM to 3:59 PM | 3 (25.0%) | 0 (0.0%) |
| 4:00 PM to 11:59 PM | 0 (0.0%) | 0 (0.0%) |
| Total | 12 (100.0%) | 8 (100.0%) |
Housing Occupancy in New Morgan borough
Occupancy by Ownership in New Morgan borough
Of the total 10 dwellings in New Morgan borough, owner-occupied units account for 0 (0.0%), while renter-occupied units make up 10 (100.0%).
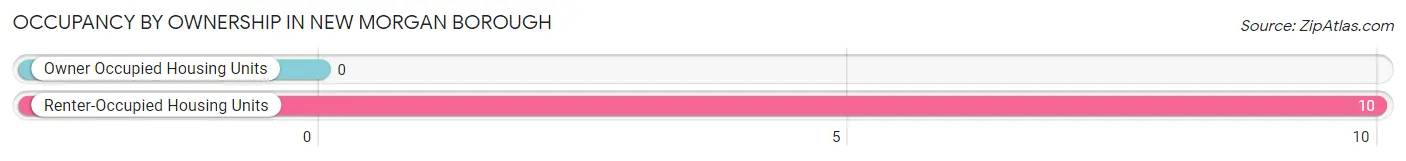
| Occupancy | # Housing Units | % Housing Units |
| Owner Occupied Housing Units | 0 | 0.0% |
| Renter-Occupied Housing Units | 10 | 100.0% |
| Total Occupied Housing Units | 10 | 100.0% |
Occupancy by Household Size in New Morgan borough
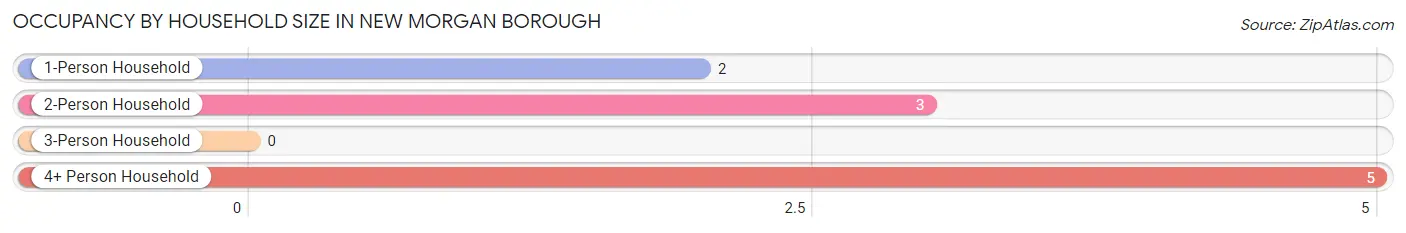
| Household Size | # Housing Units | % Housing Units |
| 1-Person Household | 2 | 20.0% |
| 2-Person Household | 3 | 30.0% |
| 3-Person Household | 0 | 0.0% |
| 4+ Person Household | 5 | 50.0% |
| Total Housing Units | 10 | 100.0% |
Occupancy by Ownership by Household Size in New Morgan borough
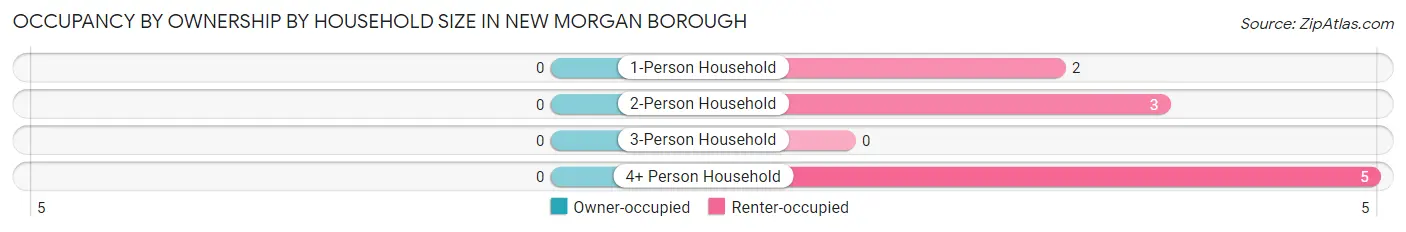
| Household Size | Owner-occupied | Renter-occupied |
| 1-Person Household | 0 (0.0%) | 2 (100.0%) |
| 2-Person Household | 0 (0.0%) | 3 (100.0%) |
| 3-Person Household | 0 (0.0%) | 0 (0.0%) |
| 4+ Person Household | 0 (0.0%) | 5 (100.0%) |
| Total Housing Units | 0 (0.0%) | 10 (100.0%) |
Occupancy by Educational Attainment in New Morgan borough
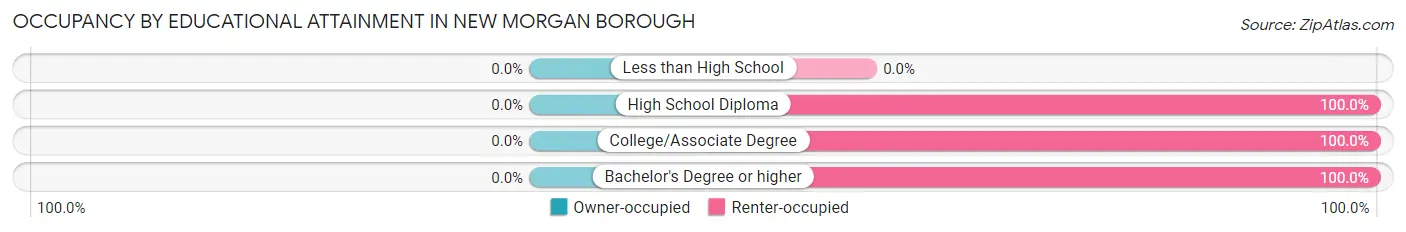
| Household Size | Owner-occupied | Renter-occupied |
| Less than High School | 0 (0.0%) | 0 (0.0%) |
| High School Diploma | 0 (0.0%) | 5 (100.0%) |
| College/Associate Degree | 0 (0.0%) | 1 (100.0%) |
| Bachelor's Degree or higher | 0 (0.0%) | 4 (100.0%) |
Occupancy by Age of Householder in New Morgan borough
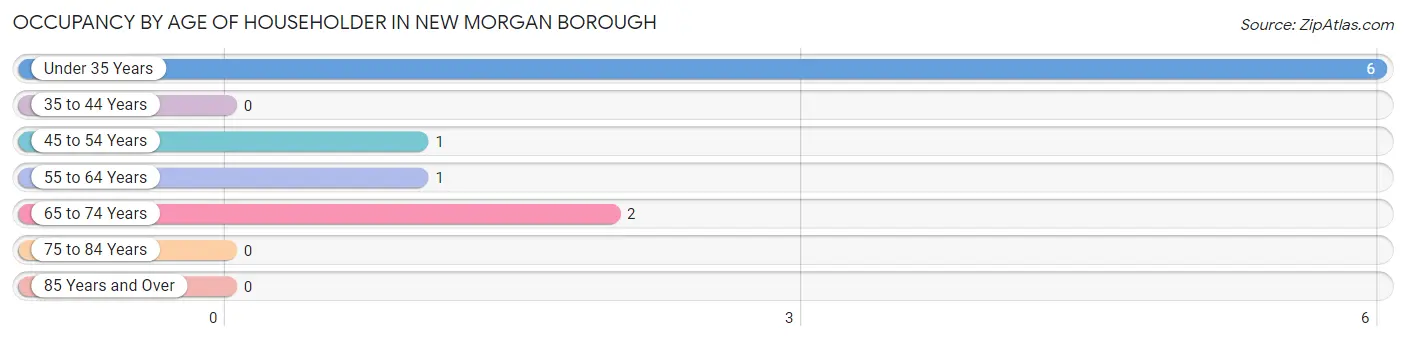
| Age Bracket | # Households | % Households |
| Under 35 Years | 6 | 60.0% |
| 35 to 44 Years | 0 | 0.0% |
| 45 to 54 Years | 1 | 10.0% |
| 55 to 64 Years | 1 | 10.0% |
| 65 to 74 Years | 2 | 20.0% |
| 75 to 84 Years | 0 | 0.0% |
| 85 Years and Over | 0 | 0.0% |
| Total | 10 | 100.0% |
Housing Finances in New Morgan borough
Median Income by Occupancy in New Morgan borough
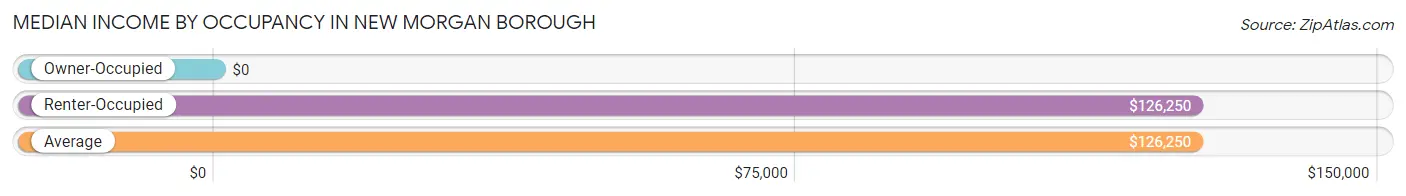
| Occupancy Type | # Households | Median Income |
| Owner-Occupied | 0 (0.0%) | $0 |
| Renter-Occupied | 10 (100.0%) | $126,250 |
| Average | 10 (100.0%) | $126,250 |
Occupancy by Householder Income Bracket in New Morgan borough
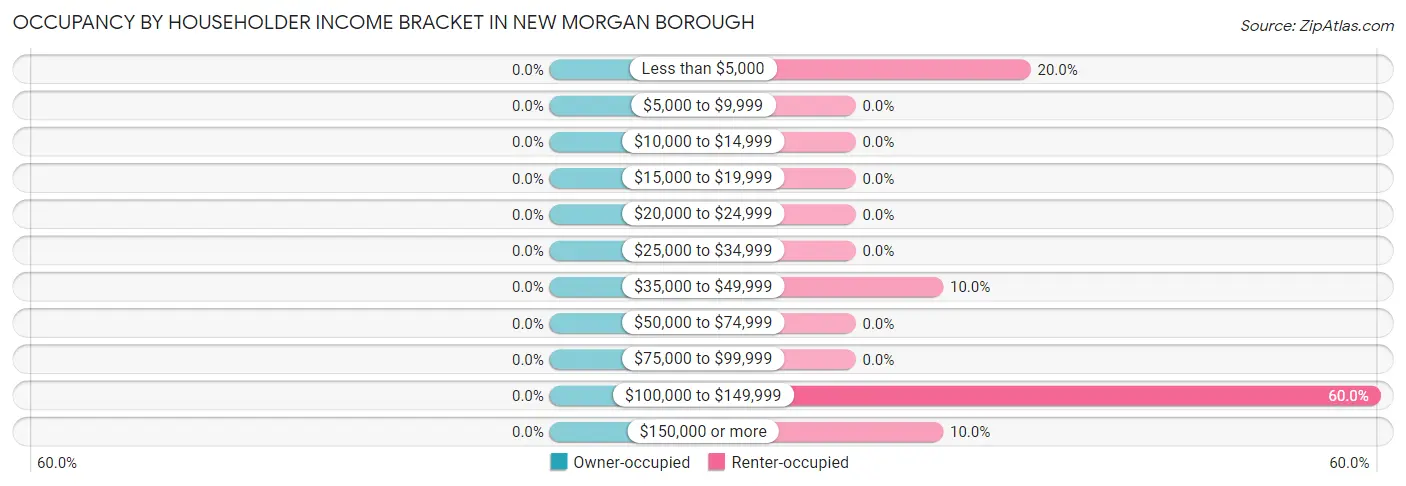
| Income Bracket | Owner-occupied | Renter-occupied |
| Less than $5,000 | 0 (0.0%) | 2 (20.0%) |
| $5,000 to $9,999 | 0 (0.0%) | 0 (0.0%) |
| $10,000 to $14,999 | 0 (0.0%) | 0 (0.0%) |
| $15,000 to $19,999 | 0 (0.0%) | 0 (0.0%) |
| $20,000 to $24,999 | 0 (0.0%) | 0 (0.0%) |
| $25,000 to $34,999 | 0 (0.0%) | 0 (0.0%) |
| $35,000 to $49,999 | 0 (0.0%) | 1 (10.0%) |
| $50,000 to $74,999 | 0 (0.0%) | 0 (0.0%) |
| $75,000 to $99,999 | 0 (0.0%) | 0 (0.0%) |
| $100,000 to $149,999 | 0 (0.0%) | 6 (60.0%) |
| $150,000 or more | 0 (0.0%) | 1 (10.0%) |
| Total | 0 (0.0%) | 10 (100.0%) |
Monthly Housing Cost Tiers in New Morgan borough
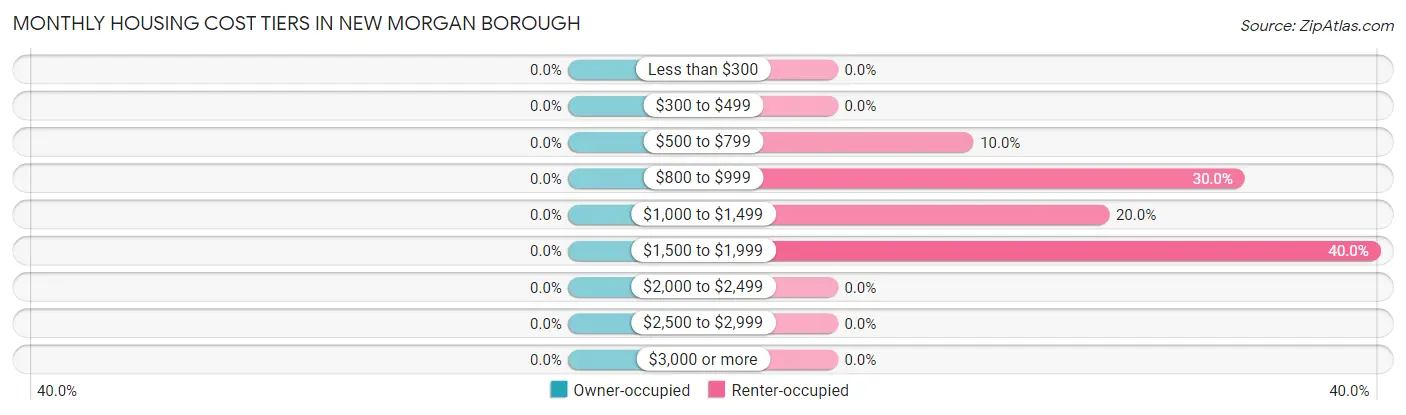
| Monthly Cost | Owner-occupied | Renter-occupied |
| Less than $300 | 0 (0.0%) | 0 (0.0%) |
| $300 to $499 | 0 (0.0%) | 0 (0.0%) |
| $500 to $799 | 0 (0.0%) | 1 (10.0%) |
| $800 to $999 | 0 (0.0%) | 3 (30.0%) |
| $1,000 to $1,499 | 0 (0.0%) | 2 (20.0%) |
| $1,500 to $1,999 | 0 (0.0%) | 4 (40.0%) |
| $2,000 to $2,499 | 0 (0.0%) | 0 (0.0%) |
| $2,500 to $2,999 | 0 (0.0%) | 0 (0.0%) |
| $3,000 or more | 0 (0.0%) | 0 (0.0%) |
| Total | 0 (0.0%) | 10 (100.0%) |
Physical Housing Characteristics in New Morgan borough
Housing Structures in New Morgan borough
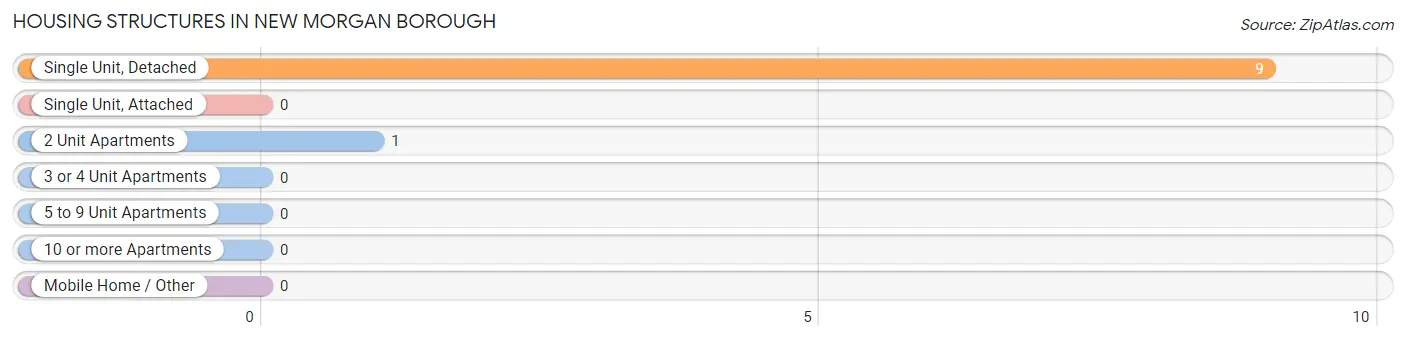
| Structure Type | # Housing Units | % Housing Units |
| Single Unit, Detached | 9 | 90.0% |
| Single Unit, Attached | 0 | 0.0% |
| 2 Unit Apartments | 1 | 10.0% |
| 3 or 4 Unit Apartments | 0 | 0.0% |
| 5 to 9 Unit Apartments | 0 | 0.0% |
| 10 or more Apartments | 0 | 0.0% |
| Mobile Home / Other | 0 | 0.0% |
| Total | 10 | 100.0% |
Housing Structures by Occupancy in New Morgan borough
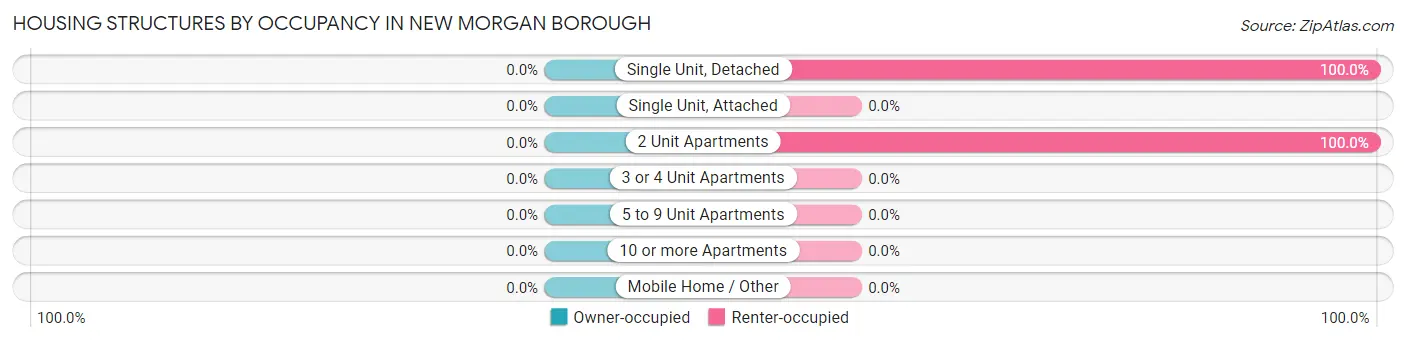
| Structure Type | Owner-occupied | Renter-occupied |
| Single Unit, Detached | 0 (0.0%) | 9 (100.0%) |
| Single Unit, Attached | 0 (0.0%) | 0 (0.0%) |
| 2 Unit Apartments | 0 (0.0%) | 1 (100.0%) |
| 3 or 4 Unit Apartments | 0 (0.0%) | 0 (0.0%) |
| 5 to 9 Unit Apartments | 0 (0.0%) | 0 (0.0%) |
| 10 or more Apartments | 0 (0.0%) | 0 (0.0%) |
| Mobile Home / Other | 0 (0.0%) | 0 (0.0%) |
| Total | 0 (0.0%) | 10 (100.0%) |
Housing Structures by Number of Rooms in New Morgan borough
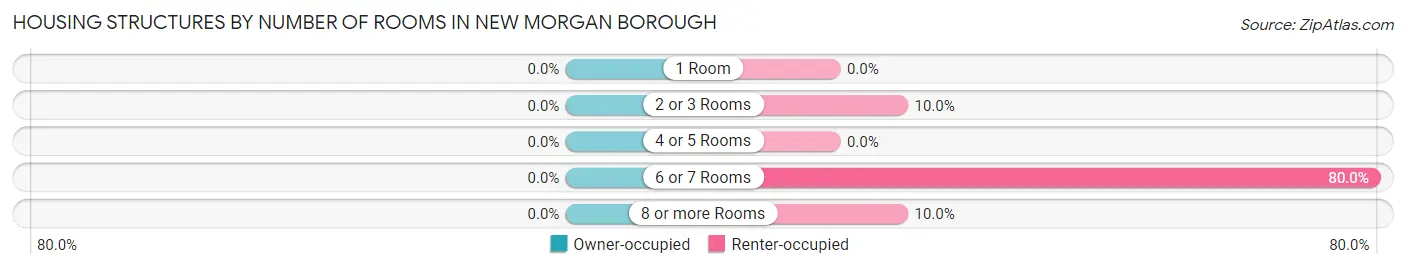
| Number of Rooms | Owner-occupied | Renter-occupied |
| 1 Room | 0 (0.0%) | 0 (0.0%) |
| 2 or 3 Rooms | 0 (0.0%) | 1 (10.0%) |
| 4 or 5 Rooms | 0 (0.0%) | 0 (0.0%) |
| 6 or 7 Rooms | 0 (0.0%) | 8 (80.0%) |
| 8 or more Rooms | 0 (0.0%) | 1 (10.0%) |
| Total | 0 (0.0%) | 10 (100.0%) |
Housing Structure by Heating Type in New Morgan borough
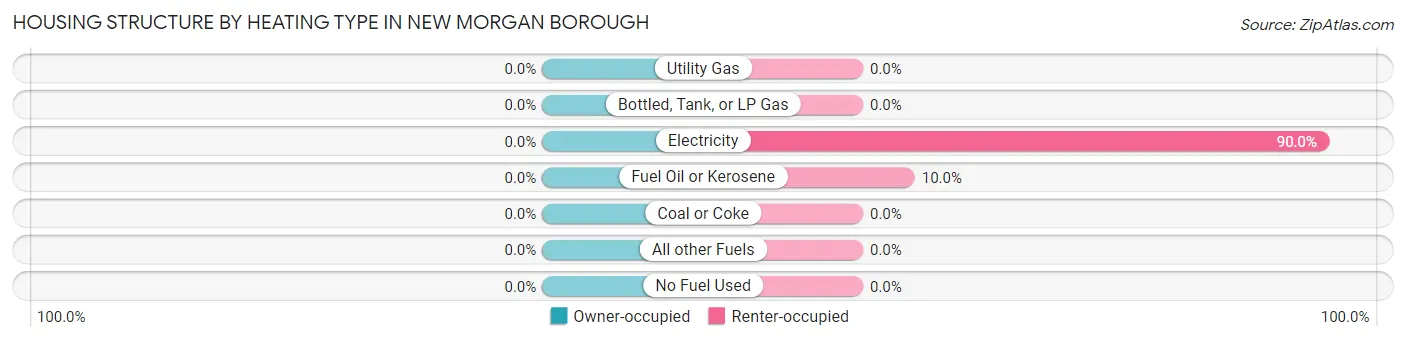
| Heating Type | Owner-occupied | Renter-occupied |
| Utility Gas | 0 (0.0%) | 0 (0.0%) |
| Bottled, Tank, or LP Gas | 0 (0.0%) | 0 (0.0%) |
| Electricity | 0 (0.0%) | 9 (90.0%) |
| Fuel Oil or Kerosene | 0 (0.0%) | 1 (10.0%) |
| Coal or Coke | 0 (0.0%) | 0 (0.0%) |
| All other Fuels | 0 (0.0%) | 0 (0.0%) |
| No Fuel Used | 0 (0.0%) | 0 (0.0%) |
| Total | 0 (0.0%) | 10 (100.0%) |
Household Vehicle Usage in New Morgan borough
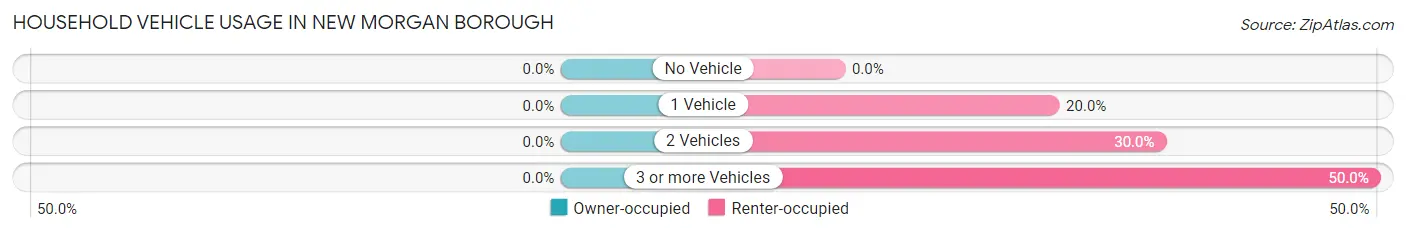
| Vehicles per Household | Owner-occupied | Renter-occupied |
| No Vehicle | 0 (0.0%) | 0 (0.0%) |
| 1 Vehicle | 0 (0.0%) | 2 (20.0%) |
| 2 Vehicles | 0 (0.0%) | 3 (30.0%) |
| 3 or more Vehicles | 0 (0.0%) | 5 (50.0%) |
| Total | 0 (0.0%) | 10 (100.0%) |
Real Estate & Mortgages in New Morgan borough
Real Estate and Mortgage Overview in New Morgan borough
| Characteristic | Without Mortgage | With Mortgage |
| Housing Units | 0 | 0 |
| Median Property Value | - | - |
| Median Household Income | - | - |
| Monthly Housing Costs | - | - |
| Real Estate Taxes | - | - |
Property Value by Mortgage Status in New Morgan borough
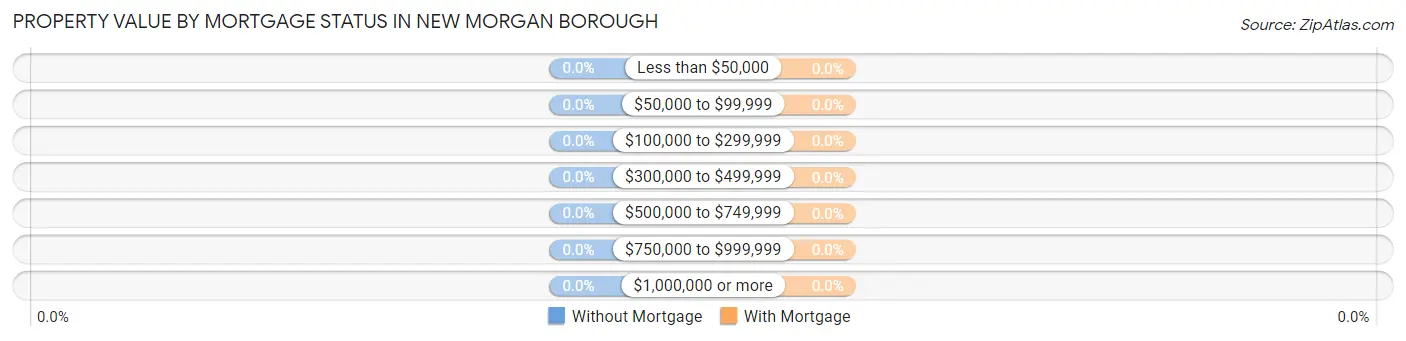
| Property Value | Without Mortgage | With Mortgage |
| Less than $50,000 | 0 (0.0%) | 0 (0.0%) |
| $50,000 to $99,999 | 0 (0.0%) | 0 (0.0%) |
| $100,000 to $299,999 | 0 (0.0%) | 0 (0.0%) |
| $300,000 to $499,999 | 0 (0.0%) | 0 (0.0%) |
| $500,000 to $749,999 | 0 (0.0%) | 0 (0.0%) |
| $750,000 to $999,999 | 0 (0.0%) | 0 (0.0%) |
| $1,000,000 or more | 0 (0.0%) | 0 (0.0%) |
| Total | 0 (0.0%) | 0 (0.0%) |
Household Income by Mortgage Status in New Morgan borough
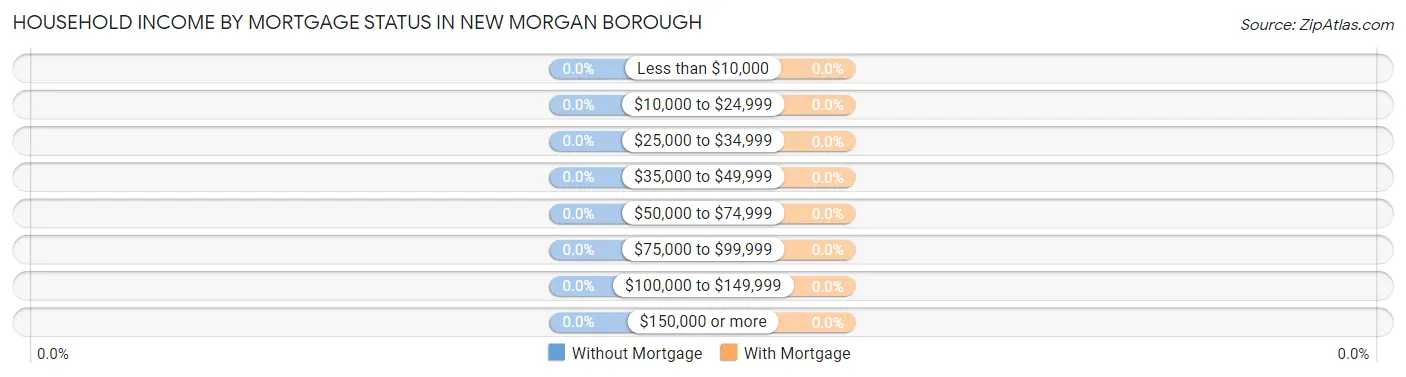
| Household Income | Without Mortgage | With Mortgage |
| Less than $10,000 | 0 (0.0%) | 0 (0.0%) |
| $10,000 to $24,999 | 0 (0.0%) | 0 (0.0%) |
| $25,000 to $34,999 | 0 (0.0%) | 0 (0.0%) |
| $35,000 to $49,999 | 0 (0.0%) | 0 (0.0%) |
| $50,000 to $74,999 | 0 (0.0%) | 0 (0.0%) |
| $75,000 to $99,999 | 0 (0.0%) | 0 (0.0%) |
| $100,000 to $149,999 | 0 (0.0%) | 0 (0.0%) |
| $150,000 or more | 0 (0.0%) | 0 (0.0%) |
| Total | 0 (0.0%) | 0 (0.0%) |
Property Value to Household Income Ratio in New Morgan borough
| Value-to-Income Ratio | Without Mortgage | With Mortgage |
| Less than 2.0x | 0 (0.0%) | 0 (0.0%) |
| 2.0x to 2.9x | 0 (0.0%) | 0 (0.0%) |
| 3.0x to 3.9x | 0 (0.0%) | 0 (0.0%) |
| 4.0x or more | 0 (0.0%) | 0 (0.0%) |
| Total | 0 (0.0%) | 0 (0.0%) |
Real Estate Taxes by Mortgage Status in New Morgan borough
| Property Taxes | Without Mortgage | With Mortgage |
| Less than $800 | 0 (0.0%) | 0 (0.0%) |
| $800 to $1,499 | 0 (0.0%) | 0 (0.0%) |
| $800 to $1,499 | 0 (0.0%) | 0 (0.0%) |
| Total | 0 (0.0%) | 0 (0.0%) |
Health & Disability in New Morgan borough
Health Insurance Coverage by Age in New Morgan borough
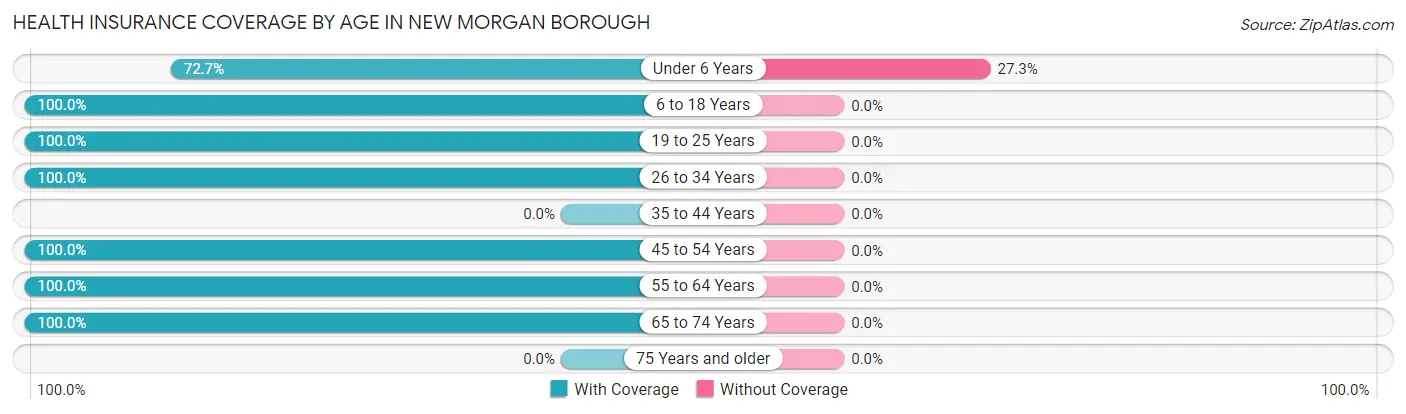
| Age Bracket | With Coverage | Without Coverage |
| Under 6 Years | 8 (72.7%) | 3 (27.3%) |
| 6 to 18 Years | 1 (100.0%) | 0 (0.0%) |
| 19 to 25 Years | 11 (100.0%) | 0 (0.0%) |
| 26 to 34 Years | 9 (100.0%) | 0 (0.0%) |
| 35 to 44 Years | 0 (0.0%) | 0 (0.0%) |
| 45 to 54 Years | 3 (100.0%) | 0 (0.0%) |
| 55 to 64 Years | 1 (100.0%) | 0 (0.0%) |
| 65 to 74 Years | 4 (100.0%) | 0 (0.0%) |
| 75 Years and older | 0 (0.0%) | 0 (0.0%) |
| Total | 37 (92.5%) | 3 (7.5%) |
Health Insurance Coverage by Citizenship Status in New Morgan borough
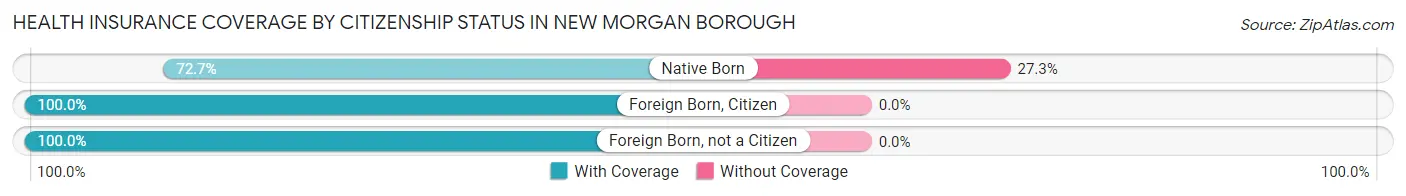
| Citizenship Status | With Coverage | Without Coverage |
| Native Born | 8 (72.7%) | 3 (27.3%) |
| Foreign Born, Citizen | 1 (100.0%) | 0 (0.0%) |
| Foreign Born, not a Citizen | 11 (100.0%) | 0 (0.0%) |
Health Insurance Coverage by Household Income in New Morgan borough
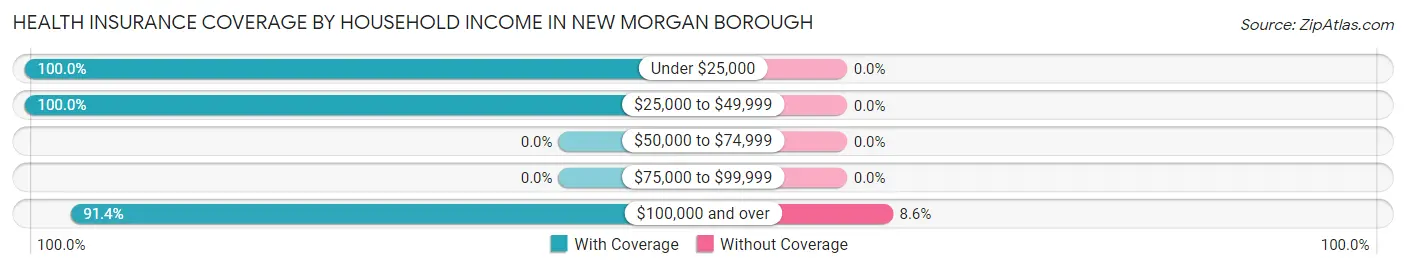
| Household Income | With Coverage | Without Coverage |
| Under $25,000 | 2 (100.0%) | 0 (0.0%) |
| $25,000 to $49,999 | 3 (100.0%) | 0 (0.0%) |
| $50,000 to $74,999 | 0 (0.0%) | 0 (0.0%) |
| $75,000 to $99,999 | 0 (0.0%) | 0 (0.0%) |
| $100,000 and over | 32 (91.4%) | 3 (8.6%) |
Public vs Private Health Insurance Coverage by Age in New Morgan borough
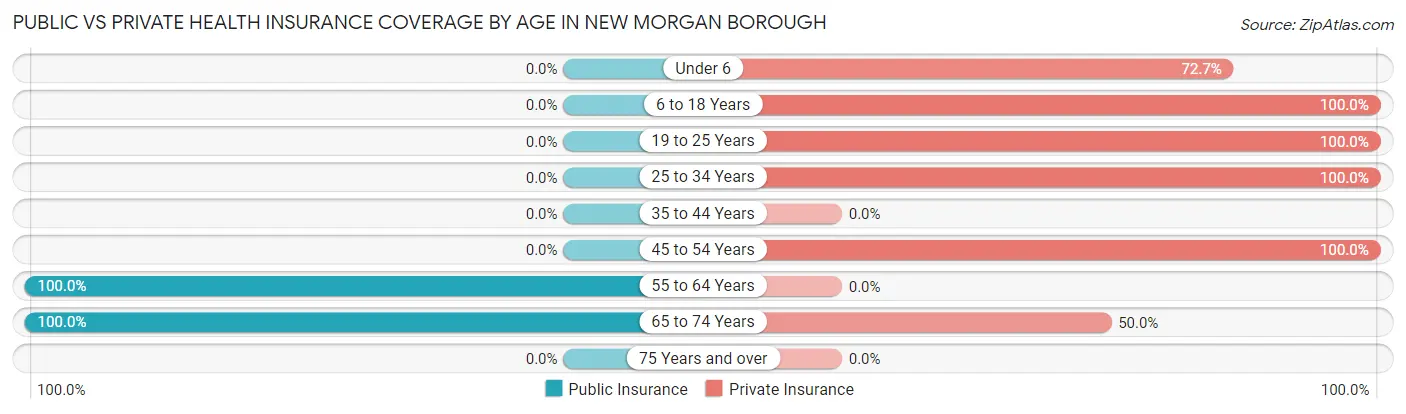
| Age Bracket | Public Insurance | Private Insurance |
| Under 6 | 0 (0.0%) | 8 (72.7%) |
| 6 to 18 Years | 0 (0.0%) | 1 (100.0%) |
| 19 to 25 Years | 0 (0.0%) | 11 (100.0%) |
| 25 to 34 Years | 0 (0.0%) | 9 (100.0%) |
| 35 to 44 Years | 0 (0.0%) | 0 (0.0%) |
| 45 to 54 Years | 0 (0.0%) | 3 (100.0%) |
| 55 to 64 Years | 1 (100.0%) | 0 (0.0%) |
| 65 to 74 Years | 4 (100.0%) | 2 (50.0%) |
| 75 Years and over | 0 (0.0%) | 0 (0.0%) |
| Total | 5 (12.5%) | 34 (85.0%) |
Disability Status by Sex by Age in New Morgan borough
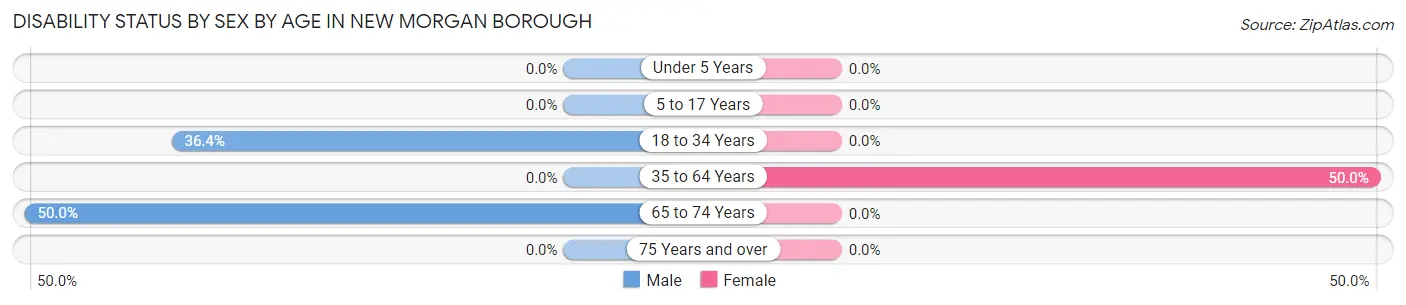
| Age Bracket | Male | Female |
| Under 5 Years | 0 (0.0%) | 0 (0.0%) |
| 5 to 17 Years | 0 (0.0%) | 0 (0.0%) |
| 18 to 34 Years | 4 (36.4%) | 0 (0.0%) |
| 35 to 64 Years | 0 (0.0%) | 1 (50.0%) |
| 65 to 74 Years | 2 (50.0%) | 0 (0.0%) |
| 75 Years and over | 0 (0.0%) | 0 (0.0%) |
Disability Class by Sex by Age in New Morgan borough
Disability Class: Hearing Difficulty
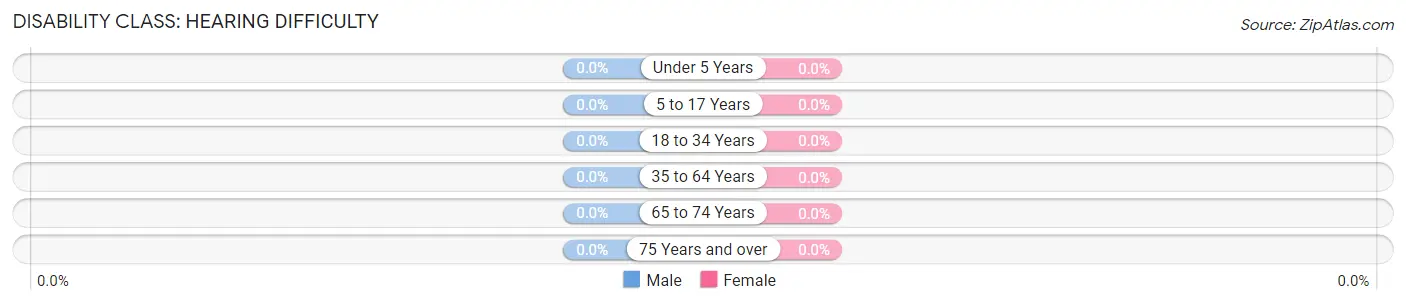
| Age Bracket | Male | Female |
| Under 5 Years | 0 (0.0%) | 0 (0.0%) |
| 5 to 17 Years | 0 (0.0%) | 0 (0.0%) |
| 18 to 34 Years | 0 (0.0%) | 0 (0.0%) |
| 35 to 64 Years | 0 (0.0%) | 0 (0.0%) |
| 65 to 74 Years | 0 (0.0%) | 0 (0.0%) |
| 75 Years and over | 0 (0.0%) | 0 (0.0%) |
Disability Class: Vision Difficulty
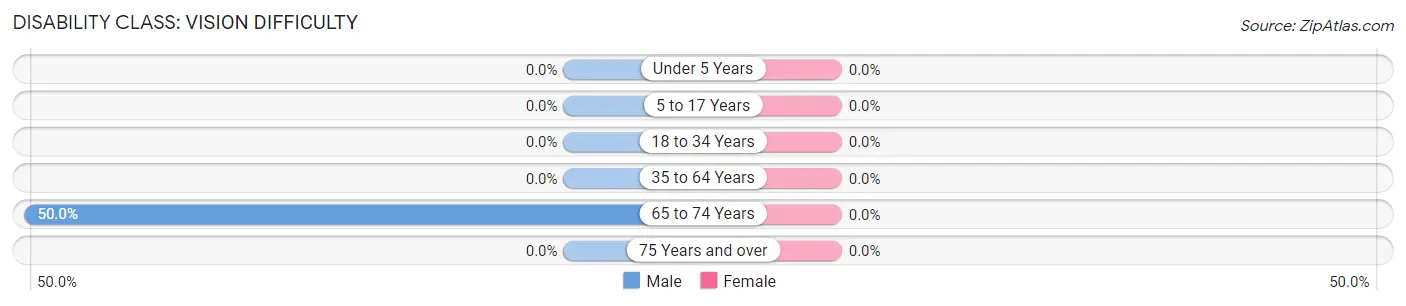
| Age Bracket | Male | Female |
| Under 5 Years | 0 (0.0%) | 0 (0.0%) |
| 5 to 17 Years | 0 (0.0%) | 0 (0.0%) |
| 18 to 34 Years | 0 (0.0%) | 0 (0.0%) |
| 35 to 64 Years | 0 (0.0%) | 0 (0.0%) |
| 65 to 74 Years | 2 (50.0%) | 0 (0.0%) |
| 75 Years and over | 0 (0.0%) | 0 (0.0%) |
Disability Class: Cognitive Difficulty
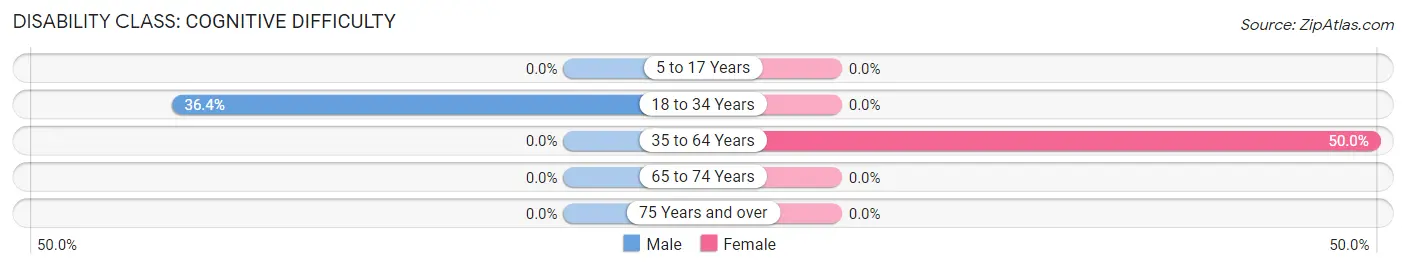
| Age Bracket | Male | Female |
| 5 to 17 Years | 0 (0.0%) | 0 (0.0%) |
| 18 to 34 Years | 4 (36.4%) | 0 (0.0%) |
| 35 to 64 Years | 0 (0.0%) | 1 (50.0%) |
| 65 to 74 Years | 0 (0.0%) | 0 (0.0%) |
| 75 Years and over | 0 (0.0%) | 0 (0.0%) |
Disability Class: Ambulatory Difficulty
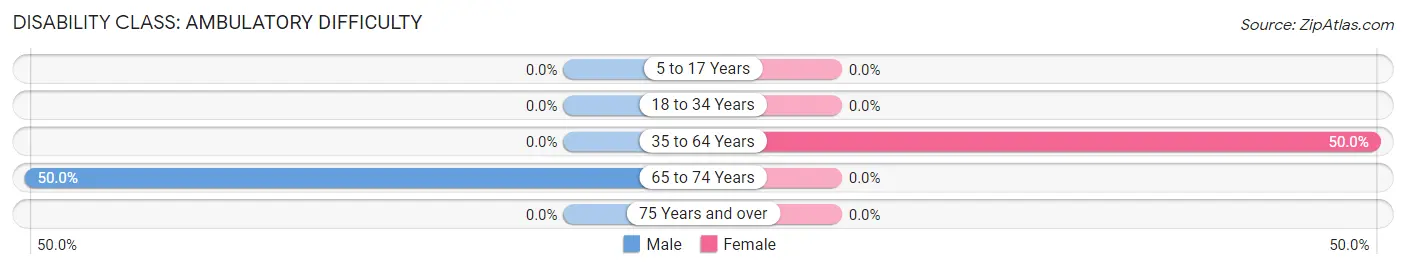
| Age Bracket | Male | Female |
| 5 to 17 Years | 0 (0.0%) | 0 (0.0%) |
| 18 to 34 Years | 0 (0.0%) | 0 (0.0%) |
| 35 to 64 Years | 0 (0.0%) | 1 (50.0%) |
| 65 to 74 Years | 2 (50.0%) | 0 (0.0%) |
| 75 Years and over | 0 (0.0%) | 0 (0.0%) |
Disability Class: Self-Care Difficulty
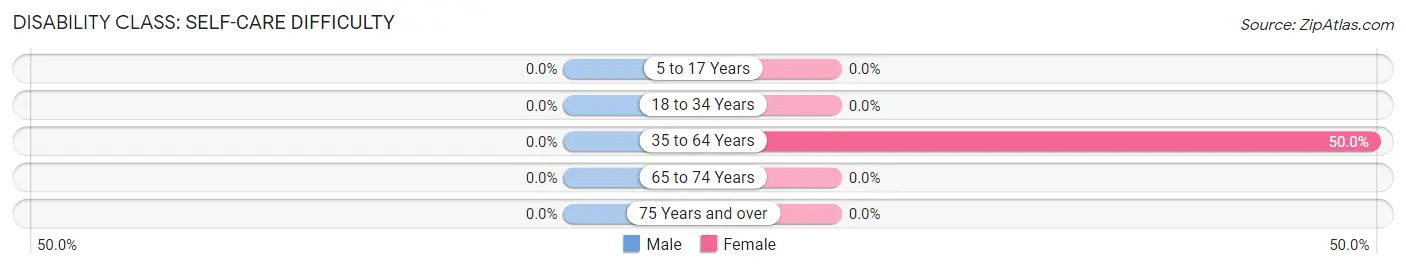
| Age Bracket | Male | Female |
| 5 to 17 Years | 0 (0.0%) | 0 (0.0%) |
| 18 to 34 Years | 0 (0.0%) | 0 (0.0%) |
| 35 to 64 Years | 0 (0.0%) | 1 (50.0%) |
| 65 to 74 Years | 0 (0.0%) | 0 (0.0%) |
| 75 Years and over | 0 (0.0%) | 0 (0.0%) |
Technology Access in New Morgan borough
Computing Device Access in New Morgan borough
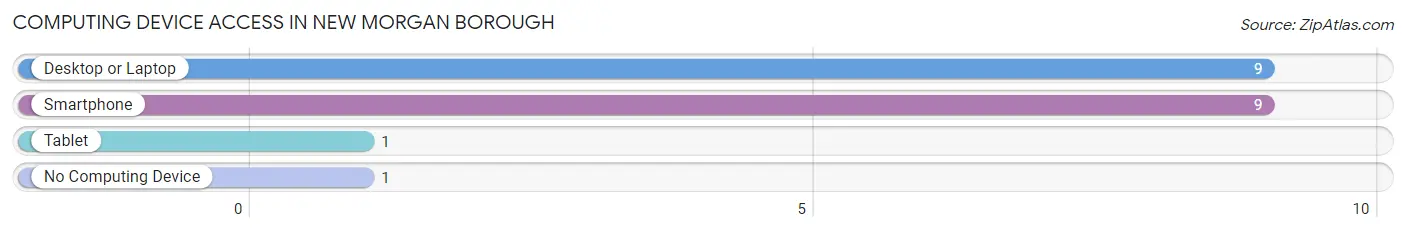
| Device Type | # Households | % Households |
| Desktop or Laptop | 9 | 90.0% |
| Smartphone | 9 | 90.0% |
| Tablet | 1 | 10.0% |
| No Computing Device | 1 | 10.0% |
| Total | 10 | 100.0% |
Internet Access in New Morgan borough
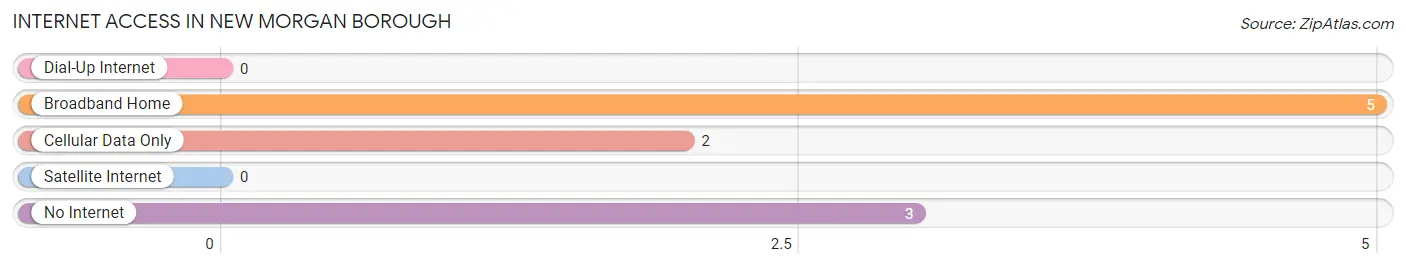
| Internet Type | # Households | % Households |
| Dial-Up Internet | 0 | 0.0% |
| Broadband Home | 5 | 50.0% |
| Cellular Data Only | 2 | 20.0% |
| Satellite Internet | 0 | 0.0% |
| No Internet | 3 | 30.0% |
| Total | 10 | 100.0% |
New Morgan borough Summary
Morgan Borough is a borough located in the state of Pennsylvania in the United States. It is located in the southwestern corner of the state, in the county of Fayette. The borough is situated in the foothills of the Allegheny Mountains, and is bordered by the townships of Bullskin, Georges, and Nicholson. The population of Morgan Borough was 1,845 at the 2010 census.
History
The area that is now Morgan Borough was first settled in the late 1700s by a group of German immigrants. The town was originally known as “Morgan’s Settlement”, named after the first settler, John Morgan. The town was officially incorporated as a borough in 1851.
In the late 1800s, the town was a major coal mining center. The coal industry was the main source of employment for the town’s residents. The coal mines were eventually closed in the early 1900s, and the town’s economy shifted to agriculture and light industry.
Geography
Morgan Borough is located at 39°51'N 79°45'W (39.85, -79.75). It is situated in the foothills of the Allegheny Mountains, and is bordered by the townships of Bullskin, Georges, and Nicholson. The borough has a total area of 1.2 square miles, all of which is land.
The borough is located in the Monongahela River Valley, and is surrounded by rolling hills and forests. The climate is humid continental, with hot summers and cold winters.
Economy
The economy of Morgan Borough is largely based on agriculture and light industry. The town is home to several small businesses, including a grocery store, a hardware store, and a few restaurants. The town also has a few small manufacturing plants.
The town is also home to a few tourist attractions, including the historic Morgan Mine, which is a former coal mine that has been converted into a museum. The town also has a few parks and recreational areas, including a public swimming pool and a golf course.
Demographics
As of the 2010 census, the population of Morgan Borough was 1,845. The racial makeup of the borough was 97.3% White, 0.7% African American, 0.2% Native American, 0.2% Asian, 0.2% from other races, and 1.4% from two or more races. Hispanic or Latino of any race were 0.7% of the population.
The median income for a household in the borough was $37,500, and the median income for a family was $45,000. The per capita income for the borough was $18,000. About 11.2% of families and 14.2% of the population were below the poverty line, including 18.2% of those under age 18 and 8.2% of those age 65 or over.
Common Questions
What is Per Capita Income in New Morgan borough?
Per Capita income in New Morgan borough is $16,943.
What is the Median Family Income in New Morgan borough?
Median Family Income in New Morgan borough is $138,750.
What is the Median Household income in New Morgan borough?
Median Household Income in New Morgan borough is $126,250.
What is Income or Wage Gap in New Morgan borough?
Income or Wage Gap in New Morgan borough is 46.0%.
Women in New Morgan borough earn 54.0 cents for every dollar earned by a man.
What is Inequality or Gini Index in New Morgan borough?
Inequality or Gini Index in New Morgan borough is 0.35.
What is the Total Population of New Morgan borough?
Total Population of New Morgan borough is 70.
What is the Total Male Population of New Morgan borough?
Total Male Population of New Morgan borough is 48.
What is the Total Female Population of New Morgan borough?
Total Female Population of New Morgan borough is 22.
What is the Ratio of Males per 100 Females in New Morgan borough?
There are 218.18 Males per 100 Females in New Morgan borough.
What is the Ratio of Females per 100 Males in New Morgan borough?
There are 45.83 Females per 100 Males in New Morgan borough.
What is the Median Population Age in New Morgan borough?
Median Population Age in New Morgan borough is 18.2 Years.
What is the Average Family Size in New Morgan borough
Average Family Size in New Morgan borough is 5.8 People.
What is the Average Household Size in New Morgan borough
Average Household Size in New Morgan borough is 4.0 People.
How Large is the Labor Force in New Morgan borough?
There are 22 People in the Labor Forcein in New Morgan borough.
What is the Percentage of People in the Labor Force in New Morgan borough?
40.0% of People are in the Labor Force in New Morgan borough.