Thompsontown borough, PA Map & Demographics
Thompsontown borough Overview
$25,162
PER CAPITA INCOME
$66,250
AVG FAMILY INCOME
$39,375
AVG HOUSEHOLD INCOME
34.4%
WAGE / INCOME GAP [ % ]
65.6¢/ $1
WAGE / INCOME GAP [ $ ]
0.41
INEQUALITY / GINI INDEX
625
TOTAL POPULATION
316
MALE POPULATION
309
FEMALE POPULATION
102.27
MALES / 100 FEMALES
97.78
FEMALES / 100 MALES
34.7
MEDIAN AGE
2.6
AVG FAMILY SIZE
1.9
AVG HOUSEHOLD SIZE
289
LABOR FORCE [ PEOPLE ]
53.8%
PERCENT IN LABOR FORCE
2.4%
UNEMPLOYMENT RATE
Income in Thompsontown borough
Income Overview in Thompsontown borough
Per Capita Income in Thompsontown borough is $25,162, while median incomes of families and households are $66,250 and $39,375 respectively.
| Characteristic | Number | Measure |
| Per Capita Income | 625 | $25,162 |
| Median Family Income | 158 | $66,250 |
| Mean Family Income | 158 | $66,048 |
| Median Household Income | 321 | $39,375 |
| Mean Household Income | 321 | $48,923 |
| Income Deficit | 158 | $0 |
| Wage / Income Gap (%) | 625 | 34.40% |
| Wage / Income Gap ($) | 625 | 65.60¢ per $1 |
| Gini / Inequality Index | 625 | 0.41 |
Earnings by Sex in Thompsontown borough
Average Earnings in Thompsontown borough are $29,583, $42,750 for men and $28,045 for women, a difference of 34.4%.
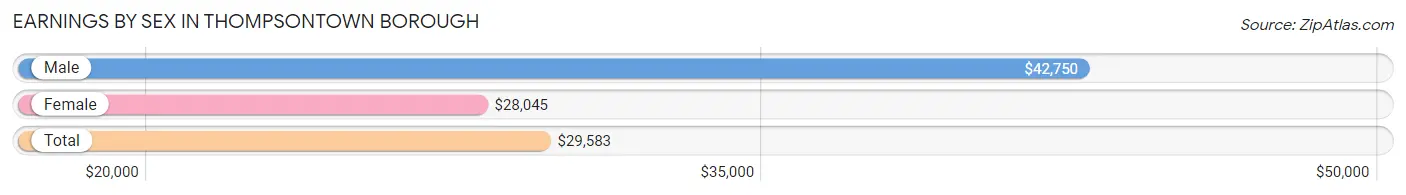
| Sex | Number | Average Earnings |
| Male | 146 (48.8%) | $42,750 |
| Female | 153 (51.2%) | $28,045 |
| Total | 299 (100.0%) | $29,583 |
Earnings by Sex by Income Bracket in Thompsontown borough
The most common earnings brackets in Thompsontown borough are $25,000 to $29,999 for men (22 | 15.1%) and $25,000 to $29,999 for women (42 | 27.5%).
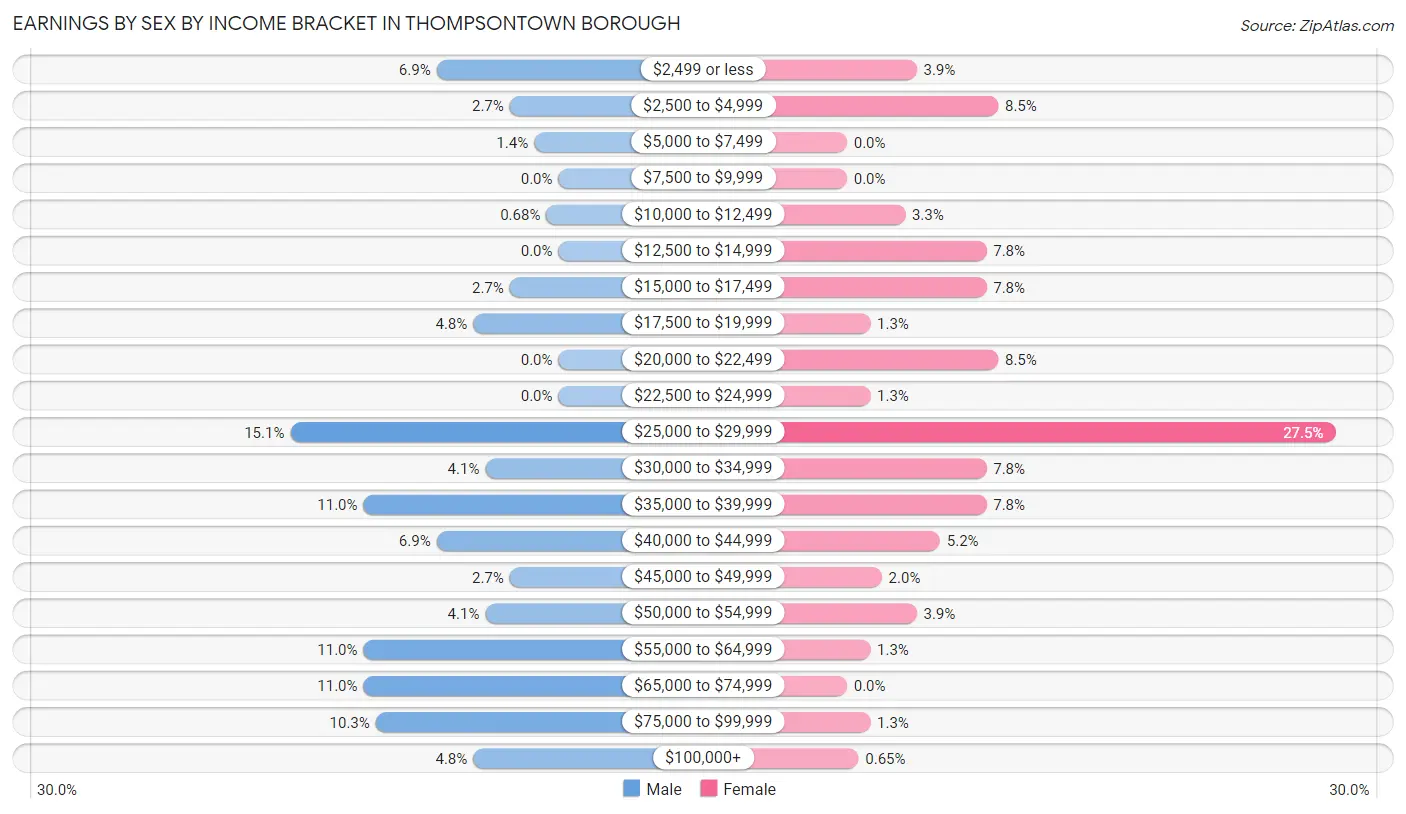
| Income | Male | Female |
| $2,499 or less | 10 (6.9%) | 6 (3.9%) |
| $2,500 to $4,999 | 4 (2.7%) | 13 (8.5%) |
| $5,000 to $7,499 | 2 (1.4%) | 0 (0.0%) |
| $7,500 to $9,999 | 0 (0.0%) | 0 (0.0%) |
| $10,000 to $12,499 | 1 (0.7%) | 5 (3.3%) |
| $12,500 to $14,999 | 0 (0.0%) | 12 (7.8%) |
| $15,000 to $17,499 | 4 (2.7%) | 12 (7.8%) |
| $17,500 to $19,999 | 7 (4.8%) | 2 (1.3%) |
| $20,000 to $22,499 | 0 (0.0%) | 13 (8.5%) |
| $22,500 to $24,999 | 0 (0.0%) | 2 (1.3%) |
| $25,000 to $29,999 | 22 (15.1%) | 42 (27.5%) |
| $30,000 to $34,999 | 6 (4.1%) | 12 (7.8%) |
| $35,000 to $39,999 | 16 (11.0%) | 12 (7.8%) |
| $40,000 to $44,999 | 10 (6.9%) | 8 (5.2%) |
| $45,000 to $49,999 | 4 (2.7%) | 3 (2.0%) |
| $50,000 to $54,999 | 6 (4.1%) | 6 (3.9%) |
| $55,000 to $64,999 | 16 (11.0%) | 2 (1.3%) |
| $65,000 to $74,999 | 16 (11.0%) | 0 (0.0%) |
| $75,000 to $99,999 | 15 (10.3%) | 2 (1.3%) |
| $100,000+ | 7 (4.8%) | 1 (0.6%) |
| Total | 146 (100.0%) | 153 (100.0%) |
Earnings by Sex by Educational Attainment in Thompsontown borough
Average earnings in Thompsontown borough are $44,250 for men and $28,750 for women, a difference of 35.0%. Men with an educational attainment of graduate degree enjoy the highest average annual earnings of $87,639, while those with high school diploma education earn the least with $27,344. Women with an educational attainment of high school diploma earn the most with the average annual earnings of $29,750, while those with graduate degree education have the smallest earnings of $28,333.
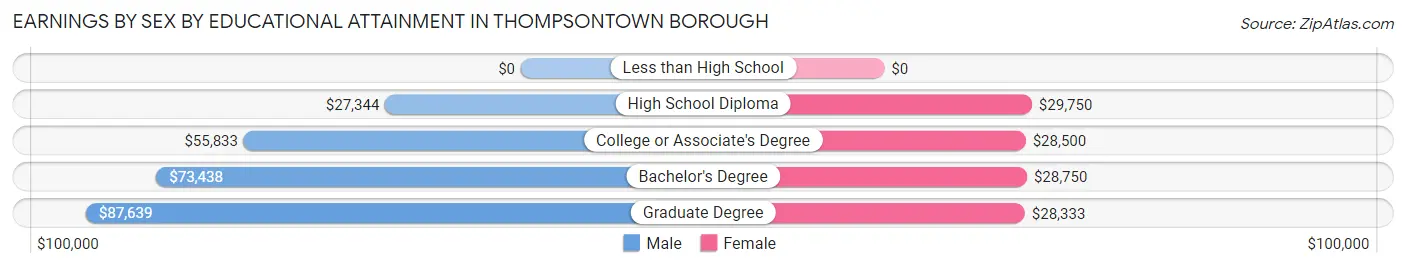
| Educational Attainment | Male Income | Female Income |
| Less than High School | - | - |
| High School Diploma | $27,344 | $29,750 |
| College or Associate's Degree | $55,833 | $28,500 |
| Bachelor's Degree | $73,438 | $28,750 |
| Graduate Degree | $87,639 | $28,333 |
| Total | $44,250 | $28,750 |
Family Income in Thompsontown borough
Family Income Brackets in Thompsontown borough
According to the Thompsontown borough family income data, there are 35 families falling into the $50,000 to $74,999 income range, which is the most common income bracket and makes up 22.2% of all families. Conversely, the $150,000 to $199,999 income bracket is the least frequent group with only 2 families (1.3%) belonging to this category.
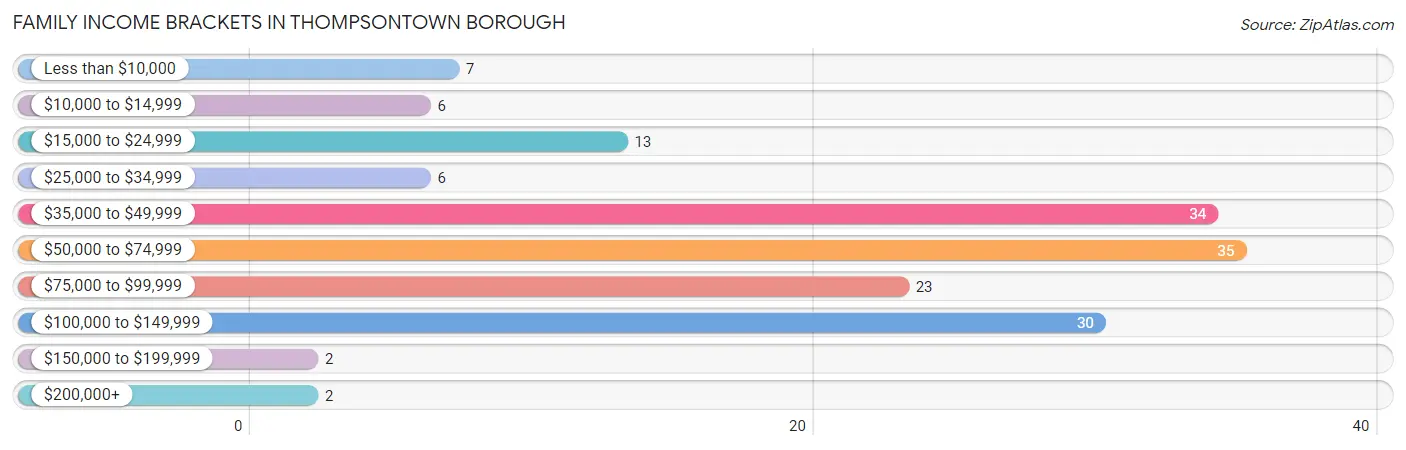
| Income Bracket | # Families | % Families |
| Less than $10,000 | 7 | 4.4% |
| $10,000 to $14,999 | 6 | 3.8% |
| $15,000 to $24,999 | 13 | 8.2% |
| $25,000 to $34,999 | 6 | 3.8% |
| $35,000 to $49,999 | 34 | 21.5% |
| $50,000 to $74,999 | 35 | 22.2% |
| $75,000 to $99,999 | 23 | 14.6% |
| $100,000 to $149,999 | 30 | 19.0% |
| $150,000 to $199,999 | 2 | 1.3% |
| $200,000+ | 2 | 1.3% |
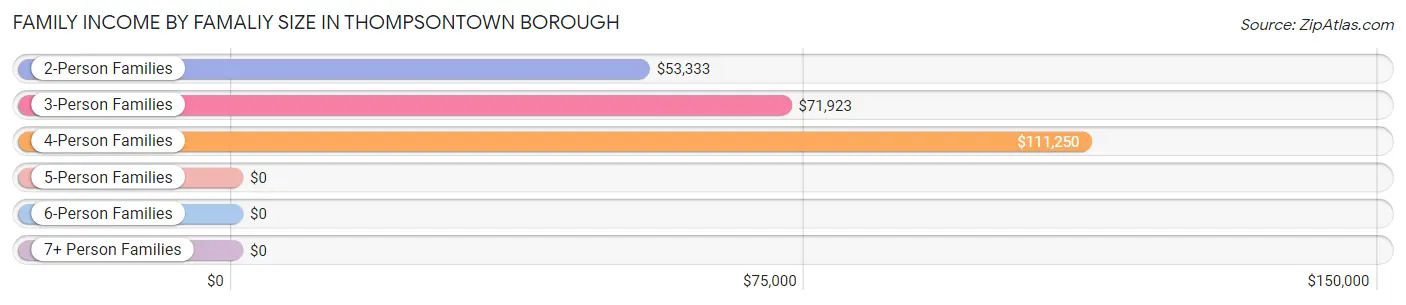
Family Income by Famaliy Size in Thompsontown borough
4-person families (13 | 8.2%) account for the highest median family income in Thompsontown borough with $111,250 per family, while 4-person families (13 | 8.2%) have the highest median income of $27,812 per family member.
| Income Bracket | # Families | Median Income |
| 2-Person Families | 92 (58.2%) | $53,333 |
| 3-Person Families | 44 (27.9%) | $71,923 |
| 4-Person Families | 13 (8.2%) | $111,250 |
| 5-Person Families | 7 (4.4%) | $0 |
| 6-Person Families | 2 (1.3%) | $0 |
| 7+ Person Families | 0 (0.0%) | $0 |
| Total | 158 (100.0%) | $66,250 |
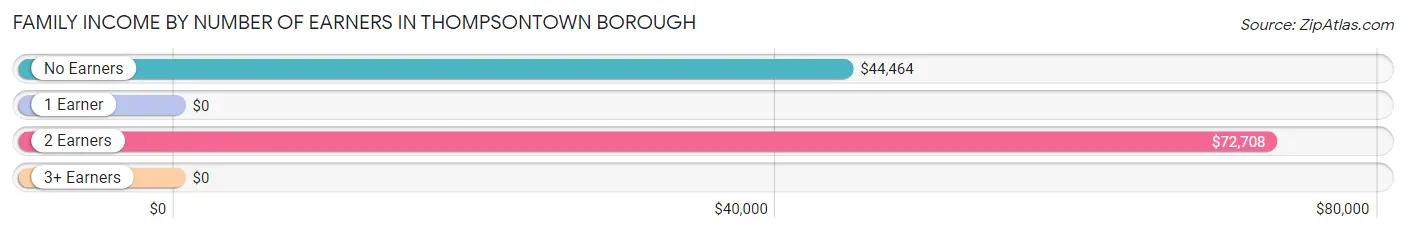
Family Income by Number of Earners in Thompsontown borough
| Number of Earners | # Families | Median Income |
| No Earners | 49 (31.0%) | $44,464 |
| 1 Earner | 26 (16.5%) | $0 |
| 2 Earners | 77 (48.7%) | $72,708 |
| 3+ Earners | 6 (3.8%) | $0 |
| Total | 158 (100.0%) | $66,250 |
Household Income in Thompsontown borough
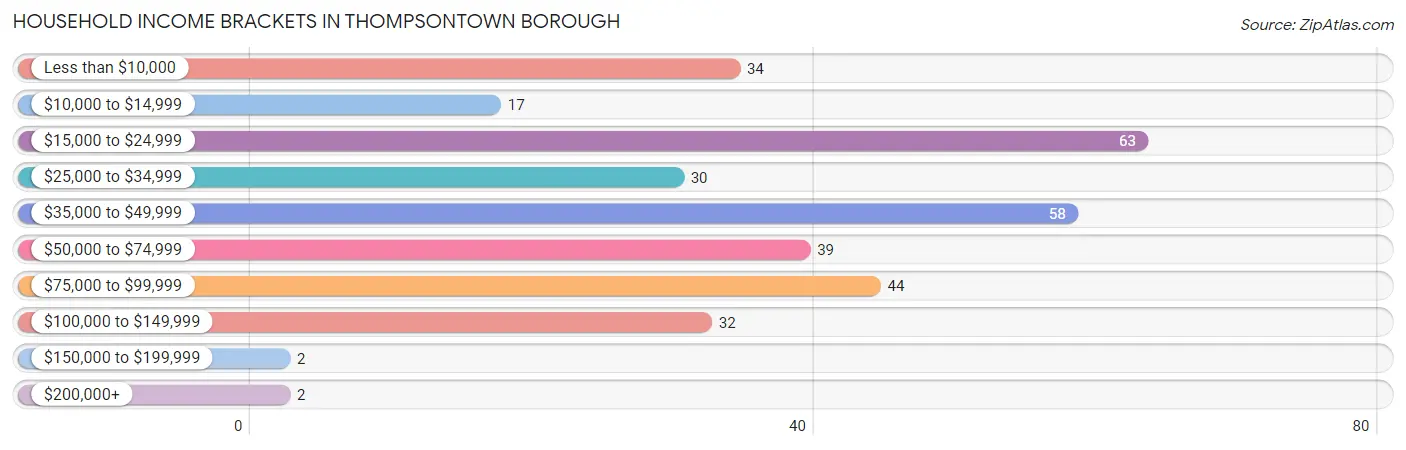
Household Income Brackets in Thompsontown borough
With 63 households falling in the category, the $15,000 to $24,999 income range is the most frequent in Thompsontown borough, accounting for 19.6% of all households. In contrast, only 2 households (0.6%) fall into the $150,000 to $199,999 income bracket, making it the least populous group.
| Income Bracket | # Households | % Households |
| Less than $10,000 | 34 | 10.6% |
| $10,000 to $14,999 | 17 | 5.3% |
| $15,000 to $24,999 | 63 | 19.6% |
| $25,000 to $34,999 | 30 | 9.3% |
| $35,000 to $49,999 | 58 | 18.1% |
| $50,000 to $74,999 | 39 | 12.1% |
| $75,000 to $99,999 | 44 | 13.7% |
| $100,000 to $149,999 | 32 | 10.0% |
| $150,000 to $199,999 | 2 | 0.6% |
| $200,000+ | 2 | 0.6% |
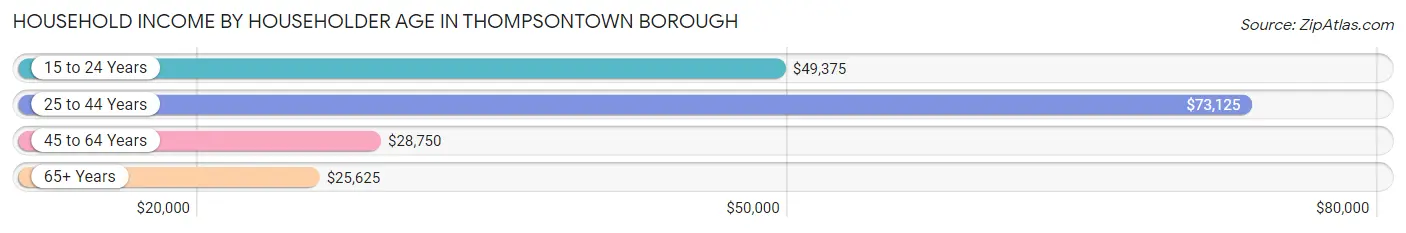
Household Income by Householder Age in Thompsontown borough
The median household income in Thompsontown borough is $39,375, with the highest median household income of $73,125 found in the 25 to 44 years age bracket for the primary householder. A total of 93 households (29.0%) fall into this category. Meanwhile, the 65+ years age bracket for the primary householder has the lowest median household income of $25,625, with 113 households (35.2%) in this group.
| Income Bracket | # Households | Median Income |
| 15 to 24 Years | 25 (7.8%) | $49,375 |
| 25 to 44 Years | 93 (29.0%) | $73,125 |
| 45 to 64 Years | 90 (28.0%) | $28,750 |
| 65+ Years | 113 (35.2%) | $25,625 |
| Total | 321 (100.0%) | $39,375 |
Poverty in Thompsontown borough
Income Below Poverty by Sex and Age in Thompsontown borough
With 21.8% poverty level for males and 23.6% for females among the residents of Thompsontown borough, 12 to 14 year old males and 12 to 14 year old females are the most vulnerable to poverty, with 6 males (100.0%) and 4 females (100.0%) in their respective age groups living below the poverty level.
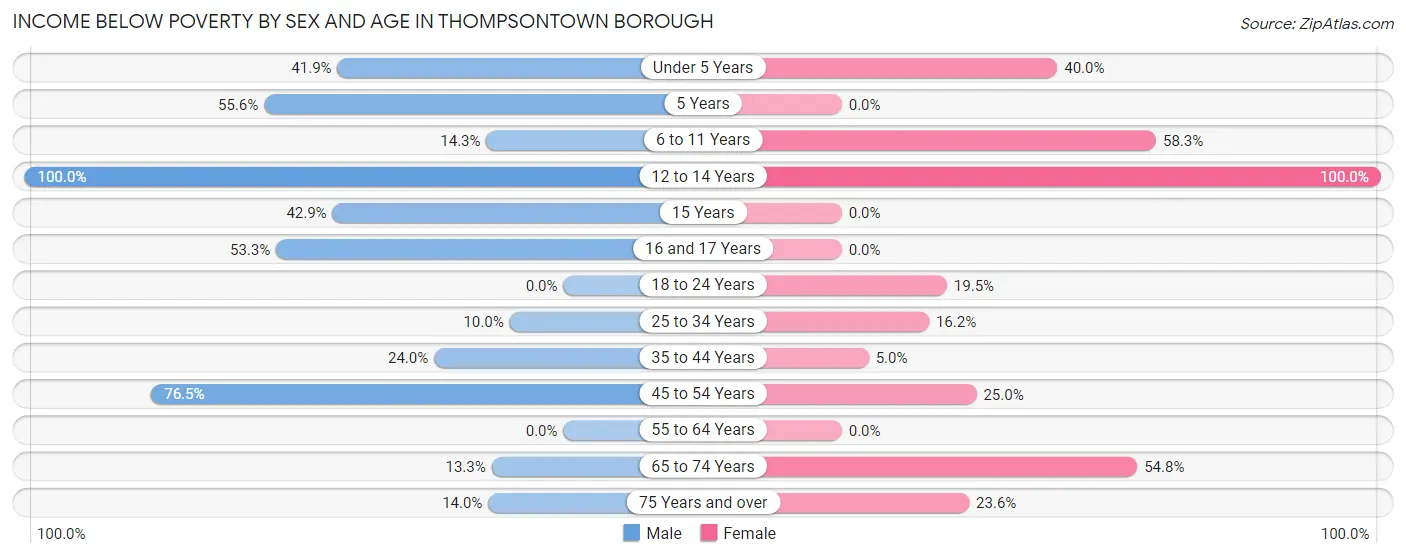
| Age Bracket | Male | Female |
| Under 5 Years | 13 (41.9%) | 4 (40.0%) |
| 5 Years | 5 (55.6%) | 0 (0.0%) |
| 6 to 11 Years | 1 (14.3%) | 7 (58.3%) |
| 12 to 14 Years | 6 (100.0%) | 4 (100.0%) |
| 15 Years | 3 (42.9%) | 0 (0.0%) |
| 16 and 17 Years | 8 (53.3%) | 0 (0.0%) |
| 18 to 24 Years | 0 (0.0%) | 8 (19.5%) |
| 25 to 34 Years | 6 (10.0%) | 11 (16.2%) |
| 35 to 44 Years | 6 (24.0%) | 1 (5.0%) |
| 45 to 54 Years | 13 (76.5%) | 8 (25.0%) |
| 55 to 64 Years | 0 (0.0%) | 0 (0.0%) |
| 65 to 74 Years | 2 (13.3%) | 17 (54.8%) |
| 75 Years and over | 6 (14.0%) | 13 (23.6%) |
| Total | 69 (21.8%) | 73 (23.6%) |
Income Above Poverty by Sex and Age in Thompsontown borough
According to the poverty statistics in Thompsontown borough, males aged 18 to 24 years and females aged 5 years are the age groups that are most secure financially, with 100.0% of males and 100.0% of females in these age groups living above the poverty line.
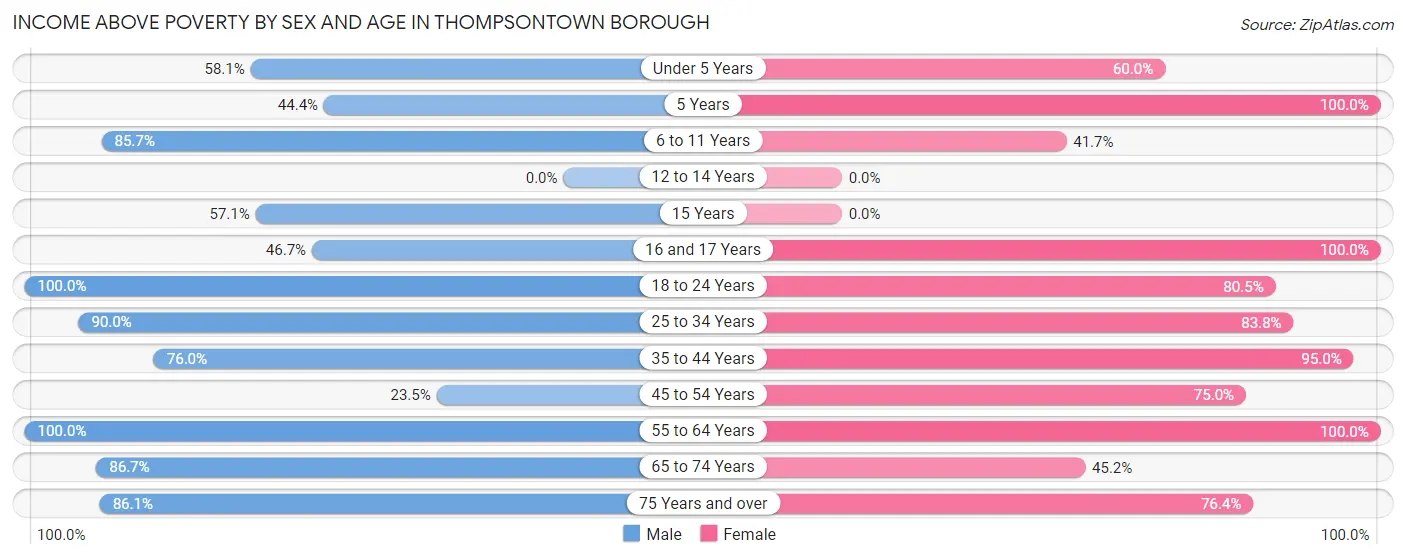
| Age Bracket | Male | Female |
| Under 5 Years | 18 (58.1%) | 6 (60.0%) |
| 5 Years | 4 (44.4%) | 2 (100.0%) |
| 6 to 11 Years | 6 (85.7%) | 5 (41.7%) |
| 12 to 14 Years | 0 (0.0%) | 0 (0.0%) |
| 15 Years | 4 (57.1%) | 0 (0.0%) |
| 16 and 17 Years | 7 (46.7%) | 3 (100.0%) |
| 18 to 24 Years | 42 (100.0%) | 33 (80.5%) |
| 25 to 34 Years | 54 (90.0%) | 57 (83.8%) |
| 35 to 44 Years | 19 (76.0%) | 19 (95.0%) |
| 45 to 54 Years | 4 (23.5%) | 24 (75.0%) |
| 55 to 64 Years | 39 (100.0%) | 31 (100.0%) |
| 65 to 74 Years | 13 (86.7%) | 14 (45.2%) |
| 75 Years and over | 37 (86.1%) | 42 (76.4%) |
| Total | 247 (78.2%) | 236 (76.4%) |
Income Below Poverty Among Married-Couple Families in Thompsontown borough
The poverty statistics for married-couple families in Thompsontown borough show that 1.8% or 2 of the total 112 families live below the poverty line. Families with no children have the highest poverty rate of 2.8%, comprising of 2 families. On the other hand, families with 1 or 2 children have the lowest poverty rate of 0.0%, which includes 0 families.
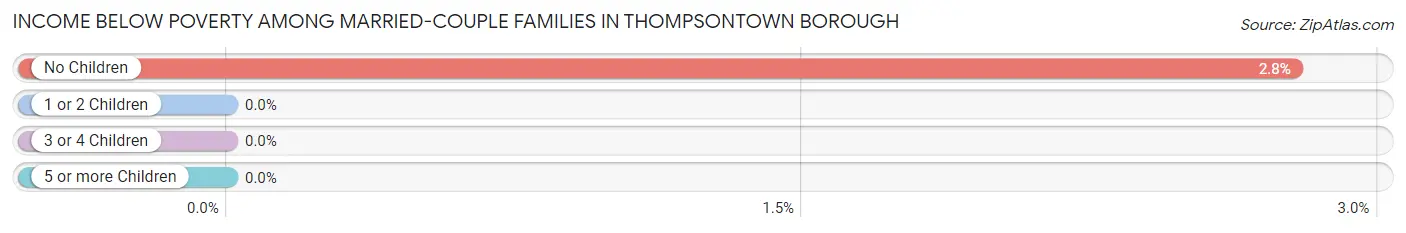
| Children | Above Poverty | Below Poverty |
| No Children | 70 (97.2%) | 2 (2.8%) |
| 1 or 2 Children | 38 (100.0%) | 0 (0.0%) |
| 3 or 4 Children | 2 (100.0%) | 0 (0.0%) |
| 5 or more Children | 0 (0.0%) | 0 (0.0%) |
| Total | 110 (98.2%) | 2 (1.8%) |
Income Below Poverty Among Single-Parent Households in Thompsontown borough
According to the poverty data in Thompsontown borough, 100.0% or 2 single-father households and 50.0% or 22 single-mother households are living below the poverty line. Among single-father households, those with 1 or 2 children have the highest poverty rate, with 2 households (100.0%) experiencing poverty. Likewise, among single-mother households, those with 3 or 4 children have the highest poverty rate, with 6 households (100.0%) falling below the poverty line.
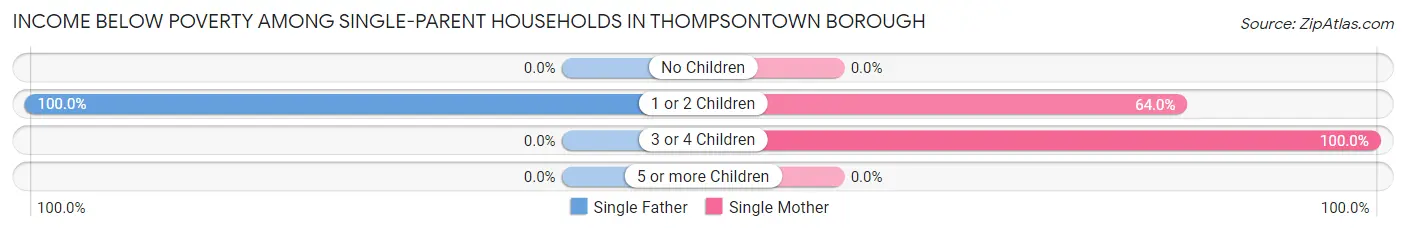
| Children | Single Father | Single Mother |
| No Children | 0 (0.0%) | 0 (0.0%) |
| 1 or 2 Children | 2 (100.0%) | 16 (64.0%) |
| 3 or 4 Children | 0 (0.0%) | 6 (100.0%) |
| 5 or more Children | 0 (0.0%) | 0 (0.0%) |
| Total | 2 (100.0%) | 22 (50.0%) |
Income Below Poverty Among Married-Couple vs Single-Parent Households in Thompsontown borough
The poverty data for Thompsontown borough shows that 2 of the married-couple family households (1.8%) and 24 of the single-parent households (52.2%) are living below the poverty level. Within the married-couple family households, those with no children have the highest poverty rate, with 2 households (2.8%) falling below the poverty line. Among the single-parent households, those with 3 or 4 children have the highest poverty rate, with 6 household (100.0%) living below poverty.
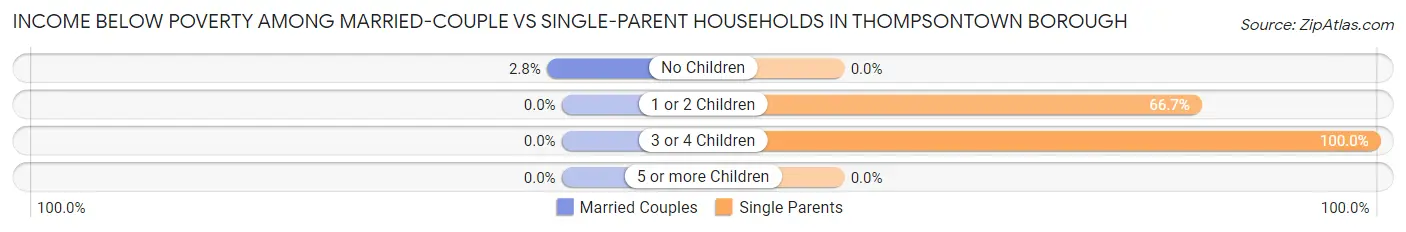
| Children | Married-Couple Families | Single-Parent Households |
| No Children | 2 (2.8%) | 0 (0.0%) |
| 1 or 2 Children | 0 (0.0%) | 18 (66.7%) |
| 3 or 4 Children | 0 (0.0%) | 6 (100.0%) |
| 5 or more Children | 0 (0.0%) | 0 (0.0%) |
| Total | 2 (1.8%) | 24 (52.2%) |
Race in Thompsontown borough
The most populous races in Thompsontown borough are White / Caucasian (526 | 84.2%), Two or more Races (69 | 11.0%), and Hispanic or Latino (18 | 2.9%).
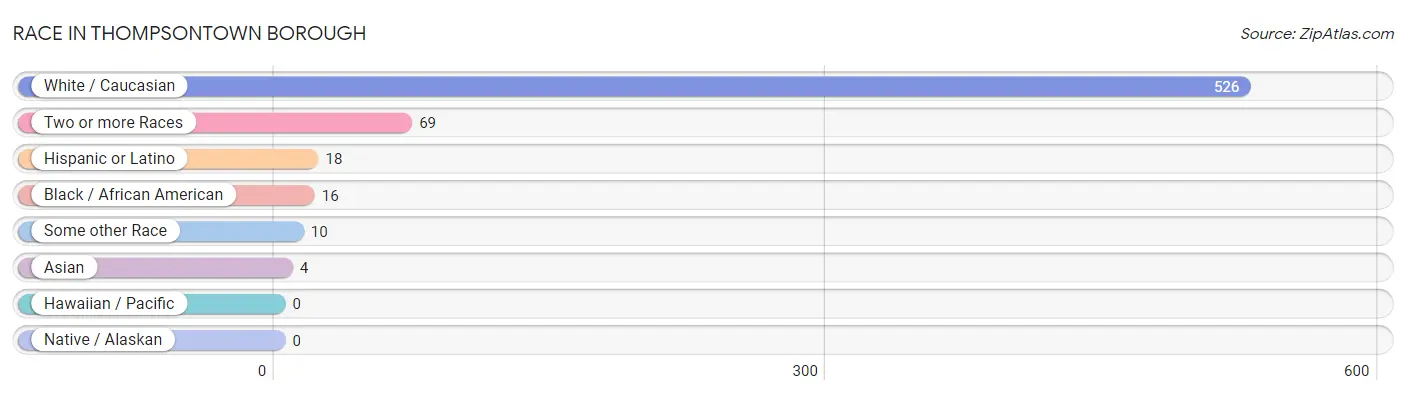
| Race | # Population | % Population |
| Asian | 4 | 0.6% |
| Black / African American | 16 | 2.6% |
| Hawaiian / Pacific | 0 | 0.0% |
| Hispanic or Latino | 18 | 2.9% |
| Native / Alaskan | 0 | 0.0% |
| White / Caucasian | 526 | 84.2% |
| Two or more Races | 69 | 11.0% |
| Some other Race | 10 | 1.6% |
| Total | 625 | 100.0% |
Ancestry in Thompsontown borough
The most populous ancestries reported in Thompsontown borough are German (239 | 38.2%), American (75 | 12.0%), Irish (67 | 10.7%), Polish (42 | 6.7%), and Pennsylvania German (35 | 5.6%), together accounting for 73.3% of all Thompsontown borough residents.
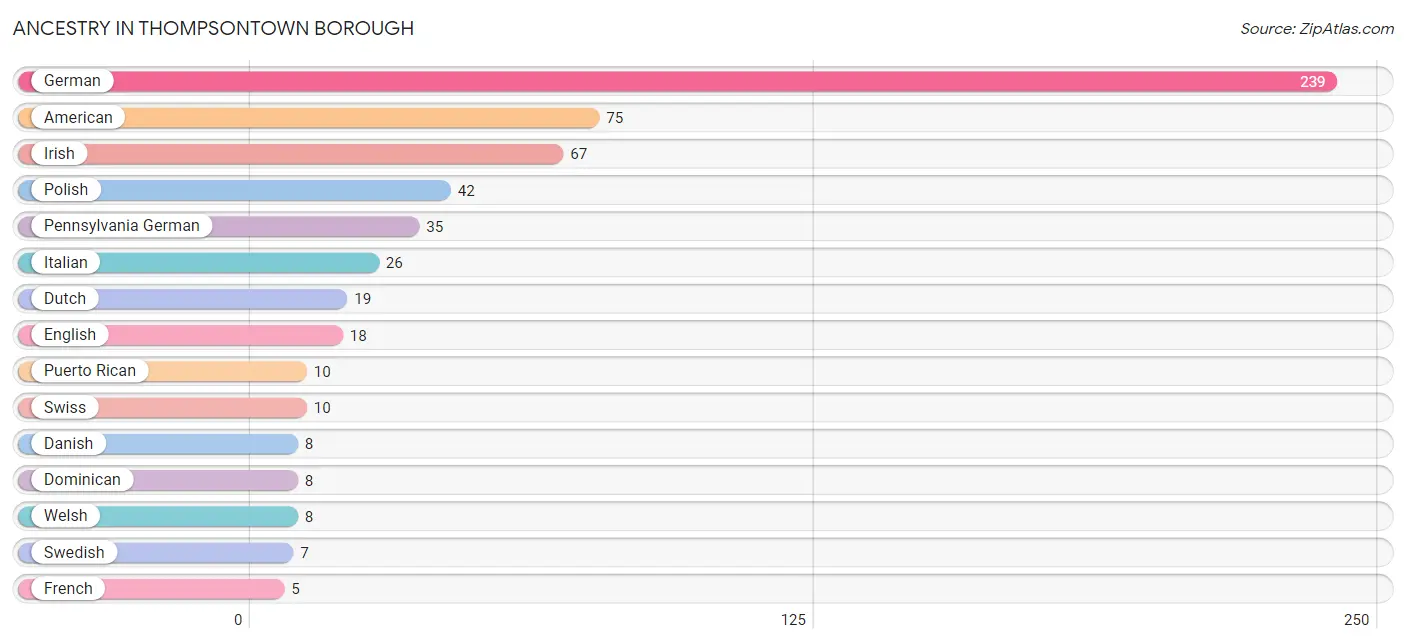
| Ancestry | # Population | % Population |
| American | 75 | 12.0% |
| Canadian | 2 | 0.3% |
| Cherokee | 1 | 0.2% |
| Chippewa | 2 | 0.3% |
| Comanche | 1 | 0.2% |
| Danish | 8 | 1.3% |
| Dominican | 8 | 1.3% |
| Dutch | 19 | 3.0% |
| English | 18 | 2.9% |
| French | 5 | 0.8% |
| German | 239 | 38.2% |
| Irish | 67 | 10.7% |
| Italian | 26 | 4.2% |
| Pennsylvania German | 35 | 5.6% |
| Polish | 42 | 6.7% |
| Puerto Rican | 10 | 1.6% |
| Russian | 2 | 0.3% |
| Scotch-Irish | 5 | 0.8% |
| Scottish | 1 | 0.2% |
| Slovak | 2 | 0.3% |
| Swedish | 7 | 1.1% |
| Swiss | 10 | 1.6% |
| Welsh | 8 | 1.3% | View All 23 Rows |
Immigrants in Thompsontown borough
The most numerous immigrant groups reported in Thompsontown borough came from Europe (19 | 3.0%), Eastern Europe (18 | 2.9%), Poland (18 | 2.9%), Germany (1 | 0.2%), and Western Europe (1 | 0.2%), together accounting for 9.1% of all Thompsontown borough residents.
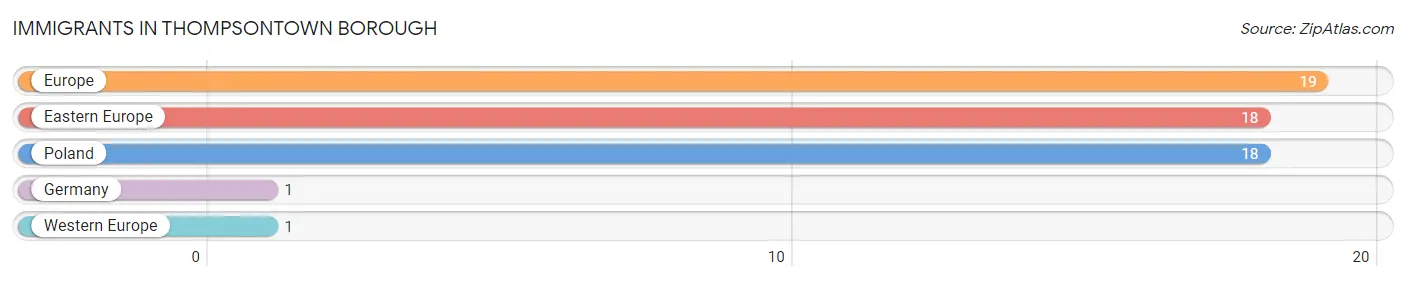
| Immigration Origin | # Population | % Population |
| Eastern Europe | 18 | 2.9% |
| Europe | 19 | 3.0% |
| Germany | 1 | 0.2% |
| Poland | 18 | 2.9% |
| Western Europe | 1 | 0.2% | View All 5 Rows |
Sex and Age in Thompsontown borough
Sex and Age in Thompsontown borough
The most populous age groups in Thompsontown borough are 25 to 29 Years (39 | 12.3%) for men and 75 to 79 Years (41 | 13.3%) for women.
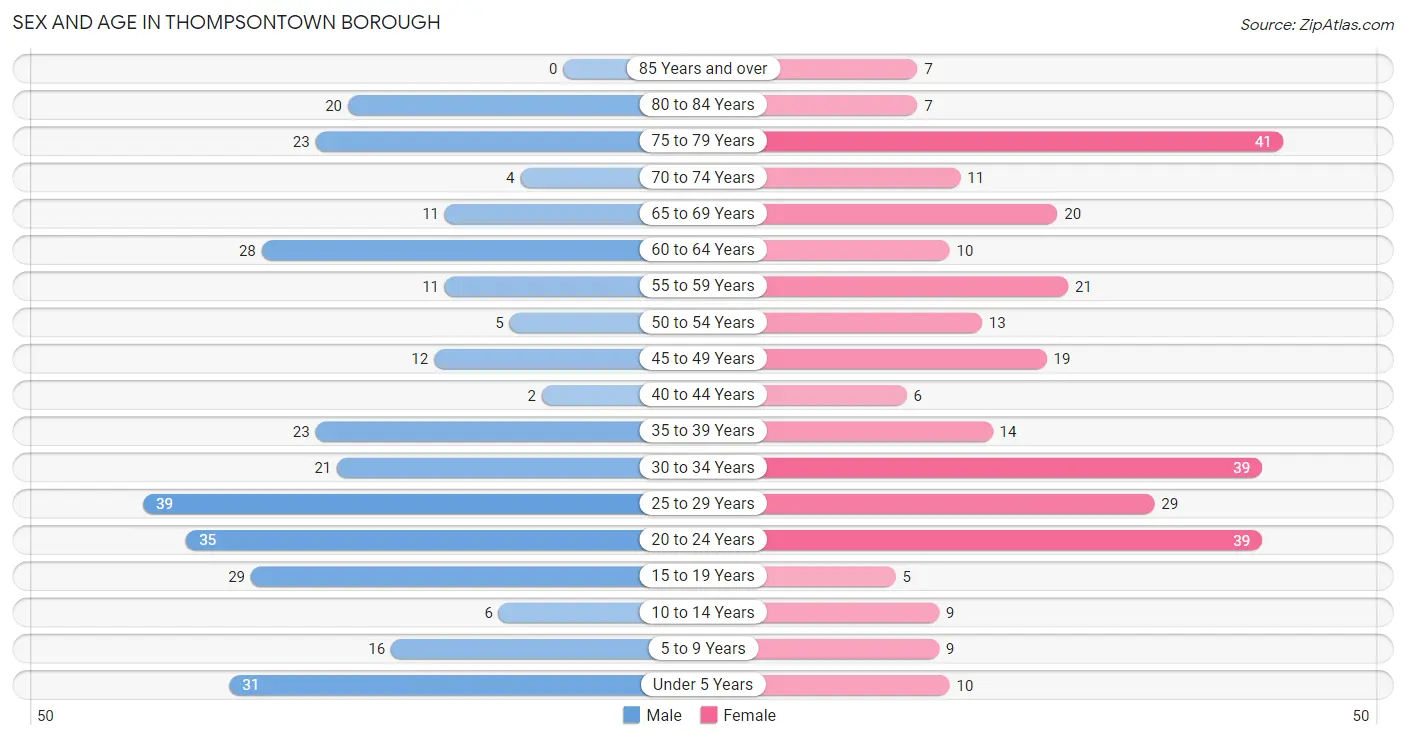
| Age Bracket | Male | Female |
| Under 5 Years | 31 (9.8%) | 10 (3.2%) |
| 5 to 9 Years | 16 (5.1%) | 9 (2.9%) |
| 10 to 14 Years | 6 (1.9%) | 9 (2.9%) |
| 15 to 19 Years | 29 (9.2%) | 5 (1.6%) |
| 20 to 24 Years | 35 (11.1%) | 39 (12.6%) |
| 25 to 29 Years | 39 (12.3%) | 29 (9.4%) |
| 30 to 34 Years | 21 (6.7%) | 39 (12.6%) |
| 35 to 39 Years | 23 (7.3%) | 14 (4.5%) |
| 40 to 44 Years | 2 (0.6%) | 6 (1.9%) |
| 45 to 49 Years | 12 (3.8%) | 19 (6.1%) |
| 50 to 54 Years | 5 (1.6%) | 13 (4.2%) |
| 55 to 59 Years | 11 (3.5%) | 21 (6.8%) |
| 60 to 64 Years | 28 (8.9%) | 10 (3.2%) |
| 65 to 69 Years | 11 (3.5%) | 20 (6.5%) |
| 70 to 74 Years | 4 (1.3%) | 11 (3.6%) |
| 75 to 79 Years | 23 (7.3%) | 41 (13.3%) |
| 80 to 84 Years | 20 (6.3%) | 7 (2.3%) |
| 85 Years and over | 0 (0.0%) | 7 (2.3%) |
| Total | 316 (100.0%) | 309 (100.0%) |
Families and Households in Thompsontown borough
Median Family Size in Thompsontown borough
The median family size in Thompsontown borough is 2.56 persons per family, with single female/mother families (44 | 27.9%) accounting for the largest median family size of 2.82 persons per family. On the other hand, single male/father families (2 | 1.3%) represent the smallest median family size with 1.50 persons per family.
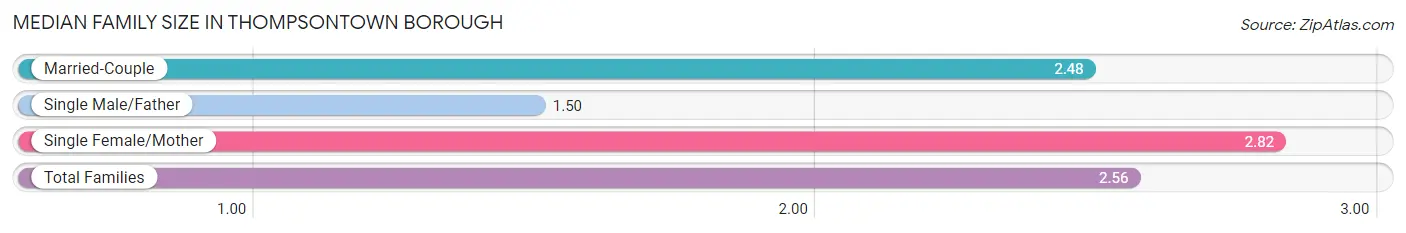
| Family Type | # Families | Family Size |
| Married-Couple | 112 (70.9%) | 2.48 |
| Single Male/Father | 2 (1.3%) | 1.50 |
| Single Female/Mother | 44 (27.9%) | 2.82 |
| Total Families | 158 (100.0%) | 2.56 |
Median Household Size in Thompsontown borough
The median household size in Thompsontown borough is 1.95 persons per household, with single female/mother households (44 | 13.7%) accounting for the largest median household size of 3.14 persons per household. non-family households (163 | 50.8%) represent the smallest median household size with 1.22 persons per household.
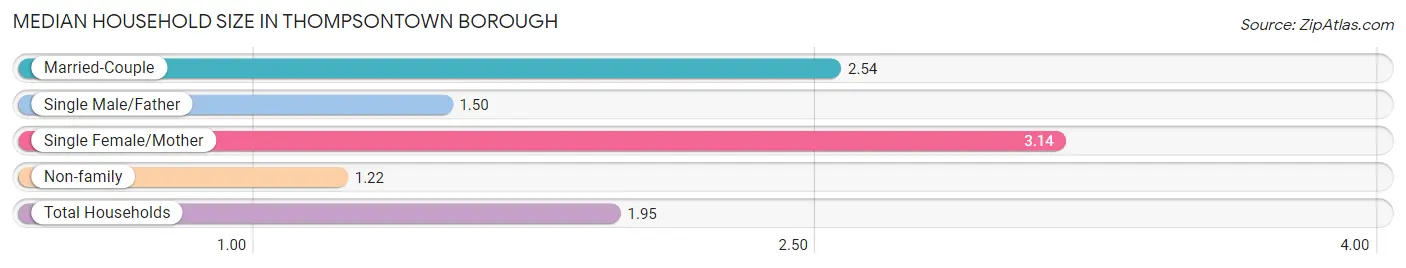
| Household Type | # Households | Household Size |
| Married-Couple | 112 (34.9%) | 2.54 |
| Single Male/Father | 2 (0.6%) | 1.50 |
| Single Female/Mother | 44 (13.7%) | 3.14 |
| Non-family | 163 (50.8%) | 1.22 |
| Total Households | 321 (100.0%) | 1.95 |
Household Size by Marriage Status in Thompsontown borough
Out of a total of 321 households in Thompsontown borough, 158 (49.2%) are family households, while 163 (50.8%) are nonfamily households. The most numerous type of family households are 2-person households, comprising 86, and the most common type of nonfamily households are 1-person households, comprising 139.
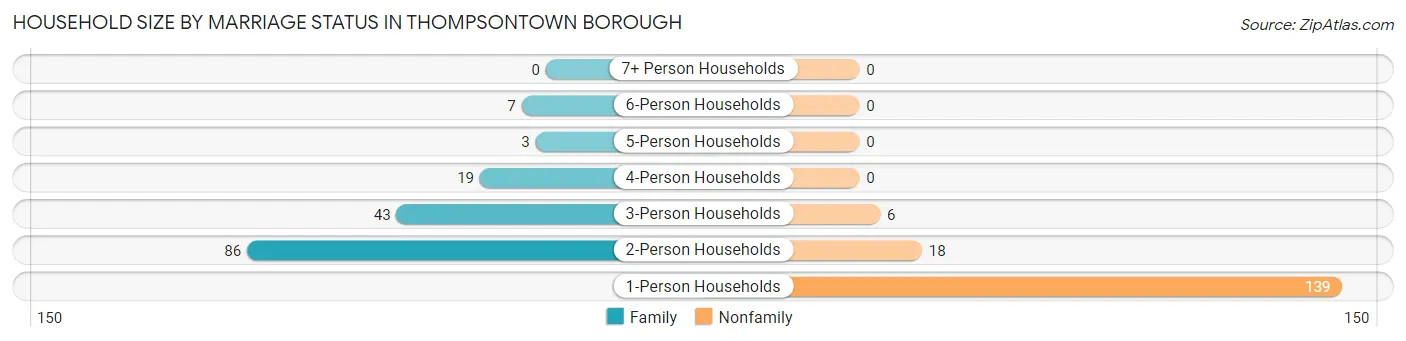
| Household Size | Family Households | Nonfamily Households |
| 1-Person Households | - | 139 (43.3%) |
| 2-Person Households | 86 (26.8%) | 18 (5.6%) |
| 3-Person Households | 43 (13.4%) | 6 (1.9%) |
| 4-Person Households | 19 (5.9%) | 0 (0.0%) |
| 5-Person Households | 3 (0.9%) | 0 (0.0%) |
| 6-Person Households | 7 (2.2%) | 0 (0.0%) |
| 7+ Person Households | 0 (0.0%) | 0 (0.0%) |
| Total | 158 (49.2%) | 163 (50.8%) |
Female Fertility in Thompsontown borough
Fertility by Age in Thompsontown borough
Average fertility rate in Thompsontown borough is 108.0 births per 1,000 women. Women in the age bracket of 20 to 34 years have the highest fertility rate with 121.0 births per 1,000 women. Women in the age bracket of 20 to 34 years acount for 76.5% of all women with births.
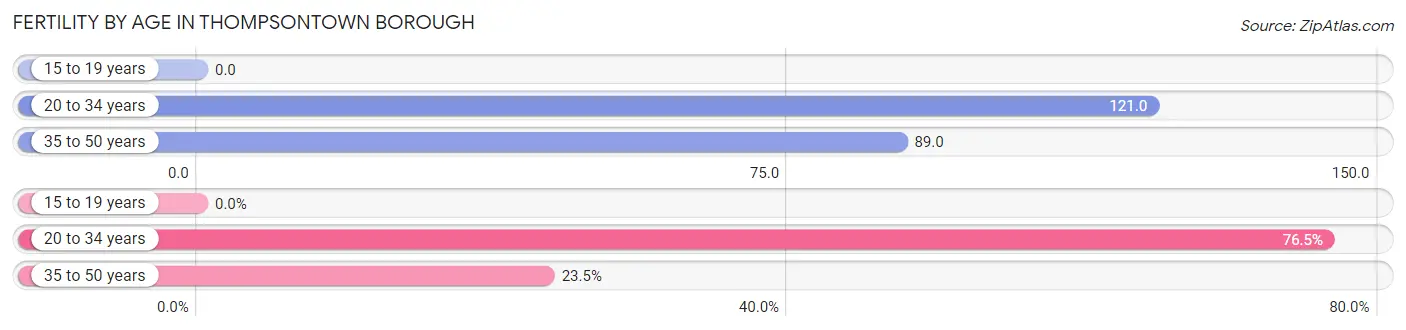
| Age Bracket | Women with Births | Births / 1,000 Women |
| 15 to 19 years | 0 (0.0%) | 0.0 |
| 20 to 34 years | 13 (76.5%) | 121.0 |
| 35 to 50 years | 4 (23.5%) | 89.0 |
| Total | 17 (100.0%) | 108.0 |
Fertility by Age by Marriage Status in Thompsontown borough
82.4% of women with births (17) in Thompsontown borough are married. The highest percentage of unmarried women with births falls into 20 to 34 years age bracket with 23.1% of them unmarried at the time of birth, while the lowest percentage of unmarried women with births belong to 35 to 50 years age bracket with 0.0% of them unmarried.
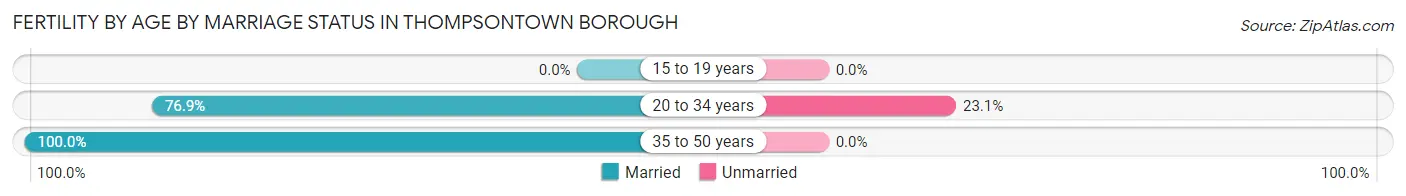
| Age Bracket | Married | Unmarried |
| 15 to 19 years | 0 (0.0%) | 0 (0.0%) |
| 20 to 34 years | 10 (76.9%) | 3 (23.1%) |
| 35 to 50 years | 4 (100.0%) | 0 (0.0%) |
| Total | 14 (82.4%) | 3 (17.6%) |
Fertility by Education in Thompsontown borough
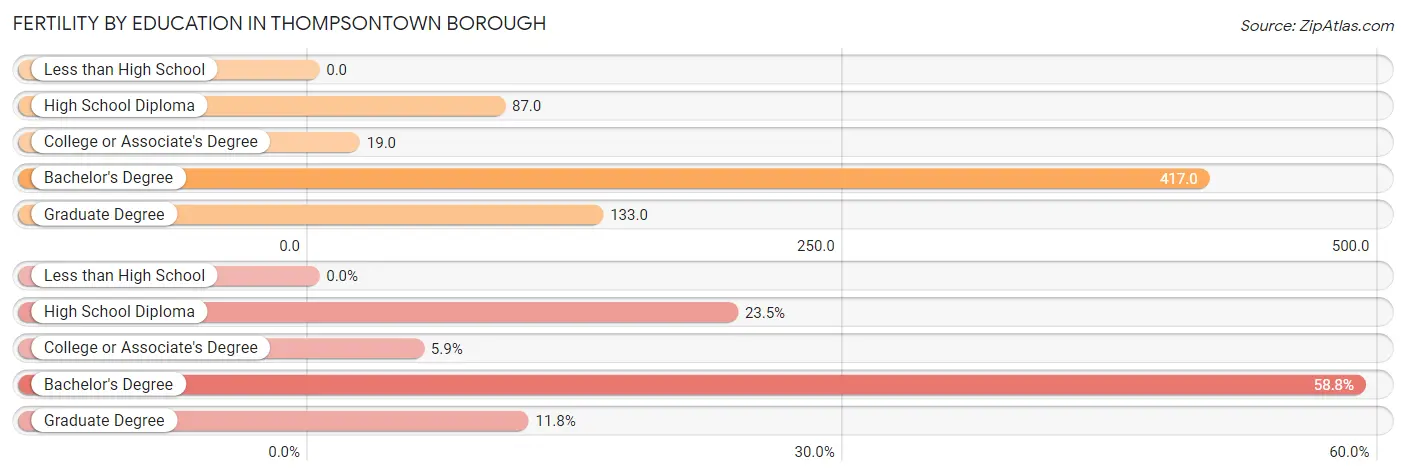
| Educational Attainment | Women with Births | Births / 1,000 Women |
| Less than High School | 0 (0.0%) | 0.0 |
| High School Diploma | 4 (23.5%) | 87.0 |
| College or Associate's Degree | 1 (5.9%) | 19.0 |
| Bachelor's Degree | 10 (58.8%) | 417.0 |
| Graduate Degree | 2 (11.8%) | 133.0 |
| Total | 17 (100.0%) | 108.0 |
Fertility by Education by Marriage Status in Thompsontown borough
17.6% of women with births in Thompsontown borough are unmarried. Women with the educational attainment of bachelor's degree are most likely to be married with 100.0% of them married at childbirth, while women with the educational attainment of college or associate's degree are least likely to be married with 100.0% of them unmarried at childbirth.
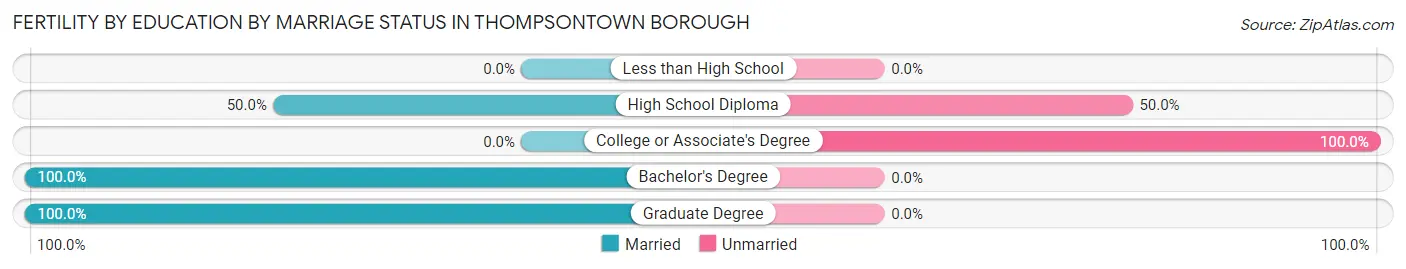
| Educational Attainment | Married | Unmarried |
| Less than High School | 0 (0.0%) | 0 (0.0%) |
| High School Diploma | 2 (50.0%) | 2 (50.0%) |
| College or Associate's Degree | 0 (0.0%) | 1 (100.0%) |
| Bachelor's Degree | 10 (100.0%) | 0 (0.0%) |
| Graduate Degree | 2 (100.0%) | 0 (0.0%) |
| Total | 14 (82.4%) | 3 (17.6%) |
Employment Characteristics in Thompsontown borough
Employment by Class of Employer in Thompsontown borough
Among the 282 employed individuals in Thompsontown borough, private company employees (226 | 80.1%), state government employees (18 | 6.4%), and not-for-profit organizations (17 | 6.0%) make up the most common classes of employment.
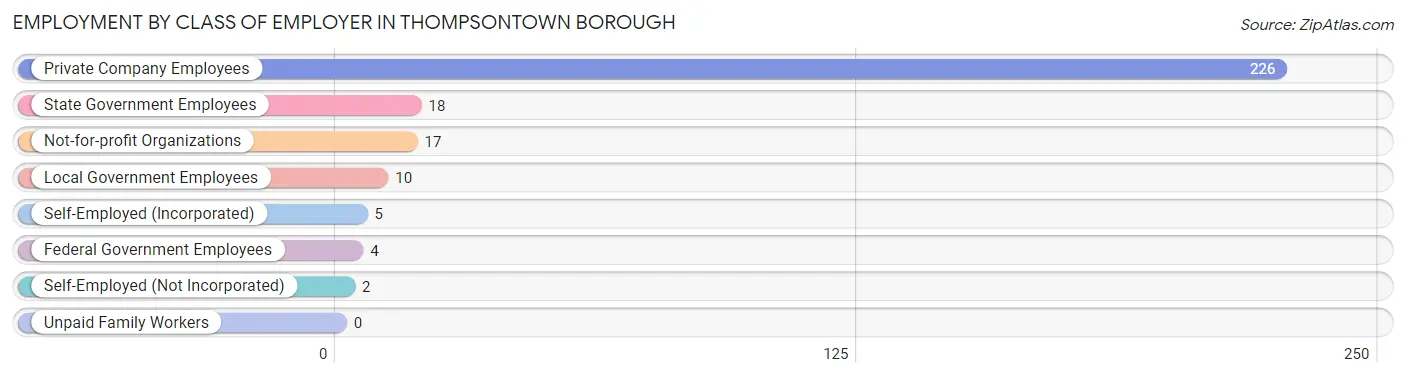
| Employer Class | # Employees | % Employees |
| Private Company Employees | 226 | 80.1% |
| Self-Employed (Incorporated) | 5 | 1.8% |
| Self-Employed (Not Incorporated) | 2 | 0.7% |
| Not-for-profit Organizations | 17 | 6.0% |
| Local Government Employees | 10 | 3.5% |
| State Government Employees | 18 | 6.4% |
| Federal Government Employees | 4 | 1.4% |
| Unpaid Family Workers | 0 | 0.0% |
| Total | 282 | 100.0% |
Employment Status by Age in Thompsontown borough
According to the labor force statistics for Thompsontown borough, out of the total population over 16 years of age (537), 53.8% or 289 individuals are in the labor force, with 2.4% or 7 of them unemployed. The age group with the highest labor force participation rate is 25 to 29 years, with 91.2% or 62 individuals in the labor force. Within the labor force, the 25 to 29 years age range has the highest percentage of unemployed individuals, with 11.3% or 7 of them being unemployed.
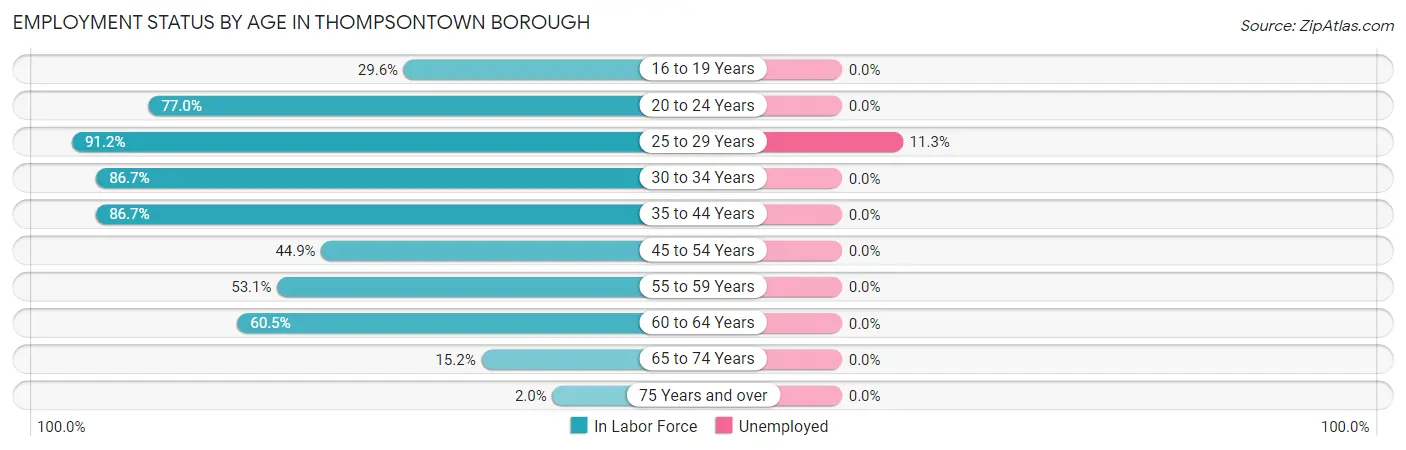
| Age Bracket | In Labor Force | Unemployed |
| 16 to 19 Years | 8 (29.6%) | 0 (0.0%) |
| 20 to 24 Years | 57 (77.0%) | 0 (0.0%) |
| 25 to 29 Years | 62 (91.2%) | 7 (11.3%) |
| 30 to 34 Years | 52 (86.7%) | 0 (0.0%) |
| 35 to 44 Years | 39 (86.7%) | 0 (0.0%) |
| 45 to 54 Years | 22 (44.9%) | 0 (0.0%) |
| 55 to 59 Years | 17 (53.1%) | 0 (0.0%) |
| 60 to 64 Years | 23 (60.5%) | 0 (0.0%) |
| 65 to 74 Years | 7 (15.2%) | 0 (0.0%) |
| 75 Years and over | 2 (2.0%) | 0 (0.0%) |
| Total | 289 (53.8%) | 7 (2.4%) |
Employment Status by Educational Attainment in Thompsontown borough
According to labor force statistics for Thompsontown borough, 73.6% of individuals (215) out of the total population between 25 and 64 years of age (292) are in the labor force, with 3.3% or 7 of them being unemployed. The group with the highest labor force participation rate are those with the educational attainment of bachelor's degree or higher, with 93.1% or 67 individuals in the labor force. Within the labor force, individuals with less than high school education have the highest percentage of unemployment, with 60.0% or 6 of them being unemployed.
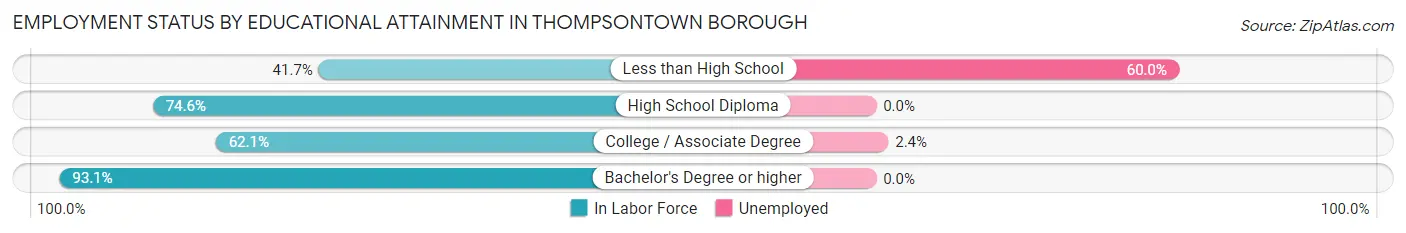
| Educational Attainment | In Labor Force | Unemployed |
| Less than High School | 10 (41.7%) | 14 (60.0%) |
| High School Diploma | 97 (74.6%) | 0 (0.0%) |
| College / Associate Degree | 41 (62.1%) | 2 (2.4%) |
| Bachelor's Degree or higher | 67 (93.1%) | 0 (0.0%) |
| Total | 215 (73.6%) | 10 (3.3%) |
Employment Occupations by Sex in Thompsontown borough
Management, Business, Science and Arts Occupations
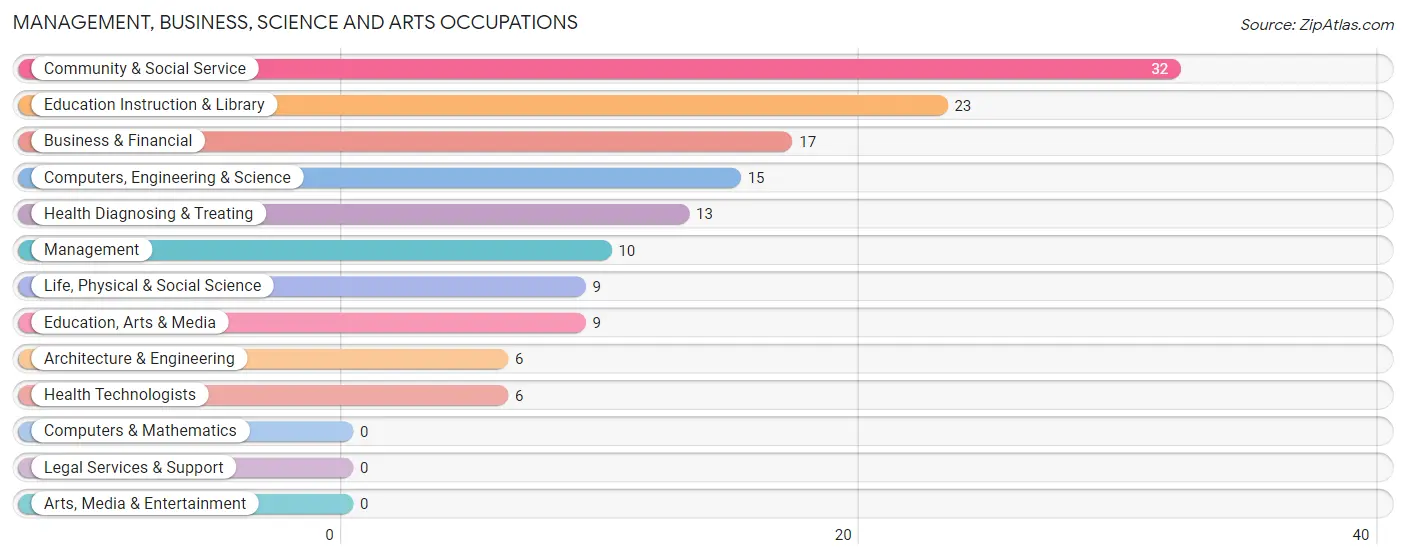
The most common Management, Business, Science and Arts occupations in Thompsontown borough are Community & Social Service (32 | 11.4%), Education Instruction & Library (23 | 8.2%), Business & Financial (17 | 6.0%), Computers, Engineering & Science (15 | 5.3%), and Health Diagnosing & Treating (13 | 4.6%).
Management, Business, Science and Arts Occupations by Sex
Within the Management, Business, Science and Arts occupations in Thompsontown borough, the most male-oriented occupations are Architecture & Engineering (100.0%), Management (80.0%), and Business & Financial (64.7%), while the most female-oriented occupations are Life, Physical & Social Science (100.0%), Health Diagnosing & Treating (76.9%), and Education Instruction & Library (60.9%).
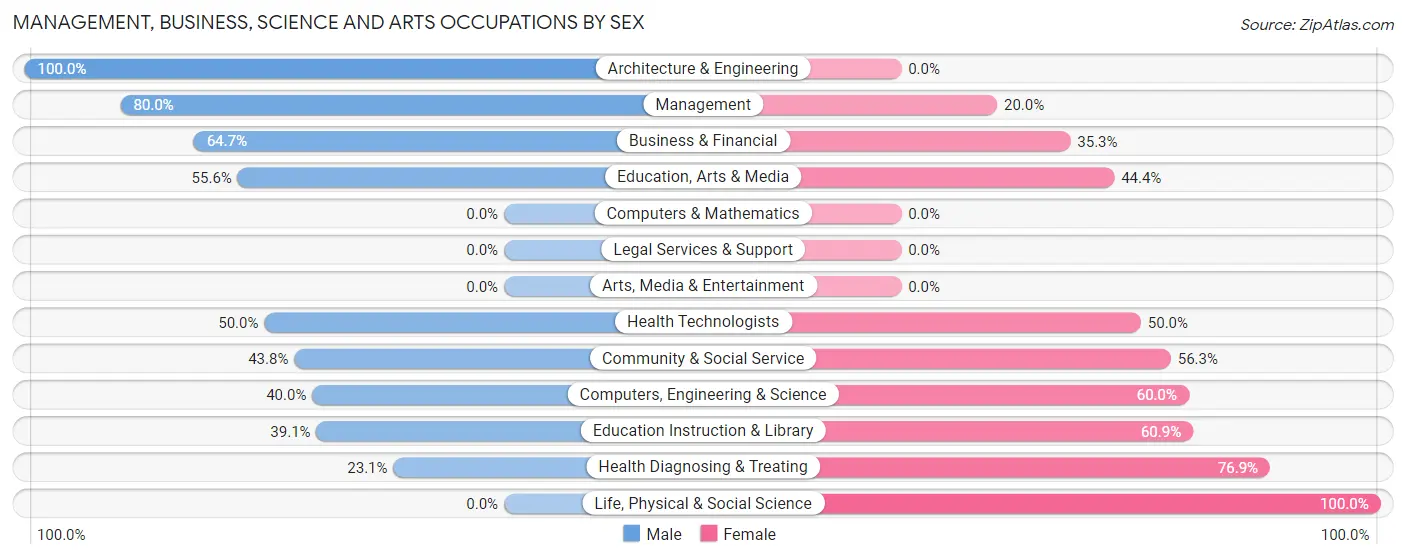
| Occupation | Male | Female |
| Management | 8 (80.0%) | 2 (20.0%) |
| Business & Financial | 11 (64.7%) | 6 (35.3%) |
| Computers, Engineering & Science | 6 (40.0%) | 9 (60.0%) |
| Computers & Mathematics | 0 (0.0%) | 0 (0.0%) |
| Architecture & Engineering | 6 (100.0%) | 0 (0.0%) |
| Life, Physical & Social Science | 0 (0.0%) | 9 (100.0%) |
| Community & Social Service | 14 (43.8%) | 18 (56.2%) |
| Education, Arts & Media | 5 (55.6%) | 4 (44.4%) |
| Legal Services & Support | 0 (0.0%) | 0 (0.0%) |
| Education Instruction & Library | 9 (39.1%) | 14 (60.9%) |
| Arts, Media & Entertainment | 0 (0.0%) | 0 (0.0%) |
| Health Diagnosing & Treating | 3 (23.1%) | 10 (76.9%) |
| Health Technologists | 3 (50.0%) | 3 (50.0%) |
| Total (Category) | 42 (48.3%) | 45 (51.7%) |
| Total (Overall) | 133 (47.2%) | 149 (52.8%) |
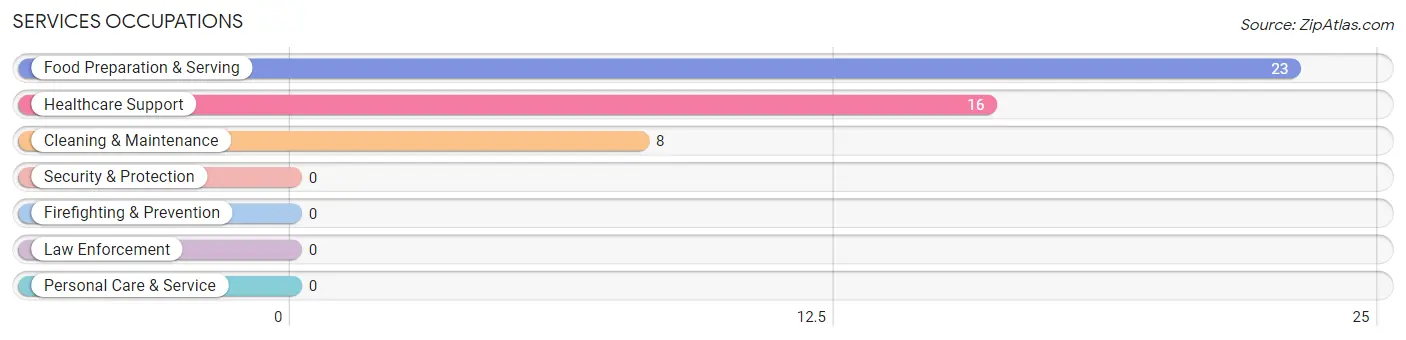
Services Occupations
The most common Services occupations in Thompsontown borough are Food Preparation & Serving (23 | 8.2%), Healthcare Support (16 | 5.7%), and Cleaning & Maintenance (8 | 2.8%).
Services Occupations by Sex
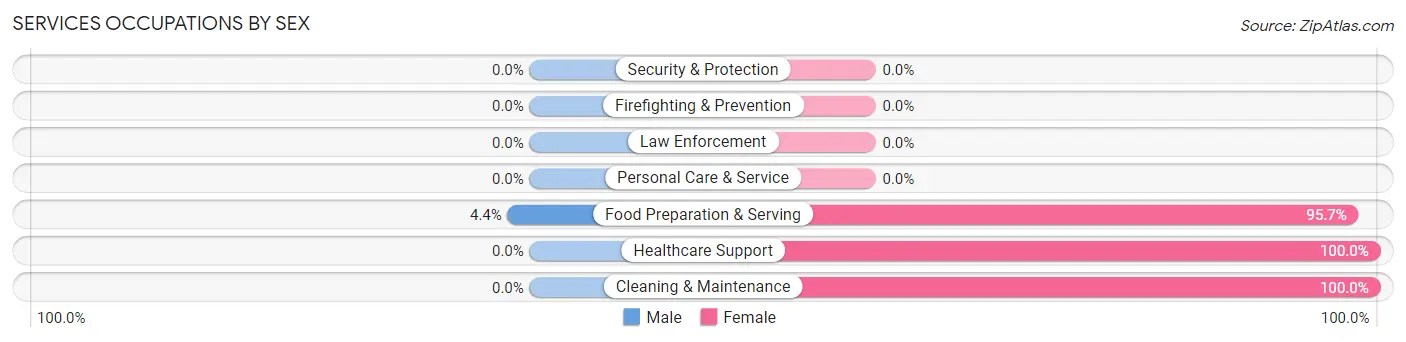
| Occupation | Male | Female |
| Healthcare Support | 0 (0.0%) | 16 (100.0%) |
| Security & Protection | 0 (0.0%) | 0 (0.0%) |
| Firefighting & Prevention | 0 (0.0%) | 0 (0.0%) |
| Law Enforcement | 0 (0.0%) | 0 (0.0%) |
| Food Preparation & Serving | 1 (4.3%) | 22 (95.7%) |
| Cleaning & Maintenance | 0 (0.0%) | 8 (100.0%) |
| Personal Care & Service | 0 (0.0%) | 0 (0.0%) |
| Total (Category) | 1 (2.1%) | 46 (97.9%) |
| Total (Overall) | 133 (47.2%) | 149 (52.8%) |
Sales and Office Occupations
The most common Sales and Office occupations in Thompsontown borough are , and Office & Administration (30 | 10.6%).
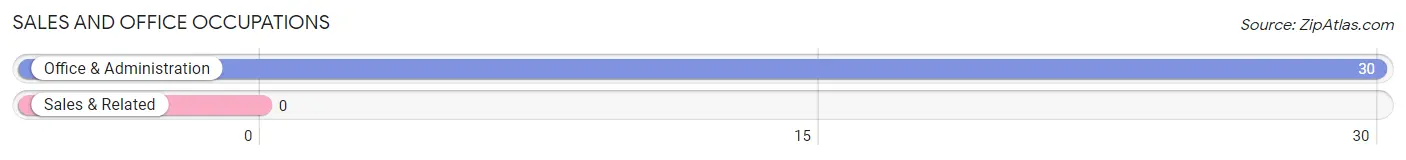
Sales and Office Occupations by Sex
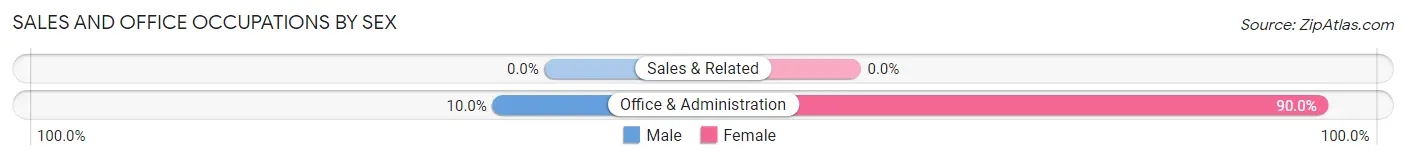
| Occupation | Male | Female |
| Sales & Related | 0 (0.0%) | 0 (0.0%) |
| Office & Administration | 3 (10.0%) | 27 (90.0%) |
| Total (Category) | 3 (10.0%) | 27 (90.0%) |
| Total (Overall) | 133 (47.2%) | 149 (52.8%) |
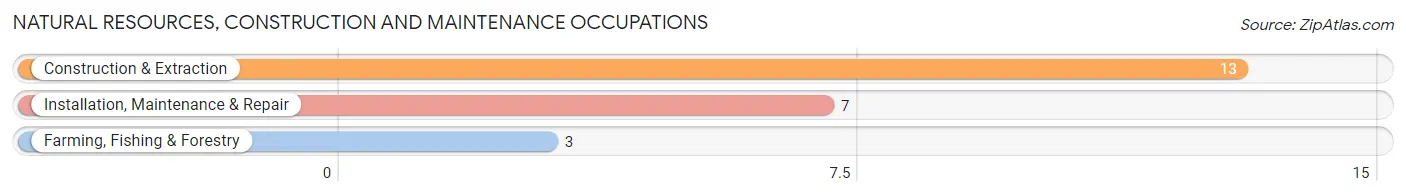
Natural Resources, Construction and Maintenance Occupations
The most common Natural Resources, Construction and Maintenance occupations in Thompsontown borough are Construction & Extraction (13 | 4.6%), Installation, Maintenance & Repair (7 | 2.5%), and Farming, Fishing & Forestry (3 | 1.1%).
Natural Resources, Construction and Maintenance Occupations by Sex
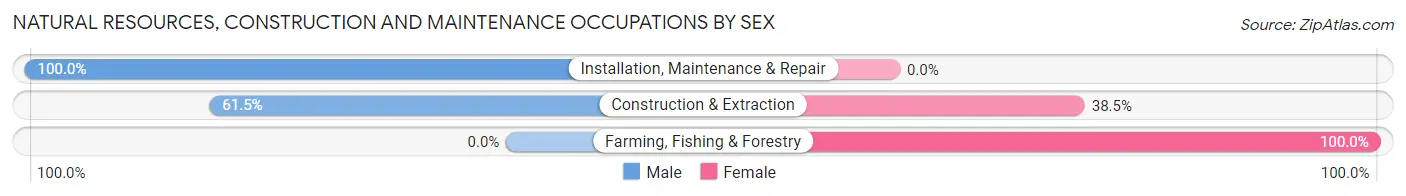
| Occupation | Male | Female |
| Farming, Fishing & Forestry | 0 (0.0%) | 3 (100.0%) |
| Construction & Extraction | 8 (61.5%) | 5 (38.5%) |
| Installation, Maintenance & Repair | 7 (100.0%) | 0 (0.0%) |
| Total (Category) | 15 (65.2%) | 8 (34.8%) |
| Total (Overall) | 133 (47.2%) | 149 (52.8%) |
Production, Transportation and Moving Occupations
The most common Production, Transportation and Moving occupations in Thompsontown borough are Production (59 | 20.9%), Material Moving (29 | 10.3%), and Transportation (7 | 2.5%).
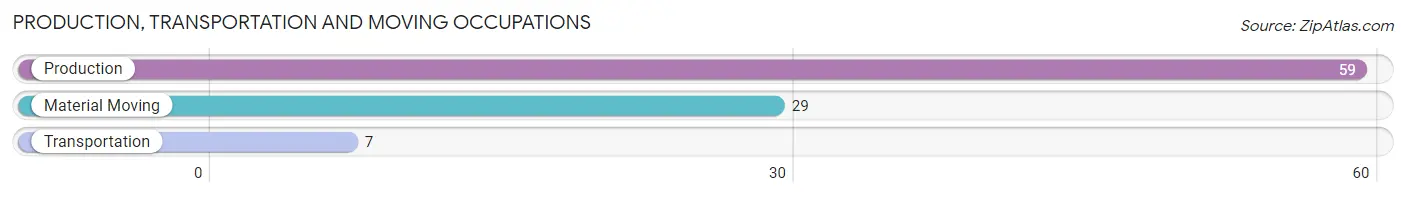
Production, Transportation and Moving Occupations by Sex
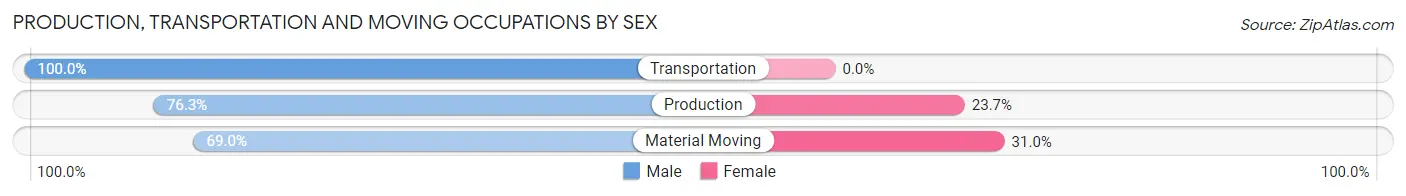
| Occupation | Male | Female |
| Production | 45 (76.3%) | 14 (23.7%) |
| Transportation | 7 (100.0%) | 0 (0.0%) |
| Material Moving | 20 (69.0%) | 9 (31.0%) |
| Total (Category) | 72 (75.8%) | 23 (24.2%) |
| Total (Overall) | 133 (47.2%) | 149 (52.8%) |
Employment Industries by Sex in Thompsontown borough
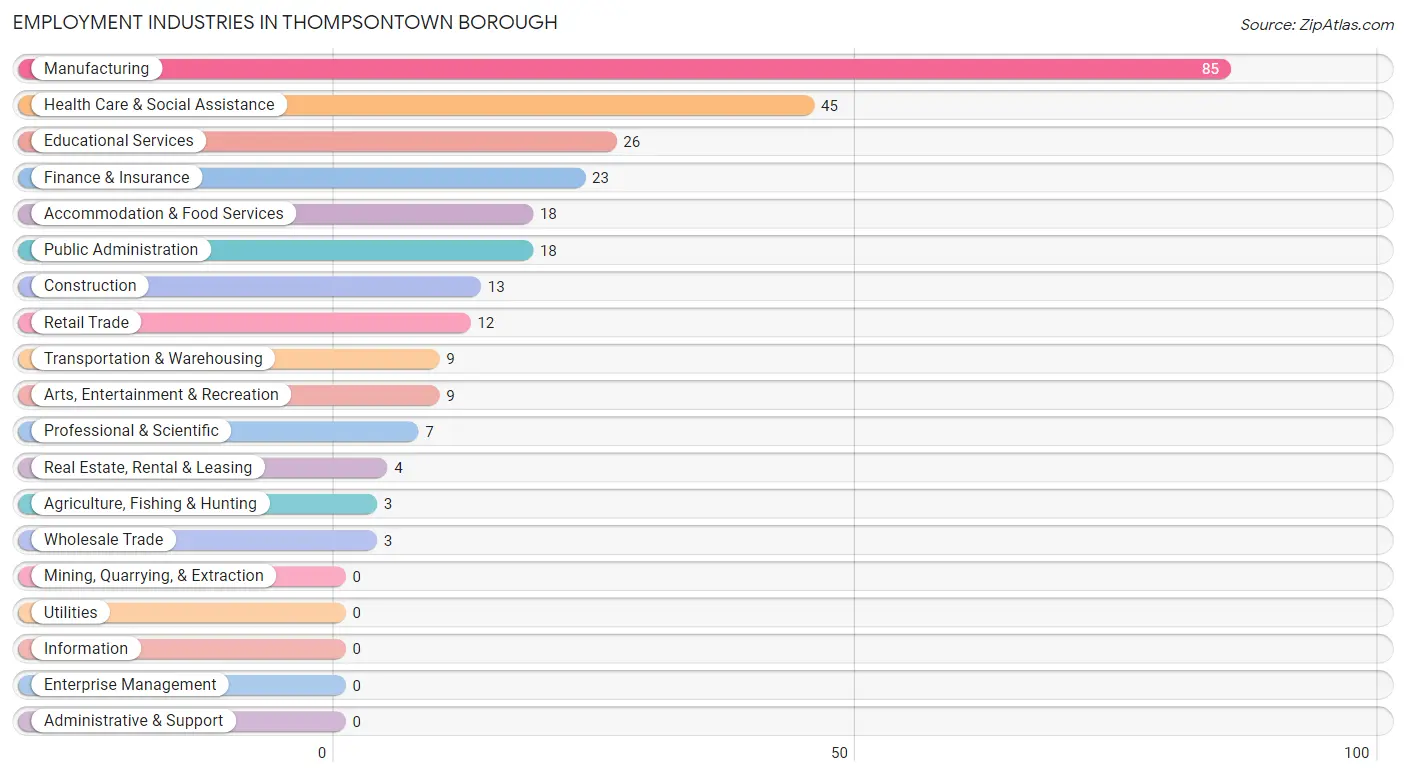
Employment Industries in Thompsontown borough
The major employment industries in Thompsontown borough include Manufacturing (85 | 30.1%), Health Care & Social Assistance (45 | 16.0%), Educational Services (26 | 9.2%), Finance & Insurance (23 | 8.2%), and Accommodation & Food Services (18 | 6.4%).
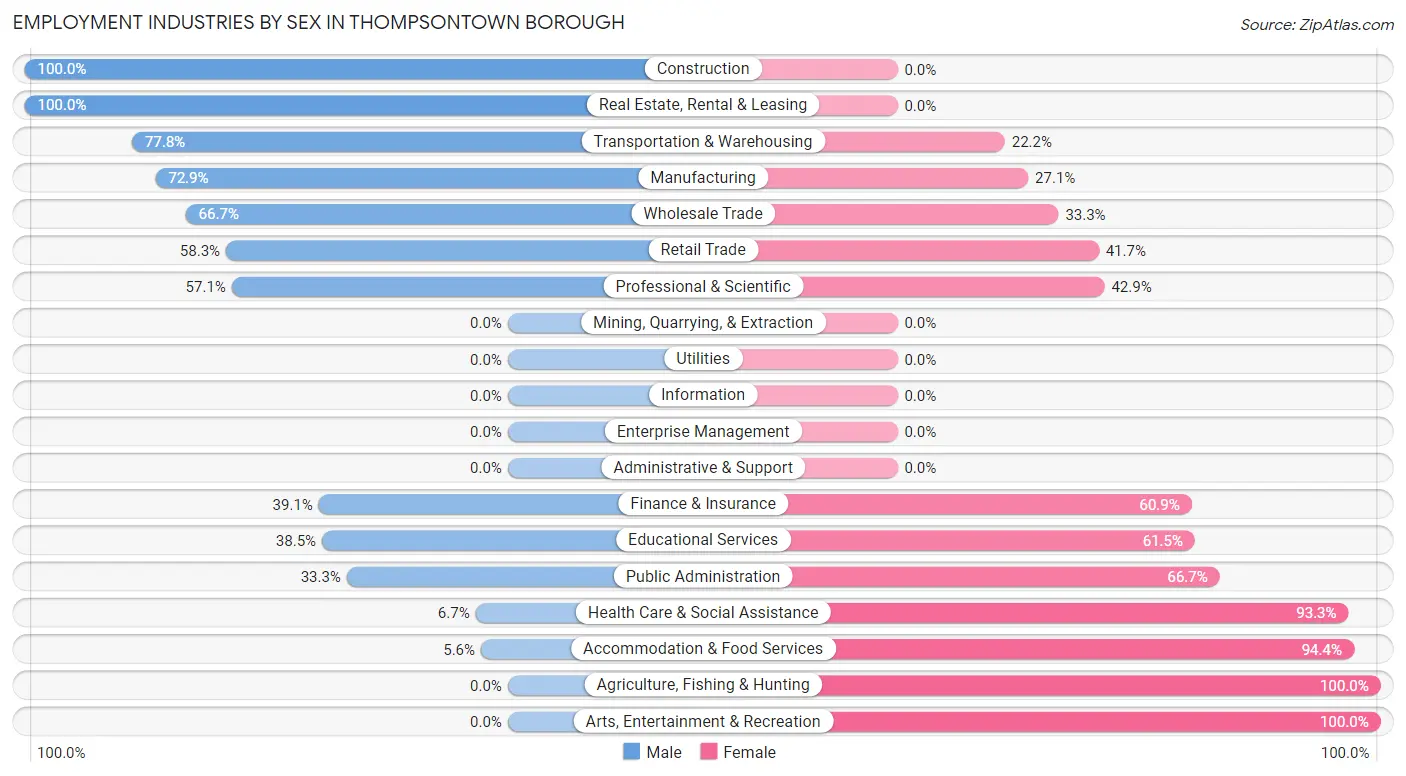
Employment Industries by Sex in Thompsontown borough
The Thompsontown borough industries that see more men than women are Construction (100.0%), Real Estate, Rental & Leasing (100.0%), and Transportation & Warehousing (77.8%), whereas the industries that tend to have a higher number of women are Agriculture, Fishing & Hunting (100.0%), Arts, Entertainment & Recreation (100.0%), and Accommodation & Food Services (94.4%).
| Industry | Male | Female |
| Agriculture, Fishing & Hunting | 0 (0.0%) | 3 (100.0%) |
| Mining, Quarrying, & Extraction | 0 (0.0%) | 0 (0.0%) |
| Construction | 13 (100.0%) | 0 (0.0%) |
| Manufacturing | 62 (72.9%) | 23 (27.1%) |
| Wholesale Trade | 2 (66.7%) | 1 (33.3%) |
| Retail Trade | 7 (58.3%) | 5 (41.7%) |
| Transportation & Warehousing | 7 (77.8%) | 2 (22.2%) |
| Utilities | 0 (0.0%) | 0 (0.0%) |
| Information | 0 (0.0%) | 0 (0.0%) |
| Finance & Insurance | 9 (39.1%) | 14 (60.9%) |
| Real Estate, Rental & Leasing | 4 (100.0%) | 0 (0.0%) |
| Professional & Scientific | 4 (57.1%) | 3 (42.9%) |
| Enterprise Management | 0 (0.0%) | 0 (0.0%) |
| Administrative & Support | 0 (0.0%) | 0 (0.0%) |
| Educational Services | 10 (38.5%) | 16 (61.5%) |
| Health Care & Social Assistance | 3 (6.7%) | 42 (93.3%) |
| Arts, Entertainment & Recreation | 0 (0.0%) | 9 (100.0%) |
| Accommodation & Food Services | 1 (5.6%) | 17 (94.4%) |
| Public Administration | 6 (33.3%) | 12 (66.7%) |
| Total | 133 (47.2%) | 149 (52.8%) |
Education in Thompsontown borough
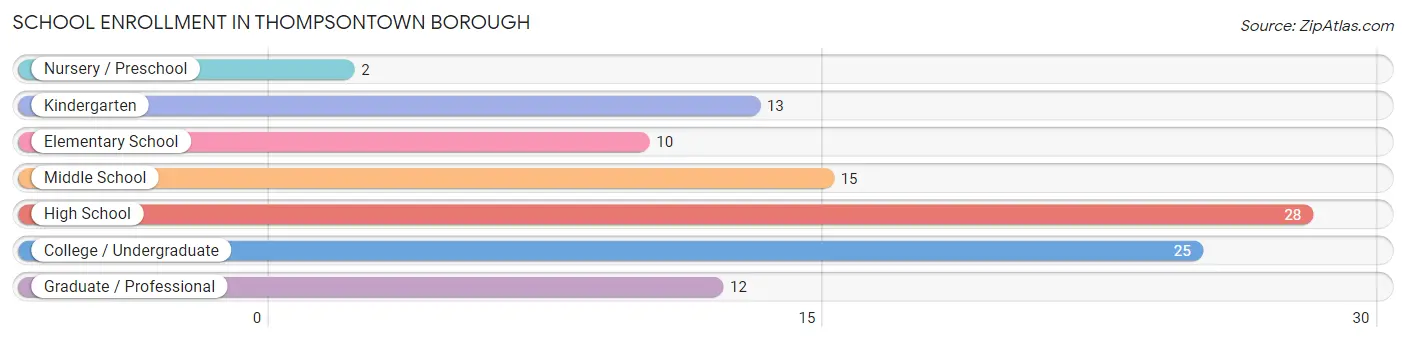
School Enrollment in Thompsontown borough
The most common levels of schooling among the 105 students in Thompsontown borough are high school (28 | 26.7%), college / undergraduate (25 | 23.8%), and middle school (15 | 14.3%).
| School Level | # Students | % Students |
| Nursery / Preschool | 2 | 1.9% |
| Kindergarten | 13 | 12.4% |
| Elementary School | 10 | 9.5% |
| Middle School | 15 | 14.3% |
| High School | 28 | 26.7% |
| College / Undergraduate | 25 | 23.8% |
| Graduate / Professional | 12 | 11.4% |
| Total | 105 | 100.0% |
School Enrollment by Age by Funding Source in Thompsontown borough
Out of a total of 105 students who are enrolled in schools in Thompsontown borough, 31 (29.5%) attend a private institution, while the remaining 74 (70.5%) are enrolled in public schools. The age group of 20 to 24 year olds has the highest likelihood of being enrolled in private schools, with 8 (53.3% in the age bracket) enrolled. Conversely, the age group of 3 to 4 year olds has the lowest likelihood of being enrolled in a private school, with 2 (100.0% in the age bracket) attending a public institution.
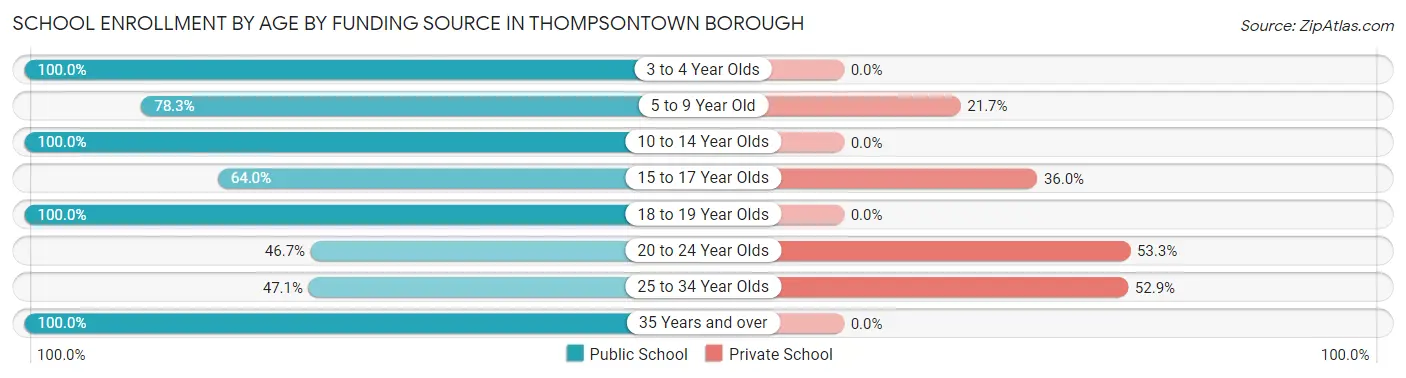
| Age Bracket | Public School | Private School |
| 3 to 4 Year Olds | 2 (100.0%) | 0 (0.0%) |
| 5 to 9 Year Old | 18 (78.3%) | 5 (21.7%) |
| 10 to 14 Year Olds | 15 (100.0%) | 0 (0.0%) |
| 15 to 17 Year Olds | 16 (64.0%) | 9 (36.0%) |
| 18 to 19 Year Olds | 7 (100.0%) | 0 (0.0%) |
| 20 to 24 Year Olds | 7 (46.7%) | 8 (53.3%) |
| 25 to 34 Year Olds | 8 (47.1%) | 9 (52.9%) |
| 35 Years and over | 1 (100.0%) | 0 (0.0%) |
| Total | 74 (70.5%) | 31 (29.5%) |
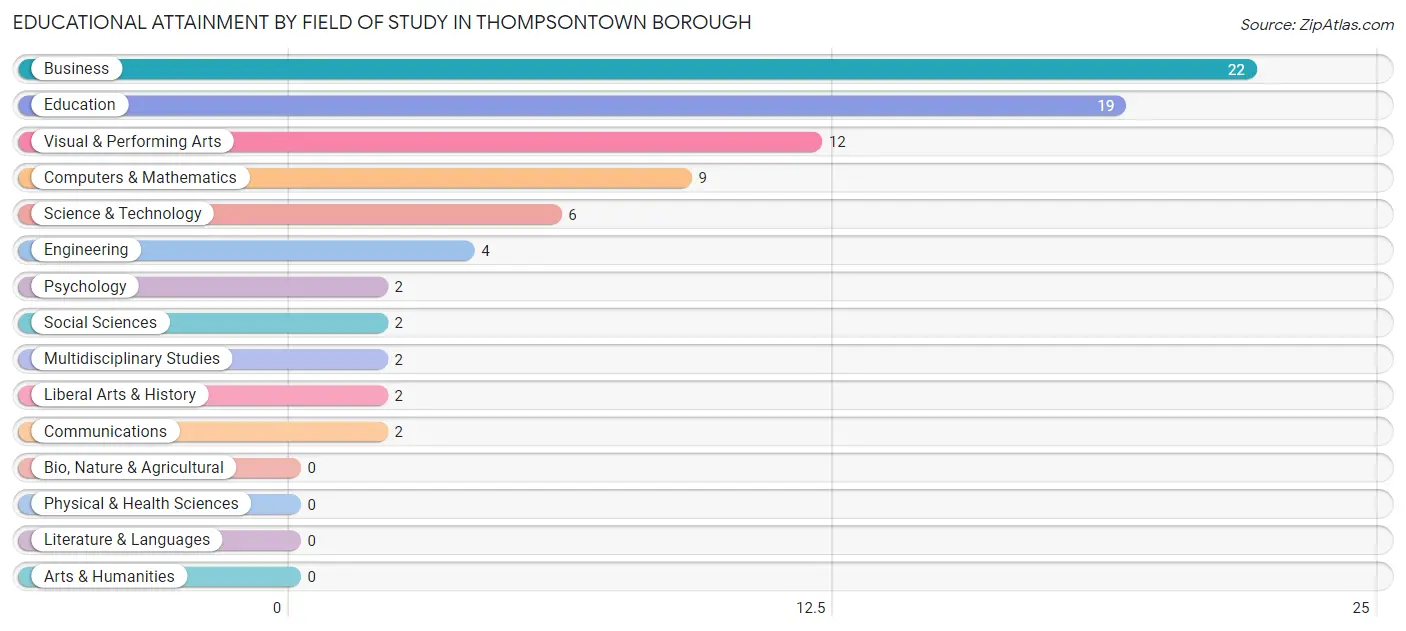
Educational Attainment by Field of Study in Thompsontown borough
Business (22 | 26.8%), education (19 | 23.2%), visual & performing arts (12 | 14.6%), computers & mathematics (9 | 11.0%), and science & technology (6 | 7.3%) are the most common fields of study among 82 individuals in Thompsontown borough who have obtained a bachelor's degree or higher.
| Field of Study | # Graduates | % Graduates |
| Computers & Mathematics | 9 | 11.0% |
| Bio, Nature & Agricultural | 0 | 0.0% |
| Physical & Health Sciences | 0 | 0.0% |
| Psychology | 2 | 2.4% |
| Social Sciences | 2 | 2.4% |
| Engineering | 4 | 4.9% |
| Multidisciplinary Studies | 2 | 2.4% |
| Science & Technology | 6 | 7.3% |
| Business | 22 | 26.8% |
| Education | 19 | 23.2% |
| Literature & Languages | 0 | 0.0% |
| Liberal Arts & History | 2 | 2.4% |
| Visual & Performing Arts | 12 | 14.6% |
| Communications | 2 | 2.4% |
| Arts & Humanities | 0 | 0.0% |
| Total | 82 | 100.0% |
Transportation & Commute in Thompsontown borough
Vehicle Availability by Sex in Thompsontown borough
The most prevalent vehicle ownership categories in Thompsontown borough are males with 2 vehicles (69, accounting for 51.9%) and females with 2 vehicles (73, making up 46.3%).
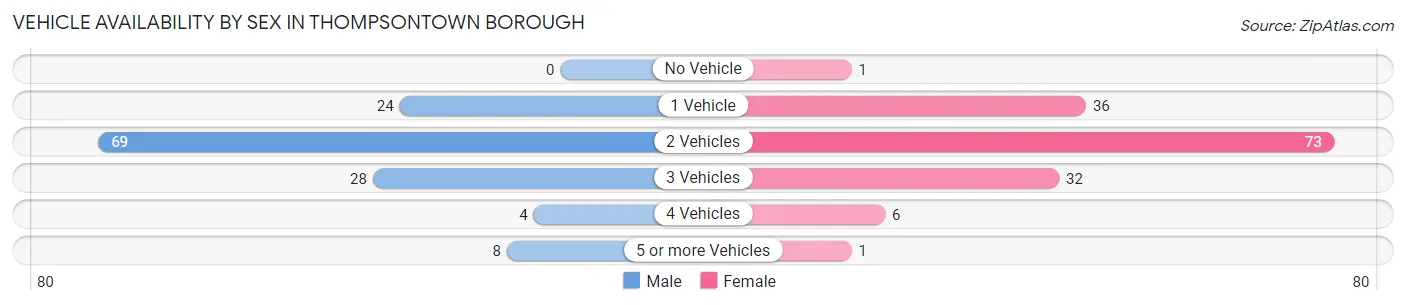
| Vehicles Available | Male | Female |
| No Vehicle | 0 (0.0%) | 1 (0.7%) |
| 1 Vehicle | 24 (18.0%) | 36 (24.2%) |
| 2 Vehicles | 69 (51.9%) | 73 (49.0%) |
| 3 Vehicles | 28 (21.0%) | 32 (21.5%) |
| 4 Vehicles | 4 (3.0%) | 6 (4.0%) |
| 5 or more Vehicles | 8 (6.0%) | 1 (0.7%) |
| Total | 133 (100.0%) | 149 (100.0%) |
Commute Time in Thompsontown borough
The most frequently occuring commute durations in Thompsontown borough are 45 to 59 minutes (43 commuters, 17.1%), 60 to 89 minutes (40 commuters, 15.9%), and 5 to 9 minutes (32 commuters, 12.8%).

| Commute Time | # Commuters | % Commuters |
| Less than 5 Minutes | 22 | 8.8% |
| 5 to 9 Minutes | 32 | 12.8% |
| 10 to 14 Minutes | 17 | 6.8% |
| 15 to 19 Minutes | 24 | 9.6% |
| 20 to 24 Minutes | 12 | 4.8% |
| 25 to 29 Minutes | 4 | 1.6% |
| 30 to 34 Minutes | 14 | 5.6% |
| 35 to 39 Minutes | 15 | 6.0% |
| 40 to 44 Minutes | 19 | 7.6% |
| 45 to 59 Minutes | 43 | 17.1% |
| 60 to 89 Minutes | 40 | 15.9% |
| 90 or more Minutes | 9 | 3.6% |
Commute Time by Sex in Thompsontown borough
The most common commute times in Thompsontown borough are 45 to 59 minutes (32 commuters, 26.2%) for males and 60 to 89 minutes (23 commuters, 17.8%) for females.
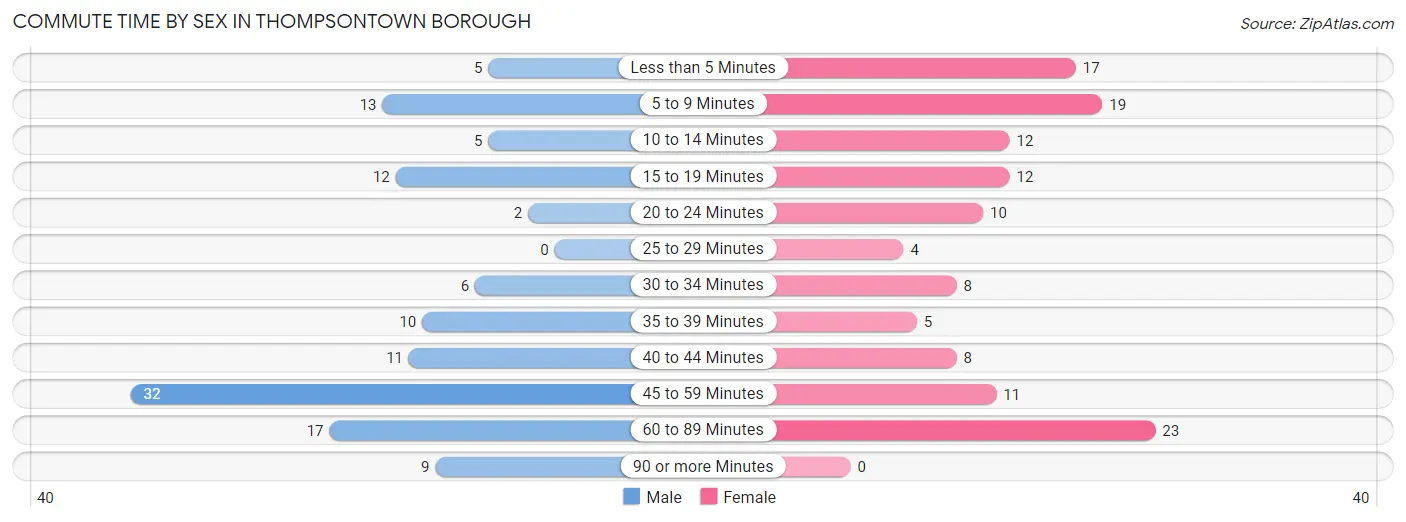
| Commute Time | Male | Female |
| Less than 5 Minutes | 5 (4.1%) | 17 (13.2%) |
| 5 to 9 Minutes | 13 (10.7%) | 19 (14.7%) |
| 10 to 14 Minutes | 5 (4.1%) | 12 (9.3%) |
| 15 to 19 Minutes | 12 (9.8%) | 12 (9.3%) |
| 20 to 24 Minutes | 2 (1.6%) | 10 (7.7%) |
| 25 to 29 Minutes | 0 (0.0%) | 4 (3.1%) |
| 30 to 34 Minutes | 6 (4.9%) | 8 (6.2%) |
| 35 to 39 Minutes | 10 (8.2%) | 5 (3.9%) |
| 40 to 44 Minutes | 11 (9.0%) | 8 (6.2%) |
| 45 to 59 Minutes | 32 (26.2%) | 11 (8.5%) |
| 60 to 89 Minutes | 17 (13.9%) | 23 (17.8%) |
| 90 or more Minutes | 9 (7.4%) | 0 (0.0%) |
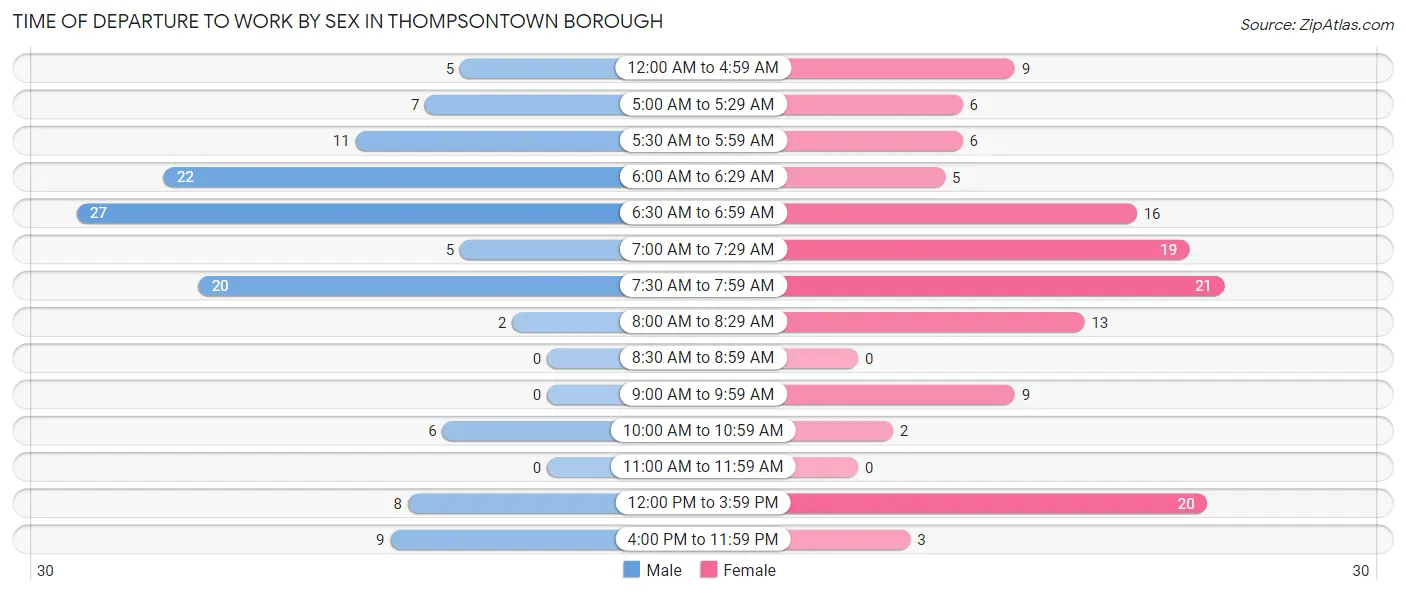
Time of Departure to Work by Sex in Thompsontown borough
The most frequent times of departure to work in Thompsontown borough are 6:30 AM to 6:59 AM (27, 22.1%) for males and 7:30 AM to 7:59 AM (21, 16.3%) for females.
| Time of Departure | Male | Female |
| 12:00 AM to 4:59 AM | 5 (4.1%) | 9 (7.0%) |
| 5:00 AM to 5:29 AM | 7 (5.7%) | 6 (4.6%) |
| 5:30 AM to 5:59 AM | 11 (9.0%) | 6 (4.6%) |
| 6:00 AM to 6:29 AM | 22 (18.0%) | 5 (3.9%) |
| 6:30 AM to 6:59 AM | 27 (22.1%) | 16 (12.4%) |
| 7:00 AM to 7:29 AM | 5 (4.1%) | 19 (14.7%) |
| 7:30 AM to 7:59 AM | 20 (16.4%) | 21 (16.3%) |
| 8:00 AM to 8:29 AM | 2 (1.6%) | 13 (10.1%) |
| 8:30 AM to 8:59 AM | 0 (0.0%) | 0 (0.0%) |
| 9:00 AM to 9:59 AM | 0 (0.0%) | 9 (7.0%) |
| 10:00 AM to 10:59 AM | 6 (4.9%) | 2 (1.5%) |
| 11:00 AM to 11:59 AM | 0 (0.0%) | 0 (0.0%) |
| 12:00 PM to 3:59 PM | 8 (6.6%) | 20 (15.5%) |
| 4:00 PM to 11:59 PM | 9 (7.4%) | 3 (2.3%) |
| Total | 122 (100.0%) | 129 (100.0%) |
Housing Occupancy in Thompsontown borough
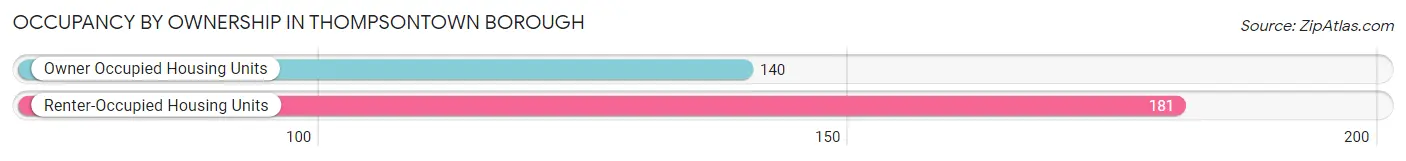
Occupancy by Ownership in Thompsontown borough
Of the total 321 dwellings in Thompsontown borough, owner-occupied units account for 140 (43.6%), while renter-occupied units make up 181 (56.4%).
| Occupancy | # Housing Units | % Housing Units |
| Owner Occupied Housing Units | 140 | 43.6% |
| Renter-Occupied Housing Units | 181 | 56.4% |
| Total Occupied Housing Units | 321 | 100.0% |
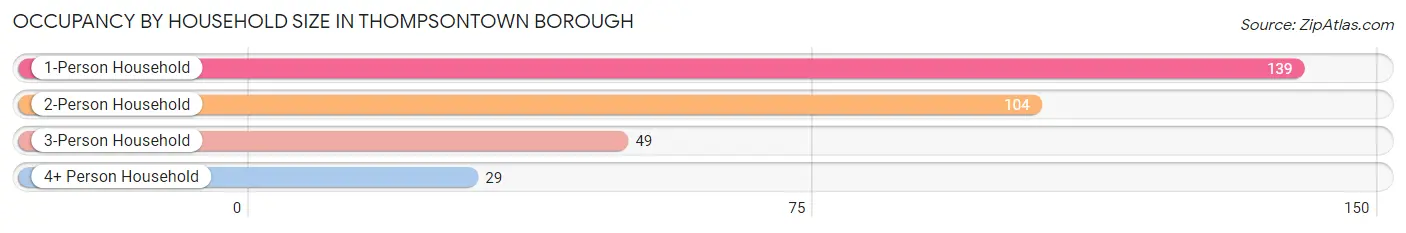
Occupancy by Household Size in Thompsontown borough
| Household Size | # Housing Units | % Housing Units |
| 1-Person Household | 139 | 43.3% |
| 2-Person Household | 104 | 32.4% |
| 3-Person Household | 49 | 15.3% |
| 4+ Person Household | 29 | 9.0% |
| Total Housing Units | 321 | 100.0% |
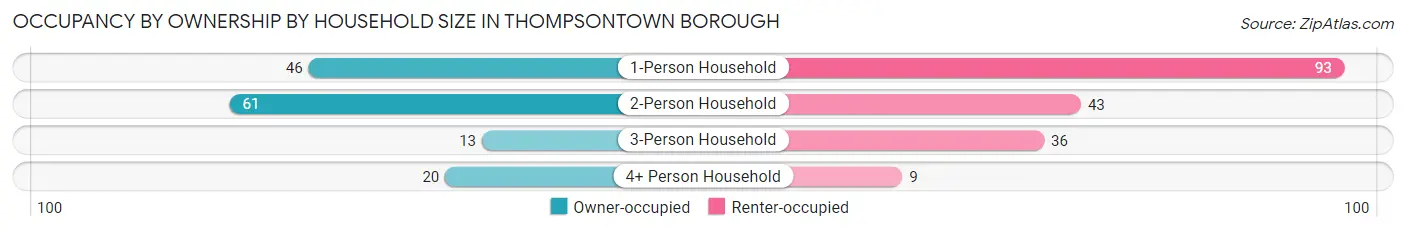
Occupancy by Ownership by Household Size in Thompsontown borough
| Household Size | Owner-occupied | Renter-occupied |
| 1-Person Household | 46 (33.1%) | 93 (66.9%) |
| 2-Person Household | 61 (58.7%) | 43 (41.3%) |
| 3-Person Household | 13 (26.5%) | 36 (73.5%) |
| 4+ Person Household | 20 (69.0%) | 9 (31.0%) |
| Total Housing Units | 140 (43.6%) | 181 (56.4%) |
Occupancy by Educational Attainment in Thompsontown borough
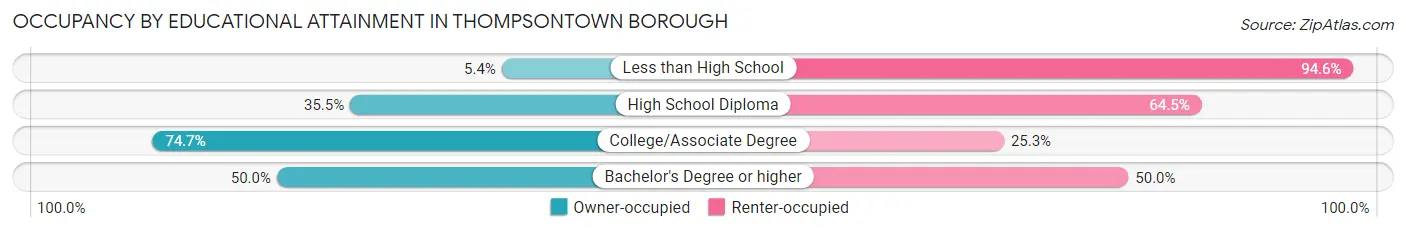
| Household Size | Owner-occupied | Renter-occupied |
| Less than High School | 2 (5.4%) | 35 (94.6%) |
| High School Diploma | 55 (35.5%) | 100 (64.5%) |
| College/Associate Degree | 56 (74.7%) | 19 (25.3%) |
| Bachelor's Degree or higher | 27 (50.0%) | 27 (50.0%) |
Occupancy by Age of Householder in Thompsontown borough
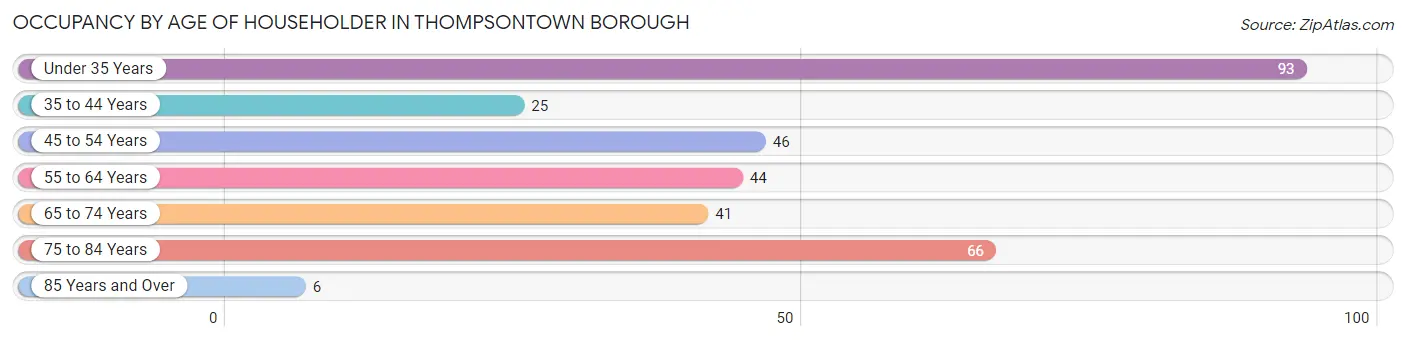
| Age Bracket | # Households | % Households |
| Under 35 Years | 93 | 29.0% |
| 35 to 44 Years | 25 | 7.8% |
| 45 to 54 Years | 46 | 14.3% |
| 55 to 64 Years | 44 | 13.7% |
| 65 to 74 Years | 41 | 12.8% |
| 75 to 84 Years | 66 | 20.6% |
| 85 Years and Over | 6 | 1.9% |
| Total | 321 | 100.0% |
Housing Finances in Thompsontown borough
Median Income by Occupancy in Thompsontown borough
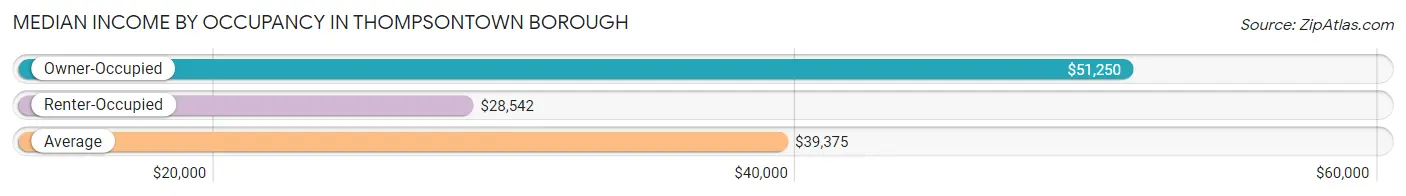
| Occupancy Type | # Households | Median Income |
| Owner-Occupied | 140 (43.6%) | $51,250 |
| Renter-Occupied | 181 (56.4%) | $28,542 |
| Average | 321 (100.0%) | $39,375 |
Occupancy by Householder Income Bracket in Thompsontown borough
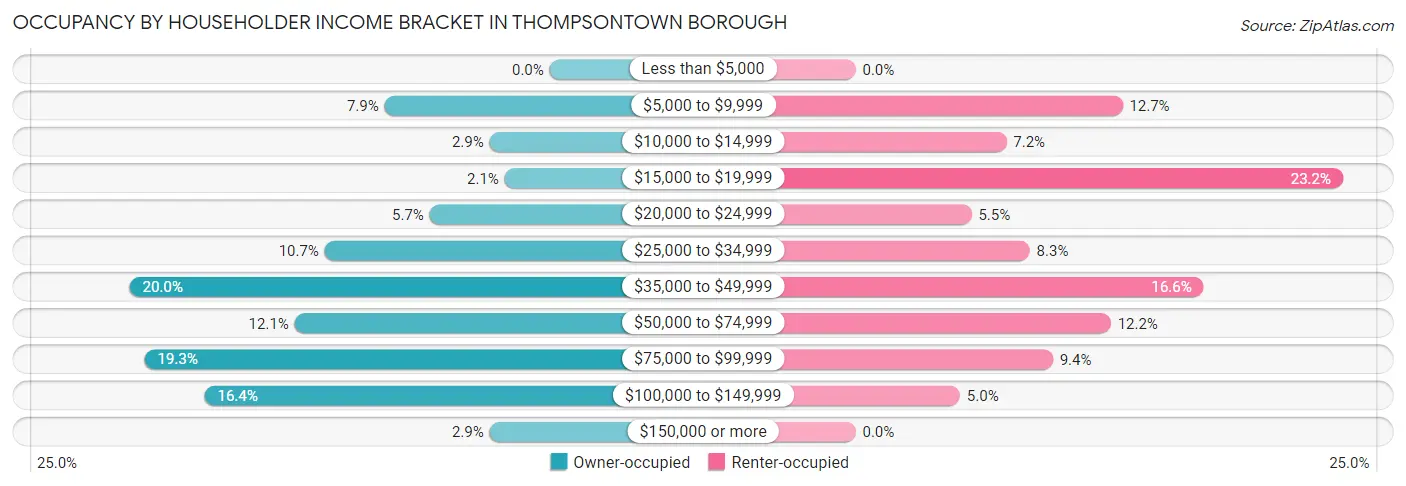
| Income Bracket | Owner-occupied | Renter-occupied |
| Less than $5,000 | 0 (0.0%) | 0 (0.0%) |
| $5,000 to $9,999 | 11 (7.9%) | 23 (12.7%) |
| $10,000 to $14,999 | 4 (2.9%) | 13 (7.2%) |
| $15,000 to $19,999 | 3 (2.1%) | 42 (23.2%) |
| $20,000 to $24,999 | 8 (5.7%) | 10 (5.5%) |
| $25,000 to $34,999 | 15 (10.7%) | 15 (8.3%) |
| $35,000 to $49,999 | 28 (20.0%) | 30 (16.6%) |
| $50,000 to $74,999 | 17 (12.1%) | 22 (12.1%) |
| $75,000 to $99,999 | 27 (19.3%) | 17 (9.4%) |
| $100,000 to $149,999 | 23 (16.4%) | 9 (5.0%) |
| $150,000 or more | 4 (2.9%) | 0 (0.0%) |
| Total | 140 (100.0%) | 181 (100.0%) |
Monthly Housing Cost Tiers in Thompsontown borough
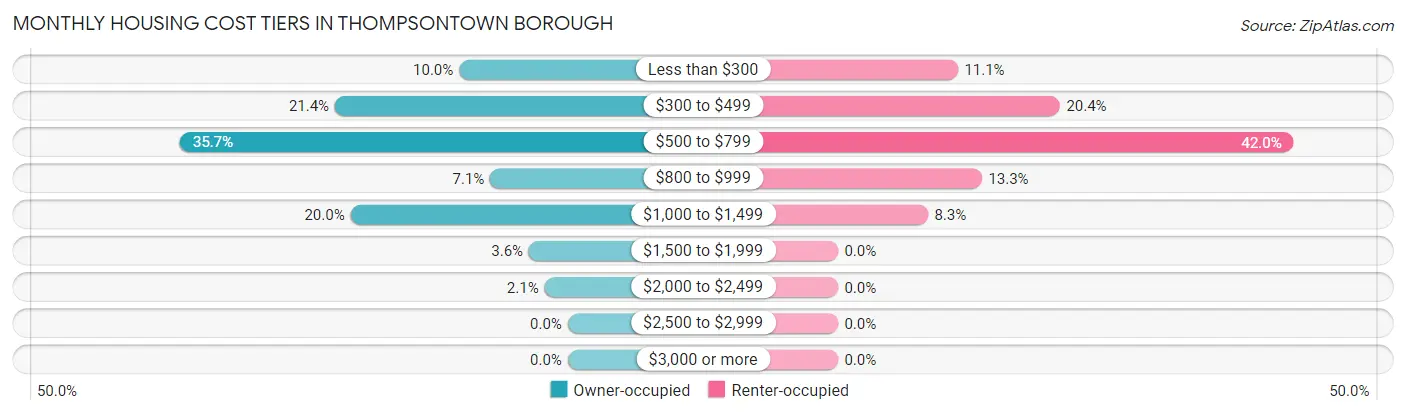
| Monthly Cost | Owner-occupied | Renter-occupied |
| Less than $300 | 14 (10.0%) | 20 (11.1%) |
| $300 to $499 | 30 (21.4%) | 37 (20.4%) |
| $500 to $799 | 50 (35.7%) | 76 (42.0%) |
| $800 to $999 | 10 (7.1%) | 24 (13.3%) |
| $1,000 to $1,499 | 28 (20.0%) | 15 (8.3%) |
| $1,500 to $1,999 | 5 (3.6%) | 0 (0.0%) |
| $2,000 to $2,499 | 3 (2.1%) | 0 (0.0%) |
| $2,500 to $2,999 | 0 (0.0%) | 0 (0.0%) |
| $3,000 or more | 0 (0.0%) | 0 (0.0%) |
| Total | 140 (100.0%) | 181 (100.0%) |
Physical Housing Characteristics in Thompsontown borough
Housing Structures in Thompsontown borough
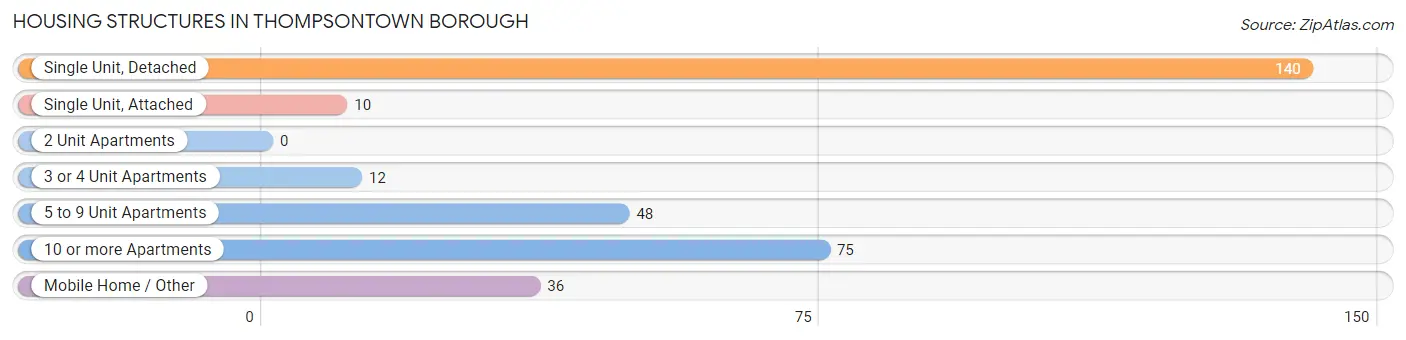
| Structure Type | # Housing Units | % Housing Units |
| Single Unit, Detached | 140 | 43.6% |
| Single Unit, Attached | 10 | 3.1% |
| 2 Unit Apartments | 0 | 0.0% |
| 3 or 4 Unit Apartments | 12 | 3.7% |
| 5 to 9 Unit Apartments | 48 | 14.9% |
| 10 or more Apartments | 75 | 23.4% |
| Mobile Home / Other | 36 | 11.2% |
| Total | 321 | 100.0% |
Housing Structures by Occupancy in Thompsontown borough
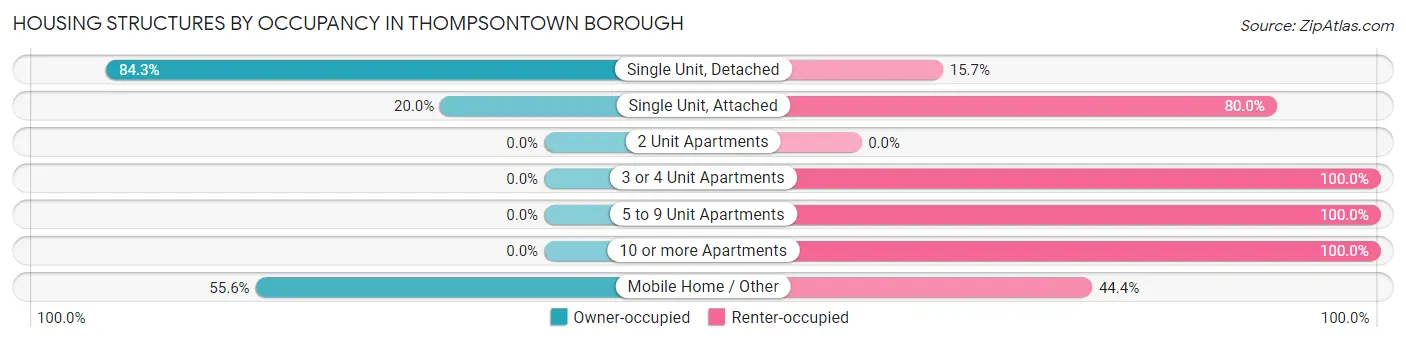
| Structure Type | Owner-occupied | Renter-occupied |
| Single Unit, Detached | 118 (84.3%) | 22 (15.7%) |
| Single Unit, Attached | 2 (20.0%) | 8 (80.0%) |
| 2 Unit Apartments | 0 (0.0%) | 0 (0.0%) |
| 3 or 4 Unit Apartments | 0 (0.0%) | 12 (100.0%) |
| 5 to 9 Unit Apartments | 0 (0.0%) | 48 (100.0%) |
| 10 or more Apartments | 0 (0.0%) | 75 (100.0%) |
| Mobile Home / Other | 20 (55.6%) | 16 (44.4%) |
| Total | 140 (43.6%) | 181 (56.4%) |
Housing Structures by Number of Rooms in Thompsontown borough
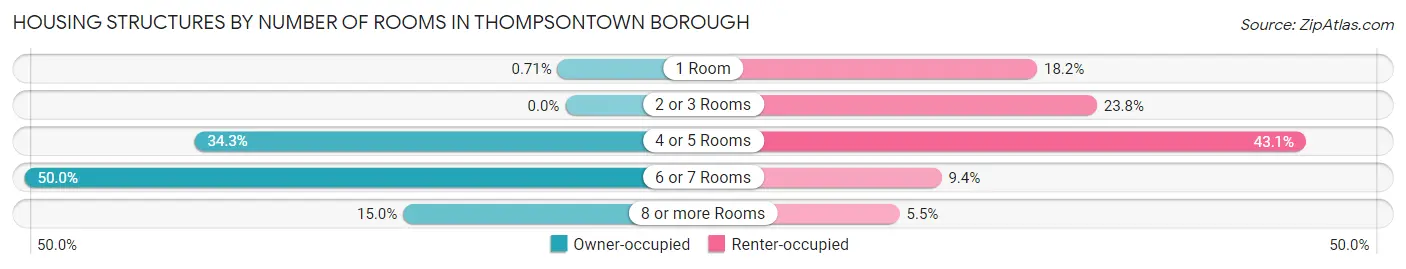
| Number of Rooms | Owner-occupied | Renter-occupied |
| 1 Room | 1 (0.7%) | 33 (18.2%) |
| 2 or 3 Rooms | 0 (0.0%) | 43 (23.8%) |
| 4 or 5 Rooms | 48 (34.3%) | 78 (43.1%) |
| 6 or 7 Rooms | 70 (50.0%) | 17 (9.4%) |
| 8 or more Rooms | 21 (15.0%) | 10 (5.5%) |
| Total | 140 (100.0%) | 181 (100.0%) |
Housing Structure by Heating Type in Thompsontown borough
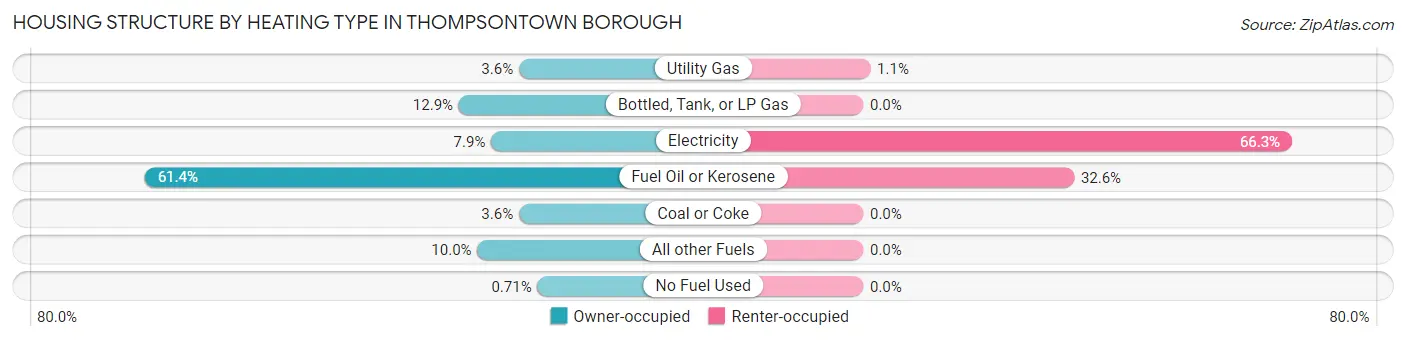
| Heating Type | Owner-occupied | Renter-occupied |
| Utility Gas | 5 (3.6%) | 2 (1.1%) |
| Bottled, Tank, or LP Gas | 18 (12.9%) | 0 (0.0%) |
| Electricity | 11 (7.9%) | 120 (66.3%) |
| Fuel Oil or Kerosene | 86 (61.4%) | 59 (32.6%) |
| Coal or Coke | 5 (3.6%) | 0 (0.0%) |
| All other Fuels | 14 (10.0%) | 0 (0.0%) |
| No Fuel Used | 1 (0.7%) | 0 (0.0%) |
| Total | 140 (100.0%) | 181 (100.0%) |
Household Vehicle Usage in Thompsontown borough
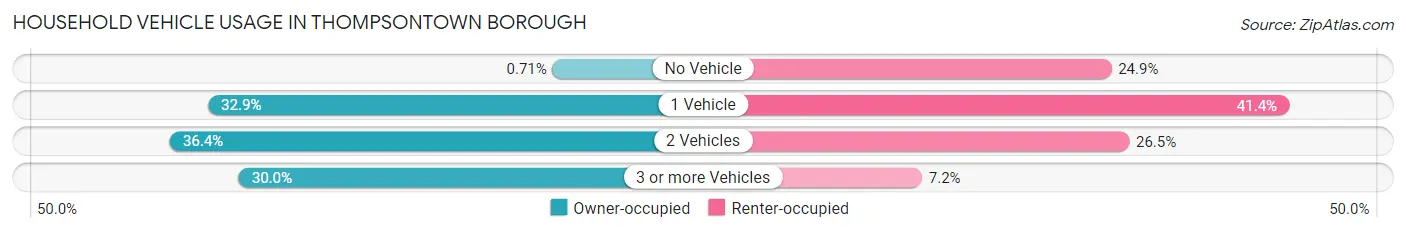
| Vehicles per Household | Owner-occupied | Renter-occupied |
| No Vehicle | 1 (0.7%) | 45 (24.9%) |
| 1 Vehicle | 46 (32.9%) | 75 (41.4%) |
| 2 Vehicles | 51 (36.4%) | 48 (26.5%) |
| 3 or more Vehicles | 42 (30.0%) | 13 (7.2%) |
| Total | 140 (100.0%) | 181 (100.0%) |
Real Estate & Mortgages in Thompsontown borough
Real Estate and Mortgage Overview in Thompsontown borough
| Characteristic | Without Mortgage | With Mortgage |
| Housing Units | 83 | 57 |
| Median Property Value | $132,500 | $157,100 |
| Median Household Income | $43,750 | $2 |
| Monthly Housing Costs | $484 | $0 |
| Real Estate Taxes | $1,500 | $0 |
Property Value by Mortgage Status in Thompsontown borough
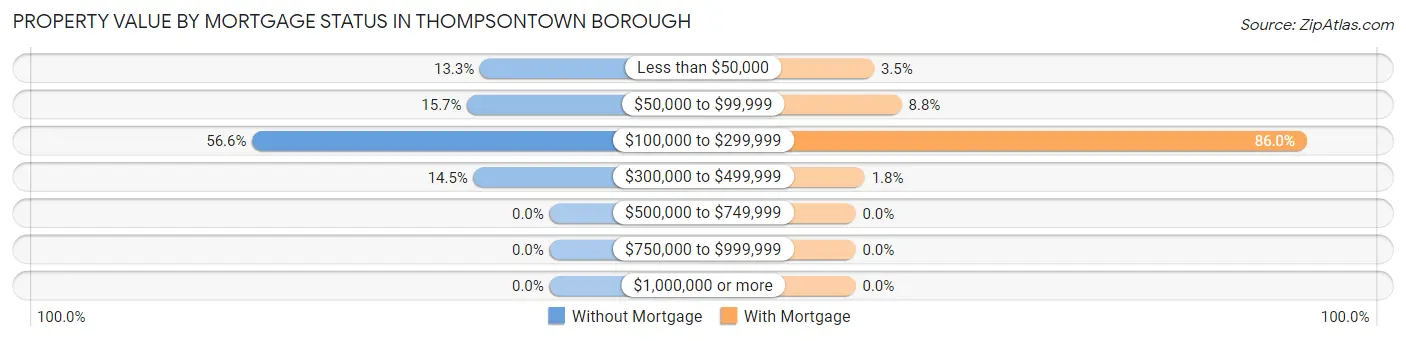
| Property Value | Without Mortgage | With Mortgage |
| Less than $50,000 | 11 (13.3%) | 2 (3.5%) |
| $50,000 to $99,999 | 13 (15.7%) | 5 (8.8%) |
| $100,000 to $299,999 | 47 (56.6%) | 49 (86.0%) |
| $300,000 to $499,999 | 12 (14.5%) | 1 (1.8%) |
| $500,000 to $749,999 | 0 (0.0%) | 0 (0.0%) |
| $750,000 to $999,999 | 0 (0.0%) | 0 (0.0%) |
| $1,000,000 or more | 0 (0.0%) | 0 (0.0%) |
| Total | 83 (100.0%) | 57 (100.0%) |
Household Income by Mortgage Status in Thompsontown borough
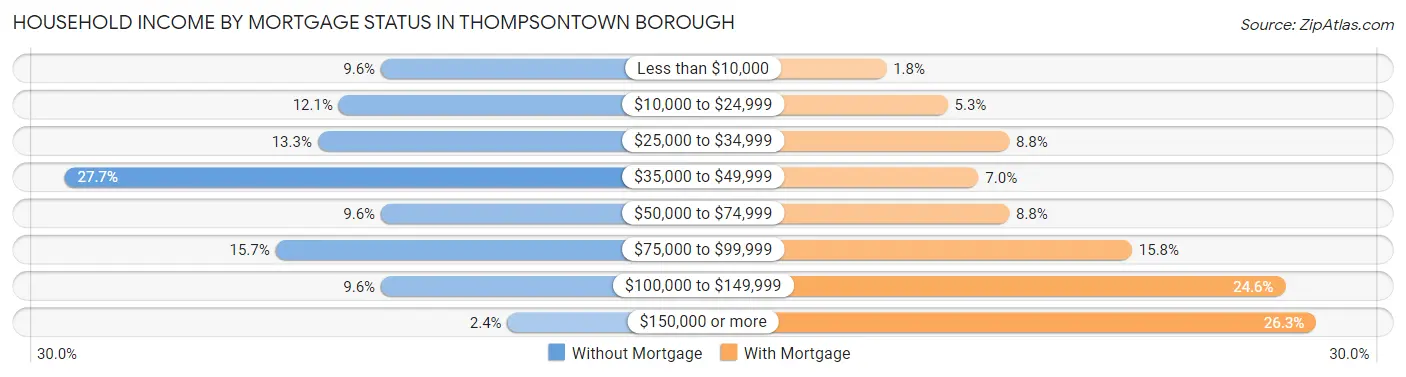
| Household Income | Without Mortgage | With Mortgage |
| Less than $10,000 | 8 (9.6%) | 1 (1.8%) |
| $10,000 to $24,999 | 10 (12.0%) | 3 (5.3%) |
| $25,000 to $34,999 | 11 (13.3%) | 5 (8.8%) |
| $35,000 to $49,999 | 23 (27.7%) | 4 (7.0%) |
| $50,000 to $74,999 | 8 (9.6%) | 5 (8.8%) |
| $75,000 to $99,999 | 13 (15.7%) | 9 (15.8%) |
| $100,000 to $149,999 | 8 (9.6%) | 14 (24.6%) |
| $150,000 or more | 2 (2.4%) | 15 (26.3%) |
| Total | 83 (100.0%) | 57 (100.0%) |
Property Value to Household Income Ratio in Thompsontown borough
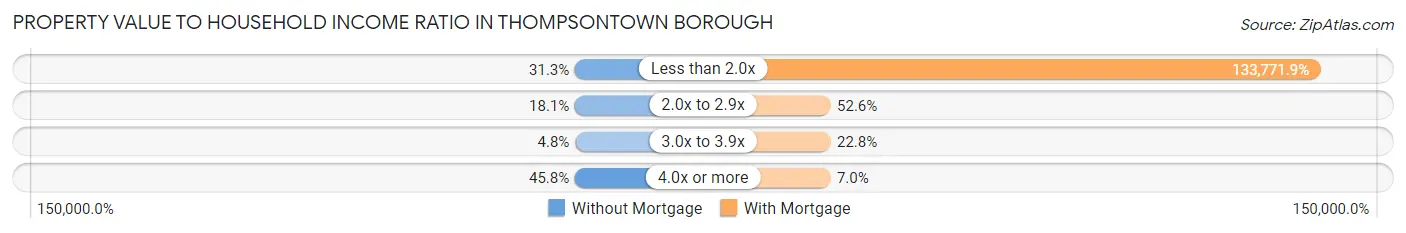
| Value-to-Income Ratio | Without Mortgage | With Mortgage |
| Less than 2.0x | 26 (31.3%) | 76,250 (133,771.9%) |
| 2.0x to 2.9x | 15 (18.1%) | 30 (52.6%) |
| 3.0x to 3.9x | 4 (4.8%) | 13 (22.8%) |
| 4.0x or more | 38 (45.8%) | 4 (7.0%) |
| Total | 83 (100.0%) | 57 (100.0%) |
Real Estate Taxes by Mortgage Status in Thompsontown borough
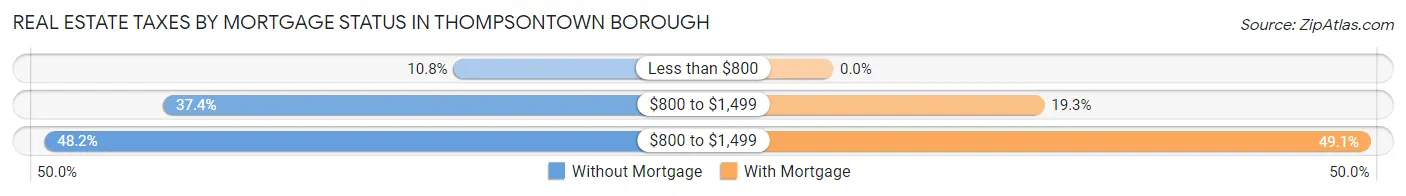
| Property Taxes | Without Mortgage | With Mortgage |
| Less than $800 | 9 (10.8%) | 0 (0.0%) |
| $800 to $1,499 | 31 (37.3%) | 11 (19.3%) |
| $800 to $1,499 | 40 (48.2%) | 28 (49.1%) |
| Total | 83 (100.0%) | 57 (100.0%) |
Health & Disability in Thompsontown borough
Health Insurance Coverage by Age in Thompsontown borough
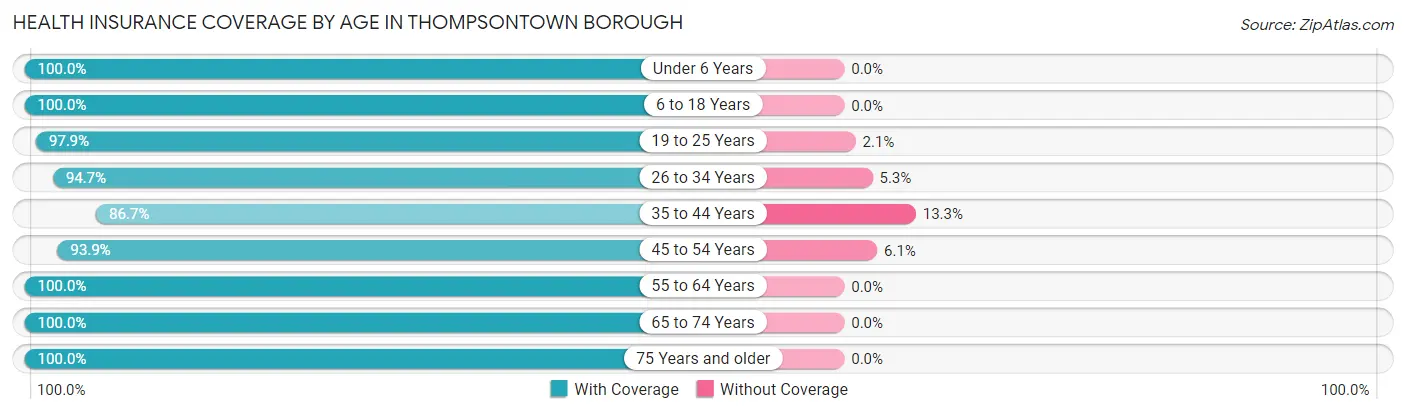
| Age Bracket | With Coverage | Without Coverage |
| Under 6 Years | 52 (100.0%) | 0 (0.0%) |
| 6 to 18 Years | 56 (100.0%) | 0 (0.0%) |
| 19 to 25 Years | 93 (97.9%) | 2 (2.1%) |
| 26 to 34 Years | 108 (94.7%) | 6 (5.3%) |
| 35 to 44 Years | 39 (86.7%) | 6 (13.3%) |
| 45 to 54 Years | 46 (93.9%) | 3 (6.1%) |
| 55 to 64 Years | 70 (100.0%) | 0 (0.0%) |
| 65 to 74 Years | 46 (100.0%) | 0 (0.0%) |
| 75 Years and older | 98 (100.0%) | 0 (0.0%) |
| Total | 608 (97.3%) | 17 (2.7%) |
Health Insurance Coverage by Citizenship Status in Thompsontown borough
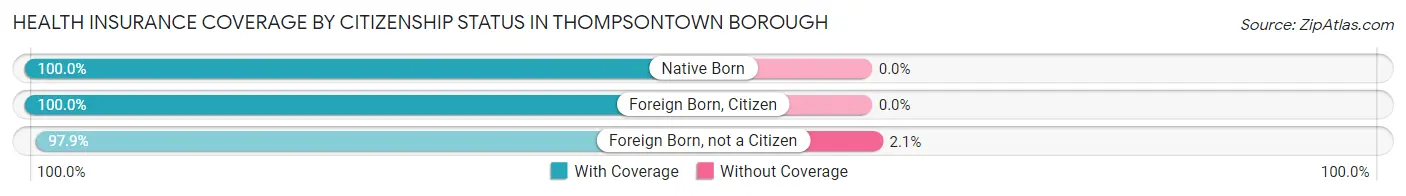
| Citizenship Status | With Coverage | Without Coverage |
| Native Born | 52 (100.0%) | 0 (0.0%) |
| Foreign Born, Citizen | 56 (100.0%) | 0 (0.0%) |
| Foreign Born, not a Citizen | 93 (97.9%) | 2 (2.1%) |
Health Insurance Coverage by Household Income in Thompsontown borough
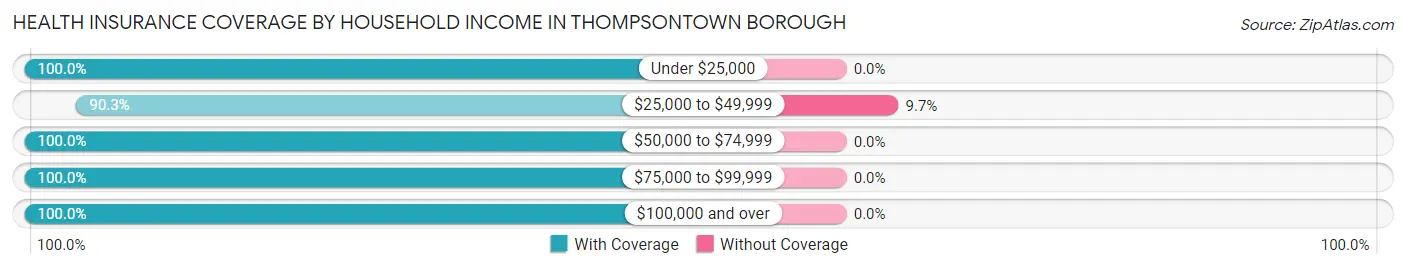
| Household Income | With Coverage | Without Coverage |
| Under $25,000 | 148 (100.0%) | 0 (0.0%) |
| $25,000 to $49,999 | 158 (90.3%) | 17 (9.7%) |
| $50,000 to $74,999 | 91 (100.0%) | 0 (0.0%) |
| $75,000 to $99,999 | 107 (100.0%) | 0 (0.0%) |
| $100,000 and over | 104 (100.0%) | 0 (0.0%) |
Public vs Private Health Insurance Coverage by Age in Thompsontown borough
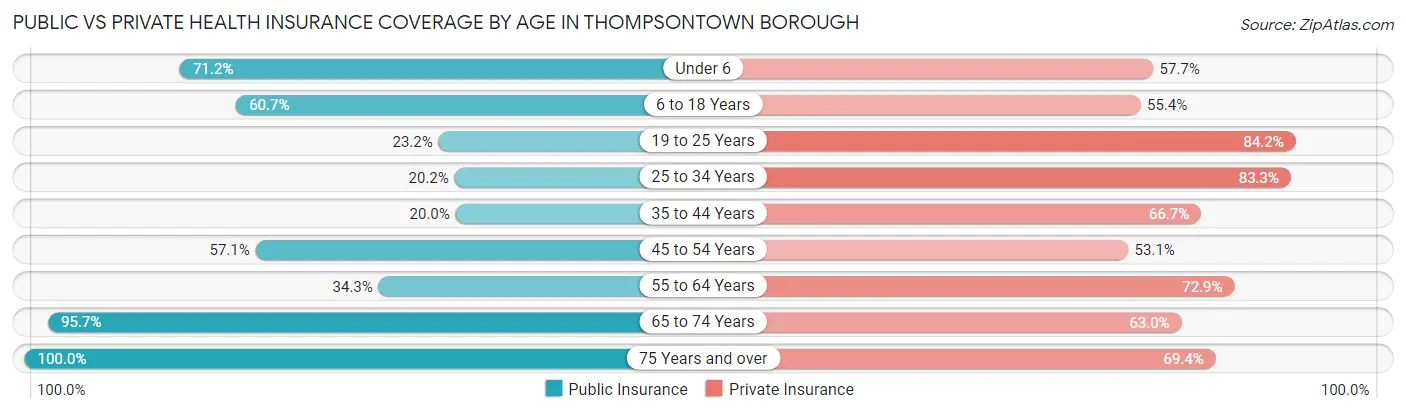
| Age Bracket | Public Insurance | Private Insurance |
| Under 6 | 37 (71.2%) | 30 (57.7%) |
| 6 to 18 Years | 34 (60.7%) | 31 (55.4%) |
| 19 to 25 Years | 22 (23.2%) | 80 (84.2%) |
| 25 to 34 Years | 23 (20.2%) | 95 (83.3%) |
| 35 to 44 Years | 9 (20.0%) | 30 (66.7%) |
| 45 to 54 Years | 28 (57.1%) | 26 (53.1%) |
| 55 to 64 Years | 24 (34.3%) | 51 (72.9%) |
| 65 to 74 Years | 44 (95.7%) | 29 (63.0%) |
| 75 Years and over | 98 (100.0%) | 68 (69.4%) |
| Total | 319 (51.0%) | 440 (70.4%) |
Disability Status by Sex by Age in Thompsontown borough
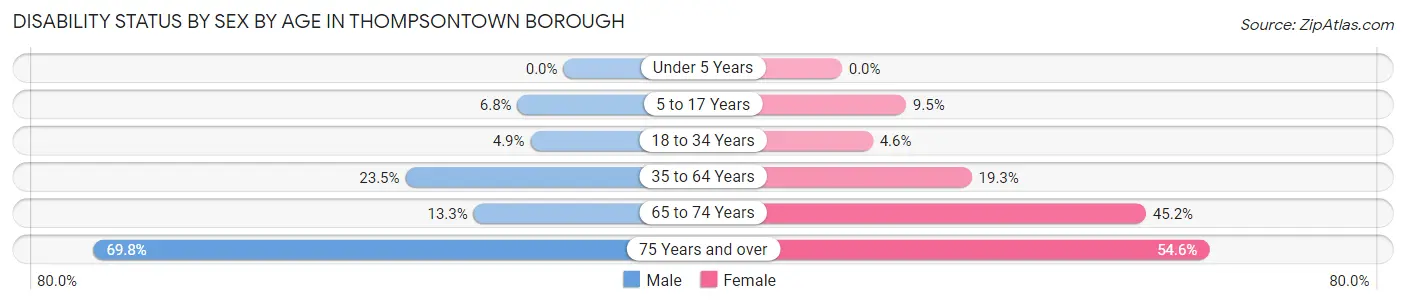
| Age Bracket | Male | Female |
| Under 5 Years | 0 (0.0%) | 0 (0.0%) |
| 5 to 17 Years | 3 (6.8%) | 2 (9.5%) |
| 18 to 34 Years | 5 (4.9%) | 5 (4.6%) |
| 35 to 64 Years | 19 (23.5%) | 16 (19.3%) |
| 65 to 74 Years | 2 (13.3%) | 14 (45.2%) |
| 75 Years and over | 30 (69.8%) | 30 (54.5%) |
Disability Class by Sex by Age in Thompsontown borough
Disability Class: Hearing Difficulty
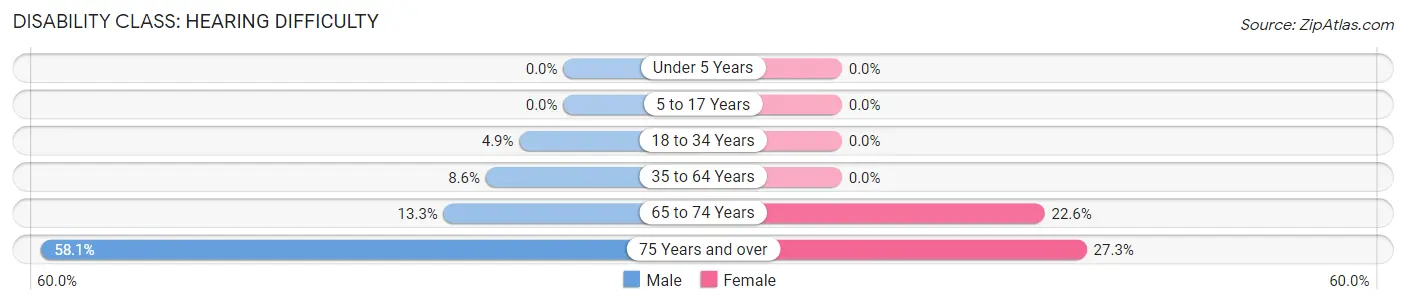
| Age Bracket | Male | Female |
| Under 5 Years | 0 (0.0%) | 0 (0.0%) |
| 5 to 17 Years | 0 (0.0%) | 0 (0.0%) |
| 18 to 34 Years | 5 (4.9%) | 0 (0.0%) |
| 35 to 64 Years | 7 (8.6%) | 0 (0.0%) |
| 65 to 74 Years | 2 (13.3%) | 7 (22.6%) |
| 75 Years and over | 25 (58.1%) | 15 (27.3%) |
Disability Class: Vision Difficulty
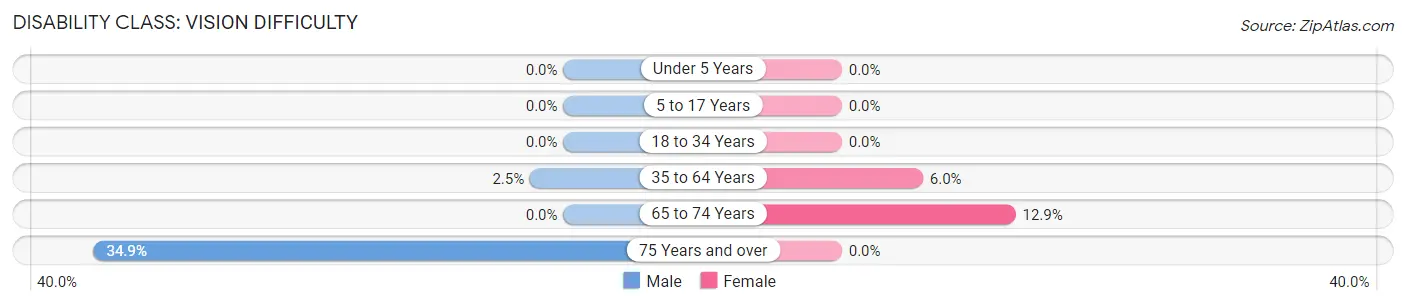
| Age Bracket | Male | Female |
| Under 5 Years | 0 (0.0%) | 0 (0.0%) |
| 5 to 17 Years | 0 (0.0%) | 0 (0.0%) |
| 18 to 34 Years | 0 (0.0%) | 0 (0.0%) |
| 35 to 64 Years | 2 (2.5%) | 5 (6.0%) |
| 65 to 74 Years | 0 (0.0%) | 4 (12.9%) |
| 75 Years and over | 15 (34.9%) | 0 (0.0%) |
Disability Class: Cognitive Difficulty
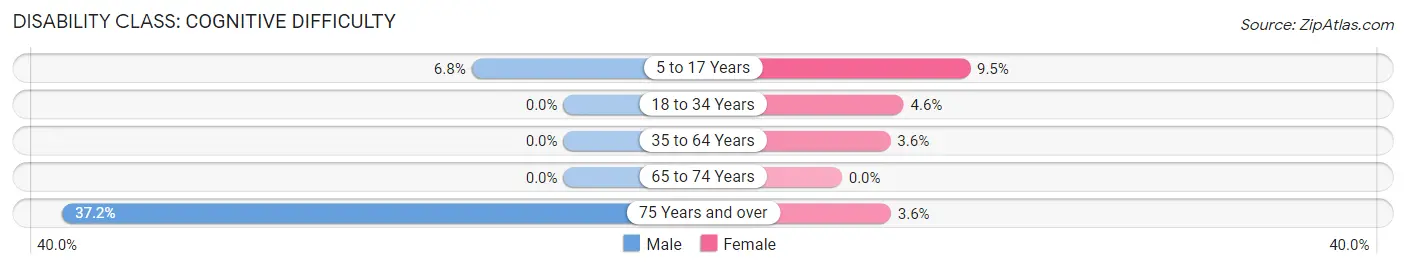
| Age Bracket | Male | Female |
| 5 to 17 Years | 3 (6.8%) | 2 (9.5%) |
| 18 to 34 Years | 0 (0.0%) | 5 (4.6%) |
| 35 to 64 Years | 0 (0.0%) | 3 (3.6%) |
| 65 to 74 Years | 0 (0.0%) | 0 (0.0%) |
| 75 Years and over | 16 (37.2%) | 2 (3.6%) |
Disability Class: Ambulatory Difficulty
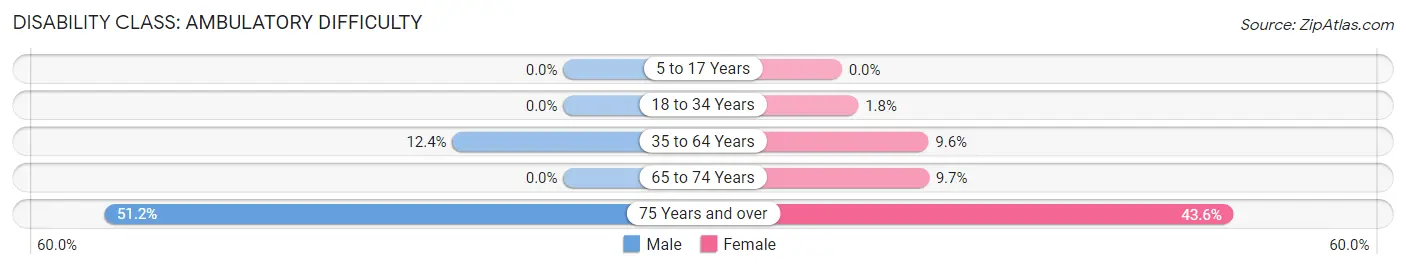
| Age Bracket | Male | Female |
| 5 to 17 Years | 0 (0.0%) | 0 (0.0%) |
| 18 to 34 Years | 0 (0.0%) | 2 (1.8%) |
| 35 to 64 Years | 10 (12.3%) | 8 (9.6%) |
| 65 to 74 Years | 0 (0.0%) | 3 (9.7%) |
| 75 Years and over | 22 (51.2%) | 24 (43.6%) |
Disability Class: Self-Care Difficulty
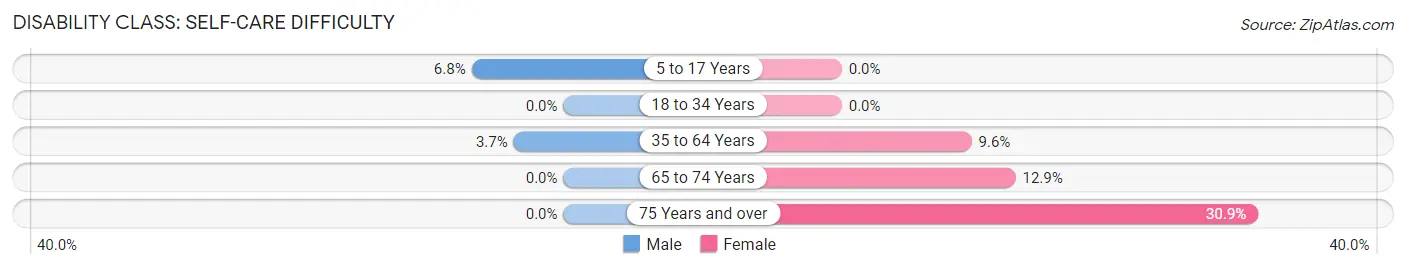
| Age Bracket | Male | Female |
| 5 to 17 Years | 3 (6.8%) | 0 (0.0%) |
| 18 to 34 Years | 0 (0.0%) | 0 (0.0%) |
| 35 to 64 Years | 3 (3.7%) | 8 (9.6%) |
| 65 to 74 Years | 0 (0.0%) | 4 (12.9%) |
| 75 Years and over | 0 (0.0%) | 17 (30.9%) |
Technology Access in Thompsontown borough
Computing Device Access in Thompsontown borough
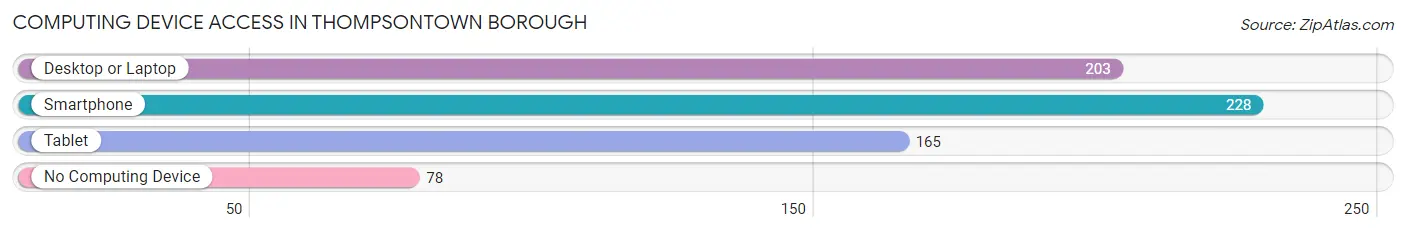
| Device Type | # Households | % Households |
| Desktop or Laptop | 203 | 63.2% |
| Smartphone | 228 | 71.0% |
| Tablet | 165 | 51.4% |
| No Computing Device | 78 | 24.3% |
| Total | 321 | 100.0% |
Internet Access in Thompsontown borough
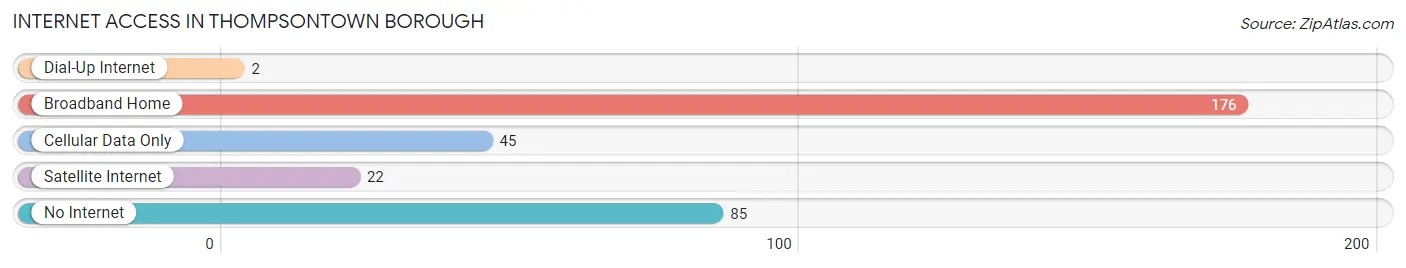
| Internet Type | # Households | % Households |
| Dial-Up Internet | 2 | 0.6% |
| Broadband Home | 176 | 54.8% |
| Cellular Data Only | 45 | 14.0% |
| Satellite Internet | 22 | 6.9% |
| No Internet | 85 | 26.5% |
| Total | 321 | 100.0% |
Thompsontown borough Summary
Thompsontown Borough is a small borough located in Juniata County, Pennsylvania. It is situated in the Susquehanna Valley, approximately 10 miles east of Lewistown. The borough was founded in 1817 and is home to approximately 1,000 people.
History
Thompsontown Borough was founded in 1817 by John Thompson, a Revolutionary War veteran. He purchased the land from the state of Pennsylvania and named it after himself. The town was originally a farming community, but it soon developed into a small industrial center. The first industry in the area was a sawmill, which was built in 1820. This was followed by a gristmill, a tannery, and a distillery.
In 1845, the Pennsylvania Railroad was built through Thompsontown, connecting it to the larger cities of Harrisburg and Philadelphia. This allowed the town to become a major shipping center for the region. The railroad also brought new businesses to the area, including a brickyard, a furniture factory, and a canning factory.
In the late 19th century, Thompsontown became a popular tourist destination. The town was known for its scenic beauty and its many outdoor activities, such as fishing, hunting, and camping. The town also had a number of hotels and inns, which attracted visitors from all over the country.
Geography
Thompsontown Borough is located in Juniata County, Pennsylvania. It is situated in the Susquehanna Valley, approximately 10 miles east of Lewistown. The borough is bordered by the Juniata River to the north and the Tuscarora Creek to the south. The borough covers an area of 1.2 square miles and has a population of approximately 1,000 people.
The terrain of Thompsontown is mostly flat, with some rolling hills. The borough is located in a temperate climate zone, with hot summers and cold winters. The average annual temperature is around 50 degrees Fahrenheit.
Economy
Thompsontown Borough has a diverse economy. The town is home to a number of small businesses, including a grocery store, a hardware store, a pharmacy, and a bank. The town also has a number of restaurants, bars, and other retail establishments.
The town is also home to a number of manufacturing companies, including a furniture factory, a canning factory, and a brickyard. The town is also home to a number of agricultural businesses, including dairy farms, poultry farms, and vegetable farms.
Demographics
As of the 2010 census, the population of Thompsontown Borough was 1,000 people. The racial makeup of the borough was 97.2% White, 0.7% African American, 0.2% Native American, 0.2% Asian, and 1.7% from other races. The median household income was $37,500, and the median family income was $45,000.
The town is served by the Juniata County School District. The district has one elementary school, one middle school, and one high school. The town also has a number of private schools, including a Catholic school and a Lutheran school.
Conclusion
Thompsontown Borough is a small borough located in Juniata County, Pennsylvania. It was founded in 1817 and is home to approximately 1,000 people. The town has a diverse economy, with a number of small businesses, manufacturing companies, and agricultural businesses. The town is served by the Juniata County School District and has a number of private schools. The town is known for its scenic beauty and its many outdoor activities, making it a popular tourist destination.
Common Questions
What is Per Capita Income in Thompsontown borough?
Per Capita income in Thompsontown borough is $25,162.
What is the Median Family Income in Thompsontown borough?
Median Family Income in Thompsontown borough is $66,250.
What is the Median Household income in Thompsontown borough?
Median Household Income in Thompsontown borough is $39,375.
What is Income or Wage Gap in Thompsontown borough?
Income or Wage Gap in Thompsontown borough is 34.4%.
Women in Thompsontown borough earn 65.6 cents for every dollar earned by a man.
What is Inequality or Gini Index in Thompsontown borough?
Inequality or Gini Index in Thompsontown borough is 0.41.
What is the Total Population of Thompsontown borough?
Total Population of Thompsontown borough is 625.
What is the Total Male Population of Thompsontown borough?
Total Male Population of Thompsontown borough is 316.
What is the Total Female Population of Thompsontown borough?
Total Female Population of Thompsontown borough is 309.
What is the Ratio of Males per 100 Females in Thompsontown borough?
There are 102.27 Males per 100 Females in Thompsontown borough.
What is the Ratio of Females per 100 Males in Thompsontown borough?
There are 97.78 Females per 100 Males in Thompsontown borough.
What is the Median Population Age in Thompsontown borough?
Median Population Age in Thompsontown borough is 34.7 Years.
What is the Average Family Size in Thompsontown borough
Average Family Size in Thompsontown borough is 2.6 People.
What is the Average Household Size in Thompsontown borough
Average Household Size in Thompsontown borough is 1.9 People.
How Large is the Labor Force in Thompsontown borough?
There are 289 People in the Labor Forcein in Thompsontown borough.
What is the Percentage of People in the Labor Force in Thompsontown borough?
53.8% of People are in the Labor Force in Thompsontown borough.
What is the Unemployment Rate in Thompsontown borough?
Unemployment Rate in Thompsontown borough is 2.4%.