Cities with the Highest Percentage of Population with a Degree in Business in Ohio
RELATED REPORTS & OPTIONS
Business
Ohio
Compare Cities
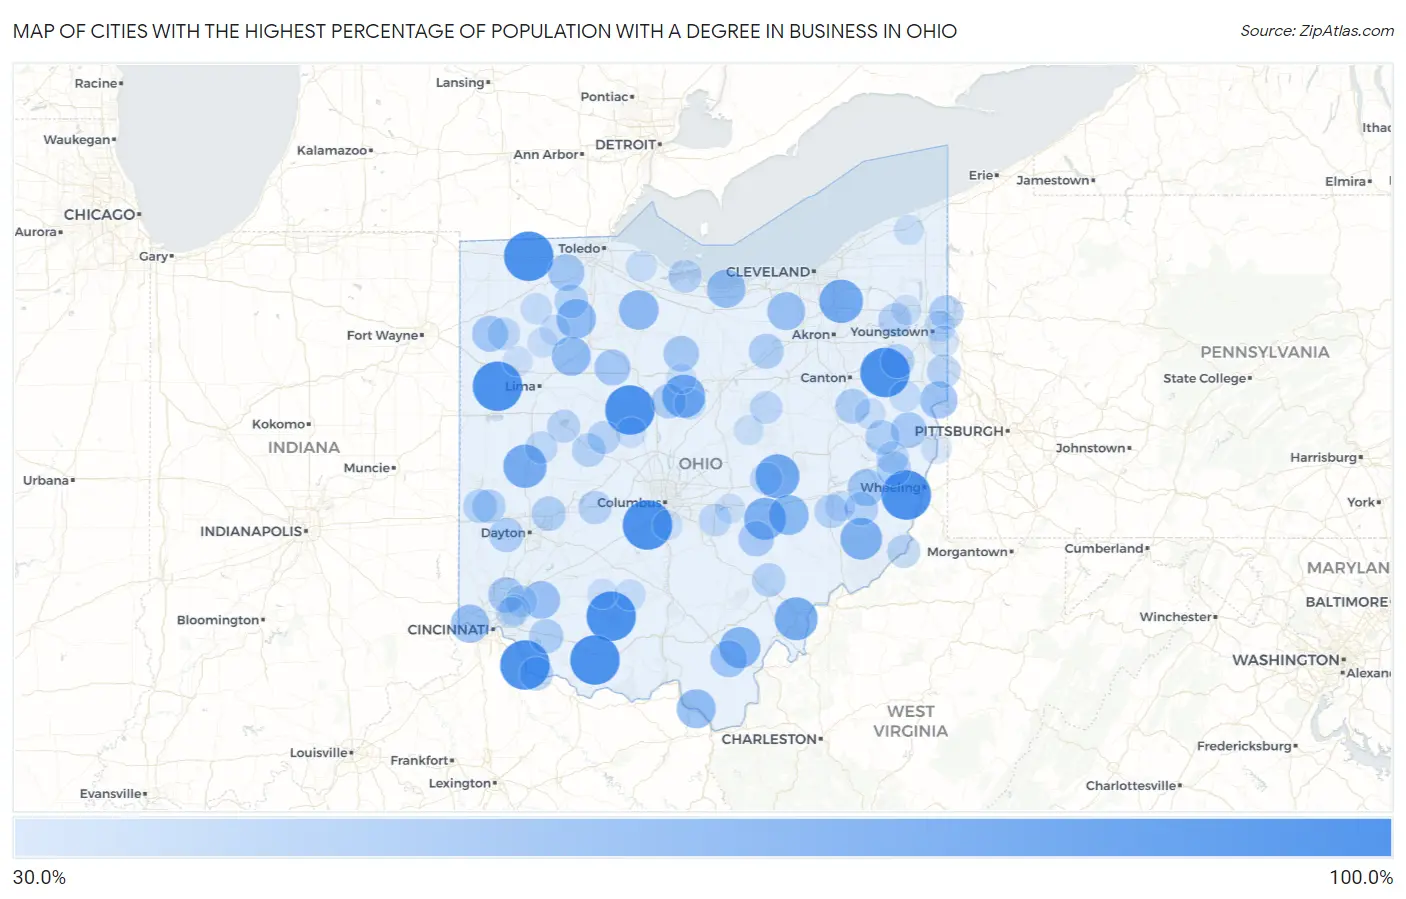
Map of Cities with the Highest Percentage of Population with a Degree in Business in Ohio
0.0%
100.0%
Cities with the Highest Percentage of Population with a Degree in Business in Ohio
| City | % Graduates | vs State | vs National | |
| 1. | Highland Holiday | 100.0% | 20.5%(+79.5)#1 | 19.5%(+80.5)#8 |
| 2. | Homeworth | 100.0% | 20.5%(+79.5)#2 | 19.5%(+80.5)#18 |
| 3. | New Bloomington | 100.0% | 20.5%(+79.5)#3 | 19.5%(+80.5)#47 |
| 4. | Pekin | 100.0% | 20.5%(+79.5)#4 | 19.5%(+80.5)#49 |
| 5. | Nashport | 100.0% | 20.5%(+79.5)#5 | 19.5%(+80.5)#60 |
| 6. | Tedrow | 100.0% | 20.5%(+79.5)#6 | 19.5%(+80.5)#70 |
| 7. | Orient | 100.0% | 20.5%(+79.5)#7 | 19.5%(+80.5)#96 |
| 8. | Moscow | 100.0% | 20.5%(+79.5)#8 | 19.5%(+80.5)#131 |
| 9. | Glencoe | 100.0% | 20.5%(+79.5)#9 | 19.5%(+80.5)#171 |
| 10. | Elgin | 100.0% | 20.5%(+79.5)#10 | 19.5%(+80.5)#175 |
| 11. | Cherry Fork | 100.0% | 20.5%(+79.5)#11 | 19.5%(+80.5)#255 |
| 12. | Trinway | 82.1% | 20.5%(+61.6)#12 | 19.5%(+62.6)#333 |
| 13. | Twinsburg Heights | 80.9% | 20.5%(+60.4)#13 | 19.5%(+61.4)#340 |
| 14. | Lockington | 80.0% | 20.5%(+59.5)#14 | 19.5%(+60.5)#349 |
| 15. | Iberia | 79.2% | 20.5%(+58.6)#15 | 19.5%(+59.7)#363 |
| 16. | Tuppers Plains | 78.7% | 20.5%(+58.2)#16 | 19.5%(+59.2)#370 |
| 17. | East Fultonham | 75.9% | 20.5%(+55.3)#17 | 19.5%(+56.4)#402 |
| 18. | Stafford | 75.0% | 20.5%(+54.5)#18 | 19.5%(+55.5)#417 |
| 19. | Vinton | 72.7% | 20.5%(+52.2)#19 | 19.5%(+53.2)#443 |
| 20. | Duncan Falls | 69.2% | 20.5%(+48.7)#20 | 19.5%(+49.7)#485 |
| 21. | Bettsville | 68.3% | 20.5%(+47.8)#21 | 19.5%(+48.8)#497 |
| 22. | Hoytville | 67.7% | 20.5%(+47.2)#22 | 19.5%(+48.2)#503 |
| 23. | Mount Cory | 66.7% | 20.5%(+46.1)#23 | 19.5%(+47.2)#516 |
| 24. | Hanging Rock | 66.7% | 20.5%(+46.1)#24 | 19.5%(+47.2)#536 |
| 25. | Mitiwanga | 64.8% | 20.5%(+44.3)#25 | 19.5%(+45.3)#582 |
| 26. | Addyston | 63.8% | 20.5%(+43.3)#26 | 19.5%(+44.3)#598 |
| 27. | Valley City | 63.0% | 20.5%(+42.5)#27 | 19.5%(+43.5)#614 |
| 28. | Butlerville | 62.5% | 20.5%(+42.0)#28 | 19.5%(+43.0)#624 |
| 29. | La Croft | 61.3% | 20.5%(+40.8)#29 | 19.5%(+41.8)#654 |
| 30. | Centerville Thurman | 60.0% | 20.5%(+39.5)#30 | 19.5%(+40.5)#688 |
| 31. | Fairview | 60.0% | 20.5%(+39.5)#31 | 19.5%(+40.5)#689 |
| 32. | Neapolis | 58.8% | 20.5%(+38.3)#32 | 19.5%(+39.3)#712 |
| 33. | Roseland | 57.9% | 20.5%(+37.4)#33 | 19.5%(+38.4)#740 |
| 34. | Wharton | 57.1% | 20.5%(+36.6)#34 | 19.5%(+37.6)#756 |
| 35. | Broughton | 57.1% | 20.5%(+36.6)#35 | 19.5%(+37.6)#766 |
| 36. | New Washington | 56.5% | 20.5%(+36.0)#36 | 19.5%(+37.0)#783 |
| 37. | Olde West Chester | 56.2% | 20.5%(+35.7)#37 | 19.5%(+36.8)#792 |
| 38. | East Springfield | 55.9% | 20.5%(+35.4)#38 | 19.5%(+36.4)#801 |
| 39. | New Lexington | 55.3% | 20.5%(+34.7)#39 | 19.5%(+35.8)#828 |
| 40. | Gomer | 54.3% | 20.5%(+33.8)#40 | 19.5%(+34.8)#855 |
| 41. | Woodworth | 54.3% | 20.5%(+33.8)#41 | 19.5%(+34.8)#856 |
| 42. | Kingsville | 54.2% | 20.5%(+33.7)#42 | 19.5%(+34.7)#857 |
| 43. | West Salem | 53.8% | 20.5%(+33.3)#43 | 19.5%(+34.3)#867 |
| 44. | Mineral City | 53.3% | 20.5%(+32.8)#44 | 19.5%(+33.8)#889 |
| 45. | Lawrenceville | 53.3% | 20.5%(+32.8)#45 | 19.5%(+33.8)#891 |
| 46. | Caledonia | 52.9% | 20.5%(+32.4)#46 | 19.5%(+33.4)#905 |
| 47. | New Athens | 52.4% | 20.5%(+31.9)#47 | 19.5%(+32.9)#937 |
| 48. | West Hill | 52.3% | 20.5%(+31.8)#48 | 19.5%(+32.8)#939 |
| 49. | Bass Lake | 52.2% | 20.5%(+31.7)#49 | 19.5%(+32.7)#942 |
| 50. | Scio | 52.2% | 20.5%(+31.7)#50 | 19.5%(+32.7)#944 |
| 51. | Crystal Lakes | 52.1% | 20.5%(+31.6)#51 | 19.5%(+32.6)#946 |
| 52. | Williamsburg | 52.1% | 20.5%(+31.6)#52 | 19.5%(+32.6)#947 |
| 53. | New Lebanon | 52.1% | 20.5%(+31.5)#53 | 19.5%(+32.6)#949 |
| 54. | Damascus | 51.0% | 20.5%(+30.5)#54 | 19.5%(+31.5)#979 |
| 55. | Pleasant City | 50.0% | 20.5%(+29.5)#55 | 19.5%(+30.5)#1,013 |
| 56. | Millfield | 50.0% | 20.5%(+29.5)#56 | 19.5%(+30.5)#1,042 |
| 57. | Milton Center | 50.0% | 20.5%(+29.5)#57 | 19.5%(+30.5)#1,065 |
| 58. | Valley Hi | 50.0% | 20.5%(+29.5)#58 | 19.5%(+30.5)#1,077 |
| 59. | Castine | 50.0% | 20.5%(+29.5)#59 | 19.5%(+30.5)#1,092 |
| 60. | Ithaca | 50.0% | 20.5%(+29.5)#60 | 19.5%(+30.5)#1,096 |
| 61. | Batesville | 50.0% | 20.5%(+29.5)#61 | 19.5%(+30.5)#1,124 |
| 62. | Chilo | 50.0% | 20.5%(+29.5)#62 | 19.5%(+30.5)#1,154 |
| 63. | East Palestine | 49.4% | 20.5%(+28.9)#63 | 19.5%(+29.9)#1,168 |
| 64. | South Canal | 49.4% | 20.5%(+28.9)#64 | 19.5%(+29.9)#1,170 |
| 65. | South Vienna | 49.3% | 20.5%(+28.7)#65 | 19.5%(+29.8)#1,174 |
| 66. | Russells Point | 48.5% | 20.5%(+28.0)#66 | 19.5%(+29.0)#1,196 |
| 67. | Bay View | 48.4% | 20.5%(+27.9)#67 | 19.5%(+28.9)#1,199 |
| 68. | West Mansfield | 48.3% | 20.5%(+27.8)#68 | 19.5%(+28.8)#1,206 |
| 69. | Sardis | 47.9% | 20.5%(+27.4)#69 | 19.5%(+28.4)#1,221 |
| 70. | Thurston | 46.7% | 20.5%(+26.1)#70 | 19.5%(+27.2)#1,290 |
| 71. | Melrose | 46.7% | 20.5%(+26.1)#71 | 19.5%(+27.2)#1,292 |
| 72. | Nashville | 46.7% | 20.5%(+26.1)#72 | 19.5%(+27.2)#1,294 |
| 73. | Cadiz | 46.6% | 20.5%(+26.0)#73 | 19.5%(+27.1)#1,302 |
| 74. | Jersey | 46.6% | 20.5%(+26.0)#74 | 19.5%(+27.1)#1,305 |
| 75. | Frazeysburg | 46.4% | 20.5%(+25.9)#75 | 19.5%(+26.9)#1,311 |
| 76. | Port Jefferson | 46.2% | 20.5%(+25.6)#76 | 19.5%(+26.7)#1,323 |
| 77. | Loveland Park | 44.8% | 20.5%(+24.3)#77 | 19.5%(+25.3)#1,413 |
| 78. | Candlewood Lake | 43.6% | 20.5%(+23.1)#78 | 19.5%(+24.1)#1,489 |
| 79. | Holgate | 43.0% | 20.5%(+22.5)#79 | 19.5%(+23.5)#1,519 |
| 80. | Maplewood Park | 42.9% | 20.5%(+22.3)#80 | 19.5%(+23.4)#1,542 |
| 81. | Summitville | 42.9% | 20.5%(+22.3)#81 | 19.5%(+23.4)#1,544 |
| 82. | Remington | 42.6% | 20.5%(+22.0)#82 | 19.5%(+23.1)#1,583 |
| 83. | Lowellville | 42.5% | 20.5%(+22.0)#83 | 19.5%(+23.0)#1,588 |
| 84. | South Salem | 42.4% | 20.5%(+21.9)#84 | 19.5%(+22.9)#1,596 |
| 85. | Concorde Hills | 42.0% | 20.5%(+21.5)#85 | 19.5%(+22.5)#1,624 |
| 86. | Dellroy | 41.7% | 20.5%(+21.1)#86 | 19.5%(+22.2)#1,655 |
| 87. | Rocky Ridge | 41.2% | 20.5%(+20.7)#87 | 19.5%(+21.7)#1,695 |
| 88. | Leipsic | 40.9% | 20.5%(+20.4)#88 | 19.5%(+21.4)#1,713 |
| 89. | Senecaville | 40.9% | 20.5%(+20.4)#89 | 19.5%(+21.4)#1,715 |
| 90. | Mingo Junction | 40.6% | 20.5%(+20.0)#90 | 19.5%(+21.1)#1,740 |
| 91. | Richwood | 40.3% | 20.5%(+19.7)#91 | 19.5%(+20.8)#1,776 |
| 92. | Leesburg | 40.2% | 20.5%(+19.6)#92 | 19.5%(+20.7)#1,782 |
| 93. | Leavittsburg | 40.0% | 20.5%(+19.5)#93 | 19.5%(+20.5)#1,791 |
| 94. | Danville | 40.0% | 20.5%(+19.5)#94 | 19.5%(+20.5)#1,800 |
| 95. | North Robinson | 40.0% | 20.5%(+19.5)#95 | 19.5%(+20.5)#1,818 |
| 96. | Lockbourne | 40.0% | 20.5%(+19.5)#96 | 19.5%(+20.5)#1,823 |
| 97. | Austinburg | 39.8% | 20.5%(+19.3)#97 | 19.5%(+20.4)#1,892 |
| 98. | Glandorf | 39.8% | 20.5%(+19.3)#98 | 19.5%(+20.3)#1,893 |
| 99. | Fort Jennings | 39.3% | 20.5%(+18.8)#99 | 19.5%(+19.8)#1,950 |
| 100. | Thornport | 39.3% | 20.5%(+18.7)#100 | 19.5%(+19.8)#1,955 |
Common Questions
What are the Top 10 Cities with the Highest Percentage of Population with a Degree in Business in Ohio?
Top 10 Cities with the Highest Percentage of Population with a Degree in Business in Ohio are:
#1
100.0%
#2
100.0%
#3
100.0%
#4
100.0%
#5
100.0%
#6
100.0%
#7
100.0%
#8
100.0%
#9
100.0%
#10
82.1%
What city has the Highest Percentage of Population with a Degree in Business in Ohio?
Highland Holiday has the Highest Percentage of Population with a Degree in Business in Ohio with 100.0%.
What is the Percentage of Population with a Degree in Business in the State of Ohio?
Percentage of Population with a Degree in Business in Ohio is 20.5%.
What is the Percentage of Population with a Degree in Business in the United States?
Percentage of Population with a Degree in Business in the United States is 19.5%.