Cities with the Most Immigrants from Spain in Ohio
RELATED REPORTS & OPTIONS
Spain
Ohio
Compare Cities
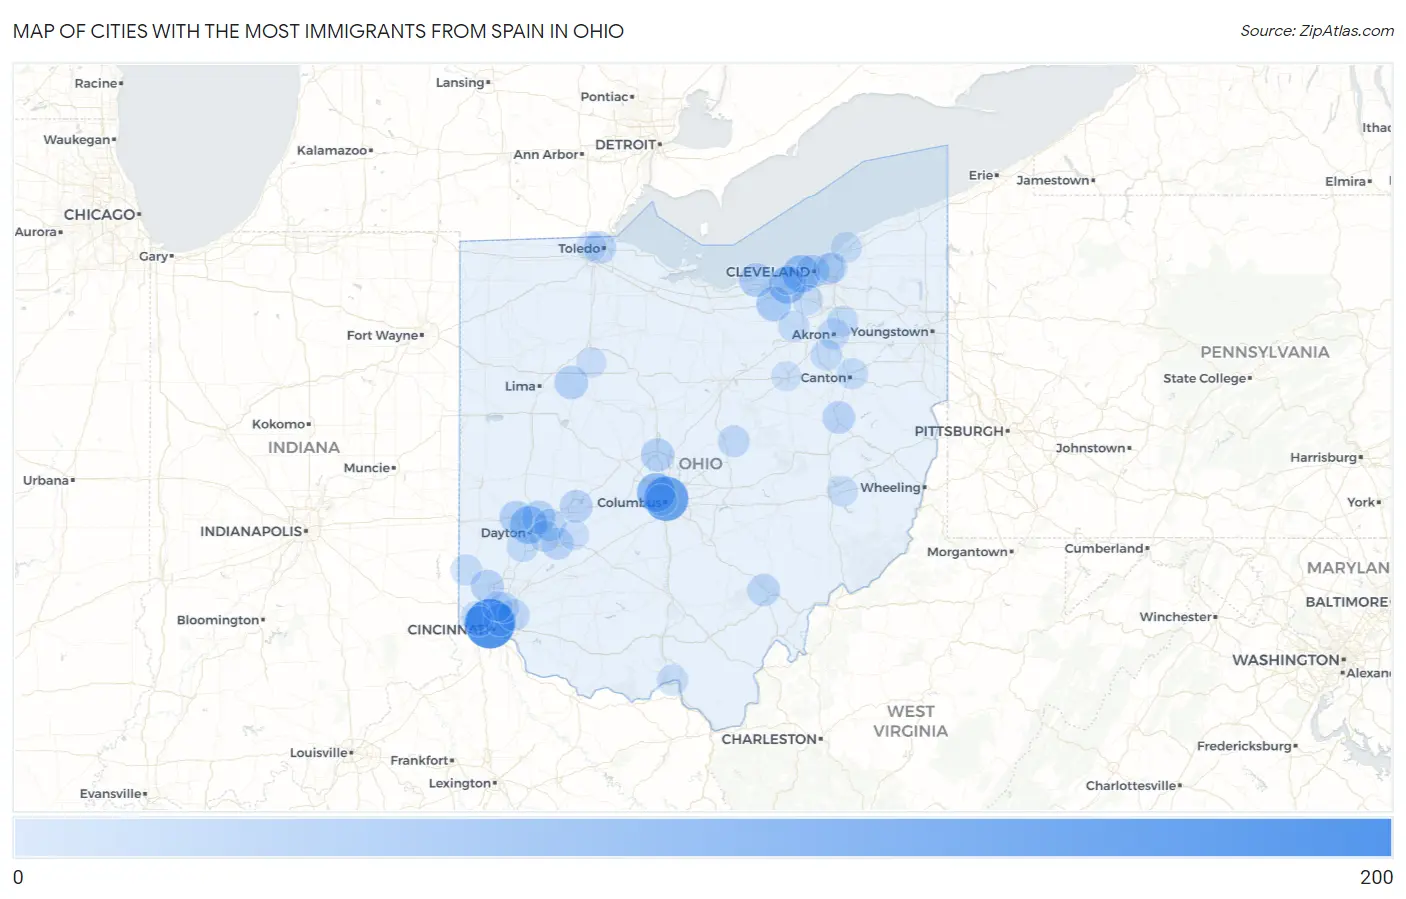
Map of Cities with the Most Immigrants from Spain in Ohio
0
200
Cities with the Most Immigrants from Spain in Ohio
| City | Spain | vs State | vs National | |
| 1. | Cincinnati | 192 | 1,486(12.92%)#1 | 120,953(0.16%)#76 |
| 2. | Columbus | 140 | 1,486(9.42%)#2 | 120,953(0.12%)#135 |
| 3. | Upper Arlington | 84 | 1,486(5.65%)#3 | 120,953(0.07%)#255 |
| 4. | Dayton | 71 | 1,486(4.78%)#4 | 120,953(0.06%)#287 |
| 5. | Lakewood | 71 | 1,486(4.78%)#5 | 120,953(0.06%)#290 |
| 6. | North Olmsted | 67 | 1,486(4.51%)#6 | 120,953(0.06%)#306 |
| 7. | Grafton | 47 | 1,486(3.16%)#7 | 120,953(0.04%)#447 |
| 8. | Lorain | 37 | 1,486(2.49%)#8 | 120,953(0.03%)#544 |
| 9. | Huber Heights | 33 | 1,486(2.22%)#9 | 120,953(0.03%)#614 |
| 10. | Englewood | 33 | 1,486(2.22%)#10 | 120,953(0.03%)#619 |
| 11. | Ada | 33 | 1,486(2.22%)#11 | 120,953(0.03%)#621 |
| 12. | Delaware | 31 | 1,486(2.09%)#12 | 120,953(0.03%)#647 |
| 13. | Cleveland | 28 | 1,486(1.88%)#13 | 120,953(0.02%)#690 |
| 14. | Hamilton | 28 | 1,486(1.88%)#14 | 120,953(0.02%)#694 |
| 15. | Springfield | 26 | 1,486(1.75%)#15 | 120,953(0.02%)#746 |
| 16. | Dover | 24 | 1,486(1.62%)#16 | 120,953(0.02%)#804 |
| 17. | Norwood | 23 | 1,486(1.55%)#17 | 120,953(0.02%)#837 |
| 18. | The Plains | 22 | 1,486(1.48%)#18 | 120,953(0.02%)#878 |
| 19. | Toledo | 20 | 1,486(1.35%)#19 | 120,953(0.02%)#925 |
| 20. | Fairborn | 19 | 1,486(1.28%)#20 | 120,953(0.02%)#965 |
| 21. | Xenia | 18 | 1,486(1.21%)#21 | 120,953(0.01%)#1,003 |
| 22. | Gambier | 17 | 1,486(1.14%)#22 | 120,953(0.01%)#1,054 |
| 23. | The Village Of Indian Hill | 16 | 1,486(1.08%)#23 | 120,953(0.01%)#1,086 |
| 24. | Cleveland Heights | 15 | 1,486(1.01%)#24 | 120,953(0.01%)#1,103 |
| 25. | Grandview Heights | 15 | 1,486(1.01%)#25 | 120,953(0.01%)#1,124 |
| 26. | Beavercreek | 14 | 1,486(0.94%)#26 | 120,953(0.01%)#1,157 |
| 27. | West Carrollton | 14 | 1,486(0.94%)#27 | 120,953(0.01%)#1,174 |
| 28. | Akron | 13 | 1,486(0.87%)#28 | 120,953(0.01%)#1,195 |
| 29. | New Franklin | 13 | 1,486(0.87%)#29 | 120,953(0.01%)#1,221 |
| 30. | Medina | 11 | 1,486(0.74%)#30 | 120,953(0.01%)#1,311 |
| 31. | Oxford | 10 | 1,486(0.67%)#31 | 120,953(0.01%)#1,372 |
| 32. | Portsmouth | 10 | 1,486(0.67%)#32 | 120,953(0.01%)#1,378 |
| 33. | Evendale | 10 | 1,486(0.67%)#33 | 120,953(0.01%)#1,405 |
| 34. | Canton | 9 | 1,486(0.61%)#34 | 120,953(0.01%)#1,416 |
| 35. | Willoughby | 9 | 1,486(0.61%)#35 | 120,953(0.01%)#1,438 |
| 36. | Stow | 8 | 1,486(0.54%)#36 | 120,953(0.01%)#1,490 |
| 37. | Old Washington | 7 | 1,486(0.47%)#37 | 120,953(0.01%)#1,597 |
| 38. | North Royalton | 6 | 1,486(0.40%)#38 | 120,953(0.00%)#1,615 |
| 39. | Dent | 5 | 1,486(0.34%)#39 | 120,953(0.00%)#1,674 |
| 40. | South Euclid | 4 | 1,486(0.27%)#40 | 120,953(0.00%)#1,718 |
| 41. | Bridgetown | 4 | 1,486(0.27%)#41 | 120,953(0.00%)#1,723 |
| 42. | Woodlawn | 4 | 1,486(0.27%)#42 | 120,953(0.00%)#1,738 |
| 43. | Arlington | 4 | 1,486(0.27%)#43 | 120,953(0.00%)#1,750 |
| 44. | Cedarville | 3 | 1,486(0.20%)#44 | 120,953(0.00%)#1,786 |
| 45. | Westlake | 1 | 1,486(0.07%)#45 | 120,953(0.00%)#1,887 |
| 46. | Wooster | 1 | 1,486(0.07%)#46 | 120,953(0.00%)#1,891 |
| 47. | Ottawa Hills | 1 | 1,486(0.07%)#47 | 120,953(0.00%)#1,909 |
Common Questions
What are the Top 10 Cities with the Most Immigrants from Spain in Ohio?
Top 10 Cities with the Most Immigrants from Spain in Ohio are:
#1
192
#2
140
#3
84
#4
71
#5
71
#6
67
#7
47
#8
37
#9
33
#10
33
What city has the Most Immigrants from Spain in Ohio?
Cincinnati has the Most Immigrants from Spain in Ohio with 192.
What is the Total Immigrants from Spain in the State of Ohio?
Total Immigrants from Spain in Ohio is 1,486.
What is the Total Immigrants from Spain in the United States?
Total Immigrants from Spain in the United States is 120,953.