Cities with the Highest Percentage of Population with a Degree in Multidisciplinary Studies in Ohio
RELATED REPORTS & OPTIONS
Multidisciplinary Studies
Ohio
Compare Cities
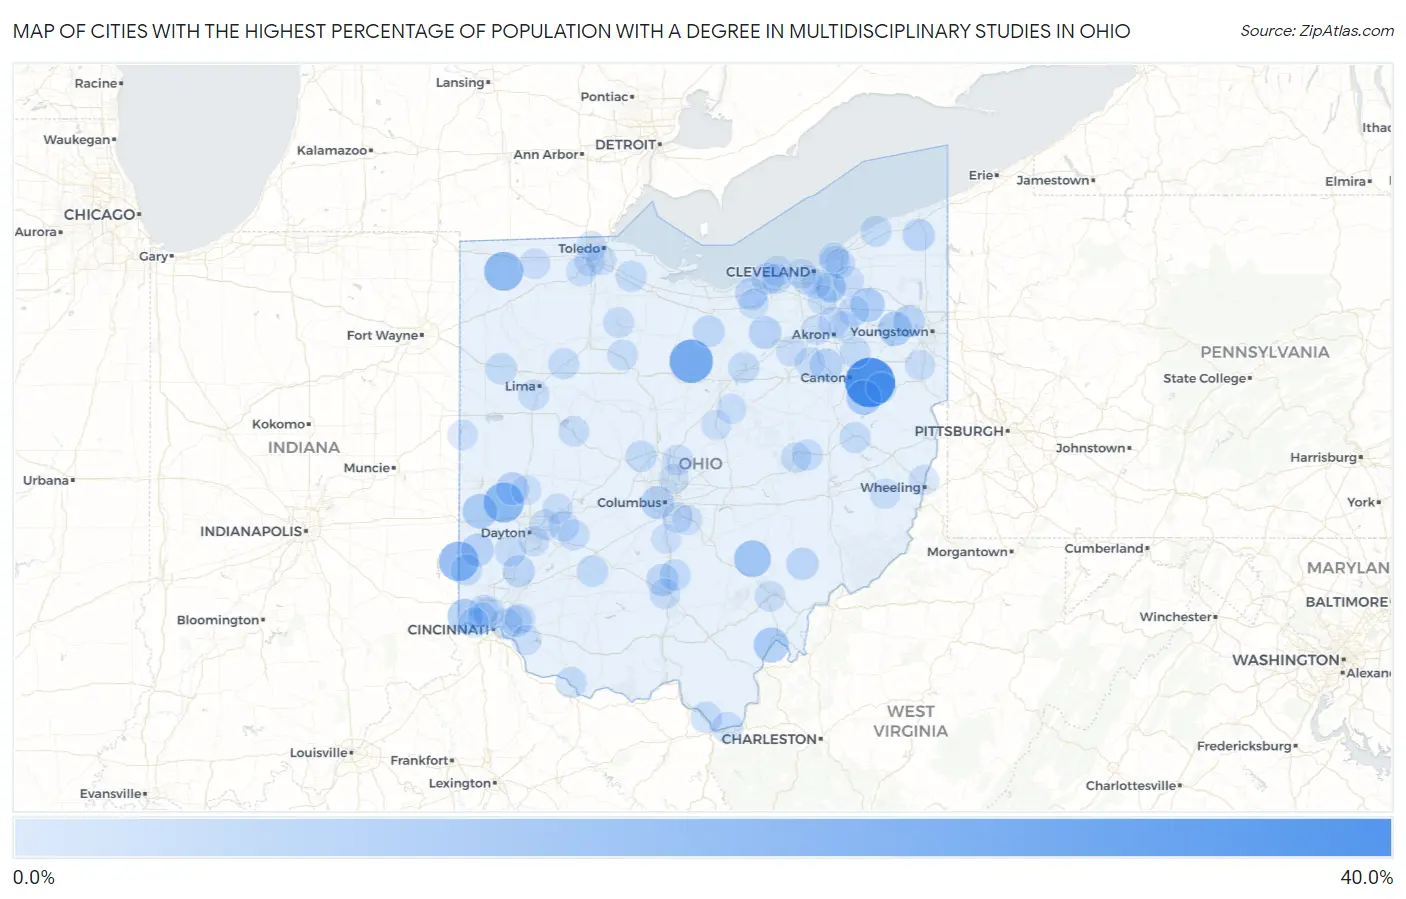
Map of Cities with the Highest Percentage of Population with a Degree in Multidisciplinary Studies in Ohio
0.0%
40.0%
Cities with the Highest Percentage of Population with a Degree in Multidisciplinary Studies in Ohio
| City | % Graduates | vs State | vs National | |
| 1. | Robertsville | 33.3% | 0.77%(+32.6)#1 | 0.88%(+32.5)#45 |
| 2. | Tiro | 22.7% | 0.77%(+22.0)#2 | 0.88%(+21.8)#95 |
| 3. | Potsdam | 17.2% | 0.77%(+16.5)#3 | 0.88%(+16.4)#141 |
| 4. | College Corner | 16.7% | 0.77%(+15.9)#4 | 0.88%(+15.8)#150 |
| 5. | Stryker | 15.7% | 0.77%(+15.0)#5 | 0.88%(+14.9)#168 |
| 6. | New Straitsville | 11.8% | 0.77%(+11.0)#6 | 0.88%(+10.9)#271 |
| 7. | Lloydsville | 10.7% | 0.77%(+9.94)#7 | 0.88%(+9.84)#310 |
| 8. | Middleport | 9.1% | 0.77%(+8.37)#8 | 0.88%(+8.26)#388 |
| 9. | Waynesburg | 9.1% | 0.77%(+8.32)#9 | 0.88%(+8.21)#394 |
| 10. | Hooven | 8.8% | 0.77%(+8.00)#10 | 0.88%(+7.89)#422 |
| 11. | West Manchester | 8.6% | 0.77%(+7.80)#11 | 0.88%(+7.69)#430 |
| 12. | Craig Beach | 7.9% | 0.77%(+7.16)#12 | 0.88%(+7.05)#476 |
| 13. | Mantua | 7.9% | 0.77%(+7.12)#13 | 0.88%(+7.02)#480 |
| 14. | Valleyview | 6.1% | 0.77%(+5.29)#14 | 0.88%(+5.18)#683 |
| 15. | Camden | 5.9% | 0.77%(+5.11)#15 | 0.88%(+5.00)#714 |
| 16. | Pleasant Hill | 5.8% | 0.77%(+5.04)#16 | 0.88%(+4.93)#728 |
| 17. | Spencer | 5.6% | 0.77%(+4.78)#17 | 0.88%(+4.68)#771 |
| 18. | Canal Fulton | 5.5% | 0.77%(+4.77)#18 | 0.88%(+4.67)#784 |
| 19. | South Amherst | 5.2% | 0.77%(+4.47)#19 | 0.88%(+4.36)#842 |
| 20. | Jefferson | 5.1% | 0.77%(+4.34)#20 | 0.88%(+4.23)#876 |
| 21. | Lordstown | 5.0% | 0.77%(+4.22)#21 | 0.88%(+4.11)#897 |
| 22. | Andersonville | 4.8% | 0.77%(+4.04)#22 | 0.88%(+3.93)#945 |
| 23. | Stockport | 4.8% | 0.77%(+3.99)#23 | 0.88%(+3.88)#952 |
| 24. | Sheffield | 4.6% | 0.77%(+3.81)#24 | 0.88%(+3.71)#998 |
| 25. | Hunter | 4.5% | 0.77%(+3.71)#25 | 0.88%(+3.60)#1,022 |
| 26. | North Fairfield | 4.2% | 0.77%(+3.40)#26 | 0.88%(+3.29)#1,105 |
| 27. | Middlebranch | 3.7% | 0.77%(+2.95)#27 | 0.88%(+2.84)#1,240 |
| 28. | Sabina | 3.6% | 0.77%(+2.88)#28 | 0.88%(+2.77)#1,276 |
| 29. | Middle Point | 3.6% | 0.77%(+2.80)#29 | 0.88%(+2.69)#1,310 |
| 30. | Coal Grove | 3.5% | 0.77%(+2.71)#30 | 0.88%(+2.60)#1,356 |
| 31. | Kingston | 3.5% | 0.77%(+2.71)#31 | 0.88%(+2.60)#1,357 |
| 32. | Oxford | 3.4% | 0.77%(+2.66)#32 | 0.88%(+2.56)#1,375 |
| 33. | Fairfax | 3.3% | 0.77%(+2.57)#33 | 0.88%(+2.46)#1,412 |
| 34. | Ashland | 3.3% | 0.77%(+2.49)#34 | 0.88%(+2.38)#1,450 |
| 35. | Terrace Park | 3.2% | 0.77%(+2.45)#35 | 0.88%(+2.34)#1,485 |
| 36. | Bluffton | 3.2% | 0.77%(+2.44)#36 | 0.88%(+2.33)#1,487 |
| 37. | Ostrander | 3.2% | 0.77%(+2.40)#37 | 0.88%(+2.30)#1,503 |
| 38. | Dennison | 3.1% | 0.77%(+2.33)#38 | 0.88%(+2.23)#1,539 |
| 39. | Perry | 3.0% | 0.77%(+2.24)#39 | 0.88%(+2.13)#1,596 |
| 40. | Maple Heights | 3.0% | 0.77%(+2.23)#40 | 0.88%(+2.12)#1,602 |
| 41. | Chesapeake | 2.9% | 0.77%(+2.17)#41 | 0.88%(+2.06)#1,634 |
| 42. | Elmore | 2.9% | 0.77%(+2.12)#42 | 0.88%(+2.01)#1,667 |
| 43. | Ripley | 2.9% | 0.77%(+2.11)#43 | 0.88%(+2.00)#1,676 |
| 44. | Hartville | 2.8% | 0.77%(+2.00)#44 | 0.88%(+1.89)#1,734 |
| 45. | West Lafayette | 2.7% | 0.77%(+1.96)#45 | 0.88%(+1.86)#1,752 |
| 46. | Streetsboro | 2.7% | 0.77%(+1.95)#46 | 0.88%(+1.84)#1,758 |
| 47. | Cedarville | 2.7% | 0.77%(+1.94)#47 | 0.88%(+1.83)#1,768 |
| 48. | Germantown | 2.7% | 0.77%(+1.90)#48 | 0.88%(+1.79)#1,803 |
| 49. | North College Hill | 2.6% | 0.77%(+1.83)#49 | 0.88%(+1.72)#1,852 |
| 50. | Yellow Springs | 2.6% | 0.77%(+1.82)#50 | 0.88%(+1.71)#1,859 |
| 51. | Wright Patterson Afb | 2.6% | 0.77%(+1.81)#51 | 0.88%(+1.70)#1,871 |
| 52. | Fostoria | 2.6% | 0.77%(+1.80)#52 | 0.88%(+1.69)#1,880 |
| 53. | Carey | 2.5% | 0.77%(+1.70)#53 | 0.88%(+1.60)#1,959 |
| 54. | Fort Shawnee | 2.5% | 0.77%(+1.69)#54 | 0.88%(+1.58)#1,968 |
| 55. | Athens | 2.4% | 0.77%(+1.60)#55 | 0.88%(+1.49)#2,037 |
| 56. | Huntsville | 2.3% | 0.77%(+1.55)#56 | 0.88%(+1.45)#2,078 |
| 57. | Sunbury | 2.3% | 0.77%(+1.55)#57 | 0.88%(+1.44)#2,080 |
| 58. | Groesbeck | 2.3% | 0.77%(+1.55)#58 | 0.88%(+1.44)#2,083 |
| 59. | Avon Lake | 2.3% | 0.77%(+1.52)#59 | 0.88%(+1.41)#2,120 |
| 60. | Chillicothe | 2.2% | 0.77%(+1.46)#60 | 0.88%(+1.36)#2,181 |
| 61. | Richmond Heights | 2.2% | 0.77%(+1.43)#61 | 0.88%(+1.32)#2,216 |
| 62. | Chagrin Falls | 2.2% | 0.77%(+1.40)#62 | 0.88%(+1.30)#2,245 |
| 63. | Minerva | 2.2% | 0.77%(+1.38)#63 | 0.88%(+1.28)#2,272 |
| 64. | Marshallville | 2.2% | 0.77%(+1.38)#64 | 0.88%(+1.27)#2,277 |
| 65. | Maumee | 2.1% | 0.77%(+1.35)#65 | 0.88%(+1.24)#2,313 |
| 66. | Groveport | 2.1% | 0.77%(+1.28)#66 | 0.88%(+1.17)#2,394 |
| 67. | Donnelsville | 2.0% | 0.77%(+1.27)#67 | 0.88%(+1.16)#2,420 |
| 68. | Milford | 2.0% | 0.77%(+1.26)#68 | 0.88%(+1.15)#2,429 |
| 69. | Cuyahoga Falls | 2.0% | 0.77%(+1.21)#69 | 0.88%(+1.10)#2,482 |
| 70. | Martins Ferry | 2.0% | 0.77%(+1.19)#70 | 0.88%(+1.09)#2,509 |
| 71. | Bethesda | 2.0% | 0.77%(+1.19)#71 | 0.88%(+1.08)#2,517 |
| 72. | Coshocton | 2.0% | 0.77%(+1.18)#72 | 0.88%(+1.08)#2,521 |
| 73. | Kettering | 1.9% | 0.77%(+1.16)#73 | 0.88%(+1.05)#2,554 |
| 74. | Wauseon | 1.9% | 0.77%(+1.08)#74 | 0.88%(+0.976)#2,647 |
| 75. | Leetonia | 1.9% | 0.77%(+1.08)#75 | 0.88%(+0.973)#2,653 |
| 76. | Avon | 1.8% | 0.77%(+1.03)#76 | 0.88%(+0.922)#2,723 |
| 77. | Highland Heights | 1.8% | 0.77%(+1.01)#77 | 0.88%(+0.904)#2,753 |
| 78. | Creston | 1.8% | 0.77%(+0.999)#78 | 0.88%(+0.891)#2,777 |
| 79. | Brooklyn | 1.8% | 0.77%(+0.993)#79 | 0.88%(+0.885)#2,785 |
| 80. | Oberlin | 1.8% | 0.77%(+0.989)#80 | 0.88%(+0.881)#2,793 |
| 81. | Monfort Heights | 1.7% | 0.77%(+0.962)#81 | 0.88%(+0.854)#2,839 |
| 82. | Waterville | 1.7% | 0.77%(+0.886)#82 | 0.88%(+0.778)#2,968 |
| 83. | Mack | 1.6% | 0.77%(+0.877)#83 | 0.88%(+0.769)#2,986 |
| 84. | Euclid | 1.6% | 0.77%(+0.867)#84 | 0.88%(+0.759)#3,004 |
| 85. | Ottawa Hills | 1.6% | 0.77%(+0.867)#85 | 0.88%(+0.759)#3,005 |
| 86. | Bedford | 1.6% | 0.77%(+0.827)#86 | 0.88%(+0.719)#3,089 |
| 87. | Rossford | 1.6% | 0.77%(+0.823)#87 | 0.88%(+0.715)#3,098 |
| 88. | Munroe Falls | 1.6% | 0.77%(+0.783)#88 | 0.88%(+0.675)#3,181 |
| 89. | Fort Recovery | 1.5% | 0.77%(+0.767)#89 | 0.88%(+0.659)#3,218 |
| 90. | Fredericktown | 1.5% | 0.77%(+0.744)#90 | 0.88%(+0.636)#3,268 |
| 91. | Brecksville | 1.5% | 0.77%(+0.741)#91 | 0.88%(+0.633)#3,277 |
| 92. | Pigeon Creek | 1.5% | 0.77%(+0.739)#92 | 0.88%(+0.631)#3,282 |
| 93. | Butler | 1.5% | 0.77%(+0.721)#93 | 0.88%(+0.613)#3,323 |
| 94. | South Bloomfield | 1.5% | 0.77%(+0.717)#94 | 0.88%(+0.609)#3,345 |
| 95. | Westerville | 1.5% | 0.77%(+0.716)#95 | 0.88%(+0.608)#3,347 |
| 96. | Lakewood | 1.5% | 0.77%(+0.713)#96 | 0.88%(+0.605)#3,355 |
| 97. | Amelia | 1.5% | 0.77%(+0.679)#97 | 0.88%(+0.571)#3,418 |
| 98. | Brooklyn Heights | 1.4% | 0.77%(+0.657)#98 | 0.88%(+0.549)#3,458 |
| 99. | Troy | 1.4% | 0.77%(+0.619)#99 | 0.88%(+0.511)#3,551 |
| 100. | Canal Winchester | 1.4% | 0.77%(+0.612)#100 | 0.88%(+0.504)#3,561 |
Common Questions
What are the Top 10 Cities with the Highest Percentage of Population with a Degree in Multidisciplinary Studies in Ohio?
Top 10 Cities with the Highest Percentage of Population with a Degree in Multidisciplinary Studies in Ohio are:
#1
33.3%
#2
22.7%
#3
17.2%
#4
16.7%
#5
15.7%
#6
11.8%
#7
9.1%
#8
9.1%
#9
8.8%
#10
8.6%
What city has the Highest Percentage of Population with a Degree in Multidisciplinary Studies in Ohio?
Robertsville has the Highest Percentage of Population with a Degree in Multidisciplinary Studies in Ohio with 33.3%.
What is the Percentage of Population with a Degree in Multidisciplinary Studies in the State of Ohio?
Percentage of Population with a Degree in Multidisciplinary Studies in Ohio is 0.77%.
What is the Percentage of Population with a Degree in Multidisciplinary Studies in the United States?
Percentage of Population with a Degree in Multidisciplinary Studies in the United States is 0.88%.