Cities with the Highest Percentage of Population Employed in Production in Ohio
RELATED REPORTS & OPTIONS
Production
Ohio
Compare Cities
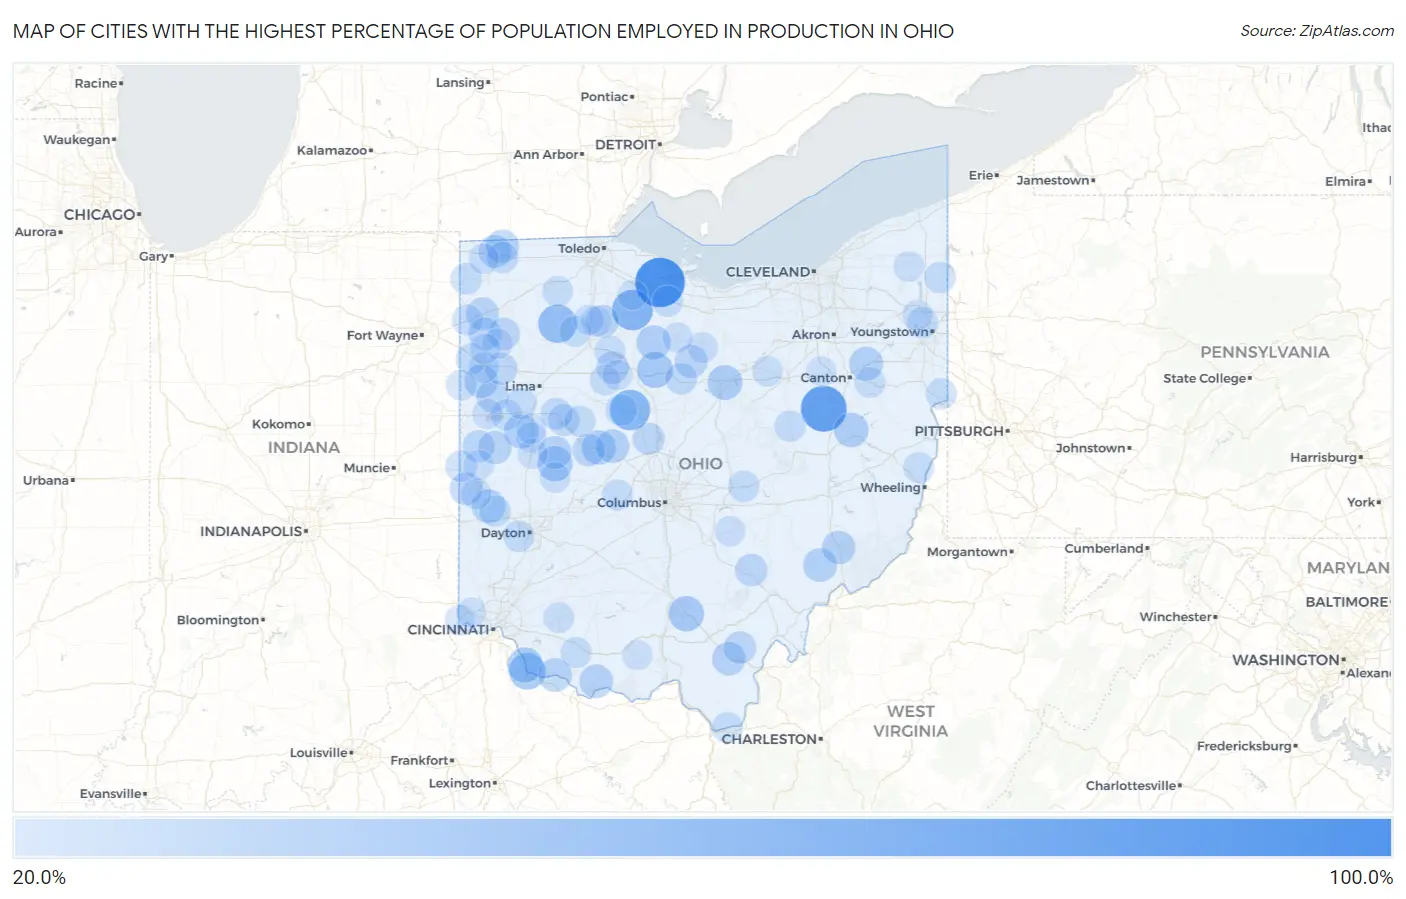
Map of Cities with the Highest Percentage of Population Employed in Production in Ohio
0.0%
100.0%
Cities with the Highest Percentage of Population Employed in Production in Ohio
| City | % Employed | vs State | vs National | |
| 1. | Marathon | 100.0% | 8.1%(+91.9)#1 | 5.5%(+94.5)#9 |
| 2. | Wightmans Grove | 100.0% | 8.1%(+91.9)#2 | 5.5%(+94.5)#38 |
| 3. | Dundee | 84.8% | 8.1%(+76.7)#3 | 5.5%(+79.3)#53 |
| 4. | Kansas | 64.2% | 8.1%(+56.1)#4 | 5.5%(+58.7)#96 |
| 5. | New Bloomington | 62.4% | 8.1%(+54.3)#5 | 5.5%(+56.9)#106 |
| 6. | Belmore | 55.3% | 8.1%(+47.2)#6 | 5.5%(+49.8)#157 |
| 7. | Neville | 47.8% | 8.1%(+39.8)#7 | 5.5%(+42.4)#229 |
| 8. | Oceola | 44.4% | 8.1%(+36.3)#8 | 5.5%(+38.9)#276 |
| 9. | Richmond Dale | 43.3% | 8.1%(+35.2)#9 | 5.5%(+37.8)#290 |
| 10. | Moscow | 42.0% | 8.1%(+33.9)#10 | 5.5%(+36.5)#314 |
| 11. | Rosewood | 41.8% | 8.1%(+33.7)#11 | 5.5%(+36.3)#322 |
| 12. | Lincoln Heights | 41.0% | 8.1%(+32.9)#12 | 5.5%(+35.5)#335 |
| 13. | Barnhill | 39.2% | 8.1%(+31.1)#13 | 5.5%(+33.7)#380 |
| 14. | Melmore | 38.7% | 8.1%(+30.7)#14 | 5.5%(+33.2)#392 |
| 15. | Kettlersville | 38.2% | 8.1%(+30.2)#15 | 5.5%(+32.8)#404 |
| 16. | East Liberty | 37.9% | 8.1%(+29.9)#16 | 5.5%(+32.4)#415 |
| 17. | Harrisburg | 37.1% | 8.1%(+29.1)#17 | 5.5%(+31.7)#436 |
| 18. | Ithaca | 37.0% | 8.1%(+28.9)#18 | 5.5%(+31.5)#441 |
| 19. | Waterford | 36.3% | 8.1%(+28.2)#19 | 5.5%(+30.8)#459 |
| 20. | Bentonville | 35.9% | 8.1%(+27.8)#20 | 5.5%(+30.4)#467 |
| 21. | Raymond | 35.6% | 8.1%(+27.5)#21 | 5.5%(+30.1)#481 |
| 22. | Higginsport | 35.3% | 8.1%(+27.3)#22 | 5.5%(+29.9)#488 |
| 23. | Centerville Thurman | 35.3% | 8.1%(+27.2)#23 | 5.5%(+29.8)#489 |
| 24. | Dexter City | 35.1% | 8.1%(+27.0)#24 | 5.5%(+29.6)#500 |
| 25. | Ohio City | 35.0% | 8.1%(+26.9)#25 | 5.5%(+29.5)#505 |
| 26. | Alvordton | 34.2% | 8.1%(+26.2)#26 | 5.5%(+28.7)#528 |
| 27. | Yorkshire | 34.1% | 8.1%(+26.0)#27 | 5.5%(+28.6)#535 |
| 28. | Quincy | 33.8% | 8.1%(+25.7)#28 | 5.5%(+28.3)#547 |
| 29. | Tiro | 33.6% | 8.1%(+25.6)#29 | 5.5%(+28.1)#557 |
| 30. | Kunkle | 32.8% | 8.1%(+24.8)#30 | 5.5%(+27.3)#604 |
| 31. | Cecil | 32.8% | 8.1%(+24.8)#31 | 5.5%(+27.3)#605 |
| 32. | Palestine | 32.8% | 8.1%(+24.7)#32 | 5.5%(+27.3)#607 |
| 33. | Bloomdale | 32.6% | 8.1%(+24.5)#33 | 5.5%(+27.1)#616 |
| 34. | Latty | 32.4% | 8.1%(+24.3)#34 | 5.5%(+26.9)#623 |
| 35. | Valley Hi | 32.2% | 8.1%(+24.1)#35 | 5.5%(+26.7)#635 |
| 36. | Carbon Hill | 31.9% | 8.1%(+23.8)#36 | 5.5%(+26.4)#647 |
| 37. | Vinton | 31.5% | 8.1%(+23.4)#37 | 5.5%(+26.0)#678 |
| 38. | Wharton | 31.0% | 8.1%(+22.9)#38 | 5.5%(+25.5)#708 |
| 39. | Melrose | 31.0% | 8.1%(+22.9)#39 | 5.5%(+25.5)#709 |
| 40. | Mendon | 30.9% | 8.1%(+22.8)#40 | 5.5%(+25.4)#714 |
| 41. | Radnor | 30.8% | 8.1%(+22.7)#41 | 5.5%(+25.3)#721 |
| 42. | New Weston | 30.8% | 8.1%(+22.7)#42 | 5.5%(+25.3)#723 |
| 43. | Middle Point | 30.4% | 8.1%(+22.3)#43 | 5.5%(+24.9)#743 |
| 44. | New Hampshire | 29.4% | 8.1%(+21.3)#44 | 5.5%(+23.9)#814 |
| 45. | North Robinson | 29.3% | 8.1%(+21.2)#45 | 5.5%(+23.8)#820 |
| 46. | Chippewa Park | 28.8% | 8.1%(+20.7)#46 | 5.5%(+23.3)#857 |
| 47. | Union City | 28.4% | 8.1%(+20.3)#47 | 5.5%(+22.9)#898 |
| 48. | La Rue | 28.2% | 8.1%(+20.2)#48 | 5.5%(+22.8)#916 |
| 49. | Massieville | 28.2% | 8.1%(+20.1)#49 | 5.5%(+22.7)#921 |
| 50. | West Unity | 28.1% | 8.1%(+20.1)#50 | 5.5%(+22.7)#924 |
| 51. | Verona | 28.1% | 8.1%(+20.0)#51 | 5.5%(+22.6)#928 |
| 52. | Marne | 27.8% | 8.1%(+19.7)#52 | 5.5%(+22.3)#951 |
| 53. | Kinsman Center | 27.4% | 8.1%(+19.4)#53 | 5.5%(+21.9)#984 |
| 54. | Edgerton | 27.4% | 8.1%(+19.4)#54 | 5.5%(+21.9)#985 |
| 55. | Drexel | 27.3% | 8.1%(+19.3)#55 | 5.5%(+21.9)#993 |
| 56. | Hilltop | 27.2% | 8.1%(+19.2)#56 | 5.5%(+21.8)#1,008 |
| 57. | Calcutta | 27.2% | 8.1%(+19.1)#57 | 5.5%(+21.7)#1,011 |
| 58. | St Marys | 27.0% | 8.1%(+18.9)#58 | 5.5%(+21.5)#1,031 |
| 59. | Buckland | 26.9% | 8.1%(+18.9)#59 | 5.5%(+21.5)#1,034 |
| 60. | Lake Buckhorn | 26.8% | 8.1%(+18.8)#60 | 5.5%(+21.3)#1,050 |
| 61. | Belle Center | 26.7% | 8.1%(+18.6)#61 | 5.5%(+21.2)#1,057 |
| 62. | Clyde | 26.7% | 8.1%(+18.6)#62 | 5.5%(+21.2)#1,059 |
| 63. | Convoy | 26.7% | 8.1%(+18.6)#63 | 5.5%(+21.2)#1,068 |
| 64. | Mccomb | 26.5% | 8.1%(+18.5)#64 | 5.5%(+21.1)#1,072 |
| 65. | Plumwood | 26.5% | 8.1%(+18.4)#65 | 5.5%(+21.0)#1,083 |
| 66. | Lake Waynoka | 26.4% | 8.1%(+18.4)#66 | 5.5%(+21.0)#1,085 |
| 67. | Antwerp | 26.4% | 8.1%(+18.3)#67 | 5.5%(+20.9)#1,091 |
| 68. | Dillonvale | 26.1% | 8.1%(+18.0)#68 | 5.5%(+20.6)#1,126 |
| 69. | Chesapeake | 26.0% | 8.1%(+17.9)#69 | 5.5%(+20.5)#1,134 |
| 70. | Robertsville | 25.5% | 8.1%(+17.5)#70 | 5.5%(+20.1)#1,189 |
| 71. | Van Wert | 25.4% | 8.1%(+17.3)#71 | 5.5%(+19.9)#1,212 |
| 72. | Wayne Lakes | 25.2% | 8.1%(+17.2)#72 | 5.5%(+19.8)#1,227 |
| 73. | Fayetteville | 25.2% | 8.1%(+17.1)#73 | 5.5%(+19.7)#1,236 |
| 74. | Vanlue | 25.0% | 8.1%(+16.9)#74 | 5.5%(+19.5)#1,252 |
| 75. | New Pittsburg | 25.0% | 8.1%(+16.9)#75 | 5.5%(+19.5)#1,254 |
| 76. | Patterson | 25.0% | 8.1%(+16.9)#76 | 5.5%(+19.5)#1,263 |
| 77. | Mcclure | 24.9% | 8.1%(+16.8)#77 | 5.5%(+19.4)#1,290 |
| 78. | Willshire | 24.8% | 8.1%(+16.7)#78 | 5.5%(+19.3)#1,312 |
| 79. | Orwell | 24.6% | 8.1%(+16.5)#79 | 5.5%(+19.1)#1,334 |
| 80. | Bairdstown | 24.6% | 8.1%(+16.5)#80 | 5.5%(+19.1)#1,342 |
| 81. | Plymouth | 24.4% | 8.1%(+16.3)#81 | 5.5%(+18.9)#1,362 |
| 82. | Anna | 24.2% | 8.1%(+16.1)#82 | 5.5%(+18.7)#1,391 |
| 83. | Bolindale | 24.2% | 8.1%(+16.1)#83 | 5.5%(+18.7)#1,392 |
| 84. | Montpelier | 24.1% | 8.1%(+16.0)#84 | 5.5%(+18.6)#1,400 |
| 85. | North Baltimore | 24.1% | 8.1%(+16.0)#85 | 5.5%(+18.6)#1,403 |
| 86. | Rushville | 24.0% | 8.1%(+16.0)#86 | 5.5%(+18.6)#1,414 |
| 87. | Elizabethtown | 23.9% | 8.1%(+15.9)#87 | 5.5%(+18.4)#1,434 |
| 88. | Celina | 23.9% | 8.1%(+15.8)#88 | 5.5%(+18.4)#1,436 |
| 89. | Grover Hill | 23.9% | 8.1%(+15.8)#89 | 5.5%(+18.4)#1,438 |
| 90. | St Paris | 23.9% | 8.1%(+15.8)#90 | 5.5%(+18.4)#1,439 |
| 91. | Scott | 23.8% | 8.1%(+15.8)#91 | 5.5%(+18.4)#1,446 |
| 92. | Attica | 23.4% | 8.1%(+15.3)#92 | 5.5%(+17.9)#1,522 |
| 93. | Kirby | 23.3% | 8.1%(+15.3)#93 | 5.5%(+17.9)#1,531 |
| 94. | Sidney | 23.3% | 8.1%(+15.2)#94 | 5.5%(+17.8)#1,547 |
| 95. | Ansonia | 23.2% | 8.1%(+15.1)#95 | 5.5%(+17.7)#1,559 |
| 96. | Rarden | 23.1% | 8.1%(+15.0)#96 | 5.5%(+17.6)#1,579 |
| 97. | Botkins | 22.9% | 8.1%(+14.9)#97 | 5.5%(+17.5)#1,605 |
| 98. | Miamitown | 22.9% | 8.1%(+14.8)#98 | 5.5%(+17.4)#1,612 |
| 99. | Helena | 22.8% | 8.1%(+14.7)#99 | 5.5%(+17.3)#1,627 |
| 100. | North Lawrence | 22.7% | 8.1%(+14.6)#100 | 5.5%(+17.2)#1,646 |
Common Questions
What are the Top 10 Cities with the Highest Percentage of Population Employed in Production in Ohio?
Top 10 Cities with the Highest Percentage of Population Employed in Production in Ohio are:
#1
100.0%
#2
84.8%
#3
64.2%
#4
62.4%
#5
55.3%
#6
47.8%
#7
44.4%
#8
43.3%
#9
42.0%
#10
41.8%
What city has the Highest Percentage of Population Employed in Production in Ohio?
Wightmans Grove has the Highest Percentage of Population Employed in Production in Ohio with 100.0%.
What is the Percentage of Population Employed in Production in the State of Ohio?
Percentage of Population Employed in Production in Ohio is 8.1%.
What is the Percentage of Population Employed in Production in the United States?
Percentage of Population Employed in Production in the United States is 5.5%.