Cities with the Most Births per 1,000 Women Receiving Public Assitance in Ohio
RELATED REPORTS & OPTIONS
Highest Birth Rate | Public Income
Ohio
Compare Cities
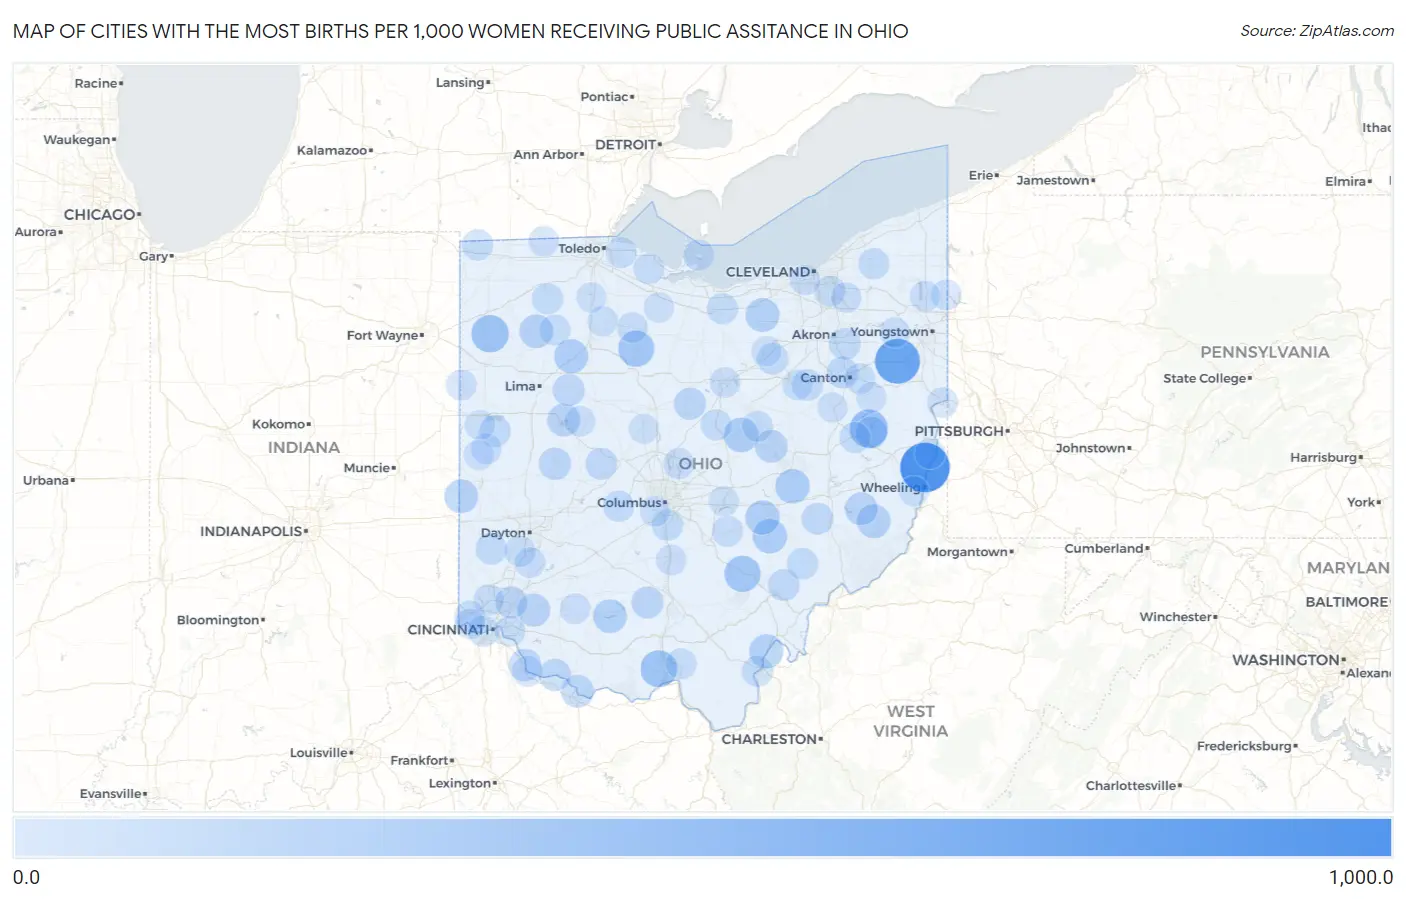
Map of Cities with the Most Births per 1,000 Women Receiving Public Assitance in Ohio
0.0
1,000.0
Cities with the Most Births per 1,000 Women Receiving Public Assitance in Ohio
| City | Births / 1,000 Women | vs State | vs National | |
| 1. | Connorville | 1,000.0 | 55.0(+945)#1 | 52.0(+948)#43 |
| 2. | Bloomingville | 1,000.0 | 55.0(+945)#2 | 52.0(+948)#46 |
| 3. | Damascus | 786.0 | 55.0(+731)#3 | 52.0(+734)#103 |
| 4. | Leesville | 486.0 | 55.0(+431)#4 | 52.0(+434)#250 |
| 5. | Broughton | 444.0 | 55.0(+389)#5 | 52.0(+392)#275 |
| 6. | Mcdermott | 422.0 | 55.0(+367)#6 | 52.0(+370)#310 |
| 7. | Haydenville | 393.0 | 55.0(+338)#7 | 52.0(+341)#359 |
| 8. | Mccutchenville | 393.0 | 55.0(+338)#8 | 52.0(+341)#360 |
| 9. | Howard | 327.0 | 55.0(+272)#9 | 52.0(+275)#515 |
| 10. | Adamsville | 319.0 | 55.0(+264)#10 | 52.0(+267)#546 |
| 11. | Rose Farm | 316.0 | 55.0(+261)#11 | 52.0(+264)#564 |
| 12. | Petersburg | 314.0 | 55.0(+259)#12 | 52.0(+262)#568 |
| 13. | Fultonham | 313.0 | 55.0(+258)#13 | 52.0(+261)#576 |
| 14. | Mount Cory | 301.0 | 55.0(+246)#14 | 52.0(+249)#622 |
| 15. | Cheshire | 300.0 | 55.0(+245)#15 | 52.0(+248)#625 |
| 16. | Pheasant Run | 290.0 | 55.0(+235)#16 | 52.0(+238)#660 |
| 17. | Rocky Fork Point | 287.0 | 55.0(+232)#17 | 52.0(+235)#674 |
| 18. | Hollansburg | 286.0 | 55.0(+231)#18 | 52.0(+234)#682 |
| 19. | Miller City | 286.0 | 55.0(+231)#19 | 52.0(+234)#686 |
| 20. | Miltonsburg | 286.0 | 55.0(+231)#20 | 52.0(+234)#691 |
| 21. | Chippewa Park | 253.0 | 55.0(+198)#21 | 52.0(+201)#855 |
| 22. | Batesville | 250.0 | 55.0(+195)#22 | 52.0(+198)#888 |
| 23. | Bidwell | 249.0 | 55.0(+194)#23 | 52.0(+197)#901 |
| 24. | Goshen | 247.0 | 55.0(+192)#24 | 52.0(+195)#907 |
| 25. | Nellie | 247.0 | 55.0(+192)#25 | 52.0(+195)#908 |
| 26. | Aberdeen | 239.0 | 55.0(+184)#26 | 52.0(+187)#954 |
| 27. | Moscow | 233.0 | 55.0(+178)#27 | 52.0(+181)#1,001 |
| 28. | Rosewood | 228.0 | 55.0(+173)#28 | 52.0(+176)#1,051 |
| 29. | Bourneville | 222.0 | 55.0(+167)#29 | 52.0(+170)#1,102 |
| 30. | Candlewood Lake | 217.0 | 55.0(+162)#30 | 52.0(+165)#1,149 |
| 31. | Bowerston | 216.0 | 55.0(+161)#31 | 52.0(+164)#1,159 |
| 32. | Higginsport | 216.0 | 55.0(+161)#32 | 52.0(+164)#1,161 |
| 33. | Brecon | 215.0 | 55.0(+160)#33 | 52.0(+163)#1,170 |
| 34. | Alger | 214.0 | 55.0(+159)#34 | 52.0(+162)#1,175 |
| 35. | Amesville | 211.0 | 55.0(+156)#35 | 52.0(+159)#1,223 |
| 36. | North Lewisburg | 206.0 | 55.0(+151)#36 | 52.0(+154)#1,266 |
| 37. | Cumberland | 205.0 | 55.0(+150)#37 | 52.0(+153)#1,279 |
| 38. | Hills And Dales | 200.0 | 55.0(+145)#38 | 52.0(+148)#1,320 |
| 39. | Lakemore | 198.0 | 55.0(+143)#39 | 52.0(+146)#1,359 |
| 40. | Gratis | 193.0 | 55.0(+138)#40 | 52.0(+141)#1,411 |
| 41. | Kidron | 192.0 | 55.0(+137)#41 | 52.0(+140)#1,421 |
| 42. | Congress | 192.0 | 55.0(+137)#42 | 52.0(+140)#1,433 |
| 43. | Chickasaw | 191.0 | 55.0(+136)#43 | 52.0(+139)#1,442 |
| 44. | Lockbourne | 188.0 | 55.0(+133)#44 | 52.0(+136)#1,482 |
| 45. | Stockport | 187.0 | 55.0(+132)#45 | 52.0(+135)#1,504 |
| 46. | Gallipolis | 184.0 | 55.0(+129)#46 | 52.0(+132)#1,537 |
| 47. | Lake Seneca | 183.0 | 55.0(+128)#47 | 52.0(+131)#1,555 |
| 48. | Malinta | 183.0 | 55.0(+128)#48 | 52.0(+131)#1,559 |
| 49. | Dennison | 179.0 | 55.0(+124)#49 | 52.0(+127)#1,615 |
| 50. | Fredericktown | 174.0 | 55.0(+119)#50 | 52.0(+122)#1,688 |
| 51. | Delshire | 173.0 | 55.0(+118)#51 | 52.0(+121)#1,717 |
| 52. | Collins | 173.0 | 55.0(+118)#52 | 52.0(+121)#1,726 |
| 53. | Aquilla | 173.0 | 55.0(+118)#53 | 52.0(+121)#1,727 |
| 54. | Lafayette | 172.0 | 55.0(+117)#54 | 52.0(+120)#1,746 |
| 55. | Sullivan | 171.0 | 55.0(+116)#55 | 52.0(+119)#1,756 |
| 56. | Galena | 170.0 | 55.0(+115)#56 | 52.0(+118)#1,768 |
| 57. | Pleasant Run Farm | 169.0 | 55.0(+114)#57 | 52.0(+117)#1,777 |
| 58. | Leipsic | 169.0 | 55.0(+114)#58 | 52.0(+117)#1,780 |
| 59. | Walton Hills | 169.0 | 55.0(+114)#59 | 52.0(+117)#1,781 |
| 60. | West Rushville | 169.0 | 55.0(+114)#60 | 52.0(+117)#1,792 |
| 61. | Miamisburg | 168.0 | 55.0(+113)#61 | 52.0(+116)#1,793 |
| 62. | Curtice | 167.0 | 55.0(+112)#62 | 52.0(+115)#1,817 |
| 63. | East Canton | 167.0 | 55.0(+112)#63 | 52.0(+115)#1,818 |
| 64. | Kelleys Island | 167.0 | 55.0(+112)#64 | 52.0(+115)#1,837 |
| 65. | Gann Brinkhaven | 167.0 | 55.0(+112)#65 | 52.0(+115)#1,848 |
| 66. | Oak Harbor | 165.0 | 55.0(+110)#66 | 52.0(+113)#1,873 |
| 67. | Grandview | 164.0 | 55.0(+109)#67 | 52.0(+112)#1,892 |
| 68. | Minford | 164.0 | 55.0(+109)#68 | 52.0(+112)#1,898 |
| 69. | Bascom | 159.0 | 55.0(+104)#69 | 52.0(+107)#2,016 |
| 70. | Five Points | 157.0 | 55.0(+102)#70 | 52.0(+105)#2,044 |
| 71. | Lynchburg | 156.0 | 55.0(+101)#71 | 52.0(+104)#2,079 |
| 72. | Logan Elm Village | 156.0 | 55.0(+101)#72 | 52.0(+104)#2,082 |
| 73. | Belle Center | 156.0 | 55.0(+101)#73 | 52.0(+104)#2,088 |
| 74. | Lincoln Heights | 154.0 | 55.0(+99.0)#74 | 52.0(+102)#2,128 |
| 75. | Willshire | 154.0 | 55.0(+99.0)#75 | 52.0(+102)#2,130 |
| 76. | North Star | 154.0 | 55.0(+99.0)#76 | 52.0(+102)#2,143 |
| 77. | Orangeville | 154.0 | 55.0(+99.0)#77 | 52.0(+102)#2,144 |
| 78. | Neville | 154.0 | 55.0(+99.0)#78 | 52.0(+102)#2,153 |
| 79. | East Liverpool | 152.0 | 55.0(+97.0)#79 | 52.0(+100.0)#2,181 |
| 80. | Reminderville | 150.0 | 55.0(+95.0)#80 | 52.0(+98.0)#2,238 |
| 81. | Sherwood | 150.0 | 55.0(+95.0)#81 | 52.0(+98.0)#2,241 |
| 82. | Urbancrest | 150.0 | 55.0(+95.0)#82 | 52.0(+98.0)#2,245 |
| 83. | Cortland | 149.0 | 55.0(+94.0)#83 | 52.0(+97.0)#2,267 |
| 84. | Lyons | 149.0 | 55.0(+94.0)#84 | 52.0(+97.0)#2,288 |
| 85. | Apple Creek | 145.0 | 55.0(+90.0)#85 | 52.0(+93.0)#2,400 |
| 86. | Addyston | 144.0 | 55.0(+89.0)#86 | 52.0(+92.0)#2,442 |
| 87. | Bloomdale | 144.0 | 55.0(+89.0)#87 | 52.0(+92.0)#2,445 |
| 88. | Neffs | 143.0 | 55.0(+88.0)#88 | 52.0(+91.0)#2,469 |
| 89. | New Alexandria | 143.0 | 55.0(+88.0)#89 | 52.0(+91.0)#2,492 |
| 90. | Linndale | 143.0 | 55.0(+88.0)#90 | 52.0(+91.0)#2,497 |
| 91. | Coldwater | 142.0 | 55.0(+87.0)#91 | 52.0(+90.0)#2,531 |
| 92. | Green Springs | 142.0 | 55.0(+87.0)#92 | 52.0(+90.0)#2,545 |
| 93. | Strasburg | 141.0 | 55.0(+86.0)#93 | 52.0(+89.0)#2,560 |
| 94. | Lake Mohawk | 140.0 | 55.0(+85.0)#94 | 52.0(+88.0)#2,588 |
| 95. | Rossburg | 140.0 | 55.0(+85.0)#95 | 52.0(+88.0)#2,613 |
| 96. | West Salem | 139.0 | 55.0(+84.0)#96 | 52.0(+87.0)#2,626 |
| 97. | Lake Milton | 139.0 | 55.0(+84.0)#97 | 52.0(+87.0)#2,634 |
| 98. | Portage | 138.0 | 55.0(+83.0)#98 | 52.0(+86.0)#2,662 |
| 99. | Hebron | 135.0 | 55.0(+80.0)#99 | 52.0(+83.0)#2,749 |
| 100. | Prospect | 135.0 | 55.0(+80.0)#100 | 52.0(+83.0)#2,755 |
Common Questions
What are the Top 10 Cities with the Most Births per 1,000 Women Receiving Public Assitance in Ohio?
Top 10 Cities with the Most Births per 1,000 Women Receiving Public Assitance in Ohio are:
#1
1,000.0
#2
786.0
#3
486.0
#4
444.0
#5
422.0
#6
393.0
#7
393.0
#8
327.0
#9
319.0
#10
316.0
What city has the Most Births per 1,000 Women Receiving Public Assitance in Ohio?
Connorville has the Most Births per 1,000 Women Receiving Public Assitance in Ohio with 1,000.0.
What is the Number of Births per 1,000 Women Receiving Public Assitance in the State of Ohio?
Number of Births per 1,000 Women Receiving Public Assitance in Ohio is 55.0.
What is the Number of Births per 1,000 Women Receiving Public Assitance in the United States?
Number of Births per 1,000 Women Receiving Public Assitance in the United States is 52.0.